Page 1
Proceedings of the Asia Pacific Industrial Engineering & Management Systems Conference 2012
V. Kachitvichyanukul, H.T. Luong, and R. Pitakaso Eds.
______________________________________
†: Corresponding Author
412
SCALABILITY FOR SUPPORTING THE GROWTH OF HOSPITALS:
APPLICATION AT THAILAND HOSPITALS
Adisak Sakphisal
Faculty of Engineering and Industrial Sciences
Swinburne University of Technology, Hawthorn, Vic., Australia
Email: [email protected]
Peter G Higgins †
Faculty of Engineering and Industrial Sciences
Swinburne University of Technology, Hawthorn, Vic., Australia
Tel: (+61) 3- 9214-8029
Email: [email protected]
Abstract. Public hospitals in Thailand have been forced to serve dramatically increased numbers of patients
since the National Health Security Act 2002 gave access to free medical treatment. The challenge to hospitals
is to plan for increasing resources and facilities of service processes to serve more patients. A model for
analysing the scalability of factors necessary to the growth in hospital size has been developed. In its
development, we focused on one part of the hospital, the outpatient department (OPD). The model is an
outcome of three-stage study of OPDs. In the first stage, the OPD at a single hospital was investigated for the
identification of key factors associated with patient flow. The second stage, the investigation expanded to
seven hospitals so to find patterns in performance based on principles of Lean Systems. In the final stage, a
descriptive model of “scalability” was created. The objective of the model is to guide hospitals in planning
their growth in size.
Keywords: hospital, lean, process analysis, growth, outpatient, planning
1. INTRODUCTION
Similar to other countries, the Thai Government has
introduced a care guarantee Act. Public hospitals are
obligated to meet performance measures of cost and
accessibility. They may meet these, partially, by decreasing
waiting and treatment time. Currently, there is pressure on
doctors to reduce flow time by contracting consultation
time, which may be at the expense of diagnosis and
treatment. The sophistication of medical infrastructure and
services varies between hospitals. The quality of the
operational process becomes a critical factor in the hospital
performance. Also, the drastic demand by patients who
need to experience the outpatient department would
identify the potential of outpatient department. Whereas,
being treated for better health soon after the patient arrives
becomes the most ambitious perspective of patients’ needs.
Long waiting time of patients can bring up huge amount of
problems; for instance, some patients decide not to visit a
hospital only because of their intolerance to long waiting
times due to their weakening health. Long waiting times in
outpatient departments (OPDs) are notorious, as Paul and
Kuljis (1995) highlight by referring to a report by Thakar
and Malin (1989). The focus of research is OPDs, as they
form 80% of patient demand in Thailand (Alpha Research,
2006). The greatest demand within an OPD comes from the
sub department of internal medicine, which is responsible
for the management of nonsurgical treatment of serious
diseases such as hypertension and diabetes. The challenge
for hospitals is to plan for increasing resources and
facilities of service processes to serve greatly increased
numbers of patients.
2. LITERATURE REVIEW
By decreasing waiting and treatment times, costs can
be reduced, while increasing accessibility. Hall et al.(2006,
p.8) stated three goals that benefit from healthcare delay
reduction are: waiting time reduction for needed service,
timeliness for reaching the service, and elimination of
inefficient activities. Hence, the operational cost is reduced.
Whereas, service providers suffer increasing workload,
which may breach limits of human performance (Wickens
et al. 2004, p.331). The need to increase the number of
Page 2
Sakphisal and Higgins
413
healthcare service operators has become a matter of current
debate (Paavola, 2008). OPDs can be characterized as large
dynamic and complex systems with multiple processes
having variable cycles with their phasing dependent upon
the flow of the conditional demands of patients. Bertrand
and Vries (2005, p.28) discuss the application of the
concept of the focused factory—created by Wickham
Skinner in 1985—to the design of the hospital service
process. A focused factory produces a homogenous group
of products or services. For the concept to be applicable to
hospitals, patients need to be grouped by homogeneous
treatment practices and resources. Thus, homogenous
groups within the processes and services in the routings of
patient flows must be identifiable.
Hall (2006) contends that reduction in delays in the
delivery of healthcare requires the optimisation of the
service process as the first priority. This is followed by
alterations to the arrival processed and changing the
queuing process through such practices as prioritisation in
triage. The transformation of the service process includes
clinical process, management process, and ancillary process
(Vissers, 1998). The planning and control of healthcare
concerns the interaction between patient flow and resources
(Vissers & Beech, 2005). Contributing factors to the
servicing of outpatients are—amongst others—patient flow,
work activity and information flow at workstations, service
time, material flow, such as specimens and documentation.
Physical, information, and human resources relating to
tasks performed have been concerned.
Success of healthcare initiatives depends upon the
local situation and thereby there cannot be a universal best
practice (Stacey and Griffin, 2006, p.23). Walshe (2003)
comments that various nations, as well as doctor and nurses,
criticize international comparisons of the quality health
care produced by the World Health Organization. Clinical
practices may vary across countries. Therefore, the
approach for design should be the application of a process
improvement roadmap that leads to an operations model for
a shortest lead time at minimum cost. The roadmap would
become a guiding tool for improving the service quality.
3. 3 METHODOLOGY
3.1 Time Variances
Service processing times and waiting times are the two
time parameters in a hospital service process. Waiting to be
served in the service process takes the largest proportion of
the patient flow time. The time influences on making the
following decisions: number of service facilities, number of
servers at a service facility, and efficiency of the servers
(Hillier & Lieberman 1974, p. 438).
3.2 Resource Utilization
After decisions have been made for capacity
investment, resources in hospitals become fixed. Like
hotels and airlines facilities, resources in hospitals need to
be utilized to make profit in their business. The challenge
for managers is to balance daily demands with an available
capacity (Fitzsimmons & Fitzsimmons 2008, p. 257).
3.2.1 Job Design
Job design for a production process work environment
needs to include the tools and machines that humans use to
better perform their jobs. The design also concerns factors
in the relation to the physical limitations of humans, such
as size, weight, grasping pressure, and the simplicity of
equipment usage (Lee & Schniederjans, 1994). In hospitals,
human activities dominate many service operations. In
some service stages, automated, or semi automated,
equipment improves productivity; for example, the
measurement of blood pressure. Nonetheless, many jobs—
for example, examination, diagnosis, and triage—tasks
require judgment that cannot be mechanized or automated.
Job design also includes designing facilities location,
utilizing existing equipment, minimizing skill requirements
for cost cutting, grouping work tasks for specific skill
development and efficiency improvement, designing self-
teaching jobs for learning time reduction, equalizing work
assignments for idle time reduction; and providing
environmental conditions which improve productivity (Lee
& Schniederjans, 1994).
3.2.2 Line Balancing
Task assignments have an impact on operational
processes. If times to complete tasks in an operational
process vary due to unevenness in the number and
complexity of tasks assigned to workstations, the workload
may be unbalanced. A hospital service process is like an
assembly line at some stations. A workstation may become
idle because the preceding workstation requires a longer
time to complete its tasks. The slow station establishes line
congestion by blocking the flow of the process, thereby
causing a bottleneck in the process. The solution is to
redesign processes such that individual workstations, which
may include one or more persons, complete tasks within the
same cycle time.
3.3 Space Management
Effective facility design improves the efficiency of
service operations. It involves space management,
allocation, planning, and forecasting. Performance of a
Page 3
Sakphisal and Higgins
414
service facility relies on the design and layout which
supports the facility’s elements; for example, hospitals
usually locate outpatient departments on the ground floor
and wheelchair and stretcher storage near the front of
hospitals for convenience and speed of access.
Space design needs to take into account flexibility, for
example, to support organizational growth, which demands
more space for additional facilities and resources. Flexible
spaces are required to support various activities by allowing
their activities to expand into the flexible space at an
intermediate growth rate. Design for flexibility protects
against loss of productivity for individual work stations.
Flexible space becomes utilized for high potential activities.
Thus, flexible space should not be dominated by permanent
activities.
For space planning and management programming,
problems, such as the demand for space expansion, need to
be analysed. The result of the analysis can be used to
support the design to improve the performance of the
station. Programming includes forecasting and estimating
demand on space. Space programming applies to all sized
organizations from small firms to entire facilities, buildings
and locations of large organizations. The space planning
process enables organizational goals to be set. The space
that accommodates functions and activities at the right
locations provides better productivity. For example an
emergency department should be located at the front part of
hospitals where urgent cases can be immediately treated.
Adjacent activities should be located next to each other.
Efficient space allows performers to finish their tasks
within the space—that is a utilization criterion. An
organization with a high degree of dynamical changes
needs to be quite flexible.
3.3.1 Space Utilization
Space planning has been developed from several
techniques. According to Cotts, Roper and Payant (2010),
the methods of either Brauer or Muther are preferred by
many facility managers for planning space utilization.
Under Brauer’s method (1992), there is collaboration with
the users in defining space utilization. Priority is given to
how the users define their working environment. Thus,
facilities including space and construction can satisfy their
requirements. Muther’s method (1974) is called
“Systematic Layout Planning”. The facility layout involves
data gathering based on materials flow, space relationships,
and relationships of activities. Muther’s method is widely
used, from offices to manufacturing.
3.3.2 Facility Layout
Normann (2001) states that logic of service: “forces us to
shift our attention from production to utilization, from
product to process, from transaction to relationship. In this
sense the service logic clearly frames a manufacturing logic
rather than replaces it”. Based on Hameri (2011), May
(2004) illustrates that patient-centred service operations at
Griffin Hospital, UK, benefitted from a well designed
facility. In addition the hospital also has the benefit that
staff feels as if they are working as a team and giving more
personalized service. According to Higgins (1999),
decentralizing control allows decisions to be made locally
for unexpected situations, thereby improving management
of uncertainty such that an unexpected situation can be
responded to in a timely fashion. Decentralization not only
simplifies the command structure, but also maintains the
robustness of an organizational system.
3.3.3 Production Flow Analysis
Production Flow Analysis (PFA) is a technique for
planning the change to Group Technology in existing batch
and jobbing production factories (Burbidge, 1991). It
produces a cellular layout within dependent production
cells, which often form the unit for capacity planning and
production location. Different cells together operate
according to a rhythm, which usually in job-shop cases
feeds the parts for final assembly or downstream supply
chain (Hameri, 2011). The PFA methodology is applied to
define the material flows inside the groups. A process and
material flow analysis could show what process and
equipment are needed and how the general material flow
will take place. Some element of process flow analysis
(determining the type and quantities of processing
equipment and calculating there space requirement) after
the product analysis and its importance in development of
some of the data required for facility design. Material flow
analysis, how to develop flow, and distance are an essential
data on creating layouts there are tools for presenting
layout design (Heragu 2006, p. 55).
3.4 Service Capacity
Service demand often varies and this can cause
overloaded workstations or facilities to be idle, including
performers, tools, and machines. Demand for hospital
services is usually less in summer and autumn
(Fitzsimmons and Fitzsimmons, 2008). In other seasons,
patients may need to wait for service. Lovelock and Wright
(1999) suggest that for successful management of capacity,
patterns or determinants of demand need to be understood.
To balance service demand and service capability, Sasser
(1976) identifies two common strategies for managing
capacity: levelling capacity and chasing demand. Levelling
capacity is market-oriented. It is applied where capacity is
Page 4
Sakphisal and Higgins
415
limited and service demand is high. For example a level
capacity strategy is the use of price incentives which
encourage users to come at times of low demand. Chasing
demand is operations-oriented, managing situations where
capacity is variable and resources can be adjusted to satisfy
service demand fluctuations by scheduling the workforce
according to demand. A workforce is one of the variable
facilities in an organizational system, because its capacity is
limited by skills and professional classifications, for
example doctors, nurses, pharmacists, pathologists, and
maintenance technicians are the workforce of hospitals but
their skills are very different. According to Armistead and
Clark (1994), chasing demand should encompass the
significant elements of cost of variation, speed of reaction,
and range of variation. Fitzsimmons and Fitzsimmons
(2008) conclude that the two strategies may be combined as
a hybrid strategy called yield management. An example of
the hybrid strategy application is when a hospital uses the
chase demand strategy for staff scheduling based on
seasonal periods, and a level capacity strategy on its fixed
number of patient beds. However, at times inadequate
capacity still remains a problem for most service
organizations, regardless of which strategy is applied.
Armistead and Clark (1994) suggest organisations should
face such situations by using a coping strategy which either
disregards service quality standards or attempts to manage
a decline in some of its service standards. The problem of
widely variable demand affects most service organizations
that interact with humans either mentally or physically,
such as health care, transportation, food service,
accommodation, and entertainment. Good service managers
know the importance of demand and capacity management.
Fitzsimmons and Fitzsimmons (2008, p. 264) state,
“Service capacity is defined in terms of an achievable level
of output per unit time…for service providers the
measurement of capacity is based on a busy employee and
not on observed output that must always be less than
capacity”. It is essential to track service times. To better
understand the existing service process, the related
variables would be the mean value of service rate per busy
service provider, the number of service providers at
individual service steps, and the mean value of arrival rate
at individual service steps. The number of service facilities
is directly related to the mean value of arrival rate at each
individual service step because, assuming a uniform work
load among the facilities, mean arrival rate at each facility
equals the total mean arrival rate to all facilities divided by
the number of facilities.
3.4.1 Networking
Within the operational system of organizations, the
provider has to find a way to position himself, and enhance
and leverage the value creating process of the customer
(Enquist, Camén & Johnson, 2011; Vargo & Lusch, 2004;
Alter, 2008).
3.5 Robustness
Higgins (1999) explains that having robustness in a
planned operation means less reactive decisions as there are
less need for persons to seek ways to repair the plan. In
reality, the demand and the provision of service operation
vary and that can sometimes cause a crisis situation in the
system. Critical operational management requires more
than technical expertise, it also requires teams to work well
together as a cohesive unit. The aviation industry pioneered
resource management with its cockpit resource
management. This later evolved into crew resource
management (CRM) that considered the entire crew
onboard the aircraft as a cohesive team. The objective of
the concept of CRM was to address the issues arising in the
late 1960s—early 1970s which caused accidents such as
failure to communicate intent and plans; failure to delegate
tasks and assign responsibilities; failure to set priorities;
failure to utilize available data; inadequate leadership;
inadequate monitoring; and preoccupation with minor
mechanical problems (Wiener, 1993). Team resource
management (TRM) incorporates the theoretical
approaches developed in CRM for the hospital training for
the critical operation environment in hospitals (Bleakley et
al. 2004). Kohn, Corrigen and Donaldson (2000) identified
four critical areas that improve safety in an operating
theatre. Key elements of the four critical areas are building
an environment for the safe use of equipment, building a
no-blame environment for investigating and reporting near
misses, building an effective team, and recognizing the
correlation between individual and system errors. The
study of Hugh (2002) confirmed that TRM contributed to a
decrease of accidental injuries during surgical operations
from 1 injury per 200 cases to no injuries per 2000
surgeries.
3.5.1 Resilience
A resilient system is one that can respond rapidly to
unexpected and unplanned situations to quickly bring the
system back to smooth operation that is directed towards
the performed goal. This requires a flexible system,
efficient communication and resource gathering taking
place at critical points. Resilience should avert a disaster or
major disruption by recognising variations that occur out of
the control range. These resilient characteristics are able to
cope with severe pressures and conflicts between safety and
the primary performance goals, by managing the activities
of an organization to predict and avoid threats (Hale &
Page 5
Sakphisal and Higgins
416
Heijer, 2006). Based on Woods and Hollnagel (2006), the
term resilience refers to a system that utilizes the potential
abilities of its resources including engineered
characteristics and highly adaptive abilities in a controlled
manner in various situations, but it should not be used to
describe for human uncontrolled behaviour. Fujita (2006)
explains that service providers who are located at the front
end, such as nurses, doctors and maintenance people, are
inherently proactive and adaptive. These abilities allow
them to accomplish good outcomes in unexpected events.
However, human characteristics may sometimes bring bad
outcomes. McColl-Kennedy and Sparks (2003) claim that
negative emotions, such as anger, affect not only co-
workers but also customers. According to Woods and
Hollnagel (2006), resilience is especially concerned with
understanding how well the system adapts and to what
range or sources of variations. Resilience engineering aims
to support for the cognitive processes of reconstructing an
organization’s standard. Developing indicators and
measures of contributors to resilience maintains an
organization’s safety. They also state that the features of
flexibility, buffers, instability, and tolerance and patterns of
interactions across scales, such as responsibility and
authority, are examples of resilience engineering. Fujita
(2006) stated that the above abilities assist a system to be
robust, so features are required to make a system resilient.
3.5.2 Sensitivity analysis
Any organization can face the changes on a daily basis.
For example, a hospital environment is challenged by has
been challenged by varying demands, need for equipment
replacement, and managing employee illness, absentee, etc.
The decision maker can tolerate the changes by using
information which can be supplied by sensitivity analysis.
Sensitivity analysis is used when analyses the change of
variables by emphasizing on the possible uncertainties
surrounding the outputs. As the results of analysis,
decision-makers can preview the consequence and the
actions can be planned in advance. However, finding
correct information and right amount of information is a
significant challenge. Otherwise, this approach can be time
consuming for decision-makers to find deliberated solution
(Rae, Rothley & Dragicevic, 2007). Sensitivity analysis
application in linear programming provides information
about sensitive parameters which can assist the
management decision maker respond to the change (Hillier
& Lieberman, 1974, p.24). Sensitivity analysis concerns
results different scenarios over the ranges of factors which
are constraints of linear programming. The system
robustness can be designed based on mathematical
statistical records. One way to find it is to look at historical
demand. This can be determined by obtaining and applying
the information about the inventory level that need to be
managed. Standard deviation (σ) of demand in the planning
timeline and confidential level (CL) influence the decision
making for system robustness design. It is important to
maintain the flexibility of service facilities for sustain the
system. In addition, resilience plays a major role when a
system is out of order.
To have a flexible system, a management needs to
support its operational system by not having too much and
not running out of materials and facilities. The desired level
balances demand and supply in an unstable situation. That
is why inventories are essential. In particular, an inventory
system maintains adequate a stock. Whilst inventories are
important, too many can increase the business operational
cost.
The buffer stock is given by ησn, where σn is the standard
deviation and η is the safety factor (Buffa & Sarin, 1987,
p.119). In a hospital operational service with a labour
intensive system, resources calculations are required to
establish the facilities need to take into account the
uncertainties of both the patient mix demand and urgent
circumstance. In this case, the service buffer is given by
Zσd, where σd is the standard deviation of daily demand and
Z is the safety factor for the desire confidence level (CL).
Figure 1: Distribution of service demand
Nu
mb
er o
f p
ati
ents
Max
imiz
ed v
ari
ab
le r
eso
urc
es
Maximum number of patient
resources
Sensitivity Analysis
Varying number of resources
Varying safety factors
Varying service hours
Factors
Figure 2: Sensitivity analysis of hospital service system
x
Page 6
Sakphisal and Higgins
417
3.6 Operational Costs
Operational costs can be either fixed or variable. A fixed
operational cost is not a decision variable, for example the
payroll of an operations manager. A variable cost is a
decision variable, for example payroll, overtime, second
shifts, outsourcing, hiring and laying-off, excess inventory
and backlog, and inconsistency of service rates. Buffa and
Sarin (1987) describe how the behaviour of cost, with
respect to changes in decision variables, is not easy to
quantify. Often, cost approximations are made by assuming
the costs to be linear or quadratic functions of the
appropriate decision variables. These assumptions can be
used to create simple models, such as linear programming,
to determine the minimum cost for planning.
3.6.1 Economy of Scale
Higher productivity can lower operational costs.
However, variable outcomes do not affect fixed costs.
Utilizing resources associated with fixed costs is improved
by increasing units of output and spreading fixed costs
across individual units. More units of output spread the
fixed costs responsibility resulting in a lower unit cost. The
operational environment of more outcomes with less cost is
called economies of scale. From an economic perspective,
cost changes with an increase of output and input numbers.
The model of economies of scale can identify
organizational size. At some stage, an organization’s
management team forces operational/manufacturing
processes to increase their outputs to a stage where the
costs actually increase. At this stage the firm has gone
beyond an optimal volume, so their high outcomes cause
higher costs; this is called diseconomies of scale (Buffa &
Sarin, 1987).
3.6.2 Hospital Costs
The basic unit of capacity is the hospital bed, and bed
occupancy level is a variable figure which needs to be
managed. The level of bed occupancy influences how
revenue flows through the wide-range of healthcare
services of a hospital. Hospital resource utilization and
hospital service revenue depends on the demands of the
patient mix variety. The demand on other hospital services,
such as outpatient service, laboratories and X-rays, then
flows from the variety of patients. The demand on hospital
services is highly variable in nature, so therefore it is hard
to maximize the bed occupancy levels, for example
emergency demand must be served and service facilities
must be available. Emergency cases arrive on a random
basis. This creates a problem for scheduling. Therefore as a
result, the patient mix scheduling and the flow of patient
variety arrivals must be considered. Patient flow can be
effectively managed for scheduled patients for example
patients of an internal medicine clinic who are required to
have regular appointments at the hospital.
A major challenge for a hospital service operation is the
cost of service incurred when the demand increases.
Insufficient services may impact on a patient’s well-being
when the hospital allows the patients to wait for service.
The two primary considerations, for service capacity plan
decision making, are waiting time before being served and
service cost. This means a total operational cost model,
which includes the cost of waiting and the cost of service,
must be developed. Reasonable estimates of the waiting
costs and the service costs need to be obtained to create this
model. Of these two costs, the waiting cost is usually the
more difficult to evaluate. In the waiting line, the cost of
waiting would be the cost per unit of time for a customer
waiting for a service. This cost is not a direct cost to the
hospital, but if the hospital ignores the cost of waiting and
allows a long wait, customers ultimately will take their
business elsewhere. Thus, the business of the hospital will
experience loss from selling its service. Therefore service
cost relies on the hospital service facilities in the service
process. Figure 3 illustrates a hospital’s operational cost
curve. With more patients, the service resource utilization is
better and as a result the service cost per patient decreases
from point A to point B. The optimum point is at point B,
where the operational cost is at the minimum and the
utilization of facilities is at the maximum level. As the
number of patients continues to increase beyond the
maximum utilization of facilities, waiting time is incurred.
The waiting time increases when the arrival rate increases,
but the service rate is constant. This situation forces the
operational cost from the optimum point B into
diseconomies of scale up to point C. The cost curve
maintains the same level of service quality until point B
Patient visits daily
Var
ian
ts
Waiting cost per patient
Desired Maximum operational cost
A
B
C
Service cost per patient
Minimum operational cost
Figure 3: Operatonal cost curve from correlation of
linear regression of hospital operational costs
Page 7
Sakphisal and Higgins
418
where the total operational cost is at its minimum and after
point B operational cost increases as does the cost of
waiting for the service facilities.
It is obvious from the cost curve (Figure 3) that
service cost and waiting time before being served create
conflicting pressures on the decision maker. Maximizing
the utilization of hospital facilities can reduce service cost
per patient. With a small number of patients, providers are
better able to engage in high service quality. On the other
hand, long waiting times are undesirable and incur a high
level of waiting cost. Therefore to reduce service cost, it is
necessary to strive for full facility utilization which results
in a decrease in service cost. The position on the cost
curve indicates whether a decision needs to be made on
service facilities.
The hospital operational cost in a mathematical
statement, where waiting cost is denoted as WC, SC refers
to the service cost and TC is the total operational cost
which aims to be minimized, would be to:
Minimize TC = SC + WC
Table 1: Patients who visit the diabetes clinic held in Internal Medicine.
Type of patient Category Priority
Appointment
(AP)
On-time Existing first
Internal-referred first
Late last
No-appointment
(no AP)
No-show last
External-referred last
4. PATIENT FLOW
The first stage of our study was a pilot exercise that
focused on a medium-sized hospital. Its purpose was to
identify essential elements of a model of the operations of
outpatient servicing. The study covered, inter alia, patient
flow, work activity and information flow at workstations,
service time, material flow, such as specimens and
documentation. It required an examination of each
workstation’s physical layout and equipment, staffing levels,
job descriptions, task analyses and service demands.
Service demand is a critical constraint, as the hospital is
compelled to treat anyone who seeks medical treatment.
This includes information behaviour, the context in which
the service providers work, and the reasons for their actions.
It encompasses why and how they collaborate through the
series of treatment phases in managing the health of
patients. Within an Internal Medicine clinic of an
outpatients department, patients fit two major categories—
with or without an appointment—and subcategories as
shown in Table 1.
The services are delivered to patients through direct
and indirect interaction. For example at the Internal
Medicine clinic, patients meet staff face-to-face when
Welfare
26 sec
Register
78 sec
Weight
9 sec
Blood P.
89 sec
Interview
167 sec
Inspect 17 sec
Collect Medicine
22 sec
Out
Key order 55 sec
Place Sticker 31 sec
Examine
133 sec
Pick up Medicine
73 sec
In
(AP)
In
(no AP)
Direct
servicing of
Indirect
servicing of
Figure 4: The service process within internal medicine at the medium sized hospital.
Page 8
Sakphisal and Higgins
419
patients attend the service activities. The seven direct
service activities include welfare checking; registering;
weight measuring; blood pressure measuring; nurse
interview; doctor examine; and dispatch where patients
pick up medicine. At indirect servicing, staff who perform
the service activities, such as typing prescription orders,
labelling medicine envelopes, collecting medicines, and
inspecting medicines work without having patient contact.
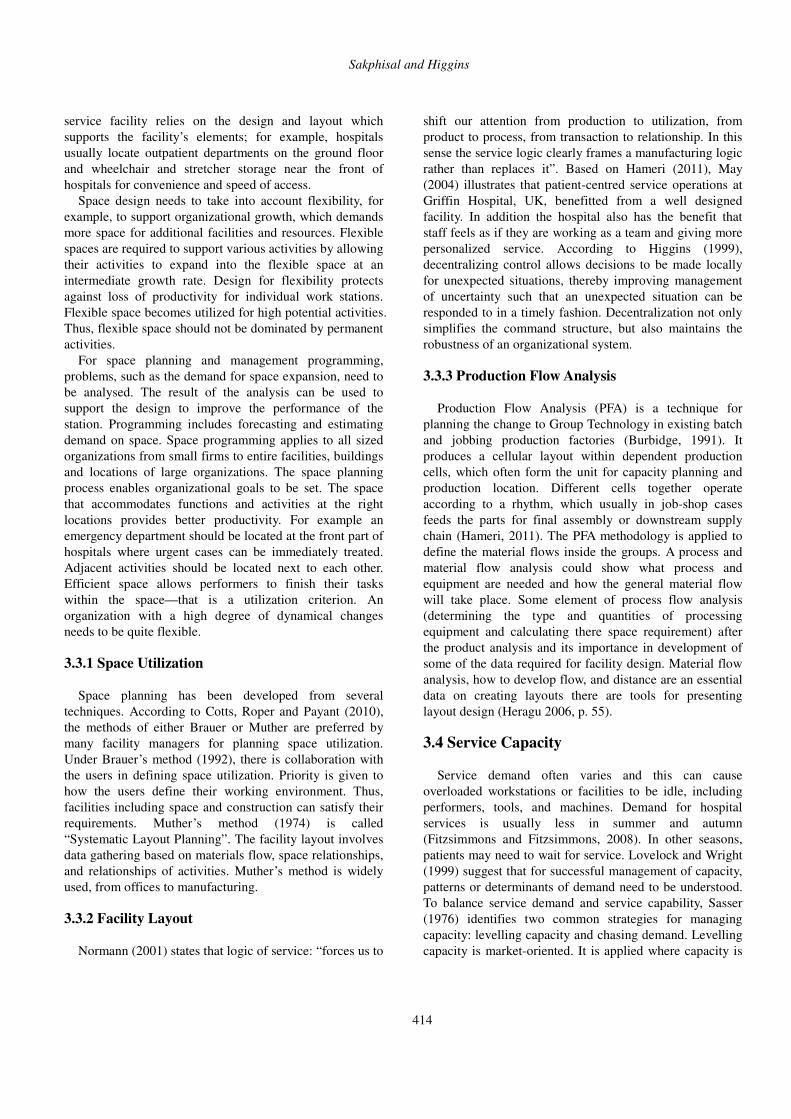
Figure 4 shows the order of service steps of an IM clinic of
the medium sized hospital.
The activities for Internal Medicine are presented in
the flow diagram shown in Figure 5. It includes information
flow, patient flow, and flow of staff. The overall picture of
the Internal Medicine sub-department such as number of
staff, location of service stations and layout is also
presented. Figure 5 shows by way of example, the places of
interaction (i.e., service steps) between outpatient and
hospital personnel, the flow of staff and the locations of
services.
Figure 5: The flow diagram within Internal Medicine at the medium sized hospital.
Medium
Medium Medium
Medium
Medium-large Medium-large
Large
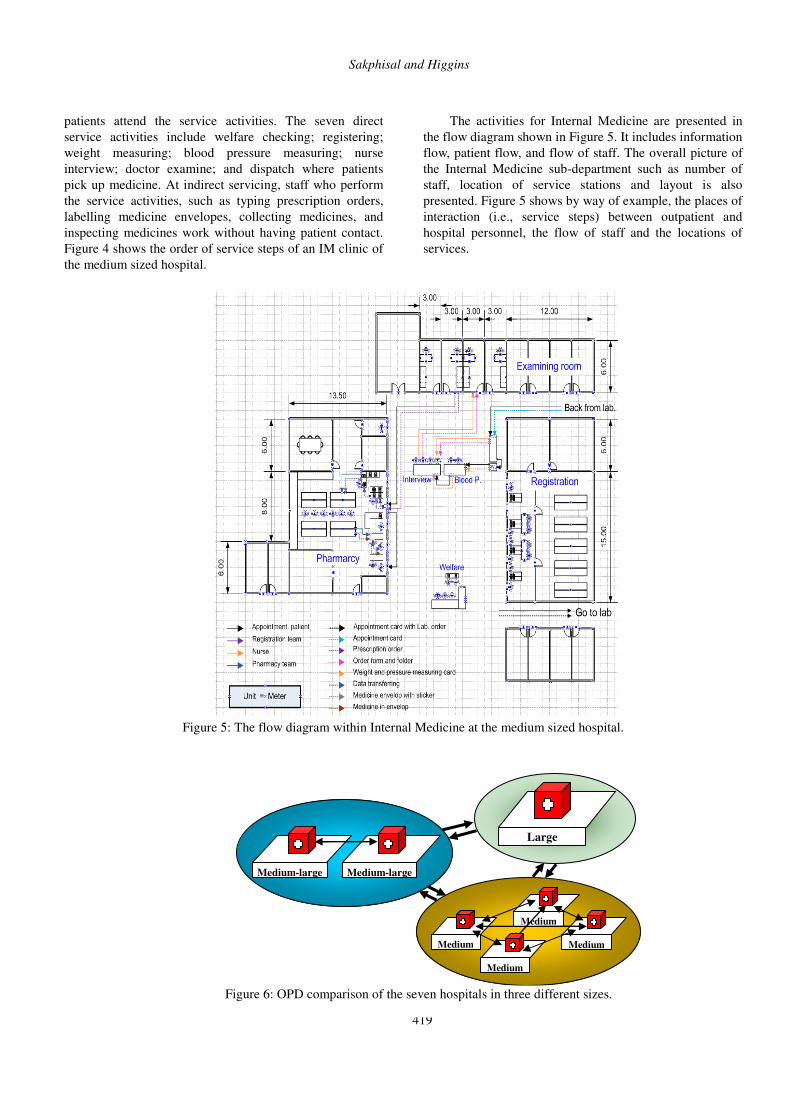
Figure 6: OPD comparison of the seven hospitals in three different sizes.
Page 9
Sakphisal and Higgins
420
For the second stage, the studying the elements of the
service process which provides for outpatient at an Internal
Medicine clinic of the medium sized hospital and the
understanding the application of the elements that have
been in the hospital are the path for scaling the outpatient
service process. This stage has included seven hospitals.
The evidence from this exploration analysis supports the
model scaling. The study has explored Internal Medicine
clinics of OPDs in seven hospitals. These seven hospitals
are categorized in three different sizes as presented in
Figure 6. Four hospitals are medium sized (M), two are
medium-large sized (ML), and one is large sized (L). The
operational processes and service patterns for treating
outpatients at seven hospitals were observed.
Table 2: Hospital details
Hospital Size Medium Medium-large Large
Name M1 M2 M3 M4 ML1 ML2 L1
No. of Bed 440 320 300 420 552 855 2630
Location All hospitals are located in the middle part of Thailand
Figure 7: The activities of seven hospitals in the service pattern.
Figure 8: The service pattern of seven hospitals
Based on Table 2, size is identified by the number of
beds provided for inpatients, which is indicative of overall
resources, funding and public visibility. The objective was
the revelation of the defining characteristics of various
sized hospitals by exploring, more broadly, the elements of
the model using the first stage of this pilot study in an
Internal Medicine clinic. Process flow analysis identified
Page 10
Sakphisal and Higgins
421
the steps for mapping the value stream of tasks. An analysis
of the seven outpatients departments identifies a shared
service pattern for outpatients as shown in Figure 7. The
activities in the service pattern are all the same, but the
processes within individual department are different in each
hospital studied. It is evident that the medium-large sized
and the large-sized hospitals have empowered the
outpatients department by setting up work cells within one
area, based on cellular manufacturing.
The five steps within internal medicine that are
directly connected to the serving of patients are: checking
patient welfare, registration, measuring weight and blood
pressure, interviewing by a nurse, examining by a doctor,
and dispatching medicine. Seven hospitals have the same
pattern of service steps as presented in Figure 8.
The results of the pilot study indicate that there is
much opportunity for improvement in patient flow,
especially reduction in waiting time. The application of
techniques from lean manufacturing may allow hospital to
serve more patients through productivity improvement.
However, applying lean concepts may be to the detriment
of patient welfare. Reducing service times may result in
more errors in diagnosis and treatment. Patients may take
longer to recover and, consequently, placing workload
demands on the hospital over a longer period. Staff, pushed
to work faster, may become dissatisfied and disaffected.
The various tools applied can support the understanding of
the service process for internal medicine for three different
sized hospitals. The five steps within Internal Medicine that
are directly connected to the serving of patients are:
checking patient welfare, registration, measuring weight
and blood pressure, interviewing by a nurse, examining by
a doctor, and dispatching medicine. Seven hospitals have
the same pattern of service steps. Pathology testing is
excluded for the following reasons. Firstly, it does not
apply to all patients. For instance, patients suffering
hypertension do not routinely undergo pathology testing,
whereas all diabetics do. Secondly, a doctor must have
results from pathology before examining a patient. So that
results are available when doctors start to examine patients,
registration of patients and pathology testing commence
early in the morning. Finally, pathology is a service
external to the outpatients department.
6. HOSPITAL SCALABILITY
Further data from seven hospitals included the three
hospitals from pilot study is collected in order to establish
scalability. The final stage of our research is the
development of a model or models by using the analytical
tools from industrial engineering and, in particular, lean
operations. Developments of a model depends on us
identifying the functions of personnel and the possibility
for reallocation of tasks—for example, from medical
consultant to triage nurse—so the hospital can become
more responsive to the needs of outpatients. Obstacles to
patient flow may be reduced, by applying a model that
includes human aspects of planning and control of
outpatient services. Human-centred planning is essential for
the operational improvement of hospitals.
The extent of the hospital scalability aims to meet the
objective as the basis to guide hospitals to create a model
for their growth. The analysis of the hospital scalability is
divided into 5 tiers including factor, parameter, method,
decision, and plan. For the scalability, hospitals need to
consider departments of the entire hospital which involve in
patient service process. The analysis brings together factors
of departments. From factors, parameters are used to
identify the contribution of individual factors to the process.
Factors may correlate to parameters, which some factors
may relate to all aspects of parameters.
Practical decision making in hospitals is a highly
sophisticated process especially when planning to improve
future operational systems. Operations planning problems
focus on a minimum patient flow time, a maximum service
capability of staff and facilities, a maximum service system
robustness, and a minimum operational service cost.
6.1 Hospital Scalability Optimization
In the hospital service process, queuing-type situations
that discourage patient flow time arise in a wide variety of
contexts. Therefore it is not possible to use only one
decision-making methodology because of the mixed patient
demand situations. A hospital offers service capability
through its staff and facilities. Vastly fluctuating
employment could severely diminish this capability. An
important part of a service operation and its impact on the
staffing environment is the recognition of the wide
fluctuations in individual patient demand and demand
quantity. Staff and task allocation need to meet the desired
level of resource utilization. A decision concerning the size
of staff, as well as the allocation of facilities and the
cooperation of shared resources, directly affects the
flexibility of a service process. To optimize flow time,
resource utilization (staff, facilities, and space), robustness
and service cost, decisions about each of these areas need
to be made at the appropriate level of the hospital service
process. For example, a decision on purchasing equipment
not only needs to consider the efficiency of the equipment
including size and capacity, but also space management,
such as location and space availability. Before the decision
is made for the purchase of the additional equipment,
various measures for optimal scalability are required. The
four optimum areas for scalability include maximum
robustness, minimum flow time, maximum resources
Page 11
Sakphisal and Higgins
422
utilization, and minimum service cost. An integration of
the four areas for optimal scalability should provide
decision-makers with sufficient information for them to
understand the entire service operational environment. The
appropriate level of utilization at the desired level of
robustness at an acceptable flow time needs to be measured.
However, decision-makers should be aware of service cost.
The service operational cost may not be at the minimum
cost to achieve the appropriate level of utilization at the
desired level of robustness.
A variety of relationships constitute the components
for hospitals scalability. Figure 9 represents the optimal
scalability, which identifies any given set of decision
variables for scalability. The result is then used to support
an organization’s plan, which is in turn compared with a
cumulative saving for the next investment term.
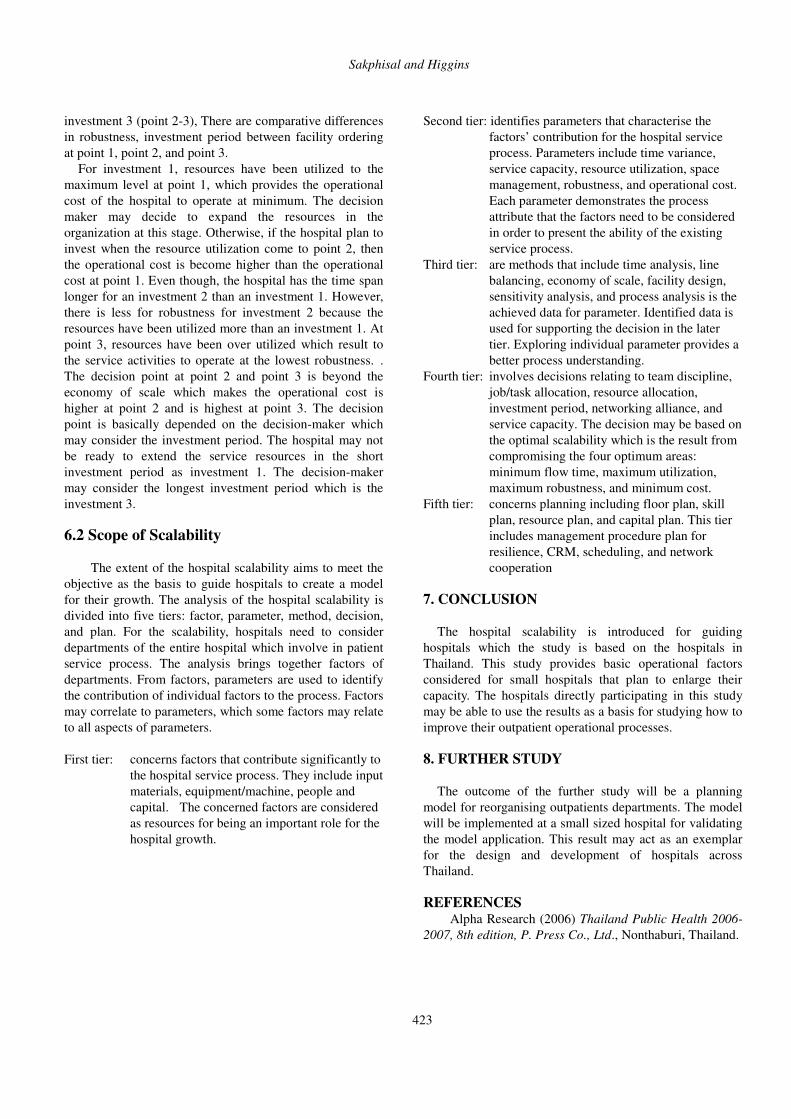
In the graph (Figure 10), the demand for the hospital
service utilities is presented. The entire service process for
the time of the planning horizon is taking the full capacity
of the resources. Because the point for the operational cost
is the decision variables, a new facility is placed to allow
the flexibility in the service process. The robustness level is
returned to the beginning level at the starting point. In this
circumstance, the demand for the facility (staff and/or
medical equipment) at point 1 triggers the call for the
investment planning decision.
Comparing the investment lead time of the three periods;
investment 1 (point 0-1), investment 2 (point 1-2), and
Patient visit daily
Var
ian
ts
Robustness
1 2 3
Investment 1 Investment 2
Investment 3
Resource utilization
Economy
of scale
Diseconomy
of scale
Less resource utilization
More resource utilization
Figure 10: Correlation of scalability’s parameters.
Minimum flow time
Maximum resources utilization
Maximum robustness
Minimum service
cost
Optimal scalability
Figure 9: Hospital scalability optimization
Page 12
Sakphisal and Higgins
423
investment 3 (point 2-3), There are comparative differences
in robustness, investment period between facility ordering
at point 1, point 2, and point 3.
For investment 1, resources have been utilized to the
maximum level at point 1, which provides the operational
cost of the hospital to operate at minimum. The decision
maker may decide to expand the resources in the
organization at this stage. Otherwise, if the hospital plan to
invest when the resource utilization come to point 2, then
the operational cost is become higher than the operational
cost at point 1. Even though, the hospital has the time span
longer for an investment 2 than an investment 1. However,
there is less for robustness for investment 2 because the
resources have been utilized more than an investment 1. At
point 3, resources have been over utilized which result to
the service activities to operate at the lowest robustness. .
The decision point at point 2 and point 3 is beyond the
economy of scale which makes the operational cost is
higher at point 2 and is highest at point 3. The decision
point is basically depended on the decision-maker which
may consider the investment period. The hospital may not
be ready to extend the service resources in the short
investment period as investment 1. The decision-maker
may consider the longest investment period which is the
investment 3.
6.2 Scope of Scalability
The extent of the hospital scalability aims to meet the
objective as the basis to guide hospitals to create a model
for their growth. The analysis of the hospital scalability is
divided into five tiers: factor, parameter, method, decision,
and plan. For the scalability, hospitals need to consider
departments of the entire hospital which involve in patient
service process. The analysis brings together factors of
departments. From factors, parameters are used to identify
the contribution of individual factors to the process. Factors
may correlate to parameters, which some factors may relate
to all aspects of parameters.
First tier: concerns factors that contribute significantly to
the hospital service process. They include input
materials, equipment/machine, people and
capital. The concerned factors are considered
as resources for being an important role for the
hospital growth.
Second tier: identifies parameters that characterise the
factors’ contribution for the hospital service
process. Parameters include time variance,
service capacity, resource utilization, space
management, robustness, and operational cost.
Each parameter demonstrates the process
attribute that the factors need to be considered
in order to present the ability of the existing
service process.
Third tier: are methods that include time analysis, line
balancing, economy of scale, facility design,
sensitivity analysis, and process analysis is the
achieved data for parameter. Identified data is
used for supporting the decision in the later
tier. Exploring individual parameter provides a
better process understanding.
Fourth tier: involves decisions relating to team discipline,
job/task allocation, resource allocation,
investment period, networking alliance, and
service capacity. The decision may be based on
the optimal scalability which is the result from
compromising the four optimum areas:
minimum flow time, maximum utilization,
maximum robustness, and minimum cost.
Fifth tier: concerns planning including floor plan, skill
plan, resource plan, and capital plan. This tier
includes management procedure plan for
resilience, CRM, scheduling, and network
cooperation
7. CONCLUSION
The hospital scalability is introduced for guiding
hospitals which the study is based on the hospitals in
Thailand. This study provides basic operational factors
considered for small hospitals that plan to enlarge their
capacity. The hospitals directly participating in this study
may be able to use the results as a basis for studying how to
improve their outpatient operational processes.
8. FURTHER STUDY
The outcome of the further study will be a planning
model for reorganising outpatients departments. The model
will be implemented at a small sized hospital for validating
the model application. This result may act as an exemplar
for the design and development of hospitals across
Thailand.
REFERENCES Alpha Research (2006) Thailand Public Health 2006-
2007, 8th edition, P. Press Co., Ltd., Nonthaburi, Thailand.
Page 13
Sakphisal and Higgins
424
Alter, S. (2008) Service System Fundamentals: work
system, value chain, and life cycle, IBM Systems Journal,
vol. 47, no. 1, pp. 71-85.
Armistead, C.G., and Clark, G. (1994) The "Coping"
Capacity Management Strategy in Services and the
Influence on Quality Performance, International Journal of
Service Industry Management, 5/ 2, 5-22.
Bertrand, W., and Vries, G.de. (2005) Lessons to be
learned from operations management, in Vissers, J., and
Beech, R. (eds), Health operations management: patient
flow logistics in health care, Routledge, New York.
Bleakley, A., Hobbs, A., Boyden, J., and Walsh, L.
(2004) Safety in Operating Theatres: improving teamwork
through team resource management, Journal of Workplace
Learning, 16/1/2, 83-91.
Brauer, R.L. (1992) Facilities Planning, 2nd edn,
AMACOM, New York.
Buffa, E.S., and Sarin, R.K. (1987) Modern
production / operations management, John Wiley & Sons,
USA.
Burbidge, J.L. (1991) Production Flow Analysis for
Planning Group Technology, Journal of Operations
Management, 10/1, 5-27.
Cotts, D.G., Roper, K.O., and Payant, R.P. (2010) The
Facility Management Handbook, 3rd edn, A Division of
American Management Association, New York.
Enquist, B., Camén, C., and Johnson, M. (2011)
Contractual Governance for Public Service Value
Networks, Journal of Service Management, 22/2, 1-25.
Fitzsimmons, J.A., and Fitzsimmons, M.J. (2008)
Service Management: operations, strategy, information
technology, 6th edn, McGraw-Hill Co., USA.
Fujita ,Y. (2006) Nature of Changes in Systems, in
Hollnagel, E., Woods, D.D., and Leveson, N. (eds),
Resilience Engineering – Concepts and precepts, Ashgate
Publishing, Aldershot, UK, 41-41.
Hale, A., and Heijer, T. (2006) Defining Resilience, in
Hollnagel, E., Woods, D.D., and Leveson, N. (eds),
Resilience Engineering – Concepts and precepts, Ashgate
Publishing, Aldershot, UK, 35-40.
Hall, R., Belson, D., Murali, P., and Dessouky, M.
(2006) Modeling Patient Flows Though the Healthcare
System, in Hall, R.W. (eds), Patient Flow Reducing Delay
in Healthcare Delivery, Springer Science & Business
Media, LLC, USA.
Hameri, A.P. (2011) Production Flow Analysis —
cases from manufacturing and service industry,
International Journal of Production Economies, 129/2,
233-241
Heragu, S.S., (2006) Facility design, 2nd edn,
iUniverse, USA.
Higgins, P.G. (1999) Job Shop Scheduling: hybrid
intelligent human-computer paradigm, PhD thesis, The
University of Melbourne
Hillier, F.S., and Lieberman, G.L. (1974) Operations
research, 2nd edn, Holden-Day, USA.
Hillier, F.S., and Lieberman, G.L. (1974) Operations
research, 2nd edn, Holden-Day, USA.
Hugh, T.B. (2002) New strategies to prevent
laparoscopic bile duct injury—surgeons can learn from
pilots, Surgery, 132/ 5, 826-835.
Kohn, L.T., Corrigan, J., and Donaldson, M.S. (2000)
To Err Is Human: building a safer health system, National
Academy Press, Washington D.C., 2000.
Lee, S.M., and Schniederjans, M.J. (1994) Operations
management, Houghton Mifflin Co., USA.
Lovelock, C., and Wright, L. (1999) Principles of
service marketing and management, Prentice Hall, Upper
Saddle River, NJ.
May, E.L. (2004) Are people your priority? — How to
engage your workplace, Healthcare Executive, 19/4, 8-16.
McColl-Kennedy, J.R., and Sparks, B.A. (2003)
Application of Fairness Theory to Service Failures and
Service Recovery, Journal of Service Research, 5/3, 251-
266.
Muther, R. (1974) Systematic Layout Planning,
Cahners Books, Boston.
Normann, R. (2001). Reframing business: when the
map changes the landscape. Chichester: Wiley.
Paavola, T. (2008) Exploiting Process Thinking in
Health Care, International Journal of Healthcare
Information Systems and Informatics, 3/2, 12-20.
Palmateer, P. (2007) Empire State Container makes
grant-related improvements, Business Journal (Central
New York), 21/23, 13-15.
Pual, R.J., and Kuljis, J. (1995) A Gemeric Simulation
Package for Organizing Outpatient clinics, Proceeding of
the 1995 Winter Simulation Conference.
Rae, C., Rothley, K., and Dragicevic, S. (2007)
Implication of Error and Uncertainty for an Environmental
Planning Scenario: a sensitivity analysis of GIS-based
variables in a reserve design exercise, Lanscape and Urban
Planning, 79/ 3-4, 210-217.
Sasser, W.E. (1976) Match Supply and Demand in
Service Industries, Harvard Business Review, 54/6, 133-
140.
Stacey, R.D., and Griffin, D. (2006) Complexity and
the experience of managing in public sector organizations,
Routledge, New York.
Vargo, S.L., and Lusch, R.F. (2004) Evolving to a
New Dominant Logic for Marketing, Journal of Marketing,
68/1, 1–17.
Page 14
Sakphisal and Higgins
425
Vissers, J., and Beech, R. (2005) Health operations
management : patient flow logistics in health care,
Routledge, New York.
Vissers, J., and Beech, R. (2005) Healthcare
operations management: basic concepts and approaches, in
Vissers, J., and Beech, R. (eds.), Health operations
management : patient flow logistics in health care,
Routledge, New York
Vissers, J.M.H. (1998) Health care management
modelling: a process perspective, Health Care
Management Science, 1/ 2, 77-85.
Walshe, K. (2003) International comparisons of the
quality of health care: what do they tell us?, Quality and
Safety in Health Care, 12/1, February 1, 2003, 4-5.
Wickens, C.D., Gordon, S.E., and Liu, Y. (2004) An
Introduction to human factors engineering, Pearson
Prentice Hall , Upper Saddle River, N.J.
Wiener, E.L., Helmreich, R.L., and Kanki, B.G. (eds.)
(1993) Cockpit Resource Management, Elsevier Academic
Press, San Diego.
Woods, D.D., and Hollnagel, E. (2006) Prologue:
Resilience Engineering Concepts, in Hollnagel, E., Woods,
D.D., and Leveson, N. (eds), Resilience Engineering –
Concepts and precepts, Ashgate Publishing, Aldershot,
UK, 1-6.
AUTHOR BIOGRAPHIES
Adisak Sakphisal is a PhD candidate, Faculty of
Engineering and Industrial Sciences, Swinburne University
of Technology. His Master of Engineering (Industrial
Engineering) is from Swinburne University of Technology,
Melbourne, Australia and his Master of Public and
Private Management is from National Institute of
Development Administration, Bangkok, Thailand. He was
the managing director and founder of an air conditioning
manufacturing company. Currently, he is a director of the
quality management unit and lecturer at Assumption
University, Thailand. His motivation for undertaking a PhD
is the application of research findings that support
operational system development, particularly in hospitals.
Peter G Higgins is a senior lecturer at the Faculty of
Engineering and Industrial Sciences, Swinburne University
of Technology. His PhD and Master of Engineering
Science are from the University of Melbourne and Monash
University, respectively. His research areas are
collaborative decision making and human-machine
interactive control with a focus on cognitive engineering
aspects of interactive decision systems used for production
planning and control.