For Peer Review Scalability Study of Backhaul Capacity Sensitive Network Selection Scheme in LTE-WiFi HetNet Alvin Ting, David Chieng, Kae Hsiang Kwong Wireless Communication, MIMOS Berhad, K.L, Malaysia. {kee.ting, ht.chieng, kh.kwong}@mimos.my Ivan Andonovic CIDCOM, Dept. EEE, University of Strathclyde, Scotland, UK [email protected]K. D. Wong Daniel Wireless LLC Palo Alto, CA, USA [email protected]Abstract Wireless Heterogeneous Network (HetNet) with small cells presents a new backhauling challenge which differs from those of experienced by conventional macro-cells. In practice, the choice of backhaul technology for these small cells whether fiber, xDSL, point–to-point and point-to-multipoint wireless, or multi-hop/mesh networks, is often governed by availability and cost, and not by required capacity. Therefore, the resulting backhaul capacity of the small cells in HetNet is likely to be non-uniform due to the mixture of backhaul technologies adopted. In such an environment, a question then arises whether a network selection strategy that considers the small cells’ backhaul capacity will improve the end users’ usage experience. In this paper, a novel Dynamic Backhaul Capacity Sensitive (DyBaCS) network selection schemes (NSS) is proposed and compared with two commonly used network NSSs, namely WiFi First (WF) and Physical Data Rate (PDR) in an LTE-WiFi HetNet environment. The proposed scheme is evaluated in terms of average connection or user throughput 1 and fairness among users. The effects of varying WiFi backhaul capacity (uniform and non-uniform distribution), WiFi-LTE coverage ratio, user density and WiFi access points (APs) density within the HetNet form the focus of this paper. Results show that the DyBaCS scheme generally provides superior fairness and user throughput performance across the range of backhaul capacity considered. Besides, DyBaCS is able to scale much better than WF and PDR across different user and WiFi densities. Keywords - Hetrogeneous Network, Network Selection, LTE, WiFi, Traffic Offload, Backhaul Capacity 1. Introduction The increasing pressure for mobile operators to offload data traffic from their 3G, LTE or WiMAX networks to small cell networks [1] [2] indicates that future mobile broadband networks will largely be heterogeneous. This migration is further fueled by the availability of multi-RAT (Radio Access Technology) which allows user devices to connect to different wireless networks such as 3G, LTE, WiMAX, WiFi either one at a time or simultaneously. Deployment of small cells such as WiFi raises new backhaul challenges for operators. There are only two broad choices as far as backhaul is concerned, 1 Capacity and throughput are used interchangeably throughout article with the detail definition in section 2.1 wireline and wireless backhaul. Due to intensive engineering work required, high cost and regulatory barriers, fixed line solutions such as fiber, cable, copper or xDSL are not ubiquitously available. Further, a relatively large number of WiFi hotspots may prove too costly for operators to backhaul with wired options. In such situations, the operator may instead increasingly rely on point-to-point and point-to-multipoint wireless solutions. However in most scenarios, a mixture of backhaul technologies is expected, as operators will adopt the most suitable backhaul solution for small cells considering the cost and availability [3] (Figure 1). With the maturity of multi- hop mesh networks, it may also serve as a potential candidate [4] [5]. Currently, WiFi APs are typically backhauled through different types of technologies which offer throughput capacity ranging from several mega bit per second (Mbps) to tens of Mbps [4]. Backhauling APs using different technologies within the HetNet leads to non-uniform AP capacity distribution. The most widely deployed IEEE802.11n WiFi technology which provisions a peak physical data rate of 600Mbps. Due to that most existing fixed backhaul services are not able to offer sufficient capacity for these WiFi APs to realize their full potential. Therefore consideration of WiFi backhaul capacity is inevitable during traffic offload decision making. Figure 1: LTE-WiFi Heterogeneous Network with different backhaul options. 1.1. Related Work To reduce data traffic pressure over mobile networks, alternative networks such as WiFi are preferred by mobile operators whenever possible [6]. As report in [7], most WiFi-enabled smartphones are configured with WiFi First network selection scheme by default to give WiFi higher priority over the cellular interface for data transmissions. Network selection strategies for WiMAX-WiFi network which Wireless Backhaul wired Backhaul WiFi WiFi WiFi wired backhaul WiFi WiFi LTE Page 1 of 26 http://mc.manuscriptcentral.com/ett Transactions on Emerging Telecommunications Technologies 1 2 3 4 5 6 7 8 9 10 11 12 13 14 15 16 17 18 19 20 21 22 23 24 25 26 27 28 29 30 31 32 33 34 35 36 37 38 39 40 41 42 43 44 45 46 47 48 49 50 51 52 53 54 55 56 57 58 59 60
The increasing pressure for mobile operators to offload data traffic from their 3G, LTE or WiMAX networks to small cell networks [1] [2] indicates that future mobile broadband networks will largely be heterogeneous. This migration is further fueled by the availability of multi-RAT (Radio Access Technology) which allows user devices to connect to different wireless networks such as 3G, LTE, WiMAX, WiFi either one at a time or simultaneously. Deployment of small cells such as WiFi raises new backhaul challenges for operators. There are only two broad choices as far as backhaul is concerned,
1 Capacity and throughput are used interchangeably throughout
article with the detail definition in section 2.1
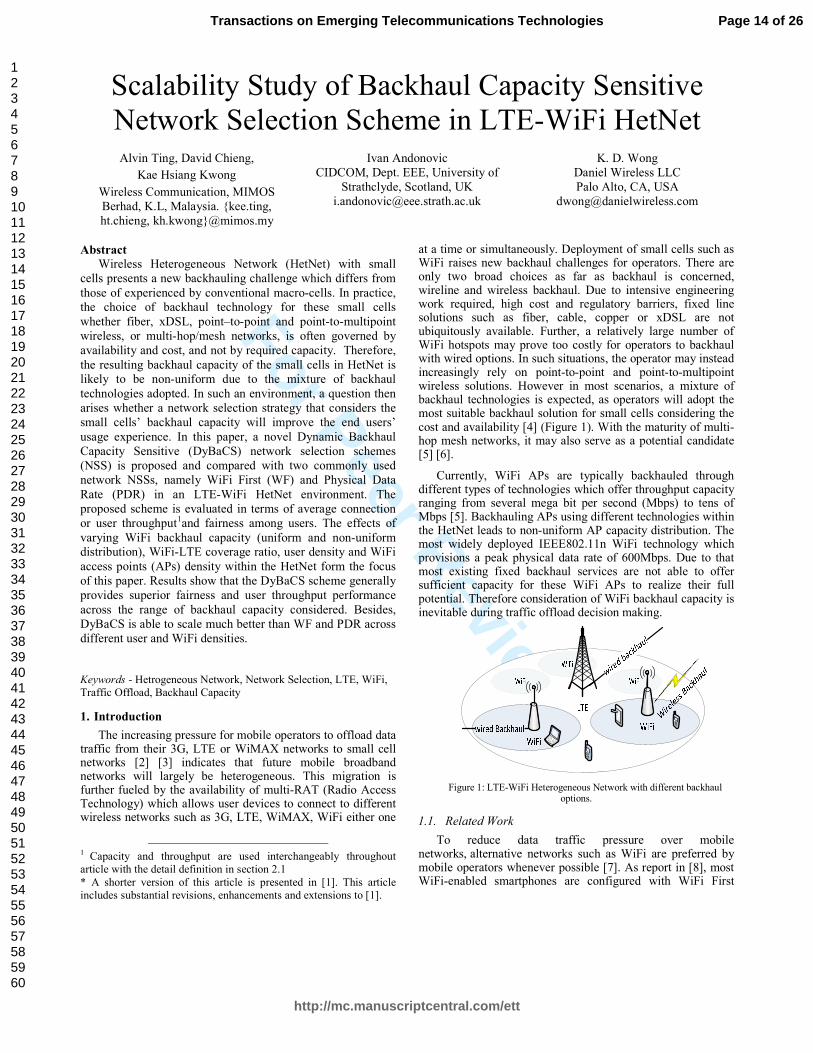
wireline and wireless backhaul. Due to intensive engineering work required, high cost and regulatory barriers, fixed line solutions such as fiber, cable, copper or xDSL are not ubiquitously available. Further, a relatively large number of WiFi hotspots may prove too costly for operators to backhaul with wired options. In such situations, the operator may instead increasingly rely on point-to-point and point-to-multipoint wireless solutions. However in most scenarios, a mixture of backhaul technologies is expected, as operators will adopt the most suitable backhaul solution for small cells considering the cost and availability [3] (Figure 1). With the maturity of multi-hop mesh networks, it may also serve as a potential candidate [4] [5].
Currently, WiFi APs are typically backhauled through different types of technologies which offer throughput capacity ranging from several mega bit per second (Mbps) to tens of Mbps [4]. Backhauling APs using different technologies within the HetNet leads to non-uniform AP capacity distribution. The most widely deployed IEEE802.11n WiFi technology which provisions a peak physical data rate of 600Mbps. Due to that most existing fixed backhaul services are not able to offer sufficient capacity for these WiFi APs to realize their full potential. Therefore consideration of WiFi backhaul capacity is inevitable during traffic offload decision making.
Figure 1: LTE-WiFi Heterogeneous Network with different backhaul options.
1.1. Related Work
To reduce data traffic pressure over mobile networks, alternative networks such as WiFi are preferred by mobile operators whenever possible [6]. As report in [7], most WiFi-enabled smartphones are configured with WiFi First network selection scheme by default to give WiFi higher priority over the cellular interface for data transmissions. Network selection strategies for WiMAX-WiFi network which
Wire
less Back
haul
wired Backhaul
WiFi
WiFi
WiFiwire
d backhaul
WiFi
WiFi
LTE
Page 1 of 26
http://mc.manuscriptcentral.com/ett
Transactions on Emerging Telecommunications Technologies
is predominantly driven by data rate are reported in [8] and [9]. This kind of network selection strategies lead to poor user experiences [10] and causes unbalanced load distribution amongst access networks [11].
Several studies [12-14] have proposed the use of Network Selection Schemes (NSSs) to optimize network performance. The work by [12] considers a globally optimal user-network association scheme in a WLAN-UMTS hybrid cell. In [13], a heuristic greedy search algorithm that maximizes total user throughput in a heterogeneous wireless access network comprising WiFi APs and 3G BSs is proposed. Both these studies adopt a simplified WLAN model by assuming only one transmission rate. Poisson point process (PPP) theory and stochastic geometry method are used in [14] to model traffic offloading in a multi RAT heterogeneous wireless network. The authors propose a method to determine the optimum percentage of the traffic that needs be offloaded in order to maximize network coverage while meeting user requirements. In that work however, no network selection algorithm is proposed.
Fairness performance is considered in [15-18] where [15] focuses on ensuring max-min fairness for multicast in Orthogonal Frequency Division Multiple Access (OFDMA)-based wireless heterogeneous networks. A proportional user rate based radio resource management strategy is investigated in [16] on LTE-WiFi HetNet, where a suboptimal network selection algorithm is introduced to improve the minimum normalized user rate and fairness. Bejerano et al. [17] proposes changes to the transmission power of AP beacon messages in order to minimize the load in congested APs and produces an optimal max-min load balancing strategy. A load balancing scheme for overlapping wireless LAN cells is reported in [18]. However, the work aims to balance the throughput of APs and not the fairness amongst users.
NSSs that consider QoS are reported in [6] [22] [23]. Network selection based on multiple parameters such as cost, bandwidth and QoS parameters including packet loss, jitter and delay is reported in [22]. However, the study focuses only on general heterogeneous networking and no specific type of technology is simulated. Similarly, the work in [6] and [23] investigate access network selection for optimal service delivery and QoS to users respectively. However the overall HetNet performance and fairness is not considered.
Load balancing in Cellular and WLAN HetNet is reported in [19] [20] and [21]. In [19], a joint access-control strategy is designed for sharing of the radio resource and load balancing between CDMA Cellular Network and WLANs by considering user preferences. Bandwidth allocation is optimized by maximizing the aggregated social welfare of the WLANs under interference-constraint environment. However, the method used to balance the load amongst mobile nodes is not disclosed. The work in [20] looks into the trade-off between the amount of traffic being offloaded and users’ satisfaction. An incentive framework is proposed to motivate users to use delay tolerance WiFi networks for traffic offloading. Yang et al. in [21] proposes a load balancing scheme that aims to balance the network load between the LTE network and WiFi hotspots considering access pattern of UEs.
Bejerano et al. [10] considers backhaul capacity during AP selection, while [24] proposes a backhaul-aware base station (BS) selection algorithm. Although backhaul-aware network selection scheme have been explored in these works, their scope is limited to homogeneous wireless networks.
In this paper, a Dynamic Backhaul Capacity Sensitive (DyBaCS) NSS is proposed for LTE-WiFi HetNet. This scheme not only considers access link throughput but also available backhaul capacity in order to preserve fairness amongst users. The proposed scheme is compared with two commonly used NSSs namely WiFi First (WF) and Physical Data Rate (PDR). This paper investigates fairness and average user throughput performances across WiFi backhaul capacity ranging from 1Mbps to 25Mbps.
The rest of the paper is organized as follows. Section 2 describes the proposed DyBaCS network selection algorithm as well as WF and PDR schemes. Section 3 details the simulation approach, simulation parameters and assumptions made. Results are discussed in Section 4 followed by conclusions in Section 5.
2. Existing and Proposed Network Selection Schemes
This section describes the simulation approach simulation parameters and assumptions used in the study. The notations used are listed in TABLE I.
TABLE I : NOTATIONS
Notation Description
𝑁𝑐𝑙𝑢𝑠𝑡𝑒𝑟 number of clusters for user distribution
𝜎𝑥, 𝜎𝑦 width and height of user distribution clusters
𝑁𝑢𝑠𝑒𝑟 number of users in a cluster
𝑆𝐼𝑁𝑅 signal to interference and noise ratio
SNR signal to noise ratio
𝑝𝑢 WiFi receive power by user u
𝑝𝐼 WiFi interference power
𝑁𝐹 noise floor
𝐶𝐴𝑣 average user throughput
𝑅 WiFi downlink physical transmission rate to users
𝜑 link throughput efficiency measured at the IP layer
𝑇 maximum downlink throughput achievable by a LTE user
𝐶𝑙𝑖𝑛𝑘,𝑢𝐿𝑇𝐸 access link throughput from LTE BS to user 𝑢
𝐶𝑏ℎ𝑖 backhaul capacity of AP 𝑖 in Mbps
𝐶𝐴𝑣,𝑙𝑡𝑑𝑖
average AP 𝑖 users’ throughput with limited backhaul capacity
𝐶𝐴𝑣𝑖
average AP 𝑖 users’ throughput with sufficient backhaul capacity
𝐶𝑒𝑓𝑓 effective user throughput
𝐶𝑛𝑖 estimated throughput if user n is connected to AP 𝑖
𝐶𝑛𝐿𝑇𝐸 estimated throughput if user n is connected to LTE BS
Ω list of higher speed connections (amongst WiFi and LTE interfaces for a user) for all users in throughput
𝐴 set that contains all users in the HetNet
2.1. Network Capacity Model
2.1.1. Single WiFi AP with Max-min Fairness
In a multi-rate WiFi network, users with slower link speed tend to occupy more spectrum resource (in terms of transmit time) than higher speed users for the same amount of data sent. Such a bandwidth sharing scenario amongst all users within a single AP coverage has been modelled.
Suppose a total of 𝑁𝑢𝑠𝑒𝑟 users are connected to an AP and each is supported by a data rate, 𝑅𝑢 in accordance to their 𝑆𝐼𝑁𝑅 level. Thus, user 𝑢 receives transmission slots at rate 𝑅𝑢 bps, where 𝑢 = 1,2. . 𝑁𝑢𝑠𝑒𝑟 . Assuming the channel access probability is 𝒫u and it exhibits the effect of slots assignment, which is inversely proportional to user data rate 𝑅𝑢. Let 𝑆𝑢 be the number of slots allocated to user 𝑢, where 𝑆𝑢 = 𝑘/𝑅𝑢, with 𝑘 being an arbitrary constant which will be cancelled off eventually. In this case, if user packet size is assumed to be the same, the AP throughput at the physical layer can be calculated as [25] [26]:
𝐶𝑠𝑦𝑠𝑃ℎ𝑦
=∑ 𝒫𝑢𝑅𝑢𝑆𝑢
𝑁𝑢𝑠𝑒𝑟𝑢=1
∑ 𝒫𝑢𝑆𝑢𝑁𝑢𝑠𝑒𝑟𝑢=1
(1)
Substituting 𝑆𝑢 =𝑘
𝑅𝑢 into Eqn (1);
𝐶𝑠𝑦𝑠𝑃ℎ𝑦
=∑ 𝒫𝑢𝑅𝑢(
𝑘
𝑅𝑢)
𝑁𝑢𝑠𝑒𝑟𝑢=1
∑ 𝒫𝑢( 𝑘
𝑅𝑢)
𝑁𝑢𝑠𝑒𝑟𝑢=1
=𝑘∙∑ 𝒫𝑢
𝑁𝑢𝑠𝑒𝑟𝑢=1
𝑘∙∑ 𝒫𝑢𝑅 𝑢
𝑁𝑢𝑠𝑒𝑟𝑢=1
=∑ 𝒫𝑢
𝑁𝑢𝑠𝑒𝑟𝑢=1
∑ 𝒫𝑢𝑅 𝑢
𝑁𝑢𝑠𝑒𝑟𝑢=1
(2)
Since the sum of 𝒫u by all user is ∑ 𝒫𝑢𝑁𝑢𝑠𝑒𝑟𝑢=1 = 1, Eqn (2)
can be further simplified to:
𝐶𝑠𝑦𝑠𝑃ℎ𝑦
=1
∑ 𝒫𝑢𝑅 𝑢
𝑁𝑢𝑠𝑒𝑟𝑢=1
(3)
The average physical layer throughput per user 𝐶𝐴𝑣𝑃ℎ𝑦
is
calculated by dividing Eqn (3) with the total number of users
𝑁𝑢𝑠𝑒𝑟 Since fair resource sharing is assumed, which in turn implies that the packet sending frequency of every user is the
same, the 𝒫𝑢 of a user can also be written as 1
𝑁𝑢𝑠𝑒𝑟:
𝐶𝐴𝑣𝑃ℎ𝑦 = (
1
𝑁𝑢𝑠𝑒𝑟) × (
1
∑
1𝑁𝑢𝑠𝑒𝑟
𝑅𝑢
𝑁𝑢𝑠𝑒𝑟𝑢=1
) =1
∑1
𝑅𝑢
𝑁𝑢𝑠𝑒𝑟𝑢=1
(4)
The model facilitates max-min fairness [27] [28] behavior in a multi-rate system where all users are allocated an equal amount bandwidth resource. This characteristic is representative of WLAN Distributed Coordinated Function (DCF) [29] where all users are offered a fair medium access opportunity.
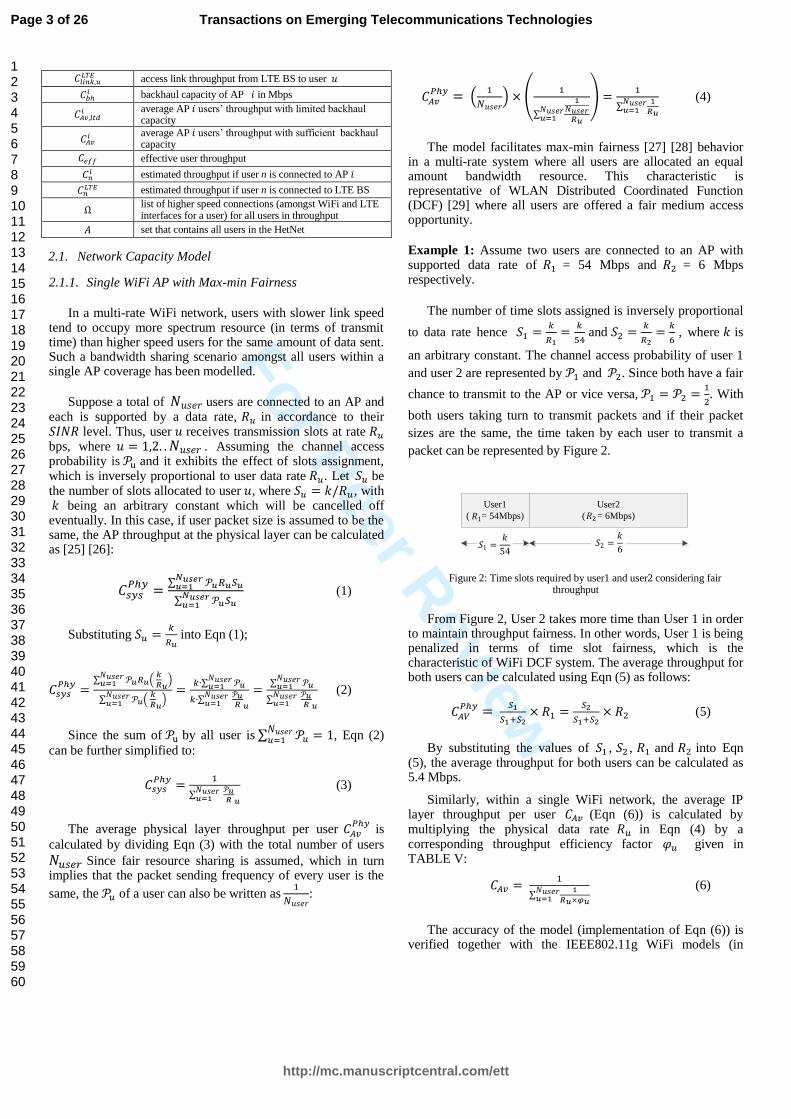
Example 1: Assume two users are connected to an AP with supported data rate of 𝑅1 = 54 Mbps and 𝑅2 = 6 Mbps respectively.
The number of time slots assigned is inversely proportional
to data rate hence 𝑆1 =𝑘
𝑅1=
𝑘
54 and 𝑆2 =
𝑘
𝑅2=
𝑘
6 , where 𝑘 is
an arbitrary constant. The channel access probability of user 1
and user 2 are represented by 𝒫1 and 𝒫2. Since both have a fair
chance to transmit to the AP or vice versa, 𝒫1 = 𝒫2 =1
2. With
both users taking turn to transmit packets and if their packet
sizes are the same, the time taken by each user to transmit a
packet can be represented by Figure 2.
Figure 2: Time slots required by user1 and user2 considering fair throughput
From Figure 2, User 2 takes more time than User 1 in order to maintain throughput fairness. In other words, User 1 is being penalized in terms of time slot fairness, which is the characteristic of WiFi DCF system. The average throughput for both users can be calculated using Eqn (5) as follows:
𝐶𝐴𝑉𝑃ℎ𝑦 =
𝑆1
𝑆1+𝑆2× 𝑅1 =
𝑆2
𝑆1+𝑆2× 𝑅2 (5)
By substituting the values of 𝑆1 , 𝑆2 , 𝑅1 and 𝑅2 into Eqn (5), the average throughput for both users can be calculated as 5.4 Mbps.
Similarly, within a single WiFi network, the average IP layer throughput per user 𝐶𝐴𝑣 (Eqn (6)) is calculated by multiplying the physical data rate 𝑅𝑢 in Eqn (4) by a corresponding throughput efficiency factor 𝜑𝑢 given in TABLE V:
𝐶𝐴𝑣 = 1
∑1
𝑅𝑢×𝜑𝑢
𝑁𝑢𝑠𝑒𝑟𝑢=1
(6)
The accuracy of the model (implementation of Eqn (6)) is verified together with the IEEE802.11g WiFi models (in
User1
( = 54Mbps)
User2
( = 6Mbps)
0.15678 0.90999𝑆1 =𝑘
54 𝑆2 =
𝑘
6
𝑅1 𝑅2
Page 3 of 26
http://mc.manuscriptcentral.com/ett
Transactions on Emerging Telecommunications Technologies
section 3.1) using the QualNet event-driven simulator (Version 5.2) and the results are found to be very similar.
2.1.2. LTE with Max-Min Fairness
In LTE, resource is assigned to users in forms of Physical Resource Blocks (PRB) consisting of many Resource Elements. The same max-min fair bandwidth sharing approach is adopted where in the LTE case, more PRBs are assigned to users experiencing worse channel behavior to ensure fairness. This assumption is reasonable since the LTE Medium Access Control (MAC) scheduler has not been fully defined in the standards. In order to simplify the study, resource element allocations in LTE are approximated as time fraction allocation in a TDMA manner as modeled in [16] and the average user throughput is defined by Eqn (7), a straightforward modification from Eqn (6):
𝐶𝐴𝑣 = 1
∑1
𝑇𝑢
𝑁𝑢𝑠𝑒𝑟𝐿𝑇𝐸
𝑢=1
(7)
where 𝑇𝑢 is maximum link throughput achievable by LTE user
𝑢 and 𝑁𝑢𝑠𝑒𝑟𝐿𝑇𝐸 is the total number of LTE users.
2.2. Network Selection Schemes
In a heterogeneous wireless network comprising two or more technologies, user throughput fairness needs to be considered in two aspects, intra-network fairness and inter-network fairness. Intra-network fairness can be provided by AP or LTE BS to its associated users as the task is confined locally. With max-min fair capacity sharing of WiFi and LTE network (Eqn (6) and Eqn (7)), fairness is achievable amongst users under the same AP or BS. However, fair capacity sharing across the entire HetNet is not guaranteed and is strongly dependent on the implemented NSSs. The proposed DyBaCS is compared with two commonly used NSSs namely WiFi First (WF) and Physical Data Rate (PDR), the characteristics of which are as follows:
2.2.1. WiFi First (WF)
WiFi First (WF) connects a user to an AP whenever WiFi coverage is available. In other words, a user will never connect to a LTE network when there is WiFi coverage. This approach is adopted by most smart phones’ and tablets’ connection manager by default as the preferred data connection mode. In addition, this mode is also promoted by some mobile operators as a means to offload traffic from mobile networks [30] [7].
2.2.2. Physical Data Rate (PDR)
PDR chooses the network based on the Physical data rate of the RAT available to the user [8] [9]. Here the physical data rates provided by LTE and WiFi are compared and the RAT with higher physical data rate is chosen. Since PDR tends to assign more bandwidth to the users with better link capacity, it compromises user fairness, though the overall throughput performance might be good.
DyBaCS is mainly proposed to preserve fairness while maximizing HetNet throughput. Thus DyBaCS throughput performance may not outperform PDR (which is optimum in maintaining HetNet throughput), but it is very close to PDR in most cases (Section 4). In the study, a single LTE network is assumed with 𝐼 (𝐼 ≥ 1) denoting the total number of WiFi APs in the HetNet and i denoting the index of the network, i.e. network 𝑖 = 1 ≤ 𝑖 ≤ 𝐼 is the i-th WiFi network, while, 𝑢 = 1 ≤ 𝑢 ≤ 𝑁𝑢𝑠𝑒𝑟
𝐻𝑒𝑡𝑁𝑒𝑡 represents the 𝑢-th user in the HetNet and 𝑈 is the total user in entire HetNet. Total number of users
in AP 𝑖 and LTE network is represented by 𝑈𝑖 and 𝑈𝐿𝑇𝐸 respectively.
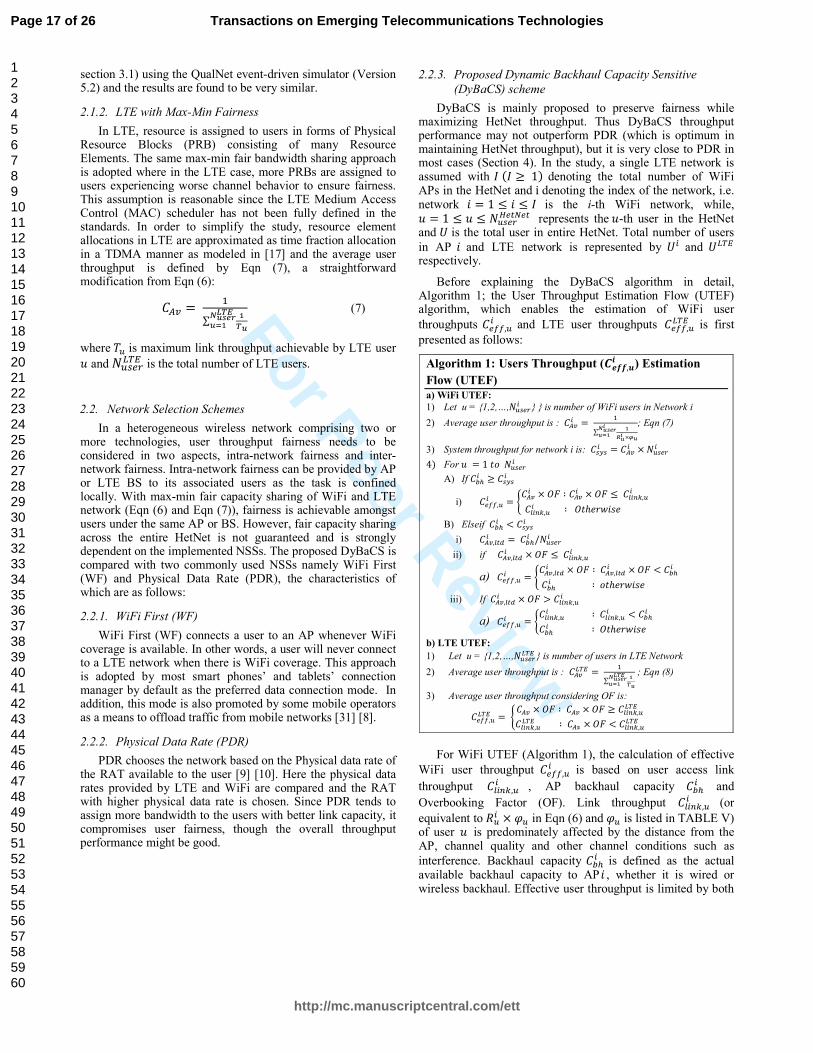
Before explaining the DyBaCS algorithm in detail, Algorithm 1; the User Throughput Estimation Flow (UTEF) algorithm, which enables the estimation of WiFi user
throughputs 𝐶𝑒𝑓𝑓,𝑢𝑖 and LTE user throughputs 𝐶𝑒𝑓𝑓,𝑢
factors. In practice, OF is normally considered as not all the users access the channel at the same time [31]; by including OF the perceived throughput from the users point of view can be calculated.
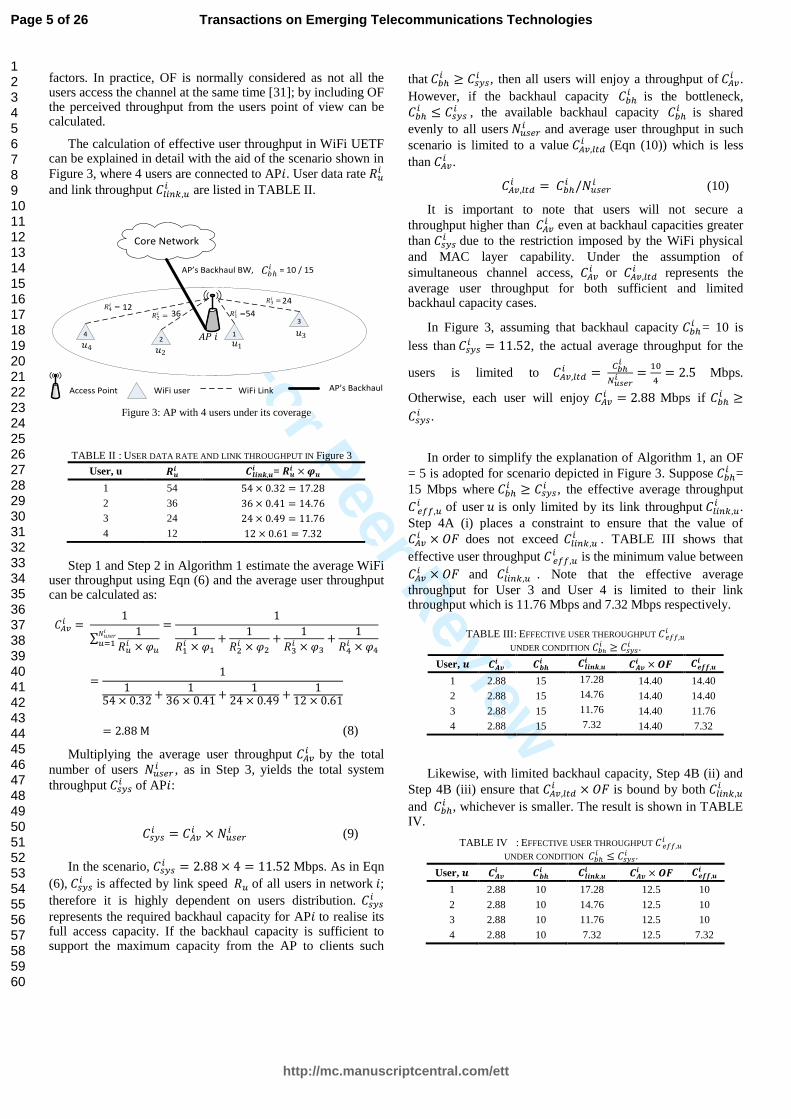
The calculation of effective user throughput in WiFi UETF can be explained in detail with the aid of the scenario shown in
Figure 3, where 4 users are connected to AP𝑖. User data rate 𝑅𝑢𝑖
and link throughput 𝐶𝑙𝑖𝑛𝑘,𝑢𝑖 are listed in TABLE II.
Figure 3: AP with 4 users under its coverage
TABLE II : USER DATA RATE AND LINK THROUGHPUT IN Figure 3
User, u 𝑹𝒖𝒊 𝑪𝒍𝒊𝒏𝒌,𝒖
𝒊 = 𝑹𝒖𝒊 × 𝝋𝒖
1 54 54 × 0.32 = 17.28
2 36 36 × 0.41 = 14.76
3 24 24 × 0.49 = 11.76
4 12 12 × 0.61 = 7.32
Step 1 and Step 2 in Algorithm 1 estimate the average WiFi
user throughput using Eqn (6) and the average user throughput can be calculated as:
𝐶𝐴𝑣𝑖 =
1
∑1
𝑅𝑢𝑖 × 𝜑𝑢
𝑁𝑢𝑠𝑒𝑟𝑖
𝑢=1
=1
1
𝑅1𝑖 × 𝜑1
+1
𝑅2𝑖 × 𝜑2
+1
𝑅3𝑖 × 𝜑3
+1
𝑅4𝑖 × 𝜑4
=1
154 × 0.32
+1
36 × 0.41+
124 × 0.49
+1
12 × 0.61
= 2.88 M (8)
Multiplying the average user throughput 𝐶𝐴𝑣𝑖 by the total
number of users 𝑁𝑢𝑠𝑒𝑟𝑖 , as in Step 3, yields the total system
throughput 𝐶𝑠𝑦𝑠𝑖 of AP𝑖:
𝐶𝑠𝑦𝑠𝑖 = 𝐶𝐴𝑣
𝑖 × 𝑁𝑢𝑠𝑒𝑟𝑖 (9)
In the scenario, 𝐶𝑠𝑦𝑠𝑖 = 2.88 × 4 = 11.52 Mbps. As in Eqn
(6), 𝐶𝑠𝑦𝑠𝑖 is affected by link speed 𝑅𝑢 of all users in network 𝑖;
therefore it is highly dependent on users distribution. 𝐶𝑠𝑦𝑠𝑖
represents the required backhaul capacity for AP𝑖 to realise its full access capacity. If the backhaul capacity is sufficient to support the maximum capacity from the AP to clients such
that 𝐶𝑏ℎ𝑖 ≥ 𝐶𝑠𝑦𝑠
𝑖 , then all users will enjoy a throughput of 𝐶𝐴𝑣𝑖 .
However, if the backhaul capacity 𝐶𝑏ℎ𝑖 is the bottleneck,
𝐶𝑏ℎ𝑖 ≤ 𝐶𝑠𝑦𝑠
𝑖 , the available backhaul capacity 𝐶𝑏ℎ𝑖 is shared
evenly to all users 𝑁𝑢𝑠𝑒𝑟𝑖 and average user throughput in such
scenario is limited to a value 𝐶𝐴𝑣,𝑙𝑡𝑑𝑖 (Eqn (10)) which is less
than 𝐶𝐴𝑣𝑖 .
𝐶𝐴𝑣,𝑙𝑡𝑑𝑖 = 𝐶𝑏ℎ
𝑖 /𝑁𝑢𝑠𝑒𝑟𝑖 (10)
It is important to note that users will not secure a
throughput higher than 𝐶𝐴𝑣𝑖 even at backhaul capacities greater
than 𝐶𝑠𝑦𝑠𝑖 due to the restriction imposed by the WiFi physical
and MAC layer capability. Under the assumption of
simultaneous channel access, 𝐶𝐴𝑣𝑖 or 𝐶𝐴𝑣,𝑙𝑡𝑑
𝑖 represents the
average user throughput for both sufficient and limited backhaul capacity cases.
In Figure 3, assuming that backhaul capacity 𝐶𝑏ℎ𝑖 = 10 is
less than 𝐶𝑠𝑦𝑠𝑖 = 11.52, the actual average throughput for the
users is limited to 𝐶𝐴𝑣,𝑙𝑡𝑑𝑖 =
𝐶𝑏ℎ𝑖
𝑁𝑢𝑠𝑒𝑟𝑖 =
10
4= 2.5 Mbps.
Otherwise, each user will enjoy 𝐶𝐴𝑣𝑖 = 2.88 Mbps if 𝐶𝑏ℎ
𝑖 ≥
𝐶𝑠𝑦𝑠𝑖 .
In order to simplify the explanation of Algorithm 1, an OF
= 5 is adopted for scenario depicted in Figure 3. Suppose 𝐶𝑏ℎ𝑖 =
15 Mbps where 𝐶𝑏ℎ𝑖 ≥ 𝐶𝑠𝑦𝑠
𝑖 , the effective average throughput
𝐶 𝑒𝑓𝑓,𝑢𝑖 of user 𝑢 is only limited by its link throughput 𝐶𝑙𝑖𝑛𝑘,𝑢
𝑖 .
Step 4A (i) places a constraint to ensure that the value of
𝐶𝐴𝑣𝑖 × 𝑂𝐹 does not exceed 𝐶𝑙𝑖𝑛𝑘,𝑢
𝑖 . TABLE III shows that
effective user throughput 𝐶 𝑒𝑓𝑓,𝑢𝑖 is the minimum value between
𝐶𝐴𝑣𝑖 × 𝑂𝐹 and 𝐶𝑙𝑖𝑛𝑘,𝑢
𝑖 . Note that the effective average
throughput for User 3 and User 4 is limited to their link throughput which is 11.76 Mbps and 7.32 Mbps respectively.
TABLE III : EFFECTIVE USER THEROUGHPUT 𝐶 𝑒𝑓𝑓,𝑢𝑖
UNDER CONDITION 𝐶𝑏ℎ𝑖 ≥ 𝐶𝑠𝑦𝑠
𝑖 .
User, 𝒖 𝑪𝑨𝒗𝒊 𝑪𝒃𝒉
𝒊 𝑪𝒍𝒊𝒏𝒌,𝒖𝒊 𝑪𝑨𝒗
𝒊 × 𝑶𝑭 𝑪𝒆𝒇𝒇,𝒖𝒊
1 2.88 15 17.28 14.40 14.40
2 2.88 15 14.76 14.40 14.40
3 2.88 15 11.76 14.40 11.76
4 2.88 15 7.32 14.40 7.32
Likewise, with limited backhaul capacity, Step 4B (ii) and
Step 4B (iii) ensure that 𝐶𝐴𝑣,𝑙𝑡𝑑𝑖 × 𝑂𝐹 is bound by both 𝐶𝑙𝑖𝑛𝑘,𝑢
𝑖
and 𝐶𝑏ℎ𝑖 , whichever is smaller. The result is shown in TABLE
IV.
TABLE IV : EFFECTIVE USER THROUGHPUT 𝐶 𝑒𝑓𝑓,𝑢𝑖
UNDER CONDITION 𝐶𝑏ℎ𝑖 ≤ 𝐶𝑠𝑦𝑠
𝑖 .
User, 𝒖 𝑪𝑨𝒗𝒊 𝑪𝒃𝒉
𝒊 𝑪𝒍𝒊𝒏𝒌,𝒖𝒊 𝑪𝑨𝒗
𝒊 × 𝑶𝑭 𝑪𝒆𝒇𝒇,𝒖𝒊
1 2.88 10 17.28 12.5 10
2 2.88 10 14.76 12.5 10
3 2.88 10 11.76 12.5 10
4 2.88 10 7.32 12.5 7.32
Core Network
12
3
4
24
5412
36
WiFi userAccess Point WiFi Link
AP’s Backhaul BW, = 10 / 15
AP’s Backhaul
𝐶𝑏ℎ𝑖
𝐴𝑃 𝑖
𝑅1𝑖 = 𝑅2
𝑖 =
𝑅3𝑖 =
𝑅4𝑖 =
𝑢2 𝑢1
𝑢3 𝑢4
Page 5 of 26
http://mc.manuscriptcentral.com/ett
Transactions on Emerging Telecommunications Technologies
In short, Step 4 imposes logical considerations to the
determination of the effective user average throughput 𝐶 𝑒𝑓𝑓,𝑢𝑖
taking into consideration backhaul capacity, user link speed and OF. Similarly, the LTE user throughput can also be estimated using the LTE UTEF approach. In this paper, LTE backhaul capacity is always assumed to be sufficient. Therefore in Step 3, the only constraint for user throughput in
the LTE network is the access link throughput 𝐶𝑙𝑖𝑛𝑘,𝑢𝐿𝑇𝐸 .
The DyBaCS NSS (Algorithm 2) assumes that initially, there is no user connected to the HetNet. Users are admitted to the HetNet one by one and their servicing network is determined by the NSS.
Step1 initializes variables Ω, 𝐴,𝑁𝑢𝑠𝑒𝑟𝑖 and 𝑁𝑢𝑠𝑒𝑟
𝐿𝑇𝐸 , where Ω is a list holding the higher speed connections between WiFi and LTE interfaces to users, 𝐴 is the set containing all users in
the HetNet, 𝑁𝑢𝑠𝑒𝑟𝑖 is the list of users connected to the WiFi AP𝑖
and 𝑁𝑢𝑠𝑒𝑟𝐿𝑇𝐸 is the list of users connected to the LTE network.
In Step 2, the access link with the highest throughput
between user 𝑢 to LTE (𝐶𝑙𝑖𝑛𝑘,𝑢𝐿𝑇𝐸 ) or WiFi (𝐶𝑙𝑖𝑛𝑘,𝑢
𝑖 ) is chosen
and placed into Ω , Ω𝑢 represents the throughput value for user 𝑢 . All users are able to connect to at least the LTE network while access to WiFi depends on availability of WiFi
coverage. Hence 𝛽𝑢𝑖 = 0,1 denotes the connectivity of user
𝑢 to AP𝑖 , 𝛽𝑢𝑖 = ‘1’ means connection is possible, ‘0’ means
the opposite. Since multi-homing is not considered, every user is only allowed to connect to one network at a time. Step 3 assigns all users with no WiFi access to the LTE network and excludes those users from set 𝐴 . The network selection
parameter 𝛼𝑢𝑖 ∈ 0,1 indicates the choice of user 𝑢; 𝛼𝑢
𝑖 = ‘1’ indicates that user 𝑢 is connected to network 𝑖 and value ‘0’ means the opposite.
The remaining users within set 𝐴 which have not been assigned to any network are subjected to network selection; they can either assigned to WiFi or LTE. Network selection for those users is addressed in Step 4 in order to optimize the network performance. Step 4 (a) ensures the user with the highest link throughput within set 𝐴 (referred to as user 𝑛) is considered first.
In Step 4 (b) and Step 4 (c), the achievable throughput of user 𝑛 (considering access link speed, AP backhaul capacity and OF) on WiFi AP 𝑖 and LTE is estimated using WiFi
UTEF and LTE UTEF and represented by 𝐶𝑒𝑓𝑓,𝑛𝑖 and 𝐶𝑒𝑓𝑓,𝑛
𝐿𝑇𝐸
respectively. The throughput estimation is executed assuming that user 𝑛 is added to the corresponding WiFi or LTE network. Therefore, during the throughput estimation, the total number of users connected to AP 𝑖 is assumed to be user 𝑛
plus the total number of existing users 𝑁𝑢𝑠𝑒𝑟𝑖 written as
𝑁𝑢𝑠𝑒𝑟𝑖 ∪ 𝑛 and similarly the total number of users in the
LTE network is 𝑁𝑢𝑠𝑒𝑟𝐿𝑇𝐸 ∪ 𝑛. The achievable throughput for
user 𝑛 on the WiFi and LTE network is then assigned to 𝐶𝑛𝑖
and 𝐶𝑛𝐿𝑇𝐸 respectively.
User 𝑛 is subsequently assigned to the network that offers
the highest throughput and the corresponding 𝛼𝑛𝐿𝑇𝐸 or 𝛼𝑛
𝑖 value is set according to Step 4 (d). The total number of users
connected to their respective 𝑖-th WiFi network 𝑁𝑢𝑠𝑒𝑟𝑖 or LTE
network 𝑁𝑢𝑠𝑒𝑟𝐿𝑇𝐸 is then updated.
Finally set 𝐴 is updated by excluding user 𝑛 in Step 4(e) and the Step 4 processes are repeated until all users are serviced.
Algorithm 2: DyBaCS
1) Initialization
a) Ω = ∅, and 𝐴 = 1,2, … , 𝑁𝑢𝑠𝑒𝑟𝐻𝑒𝑡𝑁𝑒𝑡
b) 𝑈𝑖 = ∅, ∀ 𝑖 = 0, 1 … , 𝐼; 𝑁𝑢𝑠𝑒𝑟𝐿𝑇𝐸 = ∅
2) For 𝑢 = 1 𝑡𝑜 𝑁𝑢𝑠𝑒𝑟𝐻𝑒𝑡𝑁𝑒𝑡
a) Ω𝑢 ← 𝑚𝑎𝑥(𝛽𝑢𝑖 × 𝐶𝑙𝑖𝑛𝑘,𝑢
𝑖 , 𝐶𝑙𝑖𝑛𝑘,𝑢𝐿𝑇𝐸 ) , ∀ 𝑖 = 0, 1 … , 𝐼
3) For 𝑢 = 1 𝑡𝑜 𝑁𝑢𝑠𝑒𝑟𝐻𝑒𝑡𝑁𝑒𝑡
a) if user 𝑢 satisfying 𝛽𝑢𝑖 = 0, ∀𝑖 = 1, 2, … 𝐼
i. 𝛼𝑢𝐿𝑇𝐸 = 1
ii. 𝐴 = 𝐴 − 𝑢
4) while 𝐴 ≠ ∅
a) find 𝑛 where |Ω𝑛| ≥ |Ω𝑢| for all 𝑢 ∈ 𝐴 and
b) Estimate user 𝑛 throughput 𝐶𝑒𝑓𝑓,𝑛𝑖 in i-th WiFi Network
assuming user n is included to the network, i.e. 𝑁𝑢𝑠𝑒𝑟𝑖 ∪ 𝑛;
Using WiFi UTEF (Algorithm 1a)
i. 𝐶𝑛𝑊𝑖𝐹𝑖 ← 𝐶 𝑒𝑓𝑓,𝑛
𝑖
c) Estimate user 𝑛 throughput 𝐶𝑒𝑓𝑓,𝑛𝐿𝑇𝐸 in LTE Network assuming
user n is included to LTE Network, i.e. 𝑁𝑢𝑠𝑒𝑟𝐿𝑇𝐸 ∪ 𝑛; Using LTE
UTEF (Algorithm 1b);
i. 𝐶𝑛𝐿𝑇𝐸 ← 𝐶𝑒𝑓𝑓,𝑛
𝐿𝑇𝐸
d) If 𝐶𝑛𝐿𝑇𝐸≥ 𝐶𝑛
𝑖
i. 𝛼𝑛𝐿𝑇𝐸 = 1
ii. 𝑁𝑢𝑠𝑒𝑟𝐿𝑇𝐸 = 𝑁𝑢𝑠𝑒𝑟
𝐿𝑇𝐸 ∪ 𝑛
Else
iii. 𝛼𝑛𝑖 = 1
iv. 𝑁𝑢𝑠𝑒𝑟𝑖 = 𝑁𝑢𝑠𝑒𝑟
𝑖 ∪ 𝑛
e) 𝐴 = 𝐴 − 𝑛
3. Parameters, Assumptions and Simulation Approach
The section describes the simulation approach, simulation
parameters and assumptions used.
3.1. WiFi Model
TABLE V presents the parameters used in the WiFi IEEE802.11g model. The receiver sensitivity values per modulation and coding scheme (MCS) for WiFi receivers are taken from [32]. The throughput efficiency, the ratio of actual IP layer throughput against physical data rate and the actual IP layer throughput of each MCS scheme are obtained from the QualNet simulator assuming fixed packet size of 1000 Bytes with constant bit rate traffic.
TABLE V : IEEE802.11G PARAMETERS
Index MCS
Receiver
Sensitivity
(dBm)
Data
Rate
(Mbps)
Throughput
Efficiency
(𝝋)
Throughput
(Mbps)
1 BPSK1/2 -94.0 6 0.70 4.20
2 BPSK3/4 -93.0 9 0.64 5.76
3 QPSK1/2 -91.0 12 0.61 7.32
4 QPSK3/4 -90.0 18 0.54 9.72
5 16-QAM1/2 -86.0 24 0.49 11.76
6 16-QAM3/4 -83.0 36 0.41 14.76
7 64-QAM2/3 -77.0 48 0.35 16.80
8 64-QAM3/4 -74.0 54 0.32 17.28
Page 6 of 26
http://mc.manuscriptcentral.com/ett
Transactions on Emerging Telecommunications Technologies
The path loss model in Eqn (11) is derived from field measurement detailed in [33] :
𝑃𝐿 = 30.2 ∗ 𝑙𝑜𝑔10(𝑑) + 22.234 (11)
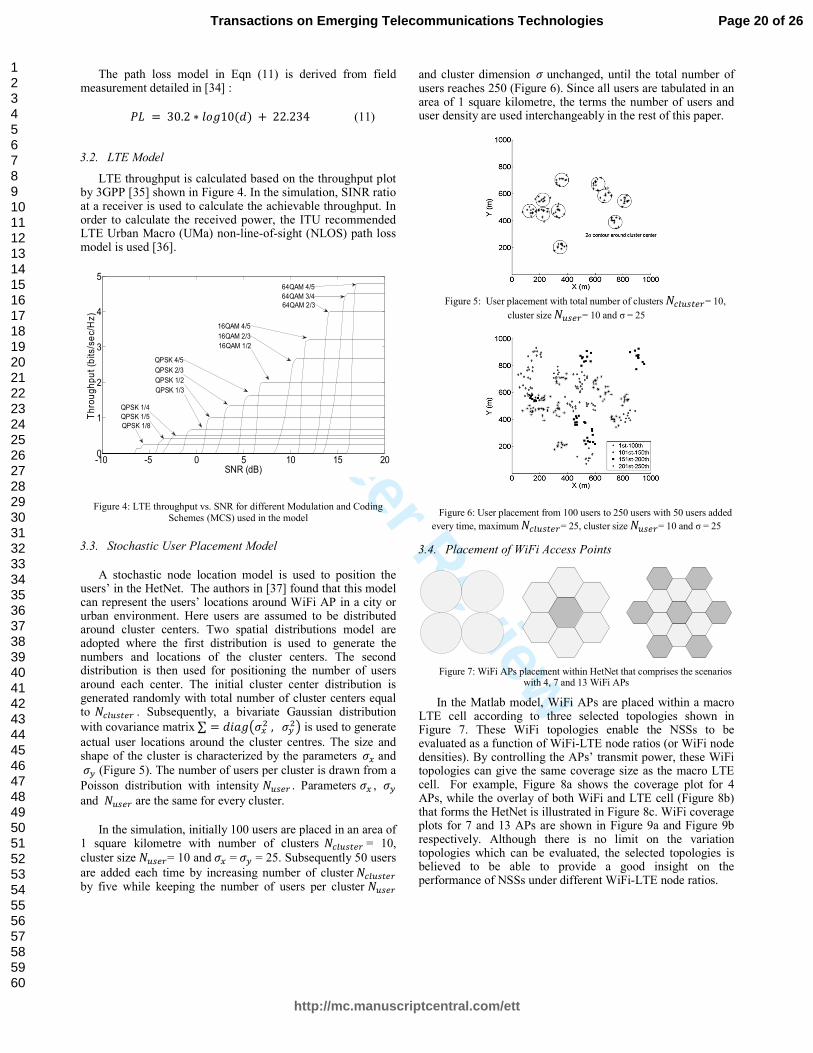
3.2. LTE Model
LTE throughput is calculated based on the throughput plot by 3GPP [34] shown in Figure 4. In the simulation, SINR ratio at a receiver is used to calculate the achievable throughput. In order to calculate the received power, the ITU recommended LTE Urban Macro (UMa) non-line-of-sight (NLOS) path loss model is used [35].
Figure 4: LTE throughput vs. SNR for different Modulation and Coding
Schemes (MCS) used in the model
3.3. Stochastic User Placement Model
A stochastic node location model is used to position the users’ in the HetNet. The authors in [36] found that this model can represent the users’ locations around WiFi AP in a city or urban environment. Here users are assumed to be distributed around cluster centers. Two spatial distributions model are adopted where the first distribution is used to generate the numbers and locations of the cluster centers. The second distribution is then used for positioning the number of users around each center. The initial cluster center distribution is generated randomly with total number of cluster centers equal to 𝑁𝑐𝑙𝑢𝑠𝑡𝑒𝑟 . Subsequently, a bivariate Gaussian distribution
with covariance matrix ∑ = 𝑑𝑖𝑎𝑔(𝜎𝑥2 , 𝜎𝑦
2) is used to generate
actual user locations around the cluster centres. The size and shape of the cluster is characterized by the parameters 𝜎𝑥 and 𝜎𝑦 (Figure 5). The number of users per cluster is drawn from a
Poisson distribution with intensity 𝑁𝑢𝑠𝑒𝑟 . Parameters 𝜎𝑥 , 𝜎𝑦
and 𝑁𝑢𝑠𝑒𝑟 are the same for every cluster.
In the simulation, initially 100 users are placed in an area of 1 square kilometre with number of clusters 𝑁𝑐𝑙𝑢𝑠𝑡𝑒𝑟 = 10, cluster size 𝑁𝑢𝑠𝑒𝑟= 10 and 𝜎𝑥 = 𝜎𝑦 = 25. Subsequently 50 users
are added each time by increasing number of cluster 𝑁𝑐𝑙𝑢𝑠𝑡𝑒𝑟 by five while keeping the number of users per cluster 𝑁𝑢𝑠𝑒𝑟
and cluster dimension 𝜎 unchanged, until the total number of users reaches 250 (Figure 6). Since all users are tabulated in an area of 1 square kilometre, the terms the number of users and user density are used interchangeably in the rest of this paper.
Figure 5: User placement with total number of clusters 𝑁𝑐𝑙𝑢𝑠𝑡𝑒𝑟 = 10,
cluster size 𝑁𝑢𝑠𝑒𝑟= 10 and σ = 25
Figure 6: User placement from 100 users to 250 users with 50 users added
every time, maximum 𝑁𝑐𝑙𝑢𝑠𝑡𝑒𝑟= 25, cluster size 𝑁𝑢𝑠𝑒𝑟= 10 and σ = 25
3.4. Placement of WiFi Access Points
Figure 7: WiFi APs placement within HetNet that comprises the scenarios with 4, 7 and 13 WiFi APs
In the Matlab model, WiFi APs are placed within a macro LTE cell according to three selected topologies shown in Figure 7. These WiFi topologies enable the NSSs to be evaluated as a function of WiFi-LTE node ratios (or WiFi node densities). By controlling the APs’ transmit power, these WiFi topologies can give the same coverage size as the macro LTE cell. For example, Figure 8a shows the coverage plot for 4 APs, while the overlay of both WiFi and LTE cell (Figure 8b) that forms the HetNet is illustrated in Figure 8c. WiFi coverage plots for 7 and 13 APs are shown in Figure 9a and Figure 9b respectively. Although there is no limit on the variation topologies which can be evaluated, the selected topologies is believed to be able to provide a good insight on the performance of NSSs under different WiFi-LTE node ratios.
-10 -5 0 5 10 15 200
1
2
3
4
5
SNR (dB)
Thro
ughpu
t (b
its/s
ec/H
z)
64QAM 2/3
64QAM 3/4
64QAM 4/5
16QAM 4/5
16QAM 1/2
16QAM 2/3
QPSK 4/5
QPSK 1/2
QPSK 1/3
QPSK 2/3
QPSK 1/8
QPSK 1/4
QPSK 1/5
Page 7 of 26
http://mc.manuscriptcentral.com/ett
Transactions on Emerging Telecommunications Technologies
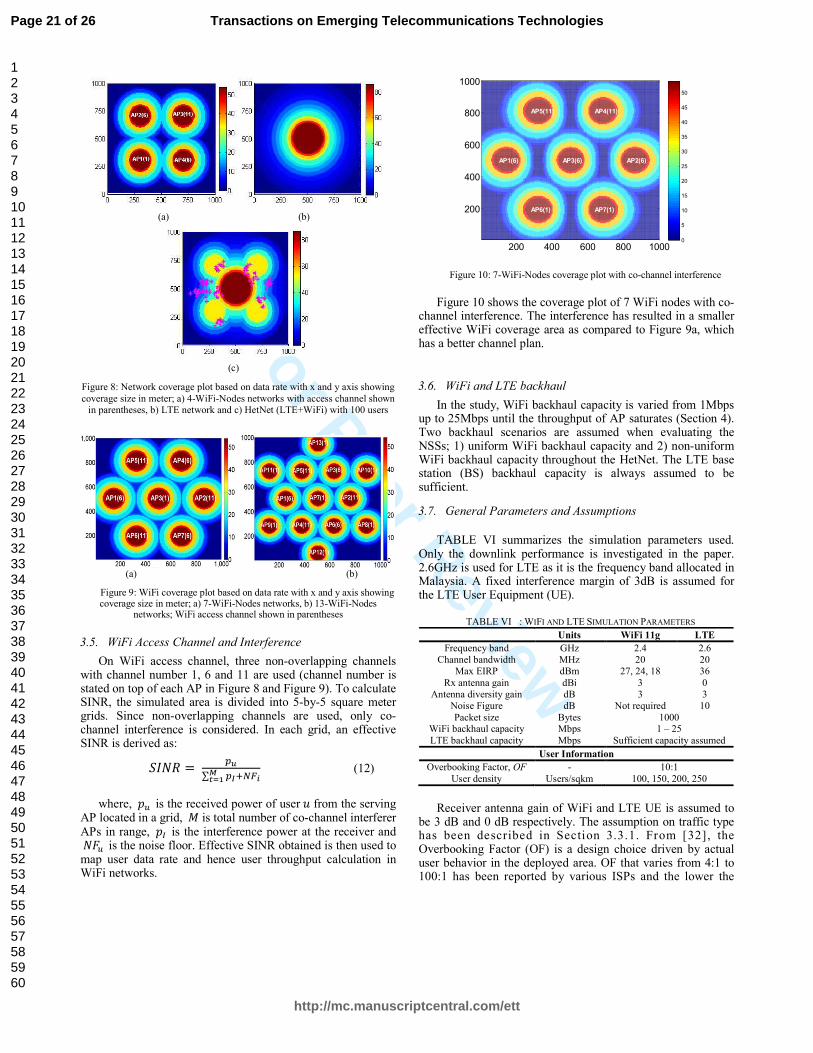
Figure 8: Network coverage plot based on data rate with x and y axis showing
coverage size in meter; a) 4-WiFi-Nodes networks with access channel shown in parentheses, b) LTE network and c) HetNet (LTE+WiFi) with 100 users
(a) (b)
Figure 9: WiFi coverage plot based on data rate with x and y axis showing coverage size in meter; a) 7-WiFi-Nodes networks, b) 13-WiFi-Nodes
networks; WiFi access channel shown in parentheses
3.5. WiFi Access Channel and Interference
On WiFi access channel, three non-overlapping channels with channel number 1, 6 and 11 are used (channel number is stated on top of each AP in Figure 8 and Figure 9). To calculate SINR, the simulated area is divided into 5-by-5 square meter grids. Since non-overlapping channels are used, only co-channel interference is considered. In each grid, an effective SINR is derived as:
𝑆𝐼𝑁𝑅 = 𝑝𝑢
∑ 𝑝𝐼𝑀𝑡=1 +𝑁𝐹𝑖
(12)
where, 𝑝𝑢 is the received power of user 𝑢 from the serving AP located in a grid, 𝑀 is total number of co-channel interferer APs in range, 𝑝𝐼 is the interference power at the receiver and 𝑁𝐹𝑢 is the noise floor. Effective SINR obtained is then used to map user data rate and hence user throughput calculation in WiFi networks.
Figure 10: 7-WiFi-Nodes coverage plot with co-channel interference
Figure 10 shows the coverage plot of 7 WiFi nodes with co-channel interference. The interference has resulted in a smaller effective WiFi coverage area as compared to Figure 9a, which has a better channel plan.
3.6. WiFi and LTE backhaul
In the study, WiFi backhaul capacity is varied from 1Mbps up to 25Mbps until the throughput of AP saturates (Section 4). Two backhaul scenarios are assumed when evaluating the NSSs; 1) uniform WiFi backhaul capacity and 2) non-uniform WiFi backhaul capacity throughout the HetNet. The LTE base station (BS) backhaul capacity is always assumed to be sufficient.
3.7. General Parameters and Assumptions
TABLE VI summarizes the simulation parameters used. Only the downlink performance is investigated in the paper. 2.6GHz is used for LTE as it is the frequency band allocated in Malaysia. A fixed interference margin of 3dB is assumed for the LTE User Equipment (UE).
TABLE VI : WIFI AND LTE SIMULATION PARAMETERS
Units WiFi 11g LTE
Frequency band GHz 2.4 2.6 Channel bandwidth MHz 20 20
Max EIRP dBm 27, 24, 18 36
Rx antenna gain dBi 3 0 Antenna diversity gain dB 3 3
Receiver antenna gain of WiFi and LTE UE is assumed to be 3 dB and 0 dB respectively. The assumption on traffic type has been described in Section 3.3.1. From [31], the Overbooking Factor (OF) is a design choice driven by actual user behavior in the deployed area. OF that varies from 4:1 to 100:1 has been reported by various ISPs and the lower the
200 400 600 800 1000
200
400
600
800
1000
AP1(6) AP2(6)AP3(6)
AP4(11)AP5(11)
AP6(1) AP7(1)
0
5
10
15
20
25
30
35
40
45
50
Raw
Data
Rate
(M
bp
s)
Page 8 of 26
http://mc.manuscriptcentral.com/ett
Transactions on Emerging Telecommunications Technologies
Figure 11: HetNet average user throughput as a function of WiFi backhaul capacity. (4 WiFi APs, 100% WiFi-LTE overlap, Uniform WiFi backhaul capacity)
Figure 12: Fairness on bandwidth sharing as a function of WiFi backhaul capacity. (4 WiFi APs, 100% WiFi-LTE overlap, Uniform WiFi backhaul
capacity)
value the better the service guarantee. A factor of 10:1 in adopted to represent a relatively heavy usage scenario. User density is varied from 100 users to 250 users per square km.
4. Results and Analysis
4.1. Effect of Varying Backhaul Capacity Uniformly
Two performance metrics namely average user throughput and user throughput fairness in the HetNet cell are used to evaluate the performance of the NSSs. Fairness is derived
using Jain fairness index in the form of (∑ 𝐶𝑒𝑓𝑓,𝑢𝑁𝑢𝑠𝑒𝑟𝑢=1 )
2/
(𝑁𝑢𝑠𝑒𝑟 ∑ (𝐶𝑒𝑓𝑓,𝑢)2𝑁𝑢𝑠𝑒𝑟
𝑢=1 ) [37].
First the performance of all NSSs is evaluated as a function of WiFi backhaul capacity from 1Mbps to 25Mbps with 100% WiFi-LTE coverage overlap and 4 WiFi APs (as in Figure 8c). Figure 11 shows that average user throughput of PDR and DyBaCS are similar over the entire range of backhaul capacity and WF has the lowest average user throughput. The plots plateaus when backhaul capacity reaches 20Mbps for all NSSs as that is the maximum access throughput achievable by WiFi (IEEE 802.11g). The total WiFi access throughput also depends on user distribution as slower users slow down the entire network. Figure 12 evaluates the fairness in terms of achievable throughput per user. Result shows that average user throughput of PDR and DyBaCS are similar over the entire range of backhaul capacity while WF has the lowest average user throughput. DyBaCS outperforms the rest in terms of fairness and WF exhibits the worst fairness performance.
4.2. Effect of WiFi-LTE Overlap Ratio Within a HetNet cell
Since the coverage overlap between WiFi and LTE is likely to vary in practice, it is therefore important to investigate how NSSs perform in different overlap conditions. Here the coverage area is defined as a percentage e.g. 25% means 25% of LTE coverage is also covered by WiFi and 100% means all LTE coverage is overlapped by WiFi. The simulation is carried out by switching on APs within the LTE cell one by one until the entire LTE cell overlaps with WiFi coverage. AP activation sequence is based on the number of users covers by an AP, AP which covers the most users is switched on first and followed by APs with lesser users in descending order.
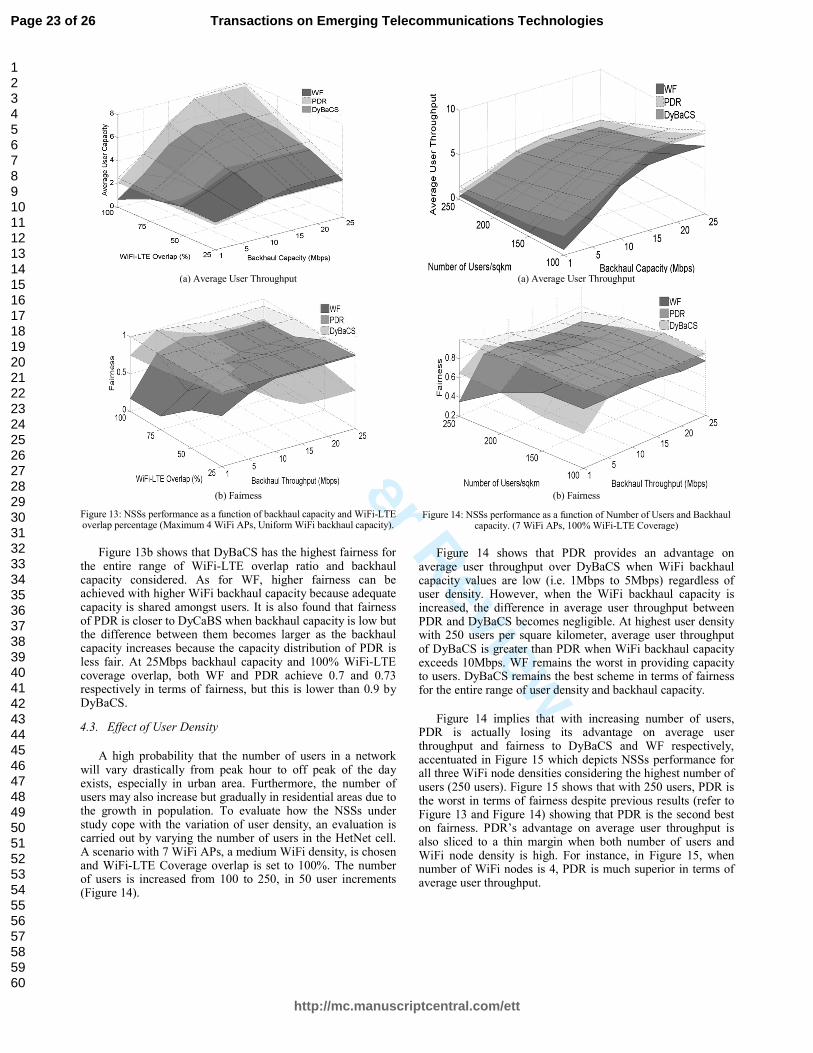
Figure 13a shows that in general, that the average user throughput increases linearly for all NSSs as backhaul capacity increases and starting to flatten at 15Mbps. The maximum average user throughput for PDR, DyBaCS and WF are 7.87Mbps, 7.60Mbps and 5.32Mbps respectively at 100% WiFi-LTE coverage overlap and 20Mbps backhaul capacity. PDR which has the highest average throughput only has a marginal performance edge as compared to DyBaCS. The difference in performances diminishes when WiFi-LTE coverage overlap increases. WF provides the worst average user throughput in most cases. An interesting point to note is for WF at 1Mbps backhaul capacity, increases in WiFi coverage results in a drop in the average user throughput instead of increase. This is due to the fact that WF connects all users to WiFi networks regardless of its backhaul capacity. Consequently, with limited WiFi backhaul capacity as low as 1Mbps, WF causes the users to suffer from low average throughput and becoming more severe when WiFi coverage is larger.
Page 9 of 26
http://mc.manuscriptcentral.com/ett
Transactions on Emerging Telecommunications Technologies
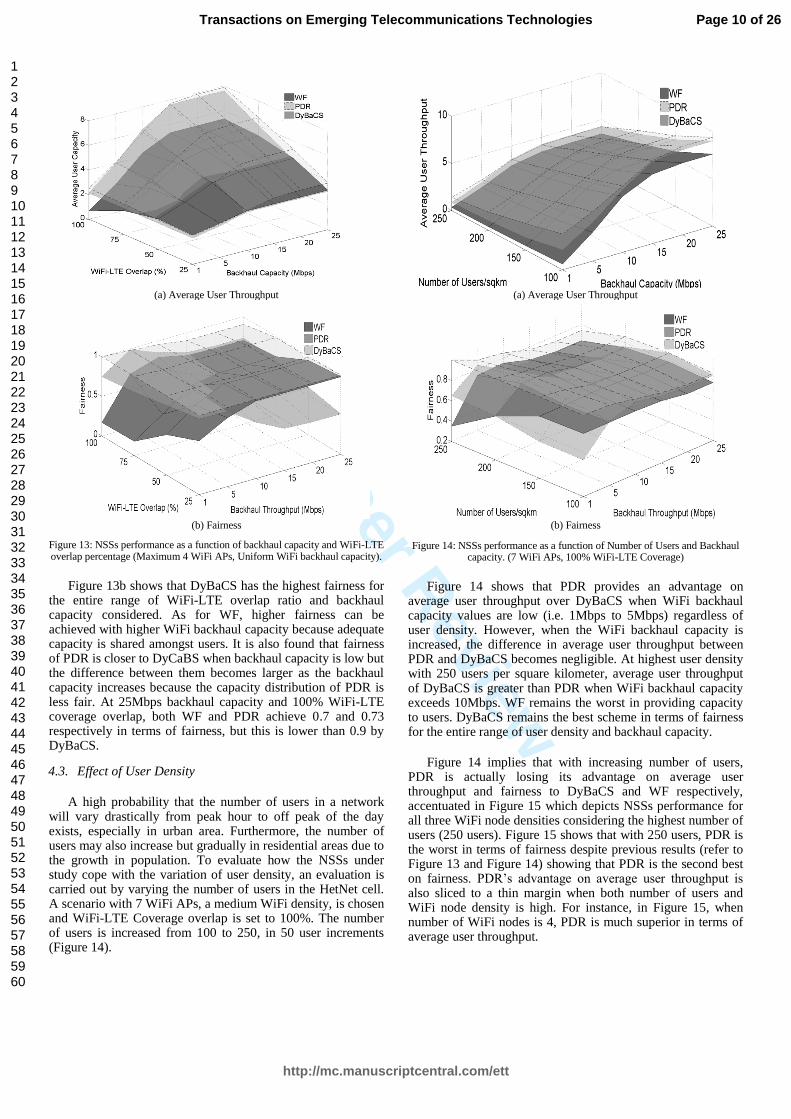
Figure 13: NSSs performance as a function of backhaul capacity and WiFi-LTE overlap percentage (Maximum 4 WiFi APs, Uniform WiFi backhaul capacity).
Figure 13b shows that DyBaCS has the highest fairness for the entire range of WiFi-LTE overlap ratio and backhaul capacity considered. As for WF, higher fairness can be achieved with higher WiFi backhaul capacity because adequate capacity is shared amongst users. It is also found that fairness of PDR is closer to DyCaBS when backhaul capacity is low but the difference between them becomes larger as the backhaul capacity increases because the capacity distribution of PDR is less fair. At 25Mbps backhaul capacity and 100% WiFi-LTE coverage overlap, both WF and PDR achieve 0.7 and 0.73 respectively in terms of fairness, but this is lower than 0.9 by DyBaCS.
4.3. Effect of User Density
A high probability that the number of users in a network will vary drastically from peak hour to off peak of the day exists, especially in urban area. Furthermore, the number of users may also increase but gradually in residential areas due to the growth in population. To evaluate how the NSSs under study cope with the variation of user density, an evaluation is carried out by varying the number of users in the HetNet cell. A scenario with 7 WiFi APs, a medium WiFi density, is chosen and WiFi-LTE Coverage overlap is set to 100%. The number of users is increased from 100 to 250, in 50 user increments (Figure 14).
(a) Average User Throughput
(b) Fairness
Figure 14: NSSs performance as a function of Number of Users and Backhaul capacity. (7 WiFi APs, 100% WiFi-LTE Coverage)
Figure 14 shows that PDR provides an advantage on average user throughput over DyBaCS when WiFi backhaul capacity values are low (i.e. 1Mbps to 5Mbps) regardless of user density. However, when the WiFi backhaul capacity is increased, the difference in average user throughput between PDR and DyBaCS becomes negligible. At highest user density with 250 users per square kilometer, average user throughput of DyBaCS is greater than PDR when WiFi backhaul capacity exceeds 10Mbps. WF remains the worst in providing capacity to users. DyBaCS remains the best scheme in terms of fairness for the entire range of user density and backhaul capacity.
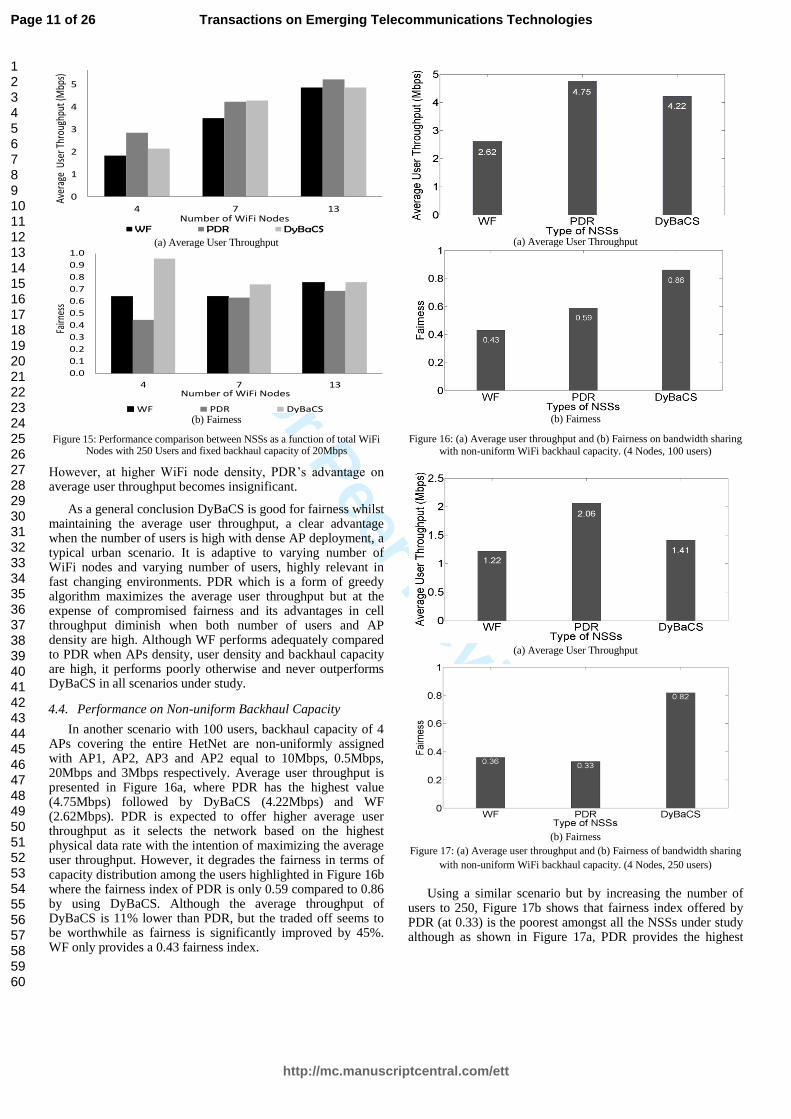
Figure 14 implies that with increasing number of users, PDR is actually losing its advantage on average user throughput and fairness to DyBaCS and WF respectively, accentuated in Figure 15 which depicts NSSs performance for all three WiFi node densities considering the highest number of users (250 users). Figure 15 shows that with 250 users, PDR is the worst in terms of fairness despite previous results (refer to Figure 13 and Figure 14) showing that PDR is the second best on fairness. PDR’s advantage on average user throughput is also sliced to a thin margin when both number of users and WiFi node density is high. For instance, in Figure 15, when number of WiFi nodes is 4, PDR is much superior in terms of average user throughput.
Page 10 of 26
http://mc.manuscriptcentral.com/ett
Transactions on Emerging Telecommunications Technologies
Figure 15: Performance comparison between NSSs as a function of total WiFi Nodes with 250 Users and fixed backhaul capacity of 20Mbps
However, at higher WiFi node density, PDR’s advantage on average user throughput becomes insignificant.
As a general conclusion DyBaCS is good for fairness whilst maintaining the average user throughput, a clear advantage when the number of users is high with dense AP deployment, a typical urban scenario. It is adaptive to varying number of WiFi nodes and varying number of users, highly relevant in fast changing environments. PDR which is a form of greedy algorithm maximizes the average user throughput but at the expense of compromised fairness and its advantages in cell throughput diminish when both number of users and AP density are high. Although WF performs adequately compared to PDR when APs density, user density and backhaul capacity are high, it performs poorly otherwise and never outperforms DyBaCS in all scenarios under study.
4.4. Performance on Non-uniform Backhaul Capacity
In another scenario with 100 users, backhaul capacity of 4 APs covering the entire HetNet are non-uniformly assigned with AP1, AP2, AP3 and AP2 equal to 10Mbps, 0.5Mbps, 20Mbps and 3Mbps respectively. Average user throughput is presented in Figure 16a, where PDR has the highest value (4.75Mbps) followed by DyBaCS (4.22Mbps) and WF (2.62Mbps). PDR is expected to offer higher average user throughput as it selects the network based on the highest physical data rate with the intention of maximizing the average user throughput. However, it degrades the fairness in terms of capacity distribution among the users highlighted in Figure 16b where the fairness index of PDR is only 0.59 compared to 0.86 by using DyBaCS. Although the average throughput of DyBaCS is 11% lower than PDR, but the traded off seems to be worthwhile as fairness is significantly improved by 45%. WF only provides a 0.43 fairness index.
(a) Average User Throughput
(b) Fairness
Figure 16: (a) Average user throughput and (b) Fairness on bandwidth sharing
with non-uniform WiFi backhaul capacity. (4 Nodes, 100 users)
(a) Average User Throughput
(b) Fairness
Figure 17: (a) Average user throughput and (b) Fairness of bandwidth sharing
with non-uniform WiFi backhaul capacity. (4 Nodes, 250 users)
Using a similar scenario but by increasing the number of users to 250, Figure 17b shows that fairness index offered by PDR (at 0.33) is the poorest amongst all the NSSs under study although as shown in Figure 17a, PDR provides the highest
0
1
2
3
4
5
6
4 7 13
WF PDR DyBaCS
Aver
age
Use
r Thr
ough
put (
Mbp
s)
Number of WiFi Nodes
0.0
0.1
0.2
0.3
0.4
0.5
0.6
0.7
0.8
0.9
1.0
4 7 13
WF PDR DyBaCS
Fairn
ess
Number of WiFi Nodes
Page 11 of 26
http://mc.manuscriptcentral.com/ett
Transactions on Emerging Telecommunications Technologies
average user throughput. DyBaCS on the other hand provides a good balance between average user throughput and fairness.
The results captured in Figure 16 and Figure 17 consistently indicate that DyBaCS, under non-uniform WiFi backhaul scenarios, provisions best fairness to users with minimal penalty in the average user throughput. DyBaCS provides the best performance on both average throughput and fairness when both user density and WiFi node density is high (similar to uniform backhaul capacity case). Performance under non-uniform WiFi backhaul is in agreement with that of uniform backhaul evaluation detailed in Section 4. However, it is important to note that changes in user location and distribution of backhaul capacity may affect performance to a certain degree but the general trends remain.
5. Conclusions
A backhaul capacity sensitive network selection scheme referred to as DyBaCS within a wireless HetNet has been presented. The performance of DyBaCS and two commonly used NSSs has been evaluated as a function of WiFi backhaul capacity, WiFi-LTE coverage ratio, WiFi-LTE node ratio and user density. The performance of NSSs has also been compared under uniform and non-uniform WiFi backhaul capacity distributions. Results show that the proposed DyBaCS scheme provides the best fairness whilst preserving the average user throughput over all scenarios. DyBaCS is a highly scalable NSS as compared to PDR and WF in scenarios with varying number of users, WiFi nodes and WiFi backhaul capacity. Future work needs to consider more realistic proportional fairness capacity sharing schemes. The use of higher capacity LTE base stations and IEEE802.11n WiFi also needs to be studied. Besides, evaluation under different traffic types also needs to be addressed.
Acknowledgment
The work is supported by Ministry of Science, Technology and Innovation of Malaysia under the Science Fund project code 01-03-04-SF0011.
References
1. The LTE capacity shortfall: Why small cell backhaul is the answer, Aviat Networks, Retrieved 14th May 2013 from http:// www.aviatnetwork.com/
2. Small cell market status Feb 2013, Informa telecoms & media, Retrieved 2nd October 2013 from http://www.smallcellforum.org/
3. Small cell operators face myriad operational and financial challenges, Infonetics Research, Retrieved 1st Oct 2013 from http://www.infonetics.com/
4. Mark Priscaro (14th May 2013), Telecom New Zealand
and Ruckus Wireless Transform Traditional Phone
Booths into Super Fast Wi-Fi Hotspots, Ruckus Wireless,
Retrieved 16th May 2013 from http://
www.ruckuswireless.com/
5. Firetide Wireless Mesh Solutions for TELCOS: Access &
Small Cell Backhaul,
https://www.winncom.com/manufacturer/firetide
6. Karam F W, Jensen T. Performance analysis of ranking
for QoS handover algorithm for selection of access
network in heterogeneous wireless networks. 21st
International Conference onComputer Communications
and Networks (ICCCN), 30 July-2 Aug 2012:1-6.
7. A Handa. Mobile Data Offload for 3G Networks: A
White Paper. http://www.intellinet-
tech.com/Media/PagePDF/Data%20Offload.pdf, Oct.
2009.
8. J Nie, J Wen, Q Dong, Z Zhou. A seamless handoff in
IEEE802.16a and IEEE802.11n hybrid networks, in proc.
9. J Roy, V Vaidehi, and S Srikanth. Always best-connected
QoS integration model for the WLAN, WiMAX
heterogeneous network. In IEEE First International
Conference on Industrial and Information Systems, 8-11
Aug 2006: 361-366. 10. Y Bejerano, S J Han, and L E Li. Fairness and Load
Balancing in Wireless LANs Using Association Control, IEEE/ACM Transactions on Networking 2007; 15(3):560-573.
11. Judd G, Steenkiste P. Fixing 802. 11 access point selection. ACM SIGCOMM Computer Communication Review 2002; 32(3): 31-31.
12. D Kumar, E Altman, and J M Kelif. Globally optimal user-network association in an 802.11 WLAN and 3G UMTS hybrid cell. International Teletraffic Congress, Ottawa, Canada, June 17-21 2007: 1173-1187.
13. K Premkumar and A Kumar. Optimum Association of Mobile Wireless Devices with a WLAN-3G Access Network, Proc. IEEE Int’l Conf. Comm. (ICC ’06), 11-15 June 2006: 2002-2008.
14. S. Singh, H. S. Dhillon, and J. G. Andrews. Offloading in heterogeneous networks: Modeling, analysis, and design insights, IEEE Trans. Wireless Communications 2013; 12(5): 2482-2497.
15. P Li , J Kong, S H Kim, H B Jung, X L Niu, D K Kim.
Power allocation with max-min fairness for multicast in
heterogeneous network, 14th International Conference on
Advanced Communication Technology (ICACT), 19-22
Feb 2012: 502-505
16. P Xue, P Gong, J H Park, D Y Park, D K Kim. Radio
resource management with proportional rate constraint in
the heterogeneous networks, IEEE Transactions on
Wireless Communications 2011; 11(3): 1066-1075. 17. Y Bejerano and S J Han. Cell Breathing Techniques for
Load Balancing in Wireless LANs. IEEE Tranctions on Mobile Computing 2009; 8(6): 735-749.
18. H Velayos, V Aleo, and G Karlsson. Load Balancing in Overlapping Wireless LAN Cells, Proc. IEEE International Conference on Communications, 20-24 June 2004: 3833-3836.
19. Pei X, Jiang T, Qu D, Zhu G & Liu J. Radio-resource management and access-control mechanism based on a novel economic model in heterogeneous wireless networks. IEEE Transactions on Vehicular Technology 2010, 59(6): 3047-3056.
20. Zhuo X, Hua S, Gao W & Cao G. An Incentive Framework for Cellular Traffic Offloading. IEEE Transactions on Mobile Computing 2014; 13(3): 541-555.
21. Yang Z, Yang Q, Fu F & Kwak K S. A novel load balancing scheme in LTE and WiFi coexisted network for OFDMA system. International Conference on Wireless
Page 12 of 26
http://mc.manuscriptcentral.com/ett
Transactions on Emerging Telecommunications Technologies
Communications & Signal Processing (WCSP), 24-26 Oct 2013; 1-5.
22. F Bari and V C M Leung. Automated network selection in a heterogeneous wireless network environment. IEEE Network 2007; 21(1): 34–40.
23. H Hu, W Zhou, S Zhang, J Song. A Novel network
selection algorithm in next generation heterogeneous
network for modern service industry. IEEE Asia-Pacific
Services Computing Conference, 9-12 Dec 2008: 1263-
1268. 24. Galeana-Zapien H, Ferrus R. Design and Evaluation of a
Backhaul-Aware Base Station Assignment Algorithm for OFDMA-Based Cellular Networks. IEEE Transactions on Wireless Communications 2010; 9(10): 3226-3237.
25. Pahlavan K, & Levesque A H. Wirless Information Networks, 2
nd Edition, John Wiley & Sons, 2005.
26. P Bender et al. CDMA/HDR: A Bandwidth Efficient
High-speed Wireless Data Service for Nomadic User.
IEEE Communication Magazine 2000; 38(7): 70–77. 27. Gerasimenko M, Moltchanov D, Florea R, Andreev S,
Koucheryavy Y, Himayat N, Yeh S-p. & Talwar S. Cooperative Radio Resource Management in Heterogeneous Cloud Radio Access Networks. IEEE Access 2015; 3: 397-406.
28. Yang C, Li J & Anpalagan A. Cooperative bargaining game - theoretic methodology for 5G wireless heterogeneous networks. Transactions on Emerging Telecommunications Technologies 2014; 26(1): 70-81.
29. Bredel M & Fidler M. A measurement study of bandwidth estimation in IEEE 802.11 g wireless LANs using the DCF. NETWORKING 2008 Ad Hoc and Sensor Networks, Wireless Networks, Next Generation Internet; 4928: 314-325. Springer.
30. Yongmin Choi, Hyun Wook Ji, Jae-yoon Park, Hyun-chul
Kim, Silvester J A. A 3W network strategy for mobile
data traffic offloading. IEEE Communications Magazine
2011; 49(10): 118-123.
31. Tranzeo Wireless Technologies Inc. Example Community
Broadband Wireless Mesh Network Design, Version 1.1,
20June 2007.
32. NanoStation2, Ubiquiti Networks,
www.ubnt.com/products/nano.php
33. A Ting, D Chieng, K H Kwong, I Andonovic.
Optimization of Heterogeneous Multi-radio Multi-hop
Rural Wireless Network. IEEE 14th
International
Conference on Communicaiton Technology 2012,
ChengDu China, 9-11 Nov 2012: 1159-1165.
34. 3GPP, Evolved Universal Terrestrial Radio Access (E-
UTRA); Radio Frequency (RF) system scenarios (Release
10), 3GPP TR 36.942 V10.2.0 2010
35. ITU-R Report M.2135-1: Guidelines for evaluation of
radio interface technologies for IMT-Advanced,
December 2009.
36. M Petrova, P Mahonen, and J Riihijarvi. Connectivity
analysis of clustered ad hoc and mesh networks, In
Proceedings of IEEE GLOBECOM, Martinique 26-30
Nov 2007: 1139-1143.
37. R Jain, A Durresi, and G Babic. Throughput fairness
index: an explanation, ATM Forum/99-0045, Feb. 1999.
Page 13 of 26
http://mc.manuscriptcentral.com/ett
Transactions on Emerging Telecommunications Technologies
The increasing pressure for mobile operators to offload data traffic from their 3G, LTE or WiMAX networks to small cell networks [2] [3] indicates that future mobile broadband networks will largely be heterogeneous. This migration is further fueled by the availability of multi-RAT (Radio Access Technology) which allows user devices to connect to different wireless networks such as 3G, LTE, WiMAX, WiFi either one
1 Capacity and throughput are used interchangeably throughout
article with the detail definition in section 2.1
* A shorter version of this article is presented in [1]. This article
includes substantial revisions, enhancements and extensions to [1].
at a time or simultaneously. Deployment of small cells such as WiFi raises new backhaul challenges for operators. There are only two broad choices as far as backhaul is concerned, wireline and wireless backhaul. Due to intensive engineering work required, high cost and regulatory barriers, fixed line solutions such as fiber, cable, copper or xDSL are not ubiquitously available. Further, a relatively large number of WiFi hotspots may prove too costly for operators to backhaul with wired options. In such situations, the operator may instead increasingly rely on point-to-point and point-to-multipoint wireless solutions. However in most scenarios, a mixture of backhaul technologies is expected, as operators will adopt the most suitable backhaul solution for small cells considering the cost and availability [4] (Figure 1). With the maturity of multi-hop mesh networks, it may also serve as a potential candidate [5] [6].
Currently, WiFi APs are typically backhauled through different types of technologies which offer throughput capacity ranging from several mega bit per second (Mbps) to tens of Mbps [5]. Backhauling APs using different technologies within the HetNet leads to non-uniform AP capacity distribution. The most widely deployed IEEE802.11n WiFi technology which provisions a peak physical data rate of 600Mbps. Due to that most existing fixed backhaul services are not able to offer sufficient capacity for these WiFi APs to realize their full potential. Therefore consideration of WiFi backhaul capacity is inevitable during traffic offload decision making.
Figure 1: LTE-WiFi Heterogeneous Network with different backhaul options.
1.1. Related Work
To reduce data traffic pressure over mobile networks, alternative networks such as WiFi are preferred by mobile operators whenever possible [7]. As report in [8], most WiFi-enabled smartphones are configured with WiFi First
Page 14 of 26
http://mc.manuscriptcentral.com/ett
Transactions on Emerging Telecommunications Technologies
network selection scheme by default to give WiFi higher priority over the cellular interface for data transmissions. Network selection strategies for WiMAX-WiFi network which is predominantly driven by data rate are reported in [9] and [10]. This kind of network selection strategies lead to poor user experiences [11] and causes unbalanced load distribution amongst access networks [12].
Several studies [13-15] have proposed the use of Network Selection Schemes (NSSs) to optimize network performance. The work by [13] considers a globally optimal user-network association scheme in a WLAN-UMTS hybrid cell. In [14], a heuristic greedy search algorithm that maximizes total user throughput in a heterogeneous wireless access network comprising WiFi APs and 3G BSs is proposed. Both these studies adopt a simplified WLAN model by assuming only one transmission rate. Poisson point process (PPP) theory and stochastic geometry method are used in [15] to model traffic offloading in a multi RAT heterogeneous wireless network. The authors propose a method to determine the optimum percentage of the traffic that needs be offloaded in order to maximize network coverage while meeting user requirements. In that work however, no network selection algorithm is proposed.
Fairness performance is considered in [16-19] where [16] focuses on ensuring max-min fairness for multicast in Orthogonal Frequency Division Multiple Access (OFDMA)-based wireless heterogeneous networks. A proportional user rate based radio resource management strategy is investigated in [17] on LTE-WiFi HetNet, where a suboptimal network selection algorithm is introduced to improve the minimum normalized user rate and fairness. Bejerano et al. [18] proposes changes to the transmission power of AP beacon messages in order to minimize the load in congested APs and produces an optimal max-min load balancing strategy. A load balancing scheme for overlapping wireless LAN cells is reported in [19]. However, the work aims to balance the throughput of APs and not the fairness amongst users.
NSSs that consider QoS are reported in [7] [23] [24]. Network selection based on multiple parameters such as cost, bandwidth and QoS parameters including packet loss, jitter and delay is reported in [23]. However, the study focuses only on general heterogeneous networking and no specific type of technology is simulated. Similarly, the work in [7] and [24] investigate access network selection for optimal service delivery and QoS to users respectively. However the overall HetNet performance and fairness is not considered.
Load balancing in Cellular and WLAN HetNet is reported in [20] [21] and [22]. In [20], a joint access-control strategy is designed for sharing of the radio resource and load balancing between CDMA Cellular Network and WLANs by considering user preferences. Bandwidth allocation is optimized by maximizing the aggregated social welfare of the WLANs under interference-constraint environment. However, the method used to balance the load amongst mobile nodes is not disclosed. The work in [21] looks into the trade-off between the amount of traffic being offloaded and users’ satisfaction. An incentive framework is proposed to motivate users to use delay tolerance WiFi networks for traffic offloading. Yang et
al. in [22] proposes a load balancing scheme that aims to balance the network load between the LTE network and WiFi hotspots considering access pattern of UEs.
Bejerano et al. [11] considers backhaul capacity during AP selection, while [25] proposes a backhaul-aware base station (BS) selection algorithm. Although backhaul-aware network selection scheme have been explored in these works, their scope is limited to homogeneous wireless networks.
In this paper, a Dynamic Backhaul Capacity Sensitive (DyBaCS) NSS is proposed for LTE-WiFi HetNet. This scheme not only considers access link throughput but also available backhaul capacity in order to preserve fairness amongst users. The proposed scheme is compared with two commonly used NSSs namely WiFi First (WF) and Physical Data Rate (PDR). This paper investigates fairness and average user throughput performances across WiFi backhaul capacity ranging from 1Mbps to 25Mbps.
The rest of the paper is organized as follows. Section 2 describes the proposed DyBaCS network selection algorithm as well as WF and PDR schemes. Section 3 details the simulation approach, simulation parameters and assumptions made. Results are discussed in Section 4 followed by conclusions in Section 5.
2. Existing and Proposed Network Selection Schemes
This section describes the simulation approach simulation parameters and assumptions used in the study. The notations used are listed in TABLE I.
TABLE I : NOTATIONS
Notation Description number of clusters for user distribution , width and height of user distribution clusters number of users in a cluster signal to interference and noise ratio
SNR signal to noise ratio WiFi receive power by user u WiFi interference power noise floor average user throughput WiFi downlink physical transmission rate to users link throughput efficiency measured at the IP layer
maximum downlink throughput achievable by a LTE user path loss in dB distance in meters
total number of users in a LTE cell ! total number of users in HetNet "#, access link throughput from AP to user % "#, access link throughput from LTE BS to user % &' backhaul capacity of AP in Mbps ,( average AP users’ throughput with limited backhaul capacity average AP users’ throughput with sufficient backhaul capacity )) effective user throughput " estimated throughput if user n is connected to AP " estimated throughput if user n is connected to LTE BS
Ω list of higher speed connections (amongst WiFi and LTE interfaces for a user) for all users in throughput + set that contains all users in the HetNet
2.1. Network Capacity Model
2.1.1. Single WiFi AP with Max-min Fairness
In a multi-rate WiFi network, users with slower link speed tend to occupy more spectrum resource (in terms of transmit time) than higher speed users for the same amount of data sent. Such a bandwidth sharing scenario amongst all users within a single AP coverage has been modelled.
Suppose a total of%,-. users are connected to an AP and each is supported by a data rate, in accordance to their level. Thus, user % receives transmission slots at rate bps, where % = 1,2. .%,-. . Assuming the channel access probability is34 and it exhibits the effect of slots assignment, which is inversely proportional to user data rate . Let be the number of slots allocated to user%, where = 5/, with 5 being an arbitrary constant which will be cancelled off eventually. In this case, if user packet size is assumed to be the same, the AP throughput at the physical layer can be calculated as [26] [27]:
Since the sum of 34 by all user is∑ 3%,-.GH = 1, Eqn (2)
can be further simplified to:
7' = H∑ 39D 9%,-.9@A (3)
The average physical layer throughput per user 7' is
calculated by dividing Eqn (3) with the total number of users Since fair resource sharing is assumed, which in turn implies that the packet sending frequency of every user is the
same, the 3 of a user can also be written as H%,-.:
7' =B H%,-.E × J H∑ A%,-.D9%,-.9@A
K = H∑ AD9%,-.9@A (4)
The model facilitates max-min fairness [28] [29] behavior in a multi-rate system where all users are allocated an equal amount bandwidth resource. This characteristic is representative of WLAN Distributed Coordinated Function (DCF) [30] where all users are offered a fair medium access opportunity.
Example 1: Assume two users are connected to an AP with supported data rate of H = 54 Mbps and L = 6 Mbps respectively.
The number of time slots assigned is inversely proportional
to data rate hence H = #:A = #MN and L = #:O = #P , where 5 is
an arbitrary constant. The channel access probability of user 1
and user 2 are represented by 3H and3L. Since both have a fair
chance to transmit to the AP or vice versa, 3H = 3L = HL. With
both users taking turn to transmit packets and if their packet
sizes are the same, the time taken by each user to transmit a
packet can be represented by Figure 2.
Figure 2: Time slots required by user1 and user2 considering fair throughput
From Figure 2, User 2 takes more time than User 1 in order to maintain throughput fairness. In other words, User 1 is being penalized in terms of time slot fairness, which is the characteristic of WiFi DCF system. The average throughput for both users can be calculated using Eqn (5) as follows:
Q7' = ;A;AR;O × H = ;O;AR;O × L (5)
By substituting the values of H , L , H and Linto Eqn (5), the average throughput for both users can be calculated as 5.4 Mbps.
Similarly, within a single WiFi network, the average IP layer throughput per user (Eqn (6)) is calculated by multiplying the physical data rate in Eqn (4) by a corresponding throughput efficiency factor given in TABLE V:
= H∑ AD9×S9%,-.9@A (6)
The accuracy of the model (implementation of Eqn (6)) is verified together with the IEEE802.11g WiFi models (in
1 = 554 2 = 56
1 2
Page 16 of 26
http://mc.manuscriptcentral.com/ett
Transactions on Emerging Telecommunications Technologies
section 3.1) using the QualNet event-driven simulator (Version 5.2) and the results are found to be very similar.
2.1.2. LTE with Max-Min Fairness
In LTE, resource is assigned to users in forms of Physical Resource Blocks (PRB) consisting of many Resource Elements. The same max-min fair bandwidth sharing approach is adopted where in the LTE case, more PRBs are assigned to users experiencing worse channel behavior to ensure fairness. This assumption is reasonable since the LTE Medium Access Control (MAC) scheduler has not been fully defined in the standards. In order to simplify the study, resource element allocations in LTE are approximated as time fraction allocation in a TDMA manner as modeled in [17] and the average user throughput is defined by Eqn (7), a straightforward modification from Eqn (6):
= H∑ AW9<9=>?XWY9@A
(7)
where is maximum link throughput achievable by LTE user % and is the total number of LTE users.
2.2. Network Selection Schemes
In a heterogeneous wireless network comprising two or more technologies, user throughput fairness needs to be considered in two aspects, intra-network fairness and inter-network fairness. Intra-network fairness can be provided by AP or LTE BS to its associated users as the task is confined locally. With max-min fair capacity sharing of WiFi and LTE network (Eqn (6) and Eqn (7)), fairness is achievable amongst users under the same AP or BS. However, fair capacity sharing across the entire HetNet is not guaranteed and is strongly dependent on the implemented NSSs. The proposed DyBaCS is compared with two commonly used NSSs namely WiFi First (WF) and Physical Data Rate (PDR), the characteristics of which are as follows:
2.2.1. WiFi First (WF)
WiFi First (WF) connects a user to an AP whenever WiFi coverage is available. In other words, a user will never connect to a LTE network when there is WiFi coverage. This approach is adopted by most smart phones’ and tablets’ connection manager by default as the preferred data connection mode. In addition, this mode is also promoted by some mobile operators as a means to offload traffic from mobile networks [31] [8].
2.2.2. Physical Data Rate (PDR)
PDR chooses the network based on the Physical data rate of the RAT available to the user [9] [10]. Here the physical data rates provided by LTE and WiFi are compared and the RAT with higher physical data rate is chosen. Since PDR tends to assign more bandwidth to the users with better link capacity, it compromises user fairness, though the overall throughput performance might be good.
DyBaCS is mainly proposed to preserve fairness while maximizing HetNet throughput. Thus DyBaCS throughput performance may not outperform PDR (which is optimum in maintaining HetNet throughput), but it is very close to PDR in most cases (Section 4). In the study, a single LTE network is assumed with Z ≥ 1\ denoting the total number of WiFi APs in the HetNet and i denoting the index of the network, i.e. network = 1 ≤ ≤ is the i-th WiFi network, while, % = 1 ≤ % ≤ ! represents the%-th user in the HetNet and _ is the total user in entire HetNet. Total number of users
in AP and LTE network is represented by _ and _ respectively.
Before explaining the DyBaCS algorithm in detail, Algorithm 1; the User Throughput Estimation Flow (UTEF) algorithm, which enables the estimation of WiFi user
throughputs )), and LTE user throughputs )), is first
1) Let u = 1,2,…, is number of WiFi users in Network i
2) Average user throughput is : = H∑ AD9e ×S9<9=>?e9@A
; Eqn (7)
3) System throughput for network i is: = × 4\ For% = 1fg A) If &' ≥
i) )), = h × i ∶ × i ≤ "#,"#, ∶ ifℎ-.l,-
B) Elseif &' <
i) ,( =&' /
ii) if ,( × i ≤"#,
a) )), = h,( × i ∶ ,( ×i < &'&' ∶ gfℎ-.l,- iii) If ,( × i > "#,
a) )), = h"#, ∶ "#, < &'&' ∶ ifℎ-.l,- b) LTE UTEF:
1) Let u = 1,2,…, is number of users in LTE Network
2) Average user throughput is : = H∑ AW9<9=>?XWY9@A
; Eqn (8)
3) Average user throughput considering OF is:
)), =h × i ∶ × i ≥ "#,"#, ∶ ×i < "#,
For WiFi UTEF (Algorithm 1), the calculation of effective
WiFi user throughput )), is based on user access link
throughput "#, , AP backhaul capacity &' and
Overbooking Factor (OF). Link throughput "#, (or
equivalent to × in Eqn (6) and is listed in TABLE V) of user % is predominately affected by the distance from the AP, channel quality and other channel conditions such as
interference. Backhaul capacity &' is defined as the actual available backhaul capacity to AP , whether it is wired or wireless backhaul. Effective user throughput is limited by both
Page 17 of 26
http://mc.manuscriptcentral.com/ett
Transactions on Emerging Telecommunications Technologies
factors. In practice, OF is normally considered as not all the users access the channel at the same time [32]; by including OF the perceived throughput from the users point of view can be calculated.
The calculation of effective user throughput in WiFi UETF can be explained in detail with the aid of the scenario shown in
Figure 3, where 4 users are connected to AP. User data rate
and link throughput "#, are listed in TABLE II.
Figure 3: AP with 4 users under its coverage
TABLE II : USER DATA RATE AND LINK THROUGHPUT IN Figure 3
Multiplying the average user throughput by the total
number of users , as in Step 3, yields the total system
throughput of AP:
= × (9)
In the scenario, = 2.88 × 4 = 11.52 Mbps. As in Eqn
(6), is affected by link speed of all users in network; therefore it is highly dependent on users distribution.
represents the required backhaul capacity for AP to realise its full access capacity. If the backhaul capacity is sufficient to support the maximum capacity from the AP to clients such
that&' ≥ , then all users will enjoy a throughput of .
However, if the backhaul capacity &' is the bottleneck, &' ≤ , the available backhaul capacity &' is shared
evenly to all users and average user throughput in such
scenario is limited to a value ,( (Eqn (10)) which is less
than .
,( = &' / (10)
It is important to note that users will not secure a
throughput higher than even at backhaul capacities greater
than due to the restriction imposed by the WiFi physical
and MAC layer capability. Under the assumption of
simultaneous channel access, or ,( represents the
average user throughput for both sufficient and limited backhaul capacity cases.
In Figure 3, assuming that backhaul capacity &' = 10 is
less than = 11.52, the actual average throughput for the
users is limited to ,( = |~e!9=>?e = HN = 2.5 Mbps.
Otherwise, each user will enjoy = 2.88 Mbps if &' ≥ .
In order to simplify the explanation of Algorithm 1, an OF
= 5 is adopted for scenario depicted in Figure 3. Suppose &' =
15 Mbps where&' ≥ , the effective average throughput )), of user % is only limited by its link throughput"#, .
Step 4A (i) places a constraint to ensure that the value of × i does not exceed "#, . TABLE III shows that
effective user throughput )), is the minimum value between × i and "#, . Note that the effective average
throughput for User 3 and User 4 is limited to their link throughput which is 11.76 Mbps and 7.32 Mbps respectively.
TABLE III : EFFECTIVE USER THEROUGHPUT )),
UNDER CONDITION &' ≥ .
User, c `d `d `pdqr,cd `d × `abb,cd
1 2.88 15 17.28 14.40 14.40
2 2.88 15 14.76 14.40 14.40
3 2.88 15 11.76 14.40 11.76
4 2.88 15 7.32 14.40 7.32
Likewise, with limited backhaul capacity, Step 4B (ii) and
Step 4B (iii) ensure that ,( × i is bound by both "#,
and &' , whichever is smaller. The result is shown in TABLE IV.
TABLE IV : EFFECTIVE USER THROUGHPUT )),
UNDER CONDITION &' ≤ . User, c `d `d `pdqr,cd `d × `abb,cd
1 2.88 10 17.28 12.5 10
2 2.88 10 14.76 12.5 10
3 2.88 10 11.76 12.5 10
4 2.88 10 7.32 12.5 7.32
ℎ
+ 1 = 2 =
3 = 4 =
%2 %1
%3 %4
Page 18 of 26
http://mc.manuscriptcentral.com/ett
Transactions on Emerging Telecommunications Technologies
In short, Step 4 imposes logical considerations to the
determination of the effective user average throughput )),
taking into consideration backhaul capacity, user link speed and OF. Similarly, the LTE user throughput can also be estimated using the LTE UTEF approach. In this paper, LTE backhaul capacity is always assumed to be sufficient. Therefore in Step 3, the only constraint for user throughput in
the LTE network is the access link throughput"#, .
The DyBaCS NSS (Algorithm 2) assumes that initially, there is no user connected to the HetNet. Users are admitted to the HetNet one by one and their servicing network is determined by the NSS.
Step1 initializes variablesΩ,+, and , where Ω is a list holding the higher speed connections between WiFi and LTE interfaces to users, + is the set containing all users in
the HetNet, is the list of users connected to the WiFi AP and is the list of users connected to the LTE network.
In Step 2, the access link with the highest throughput
between user% to LTE ("#, ) or WiFi ("#, ) is chosen
and placed into Ω , Ω represents the throughput value for user % . All users are able to connect to at least the LTE network while access to WiFi depends on availability of WiFi
coverage. Hence = 0,1denotes the connectivity of user % to AP , = ‘1’ means connection is possible, ‘0’ means the opposite. Since multi-homing is not considered, every user is only allowed to connect to one network at a time. Step 3 assigns all users with no WiFi access to the LTE network and excludes those users from set + . The network selection
parameter ∈ 0,1 indicates the choice of user%; = ‘1’ indicates that user % is connected to network and value ‘0’ means the opposite.
The remaining users within set + which have not been assigned to any network are subjected to network selection; they can either assigned to WiFi or LTE. Network selection for those users is addressed in Step 4 in order to optimize the network performance. Step 4 (a) ensures the user with the highest link throughput within set + (referred to as user) is considered first.
In Step 4 (b) and Step 4 (c), the achievable throughput of user (considering access link speed, AP backhaul capacity and OF) on WiFi AP and LTE is estimated using WiFi
UTEF and LTE UTEF and represented by ))," and )),"
respectively. The throughput estimation is executed assuming that user is added to the corresponding WiFi or LTE network. Therefore, during the throughput estimation, the total number of users connected to AP is assumed to be user
plus the total number of existing users written as ∪ and similarly the total number of users in the LTE network is ∪ . The achievable throughput for
user on the WiFi and LTE network is then assigned to " and " respectively.
User is subsequently assigned to the network that offers
the highest throughput and the corresponding " or " value is set according to Step 4 (d). The total number of users
connected to their respective -th WiFi network or LTE
network is then updated.
Finally set + is updated by excluding user in Step 4(e) and the Step 4 processes are repeated until all users are serviced.
Algorithm 2: DyBaCS
1) Initialization
a) Ω = ∅, and + = 1,2, … , ! b) _ = ∅, ∀ = 0, 1… , ; = ∅
2) For % = 1fg ! a) Ω ← × "#, , "#, , ∀ = 0, 1… ,
3) For % = 1fg ! a) if user % satisfying = 0, ∀ = 1, 2,…
i. = 1
ii. + = + − % 4) while + ≠ ∅
a) find where |Ω"| ≥ |Ω| for all % ∈ + and
b) Estimate user throughput ))," in i-th WiFi Network
assuming user n is included to the network, i.e. ∪ ; Using WiFi UTEF (Algorithm 1a)
i. " ← )),"
c) Estimate user throughput ))," in LTE Network assuming
user n is included to LTE Network, i.e. ∪ ; Using LTE
UTEF (Algorithm 1b);
i. " ← )),"
d) If "≥" i. " = 1
ii. = ∪ Else
iii. " = 1
iv. = ∪ e) + = + −
3. Parameters, Assumptions and Simulation Approach
The section describes the simulation approach, simulation
parameters and assumptions used.
3.1. WiFi Model
TABLE V presents the parameters used in the WiFi IEEE802.11g model. The receiver sensitivity values per modulation and coding scheme (MCS) for WiFi receivers are taken from [33]. The throughput efficiency, the ratio of actual IP layer throughput against physical data rate and the actual IP layer throughput of each MCS scheme are obtained from the QualNet simulator assuming fixed packet size of 1000 Bytes with constant bit rate traffic.
TABLE V : IEEE802.11G PARAMETERS
Index MCS
Receiver
Sensitivity
(dBm)
Data
Rate
(Mbps)
Throughput
Efficiency
(s)
Throughput
(Mbps)
1 BPSK1/2 -94.0 6 0.70 4.20
2 BPSK3/4 -93.0 9 0.64 5.76
3 QPSK1/2 -91.0 12 0.61 7.32
4 QPSK3/4 -90.0 18 0.54 9.72
5 16-QAM1/2 -86.0 24 0.49 11.76
6 16-QAM3/4 -83.0 36 0.41 14.76
7 64-QAM2/3 -77.0 48 0.35 16.80
8 64-QAM3/4 -74.0 54 0.32 17.28
Page 19 of 26
http://mc.manuscriptcentral.com/ett
Transactions on Emerging Telecommunications Technologies
The path loss model in Eqn (11) is derived from field measurement detailed in [34] :
= 30.2 ∗ g10Z\ + 22.234 (11)
3.2. LTE Model
LTE throughput is calculated based on the throughput plot by 3GPP [35] shown in Figure 4. In the simulation, SINR ratio at a receiver is used to calculate the achievable throughput. In order to calculate the received power, the ITU recommended LTE Urban Macro (UMa) non-line-of-sight (NLOS) path loss model is used [36].
Figure 4: LTE throughput vs. SNR for different Modulation and Coding
Schemes (MCS) used in the model
3.3. Stochastic User Placement Model
A stochastic node location model is used to position the users’ in the HetNet. The authors in [37] found that this model can represent the users’ locations around WiFi AP in a city or urban environment. Here users are assumed to be distributed around cluster centers. Two spatial distributions model are adopted where the first distribution is used to generate the numbers and locations of the cluster centers. The second distribution is then used for positioning the number of users around each center. The initial cluster center distribution is generated randomly with total number of cluster centers equal to . Subsequently, a bivariate Gaussian distribution
with covariance matrix ∑ = L,L is used to generate
actual user locations around the cluster centres. The size and shape of the cluster is characterized by the parameters and (Figure 5). The number of users per cluster is drawn from a
Poisson distribution with intensity . Parameters ,
and are the same for every cluster.
In the simulation, initially 100 users are placed in an area of 1 square kilometre with number of clusters = 10,
are added each time by increasing number of cluster by five while keeping the number of users per cluster
and cluster dimension unchanged, until the total number of users reaches 250 (Figure 6). Since all users are tabulated in an area of 1 square kilometre, the terms the number of users and user density are used interchangeably in the rest of this paper.
Figure 5: User placement with total number of clusters = 10,
cluster size = 10 and σ = 25
Figure 6: User placement from 100 users to 250 users with 50 users added
every time, maximum = 25, cluster size = 10 and σ = 25
3.4. Placement of WiFi Access Points
Figure 7: WiFi APs placement within HetNet that comprises the scenarios with 4, 7 and 13 WiFi APs
In the Matlab model, WiFi APs are placed within a macro LTE cell according to three selected topologies shown in Figure 7. These WiFi topologies enable the NSSs to be evaluated as a function of WiFi-LTE node ratios (or WiFi node densities). By controlling the APs’ transmit power, these WiFi topologies can give the same coverage size as the macro LTE cell. For example, Figure 8a shows the coverage plot for 4 APs, while the overlay of both WiFi and LTE cell (Figure 8b) that forms the HetNet is illustrated in Figure 8c. WiFi coverage plots for 7 and 13 APs are shown in Figure 9a and Figure 9b respectively. Although there is no limit on the variation topologies which can be evaluated, the selected topologies is believed to be able to provide a good insight on the performance of NSSs under different WiFi-LTE node ratios.
-10 -5 0 5 10 15 200
1
2
3
4
5
SNR (dB)
Throughput (bits/sec/H
z)
64QAM 2/3
64QAM 3/4
64QAM 4/5
16QAM 4/5
16QAM 1/2
16QAM 2/3
QPSK 4/5
QPSK 1/2
QPSK 1/3
QPSK 2/3
QPSK 1/8
QPSK 1/4
QPSK 1/5
Page 20 of 26
http://mc.manuscriptcentral.com/ett
Transactions on Emerging Telecommunications Technologies
Figure 8: Network coverage plot based on data rate with x and y axis showing
coverage size in meter; a) 4-WiFi-Nodes networks with access channel shown in parentheses, b) LTE network and c) HetNet (LTE+WiFi) with 100 users
(a) (b)
Figure 9: WiFi coverage plot based on data rate with x and y axis showing coverage size in meter; a) 7-WiFi-Nodes networks, b) 13-WiFi-Nodes
networks; WiFi access channel shown in parentheses
3.5. WiFi Access Channel and Interference
On WiFi access channel, three non-overlapping channels with channel number 1, 6 and 11 are used (channel number is stated on top of each AP in Figure 8 and Figure 9). To calculate SINR, the simulated area is divided into 5-by-5 square meter grids. Since non-overlapping channels are used, only co-channel interference is considered. In each grid, an effective SINR is derived as:
= 9∑ ¡¢£@A R!e (12)
where, is the received power of user% from the serving AP located in a grid, ¤is total number of co-channel interferer APs in range, is the interference power at the receiver and is the noise floor. Effective SINR obtained is then used to map user data rate and hence user throughput calculation in WiFi networks.
Figure 10: 7-WiFi-Nodes coverage plot with co-channel interference
Figure 10 shows the coverage plot of 7 WiFi nodes with co-channel interference. The interference has resulted in a smaller effective WiFi coverage area as compared to Figure 9a, which has a better channel plan.
3.6. WiFi and LTE backhaul
In the study, WiFi backhaul capacity is varied from 1Mbps up to 25Mbps until the throughput of AP saturates (Section 4). Two backhaul scenarios are assumed when evaluating the NSSs; 1) uniform WiFi backhaul capacity and 2) non-uniform WiFi backhaul capacity throughout the HetNet. The LTE base station (BS) backhaul capacity is always assumed to be sufficient.
3.7. General Parameters and Assumptions
TABLE VI summarizes the simulation parameters used. Only the downlink performance is investigated in the paper. 2.6GHz is used for LTE as it is the frequency band allocated in Malaysia. A fixed interference margin of 3dB is assumed for the LTE User Equipment (UE).
Receiver antenna gain of WiFi and LTE UE is assumed to be 3 dB and 0 dB respectively. The assumption on traffic type has been described in Section 3.3.1. From [32], the Overbooking Factor (OF) is a design choice driven by actual user behavior in the deployed area. OF that varies from 4:1 to 100:1 has been reported by various ISPs and the lower the
200 400 600 800 1000
200
400
600
800
1000
AP1(6) AP2(6)AP3(6)
AP4(11)AP5(11)
AP6(1) AP7(1)
0
5
10
15
20
25
30
35
40
45
50
Page 21 of 26
http://mc.manuscriptcentral.com/ett
Transactions on Emerging Telecommunications Technologies
Figure 11: HetNet average user throughput as a function of WiFi backhaul capacity. (4 WiFi APs, 100% WiFi-LTE overlap, Uniform WiFi backhaul capacity)
Figure 12: Fairness on bandwidth sharing as a function of WiFi backhaul capacity. (4 WiFi APs, 100% WiFi-LTE overlap, Uniform WiFi backhaul
capacity)
value the better the service guarantee. A factor of 10:1 in adopted to represent a relatively heavy usage scenario. User density is varied from 100 users to 250 users per square km.
4. Results and Analysis
4.1. Effect of Varying Backhaul Capacity Uniformly
Two performance metrics namely average user throughput and user throughput fairness in the HetNet cell are used to evaluate the performance of the NSSs. Fairness is derived
using Jain fairness index in the form of ∑ )),!9=>?GH L/B ∑ )),L!9=>?GH E [38].
First the performance of all NSSs is evaluated as a function of WiFi backhaul capacity from 1Mbps to 25Mbps with 100% WiFi-LTE coverage overlap and 4 WiFi APs (as in Figure 8c). Figure 11 shows that average user throughput of PDR and DyBaCS are similar over the entire range of backhaul capacity and WF has the lowest average user throughput. The plots plateaus when backhaul capacity reaches 20Mbps for all NSSs as that is the maximum access throughput achievable by WiFi (IEEE 802.11g). The total WiFi access throughput also depends on user distribution as slower users slow down the entire network. Figure 12 evaluates the fairness in terms of achievable throughput per user. Result shows that average user throughput of PDR and DyBaCS are similar over the entire range of backhaul capacity while WF has the lowest average user throughput. DyBaCS outperforms the rest in terms of fairness and WF exhibits the worst fairness performance.
4.2. Effect of WiFi-LTE Overlap Ratio Within a HetNet cell
Since the coverage overlap between WiFi and LTE is likely to vary in practice, it is therefore important to investigate how NSSs perform in different overlap conditions. Here the coverage area is defined as a percentage e.g. 25% means 25% of LTE coverage is also covered by WiFi and 100% means all LTE coverage is overlapped by WiFi. The simulation is carried out by switching on APs within the LTE cell one by one until the entire LTE cell overlaps with WiFi coverage. AP activation sequence is based on the number of users covers by an AP, AP which covers the most users is switched on first and followed by APs with lesser users in descending order.
Figure 13a shows that in general, that the average user throughput increases linearly for all NSSs as backhaul capacity increases and starting to flatten at 15Mbps. The maximum average user throughput for PDR, DyBaCS and WF are 7.87Mbps, 7.60Mbps and 5.32Mbps respectively at 100% WiFi-LTE coverage overlap and 20Mbps backhaul capacity. PDR which has the highest average throughput only has a marginal performance edge as compared to DyBaCS. The difference in performances diminishes when WiFi-LTE coverage overlap increases. WF provides the worst average user throughput in most cases. An interesting point to note is for WF at 1Mbps backhaul capacity, increases in WiFi coverage results in a drop in the average user throughput instead of increase. This is due to the fact that WF connects all users to WiFi networks regardless of its backhaul capacity. Consequently, with limited WiFi backhaul capacity as low as 1Mbps, WF causes the users to suffer from low average throughput and becoming more severe when WiFi coverage is larger.
Page 22 of 26
http://mc.manuscriptcentral.com/ett
Transactions on Emerging Telecommunications Technologies
Figure 13: NSSs performance as a function of backhaul capacity and WiFi-LTE overlap percentage (Maximum 4 WiFi APs, Uniform WiFi backhaul capacity).
Figure 13b shows that DyBaCS has the highest fairness for the entire range of WiFi-LTE overlap ratio and backhaul capacity considered. As for WF, higher fairness can be achieved with higher WiFi backhaul capacity because adequate capacity is shared amongst users. It is also found that fairness of PDR is closer to DyCaBS when backhaul capacity is low but the difference between them becomes larger as the backhaul capacity increases because the capacity distribution of PDR is less fair. At 25Mbps backhaul capacity and 100% WiFi-LTE coverage overlap, both WF and PDR achieve 0.7 and 0.73 respectively in terms of fairness, but this is lower than 0.9 by DyBaCS.
4.3. Effect of User Density
A high probability that the number of users in a network will vary drastically from peak hour to off peak of the day exists, especially in urban area. Furthermore, the number of users may also increase but gradually in residential areas due to the growth in population. To evaluate how the NSSs under study cope with the variation of user density, an evaluation is carried out by varying the number of users in the HetNet cell. A scenario with 7 WiFi APs, a medium WiFi density, is chosen and WiFi-LTE Coverage overlap is set to 100%. The number of users is increased from 100 to 250, in 50 user increments (Figure 14).
(a) Average User Throughput
(b) Fairness
Figure 14: NSSs performance as a function of Number of Users and Backhaul capacity. (7 WiFi APs, 100% WiFi-LTE Coverage)
Figure 14 shows that PDR provides an advantage on average user throughput over DyBaCS when WiFi backhaul capacity values are low (i.e. 1Mbps to 5Mbps) regardless of user density. However, when the WiFi backhaul capacity is increased, the difference in average user throughput between PDR and DyBaCS becomes negligible. At highest user density with 250 users per square kilometer, average user throughput of DyBaCS is greater than PDR when WiFi backhaul capacity exceeds 10Mbps. WF remains the worst in providing capacity to users. DyBaCS remains the best scheme in terms of fairness for the entire range of user density and backhaul capacity.
Figure 14 implies that with increasing number of users, PDR is actually losing its advantage on average user throughput and fairness to DyBaCS and WF respectively, accentuated in Figure 15 which depicts NSSs performance for all three WiFi node densities considering the highest number of users (250 users). Figure 15 shows that with 250 users, PDR is the worst in terms of fairness despite previous results (refer to Figure 13 and Figure 14) showing that PDR is the second best on fairness. PDR’s advantage on average user throughput is also sliced to a thin margin when both number of users and WiFi node density is high. For instance, in Figure 15, when number of WiFi nodes is 4, PDR is much superior in terms of average user throughput.
Page 23 of 26
http://mc.manuscriptcentral.com/ett
Transactions on Emerging Telecommunications Technologies
Figure 15: Performance comparison between NSSs as a function of total WiFi Nodes with 250 Users and fixed backhaul capacity of 20Mbps
However, at higher WiFi node density, PDR’s advantage on average user throughput becomes insignificant.
As a general conclusion DyBaCS is good for fairness whilst maintaining the average user throughput, a clear advantage when the number of users is high with dense AP deployment, a typical urban scenario. It is adaptive to varying number of WiFi nodes and varying number of users, highly relevant in fast changing environments. PDR which is a form of greedy algorithm maximizes the average user throughput but at the expense of compromised fairness and its advantages in cell throughput diminish when both number of users and AP density are high. Although WF performs adequately compared to PDR when APs density, user density and backhaul capacity are high, it performs poorly otherwise and never outperforms DyBaCS in all scenarios under study.
4.4. Performance on Non-uniform Backhaul Capacity
In another scenario with 100 users, backhaul capacity of 4 APs covering the entire HetNet are non-uniformly assigned with AP1, AP2, AP3 and AP2 equal to 10Mbps, 0.5Mbps, 20Mbps and 3Mbps respectively. Average user throughput is presented in Figure 16a, where PDR has the highest value (4.75Mbps) followed by DyBaCS (4.22Mbps) and WF (2.62Mbps). PDR is expected to offer higher average user throughput as it selects the network based on the highest physical data rate with the intention of maximizing the average user throughput. However, it degrades the fairness in terms of capacity distribution among the users highlighted in Figure 16b where the fairness index of PDR is only 0.59 compared to 0.86 by using DyBaCS. Although the average throughput of DyBaCS is 11% lower than PDR, but the traded off seems to be worthwhile as fairness is significantly improved by 45%. WF only provides a 0.43 fairness index.
(a) Average User Throughput
(b) Fairness
Figure 16: (a) Average user throughput and (b) Fairness on bandwidth sharing
with non-uniform WiFi backhaul capacity. (4 Nodes, 100 users)
(a) Average User Throughput
(b) Fairness
Figure 17: (a) Average user throughput and (b) Fairness of bandwidth sharing
with non-uniform WiFi backhaul capacity. (4 Nodes, 250 users)
Using a similar scenario but by increasing the number of users to 250, Figure 17b shows that fairness index offered by PDR (at 0.33) is the poorest amongst all the NSSs under study although as shown in Figure
0
1
2
3
4
5
4 7 13
WF PDR DyBaCS
Ave
rage
Use
r Th
roug
hput
(Mbp
s)
Number of WiFi Nodes
0.0
0.1
0.2
0.3
0.4
0.5
0.6
0.7
0.8
0.9
1.0
4 7 13
WF PDR DyBaCS
Fairn
ess
Number of WiFi Nodes
Page 24 of 26
http://mc.manuscriptcentral.com/ett
Transactions on Emerging Telecommunications Technologies
17a, PDR provides the highest average user throughput. DyBaCS on the other hand provides a good balance between average user throughput and fairness.
The results captured in Figure 16 and Figure 17 consistently indicate that DyBaCS, under non-uniform WiFi backhaul scenarios, provisions best fairness to users with minimal penalty in the average user throughput. DyBaCS provides the best performance on both average throughput and fairness when both user density and WiFi node density is high (similar to uniform backhaul capacity case). Performance under non-uniform WiFi backhaul is in agreement with that of uniform backhaul evaluation detailed in Section 4. However, it is important to note that changes in user location and distribution of backhaul capacity may affect performance to a certain degree but the general trends remain.
5. Conclusions
A backhaul capacity sensitive network selection scheme referred to as DyBaCS within a wireless HetNet has been presented. The performance of DyBaCS and two commonly used NSSs has been evaluated as a function of WiFi backhaul capacity, WiFi-LTE coverage ratio, WiFi-LTE node ratio and user density. The performance of NSSs has also been compared under uniform and non-uniform WiFi backhaul capacity distributions. Results show that the proposed DyBaCS scheme provides the best fairness whilst preserving the average user throughput over all scenarios. DyBaCS is a highly scalable NSS as compared to PDR and WF in scenarios with varying number of users, WiFi nodes and WiFi backhaul capacity. Future work needs to consider more realistic proportional fairness capacity sharing schemes. The use of higher capacity LTE base stations and IEEE802.11n WiFi also needs to be studied. Besides, evaluation under different traffic types also needs to be addressed.
Acknowledgment
The work is supported by Ministry of Science, Technology and Innovation of Malaysia under the Science Fund project code 01-03-04-SF0011.
References
1. A Ting, D Chieng, K H Kwong, I Andonovic & K D Wong. Dynamic backhaul sensitive Network Selection Scheme in LTE-WiFi wireless HetNet. IEEE 24th International Symposium on Personal Indoor and Mobile Radio Communications (PIMRC); 8-11 Sept 2013: 3061-3065.
2. The LTE capacity shortfall: Why small cell backhaul is the answer, Aviat Networks, Retrieved 14th May 2013 from http:// www.aviatnetwork.com/
3. Small cell market status Feb 2013, Informa telecoms & media, Retrieved 2nd October 2013 from http://www.smallcellforum.org/
4. Small cell operators face myriad operational and financial challenges, Infonetics Research, Retrieved 1st Oct 2013 from http://www.infonetics.com/
5. Mark Priscaro (14th May 2013), Telecom New Zealand
and Ruckus Wireless Transform Traditional Phone
Booths into Super Fast Wi-Fi Hotspots, Ruckus Wireless,
Retrieved 16th May 2013 from http://
www.ruckuswireless.com/
6. Firetide Wireless Mesh Solutions for TELCOS: Access &
Small Cell Backhaul,
https://www.winncom.com/manufacturer/firetide
7. Karam F W, Jensen T. Performance analysis of ranking
for QoS handover algorithm for selection of access
network in heterogeneous wireless networks. 21st
International Conference onComputer Communications
and Networks (ICCCN), 30 July-2 Aug 2012:1-6.
8. A Handa. Mobile Data Offload for 3G Networks: A
White Paper. http://www.intellinet-
tech.com/Media/PagePDF/Data%20Offload.pdf, Oct.
2009.
9. J Nie, J Wen, Q Dong, Z Zhou. A seamless handoff in
IEEE802.16a and IEEE802.11n hybrid networks, in proc.
10. J Roy, V Vaidehi, and S Srikanth. Always best-connected
QoS integration model for the WLAN, WiMAX
heterogeneous network. In IEEE First International
Conference on Industrial and Information Systems, 8-11
Aug 2006: 361-366. 11. Y Bejerano, S J Han, and L E Li. Fairness and Load
Balancing in Wireless LANs Using Association Control, IEEE/ACM Transactions on Networking 2007; 15(3):560-573.
12. Judd G, Steenkiste P. Fixing 802. 11 access point selection. ACM SIGCOMM Computer Communication Review 2002; 32(3): 31-31.
13. D Kumar, E Altman, and J M Kelif. Globally optimal user-network association in an 802.11 WLAN and 3G UMTS hybrid cell. International Teletraffic Congress, Ottawa, Canada, June 17-21 2007: 1173-1187.
14. K Premkumar and A Kumar. Optimum Association of Mobile Wireless Devices with a WLAN-3G Access Network, Proc. IEEE Int’l Conf. Comm. (ICC ’06), 11-15 June 2006: 2002-2008.
15. S. Singh, H. S. Dhillon, and J. G. Andrews. Offloading in heterogeneous networks: Modeling, analysis, and design insights, IEEE Trans. Wireless Communications 2013; 12(5): 2482-2497.
16. P Li , J Kong, S H Kim, H B Jung, X L Niu, D K Kim.
Power allocation with max-min fairness for multicast in
heterogeneous network, 14th International Conference on
Advanced Communication Technology (ICACT), 19-22
Feb 2012: 502-505
17. P Xue, P Gong, J H Park, D Y Park, D K Kim. Radio
resource management with proportional rate constraint in
the heterogeneous networks, IEEE Transactions on
Wireless Communications 2011; 11(3): 1066-1075. 18. Y Bejerano and S J Han. Cell Breathing Techniques for
Load Balancing in Wireless LANs. IEEE Tranctions on Mobile Computing 2009; 8(6): 735-749.
19. H Velayos, V Aleo, and G Karlsson. Load Balancing in Overlapping Wireless LAN Cells, Proc. IEEE International Conference on Communications, 20-24 June 2004: 3833-3836.
20. Pei X, Jiang T, Qu D, Zhu G & Liu J. Radio-resource management and access-control mechanism based on a novel economic model in heterogeneous wireless
Page 25 of 26
http://mc.manuscriptcentral.com/ett
Transactions on Emerging Telecommunications Technologies
networks. IEEE Transactions on Vehicular Technology 2010, 59(6): 3047-3056.
21. Zhuo X, Hua S, Gao W & Cao G. An Incentive Framework for Cellular Traffic Offloading. IEEE Transactions on Mobile Computing 2014; 13(3): 541-555.
22. Yang Z, Yang Q, Fu F & Kwak K S. A novel load balancing scheme in LTE and WiFi coexisted network for OFDMA system. International Conference on Wireless Communications & Signal Processing (WCSP), 24-26 Oct 2013; 1-5.
23. F Bari and V C M Leung. Automated network selection in a heterogeneous wireless network environment. IEEE Network 2007; 21(1): 34–40.
24. H Hu, W Zhou, S Zhang, J Song. A Novel network
selection algorithm in next generation heterogeneous
network for modern service industry. IEEE Asia-Pacific
Services Computing Conference, 9-12 Dec 2008: 1263-
1268. 25. Galeana-Zapien H, Ferrus R. Design and Evaluation of a
Backhaul-Aware Base Station Assignment Algorithm for OFDMA-Based Cellular Networks. IEEE Transactions on Wireless Communications 2010; 9(10): 3226-3237.
26. Pahlavan K, & Levesque A H. Wirless Information Networks, 2nd Edition, John Wiley & Sons, 2005.
27. P Bender et al. CDMA/HDR: A Bandwidth Efficient
High-speed Wireless Data Service for Nomadic User.
IEEE Communication Magazine 2000; 38(7): 70–77. 28. Gerasimenko M, Moltchanov D, Florea R, Andreev S,
Koucheryavy Y, Himayat N, Yeh S-p. & Talwar S. Cooperative Radio Resource Management in Heterogeneous Cloud Radio Access Networks. IEEE Access 2015; 3: 397-406.
29. Yang C, Li J & Anpalagan A. Cooperative bargaining game - theoretic methodology for 5G wireless heterogeneous networks. Transactions on Emerging Telecommunications Technologies 2014; 26(1): 70-81.
30. Bredel M & Fidler M. A measurement study of bandwidth estimation in IEEE 802.11 g wireless LANs using the DCF. NETWORKING 2008 Ad Hoc and Sensor Networks, Wireless Networks, Next Generation Internet; 4928: 314-325. Springer.
31. Yongmin Choi, Hyun Wook Ji, Jae-yoon Park, Hyun-chul
Kim, Silvester J A. A 3W network strategy for mobile
data traffic offloading. IEEE Communications Magazine
2011; 49(10): 118-123.
32. Tranzeo Wireless Technologies Inc. Example Community
Broadband Wireless Mesh Network Design, Version 1.1,
20June 2007.
33. NanoStation2, Ubiquiti Networks,
www.ubnt.com/products/nano.php
34. A Ting, D Chieng, K H Kwong, I Andonovic.
Optimization of Heterogeneous Multi-radio Multi-hop
Rural Wireless Network. IEEE 14th
International
Conference on Communicaiton Technology 2012,
ChengDu China, 9-11 Nov 2012: 1159-1165.
35. 3GPP, Evolved Universal Terrestrial Radio Access (E-
UTRA); Radio Frequency (RF) system scenarios (Release
10), 3GPP TR 36.942 V10.2.0 2010
36. ITU-R Report M.2135-1: Guidelines for evaluation of
radio interface technologies for IMT-Advanced,
December 2009.
37. M Petrova, P Mähönen, and J Riihijärvi. Connectivity
analysis of clustered ad hoc and mesh networks, In
Proceedings of IEEE GLOBECOM, Martinique 26-30
Nov 2007: 1139-1143.
38. R Jain, A Durresi, and G Babic. Throughput fairness
index: an explanation, ATM Forum/99-0045, Feb. 1999.
Page 26 of 26
http://mc.manuscriptcentral.com/ett
Transactions on Emerging Telecommunications Technologies