91
Scale and Scope as Drivers of the European Research Area Final Report Nicholas Vonortas, Wolfgang Polt, Robbert Fisher, Yiannis Spanos, Michael Dinges, Babis Ipektsidis, Maria Pateraki

Scale and Scope as Drivers of the
European Research Area
Final Report
Nicholas Vonortas, Wolfgang Polt, Robbert Fisher,
Yiannis Spanos, Michael Dinges, Babis Ipektsidis,
Maria Pateraki
EXECUTIVE SUMMARY
The objective of this study was to assess empirically whether economies of scale and
scope exist at the research project level. The assumption underlying European Union
research policy appears to be that such economies exist, hence the emphasis placed on
the 'critical mass' of research and development (R&D) projects. Overall, the results of
this analysis do not support a simple assumption that 'bigger is better' in the context of
the European Framework Programmes (FPs). Consequently, some of the basic
assumptions underlying the change in the general orientation of the FPs towards
larger projects should be reconsidered.
There are many factors that must be taken into account when determining the relation
between scale, scope and performance of individual participants. Three sets of factors
mediate the relation between project scale and performance: (a) the pool of available
resources; (b) the learning process (absorptive capacity); and (c) transaction costs.
Three additional sets of factors moderate the relation between project scale and the
mediating factors above: (a) partner contribution to the project; (b) project
characteristics (such as scope); and (c) project management. Finally, the industry and
market environment(s) relevant to the research project under question are important.
Performance of individual participants was measured along eight dimensions:
Goal achievement – the degree to which the project achieved its scientific,
technical and commercial objectives
Knowledge outputs – publications, doctoral dissertations, etc.
Technological outputs – tools and techniques, models, simulations, prototypes,
etc.
Network outputs – building relationships with other organisations
Research capacity impacts – effects on the capacity of the partner to undertake
research such as research staff, technological skills, critical mass
Commercial outputs – increased turnover, profitability, competitiveness
Product innovation – new or improved products or services
Process innovation – new or improved production processes
The data for the multi-layered descriptive and econometric analysis came from three
sources: (i) the 'InnoImpact' survey (a survey carried out to identify the innovation
performance of FP projects); (ii) a follow-up survey; and (iii) the Community
Research and Development Information Service (CORDIS). The final sample
consisted of responses from 1,172 organisations participating in a total of 676
research projects funded by the Fifth and Sixth Framework Programmes for Research.
The descriptive analysis did not indicate any absolute advantage of project size, when
measured by the number of partners, on performance. On the contrary, larger projects

appeared to add significantly to transaction costs. When measured by the average
funding per partner, (relative) project size was more strongly related to a number of
performance dimensions, namely knowledge output, technological output, and
research capacity impact. Larger collaborative projects in terms of average funding
seemingly allowed more sophisticated partners to undertake projects that were riskier,
more complex, and of longer duration compared to those undertaken individually.
Evidence suggests that it is not necessarily the absolute size but the relative size of a
project (partner funding) that might be responsible for 'critical mass' effects.
The econometric analysis showed increasing (up to a certain threshold) and then
decreasing returns to scale for one performance dimension, i.e. network outputs, when
scale is measured by the number of partners in a consortium. When scale is measured
by the project budget, the analysis suggested decreasing and then increasing returns
for goal achievement. While similar results were obtained for the remaining
performance dimensions, the statistical significance was low. Importantly, the size of
the estimated threshold varies considerably across project performance dimensions.
Taken overall, the econometric results indicate that increasing scale generally does
not seem to improve project performance, with the notable exception of firms which
seem to benefit from increasing scale in terms of their own funding, showing a
positive effect mainly on commercial impacts.
To sum up, project scale affects performance in complex ways: mostly, its effects are
transmitted through critical intervening variables, such as the complementarities of
resources, learning conditions, and transaction costs. When the net effect is negative –
most of the time – it is because increasing scale lowers the positive effect of resources
and learning and magnifies the negative effect of transaction costs. When the net
effect is positive – mainly for private enterprises – it is because increasing scale
strengthens the positive effect of resources and learning and diminishes the negative
effect of transaction costs. Consequently, the underlying explanation of positive or
negative net effects must be sought basically in the characteristics of the R&D project.
In the context of European Research Framework Programmes, increasing scale does
not unequivocally improve project performance. The exception is firms which often
seem to benefit from increasing budgets in terms of commercial outcomes. Several
messages emerge for policymakers and FP programme managers:
The basic assumption of 'bigger is better' in collaborative R&D projects is not
supported by our analysis. In our view, the rationale for increasing project
sizes in the Framework Programmes should be carefully reconsidered.
Indiscriminately raising the scale of collaborative R&D projects in the
Framework Programmes without good knowledge of the 'optimal', or 'most
appropriate', size should be resisted. It remains doubtful, however, whether
such knowledge can be obtained ex-ante economically with our current level
of understanding.
A closer look must be taken at relative project size as reflected by average
funding per partner, especially with an eye on business participants, where size
is indeed occasionally translated into positive effects on performance.
Given the importance of the issue for the European Research Area (ERA), and
given the diversity of underlying determinants, monitoring of the effects of
R&D project scale and scope on project and program performance should

become an integral part of the monitoring and evaluation exercises of the
Framework Programmes.

TABLE OF CONTENTS
Executive Summary ............................................................................................ 2
Table of Contents ............................................................................................... 5
Chapter 1 Introduction and background ............................................................ 8
1.1 Background and objectives ................................................................. 8
1.2 Study approach and implementation................................................... 9
1.3 Literature review and analytical framework ....................................... 11
1.3.1 Economies of scale and scope in R&D ............................................. 11
1.3.2 Economies of scale and scope in Collaborative R&D ....................... 12
1.3.3 Analytical Framework and Hypotheses ............................................. 14
Chapter 2 Data used in the Study ................................................................... 19
2.1 Introduction ....................................................................................... 19
2.2 CORDIS data .................................................................................... 19
2.3 Data from the Innovation Impact Study ............................................. 20
2.4 Survey construction and implementation .......................................... 20
2.5 Sampling ........................................................................................... 22
2.6 Response and data quality ............................................................... 22
2.7 Representativeness of our sample ................................................... 23
2.8 EPO data .......................................................................................... 24
Chapter 3 Economies of Scale and Scope in R&D projects ............................... 26
3.1 Descriptive analysis .......................................................................... 26
3.1.1 Introduction ................................................................................. 26
3.1.2 Overview of the sample data .......................................................... 27
3.1.3 Performance dimensions ................................................................ 34
3.1.4 Mediator Variables ....................................................................... 37
3.1.5 Partner Characteristics and Project Profile ....................................... 39
3.1.6 Conclusions ................................................................................. 44
3.2 Econometric Analyses ...................................................................... 46
3.2.1 Introduction and Overview ............................................................ 46
3.2.2 Methodology ................................................................................ 46

3.2.3 Results and Discussion .................................................................. 53
Chapter 4 Summary and Conclusions ............................................................. 80
References ....................................................................................................... 88
Figures
Figure 1: Erascope implementation .................................................................... 11
Figure 2: Analytical framework ......................................................................... 15
Figure 3: Number of responses per project .................................................... 23
Figure 5: Project size and project funding by thematic area* ................................. 29
Figure 6: Project size and project funding by instrument ....................................... 30
Figure 7: Funding by project size (number of partners) ......................................... 32
Figure 8: Average participant funding by instrument ............................................ 32
Figure 9: Project funding by Instrument .............................................................. 33
Figure 10: Number of project partners by instrument ............................................ 34
Figure 11: Performance dimensions by project size (by number of partners) ........... 35
Figure 12: Percentage of projects that realised product and process innovations (by
number of partners) .......................................................................................... 36
Figure 13: Performance dimensions by project size (by average partner funding) .... 36
Figure 14: Percentage of projects that realised product and process innovations (by
partner funding) ............................................................................................... 37
Figure 15: Mediator variables by project size (number of partners) ........................ 39
Figure 16 Mediator variables by project size (total funding) .................................. 39
Figure 17: Firm characteristics by project size (number of partners) ....................... 41
Figure 18: Firm characteristics by project size (participant funding) ....................... 42
Figure 19: Project profile vis-à-vis typical internal project (by number of partners) . 42
Figure 20: Project profile vis-à-vis typical internal project (by partner funding) ...... 44
Figure 21: 'Simple' multiple mediation model ...................................................... 51
Figure 22: Moderated Mediation ........................................................................ 52
Figure 23: Effect on network outputs .................................................................. 56
Figure 24: Effect on goal achievement ................................................................ 58
Tables
Table 1: Sections of the questionnaire ........................................................... 21
Table 2: Difference between FP5 total population and the Erascope actual response sample ............................................................................................ 23
Table 3: Difference FP6 total population and the Erascope actual response sample ........................................................................................................... 24
Table 9: Mapping thematic areas ........................................................................ 28
Table 10: Quartiles partners, project funding, and participant funding .................... 32
Table 11: Direct effects of scale on project performance (full sample) .................... 54
Table 12: Summary of results in the different sub-samples .................................... 62
Table 14: Summary of Step 1 results with regards to optimal scale ........................ 64
Table 15: Unconditional mediational effects of scale on project performance (full
sample) ........................................................................................................... 67
Table 16: Unconditional mediational effects of scale on project performance
(Collaborative research sub-sample) ................................................................... 67
Table 17: Conditional mediational effects of log (number of partners) on project
performance (full sample) ................................................................................. 76
Table 18: Conditional mediational effects of log (budget) on project performance (full
sample) a Only total indirect effects are significant ............................................... 78

8
CHAPTER 1 INTRODUCTION AND BACKGROUND
1.1 Background and objectives
This study was carried out at the request of the European Commission as part of a
series of studies on 'Forward Visions on the European Research Area'.
After the approval by the Council and Parliament of the Seventh Framework
Programme for Research and Technological Development, the focus in European
research policymaking has shifted back to the idea of the European Research Area. A
Green Paper re-launching the debate on the issue has been published in 2007.
The idea of the European Research Area was launched in response to three perceived
S&T weaknesses:
insufficient funding of R&D,
lack of an environment to stimulate research and exploit results,
fragmented nature of activities and dispersal of resources.
In response, the European Research Area aimed for:
the creation of an 'internal market' in research, an area of free movement of
knowledge, researchers and technology, with the aim of increasing
cooperation, stimulating competition and achieving better allocation of
resources,
a restructuring of the European research fabric, in particular by improved
coordination of national research activities and policies, which account for
most of the research carried out and financed in Europe,
the development of a European research policy which not only addresses the
funding of research activities, but also takes account of all relevant aspects of
other EU and national policies.
One of the core assumptions underlying the ERA idea appears to be that economies of
scale and scope are very important in research funding and execution, implying
therefore that coordination and collaboration in research funding and execution are
beneficial, while fragmentation and dispersal are inefficient.
Because of insufficient empirical foundation in the relevant literature, this assumption
remained largely to be validated. The purpose of this series of studies has been to start
filling those gaps and obtain much better insight into when and where in research
economies of scale and scope matter.
The objective of the Erascope study therefore was to assess whether economies of
scale exist at the research project level. The assumption underlying European Union

9
research policy is that such economies exist, hence the emphasis placed on the 'critical
mass' of R&D projects. Yet till today and despite repeated rounds of policy
discussions centred on this notion, critical mass remains a poorly defined notion. At
the project level it tends to be interpreted mainly in terms of bringing together more
and more players and pooling their resources.
The 2002 follow-up Commission Communication on ERA described how FP6 was
specifically designed and formulated to help achieve the ERA, and how this had been
done through, among other mechanisms, 'new support instruments which will make it
possible to build up critical masses of resources (NoEs and IPs)'.
Some Framework Programme ex-post evaluation studies, based on anecdotal evidence
however, have suggested that larger-scale projects under FP6 have not always had the
expected impacts on efficiency and effectiveness. Hence, to arrive at a better
understanding and to aid evidence-based policymaking in this field in the future, it is
important to develop a structured, methodologically robust analysis of these issues.
The concrete research questions to be answered in the context of this project were the
following:
Are larger research projects more productive in scientific and technological terms
than smaller research projects, after taking account of a number of control
variables into consideration? These control variables are:
o thematic priority, instrument, characteristics of the individual consortium
participants (sector, public/private, size, resources/capabilities, internal
organisation, objectives of the individual consortium participants, and type
of actor such as firm, university, research institute),
o project type and objectives (e.g. clear/unclear project objective,
radical/incremental, risky or not risky, product/process/technology
oriented, generic/specific),
o other consortium characteristics (e.g. history of cooperation between
consortium members, management issues, project-team dynamics such as
type of prime contractor, levels of communication, of coordination, of
cohesion, and of learning).
In reference to the first question, why is this or is this not the case? What can be
explanatory factors? In other words, under what conditions are larger research
projects more/less productive than smaller research projects?
As measures of the size of a research project the project budget, or the number of
partners participating in the project, or a combination of the two, is used. Scientific
productivity of a research project means the number and the impact of the scientific
publications it generates, and technological productivity means the number of patents,
tools, techniques, models, simulations, prototypes, demonstrators, pilots, etc.
The services requested in this study essentially comprise three sequential components:
(1) a literature overview, the development of a conceptual framework, and a sound
approach to data collection, (2) the collection of data, and (3) the analysis of data.
1.2 Study approach and implementation
The study has been implemented in three phases:

10
Preparatory analytical work: this phase included an extensive literature review
followed by the construction of an analytical framework and the definition of a
set of hypotheses. Intermediate results were presented in a workshop to the
High Level Advisory Group (HLAG)1. The HLAG gave extensive feedback
which was taken on board in the final versions of the framework and the
literature review. Chapter 2 describes both the literature review and the
analytical framework.
Data collection: the existing data collected in the Innovation Impact study2
were used as the basis for the selection of respondents and the optimisation of
the response, as well as for reuse as far as the new variables of Erascope
allowed it. An online questionnaire was implemented and respondents were
contacted by mail to participate in the survey. Other data were collected from
CORDIS and from EPO PATSTAT. The data were filtered and organised for
the third phase. Chapter 3 describes the data collection process in more detail.
Analyses: the third stage of the study included two different analyses, a
descriptive analysis and an econometric analysis. The HLAG reconvened to
examine the analyses and provide recommendations based on the intermediate
results. The feedback and comments were taken on board in the final round of
analyses. Chapter 4 explores the analyses in detail.
1 See Annex 1 for the composition of the HLAG
2
http://www.innovationimpact.org/joomla/result/innoimpact%20final%20report%20OPOCE%20NBNA23100ENC.

11
Figure 1: Erascope implementation provides a graphical overview of the
implementation of the study (following page).
Figure 1: Erascope implementation
1.3 Literature review and analytical framework
The main aim of the literature overview was to shed light on the relevance of scale
and scope in research, in general, and in collaborative R&D in particular. The
literature review thereby contributed to the development of the conceptual framework
and the empirical work performed in this study.
1.3.1 Economies of scale and scope in R&D
Vonortas (2009) discusses in detail the economies of scale and scope in research.
Scale effects may be present at several levels: the research project, the organisation,
the group of organisations (if cooperative project) and the geographical area (country,
region). The concept of returns to scale is used to describe what happens to output
when all inputs are increased together (by the same proportion) when a specific
technique is in place. An increase in all inputs resulting in a more than proportional
increase in research output indicates increasing returns to scale. Increases of the same
proportion means constant returns to scale. Research output which increases by a
smaller proportion than all of the research inputs results in decreasing returns to scale.
Economic theory offers three possible reasons for increasing returns to scale:
specialisation, dimensional effects and indivisibilities. Specialisation implies a finer
division of labour as the research project grows larger. Dimensional effects refer to
the case where a larger unit of capital produces disproportionately more than a smaller

12
unit. Indivisibilities exist when certain inputs are available only in certain minimum
sizes: larger research scales may utilise such inputs more efficiently. For instance,
professional management or large physical infrastructure could be such an input. On
the other hand, the prevailing reason for decreasing returns is the coordination and
control complications of large size operations.
Under the assumption that all inputs are in perfectly elastic supply to the organisation,
then the scale effects above translate into cost effects: increasing returns are reflected
in economies of scale – decreasing long-term average cost – whereas decreasing
returns to scale are reflected into diseconomies of scale – increasing long-term
average cost.
On the other hand, economies of scope are present when the same one research
operation deals with several subjects because of cost advantages. Economies of scope
in research may result in situations where several research projects involve at least
some of the same management and S&T knowledge, skills and capital equipment,
thus allowing for cross-fertilisation and productive exchange. In research projects,
economies of scope may arise due to the increasing complexity of the research
endeavour and the formation of an interdisciplinary team with complementary
knowledge assets.
While scale and scope effects may be theoretically discussed separately, in practice
they frequently occur simultaneously and are difficult to distinguish empirically.
Overall, it should be noted that empirical findings regarding the influence of scale
economies on R&D performance are mixed (Cohen and Levin, 1989; Patel and Pavitt,
1995). Some researchers note that these inconsistent findings result from the difficulty
to separate in practice scale and scope and to do so in different
industrial/technological environments. While the two concepts are conceptually
distinct, there is a lack of sufficiently detailed data to distinguish between various
measures of scale and scope and empirically test the effect on R&D project
performance (Henderson and Cockburn, 1996).
1.3.2 Economies of scale and scope in Collaborative
R&D
An important limitation of the classic discussion on scale and scope effects in research
for today's environment is the concentration on individual organisations. This
contrasts with one of the most striking features of industrial innovation today, namely
that only a small minority of firms can innovate alone. Adapting to an environment of
high risks, global competition, increasing complexity of technological advances, and
rapid generation and diffusion of technical knowledge and know-how, a large number
of firms have opted for cooperative relations. In the presence of technological
development that involves a greater array of product and process systems, subsystems,
and components, no single firm can deploy all of the requisite capabilities and assets
at a reasonable cost. In this context, a network can serve as a locus for innovation
because, for any network member, it provides timely access to external knowledge
and resources that are otherwise unavailable, while also testing internal expertise and
learning abilities (Powell et al., 1996). Linkages within innovation networks are very
complex, involving not only diverse kinds of formal contracts, but also informal
exchanges of knowledge, thus increasing opportunities for knowledge transmission.
13
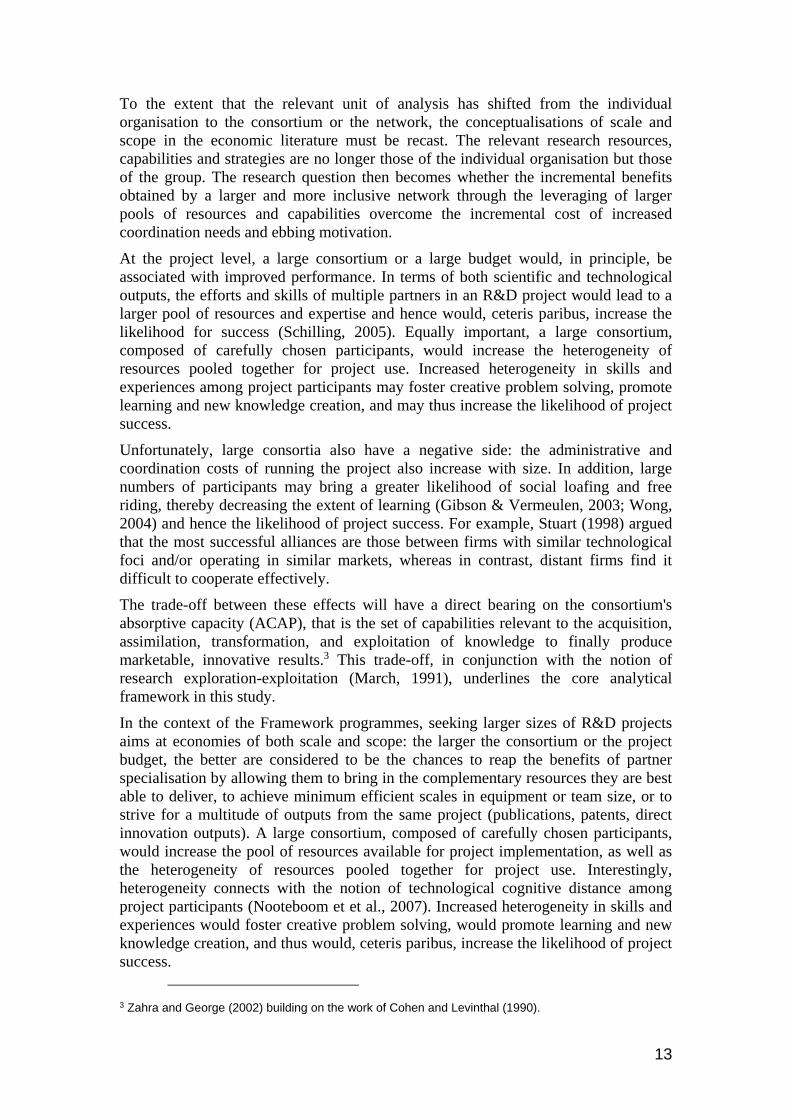
To the extent that the relevant unit of analysis has shifted from the individual
organisation to the consortium or the network, the conceptualisations of scale and
scope in the economic literature must be recast. The relevant research resources,
capabilities and strategies are no longer those of the individual organisation but those
of the group. The research question then becomes whether the incremental benefits
obtained by a larger and more inclusive network through the leveraging of larger
pools of resources and capabilities overcome the incremental cost of increased
coordination needs and ebbing motivation.
At the project level, a large consortium or a large budget would, in principle, be
associated with improved performance. In terms of both scientific and technological
outputs, the efforts and skills of multiple partners in an R&D project would lead to a
larger pool of resources and expertise and hence would, ceteris paribus, increase the
likelihood for success (Schilling, 2005). Equally important, a large consortium,
composed of carefully chosen participants, would increase the heterogeneity of
resources pooled together for project use. Increased heterogeneity in skills and
experiences among project participants may foster creative problem solving, promote
learning and new knowledge creation, and may thus increase the likelihood of project
success.
Unfortunately, large consortia also have a negative side: the administrative and
coordination costs of running the project also increase with size. In addition, large
numbers of participants may bring a greater likelihood of social loafing and free
riding, thereby decreasing the extent of learning (Gibson & Vermeulen, 2003; Wong,
2004) and hence the likelihood of project success. For example, Stuart (1998) argued
that the most successful alliances are those between firms with similar technological
foci and/or operating in similar markets, whereas in contrast, distant firms find it
difficult to cooperate effectively.
The trade-off between these effects will have a direct bearing on the consortium's
absorptive capacity (ACAP), that is the set of capabilities relevant to the acquisition,
assimilation, transformation, and exploitation of knowledge to finally produce
marketable, innovative results.3 This trade-off, in conjunction with the notion of
research exploration-exploitation (March, 1991), underlines the core analytical
framework in this study.
In the context of the Framework programmes, seeking larger sizes of R&D projects
aims at economies of both scale and scope: the larger the consortium or the project
budget, the better are considered to be the chances to reap the benefits of partner
specialisation by allowing them to bring in the complementary resources they are best
able to deliver, to achieve minimum efficient scales in equipment or team size, or to
strive for a multitude of outputs from the same project (publications, patents, direct
innovation outputs). A large consortium, composed of carefully chosen participants,
would increase the pool of resources available for project implementation, as well as
the heterogeneity of resources pooled together for project use. Interestingly,
heterogeneity connects with the notion of technological cognitive distance among
project participants (Nooteboom et et al., 2007). Increased heterogeneity in skills and
experiences would foster creative problem solving, would promote learning and new
knowledge creation, and thus would, ceteris paribus, increase the likelihood of project
success.
3 Zahra and George (2002) building on the work of Cohen and Levinthal (1990).
14
The research question then becomes whether the incremental benefits obtained by a
larger and more inclusive network through the leveraging of larger pools of resources
and capabilities overcome the incremental cost of increased coordination needs and
ebbing motivation.
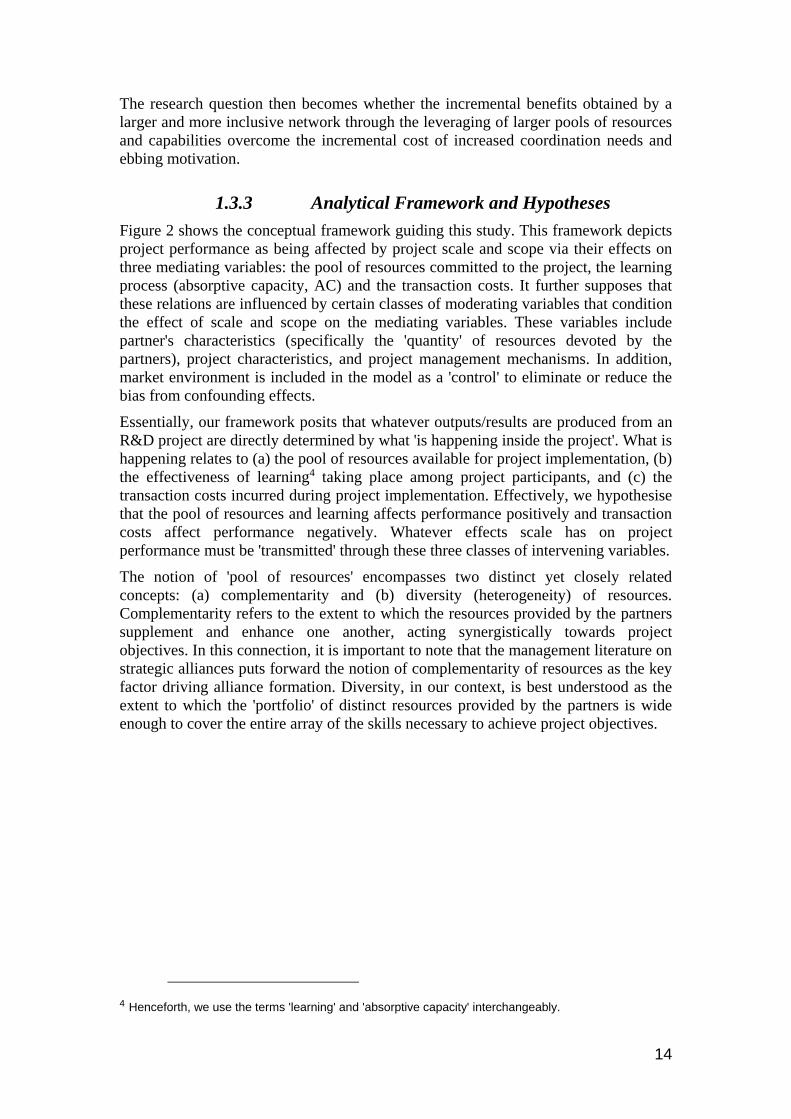
1.3.3 Analytical Framework and Hypotheses
Figure 2 shows the conceptual framework guiding this study. This framework depicts
project performance as being affected by project scale and scope via their effects on
three mediating variables: the pool of resources committed to the project, the learning
process (absorptive capacity, AC) and the transaction costs. It further supposes that
these relations are influenced by certain classes of moderating variables that condition
the effect of scale and scope on the mediating variables. These variables include
partner's characteristics (specifically the 'quantity' of resources devoted by the
partners), project characteristics, and project management mechanisms. In addition,
market environment is included in the model as a 'control' to eliminate or reduce the
bias from confounding effects.
Essentially, our framework posits that whatever outputs/results are produced from an
R&D project are directly determined by what 'is happening inside the project'. What is
happening relates to (a) the pool of resources available for project implementation, (b)
the effectiveness of learning4 taking place among project participants, and (c) the
transaction costs incurred during project implementation. Effectively, we hypothesise
that the pool of resources and learning affects performance positively and transaction
costs affect performance negatively. Whatever effects scale has on project
performance must be 'transmitted' through these three classes of intervening variables.
The notion of 'pool of resources' encompasses two distinct yet closely related
concepts: (a) complementarity and (b) diversity (heterogeneity) of resources.
Complementarity refers to the extent to which the resources provided by the partners
supplement and enhance one another, acting synergistically towards project
objectives. In this connection, it is important to note that the management literature on
strategic alliances puts forward the notion of complementarity of resources as the key
factor driving alliance formation. Diversity, in our context, is best understood as the
extent to which the 'portfolio' of distinct resources provided by the partners is wide
enough to cover the entire array of the skills necessary to achieve project objectives.
4 Henceforth, we use the terms 'learning' and 'absorptive capacity' interchangeably.

15
Figure 2: Analytical framework
The two concepts are (intuitively) closely related, but not necessarily identical. One
can easily think of a situation where partners provide complementary resources,
which nevertheless do not cover the entire spectrum of requisite skills for successful
project implementation.
Absorptive capacity according to Cohen and Levinthal (1990) refers to a firm's
capacity to value external information, assimilate and apply it to commercial ends.
The concept was taken up by a number of researchers and used in a variety of
empirical settings, including the study of strategic alliances. The basic rationale is that
the effectiveness of any inter-organisational arrangement (such as collaborative R&D)
is basically a function of the quality of learning taking place among the partners. In
our context, this means that since R&D projects are essentially striving to create new
knowledge, success is inherently dependent on the effectiveness of learning within the
consortium (i.e. the degree to which partners are capable of acquiring knowledge from
one another and from external sources, to assimilate, and combine it in order to create
new knowledge).
Transaction costs refer to the (inevitable) problems encountered by the partners during
project implementation. The quid pro quo among partners inevitably brings with it
problems in the coordination of activities, resulting from possible hidden agendas, a
reluctance to reveal valuable information, potentially contradictory objectives, and so
forth. Obviously, these problems work in the direction of making project success
more difficult to achieve.
It is clear that these three classes of intervening variables are not independent from
one another. In fact, it would be reasonable to argue that the pool of resources and the
transaction costs influence directly, and in opposing directions, the effectiveness of
Output Scope
Scale
- # of partners
- project budget
Scope
-diversity of activities
(vertical)
-number of subprojects
(horizontal)
Pool of
Resources
-“Large”
- “Heterogeneous”
Transaction
costs
Administrative
Coordination
Partners’ Characteristics (strategy,
objectives, technological and other resources
and experiences, etc)
Industry & Market environment
/Appropriability Regimes
Project Characteristics (degree of technical
& commercial risk; built on past R&D; etc)
&
Project Management (e.g., communication,
coordination, trust, leadership, etc)
Exploitation
Private returns
Social returns (i.e.
knowledge spillovers)
Project Performance
Learning
process
MEDIATING EFFECTS
MODERATING EFFECTS
MODERATING EFFECTS

16
learning in the consortium. Specifically, it seems reasonable to expect that the higher
the complementarity and diversity of resources, the more effective the absorptive
capacity of the consortium, as partners will have more and a wider array of skills to
share and synthesise in their quest to produce new knowledge. A possible counter-
argument here could be that as diversity (but not complementarities) increases, the
more difficult it is for partners to assimilate know-how from one another, and
consequently the more difficult it is for them to synthesise the bits and pieces into new
knowledge. Even though this is a serious point, one could argue that 'excessive'
diversity among partners would adversely affect learning through higher transaction
costs. In other words, any negative effects of diversity on learning would result from
transaction costs incurred precisely because of excessive diversity. It is only logical to
assume that high diversity, produced for example from widely different skills and
experiences among partners, will result in more difficulties in coordination, in
disparate objectives, etc. and hence in higher transaction costs. As for the latter, there
would be little doubt that the higher the transaction costs incurred by the partners, the
less likely the successful production of new knowledge.
In our conceptual framework, however, we do not model such effects among the
mediating variables. Doing so would complicate considerably the empirical analyses
in an already complicated framework, since we would need to estimate an even more
complex set of relations among the variables of interest. Instead, and given that our
primary interest is in the effects of scale, we prefer to make the simplifying
assumption that the three 'mediators' are correlated, without paying explicit attention
to the structural effects governing their inter-relations. Note however that we
hypothesise differential effects of scale on performance transmitted through the
mediators, as explained below.
Our primary interest is in estimating the effects of scale, which are assumed to pass
through the intervening variables. We expect that scale will affect all three types of
mediating variables positively (in a statistical sense). Put differently, we build our
conceptual framework on the premise that as scale becomes larger, this will, ceteris
paribus, (a) increase the complementarity and diversity of resources, (b) will increase
learning, and (c) will increase transaction costs. Points (a) and (c) seem reasonable to
hypothesise. There is little doubt that as scale becomes larger, this results in
potentially more complementary resources and a more diverse set of skills and
experiences for project implementation. Similarly, as the scale of the project becomes
larger, particularly in terms of the number of participants, the greater the likelihood of
problems among partners. For example, it is more difficult for a large number of
project participants to coordinate activities among themselves. Similarly, it is more
difficult, ceteris paribus, to align motives and objectives driving their participation in
the project. Even though this is not necessarily so, greater numbers bring – all else
being equal – the likelihood of widely differing agendas that may make such an
alignment a difficult task.
In contrast, point (b) deserves more attention. The hypothesis that scale increases
learning follows from the assumption that, as scale becomes larger, it is more likely
that the partners will have more resources to share, combine, and synthesise in order
to produce new knowledge. The counter-argument is, of course, that as scale increases
so does the likelihood of friction and higher transaction costs among the partners, and
consequently it will be less (not more) learning taking place. But these arguments
bring us back to the point noted just above: learning is positively affected by
complementarity and diversity of resources, and negatively affected by transaction

17
costs, and it is through them that scale affects learning. Hence, we admit that the
hypothesis of a direct positive influence of scale on learning is a simplification of an
otherwise more complex relation; it would be more defensible to hypothesise that the
effect of scale on learning is mediated: positively by the pool of resources and
negatively by transaction costs. But this, as already noted, would make our conceptual
framework too complex to test empirically. Hence, in what follows, we will present
the effects of scale on learning as if they were direct, even though we acknowledge
this to be a simplification of an otherwise much more complex relation.
Returning to our key question, the discussion thus far implies that we expect a mixture
of positive and negative indirect effects of scale on performance – effects that are
assumed to be mediated by the complementarity and diversity of the pool of
resources, learning, and transaction costs. Specifically, we expect two positive
indirect effects in the following causal chains: (a) scale complementarity and
diversity performance, (b) scale learning performance, and (c) a negative
indirect effect in the chain: scale transaction costs performance.
Finally, as shown in the Figure above, we also expect that these mediated effects may
be based conditionally on some moderator variables. Put differently, we hypothesise
that the effects of scale on the mediating variables may be moderated by such factors
as the 'quantity' of resources devoted by each partner, the characteristics of the project
per se, and the 'quality' of project management.
With regards to the 'quantity' of resources, we argue that if partners devote more
resources to the project, the positive effect of scale on the collective pool of resources
will be (quite obviously) higher. Within the same line of reasoning, this will also
increase the positive effect of scale on collective learning. In connection to transaction
costs, we expect that a high quantity of resources devoted by each partner will
decrease the positive (in the statistical sense) effect of scale, because in such
circumstances the partners will have more stakes invested in project success and
hence more to lose if things go wrong because of transaction costs.
Similar arguments can be put forward as to the moderating effects of project
management 'quality'. We expect that the effects of scale on the collective pool of
resources and on learning will be higher in a well managed project. Conversely, the
positive (in a statistical sense) effects of scale on transaction costs will be reduced by
effective project management.
With regards to the moderating effects of project characteristics, we expect that the
character of the project, such as its degree of scientific and commercial risk, whether
it is an entirely 'new area' project, and so forth, will naturally have bearing on how
scale affects the mediator variables. Because this is 'uncharted ground', we do not
posit specific hypotheses as to the direction of the moderating effects.
In our discussion above, we have referred to scale in an abstract manner. In our
empirical analyses, scale is operationalised by the number of partners in the
consortium and budget. (We also use the average budget per participant as an
alternative operationalisation). Admittedly, the arguments presented above make more
sense when we conceptualise scale through the number of partners, than when we use
budget. As an example, it is less clear whether a high budget leads to increased
transaction costs. As before, we prefer to leave the matter open for empirical
verification, and return to this issue in the discussion of results.

18
Based on these arguments we put forward the following (tentative) hypotheses to be
tested empirically:
Hypothesis 1: The effects of scale on project performance are mediated by (a)
complementarity and diversity in the collective pool of resources, (b)
absorptive capacity, and (c) transaction costs.
Hypothesis 2a: Scale affects positively all three mediator variables.
Hypothesis 2b: The positive effects of scale on all three mediator variables
will be moderated by: (a) the 'quantity' of resources by each partner, (b) the
'quality' of project management, and (c) by the characteristics of the project
per se.
Hypothesis 3a: Complementarity and diversity of resources affect positively
project performance.
Hypothesis 3b: Absorptive capacity affects positively project performance.
Hypothesis 3c: Transaction costs affect negatively project performance.

19
CHAPTER 2 DATA USED IN THE STUDY
2.1 Introduction
The study team aimed to leverage existing datasets to the extent possible as well as to
collect new data to allow analysis of all the variables of the conceptual model
presented in Chapter 2. After the construction of the analytical framework, an
assessment was made of sources to establish a basis of existing data. Three sources in
particular were considered to be of relevance:
Innovation Impact data (gained from the previous project 'The evaluation of
the impact on innovation of projects of Community Fifth and Sixth RTD
Framework Programmes'5) looking at the questions that corresponded to
variables of the Erascope study,
CORDIS for overall project and participant data such as type of instrument,
thematic area, project acronym and title, project budget, number of partners in
the project,
EPO PATSTAT data to add to the measures of output.
Data for the remainder of the variables were to be sought through the survey.
The following sections briefly outline the different data sources and how they were
used.
2.2 CORDIS data
CORDIS data were used in several steps of the process and to collect several sets of
data for the analytical work in the study. Since the initial sample was drawn from
Innovation Impact data, we used CORDIS data to identify additional partners and the
coordinators of the sampled projects.
Several variables from CORDIS were pre-entered into the survey (i.e. previously
known data did not have to be re entered) to facilitate survey response.
For analytical purposes, CORDIS data were used to calculate (average) consortium
sizes in terms of partners and budgets for the different instruments/thematic areas and
also to analyse potential bias and the representativeness of the data sample.
5
http://www.innovationimpact.org/joomla/result/innoimpact%20final%20report%20OPOCE%20NBNA23100ENC.
pdf online.
20
2.3 Data from the Innovation Impact Study
The Innovation Impact study designed an extensive questionnaire (40 questions with
240 sub-questions) aimed at identifying factors that had an impact on the results of
projects, especially their innovation output. The questionnaire included a large
number of questions on organisational and project characteristics.
CORDIS yielded the relevant project information (including type of instrument,
thematic area, project acronym and title, etc.) on all FP5 and FP6 projects. Including
activities to filter the CORDIS data and enhance the quality, the Innovation Impact
study collected over 8,200 responses from FP5 and FP6 projects, gathering a wide
variety of data which served as a major basis for the Erascope study..
2.4 Survey construction and implementation
The Erascope survey was developed and tested on the basis of the Conceptual
Framework presented in Chapter 2. Based on the framework, the Erascope survey
developed two questionnaires, for enterprises and research institutions respectively.
The questionnaire had nine sections. Each section was built through subjective and/or
objective measures. Some of them stemmed from the Innovation Impact study while
others represented scales from the literature or completely new scales developed for
the purposes of this study (such as learning processes). Extensive mapping between
extant data sources and the current survey was undertaken during the set up of the
questionnaires. Furthermore, responses from more partners per project were sought as
well as information from project coordinators while additional questions were added
to be answered only by the project coordinator. The following table illustrates in
greater detail the way we built the final questionnaire for the current study.
This approach allowed us to fully leverage the existing data and knowledge and
perform consistent statistical and econometric analyses.

21
Table 1: Sections of the questionnaire
Scales from Innovation
impact study
New scales for Erascope study
Section 1: Partner's Characteristics 1.1 Partner's Demographics
1.2 Innovation History
1.3 Cooperation History 1.4 Objectives/Motives
1.5 Innovation and Technology-related Capabilities
1.6 Complementary Assets
Section 2: Pool of Resources 2.1 Human Capital
Section 3: Project Management Mechanisms 3. Project Management Mechanisms
Section 4: Characteristics of the Project 4.1 Direct Assessment of Scale and
Scope
4.2 Assessment of project Characteristics 4.3 Past Research
4.4 Project Ambitions
Section 5: Objectives and Relations 5.1 Partners as Competitors 5.2 Project Objectives 5.3 Communication 5.4 Coordination 5.5 Trust
Section 6: Effectiveness of learning within the consortium 6.1 Learning Processes
Section 7: Industry and Market Environment 7.1 Environmental Uncertainty 7.2 Demand Conditions
Section 8: Project Results 8.1 Technical Goals 8.2 Knowledge-oriented, Technological
and Network-oriented Outputs
8.3 Knowledge-oriented, Technological and Network-oriented Impacts
8.4 Commercial Exploitation Outputs 8.5 Commercial Exploitation Impacts
Section 9: Coordinators' Section 9.1 SMEs in the Consortium 9.2 Patents and/or publications
The survey was implemented online and is accessible on the project website
(http://www.erascope.eu) while much attention was paid to user friendliness.

22
2.5 Sampling
To allow the full leverage of previously collected data and to enhance the return rate
and efficiency of the survey, the starting point of our sample was the set of
organisations that had answered the Innovation Impact questionnaire.
It was established in the Innovation Impact study that the data coverage was very
good and the surveyed sample of organisations representative of the whole population
of FP participants. In this regard our data collection strategy for Erascope was to re-
contact those organisations that had responded to the Innovation Impact study. The
responses from the Innovation Impact study were loaded into the online Erascope
questionnaire where the respondents were able to reconfirm or alter their earlier
responses to Innovation Impact questions as well as answer the new questions for the
current study.
From the 8,200 questionnaires received under Innovation Impact, we selected 2,921
respondents that represented projects for which more than 1 completed questionnaire
was received. The 2,921 participants represented 1,005 projects.
The second step was to identify the coordinators of the projects who were not already
present in the sample. Finally the remaining participants in these 1,005 projects were
identified, making up a total of 8,000 identified organisations to be contacted.
All these participants were first contacted by mail, including a letter from our team
and a recommendation letter from the Commission. Each prospective respondent
organisation was assigned a unique User ID and login to the survey.
The mailing was done in three batches in order to manage the response and the
helpdesk. The mailings went out between the beginning of October and mid
November 2009. The order began with the previous respondents, followed by the
coordinators and finally the other participants.
2.6 Response and data quality
The data collection period ran for 3.5 months. Of the 8,000 letters mailed out, around
15% were returned as undeliverable. The dedicated helpdesk answered around 250
queries, most queries related to access and to the User ID and password provided.
The responses received for the Erascope survey, amounted to a grand total of 1,172
responses, of which 422 (36%) were classified as enterprises and 750 (64%) as
research organisations.
The overall response rate to the survey was 14.7%. The response rate of the
coordinators was 16% and for the contractors 14.5%.
The number of responses per project varied from 1-7. Single-response projects were
the most frequent. The following pie chart presents a graphical representation of the
breakdown of projects on the basis of responses per project.
Concerning the data quality of the survey, the ratio of valid responses for both
questionnaires indicates good quality, as all variables had a valid result above 80%.
This confirmed the quality of the data collection process.

23
Figure 3: Number of responses per project
2.7 Representativeness of our sample
In this section of the report we analyse the representativeness of our sample. Of the
8,000 organisations that received the invitation to participate in the survey, 1,172
responses were returned. The participation in the survey was voluntary and the
respondents received guarantees that their individual replies would be treated
confidentially, for research purposes only. Here it must be stated that the total
population comprises partners from small and large consortia, but that the sample is
more likely to randomly pick up partners from larger ones, since the number of such
partners is (necessarily) larger than the number of partners from smaller ones.
With 49% of responses from FP5 participants and 51% from FP6 participants, the
sample shows an almost equal distribution among FP5 and FP6 projects. Additionally,
the overall representativeness per Thematic Area and per theme is high across the
board.
A summary of the difference between the FP5 and FP6 total population and actual
response samples are presented in the tables below.
Table 2: Difference between FP5 total population and the Erascope actual
response sample
Participants EESD GROWTH HUMAN POTENTIAL IST
LIFE QUALITY
Grand Total
CRS -1.05% 3.17% 0.00% -0.37% 0.66% 2.41%
CSC 2.48% 7.56% 0.19% -2.98% -4.40% 2.84%
THN 0.43% -1.79% -1.74% -0.87% -1.29% -5.25%
Grand Total 1.86% 8.94% -1.55% -4.22% -5.03% 0.00%

24
Table 3: Difference FP6 total population and the Erascope actual response
sample
Participants
FP6-
AEROSPACE
FP6-
CITIZENS
FP6-
FOOD
FP6-
IST
FP6-
LIFESCIHEALTH
FP6-
NMP
FP6-
SUSTDEV
Grand
Total
IP 1.49% -0.84% 3.27% -3.76% -2.30% 8.81% 4.00% 10.68%
NoE -0.19% -0.05% 1.68% -2.12% -0.24% 1.82% -0.04% 0.86%
STREP -0.45% 0.52% 1.72% -9.26% -3.41% -0.44% -0.23%
-
11.54%
Grand Total 0.85% -0.36% 6.67% -15.14% -5.94% 10.20% 3.73% 0.00%
Generally speaking, the straightforward way to correct oversampling is through
weighting. Nevertheless, weighting changes the point estimates and the confidence
intervals, rendering the latter wider. This means that weighting tends to reduce the
number of statistically significant relations.
Again, however, it is worth noting that we need to do that only if we suspect that
partners participating in certain types of projects (e.g. FP5 – Growth) are over-
represented relative to the true proportion of such partners in the population. Yet, in
this case and based on the tables above it can be concluded that the participants in our
sample reasonably (with a margin of ±10%) represent the population proportions.
2.8 EPO data
The conceptual model of the current study is largely operationalised through
subjective measures like Likert scale items that were extracted or developed after
extensive literature review. In addition to subjective measures of project success, we
aimed to capture project outputs also through objective measures such as patents and
publications. As these can only be collected at project level (and not at respondents
level for individual organisations), we asked project coordinators for the number of
patents and a count of publications of the projects. However the level of response
received was insufficient, as many coordinators did not provide this information and
the answers could not be considered as completely covering the project output.
The study team decided to try to remedy the lack of output data by extracting relevant
data from the European Patent Office (EPO) PATSTAT database.
The approach followed involved three major steps. The first was to process each
organisation's name and to identify the participants in the survey in the Patstat
database. For this purpose we used the standard name attributed to applicant and
inventor names for inclusion in the DOCDB (EPO master documentation database)
and performed a manual check of the organisation names of survey respondents
against the database.
The second step was to relate the projects in our survey to the International Patent
Classification (IPC). We used an online tool of the World Intellectual Property
Organisation (WIPO), designed to help classify patents at IPC subclass level. For the
categorisation we used the project title as a quote and formulated a list of IPC subclass
levels used in our queries in order to identify patents in the same field by the project
participants.

25
We are aware of the attribution problem here: a patent obtained by an organisation in
the same field in the same period is not necessarily the outcome of an FP project this
organisation participated in. However, we considered patents in the same field by
research project participants for the respective time period to be a reasonable
approximation for technological outputs associated with a specific strand of research
activities.
The third step was to actually run the queries individually for each organisation and
for the technologies we had identified for the project the organisation participated in.
For each query, we implemented a time filter so as to search for any potential patents
in the five years before the project, for the duration of the project and in the five years
after the end of the project. The number of patents identified for each period was used
for further analysis.
Although the results of the method proved accurate, the use of the results was very
limited, as only a very small and insignificant number of attributable patents came out
of the analysis and they had no impact on the results of the study.

26
CHAPTER 3 ECONOMIES OF SCALE AND SCOPE IN
R&D PROJECTS
3.1 Descriptive analysis
3.1.1 Introduction
This chapter provides an explorative analysis of the dataset on collaborative FP5 and
FP6 projects.
In a first step we describe distinct patterns of the dataset obtained by the survey.
These allow us to portray the coverage of thematic areas, the funding provided by the
different thematic areas, the coverage of different funding instruments and its funding.
In a second step we provide a first insight into the core research question of this study,
i.e. to assess to which extent the size of publicly funded collaborative R&D projects
affects its outcome. Based upon the survey results the descriptive statistics illustrate in
particular whether there are differences regarding:
scientific, technological and economic performance patterns,
mediating variables which facilitate project success (i.e. the learning capacity/
absorptive capacity, transaction costs and complementarity of resources),
characteristics of the project partners,
project profiles vis á vis typical internal projects.
In pursuing the analysis we consider that project size may be measured by different
variables such as:
number of project participants respectively organisations,
total budget of the collaborative research endeavour
funding per participant.
While the number of project participants and the total budget reflect the absolute size
of the research project, the funding per participant reflects the hypothesis that the
success of a research project may not only depend on the absolute size of a research
project but also on the individual funding each partner receives. Hence, the
descriptive analysis differentiates between the absolute and the relative project size:
The absolute project size in the following analysis is mostly measured by the
total number of project participants. The total budget of the collaborative
research project is portrayed only in a few parts of the descriptive analysis as
we did not observe considerable differences regarding project performance
measured by the number of project participants versus the total funding.

27
The relative project size is measured via the average funding per project
participant. As the project database did not provide information on the
individual funding per participant, the average funding per participant (total
funding divided by the number of partners) is the only available measure to
estimate the project size at the participant level.
3.1.2 Overview of the sample data
The sample retrieved through the online survey contained a total of 1172
observations. 750 observations (64%) stemmed from Research Organisations and 422
(36%) from private enterprises. These corresponded to 676 collaborative R&D
projects of which 328 projects had more than two responses. With 49% of responses
from FP5 participants and 51% from FP6 participants, the sample showed an almost
equal distribution among FP5 and FP6 projects.
3.1.2.1 Coverage of different thematic areas
Both FP5 and FP6 contained programmes which covered different thematic areas. The
thematic programmes of FP5 as outlined in CORDIS6 were:
Quality of life and management of living resources: Key objectives of this
thematic area are to link the ability to discover with the ability to produce, in
order to address the needs of society and to meet consumer requirements. This
will lead to future wealth and job creation and improvements in the state of the
environment. Activities under the programme focus on specific areas where
growing knowledge potentially contains technical answers to some of the
pressing questions posed by European citizens, whilst respecting fundamental
ethical values.
User-friendly information society: Key objectives of this thematic area are to
realise the benefits of the information society for Europe both by accelerating
its emergence and by ensuring that the needs of individuals and enterprises are
met. The programme's interrelated research objectives focus on the technology
developments of the information society and enable the close articulation
between research and policy needed for a coherent and inclusive information
society.
Competitive and sustainable growth: Key objectives are to support research
activities contributing to competitiveness and sustainability, particularly where
these two objectives interact. Industry's role will not only be to identify areas
for collaboration but also to bring together and integrate projects, especially
cross-sectoral projects along the value chain, so that technology uptake and
innovation are more effectively ensured across Europe.
Energy, environment and sustainable development: Key objectives are to
contribute to sustainable development by focusing on key activities crucial for
social well-being and economic competitiveness in Europe.
The thematic areas in FP6 as described in CORDIS7 are:
6 Source: http://cordis.europa.eu/fp5/src/struct.htm online. 7 Source: http://cordis.europa.eu/fp6/activities.htm online.

28
Life sciences, genomics and biotechnology for health: Key objectives are to
integrate post-genomic research into the more established biomedical and
biotechnological approaches. Involvement of key stakeholders e.g. industry,
healthcare providers and physicians, policymakers, regulatory authorities,
patient associations and experts on ethical matters.
Information society technologies: Key objectives are to contribute to European
policies for the knowledge society and the e-Europe Action Plan, medium and
long term RTD on the future generation of technologies integrating computers
and networks into everyday environment, placing the individual at the centre.
Nanotechnologies and nanosciences, knowledge-based multifunctional
materials and new production processes and devices: Key objectives are to
contribute to the creation of the scientific base for the transition of European
production industry from resource-based towards knowledge-based, more
environment-friendly approaches.
Aeronautics and space: Key objectives are to strive towards higher levels of
technological excellence by consolidating and concentrating RTD efforts in
the context of the Advisory Council for Aeronautics Research in Europe and
the European Strategy for Space.
Food quality and safety: Key objectives are to assure health and wellbeing of
European citizens through a better understanding of the influence of food
intake and environmental factors on human health, providing safer, high-
quality and health-promoting food.
Sustainable development, global change and ecosystems: Key objectives are to
strengthen the S&T capacities needed for Europe to be able to implement a
sustainable development model in the short and in the long term, integrating
its social, economic and environmental dimensions, and contributing to
international efforts mitigating adverse trends in global change.
Citizens and governance in a knowledge-based society: Key objectives are to
provide a sound scientific base for the management of the transition towards a
European knowledge based society, conditioned by national, regional and
local policies and by decision making by individual citizens, families and
other societal units.
We have grouped thematic areas of FP5 and FP6 as follows:
Table 4: Mapping thematic areas
Thematic Area Growth FP5 Competitive and Sustainable Growth
FP6 Aeronautics and Space
FP6 Nanotechnologies and Nanosciences
Thematic Area Information
Society
FP5 User friendly information Society
FP6 Information society technologies
Thematic Area Life FP5 Quality of life and management of living
resources
FP6 Life sciences, genomics and biotechnology for
health
FP6 – Food quality and safety
29
Thematic Area Energy,
Environment and Sustainable
Development (EESD)
FP5 Energy, environment and sustainable
development
FP 6 Sustainable development global change and
ecosystems
FP6 Citizens and governance in a knowledge-based
society8
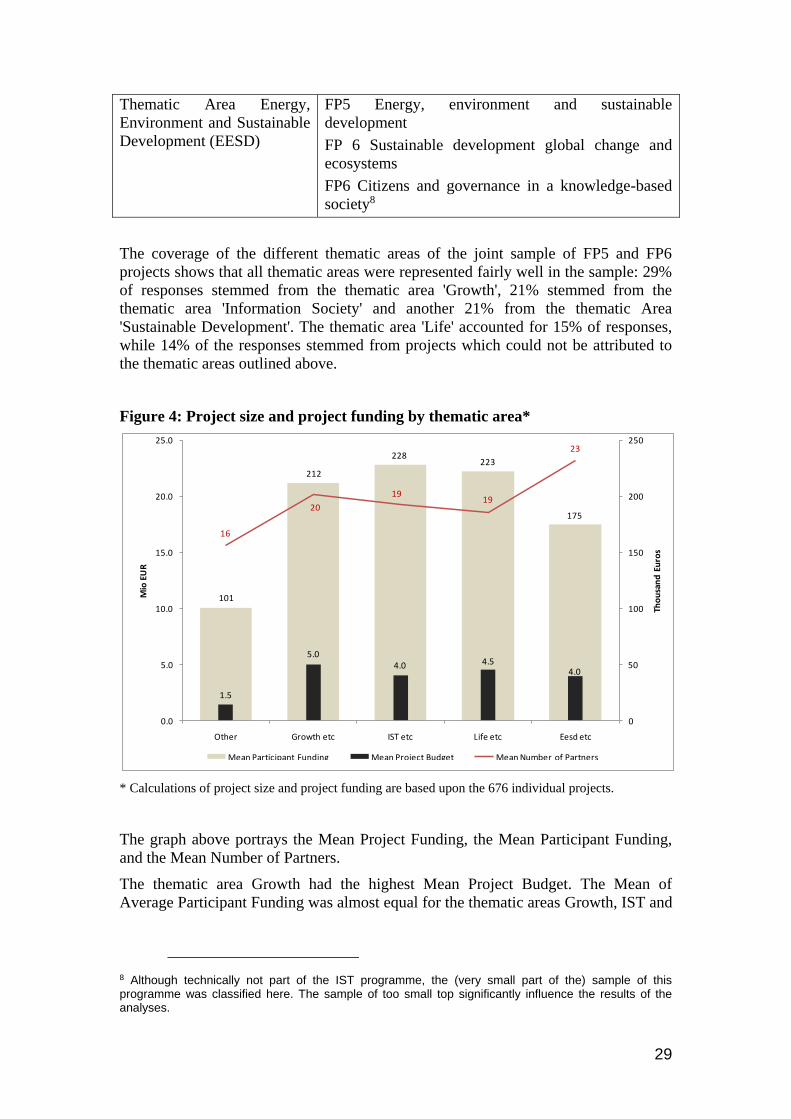
The coverage of the different thematic areas of the joint sample of FP5 and FP6
projects shows that all thematic areas were represented fairly well in the sample: 29%
of responses stemmed from the thematic area 'Growth', 21% stemmed from the
thematic area 'Information Society' and another 21% from the thematic Area
'Sustainable Development'. The thematic area 'Life' accounted for 15% of responses,
while 14% of the responses stemmed from projects which could not be attributed to
the thematic areas outlined above.
Figure 4: Project size and project funding by thematic area*
* Calculations of project size and project funding are based upon the 676 individual projects.
The graph above portrays the Mean Project Funding, the Mean Participant Funding,
and the Mean Number of Partners.
The thematic area Growth had the highest Mean Project Budget. The Mean of
Average Participant Funding was almost equal for the thematic areas Growth, IST and
8 Although technically not part of the IST programme, the (very small part of the) sample of this programme was classified here. The sample of too small top significantly influence the results of the analyses.
101
212
228223
175
1.5
5.04.0 4.5
4.0
16
20
1919
23
0.0
5.0
10.0
15.0
20.0
25.0
Other Growth etc IST etc Life etc Eesd etc
0
50
100
150
200
250
Mio
EU
R
Tho
usa
nd
Eu
ros
Mean Participant Funding Mean Project Budget Mean Number of Partners

30
Life. Due to the higher number of project partners, the Mean of Average Participant
Funding was considerable lower in the thematic area Eesd.
3.1.2.2 Funding instruments
The sample also contained a large variety of different funding instruments of FP5 and
FP6. There were 20% of the respondents who participated in Integrated Projects, 11%
in Network Projects (Networks of Excellence and Thematic Networks), and 10% of
respondents in Coordination Actions and Accompanying measures. The largest share
of projects consisted of Specific Targeted Research Projects (STREPS), Cooperative
research contracts (CRS) and Cost-sharing contracts (CSC) at 54%. Lastly, 5% of the
measures were funded via other funding instruments.
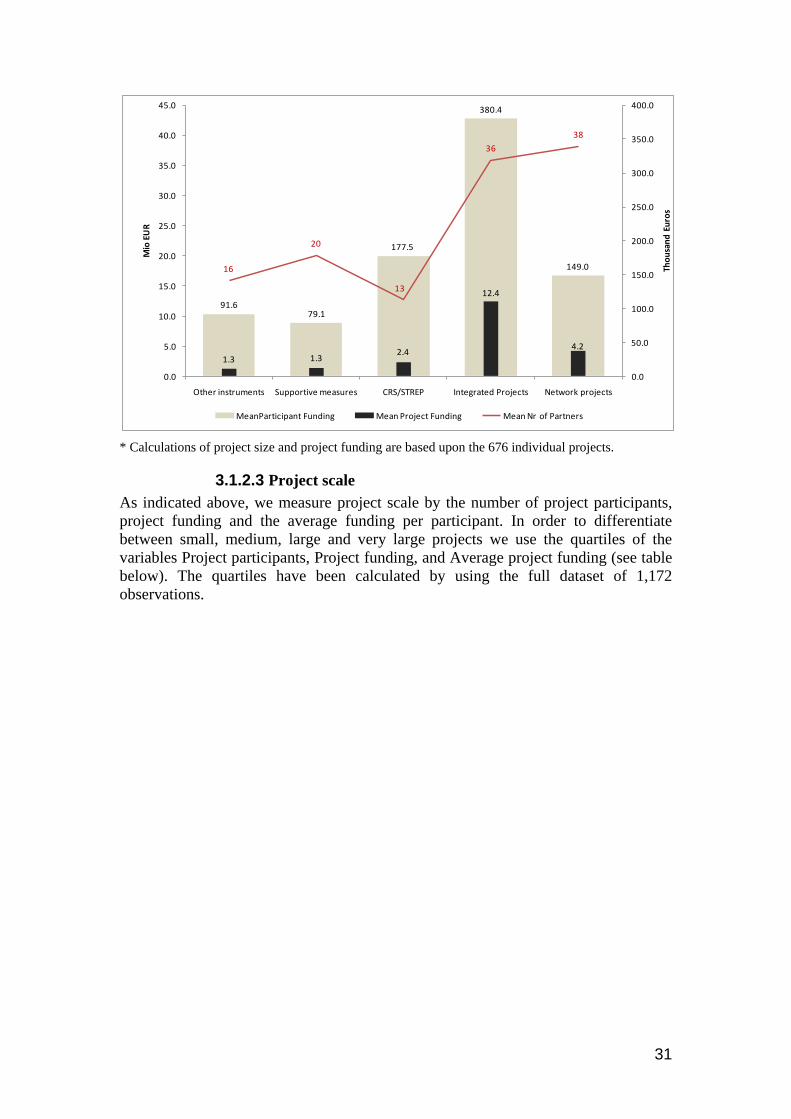
The graph below portrays the mean number of project partners, the mean project
funding and the mean average funding per participant for the different funding
instruments. In terms of number of partners, unsurprisingly, Integrated Projects and
Network Projects have the largest number of project participants. Integrated Projects
furthermore strike out in terms of total project funding and average funding per
participant: Total project funding is about five times higher than for CRS/STREPS
and average participant funding is more than twice the number of CRS/STREPS. This
means that Integrated Projects account for the majority of large scale projects in terms
of absolute project size and relative project size.
In terms of funding per participant STREPS and CRS in the range of network
projects, the total project budget of these projects is about 55% of the network
projects. Supportive measures and other instruments have on average more partners
than CRS and STREPS, but the data show that their funding is quite limited with
respect to total funding and funding per participant.
Figure 5: Project size and project funding by instrument
31
* Calculations of project size and project funding are based upon the 676 individual projects.
3.1.2.3 Project scale
As indicated above, we measure project scale by the number of project participants,
project funding and the average funding per participant. In order to differentiate
between small, medium, large and very large projects we use the quartiles of the
variables Project participants, Project funding, and Average project funding (see table
below). The quartiles have been calculated by using the full dataset of 1,172
observations.
91.679.1
177.5
380.4
149.0
1.3 1.32.4
12.4
4.2
16
20
13
36
38
0.0
5.0
10.0
15.0
20.0
25.0
30.0
35.0
40.0
45.0
Other instruments Supportive measures CRS/STREP Integrated Projects Network projects
0.0
50.0
100.0
150.0
200.0
250.0
300.0
350.0
400.0
Mio
EU
R
Tho
usa
nd
Eu
ros
MeanParticipant Funding Mean Project Funding Mean Nr of Partners

32
Table 5: Quartiles partners, project funding, and participant funding
Number of Partners Average Funding per Participant
Small Projects: <= 10 Low Funding: 0-88,276.52
Medium Projects: 11 – 16 Medium Funding: 88,276.53 – 156,250.00
Large Projects: 17 – 28 High Funding: 156,250.01 – 253,998.31
Very Large Projects: 29+ Very High Funding: 253,998.32 +
Total Project Funding
Low Total Funding: <= 1,102,230
Medium Total Funding: 1,102,231 – 2,036,195
High Total Funding: 2,035,196 – 5,056,304
Very High Total Funding: 5,056,305 +
Figure 6 seeks to portray the relation between project size (measured by the number
of participants) and project funding. We witness that large projects in the range of 17-
28 participants receive about the same average funding per participant as the very
large projects with 29 and more project participants. Hence, a larger number of
partners does not necessarily mean higher average funding per partner.
Figure 6: Funding by project size (number of partners)
* Calculations of project volume and participant funding are based upon the 676 individual projects.
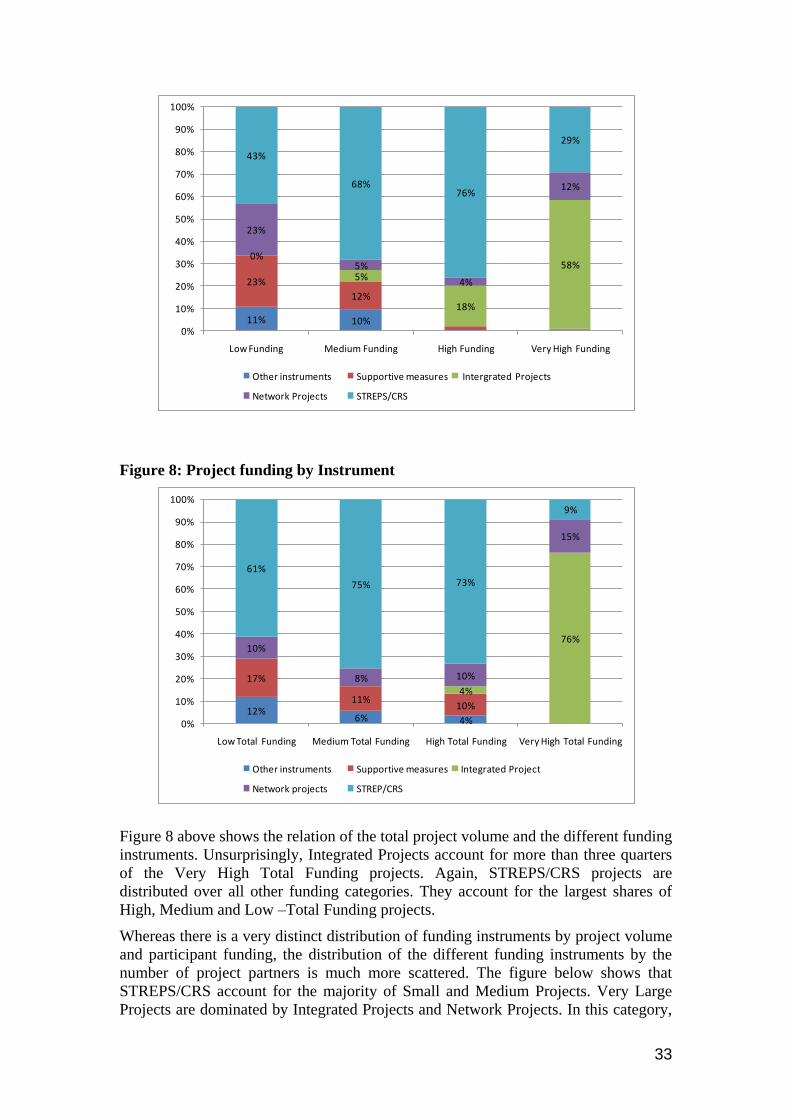
Figure 7 shows the relation of average participant funding and the different funding
instruments. Integrated Projects account for 58% of the Very High Funding projects
and 18% of the High Funding projects. STREPS/CRS projects account for 76% of the
High Funding projects and 29% of the Very High Funding projects. In addition,
STREPS/CRS projects also account for large shares of the Medium and Low funding
categories.
Figure 7: Average participant funding by instrument
182
163
222 220
1.4
2.1
4.9
9.6
0.0
2.0
4.0
6.0
8.0
10.0
12.0
Small Projects Medium Projects Large Projects Very Large Projects
0
50
100
150
200
250
Mio
EU
R
Tho
usa
nd
Eu
ros
Mean Participant Funding Mean Project Funding
33
Figure 8: Project funding by Instrument
Figure 8 above shows the relation of the total project volume and the different funding
instruments. Unsurprisingly, Integrated Projects account for more than three quarters
of the Very High Total Funding projects. Again, STREPS/CRS projects are
distributed over all other funding categories. They account for the largest shares of
High, Medium and Low –Total Funding projects.
Whereas there is a very distinct distribution of funding instruments by project volume
and participant funding, the distribution of the different funding instruments by the
number of project partners is much more scattered. The figure below shows that
STREPS/CRS account for the majority of Small and Medium Projects. Very Large
Projects are dominated by Integrated Projects and Network Projects. In this category,
11% 10%
23%
12%
0%
5%
18%
58%
23%
5%
4%
12%
43%
68%76%
29%
0%
10%
20%
30%
40%
50%
60%
70%
80%
90%
100%
Low Funding Medium Funding High Funding Very High Funding
Other instruments Supportive measures Intergrated Projects
Network Projects STREPS/CRS
12%6% 4%
17%
11%10%
4%
76%10%
8% 10%
15%
61%
75% 73%
9%
0%
10%
20%
30%
40%
50%
60%
70%
80%
90%
100%
Low Total Funding Medium Total Funding High Total Funding Very High Total Funding
Other instruments Supportive measures Integrated Project
Network projects STREP/CRS
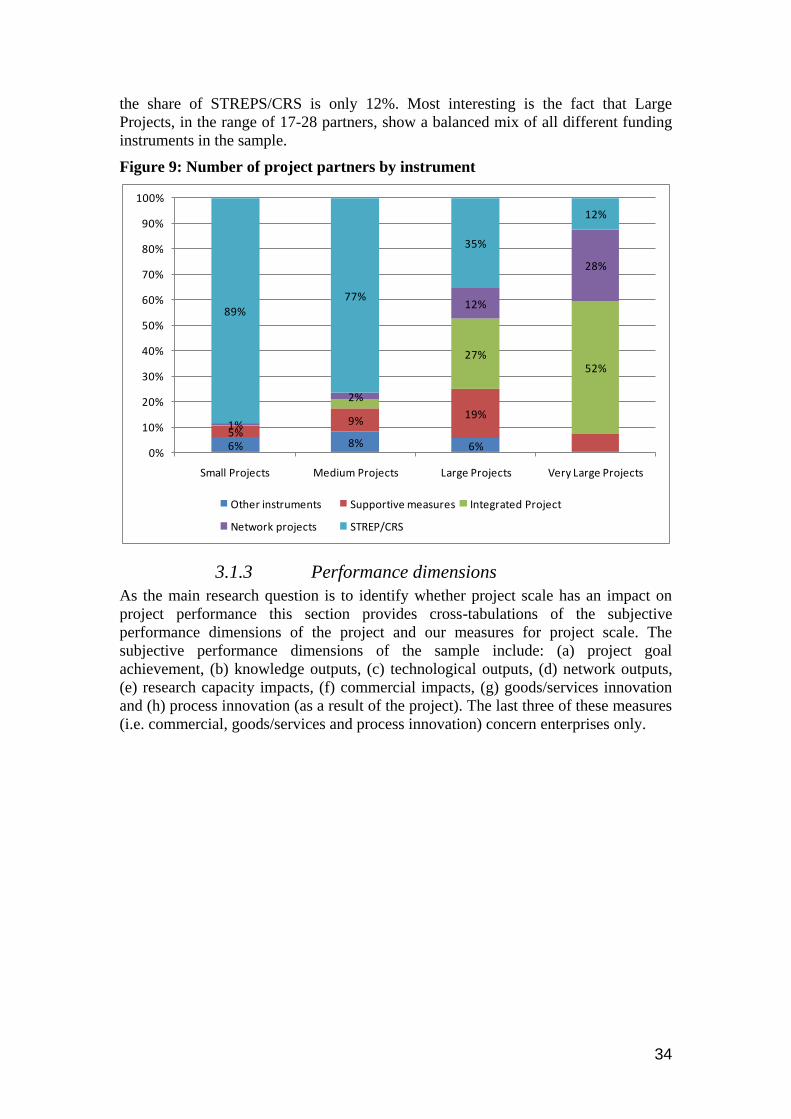
34
the share of STREPS/CRS is only 12%. Most interesting is the fact that Large
Projects, in the range of 17-28 partners, show a balanced mix of all different funding
instruments in the sample.
Figure 9: Number of project partners by instrument
3.1.3 Performance dimensions
As the main research question is to identify whether project scale has an impact on
project performance this section provides cross-tabulations of the subjective
performance dimensions of the project and our measures for project scale. The
subjective performance dimensions of the sample include: (a) project goal
achievement, (b) knowledge outputs, (c) technological outputs, (d) network outputs,
(e) research capacity impacts, (f) commercial impacts, (g) goods/services innovation
and (h) process innovation (as a result of the project). The last three of these measures
(i.e. commercial, goods/services and process innovation) concern enterprises only.
6% 8% 6%5%
9%19%
27%52%
1%
2%
12%
28%
89%
77%
35%
12%
0%
10%
20%
30%
40%
50%
60%
70%
80%
90%
100%
Small Projects Medium Projects Large Projects Very Large Projects
Other instruments Supportive measures Integrated Project
Network projects STREP/CRS

35
Figure 10: Performance dimensions by project size (by number of partners)
*indicating statistical significant differences of 10% level.
Figure 10 plots the results for the first six performance dimensions against the number
of project partners. As an overall observation we witness that Technological Outputs
and Networking Outputs are ranked higher than Knowledge Outputs, Research
Capacity Impacts and Commercial Outputs.
Taking into account project scale measured by the number of partners, we witness that
the number of project partners has no significant effects on Goal achievement,
Knowledge outputs and Technological outputs. For Networking outputs, Research
capacity impacts and Commercial impacts significant differences in project
performance exist. This is because Large Projects with 17-28 partners have
significantly higher Networking outputs than Small and Medium Projects,
significantly higher Research Capacity impacts than Medium and Very Large
Projects, and significantly higher Commercial impacts than Small Projects.
3.3
8
2.9
8
3.5
9
3.5
2
2.9
7
2.5
0
3.2
7
2.9
5
3.4
7
3.5
3
2.8
4
2.5
3
3.4
1
3.0
9
3.4
8 3.7
2
3.0
7
2.8
7
3.3
8
3.0
9
3.5
4
3.6
0
2.8
4
2.5
1
1.00
1.50
2.00
2.50
3.00
3.50
4.00
4.50
5.00
Goal achievement Knowledge outputs
Technological outputs
Networking outputs*
Research capacity impacts*
Commercial impacts*
1=
no
t si
gnif
ican
t 5
=h
igh
ly s
ign
ific
ant
Small Projects Medium Projects Large Projects Very Large Projects

36
Figure 11: Percentage of projects that realised product and process innovations
(by number of partners)
Regarding the introduction of new and/or improved products and services and new
and/or improved production processes however, the consortium size does not seem to
be a decisive factor: Very Large Projects seem to have slightly higher chances for
introducing new products and services but differences are not statistically significant.
As regards the introduction of new or improved production processes, Large Projects
seem to have a higher probability for introducing these types of innovations, but also
here differences are not statistically significant.
We may conclude that the absolute size of research projects has some effects on
project performance. The relation does not seem to be linear as Large Projects also
show higher performance levels than Very Large Projects, although differences are
only significant for the Performance Category Research Capacity Impacts.
When turning our attention to the relation between project performance and
participant funding (Figure 12), we witness an even stronger and most presumably
linear relation between project size and project performance. In particular, there seems
to be a positive correlation between individual level of funding on the one hand and
knowledge output, with technological output and research capacity impact on the
other. Projects with low levels of average funding per participant exhibit significantly
lower performance in these indicators than projects in the categories High Funding
and Very High Funding. Furthermore, there is also a positive correlation between
individual funding and the introduction of new or improved services and new or
improved production processes (Figure 13).
Figure 12: Performance dimensions by project size (by average partner funding)
77
%
36
%
74
%
37
%
76
%
42
%
83
%
33
%
0%
10%
20%
30%
40%
50%
60%
70%
80%
90%
New/improved products/services New/improved production processes
Small Projects Medium Projects Large Projects Very Large Projects
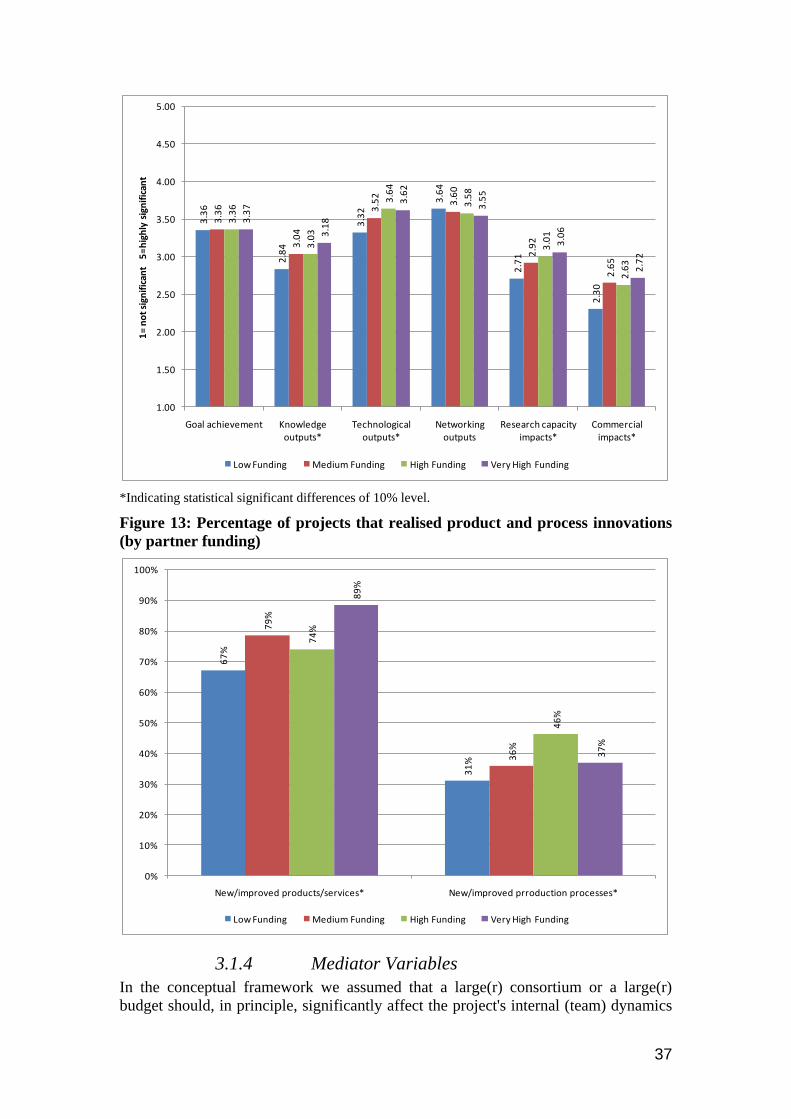
37
*Indicating statistical significant differences of 10% level.
Figure 13: Percentage of projects that realised product and process innovations
(by partner funding)
3.1.4 Mediator Variables
In the conceptual framework we assumed that a large(r) consortium or a large(r)
budget should, in principle, significantly affect the project's internal (team) dynamics
3.3
6
2.8
4
3.3
2
3.6
4
2.7
1
2.3
0
3.3
6
3.0
4
3.5
2
3.6
0
2.9
2
2.6
5
3.3
6
3.0
3
3.6
4
3.5
8
3.0
1
2.6
3
3.3
7
3.1
8
3.6
2
3.5
5
3.0
6
2.7
2
1.00
1.50
2.00
2.50
3.00
3.50
4.00
4.50
5.00
Goal achievement Knowledge outputs*
Technological outputs*
Networking outputs
Research capacity impacts*
Commercial impacts*
1=
no
t si
gnif
ican
t 5
=h
igh
ly s
ign
ific
ant
Low Funding Medium Funding High Funding Very High Funding
67
%
31
%
79
%
36
%
74
%
46
%
89
%
37
%
0%
10%
20%
30%
40%
50%
60%
70%
80%
90%
100%
New/improved products/services* New/improved prroduction processes*
Low Funding Medium Funding High Funding Very High Funding

38
and be strongly associated with performance. In terms of both scientific and
technological outputs, the efforts and skills of multiple (as opposed to just a few)
partners in an R&D project would lead to a larger pool of resources and expertise, and
hence would, ceteris paribus, increase the likelihood for success. At least equally (if
not more) important, a large consortium, composed of carefully chosen participants,
would increase the heterogeneity of resources pooled together for project use.
Increased heterogeneity in skills and experiences could foster creative problem
solving, be a source of learning and new knowledge creation, and thus could, ceteris
paribus, increase the likelihood of project success. Taken together, these effects
should have direct bearing on the consortium's absorptive capacity, and particularly
on the effectiveness of learning. Apart from these positive effects, a larger and more
heterogeneous pool of resources associated with large consortia size also increases the
transaction/coordination and administrative costs of running the project.
Based upon this, the following four mediator variables, which may be dependent on
project size and thus might indirectly translate size into effects on performance, have
been operationalised and used in the survey:
Complementarity of resources: The collective pool of resources made
available to the project by the partners (not the responding organisation – see
below) was measured in terms of the complementarities achieved among
partners. This variable is a Likert-type scale reflecting the extent of synergies
with respect to scientific, technical/engineering, and managerial skills and
assets.
Absorptive Capacity (AC): This is a construct assessing degree of knowledge
acquisition, assimilation, and integration resulting from the learning-related
activities among partners in the project.
Clarity of Objectives: This variable and Difficulties in Coordination (see
below), represent two dimensions of transaction costs incurred among partners
in the course of project implementation, as derived by the confirmatory factor
analysis of the original scale. This reflects the degree to which partners agree
that the project is characterised by clear and accepted objectives as well as by
a clear allocation of tasks. The scale was reverse-coded for the analysis to
depict the influence of Unclear Objectives.
Difficulties in Coordination: As above, this is a reverse-coded scale that
reflects the extent of difficulties in coordination among partners in terms of
information sharing, smooth planning of activities, efficiency of working
together, etc.
As the mediator variables relate to the absolute project size only, the variables are
plotted against the absolute project size in terms of number of partners and project
funding.
The descriptive statistics in Figure 14 show that no positive correlation between the
size of a research project and the variables absorptive capacity and resource
complementarity can be observed. However, as the theoretical framework suggests,
the project size seems to be negatively related with transaction costs: Small and
Medium sized projects have clearer objectives and less coordination difficulties than
very large projects.
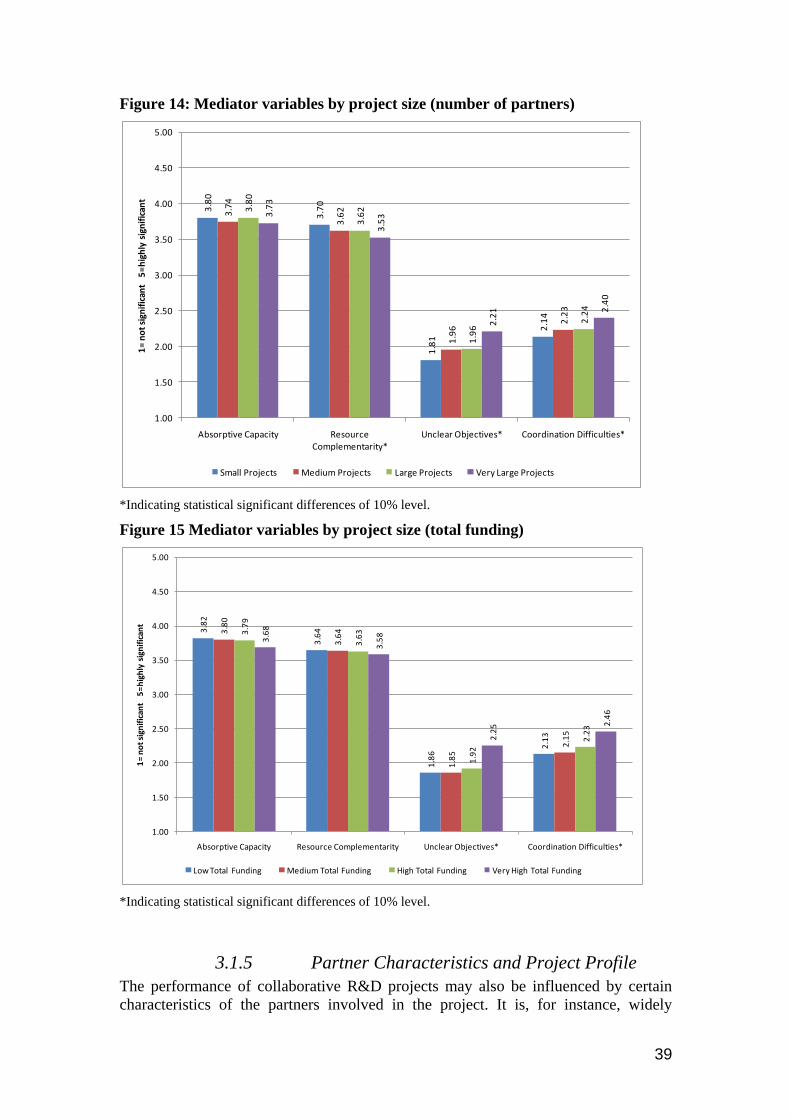
39
Figure 14: Mediator variables by project size (number of partners)
*Indicating statistical significant differences of 10% level.
Figure 15 Mediator variables by project size (total funding)
*Indicating statistical significant differences of 10% level.
3.1.5 Partner Characteristics and Project Profile
The performance of collaborative R&D projects may also be influenced by certain
characteristics of the partners involved in the project. It is, for instance, widely
3.8
0
3.7
0
1.8
1
2.1
4
3.7
4
3.6
2
1.9
6
2.2
3
3.8
0
3.6
2
1.9
6
2.2
4
3.7
3
3.5
3
2.2
1 2.4
0
1.00
1.50
2.00
2.50
3.00
3.50
4.00
4.50
5.00
Absorptive Capacity Resource Complementarity*
Unclear Objectives* Coordination Difficulties*
1=
no
t si
gnif
ican
t 5
=h
igh
ly s
ign
ific
ant
Small Projects Medium Projects Large Projects Very Large Projects
3.8
2
3.6
4
1.8
6
2.1
3
3.8
0
3.6
4
1.8
5
2.1
5
3.7
9
3.6
3
1.9
2
2.2
3
3.6
8
3.5
8
2.2
5 2.4
6
1.00
1.50
2.00
2.50
3.00
3.50
4.00
4.50
5.00
Absorptive Capacity Resource Complementarity Unclear Objectives* Coordination Difficulties*
1=
no
t si
gnif
ican
t 5
=h
igh
ly s
ign
ific
ant
Low Total Funding Medium Total Funding High Total Funding Very High Total Funding

40
acknowledged that R&D project performance (in terms of innovative output), as well
as partnership formation depend on distinct firm characteristics such as the size of the
firm and the sector affiliation. Partner characteristics considered in the literature
further include factors relating to the innovation and cooperation history and
capabilities, and factors relating to the motivation and objectives to participate in a
project. Project performance also needs to be controlled for certain characteristics of
the project, which may have an impact on types of output expected, and hence also
project performance. Possibilities to distinguish between different types of projects
are by type of R&D conducted, the level of risk associated with the project, and the
embeddedness of the project within the R&D strategies/activities of the consortium.
The following results of the survey present a selection of variables which reflect basic
characteristics of the responding organisation and qualitative characteristics of the
projects vis-à-vis a typical internal project. Variables which cover firm characteristics
are:
Size: This variable represents the size of the participant/project partner, as
reflected in the number of its employees. It is an ordinal measure, ranging
from 1-5, with higher values indicating larger size (e.g. 5 = 501+ employees).
Involvement in collaborative R&D: This variable measures the frequency of
participation in prior collaborative R&D projects. It reflects experience with
such projects. It is a Likert-type item, ranging from 1 (= never involved) to 5
(= involved in many projects).
R&D expenditures: An ordinal variable indicating the percentage of R&D
expenditure of total budget/revenue for the period just prior to the project. It
ranges from 1 (='no R&D) to 6 (= >10%).
Resource endowments: A Likert-type scale reflecting the firm's ability to
commercially exploit research results (i.e. ability to speedily introduce new
products, marketing skills in launching new products, etc.).
Figure 16 shows that there are only some links between distinct firm characteristics
and the probability to participate in larger or smaller projects. First, although not
statistically significant, there seems to be a relation between firm size and
participation in Very Large Projects. Second, firms that have been involved in
collaborative actions in the past have a higher tendency to be involved in very large
projects than small projects. Differences are, however, not statistically significant.

41
Figure 16: Firm characteristics by project size (number of partners)
When average participant funding is taken into account firm patterns are more
distinct. Project partners that participate in projects with very high and high average
participant funding have a significantly higher number of employees, and are more
often involved in collaborative actions. Furthermore their R&D intensity is
considerably higher. The commercial exploitation capacity does not vary with average
participant funding.
3.1
6
3.5
3
4.0
5
3.1
6
3.2
2
3.6
5
4.3
0
3.2
4
3.2
9
3.6
8
4.3
5
3.0
5
3.3
8
3.7
9
4.2
3
3.0
7
1.00
1.50
2.00
2.50
3.00
3.50
4.00
4.50
5.00
Number of employees Involvement in collaborative actions*
R&D intensity Resource Endowments
1=
no
t si
gnif
ican
t 5
=h
igh
ly s
ign
ific
ant
Small Projects Medium Projects Large Projects Very Large Projects

42
Figure 17: Firm characteristics by project size (participant funding)
As regards qualitative characteristics of the project the following variables have been
considered for the descriptive analysis:
Cost vis-à-vis an average project: A five-point Likert-type item, with high
values indicating high project costs in comparison to the responding
organisation's 'average' R&D project.
Scientific risk: As above, reflecting scientific risk in comparison to an
'average' project.
Commercial risk: As above, reflecting commercial risk.
Complexity: As above, reflecting the project's complexity.
Long term: As above, higher values point to a longer time horizon vis-à-vis an
'average R&D project'
Distance from core: As above, higher values point to a greater distance from
the partner's technological core area.
When project size is measured by the number of partners participating in a project, we
observe (compared with an internal project) that Very Large projects have
significantly higher project costs than Small- and Medium-sized projects. We
furthermore observe that projects with a large number of participants are significantly
less complex than Small, Medium and Very Large projects. Another interesting
observation is that there is a negative correlation between project size and commercial
risk.
Figure 18: Project profile vis-à-vis typical internal project (by number of
partners)
2.9
1
3.4
0
3.8
0
3.0
53.2
3
3.6
7
4.3
3
3.2
8
3.3
3
3.7
7
4.3
0
3.0
6
3.5
7 3.8
0
4.4
7
3.1
8
1.00
1.50
2.00
2.50
3.00
3.50
4.00
4.50
5.00
Number of employees* Involvement in collaborative actions*
R&D intensity* Resource Endowments
1=
low
5 =
hig
h
Low Funding Medium Funding High Funding Very High Funding

43
When average participant funding is taken into account, we witness an even clearer
relation between the size of a research project and the project profile compared to an
internal project. The figure below shows that average funding per partner is positively
correlated with project costs, scientific risk, commercial risk, complexity, and project
duration.
2.9
4 3.1
7
2.9
9
3.9
1
3.5
3
2.5
8
3.0
8 3.2
0
2.9
1
3.8
4
3.6
7
2.5
5
3.0
8
2.9
2
2.7
5
3.6
8
3.6
7
2.6
1
3.3
3
3.1
2
2.6
5
3.9
1
3.7
9
2.3
9
1.00
1.50
2.00
2.50
3.00
3.50
4.00
4.50
5.00
Project Costs* Scientific Risk* Commercial Risk* Complexity* Duration* Distance from Core Techn.Area
1=
no
t si
gnif
ican
t 5
=h
igh
ly s
ign
ific
ant
Small Projects Medium Projects Large Projects Very Large Projects
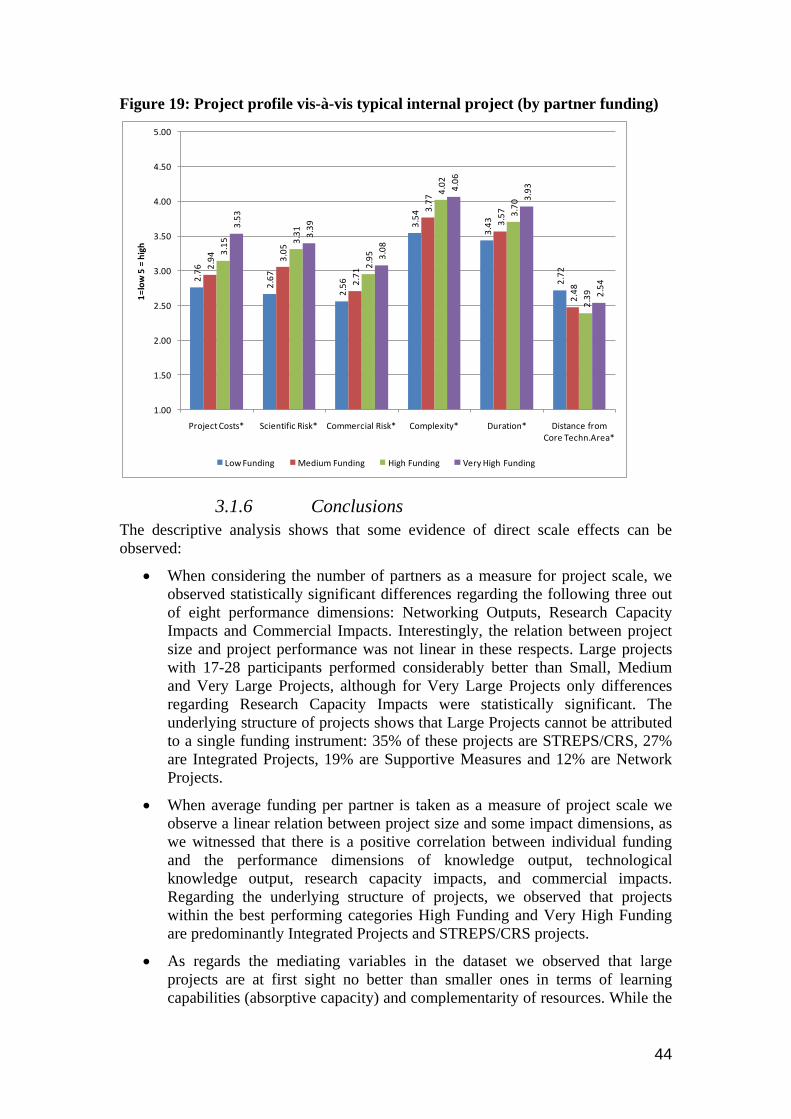
44
Figure 19: Project profile vis-à-vis typical internal project (by partner funding)
3.1.6 Conclusions
The descriptive analysis shows that some evidence of direct scale effects can be
observed:
When considering the number of partners as a measure for project scale, we
observed statistically significant differences regarding the following three out
of eight performance dimensions: Networking Outputs, Research Capacity
Impacts and Commercial Impacts. Interestingly, the relation between project
size and project performance was not linear in these respects. Large projects
with 17-28 participants performed considerably better than Small, Medium
and Very Large Projects, although for Very Large Projects only differences
regarding Research Capacity Impacts were statistically significant. The
underlying structure of projects shows that Large Projects cannot be attributed
to a single funding instrument: 35% of these projects are STREPS/CRS, 27%
are Integrated Projects, 19% are Supportive Measures and 12% are Network
Projects.
When average funding per partner is taken as a measure of project scale we
observe a linear relation between project size and some impact dimensions, as
we witnessed that there is a positive correlation between individual funding
and the performance dimensions of knowledge output, technological
knowledge output, research capacity impacts, and commercial impacts.
Regarding the underlying structure of projects, we observed that projects
within the best performing categories High Funding and Very High Funding
are predominantly Integrated Projects and STREPS/CRS projects.
As regards the mediating variables in the dataset we observed that large
projects are at first sight no better than smaller ones in terms of learning
capabilities (absorptive capacity) and complementarity of resources. While the
2.7
6
2.6
7
2.5
6
3.5
4
3.4
3
2.7
22.9
4 3.0
5
2.7
1
3.7
7
3.5
7
2.4
8
3.1
5 3.3
1
2.9
5
4.0
2
3.7
0
2.3
9
3.5
3
3.3
9
3.0
8
4.0
6
3.9
3
2.5
4
1.00
1.50
2.00
2.50
3.00
3.50
4.00
4.50
5.00
Project Costs* Scientific Risk* Commercial Risk* Complexity* Duration* Distance from Core Techn.Area*
1=
low
5 =
hig
h
Low Funding Medium Funding High Funding Very High Funding

45
expected positive effects of these mediating performance dimensions did not
occur, the hypothesised negative impacts of an increased project scale in terms
of transaction costs could be observed. In particular, very large projects in
terms of number of partners and total funding, which are by and large
Integrated Projects, have considerably more unclear objectives and higher
coordination difficulties.
Also regarding firm characteristics and project characteristics some significant
differences between small and large projects can be observed. Projects with
higher average funding per partner and with a higher number of project
partners have higher numbers of employees, are more often involved in
collaborative actions, and have a higher R&D intensity (the latter is only true
for average participant funding).
The results of the descriptive analysis further point out that the project profiles
compared with internal projects vary by project size. While there is a positive
correlation between average participant funding and Scientific Risk,
Commercial Risk, and Complexity, we witness a negative relation between the
absolute project size and the Commercial risk: the higher the number of
partners, the lower the Commercial Risk associated with the projects.
Regarding the Scientific Risk and Complexity, Large Projects are outstanding.
They are less complex and exhibit lower scientific risks. In addition, both
Project Cost and Duration are positively correlated with the number of
partners and average funding per partner.

46
3.2 Econometric Analysis
3.2.1 Introduction and Overview
The basic question in this study is whether economies of scale in R&D projects exist,
and, if so, the causal mechanisms through which these economies materialise. The
basic rationale underlying these questions is that R&D projects may experience
increasing returns to scale because of specialisation, complementarities of resources
and skills, and more efficient utilisation of resources. However, there are also limits to
the (presumed) scale effects: collaborative R&D projects may experience decreasing
returns to scale beyond a certain point because of higher transaction and
administrative costs associated with the implementation of a large project.
Using the conceptual framework (Ch.1) as our starting point, we test whether scale, as
reflected in consortium size and in project budget, exhibits an inverted-U shaped
effect on project performance via its effect on a set of 'mediator' (intervening)
variables that underpin both positive and negative effects of performance.
The conceptual framework also posits that the mediated effects of scale on
performance will depend on a set of other factors hypothesised to 'moderate' the
relation between scale and the mediator variables. Taken overall, our hypotheses
develop as a series of basic questions regarding the role of scale in collaborative R&D
projects' performance. To begin with, we ask 'Does scale affect performance?' As
noted, we would expect a positive answer here, specifically that scale has an inverted-
U shape direct effect.
Assuming that scale affects performance, we next ask 'What are the causal
mechanisms explaining this effect?' Here we first put forward the hypothesis of
'unconditional' (simple) mediational effects. We posit that scale has a mixture of
positive and negative effects on performance through a set of key intervening
variables (i.e. pool of resources, absorptive capacity, and transaction costs).
Finally, we ask whether these mediating effects are not 'simple', that is, whether they
depend on other variables such as project and partner characteristics or variables
related to project management.
Our analysis below follows the same scheme: first we test for the direct effects of
scale on performance (Step 1), then we test unconditional mediation (Step 2), and
finally conditional mediation effects (Step 3) of scale on performance.
3.2.2 Methodology
3.2.2.1 Data and Measures
As noted earlier in this report, our sample contains a total of 1,172 observations (750
from ROs and 422 from private enterprises). These correspond to 676 collaborative
R&D projects (328 projects with >= 2 responses). It is important to note, however,
that our sample contains a large number of missing variables (i.e. item non-response).
This means that we had to be selective with regard to the variables used to represent
the key constructs of interest in our analyses, with a view to obtaining the largest
possible number of usable observations for our models.
Except for single item measures, all 'composite' variables used in the analyses (see
below) were constructed following Confirmatory Factors Analysis. All of these
47
composite variables were constructed as averages of multi-item Likert-type scales,
where higher numbers pointed to a 'higher quantity' of what was measured. Annex 3-1
presents all relevant details. As shown there, all measures were reasonably valid and
reliable, as judged by their respective psychometric properties.
Dependent Variables
We obtained data for eight dimensions of performance at the level of the individual
participant. In other words, our dependent variables reflect outputs and/or impacts
obtained by individual participants as a result of their participation in a given project.
Moreover, these eight performance dimensions represent 'subjective' evaluations on
the part of the respondent regarding these outputs; they are not 'objective' indicators of
what has been actually achieved.
These subjective performance dimensions include: (a) project goal achievement, (b)
knowledge outputs, (c) technological outputs, (d) network outputs, (e) research
capacity impacts, (f) commercial impacts, (g) goods/services innovation and (h)
process innovation (as a result of the project). The last three of these measures (i.e.
commercial, goods/services and process innovation) concern enterprises only.
Goal Achievement: reflects the degree to which the project achieved its
scientific, technical and commercial objectives. As such, it represents an
overall (subjective) evaluation of project success.
Knowledge outputs: reflects significance of outputs such as publications,
PhDs, etc.
Technological outputs: reflects significance of technical outputs, such as tools
and techniques, models and simulations, and prototypes.
Network outputs: reflects the significance of networking results, such as links
with ROs and other businesses.
Research capacity impacts: measures the significance of impacts that concern
the ability of the partner to carry on research activities (i.e. increased number
of research staff, enhanced technological skills, critical mass of research).
Commercial impacts: measures the impact of possible exploitation outputs
resulting from the project in question. These outputs concern, for example,
increased turnover, profitability, enhanced competitiveness, etc. As noted
above, this variable – as the next two – are obtained only from private
enterprises in our sample.
Goods/services innovation: an indicator variable (yes/no) showing whether the
enterprise has produced new or improved goods/services as a result of the
project. It is a 'subjective' variable in the sense that the respondent 'attributes'
specific goods/services innovations that have to a lesser or greater extent
resulted from project implementation.
Process innovation: as above, but reflecting innovations in production
processes.
48
Independent Variables
Scale: This is the key variable of interest to this study, and it is operationalised using
two indicators: (a) number of partners, and (b) project budget (measured in euros).
Because both variables are heavily skewed, as is common in the literature, we
measure scale (and scale squared) using the number of partners and project budget in
a log scale to compensate for skewing. We have also constructed an alternative
measure of scale, which combines those just mentioned, i.e. average funding per
participant (in the log scale), and which was also used in the econometric analyses.
Scope: The questionnaire contained two questions intended to provide measures of
project scope, both solicited from project coordinators (as opposed to project
participants): the first asked coordinators to indicate whether the project in question
involved 'sub-projects' (a yes/no question), and (b) if yes, the exact number of such
sub-projects. It was felt that only coordinators, by having an overall picture of the
project, would be in the position to provide a reliable answer to these questions.
Unfortunately, only a relatively small number of coordinators participated in the
survey and hence we have a large number of missing values on these variables.
Because of that, in our analyses we use a proxy measure that basically reflects the
vertical scope of the project. More specifically, this variable asks respondents to
indicate whether the project involved 'R&D activities only', 'R&D plus developing a
prototype', 'R&D plus prototype plus pilot activities', or finally, 'R&D plus prototype
plus pilot plus market-oriented activities'. This is treated as an ordinal variable
ranging from 1-4, with higher values denoting higher vertical scope of project
activities.
The following four variables represent the mediator constructs in our framework; they
reflect subjective assessment (on the part of the responding organisation) of project
phenomena:
Complementarity of resources: The collective pool of resources made
available to the project by the partners (not the responding organisation) was
measured in terms of the complementarities achieved among partners. This
variable is a Likert-type scale reflecting the extent of synergies with respect to
scientific, technical/engineering, and managerial skills and assets.
Absorptive Capacity (AC): This is a construct assessing the degree of
knowledge acquisition, assimilation, and integration resulting from the
learning-related activities among partners in the project. This measure is a new
one, specifically developed for the present study. It attempts to operationalise
as faithfully as possible the theoretical conceptualisation of absorptive
capacity as the ability of partners to acquire, assimilate and integrate
knowledge.
Unclear objectives: This variable, together with 'difficulties in coordination'
(see below), represents two dimensions of transaction costs incurred among
partners in the course of project implementation, as derived by the
confirmatory factor analysis of the original scale. It reflects the degree to
which partners agree that the project is characterised by clear and accepted
objectives as well as by a clear allocation of tasks. The scale was reverse
coded for the analysis to reflect 'unclear objectives'.
Difficulties in coordination: As above, this is a reverse-coded scale that
reflects the extent of difficulties in coordination among partners in terms of

49
information sharing, smooth planning of activities, efficiency of working
together, etc.
The following variables reflect some basic characteristics of the responding
organisation as well as the 'quantity' of the resources it (the particular partner) has
committed to the project. Here we also include a measure of the market environment
in which it operates:
Size: This is a variable representing the size of the partner, as reflected in the
number of its employees. It is an ordinal measure, ranging from 1 to 5, with
higher values indicating larger size (e.g. 5 = 501+ employees).
Frequency of participation: This variable measures the frequency of
participation in prior collaborative R&D projects. It reflects experience with
such projects. It is a Likert-type item, ranging from 1 (= never involved) to 5
(= involved in many projects).
Acquaintance with partners in the project: This is an indicator (dummy)
variable that references whether the partner has collaborated before with one
or more partners in the consortium.
Organisation type: Dummy variable, referencing a RO (vs. a private firm).
Resources committed to the project: An ordinal variable measuring the
number of senior staff devoted to project implementation. It ranges from 1 (=
1 to 3 persons) to 4 (= 10+ persons).
Market & Technological dynamism: This Likert scale reflects the degree of
turbulence and uncertainty in the firm's market and technological environment.
The next two variables are also referring to the responding organisation, but this time
they refer to its 'general' innovation-related resources and skills:
R&D expenditures: An ordinal variable indicating the percentage of R&D
expenditure of total budget/revenue for the period just prior to the project. It
ranges from 1 (=no R&D) to 6 (= >10%).
Resource endowments: A Likert-type scale reflecting the firm's ability to
commercially exploit research results (i.e. ability to speedily introduce new
products, marketing skills in launching new products, etc.).
The following set of variables characterise the 'type' of the project:
Framework Programme: A dummy variable representing a project under FP6
(vs. FP5).
Thematic Category: An indicator variable with four categories (i.e. Growth,
IST, Life, and Eesd). The reference category is 'Other'. (We have chosen
'Other' as the reference category because it collects all remaining thematic
categories and as such it presents itself as a 'natural' category against which to
compare the others. The same applies to the variable just below.)
Instrument: Another indicator variable with four levels: 'Supportive measures,
Large projects, Network projects, and Small and medium projects. The
reference category is Other.
Project duration: It is measured in months. As with scale, we log transformed
this variable to compensate for extreme skewing.

50
The following set of variables measure some 'qualitative' characteristics of the project:
'New area' project: A binary variable indicating whether the project is assessed
to represent an 'entirely new scientific' area for the partner.
Cost vis-à-vis an average project: A five-point Likert-type item, with high
values indicating a high cost project in comparison to the responding
organisation's 'average' R&D project.
Scientific risk: As above, reflecting scientific risk in comparison to an
'average' project.
Commercial risk: As above, reflecting commercial risk.
Complexity: As above, reflecting the project's complexity.
Long term: As above; higher values indicate longer horizon vis-à-vis an
'average R&D project.
Distance from core: As above, higher values indicate higher distance from the
partner's technological core area.
Finally, the following two variables refer to issues of project management:
Communication: A Likert-type scale reflecting perceptions regarding the
efficiency of communication among partners in the consortium.
Coordination: As above, but referring to the efficiency of mechanisms and
tools used by the consortium to coordinate activities among partners.
3.2.2.2 Analytical Strategy and Methods
As noted above, we consider three basic questions of successively increasing
complexity. In the first we address the question whether scale affects project
performance. In what we shall henceforth refer to as Step 1 in our analyses, we
specifically examine whether these effects take the form of an inverse-U shaped
relation with performance, controlling for all the variables identified above. In Step 1,
therefore, we assess the direct effects of scale on performance by including in our
models both scale and scale squared to accommodate the possibility of a non-linear
relation (i.e. inverse-U). Our hypothesis will be supported whenever we find a
significant positive effect of scale and a significant negative effect of scale squared.
To test this hypothesis, we fit regression models separately on the different
performance dimensions identified above. Specifically, for the dependent variables
whose original questionnaire items are measured with Likert-type scales (i.e. goal
achievement, knowledge outputs, technological outputs, network outputs, research
capacity impacts, and commercialisation-related impacts) we fit OLS regressions.9
With regards to the two binary dependent variables (i.e. goods/services innovation and
process innovation) we fit logistic regression models. For all models in Step 1 we
request robust standard errors to correct for non-independence among observations
pertaining to the same project (recall that in the original sample of 1,172 observations,
we have 824 responses coming from 328 projects).
9 This is consistent with the commonly held assumption that a dependent variable constructed as the
average of a multi-item scale is distributed as a quasi-normal variate.
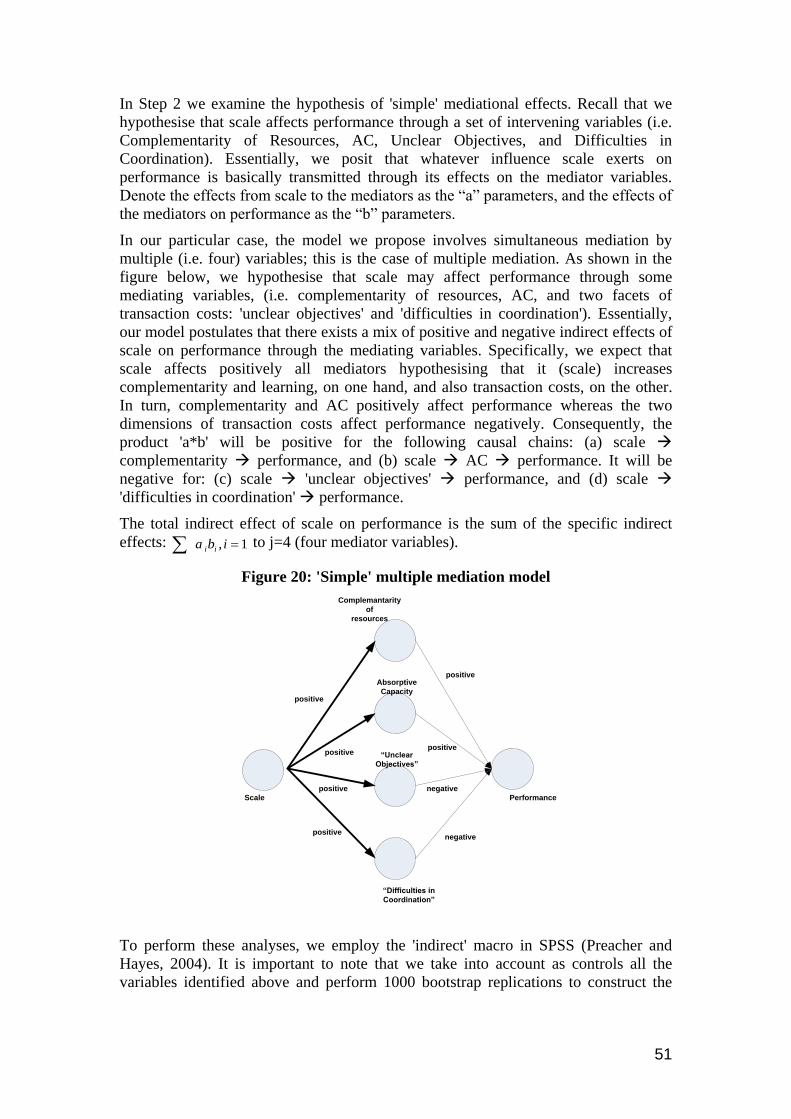
51
In Step 2 we examine the hypothesis of 'simple' mediational effects. Recall that we
hypothesise that scale affects performance through a set of intervening variables (i.e.
Complementarity of Resources, AC, Unclear Objectives, and Difficulties in
Coordination). Essentially, we posit that whatever influence scale exerts on
performance is basically transmitted through its effects on the mediator variables.
Denote the effects from scale to the mediators as the “a” parameters, and the effects of
the mediators on performance as the “b” parameters.
In our particular case, the model we propose involves simultaneous mediation by
multiple (i.e. four) variables; this is the case of multiple mediation. As shown in the
figure below, we hypothesise that scale may affect performance through some
mediating variables, (i.e. complementarity of resources, AC, and two facets of
transaction costs: 'unclear objectives' and 'difficulties in coordination'). Essentially,
our model postulates that there exists a mix of positive and negative indirect effects of
scale on performance through the mediating variables. Specifically, we expect that
scale affects positively all mediators hypothesising that it (scale) increases
complementarity and learning, on one hand, and also transaction costs, on the other.
In turn, complementarity and AC positively affect performance whereas the two
dimensions of transaction costs affect performance negatively. Consequently, the
product 'a*b' will be positive for the following causal chains: (a) scale
complementarity performance, and (b) scale AC performance. It will be
negative for: (c) scale 'unclear objectives' performance, and (d) scale
'difficulties in coordination' performance.
The total indirect effect of scale on performance is the sum of the specific indirect
effects: 1, iba ii to j=4 (four mediator variables).
Figure 20: 'Simple' multiple mediation model
To perform these analyses, we employ the 'indirect' macro in SPSS (Preacher and
Hayes, 2004). It is important to note that we take into account as controls all the
variables identified above and perform 1000 bootstrap replications to construct the
Scale Performance
Complemantarity
of
resources
Absorptive
Capacity
“Unclear
Objectives”
“Difficulties in
Coordination”
positive
positive
positive
positive
positive
positive
negative
negative
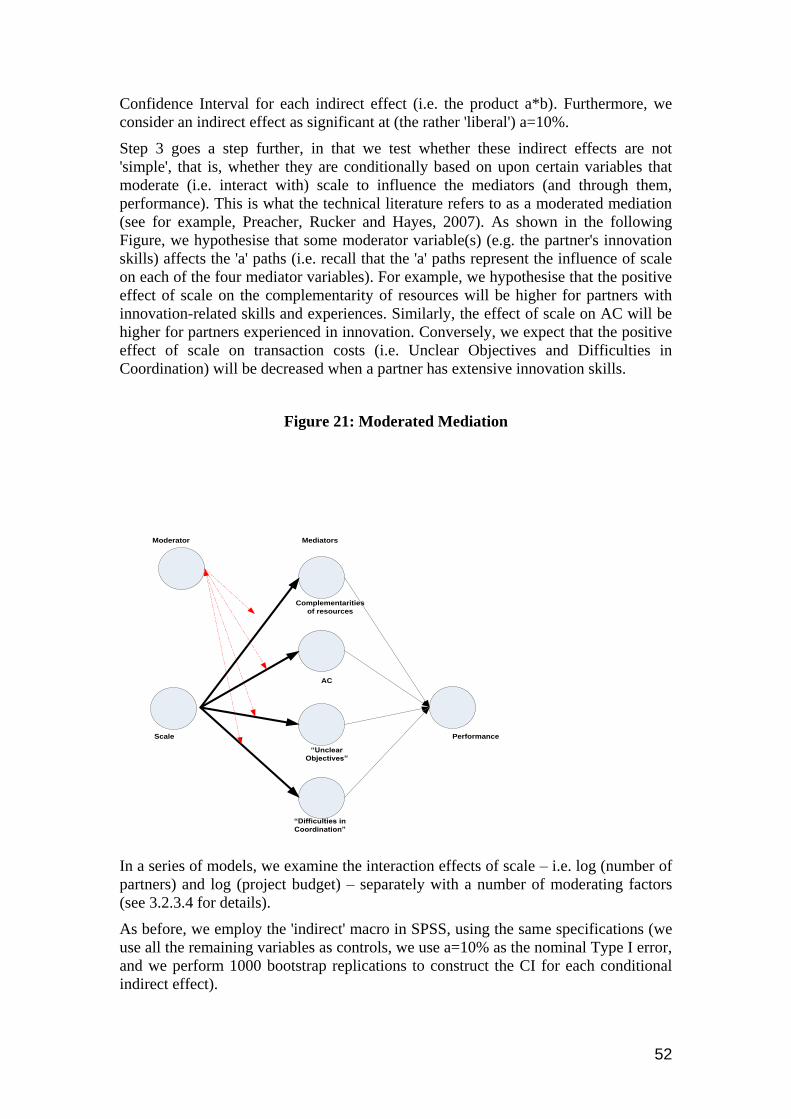
52
Confidence Interval for each indirect effect (i.e. the product a*b). Furthermore, we
consider an indirect effect as significant at (the rather 'liberal') a=10%.
Step 3 goes a step further, in that we test whether these indirect effects are not
'simple', that is, whether they are conditionally based on upon certain variables that
moderate (i.e. interact with) scale to influence the mediators (and through them,
performance). This is what the technical literature refers to as a moderated mediation
(see for example, Preacher, Rucker and Hayes, 2007). As shown in the following
Figure, we hypothesise that some moderator variable(s) (e.g. the partner's innovation
skills) affects the 'a' paths (i.e. recall that the 'a' paths represent the influence of scale
on each of the four mediator variables). For example, we hypothesise that the positive
effect of scale on the complementarity of resources will be higher for partners with
innovation-related skills and experiences. Similarly, the effect of scale on AC will be
higher for partners experienced in innovation. Conversely, we expect that the positive
effect of scale on transaction costs (i.e. Unclear Objectives and Difficulties in
Coordination) will be decreased when a partner has extensive innovation skills.
Figure 21: Moderated Mediation
In a series of models, we examine the interaction effects of scale – i.e. log (number of
partners) and log (project budget) – separately with a number of moderating factors
(see 3.2.3.4 for details).
As before, we employ the 'indirect' macro in SPSS, using the same specifications (we
use all the remaining variables as controls, we use a=10% as the nominal Type I error,
and we perform 1000 bootstrap replications to construct the CI for each conditional
indirect effect).
Scale
MediatorsModerator
Performance
“Difficulties in
Coordination”
“Unclear
Objectives”
AC
Complementarities
of resources

53
3.2.3 Results and Discussion
3.2.3.1 Step 1 – Direct effects of Scale on Project Performance
To examine the hypothesised curvilinear (inverse-U shaped) effects of scale on
performance, we run a series of regression models, one for each performance
dimension. In all these models we test for both linear and quadratic terms of log (# of
partners) and log (budget) to capture (possible) non-linearity in the effects of scale on
performance. We include all remaining variables as controls, to remove whatever
effects these other variables may have on performance. We begin our exposition with
the results obtained in the 'full sample', i.e. the sample containing data collected from
both private enterprises and ROs; this is our primary sample. In a section below, we
present results using an alternative measure of scale, i.e. average funding per project,
and also results from fitting the same and similar models in different sub-samples (e.g.
the firm sub-sample) of theoretical and/or substantive interest.
Table 6 presents the findings. Because commercial impacts, goods/services
innovation, and process innovation are relevant only for the firm sub-sample, these
dependent variables do not appear in Table 6 (they will be discussed below, the same
for the findings from fitting the negative binomial regression models on the number of
patents). Hence, the results in Table 6 pertain to following performance dimensions:
(1) goal achievement, (2) knowledge outputs, (3) technological outputs, (4) network
outputs, and (5) research capacity impacts. As noted above, we employ simple linear
regression for these variables.
We specify linear and quadratic terms for both variables representing scale
simultaneously. Admittedly this creates problems of co-linearity. Indeed, the variance
inflation factors (VIF) for these variables is, as would be expected, very high.
Nevertheless, we obtain significant results of scale on two of the five dependent
variables in Table 6. To check the robustness of these results, we run a series of
checks that will be detailed in a subsequent section.

54
Table 6: Direct effects of scale on project performance (full sample)
(1) (2) (3) (4) (5)
Goal achievement Knowledge outputs Technological
outputs
Network outputs Research capacity
impacts
lg_nrpar 0.38 0.23 0.24 1.00** 0.54
lg_nrpar_sq -0.08 -0.08 -0.07 -0.15* -0.12
log budget -1.08* 0.88 0.39 0.72 0.27
log budget squared 0.04* -0.03 -0.01 -0.02 -0.01
resource complementarity 0.06 0.15+ 0.03 0.19*** 0.19**
absorptive capacity 0.27*** 0.15 0.12+ 0.16* 0.20*
unclear objectives -0.04 -0.11 -0.07 -0.05 -0.01
coordination difficulties -0.17** 0.01 0.01 -0.03 -0.05
# of employees -0.03 0.06 -0.02 -0.03 -0.05
frequency of prior collaborative R&D 0.02 -0.00 0.02 0.02 0.02
knows one or more of the partners 0.02 0.29+ 0.20+ -0.01 0.24*
# of senior staff to project 0.03 0.18** 0.04 0.07 0.07
FP6 vs. FP5 0.02 -0.08 0.10 0.07 -0.10
thematic: Growth -0.22* -0.49* -0.01 -0.06 -0.36*
thematic: IST -0.06 -0.09 0.21 0.02 -0.08
thematic: Life -0.19 -0.25 0.03 0.02 -0.27
thematic: Eesd -0.23* -0.28 0.09 -0.05 -0.25
Instrument: Supportive measures 0.34* -0.03 0.18 0.30 0.07
Instrument: Large projects 0.06 0.48 0.05 0.03 0.25
Instrument: Network projects 0.40* 0.79* 0.22 0.34+ 0.43+
Instrument: Small/medium projects 0.14 0.22 0.10 0.11 0.07
log project duration 0.09 0.41 -0.02 0.03 0.24
vertical scope of the project 0.01 -0.05 0.13*** 0.06* 0.03
entirely 'new area' project 0.03 -0.23+ 0.01 -0.03 0.05
cost vis-à-vis average project 0.04 0.01 -0.00 0.04 -0.02
scientific risk vis-à-vis average project -0.02 -0.03 0.01 -0.05 0.04
commercial risk vis-à-vis average
project
0.00 -0.05 0.03 0.02 0.06
complexity vis-à-vis average project 0.07+ 0.07 0.13** 0.04 0.15*
long term vis-à-vis average project -0.05 0.03 0.02 0.09* -0.00
distance from core area vis-à-vis
average project
-0.01 -0.02 -0.02 0.03 0.01

55
efficiency of communication 0.07 0.23* 0.16** 0.10 0.12
efficiency of coordination 0.04 -0.02 0.07+ 0.10* -0.01
RO vs. enterprise 0.09 0.38*** 0.10 0.11 0.22*
constant 8.92** -7.87 -2.86 -6.09 -3.99
observations 570 586 583 593 588
adjusted R2 0.303 0.217 0.210 0.227 0.179
+ p<0.10, * p<0.05, ** p<0.01, *** p<0.001
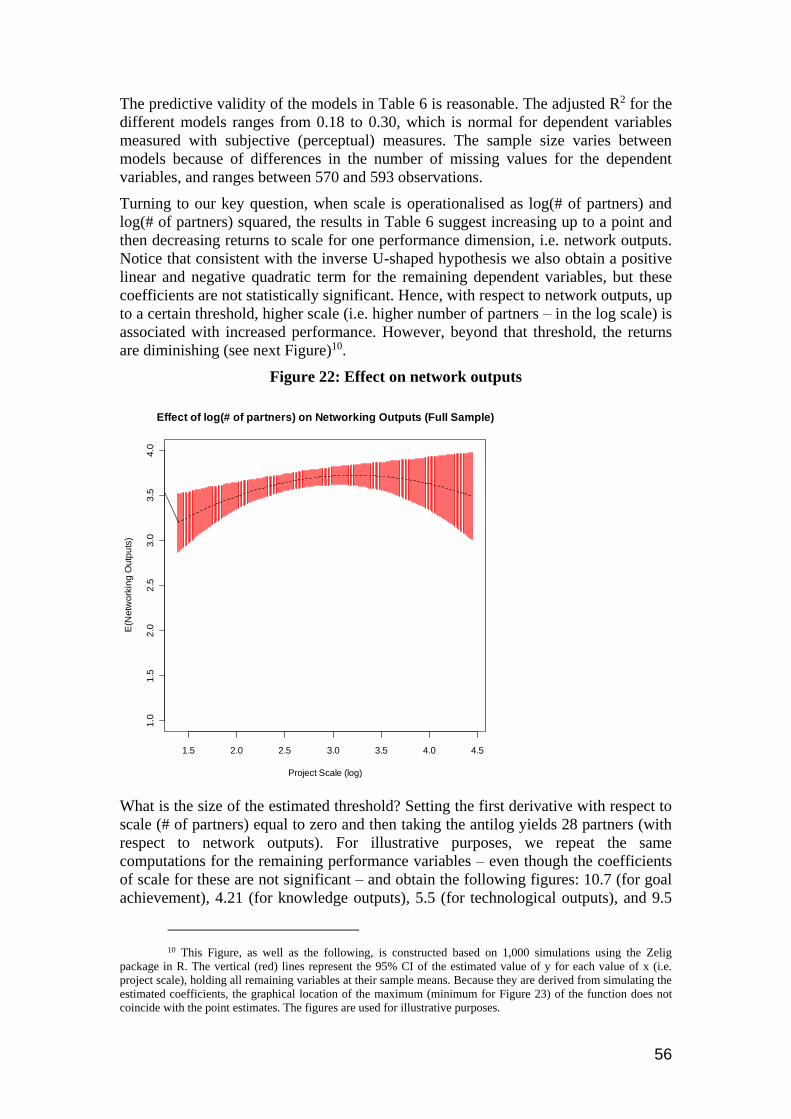
56
The predictive validity of the models in Table 6 is reasonable. The adjusted R2 for the
different models ranges from 0.18 to 0.30, which is normal for dependent variables
measured with subjective (perceptual) measures. The sample size varies between
models because of differences in the number of missing values for the dependent
variables, and ranges between 570 and 593 observations.
Turning to our key question, when scale is operationalised as log(# of partners) and
log(# of partners) squared, the results in Table 6 suggest increasing up to a point and
then decreasing returns to scale for one performance dimension, i.e. network outputs.
Notice that consistent with the inverse U-shaped hypothesis we also obtain a positive
linear and negative quadratic term for the remaining dependent variables, but these
coefficients are not statistically significant. Hence, with respect to network outputs, up
to a certain threshold, higher scale (i.e. higher number of partners – in the log scale) is
associated with increased performance. However, beyond that threshold, the returns
are diminishing (see next Figure)10.
Figure 22: Effect on network outputs
What is the size of the estimated threshold? Setting the first derivative with respect to
scale (# of partners) equal to zero and then taking the antilog yields 28 partners (with
respect to network outputs). For illustrative purposes, we repeat the same
computations for the remaining performance variables – even though the coefficients
of scale for these are not significant – and obtain the following figures: 10.7 (for goal
achievement), 4.21 (for knowledge outputs), 5.5 (for technological outputs), and 9.5
10 This Figure, as well as the following, is constructed based on 1,000 simulations using the Zelig
package in R. The vertical (red) lines represent the 95% CI of the estimated value of y for each value of x (i.e.
project scale), holding all remaining variables at their sample means. Because they are derived from simulating the
estimated coefficients, the graphical location of the maximum (minimum for Figure 23) of the function does not
coincide with the point estimates. The figures are used for illustrative purposes.
1.5 2.0 2.5 3.0 3.5 4.0 4.5
1.0
1.5
2.0
2.5
3.0
3.5
4.0
Effect of log(# of partners) on Networking Outputs (Full Sample)
Project Scale (log)
E(N
etw
ork
ing
Ou
tpu
ts)

57
(for research capacity impacts). These figures represent the 'optimal' size of the
consortium for each of these dependent variables, respectively. Do these values make
sense? One way of answering this question is to look at the empirical distribution of
the number of partners observed in our estimation sample.
When looking at the 593 observations used to fit the regression model for network
outputs, we find that the average size is 19.6 (standard deviation = 14.4), while the
25% and 75% percentile values are 9 and 25 partners, respectively. It follows
therefore that the estimated optimal size of the consortium is well within the empirical
distribution of the number of partners; in fact it is just slightly above the size of the
higher 75% (and well below the higher 90%) of the projects in the sample. This result
is reasonable, in the sense that possibilities for networking increase when the
consortium is large, not small. Still, however, as the results indicate, when the
consortium becomes too large, these effects begin to diminish.
In contrast, the optimal size with regard to the remaining performance dimensions is
well below the respective average size. Even though these coefficients are not
statistically significant (and, therefore, strictly speaking, not trustworthy), it is perhaps
worth noting how the optimal size differs among performance dimensions. It is quite
small for knowledge and technology related outputs, i.e. 4.2 and 5.5, respectively, and
moderately higher (but still considerably lower with respect to networking) for goal
achievement (10.7) and research impacts (9.5).
With respect to budget (log budget and log budget squared), the results are somewhat
surprising, in that we find a significant curvilinear effect on goal achievement, but
contrary to our hypothesis the effect is found to be U-shaped (instead of inverse-U
shaped – see next Figure), since the linear term is negative and the quadratic is
positive (see Table 6). (As will be shown later, our robustness checks reveal that this
effect generally holds for various different specifications of the functional form of
scale, as well as for one of the different sub-samples in which we run the same basic
model).

58
Figure 23: Effect on goal achievement
Following the same procedure as above, we approximate the point at which the
estimated function attains its minimum with respect to budget. We find that the
expected value of goal achievement is at its minimum when the budget is 729,416
EUR. The empirical distribution of the size of project budgets in the sample of 570
observations used to fit this model is as follows: mean = 4,649,512 (standard
deviation = 7,695,584), 25% percentile = 1,189,822, 75% percentile = 4,860,001.
Clearly, the minimum scale in terms of budget with respect to goal achievement is at
the lower end of the empirical distribution (i.e. just below the lower 10% of the
distribution). What does this finding tells us? Simply put, goal achievement begins to
increase when the project budget is higher than approximately 700,000 EUR.
As already noted, our finding of a significant U-shaped relation between budget and
goal achievement is contrary to our hypothesis. Instead of initially positive effects that
begin to diminish after a certain threshold, we observe the exact opposite pattern.
According to our estimations, the project budget has to be higher than the minimum
threshold of 700,000 EUR for goal achievement to start increasing. This is, of course,
a reasonable result. At low levels of budget, respondents feel that little can be
achieved because of limited resources. It is only when the budget becomes sizeable
(i.e. higher than the threshold of 700,000 EUR) that respondents feel there is a match
between goal expectations and the resources available to meet these goals. In this
light, it is interesting to note that the estimated minimum budget is relatively low
when compared to the empirical distribution of budget across projects in our sample.
In other words, it appears that budget does not have to be too high for participants to
indicate positive goal achievement.
The results with respect to the other variables are generally in the expected direction.
For example, the four mediating variables, whenever found to be significant, have the
12 13 14 15 16 17 18
1.0
1.5
2.0
2.5
3.0
3.5
4.0
4.5
Effect of log(budget)) on Goal Achievement (Full Sample)
Project Scale (log)
E(G
oa
l Ach
ieve
me
nt)

59
correct sign. More specifically, complementarity of resources is found to be positive
and significant for knowledge outputs (.15, p<.10), network outputs (.19, p<0.001)
and research capacity impacts (.19, p<0.001). AC is also found to positively influence
goal achievement (.27, p<0.001), technological outputs (.12, p<0.10), network outputs
(.16, p<0.05) and research impacts (.20, p<0.01). Also note that difficulties in
coordination affect goal achievement negatively (-.17, p<0.01).
Somewhat surprisingly, experience with collaborative R&D projects (frequency of
participation) does not seem to exert any influence on performance. The same holds
for the size of the partner. In contrast, having established prior collaborative relations
with some of the partners yields positive effects on knowledge outputs (.29, p<0.10),
on technological outputs (.20, p<0.10), and on research capacity impacts (.24,
p<0.05). As would be expected, the more resources committed to the project, the
higher the score for knowledge outputs (.18, p<0.01). We find no difference in any of
the five performance dimensions between FP5 and FP6 projects. Similarly, we find no
effect of project duration. In contrast, we find that ROs (vs. enterprises) obtain
significantly more positive results in terms of knowledge outputs (.38, p<0.001) and
research capacity impacts (.22, p<0.05).
Vertical scope, a variable of special interest to this study, is found to positively
influence technological outputs and network outputs (.13, p<0.001 and .06, p<0.05,
respectively). With respect to the 'qualitative' characteristics of the project, we find
that new-area projects are less successful with respect to knowledge outputs (-.23,
p<.10). Complexity influences positively goal achievement (.07, p<0.10),
technological outputs (.13, p<0.01) and research capacity impacts (.15, p<0.05), while
long term projects appear to produce more network outputs (.09, p<0.05).
We also find that efficient project management plays a positive role in performance.
Specifically, communication is positively related to knowledge and technological
outputs (.23, p<0.05; and .16, p<0.01, respectively), whereas coordination affects
positively and significantly technology outputs (.07, p<0.10) and networking (.10,
p<0.05). Finally, we obtain some significant results with regards to the controls
representing different thematic categories and instruments. More specifically,
'Growth' projects appear to be significantly less successful (in terms of goal
achievement, knowledge outputs, and research impacts) relative to the 'Other'
reference thematic category. Similarly, projects in the 'Eesd' thematic category are
less successful with respect to goal achievement. With regards to instruments, projects
under 'supportive measures' are more successful with respect to goal achievement than
the reference ('other instruments') category. While 'Large projects' and 'small/medium
projects' are no different than the reference, 'network' projects are more likely to
produce results in terms of goal achievement, knowledge outputs, research impacts,
and (obviously) network outputs.
3.2.3.2 Additional Analyses and Robustness Checks
The results presented above pertain to what we shall call the 'basic specification' of
our models in step 1, that is, they are the findings obtained from fitting simple OLS
models in the full sample, where we specify both linear and quadratic effects for both
number of partners and budget (in the log scale). In this section, we explore various
possible extensions of the basic specification in order to verify the robustness of our
results.

60
The first set of additional analyses involves fitting our models in different sub-
samples, which are derived as a 'natural' breakdown of the original full sample. There
exist four sub-samples that can be used for our purposes:
1. The 'collaborative research projects' sub-sample, which contains data on
projects that belong to the following instrument categories: IP, CSC, CRS,
STIP and STREP. Put differently, the 'collaborative research projects' sub-
sample excludes projects that fall within the Supportive measures, Network
projects, as well as Other instruments, which are arguably not clean-cut
examples of collaborative R&D activities. Hence, this sub-sample contains
observations of what may be viewed as 'pure' R&D projects.
2. The 'firm' sub-sample, which contains data obtained exclusively from private
enterprises. The rationale here is that in this sub-sample we can more closely
examine the behaviour of, and performance impacts for, firms in collaborative
R&D.
3. The 'FP5' sub-sample, which – as the name implies, contains only FP5
projects.
4. The 'FP6' sub-sample, containing only FP6 projects. The Fifth and Sixth
Framework Programmes have qualitatively different characteristics in terms of
overall design and aims and as such it would be interesting to examine more
closely our questions separately in these sub-samples.11
Fitting the same OLS models with the exact same specification of variables as in
Table 6 yields results that are summarised in the following Table (also including
results from Table 6 for comparative purposes). (Detailed results are shown in the
Annexes.)
Before discussing the findings, a few remarks are in order. Sub-sample sizes (used for
estimation) are lower than those of the Full sample (see Table 6); for the
'collaborative research projects' sub-sample the number of usable observations ranges
from 449 to 463 (conditional on the different dependent variables). For the firm sub-
sample, the numbers are much lower, ranging from 167 to 182 observations. Finally,
in the FP5 sub-sample, the usable observations ranged from 277 to 288, whereas the
respective figures for the FP6 sub-sample ranged from 293 to 305.
Analyses in the firm sub-sample include three additional dependent variables (i.e.
commercial impacts, goods/services innovation, and process innovation) and three
more independent variables (relative to those used in Table 6). These include: R&D
expenditures, resource endowments, and market/technological dynamism. These
additional independent variables are only measured for firms, not ROs. The two
models for product and process innovation are fit using logistic regression, as these
two variables are binary. For these two models, including the quadratic terms of
number of partners and budget led to severe misspecification. Hence, in these models
we only test for linear effects of scale. Given the relatively small size of usable
observations in the firm sub-sample, particularly when compared with the number of
11 Recall that in our basic specification we have included two dummies (i.e. organisation type and
framework programme) that are meant to capture performance differences between ROs and private firms, and
between FP6 vs. FP5 projects, respectively. By performing separate analyses on these sub-samples, we are
interested to see whether these differences extend to the estimated effects of all other variables, notably the effects
of scale.

61
independent variables in the equations (i.e. 35 independent variables), the respective
results should be considered with caution.
The results in Table 7 show a rather mixed picture, but looking at the table vertically,
and with respect to the number of partners, we see that scale has:
1. an inverse U-shaped effect on goal achievement, but only in the
collaborative research sub-sample,
2. no effect on knowledge outputs,
3. an inverse U-shaped effect on technology but only in the FP5 sub-sample,
with surprisingly a U-effect in the FP6 sub-sample,
4. the inverse U-shaped effect on network outputs in the full sample, as well
as in the 'collaborative research' and FP5 sub-samples,
5. almost no significant results for performance dimensions specific to
private enterprises (i.e. commercial impacts, and product and process
innovation).
Again looking vertically, but this time with respect to log budget:
1. the U-shaped effect on goal achievement in the collaborative research sub-
sample,
2. an inverse-U effect on knowledge and technology outputs also in the
collaborative research sub-sample, also found in the FP6 sub-sample.
Looking at the Table horizontally, it is clear that the firm sub-sample provides the
least evidence of scale effects on performance. This lack of strong results may be a
statistical artefact, because of the small number of observations.
Admittedly the results reported in Table 7 are mixed, making it difficult to paint a
broad and consistent picture. Nonetheless, it would be possible to argue that, at the
broadest level, we do find support for the hypothesis that scale affects performance in
a curvilinear manner. Even though the evidence is not overwhelming, at least some
dimensions of performance, most notably network outputs, goal achievement and
technology outputs, are affected by the scale of the project. It is also true, however,
that contrary to our hypothesis, in addition to inverse U-shaped effects we also find
U-shaped relations to performance. In the latter case, this has to do with goal
achievement and technology outputs. Also in the latter case, it is quite surprising that
we find the exact opposite relation between log partners and technology outputs in the
FP5 and FP6 sub-samples. In FP5 projects the relation is, as expected, inverse-U,
whereas in FP6 it is U-shaped. Moreover, again in the FP6 sub-sample, log budget has
the opposite effect on technology outputs (i.e. inverse U).
Another general finding is that both measures of scale seem to affect performance.
Interestingly, even though there seems to be no pattern with regard to the performance
dimensions they influence (i.e. as would be the case if, for example, budget affected
only goal achievement and consortium size affected network outputs), in those cases
in which they both influence significantly the same performance dimension, they do
so in opposite ways. Specifically, consider the case of goal achievement in the
collaborative-research sub-sample. Whereas number of partners exerts an inverse U-
shaped effect, budget also affects achievement but in the opposite way (U-shaped)!
Hence, it would appear that the two scale 'dimensions' operate in opposing ways when

62
affecting the same performance dimension. (As noted above, the same pattern is
found in the FP6 sub-sample with respect to technology outputs).
Table 7: Summary of results in the different sub-samples
Goal
achie
vem
ent
Kno
wle
dg
e
ou
tputs
Tec
hn
olo
gy
ou
tputs
Net
work
ou
tputs
Res
earc
h
Impac
ts
Com
mer
cial
impac
ts
Pro
du
ct
inno
vat
ion
Pro
cess
inno
vat
ion
Full sample
(for comparison)
Partners1 ns3 ns ns Inv U4 Ns n/a6 n/a n/a
Budget2 U5 ns ns ns Ns n/a n/a n/a
Collaborative research projects sub-
sample
partners Inv U ns ns Inv U Ns n/a n/a n/a
budget U Inv U Inv U ns Ns n/a n/a n/a
Firm sub-sample
partners ns ns ns ns Ns Linear
- 7
ns ns
budget ns ns ns ns Ns ns ns Linear
-8
FP5 sub-sample
partners ns ns Inv U Inv U Ns n/a n/a n/a
budget ns ns ns ns Ns n/a n/a n/a
FP6 sub-sample
partners ns ns U ns Ns n/a n/a n/a
budget ns ns Inv U ns Linear
+ 9
n/a n/a n/a
Notes:
1. partners – both linear and quadratic effects of log (# of partners) except for the logistic regressions in the
firm sub-sample
2. budget - both linear and quadratic effects of log (budget) except for the logistic regressions in the firm
sub-sample
3. ns = not significant
4. Inv U = significant inverse U-shaped effect
5. U = significant U-shaped effect
6. n/a = not applicable (only estimated in the firm sub-sample)
7. Linear - = the linear term was found negative and significant (but not the quadratic)
8. Linear - = the linear term was found negative and significant (the quadratic was not tested in the logistic
regressions)
9. Linear + = the linear term was found positive and significant (but not the quadratic)
Another set of additional analyses involved experimenting with different ways of
including the linear and quadratic terms of the two variables representing scale. As
noted earlier, the inclusion of both terms –for both number of partners and budget; in
total four terms- inevitably creates problems of collinearity. It follows that if we do
not find significant effects of scale (represented by e.g. the number of partners) on,
say, knowledge outputs (see Tables Table 6 and Table 7), this may result from severe
collinearity between log (# of partners) and log (# of partners) squared. The results
from these analyses (see Annex 3-2) show clearly that whatever specification of the
functional form of scale we use, yields the same results regarding the significance or

63
not of the curvilinear effect. Hence, we can be confident that, in this respect, the
findings presented above are robust.
A final set of robustness checks involved: (a) treating the dependent variables in the
full sample (i.e. goal achievement, knowledge outputs, technological outputs, network
outputs, and research capacity impacts) as ordinal variables using ordinal regression
(instead of OLS); (b) performing a seemingly unrelated regression (SURE) on all five
dependent variables simultaneously; (c) exploring whether the inclusion of “diversity
in R&D expenditures”, as a proxy for the heterogeneity of resources among partners,
would change the results obtained; (d) testing whether an alternative
operationalisation of scale (i.e. average budget per partner) would provide useful
results; and finally (e), examining the effects of scale on the number of patents
granted to project participants within a five-year time window after the completion of
the project. Briefly, the results obtained can be summarized as follows:
(a) Ordinal and simple regression in the full sample seem to converge towards
a basic conclusion: scale, as reflected in the number of partners in the
consortium, has an inverse U-shaped effect on at least one of the performance
dimensions examined (i.e. networking). (See Annex 3-3 for details)
(b) Performing a seemingly unrelated regression (SURE) on all five dependent
variables simultaneously provides similar results to those of table 11: we find
significant inverse U-shaped effects on networking outputs from log partners,
and a significant U-shaped relation of log budget to goal achievement (see
Annex 4-4).
(c ) We found no significant effects of diversity of the consortium on any
performance dimension, but the estimation samples were too small because of
item non-response.
(d) Substituting the linear and quadratic terms of number of partners and
budget with log (budget per partner) and log (budget per partner) squared,
results in a significant U-shaped effect to goal achievement, echoing the effect
of log budget on achievement (see Annex 4-5).
(e) Fitting poisson and negative binomial regressions on the number of
patents, we find that consortium size has a positive (linear) effect on the
number of patents granted after project completion in the full sample. Budget
has negative but insignificant effects. It should be noted, however, that the
data available on the number of patents are ill conditioned (too many zeros),
which may have an adverse effect on the predictive validity of the estimated
models.
Taken overall, our additional analyses provide reasonable confidence that the results
obtained in the full sample are quite robust. The results are less clear when we
calibrate the models in different sub-samples, but they generally provide (partial)
support to the hypothesis that scale affects (at least some dimensions of) performance
in a curvilinear manner.
The following table summarises the results obtained from Step 1 in terms of the
optimal project scale, which can be a maximum size – if the relation is inverse U-
shaped, or can be the minimum size – if the relation is found to be U-shaped. The
table organises the results according to (from left to right): (a) scale variable (i.e.
number of partners or budget), (b) the estimated optimal size, (c) whether it is

64
maximum or minimum size, (d) the type of the significant relation found (i.e. inverse
U-shaped or U-shaped), (e) the performance dimension for which the scale effect was
found to be significant, and finally (f) the (sub)sample in which the result was
obtained.
Table 8: Summary of Step 1 results with regards to optimal scale
Scale
Variable
Optimal
Scale Max/Min
Type of
Relation
Performance
Dimension (sub)Sample
partner 15 Max inv U Goal achievement Collaborative
budget 729,416 Min U Goal achievement Full
budget 568,070 Min U Goal achievement Collaborative
budget 34,523,225 Max inv U
Knowledge
outputs Collaborative
partner 28 Max inv U Network outputs Full
partner 40 Max inv U Network outputs Collaborative
partner 22 Max inv U Network outputs FP 5
partner 9 Max inv U
Technology
outputs FP 5
partner 26 Min U
Technology
outputs FP 6
budget 6,582,993 Max inv U
Technology
outputs Collaborative
budget 3,704,282 Max inv U
Technology
outputs FP 6
As noted earlier, success as measured by goal achievement requires a budget above
the minimum size indicated in the table above. At the same time, however, the
consortium size should not exceed 15 partners (at least for projects falling in the
'collaborative research' sub-sample). Knowledge outputs, in contrast, require projects
with a high budget. Beyond the estimated budget 'threshold', however, knowledge
outputs begin to diminish. Similarly, network outputs require projects with a large
number of partners (which varies according to the sample). With regard to technology
outputs, the table above shows a striking difference between FP5 and FP6 projects:
whereas in the former case the optimal maximum number of partners is nine, in the
latter case (i.e. FP6) the minimum number of partners should be 26. In contrast, there
is no such inconsistency with respect to budget: the last two rows in the table show
that there is an optimal maximum for project success in terms of technological
outputs.
3.2.3.3 Step 2: Unconditional mediational effects
We now turn our attention to examining the causal mechanisms that underpin the
effects of scale on performance. Whereas in Step 1 we sought to establish that scale

65
does in fact affect performance, we are now interested in investigating more deeply
how these effects materialise. As noted earlier, the key argument to be tested here is
that the effects of scale are 'transmitted' through a set of intervening variables (i.e.
complementarity of resources, AC, 'unclear objectives', and 'difficulties in
coordination').
Methodologically, this means that we test whether the total indirect effects of scale on
performance through the above mentioned mediators (Σaj*bj) and/or specific indirect
effects (i.e. through one of the mediators) are statistically significant, controlling for
all independent variables. As already described above, we employ the 'indirect' macro
in SPSS, with 1,000 bootstrap replications, specifying a rather liberal confidence
interval (CI) of 90%. As with Step 1, we run the analyses separately for each
performance dimension. The results obtained for the full sample are presented in
Table 9 (we only present the results that are significant at a=10% or lower).
Table 9 shows that we obtain significant unconditional ('simple') indirect effects for
only a few performance dimensions (i.e. goal achievement, knowledge, technology,
network outputs for number of partners, and goal achievement for budget).
Specifically, for log (number of partners), we find that scale exerts a significant
'specific'12 indirect effect on goal achievement by influencing positively 'unclear
objectives' (i.e. 'a' path), which in turn affects negatively goal achievement (i.e. 'b'
path). The product of the two (a*b) is negative, is estimated as -0.0522 and is
significant at a=10% since the 90% CI does not include 0 (CI: -0.1104…-0.0181).
Perhaps more important, we find that log (number of partners) has significant
negative total indirect effects, that is, effects through all four of the mediators, on goal
achievement, knowledge, technology, and network outputs. This represents Σaj*bj,
the sum of all indirect effects of scale transmitted through all mediators to affect each
of the above performance dimensions.
What do these findings tells us? With respect to goal achievement, the results indicate
that as number of partners becomes larger this intensifies ambiguities in objectives
among partners in the consortium, and because the latter (obviously) has a negative
effect on goal achievement, the indirect effect is (again obviously) negative. In
connection to knowledge, technology, and networking outputs, we find that as the
number of partners becomes larger this affects all mediator variables and the resulting
total indirect effect is significant and negative! In other words, the combined indirect
effects through all mediators affect negatively knowledge, technology, and network
outputs. This finding of significant total indirect effects, even though it holds for only
three of the performance dimensions, provides some support to the hypothesis that
scale (in this case, consortium size) influences performance indirectly through
intervening variables.
Turning to budget as measure of scale, the results show only one significant effect: as
log (budget) gets larger, learning among partners (i.e. AC) becomes more effective
(the 'a' path is positive albeit marginally significant: p=0.0833), and since learning has
a strong positive effect on goal achievement (p<0.001), the indirect effect is positive
and significant. Hence the unconditional indirect effect of budget on achievement is
positive, and involves learning as the mediator.
12 The term 'specific' is used to denote an indirect effect involving scale and a certain mediator variable –
in this case, 'unclear objectives'. It is to be distinguished from 'total indirect effects', which denote the overall effect
of scale on performance through all the mediators; it is the quantity Σai*bi.

66
We fitted the same models in the 'collaborative research' sub-sample to see whether
we obtain similar results. As shown in
Table 10, we find significant indirect effects only for number of partners. More
specifically, the table shows significant and negative total indirect effects of number
of partners on goal achievement, network outputs, and research impacts. Hence, we
have evidence that as consortium size increases this has an overall negative indirect
effect on several performance dimensions.
We also find some of the 'specific' indirect effects to be negative and significant.
Specifically, scale affects positively (i.e. intensifies) difficulties in coordination, and
this has a negative indirect effect on goal achievement and on network outputs. A
striking result obtained in this sub-sample, is that as scale (number of partners)
increases, this has a negative effect on the complementarity of resources, and hence a
negative indirect effect on network outputs and research impacts. This finding is
contrary to our hypothesis that as scale increases this will have positive effects on the
complementarity of resources devoted to the project. In addition, even though
complementarity has positive effects on network outputs and research impacts (i.e. the
'b' paths are positive, as expected), the 'a' paths are negative and hence the significant
negative indirect effects.
We have also run the same analyses in the firm sub-sample, and the only significant
finding involves the positive effect of number of partners on research impacts through
unclear objectives. Specifically, we find that increasing consortium size increases
ambiguity in objectives, and (surprisingly) that these ambiguities have a positive
influence on research impacts. This may mean that larger consortia permit partners to
pursue own (and not necessarily common) objectives, which has a positive effect on
their ability to derive (own) research benefits out of the project.
Taken overall, the results obtained in Step 2 provide some support to the hypothesis
of unconditional indirect effects of scale through the mediators on project
performance. Even though the results in the three samples are not identical, they
nevertheless provide the impression of basically negative indirect effects of scale
(mainly in terms of consortium size) on at least some dimensions of project
performance. The exception here is the positive indirect effect in the firm sub-sample.
Overall the evidence is not overwhelming, however, and this raises the question
whether scale affects the mediators (and through them, performance) conditionally
based on some third variable. This observation leads to Step 3.
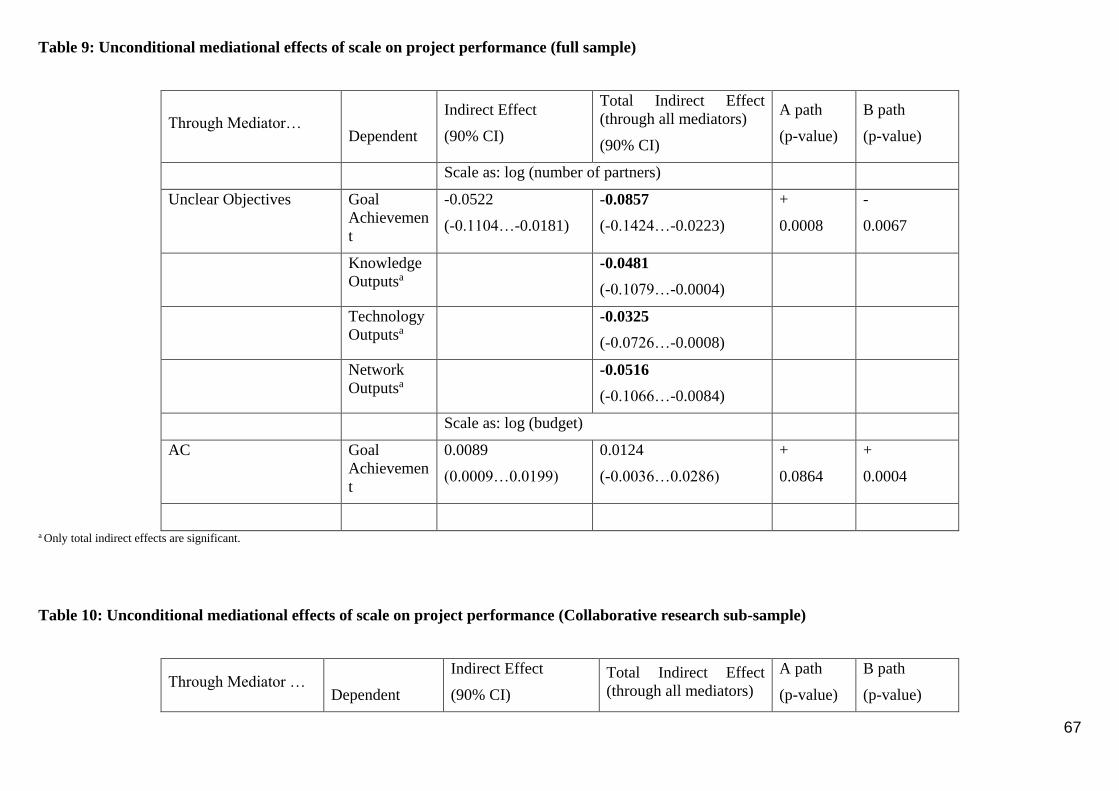
67
Table 9: Unconditional mediational effects of scale on project performance (full sample)
a Only total indirect effects are significant.
Table 10: Unconditional mediational effects of scale on project performance (Collaborative research sub-sample)
Through Mediator…
Dependent
Indirect Effect
(90% CI)
Total Indirect Effect
(through all mediators)
(90% CI)
A path
(p-value)
B path
(p-value)
Scale as: log (number of partners)
Unclear Objectives Goal
Achievemen
t
-0.0522
(-0.1104…-0.0181)
-0.0857
(-0.1424…-0.0223)
+
0.0008
-
0.0067
Knowledge
Outputsa
-0.0481
(-0.1079…-0.0004)
Technology
Outputsa
-0.0325
(-0.0726…-0.0008)
Network
Outputsa
-0.0516
(-0.1066…-0.0084)
Scale as: log (budget)
AC Goal
Achievemen
t
0.0089
(0.0009…0.0199)
0.0124
(-0.0036…0.0286)
+
0.0864
+
0.0004
Through Mediator …
Dependent
Indirect Effect
(90% CI)
Total Indirect Effect
(through all mediators)
A path
(p-value)
B path
(p-value)
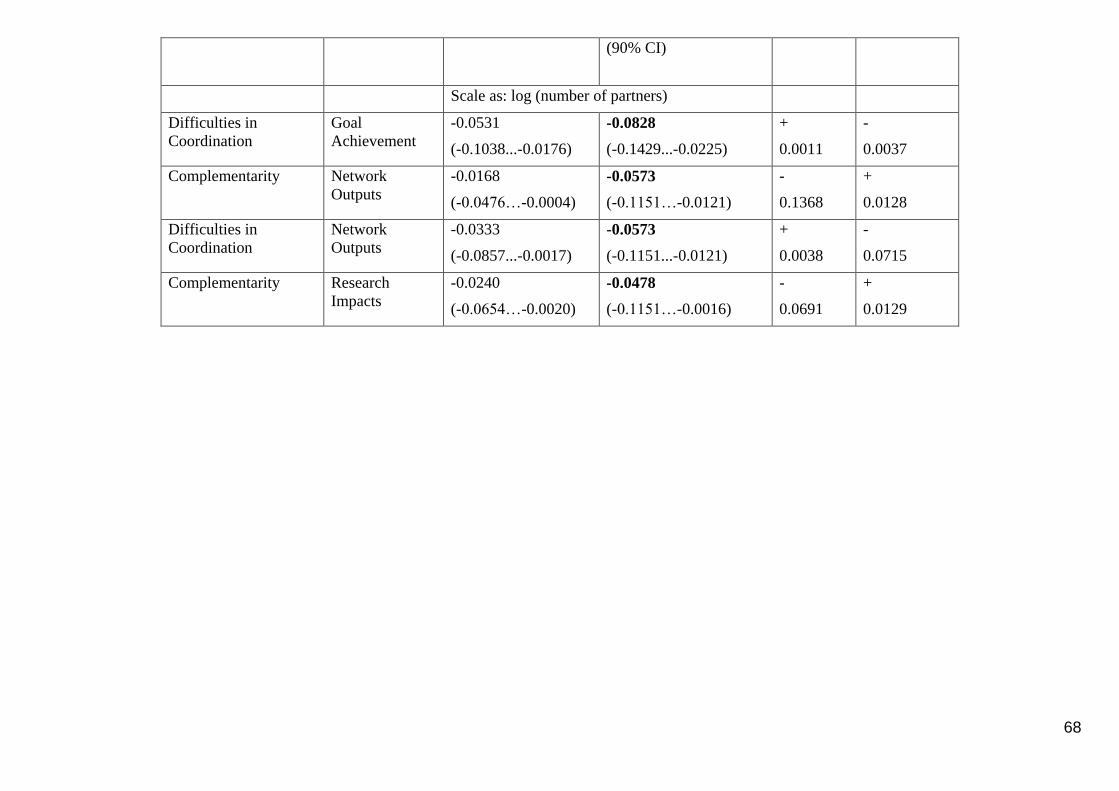
68
(90% CI)
Scale as: log (number of partners)
Difficulties in
Coordination
Goal
Achievement
-0.0531
(-0.1038...-0.0176)
-0.0828
(-0.1429...-0.0225)
+
0.0011
-
0.0037
Complementarity Network
Outputs
-0.0168
(-0.0476…-0.0004)
-0.0573
(-0.1151…-0.0121)
-
0.1368
+
0.0128
Difficulties in
Coordination
Network
Outputs
-0.0333
(-0.0857...-0.0017)
-0.0573
(-0.1151...-0.0121)
+
0.0038
-
0.0715
Complementarity Research
Impacts
-0.0240
(-0.0654…-0.0020)
-0.0478
(-0.1151…-0.0016)
-
0.0691
+
0.0129

69
3.2.3.4 Step 3: Moderated mediation analyses
Recall that in our conceptual framework we hypothesise that certain factors may
condition the effect of scale on the mediator variables. For example, we hypothesise
that as the size of the consortium increases, the positive effect on the complementarity
of resources will be higher (i.e. more positive) when the consortium is composed of
partners willing to commit significant resources to the project. In contrast to Step 2,
here we conceptualise the 'a' paths from scale to the mediators to be 'conditional', that
is, to interact with some third variable. Following this line of reasoning, in Step 3 we
examine whether the total conditional (interactive) indirect effects from scale to
performance through the mediators are significant. Put differently, we examine
whether the interaction between scale and some other variable, by being mediated
through an 'intervening' variable, has a significant effect on performance (see
Figure 21: Moderated Mediation).
As in Step 2 we employ the same macro, using the same specifications. We run a
separate analysis for each performance dimension, and each time the 'a' path is the
interaction of scale with one of the following moderating factors:
resources committed to the project (i.e. senior staff),
project management (i.e. communication and coordination),
characteristics of the project (i.e. vertical scope, 'new area' project, cost,
scientific risk, commercial risk, complexity, duration and distance from core
vis-à-vis an 'average' project),
innovation-related resources (i.e. R&D expenditures and resource
endowments). Note that these variables are measured only in the firms sub-
sample.
The results for the full sample are presented in Table 11, for log (number of partners),
and in Table 12 for log (budget). Both tables show a number of significant conditional
indirect effects. Generally, we find that a much larger number of performance
dimensions are influenced by the interaction of scale with a moderating variable, an
effect transmitted indirectly through one (or more) of the hypothesised mediators.
A significant conditional indirect effect can, in general, be interpreted as follows: for
each additional unit increase in the scale of a project, in high levels of the moderator
variable, there is a significant positive (negative) effect on performance, transmitted
though one or more mediator variables. It is important to note that we are testing a
large number of potential effects, i.e. the interaction of scale (for number of partners
and project budget) with many potential moderators, and we are testing each
conditional effect separately (also separately for each performance dimension).
Because of the large number of tests, our analysis is prone to obtain some significant
effects purely by chance. Hence, the findings shown below should be considered with
care.
Returning to the results, in Table 11 we find that with respect to goal achievement:
Increasing scale (i.e. each additional partner) in projects with high vertical
scope leads to more difficulties in coordination; the latter has a negative effect
on goal achievement, and hence the conditional indirect effect is negative.

70
Notice here that the 'a' path is not significant (p=0.17), but the product a*b is
negative and significant (-.0097) because of the strongly negative 'b' path. The
key finding, therefore, is that high vertical scope combined with a large
number of partners contributes to difficulties in coordinating the project, and
hence to lower goal achievement!
Increasing scale in projects that are perceived as high cost relative to an
'average' project lowers the effectiveness of learning among partners, and
increases difficulties in coordination, and thus lowers goal achievement.
Similarly, increasing scale in projects that are perceived to be of high
commercial risk increases difficulties in coordination and lowers the
effectiveness of learning among partners, and thus decreases goal
achievement.
With respect to knowledge outputs, we find that:
Increasing scale (i.e. each additional partner) in projects that are perceived as
high cost relative to an 'average' project lowers the complementarity of
resources among partners and lowers the effectiveness of learning among
partners, and thus lowers the amount of knowledge outputs.
Increasing scale in projects of high commercial risk lowers the degree of
complementarity of resources and thus reduces knowledge outputs. The exact
opposite effect materialises in project of high complexity: in those cases,
increasing scale increases complementarity and thus increases knowledge
outputs.
With respect to technological outputs we find that:
Each additional partner in projects that are perceived as high cost relative to an
'average' project lowers learning and increases 'unclear objectives' and thus
lowers technology outputs.
Similarly, increasing scale in projects perceived to be of high commercial risk
has a negative effect on technology outputs (by lowering learning).
With respect to network outputs:
Each additional partner in projects that are perceived to be distant relative to
the partner's core technological area lowers complementarity and thus
decreases network outputs.
With respect to research capacity impacts we find a large number of significant
indirect effects, most of which turn out to be negative:
Each additional partner in projects that are perceived as high cost relative to an
'average' project, lowers complementarity of resources and AC, and thus
decreases research impacts.
Similarly, each additional partner in projects that are perceived to be of high
commercial risk lowers complementarity of resources and AC, and thus
decreases research impacts.
Increasing scale in projects that are distant from the 'core' again lowers
complementarity of resources and AC, and thus decreases research impacts.

71
In contrast, increasing scale in projects of high complexity increases
complementarity and through that increases research impacts
Turning to Table 12 which presents significant findings with respect to scale as
budget, we find that for goal achievement:
Each additional euro budget in projects of high vertical scope lowers learning,
and also increases difficulties in coordination, and thus has a negative effect
on achievement.
Each additional euro budget in projects that are perceived as of high
commercial risk, or are considered to be distant relative to the partner's core
technological area, lowers learning, and thus decreases goal achievement.
Similarly, each additional euro budget in projects that are considered to be of
high cost, increases difficulties in coordination, resulting in lower goal
achievement.
With respect to knowledge outputs, we find that:
Each additional euro budget in projects that are perceived as of high
commercial risk, increases unclear objectives and hence lowers knowledge
outputs.
Similarly, increasing budget in projects distant to the core results in less (not
more) learning and thus to lower knowledge outputs.
With respect to technological outputs, we find that:
Each additional euro budget in projects that are perceived to be distant relative
to the partner's core technological area lowers learning and thus lowers
technology outputs.
With respect to network outputs, we find that:
Each additional euro budget in projects of high commercial risk decreases
learning and thus lowers network outputs.
Each additional euro budget in projects distant relative to the partner's core
technological area, decreases learning and thus decreases network outputs.
Finally, with respect to research capacity impacts:
Increasing budget in projects that are considered to be 'high cost', or of high
commercial risk projects, or in projects distant from the core, lowers learning
and thus reduces research impacts.
Beyond these 'specific' conditional indirect effects, we also find significant total
indirect effects, which as noted above, represent the combined impact (Σai*bi) of
scale (interacted with a moderator) on a performance dimension through all (not
just one of) the intervening mediators. (These significant total effects are
highlighted in bold font in Table 11 and Table 12).
As it turns out (see Table 11 and Table 12), it is possible that none of the 'specific'
indirect effects are found to be significant, yet nevertheless the total combined
indirect effect to be, in fact, significant. There are two instances where we find a
significant total indirect effect without at the same time finding a significant

72
'specific' indirect effect. Both of these concern log budget. First, the interaction of
log budget with high cost projects results in negative total indirect effects on
knowledge outputs. Essentially this means that increasing budget in projects that
are already considered to be of high cost relative to some 'average' projects has
detrimental effects on knowledge, and these effects are brought about by all
intervening variables. The second concerns the interaction of budget with
commercial risk: increasing budget in such projects has again detrimental effects
on technology outputs.
The vast majority of the total indirect effects reported in Table 11 and Table 12
are indeed significant. This provides further support to the moderated mediation
hypothesis, i.e. that the conditional indirect effects of scale, transmitted through
all of the mediators, on the performance dimensions are significant. In addition,
and consistent with the 'specific' conditional indirect effects described above,
almost all of these total indirect effects are negative, indicating that the
(conditional) effect of scale on performance is negative. In other words, increasing
scale, as it interacts with the hypothesised moderator variables, decreases project
performance.
What is the general picture emerging out of this long list of results? One useful
way to answer this question is by looking at the 'a' and 'b' paths in Table 11 and
Table 12.
Beginning with the 'b' paths, we see that, without exception, the signs of the
effects of the mediators on the performance dimensions are in the correct
direction. That is, complementarity of resources and AC always affect
performance positively, whereas 'unclear objectives' and 'difficulties in
coordination' affect performance negatively. This result is important in that it
provides support to one key argument in our conceptual framework, which states
that the mediating variables affect differently project performance. Hence we
could categorise the mediators as falling into the 'positive group', which comprises
complementarity of resources and AC, and into the 'negative group' which
comprises the two dimensions of transaction costs.
Another related finding is that the mediators do not appear equally important as
'members' of the 'b' paths that constitute the causal mechanisms by which scale
affects performance. In Table 11 (log number of partners) complementarity
appears eight times, AC seven times, 'unclear objectives' one time, and 'difficulties
in coordination' three times. In Table 12 (log budget) the respective numbers are:
0, 10, 1 and 2. It appears, therefore, that the 'positive' group of mediators are
affected by the conditional effect of scale much more than the 'negative' group.
Put differently, complementarity of resources and learning are more critical as
mechanisms transmitting the effects of scale on performance than transaction
costs (i.e. 'unclear objectives' and 'difficulties in coordination').
What is striking is that the conditional effect of scale on the 'positive' group is
most of the times negative. We see that by turning our attention to the 'a' paths. In
Table 11, we find that the conditional effects of log (number of partners) on either
complementarity or AC are at all times negative, with two exceptions, both
involving complementarity of resources: the interaction of scale with project
complexity has a positive effect on complementarity, that is, it makes the
(perceived) complementarity among partners to be stronger, which in turn affects
positively knowledge outputs and research impacts. In all other instances, the

73
conditional effect of scale on complementarity or AC is negative, a result
indicating that scale does not promote complementarity of resources or learning
among partners; in contrast, according to our results, it makes complementarity
and learning more difficult to achieve. To corroborate this negative (conditional)
effect of scale, we also find that whenever it affects transaction costs, it does so as
to make them higher!
The results in Table 12 tell a similar story: the conditional effect of log budget on
AC is always negative! And at the same time, whenever increasing budget has an
effect on transaction costs, these are positive, thus making transaction costs
higher. In general, therefore, the conditional effects of scale on (a) the 'negative
group' always operates in the direction of increasing (i.e. magnifying) their
negative effects, whereas (b) on the 'positive group' almost always works in the
direction of reducing its positive effects on performance.
Returning to the effects of consortium size, it is important to note that of the
twenty significant conditional 'specific' indirect effects identified in Table 11, all
but two are negative. It therefore appears that increasing the number of partners,
conditional on some third moderator variable, turns out to be negative! The two
exceptions, as described above, are when increasing scale 'combines' with
complex projects, which result in better complementarity of resources, which in
turn affects positively knowledge outputs and research impacts. We obtain the
exact same picture in Table 12 when looking at the results concerning log budget.
All thirteen significant 'specific' indirect effects of increasing budget,
conditionally based on some third moderator variable, are (again) negative. Taken
overall, increasing scale, in terms of both increasing the size of the consortium
and budget, has a negative effect on performance.
In interpreting these findings, however, it is important to remember that increasing
scale does not operate 'alone' in influencing performance negatively; it is the
conditional effect of scale on performance that is negative. The results in Table 11
and Table 12 indicate that these conditional effects arise from the interaction of
scale with the characteristics of the project itself. Project management does not
appear to play any significant role, nor does the resources committed to the
project.
Are these results robust when we fit the same models in the different sub-
samples? Annexes 3.8 and 3.9 present the results for the 'collaborative research'
and firm sub-samples, respectively. Beginning with the 'collaborative research'
sub-sample, we obtain the same overall picture. The 'b' paths are consistently in
the correct direction, the 'a' paths work in the direction of 'worsening' the negative
effects of the 'negative group' of mediators, and 'decreasing' the positive effects of
the 'positive group'. For both operationalisations of scale, all but three of the
'specific' indirect effects are negative. (The three exceptions, as in the full sample,
involve the interaction of log (number of partners) with project complexity, which
promotes the complementarity of resources among partners to produce more
knowledge and network outputs and to increase research impacts. Another
interesting result in this sub-sample is that increasing budget in project with large
vertical scope reduces learning, and this has a negative effect on goal
achievement. Furthermore, increasing budget in projects with high vertical scope,
results into less effective learning and into more difficulties in coordination, which
in turn affect negatively goal achievement.
74
Hence, consistent with our results in the full sample, the results here suggest that
the conditional effects of scale on performance are (generally) negative.
The overall picture is different, however, when we look at the results obtained in
the firm-sub-sample. The most notable difference here is that we find a relatively
large number of significant positive 'specific' (and total) indirect effects. More
specifically, we find that increasing the number of partners in projects distant to
the core reduces unclear objectives and difficulties in coordination, thus producing
more commercialisation impacts13, more research impacts and higher goal
achievement. In contrast, increasing the size of the consortium in projects where
partners commit more senior staff in the project results into reduced learning, and
hence lower goal achievement. Thus it appears that the higher the number of
senior staff in a large consortium results into less (not more) learning! Apart from
this rather surprising result, increasing budget in the firm sub-sample appears to
produce even more positive results: in fact, all indirect effects found to be
significant are positive. For example, increasing budget combined with effective
communication and coordination results into reducing unclear objectives with a
consequent positive effect on commercialisation impacts. More generally, the
conditional effects of increasing budget in this sub-sample result in reducing the
ambiguity of objectives with positive effects on commercial impacts. Moreover,
increasing budget in projects where partners have a history of spending much on
innovation is associated with lower difficulties in coordination and thus with
higher goal achievement.
Taken overall, the results from all three steps of analyses indicate that increasing
scale generally degrades project performance (with the notable exception of firms
which seem to benefit from increasing scale, particularly in terms of budget, with
a positive effect mainly on commercial impacts). Step 1 showed a curvilinear
effect on some performance dimensions. Recall, however, that in the firm sub-
sample, analyses produced very little evidence of significant scale effects on
performance. In addition, whereas Step 2 provided some indication of
unconditional negative indirect effects of scale, Step 3 gave considerable evidence
that, with the exception of the firm sub-sample, the conditional effects of scale are
mostly negative.
It should be stressed however, that the 'exception' is important; private enterprises
are key beneficiaries of the Framework Programmes, since they are expected to
translate research results into concrete innovation outputs. It is perhaps not
surprising that our results indicate firms in the sample obtain higher performance,
mainly in terms of commercial impacts, in projects with large budget. While it is
perhaps not too difficult to obtain 'intermediate' project results, such as network
outputs or research impacts, ultimate results such as commercial impacts, may
require large budgets.
Hence, even though our results from Steps 1, 2 and 3 do not provide a clear-cut,
unequivocal picture as to the net effect of scale on collaborative R&D
performance, it would seem reasonable to argue that, if anything, scale affects
13 Except from commercialisation impacts, two more performance dimensions were tested in this sub-
sample, namely goods/services innovation and process innovation. Presumably because these two performance
dimensions were measured with binary variables, the mediational models on them as dependent variables did not
converge.

75
performance in complex ways. Its effects are transmitted through critical
intervening variables, such as the complementarity of resources, learning and
transaction costs. When the net effect is negative (which is most of the time), it is
because increasing scale lowers the positive effect of resources and learning, and
magnifies the negative effect of transaction costs. Conversely, when it is positive,
it is because it strengthens the positive effect of resources and learning, and
diminishes the negative effect of transaction costs. Finally, we have also shown
that these negative (or in certain cases positive) effects materialise conditionally
based on other factors, which basically relate to the characteristics of the project
itself.
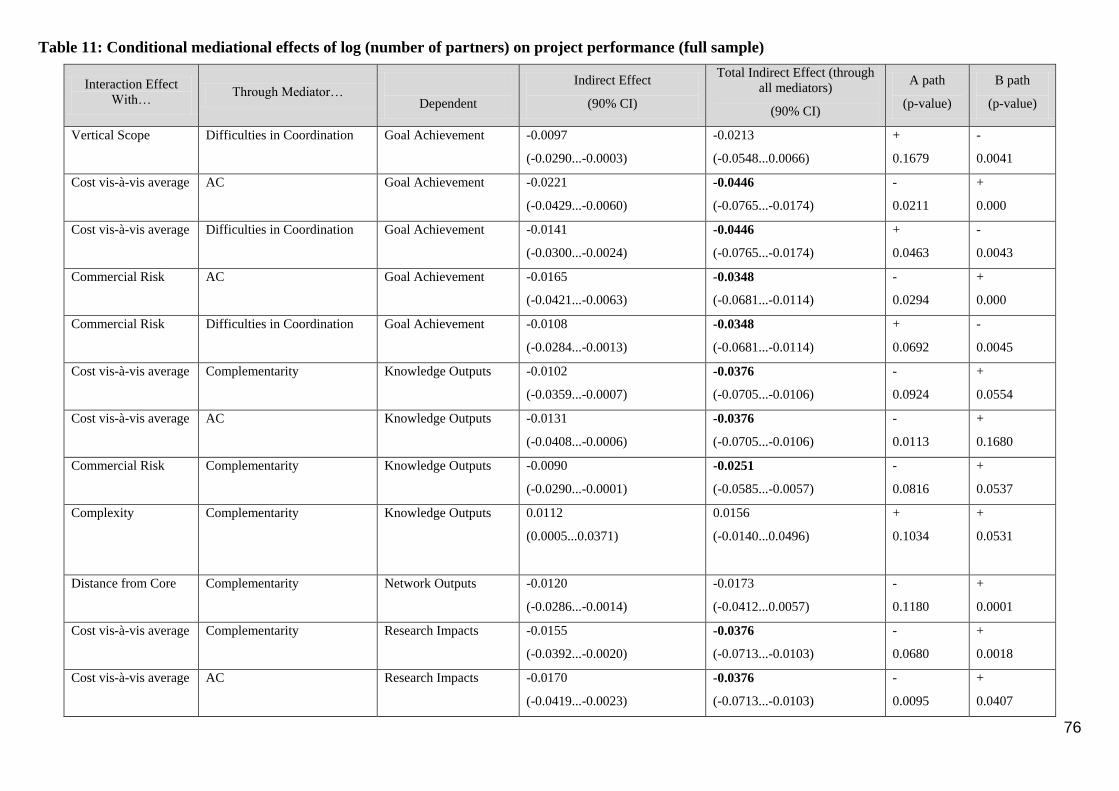
76
Table 11: Conditional mediational effects of log (number of partners) on project performance (full sample)
Interaction Effect
With… Through Mediator…
Dependent
Indirect Effect
(90% CI)
Total Indirect Effect (through
all mediators)
(90% CI)
A path
(p-value)
B path
(p-value)
Vertical Scope Difficulties in Coordination Goal Achievement -0.0097
(-0.0290...-0.0003)
-0.0213
(-0.0548...0.0066)
+
0.1679
-
0.0041
Cost vis-à-vis average AC Goal Achievement -0.0221
(-0.0429...-0.0060)
-0.0446
(-0.0765...-0.0174)
-
0.0211
+
0.000
Cost vis-à-vis average Difficulties in Coordination Goal Achievement -0.0141
(-0.0300...-0.0024)
-0.0446
(-0.0765...-0.0174)
+
0.0463
-
0.0043
Commercial Risk AC Goal Achievement -0.0165
(-0.0421...-0.0063)
-0.0348
(-0.0681...-0.0114)
-
0.0294
+
0.000
Commercial Risk Difficulties in Coordination Goal Achievement -0.0108
(-0.0284...-0.0013)
-0.0348
(-0.0681...-0.0114)
+
0.0692
-
0.0045
Cost vis-à-vis average Complementarity Knowledge Outputs -0.0102
(-0.0359...-0.0007)
-0.0376
(-0.0705...-0.0106)
-
0.0924
+
0.0554
Cost vis-à-vis average AC Knowledge Outputs -0.0131
(-0.0408...-0.0006)
-0.0376
(-0.0705...-0.0106)
-
0.0113
+
0.1680
Commercial Risk Complementarity Knowledge Outputs -0.0090
(-0.0290...-0.0001)
-0.0251
(-0.0585...-0.0057)
-
0.0816
+
0.0537
Complexity Complementarity Knowledge Outputs 0.0112
(0.0005...0.0371)
0.0156
(-0.0140...0.0496)
+
0.1034
+
0.0531
Distance from Core Complementarity Network Outputs -0.0120
(-0.0286...-0.0014)
-0.0173
(-0.0412...0.0057)
-
0.1180
+
0.0001
Cost vis-à-vis average Complementarity Research Impacts -0.0155
(-0.0392...-0.0020)
-0.0376
(-0.0713...-0.0103)
-
0.0680
+
0.0018
Cost vis-à-vis average AC Research Impacts -0.0170
(-0.0419...-0.0023)
-0.0376
(-0.0713...-0.0103)
-
0.0095
+
0.0407

77
Interaction Effect
With… Through Mediator…
Dependent
Indirect Effect
(90% CI)
Total Indirect Effect (through
all mediators)
(90% CI)
A path
(p-value)
B path
(p-value)
Commercial Risk Complementarity Research Impacts -0.0129
(-0.0312...-0.0019)
-0.0291
(-0.0590...-0.0072)
-
0.0774
+
0.0013
Commercial Risk Absorptive Capacity Research Impacts -0.0120
(-0.0383...-0.0028)
-0.0291
(-0.0590...-0.0072)
-
0.0305
+
0.0288
Complexity Complementarity Research Impacts o.o166
(0.0017...0.0408)
0.0128
(-0.0195...0.0460)
+
0.1074
+
0.0008
Distance from Core Complementarity Research Impacts -0.0125
(-0.0340...-0.0017)
-0.0204
(-0.0484...-0.0003)
-
0.1010
+
0.0015
Distance from Core AC Research Impacts -0.0084
(-0.0297...-0.0003)
-0.0204
(-0.0484...-0.0003)
-
0.1452
+
0.0332
Cost vis-à-vis average AC Technology Outputs -0.0103
(-0.0297...-0.0008)
-0.0228
(-0.0430...-0.0050)
-
0.0129
+
0.1016
Cost vis-à-vis average Unclear Objectives Technology Outputs -0.0108
(-0.0273...-0.0003)
-0.0228
(-0.0430...-0.0050)
+
0.0064
-
0.1270
Commercial Risk AC Technology Outputs -0.0075
(-0.0247...-0.0005)
-0.0152
(-0.0329...-0.0032)
-
0.0261
+
0.0947

78
Table 12: Conditional mediational effects of log (budget) on project performance (full sample) a Only total indirect effects are significant
Interaction Effect
With… Through Mediator…
Dependent
Indirect Effect
(90% CI)
Total Indirect Effect
(through all mediators)
(90% CI)
A path
(p-value)
B path
(p-value)
Vertical Scope AC Goal Achievement -0.0057
(-0.0136…-0.0002)
-0.0143
(-0.0272…-0.0032)
-
0.1369
+
0.0000
Vertical Scope Difficulties in
Coordination
Goal Achievement -0.0063
(-0.0145…-0.0018)
-0.0143
(-0.0272…-0.0032)
+
0.0258
-
0.0043
Cost vis-à-vis
average
Difficulties in
Coordination
Goal Achievement -0.0035
(-0.0096...-0.0005)
-0.0092
(-0.0199…-0.0003)
+
0.1157
-
0.0052
Commercial Risk AC Goal Achievement -0.0054
(-0.0144…-0.0008)
-0.0116
(-0.0263…-0.0014)
-
0.0950
+
0.0000
Distance from
Core
AC Goal Achievement -0.0065
(-0.0149…-0.0009)
-0.0122
(-0.0242…-0.0010)
-
0.0901
+
0.0000
Cost vis-à-vis
averagea
Knowledge Outputs -0.0074
(-0.0183...-0.0002)
Commercial Risk Unclear Objectives Knowledge Outputs -0.0045
(-0.0153...-0.0001)
-0.0085
(-0.0214...0.0002)
+
0.0373
-
0.1282
Distance from
Core
AC Knowledge Outputs -0.0046
(-0.0170...-0.0001)
-0.0113
(-0.0276...-0.0031)
-
0.0134
+
0.1713
Commercial Risk AC Network Outputs -0.0030
(-0.0109...-0.0001)
-0.0077
(-0.0173...0.0009)
-
0.1245
+
0.0229
Distance from
Core
AC Network Outputs -0.0050
(-0.0135...0.0011)
-0.0107
(-0.0221...-0.0028)
-
0.0229
+
0.0211
Cost vis-à-vis
average
AC Research Impacts -0.0032 -0.0061 - +

79
(-0.0110...-0.0001) (-0.0156...0.0019) 0.1453 0.0260
Commercial Risk AC Research Impacts -0.0044
(-0.0129...-0.0002)
-0.0077
(-0.0195...0.0022)
-
0.0867
+
0.0222
Distance from
Core
AC Research Impacts -0.0066
(-0.0170...-0.0014)
-0.0124
(-0.0242...-0.0023)
-
0.0130
+
0.0238
Commercial Riska Technology Outputs -0.0055
(-0.0130...-0.0003)
Distance from
Core
AC Technology Outputs -0.0037
(-0.0098…-0.0006)
-0.0064
(-0.0142…-0.0013)
-
0.0259
+
0.0809

80
CHAPTER 4 SUMMARY AND CONCLUSIONS
The objective of this study was to assess empirically whether economies of scale exist at
the research project level. The assumption underlying European Union research policy is
that such economies exist, hence the emphasis placed on the 'critical mass' of research
and development (R&D) projects. More concretely, the research questions to be
answered in the context of this project were:
Are larger research projects more productive in scientific and technological terms
than smaller research projects?
Why is this or is this not the case? What are the explanatory factors? Under what
conditions are larger research projects more/less productive than smaller research
projects?
There are many factors that must be taken into account in determining the relation
between scale and performance. An elaborate conceptual framework in this study, based
on an extensive literature review, categorised them as follows:
First, there are three sets of factors that mediate the relation between project scale
and performance: (a) the pool of available resources, (b) the learning process
(absorptive capacity), and (c) the transaction costs. That is to say, these factors 'sit
between' scale and performance.
The industry and market environment(s) in which the research project is
positioned will affect performance as well. They do so because the industry and
market environment(s) determine the technological opportunities, appropriability
regimes, and market demand relevant to the respective project.
Three additional sets of factors moderate the relation between project scale and
the pool of resources, learning processes, and transaction costs, bearing additional
indirect influence on the relation between scale and performance: (a) partner
characteristics (mainly the resources committed to the project), (b) project
characteristics (e.g. technical risk, commercial risk), and (c) project management
(e.g. communication and coordination).
Of course, 'performance' can be measured in different ways: project performance is a
broad and multidimensional concept which, for the purpose of this study, was comprised
of eight dimensions:

81
Goal achievement – the degree to which the project achieved its scientific,
technical and commercial objectives
Knowledge outputs – publications, doctoral dissertations and so forth
Technological outputs – tools and techniques, models, simulations, prototypes,
etc.
Network outputs – building relationships with other organisations
Research capacity impacts – effects on the capacity of the partner to undertake
research such as research staff, technological skills, critical mass
Commercial outputs – increased turnover, profitability, competitiveness
Product innovation – new or improved products or services
Process innovation – new or improved production processes
Our analysis sought to capture the effects of project scale on all eight dimensions of
performance while controlling for the mediating and moderating sets of variables. It was
thus a multi-layered analysis based on extensive statistical and econometric appraisals of
a rich set of information covering all the thematic areas and research instruments of the
Fifth and Sixth European Framework Programmes (FP5, FP6).
The study team aimed to leverage existing data sets to the extent possible as well as to
collect new data as needed to enable the elaborate analysis required by the conceptual
model. Ultimately, the utilised data were derived from three sources: (i) the 'InnoImpact'
survey (a previous survey the team had carried out to identify the innovation performance
of FP projects), (ii) a follow-up survey specifically devised and carried out for this
project, and (iii) CORDIS data. The follow-up survey determined the final sample
utilised in the study. This sample consisted of responses from 1,172 organisations
participating in a total of 676 research projects funded by FP5 and FP6. We received one
response per project for 348 projects, two responses for 205 projects, and three or more
responses for the remaining 123 projects.
Summary Conclusion
Overall, our analysis cannot support a simple assumption that 'bigger is better' for the
performance of collaborative R&D projects in the context of the European Framework
Programmes. Some of the basic assumptions on increasing returns to scale to
collaborative R&D underlying the change in the general orientation of the FPs towards
larger projects are lacking strong empirical foundation and hence should be re-
considered.
This aggregate conclusion is predicated on a set of results from the descriptive statistical
analysis and the econometric analysis summarised in the remainder of this Section.
Main Results from the Descriptive Statistical Analysis
An extensive descriptive analysis provided the first visual summary of the obtained
information and a first insight into the core research question of this study, which was to
assess to which extent the size of Framework Programme collaborative R&D projects
affect project outcome. Project size was approached on the basis of three measures:

82
number of project participants (organisations)
total budget of the collaborative research project
average budget each project participant received
The first two measures reflect the absolute project size of a research project while the
third measure reflects relative project size.
The number of partners does not affect significantly three dimensions of project
performance: overall goal achievement, knowledge outputs, and technological
outputs. On the other hand, larger (but not the largest) projects seem to have
significantly higher network output than small and medium size projects,
significantly higher research capacity impacts than medium and very large
projects, and significantly higher commercial impacts than small projects. No
consortium size seems to stand out in terms of product and process innovations.
Overall, while the absolute size of research projects in terms of numbers of
partners has some effects on project performance, the relation is not linear. It
rather varies across different performance dimensions, barring both product and
process innovations where the project size makes no statistically important
difference. It appears that 'more partners' is not tantamount to 'better
performance'. The impression we get is rather that of an inverse U-shaped
relation, implying that 'too small' projects as well as 'too large' projects perform
less well. This is a confirmation of one of our main hypotheses and constitutes a
mayor finding of our study. It reappears throughout the different sub-sequent
levels of analysis.
Turning to average participant funding as a (relative) measure of project size, we
get a stronger relation between project size and project performance. In particular,
there seems to be a positive correlation between average funding per partner and
knowledge output, technological output, and research capacity impacts. Low
funding projects with low levels of average funding per participant exhibit
significantly lower performance in these indicators than projects in the categories
'high funding' and 'very high funding'. These positive relations predominantly
surface in specific instruments, namely STREPS and IPs.
Descriptive statistics generally do not support the hypothesised positive
correlation between research project size (number of partners) and absorptive
capacity and resource complementarities. Project size, however, seems to cause
increased transaction costs: small and medium sized projects have clearer
objectives and less coordination difficulties than very large projects. An
impression of negative mediation effects thus emerges.
All in all, the descriptive analysis points out that there is no absolute advantage of project
size, when measured by the number of partners, on performance. When measured by the
average funding per partner, (relative) project size is more strongly related to a number of
performance dimensions, namely knowledge output, technological output, and research
capacity impact. Commercial outputs, however, including product/service and process
innovations are unaffected by project size irrespective of its measurement.

83
On the contrary, larger projects appear to add significantly to transaction costs. But larger
collaborative projects in terms of average funding per participant also can attract larger
and more sophisticated partners and allow them to undertake projects that are riskier,
more complex, and of longer duration compared to what they do individually.
Comparison between the two measures of scale reveals that it is not necessarily the
absolute size, but the relative project size which might be responsible for 'critical mass'
effects. A possible conclusion for the FPs is to see to it that the number of partners does
not dilute the potential scale effects of the amount of funding per partner.
Main Results from the Econometric Analysis
The econometric analysis was run both for the full sample – including all types of project
participants – and various 'sub-samples' (including a firm sub-sample). The analysis of
the full sample considered only five dimensions of performance, excluding commercial
impacts and product/service and process innovations. The analysis of the firm sub-sample
considered all eight dimensions of performance.
There were three analytical steps of progressively higher complexity. Step 1 asked
directly whether scale affects project performance. Step 2 examined the hypothesis of
simple mediational effects: simply put, that the effect of an independent variable (project
scale) on the dependent variable (project performance) is transmitted through a third
variable (mediator). The mediator variables included resource complementarity,
absorptive capacity (learning process), clarity of objectives, and coordination difficulties.
Step 3 went further to test whether these indirect effects are not 'simple', that is, whether
they are conditionally based on certain variables that moderate (interact with) scale to
influence the mediators and, through them, performance. Moderator variables included
partner and project characteristics and project management.
Direct Effects
Turning to the key question, results for the full sample suggest increasing and
then decreasing returns to scale for one of the performance dimensions, network
outputs. Hence, with respect to network outputs, up to a certain threshold, higher
scale (higher number of partners) is associated with increased performance but,
beyond that threshold, the returns to scale are diminishing. Consistent with the
inverse U-shaped hypothesis, we also obtained similar results for the remaining
performance dimensions, but these coefficients are not statistically significant.
The size of the estimated threshold varies considerably across project
performance dimensions: just under 30 partners (network outputs), more than 10
(goal achievement), more than 4 (knowledge outputs), 5.5 (technological outputs),
and 9.5 (research capacity impacts). These figures represent the 'optimal' size of
the consortium for each of these dependent variables, respectively. The estimated
optimal size of the consortium is well within the empirical distribution of the
number of partners in the sample.
This result is reasonable, in the sense that possibilities for networking increase
when the consortium is large, not small. Still, when the consortium becomes too
large, these effects begin to diminish. In contrast, the optimal size with regard to
the remaining performance dimensions is well below the respective average size
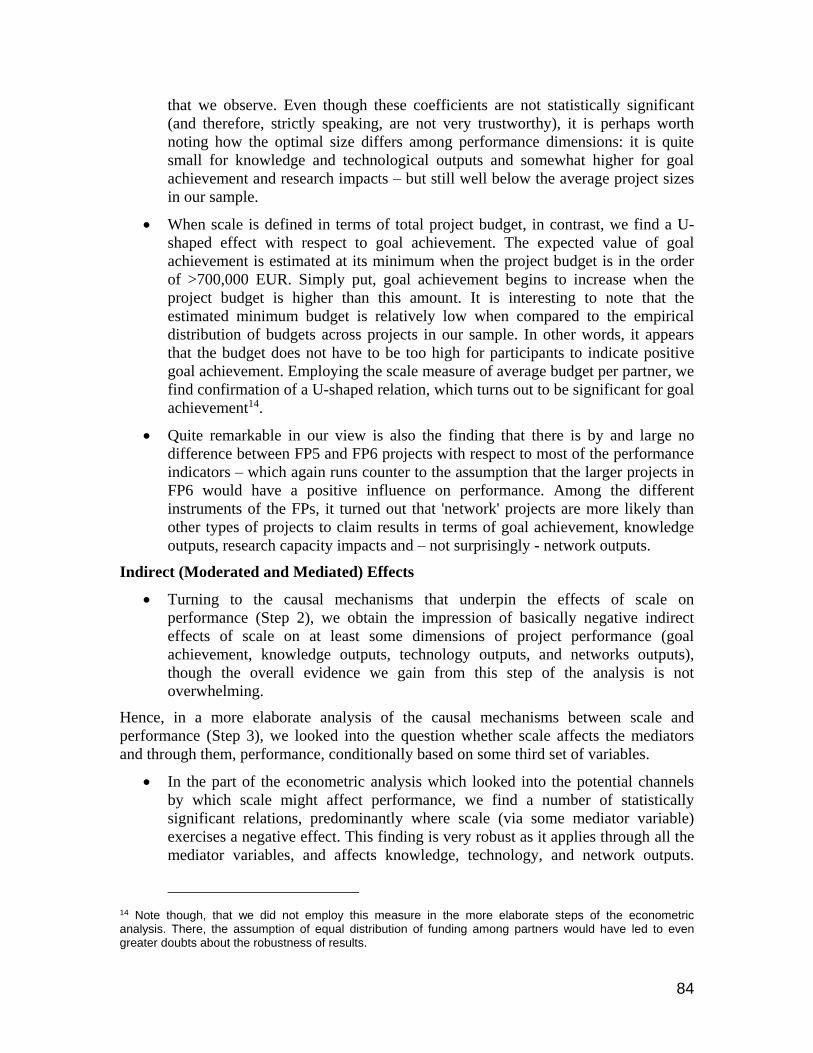
84
that we observe. Even though these coefficients are not statistically significant
(and therefore, strictly speaking, are not very trustworthy), it is perhaps worth
noting how the optimal size differs among performance dimensions: it is quite
small for knowledge and technological outputs and somewhat higher for goal
achievement and research impacts – but still well below the average project sizes
in our sample.
When scale is defined in terms of total project budget, in contrast, we find a U-
shaped effect with respect to goal achievement. The expected value of goal
achievement is estimated at its minimum when the project budget is in the order
of >700,000 EUR. Simply put, goal achievement begins to increase when the
project budget is higher than this amount. It is interesting to note that the
estimated minimum budget is relatively low when compared to the empirical
distribution of budgets across projects in our sample. In other words, it appears
that the budget does not have to be too high for participants to indicate positive
goal achievement. Employing the scale measure of average budget per partner, we
find confirmation of a U-shaped relation, which turns out to be significant for goal
achievement14.
Quite remarkable in our view is also the finding that there is by and large no
difference between FP5 and FP6 projects with respect to most of the performance
indicators – which again runs counter to the assumption that the larger projects in
FP6 would have a positive influence on performance. Among the different
instruments of the FPs, it turned out that 'network' projects are more likely than
other types of projects to claim results in terms of goal achievement, knowledge
outputs, research capacity impacts and – not surprisingly - network outputs.
Indirect (Moderated and Mediated) Effects
Turning to the causal mechanisms that underpin the effects of scale on
performance (Step 2), we obtain the impression of basically negative indirect
effects of scale on at least some dimensions of project performance (goal
achievement, knowledge outputs, technology outputs, and networks outputs),
though the overall evidence we gain from this step of the analysis is not
overwhelming.
Hence, in a more elaborate analysis of the causal mechanisms between scale and
performance (Step 3), we looked into the question whether scale affects the mediators
and through them, performance, conditionally based on some third set of variables.
In the part of the econometric analysis which looked into the potential channels
by which scale might affect performance, we find a number of statistically
significant relations, predominantly where scale (via some mediator variable)
exercises a negative effect. This finding is very robust as it applies through all the
mediator variables, and affects knowledge, technology, and network outputs.
14 Note though, that we did not employ this measure in the more elaborate steps of the econometric analysis. There, the assumption of equal distribution of funding among partners would have led to even greater doubts about the robustness of results.

85
Thus we find that with increased size, the coordination costs become higher, the
objectives of the project appear less clear to the partners, complementarities of
resources and competences are diminished and absorptive capacity is reduced. All
of this has a bearing on goal achievement, knowledge, technology and network
outputs.
This finding of significant indirect effects, which holds for three of the performance
dimensions, provides some support to the hypothesis that scale (in this case,
consortium size) influences performance indirectly through intervening variables –
and negatively in almost all cases.
In the part of our econometric analysis which looked into the indirect effects of
scale working through 'moderator variables', we found a large number of negative
relations between different size and performance variables. Often, increasing the
number of partners or the budget results either in increased difficulties in
coordination and higher transaction costs. It also lowers the effectiveness of
learning and the complementarity of resources or reduces clarity of objectives,
which in turn negatively affects each single output category (goal achievement,
knowledge output, technological output, network output, or research capacity
impact) at least once.
Again, we find hints that these negative effects are often due to the 'over-sizing' of
projects, as negative relations are mostly to be found for projects which have
already either high vertical scope and are perceived to be already 'higher-than-
average' cost projects. Also, if projects have a higher commercial risk and lie in
some distance to the core technological area of the partner, negative effects can be
observed. Only when scale is increased in projects of high complexity, we find
some positive effects with respect to knowledge and research outputs.
The notable exception to this general assessment – and it is an important
exception – are the results obtained from the firm sample. Here, we find a
relatively large number of positive effects of size, both for the number of partners
(which in some cases exercise positive influence on commercialisation impacts,
research impacts and goal achievements) and for budget size (which influences all
intermediary variables positively and hence has a positive mediated impact on
performance). Recall, however, that in the analysis of the direct effects in the firm
sub-sample, analyses produced very little evidence of significant scale effects on
performance.
To sum up, the analytical results indicate that increasing scale can degrade project
performance, and does so beyond certain reasonable levels (with the notable exception of
firms, which seem to benefit from increasing scale, particularly in terms of budget, with a
positive effect mainly on commercialisation impacts). We also found a curvilinear effect
on some performance dimensions when we looked into the direct relations between scale
and performance, including indirect effects, which provided some indication of
unconditional negative effects of scale. The analysis of 'mediated' indirect effects, finally,
gave considerable evidence that, with the exception of the firm sub-sample, the
conditional effects of scale are mostly negative. Taken overall, the results from all three
steps of the econometric analysis indicate that increasing scale generally degrades project

86
performance (with the notable exception of firms, which seem to benefit from increasing
scale, particularly in terms of budget, displaying a positive effect mainly on
commercialisation impacts).
Step 1 showed a 'curvilinear' effect on at least some performance dimensions. Recall,
however, that in the firm sub-sample, analyses produced very little evidence of
significant scale effects on performance. In addition, whereas Step 2 provided some
indication of unconditional negative indirect effects of scale, Step 3 gave considerable
evidence that, with the exception of the firm sub-sample, the conditional effects of scale
are mostly negative. It should be stressed however, that the 'exception' is important:
private enterprises are key addressees of and actors in the Framework Programmes, since
they are expected to translate research results into concrete innovation outputs. It is
perhaps not surprising that our results indicate firms in the sample obtain higher
performance, mainly in terms of commercialisation impacts, in projects with large
budget.
Summing up the Main Findings
To sum up, the study indicates that increasing scale generally does not improve project
performance unequivocally – with the notable exception of firms, which seem to benefit
from increasing scale, particularly in terms of budget, displaying a positive effect mainly
on commercial impacts.
While the results from the various analytical steps do not always provide an
unequivocal picture as to the net effect of scale on collaborative R&D
performance, we have shown that scale does not seem to have a particularly
strong effect on performance and that, if it does, it does so in complex ways:
mostly, its effects are transmitted through critical intervening variables, such as
the complementarity of resources, learning and transaction costs. When the net
effect is negative (which is most of the time), it is because increasing scale lowers
the positive effect of resources and learning, and magnifies the negative effect of
transaction costs.
Conversely, when it is found positive, it is because it strengthens the positive
effect of resources and learning, and diminishes the negative effect of transaction
costs. Finally, we have also shown that these negative (or in certain cases
positive) effects materialise conditionally based on other factors, which basically
relate to the characteristics of the project itself.
Overall, our results raise suspicion that the sizes of projects in the FPs are currently rather
too large than too small. This is supported by comparisons of the respective hypothetical
'optimal sizes' (which are different for different performance indicators15) with actual
project sizes. In quite a number of cases – for both number of partners and total budget –
we find that optimal size with regard to performance is well below the respective average
size, hinting to 'oversized-projects'.
15 Quite small for knowledge and technology related outputs (4-6 partners), somewhat larger for goal
achievement and research impacts. Also it appears that budget does not have to be too high for participants to achieve
project goals.
87
In terms of lessons for policymakers and programme managers concerned with the FPs, a
few quite clear messages emerge:
The basic assumption of 'bigger is better' in collaborative R&D projects is not
supported by our analysis. Hence, we believe that the rationale for increasing
project sizes in the FPs should be carefully reconsidered.
Especially, we would warn against increasing the scale of collaborative R&D
projects in the FPs without very good knowledge about the 'optimal' or rather
'most appropriate' size. It remains doubtful, though, whether such knowledge can
actually be obtained ex-ante.
A case could be made for having a closer look at the distribution of funds among
partners, and especially with an eye to the participants of the business sector,
where size is indeed translated into positive effects on performance – at least in
some instances.
Given the importance of the issue for the European Research Area (ERA),
monitoring the effects of R&D project scale and scope on performance for the
various broad technology areas and main funding instruments should become a
regular part of the monitoring and evaluations of the Framework Programmes.

88
REFERENCES
Balachandra, R. and JH. Friar. 1997. Factors for Success in R&D Projects and New
Product Innovation: A contextual Framework. IEEE Transactions on Engineering
Management, Vol. 44, No. 3, pp.276-87.
Baron, R. M. & Kenny, D. A. 1986. The moderator-mediator variable distinction in social
psychological research: Conceptual, strategic, and statistical considerations.
Journal of personality and social psychology, 51(6): 1173-1182.
Bollen, K. A. & Stine, R. 1990. Direct and indirect effects: Classical and bootstrap
estimates of variability. Sociological methodology, 20(1): 15-140.
Caloghirou Y., Hondroyiannis G. and Vonortas N. S. 2003. The performance of Research
Partnerships. Managerial and Decision Economics, 24.
Caloghirou Y., Ioannides, S. and Vonortas N. S. (eds). 2004. European Collaboration in
Research and Development: Business Strategies and Public Policies,
Northampton, MA: Edward Elgar.
Caloghirou Y., Ioannides, S. and Vonortas N. S. 2003. A Critical Survey of theoretical
and empirical literature. Journal of Economic Surveys, 17(4).
Cohen W.M. and Levinthal D.A. 1990. Absorptive Capacity: a New Perspective on
Learning and Innovation. Administrative Science Quarterly, Vol. 35, pp. 128-152.
Cohen WM, Levin RC. 1989. Empirical studies of innovation and market structure. In
Handbook of Industrial Organization, Schmalensee R, Willig RD (eds). Elsevier
Science: Amsterdam; 1060–1107.
Geroski, P., Machin, S., & Reenen, J. V. 1993. The Profitability of Innovating Firms. The
RAND Journal of Economics, 24(2): 198-211.
Gibson, C., & Vermeulen, F. 2003. A healthy divide: Subgroups as a stimulus for team
learning behavior. Administrative Science Quarterly, 48: 202-239.
Grimaldi and Tunzelmann (2002) Outline the following main benefits for science-
industry collaboration according to (Matthews and Norgaard, 1984; Al-Ali, 1992;
Cukor, 1992; Senker et al., 1993; Quintas and Guy, 1995).
Grimaldi, R. and N. Tunzelmann. 2002. Assessing collaborative, pre-competitive R&D
projects: the case of the UK LINK scheme. R&D Management, Vol. 32, pp. 165-
173.

89
Gulati, R. 1998. 'Alliances and networks,' Strategic Management Journal (19) pp. 293-
317.
Hagedoorn J., A.N Link. and N.S. Vonortas, (2000), 'Research Partnerships', Research
Policy, Vol. 29, No. 4-5, pp. 567–586.
Hagedoorn, J. 1993. Understanding the Rationale of Strategic Technology Partnering:
Interorganizational Modes of Cooperation and Sectoral Differences. Strategic
Management Journal, 14(5): 371-385.
Hemphill, T. and Vonortas, N. S. 2003. Strategic research partnerships: A managerial
perspective. Technology Analysis and Strategic Management, 15(2): 255-71.
Henderson R, Cockburn I. 1996. Scale, scope and spillovers: the determinants of research
productivity in drug discovery. RAND Journal of Economics 27(1): 32–59.
Hirst, G., Mann, L. (2004), 'A model of R&D leadership and team communication: the
relationship with project performance', R&D Management, Vol. 34, No. 2, pp.
147-160, March 2004.
Hoegl, M., Weinkauf, K und Gemünden, H. G. 2004. Inter-Team Coordination, Project
Commitment, and Teamwork: A Longitudinal Study. Organization Science,
15:38-55.
Katila, R., & Shane, S. 2005. When does lack of resources make new firms innovate?.
Academy of Management Journal, 48(5): 814-829.
Katz, M. L. (1993). 'Research joint ventures as a means of assembling complementary
inputs', working paper, University of California, Berkeley, CA.
Kenny, D. A., Kashy, D. A., & Bolger, N. 1998. Data analysis in social psychology. The
handbook of social psychology, 1: 233-265.
Kogut, B., & Zander, U. 1992. Knowledge of the Firm, Combinative Capabilities, and the
Replication of Technology. Organization Science, 3(3): 383-397.
Kuhlmann S. 2002. Evaluation of Socio-Economic Impacts of Public R&D. Practices and
Experiences in Europe, Presentation: Tokyo, April 18-19 2002.
Lane, P. J. and Lubatkin, Michael. 1998. Relative absorptive capacity and
interorganizational learning. Strategic Management Journal, Vol. 19, No. 5, pp.
461-477.
Lane, P.J., Salk, J.E., and Lyles, M.A.2001. Absorptive Capacity, learing and
performance in international joint ventures, Strategic Management Journal, Vol.
22. pp. 1139-1161.
Levinthal, D.A. & March, J.G. 1993. The Myopia of Learning. Strategic Management
Journal, 14, 95-112.
Malerba, F. and Vonortas, N. S. (eds). 2009. Innovation Networks in Industries, Edward
Elgar.
March, J. G. 1991. Exploration and Exploitation in Organizational Learning.
Organization Science, 2(1): 71-87.

90
MacKinnon, D. P. 2008. Introduction to statistical mediation analysis: Erlbaum Psych
Press.
Nooteboom, B. (2000), Learning and innovation in organizations and economies, Oxford,
Oxford University Press.
Oxley, J. E., and Sampson, R. S. 2004. The Scope and Governance of International R&D
Alliances. Strategic Management Journal, 25: 723-749.
Patel P, Pavitt K. 1995. Patterns of technological activity: their measurement and
interpretation. In Handbook of the Economics of Innovation and Technological
Change, Stoneman P (ed). Blackwell: Cambridge, U.K.; 14–51.
Powell, W. W., & Koput, K.W., & Smith-Doerr, L. (1996), Interorganizational
Collaboration and the Locus of Innovation: Networks of Learning in
Biotechnology. Administrative Science Quarterly 41(1):116-45.
Preacher, K. J., & Hayes, A. F. 2008. Asymptotic and resampling strategies for assessing
and comparing indirect effects in multiple mediator models. Behavior Research
Methods, 40, 879-891.
Preacher, K. J. & Hayes, A. F. 2004. SPSS and SAS procedures for estimating indirect
effects in simple mediation models. Behavior Research Methods, 36(4): 717.
Preacher, K. J., Rucker, D. D., & Hayes, A. F. 2007. Addressing moderated mediation
hypotheses: Theory, methods, and prescriptions. Multivariate Behavioral
Research, 42(1): 185-227.
Rothaermel, F. T., & Deeds, D. L. 2004. Exploration and Exploitation Alliances in
Biotechnology: A System of New Product Development. Strategic Management
Journal, 25: 201-221.
Ruegg, R., Feller, I. (2003): A Toolkit for Evaluating Public RTD Investment, NIST
GCR 03-875 (National Institute of Standards and Technology).
Sakakibara, M. 2002. Formation of R & D consortia: industry and company effects.
Strategic Management Journal, 23(11): 1033-1050.
Schilling, M. A. 2005. Strategic Management of Technological Innovation. New York:
McGraw Hill International Edition.
Shrout, P. E. & Bolger, N. 2002. Mediation in experimental and nonexperimental studies:
New procedures and recommendations. Psychological methods, 7(4): 422-445.
Sinha, D. and M. Cusumano, 1991, Complementary Resources and Cooperative
Research: A Model of Research Joint Ventures among Competitors, Management
Science, Vol. 37 (9), 1091-1106.
Sobel, M. E. 1986. Some new results on indirect effects and their standard errors in
covariance structure models. Sociological methodology, 16: 159-186.
Stuart, T. 1998. Network positions and propensities to collaborate: an investigation of
strategic alliance formation in a high-technology industry. Administrative Science
Quarterly 43, 637-668.
91
Vonortas, N. S. 1997. Cooperation in Research and Development, Boston, MA;
Dordrecht, Netherlands: Kluwer Academic Publishers.
Vonortas, N. S. 2009. Scale and Scope in Research, in Luc Delanghe, H., Muldur, U. and
Soete L. (eds), European Science and Technology Policy: Towards Integration or
Fragmentation?, Edward Elgar.
Westney, E. 1988. Domestic and foreign learning curves in managing international
cooperative strategies. In F. J. Contractor and P. Lorange (eds). Cooperative
Strategies in International Business: Joint Ventures and Technology Transfers
Between Firms. Lexington Books, New York, pp. 339–346. Seabright, M., D.
Levinthal.
Wong, S. S. 2004. Distal and Local Group Learning: Performance Trade-offs and
Tensions. Organization Science, 15(6): 645-656.
Zahra, S. A., & George, G. 2002. Absorptive capacity: A review, reconceptualization,
and extension. The Academy of Management review, 27(2): 185-203.
Zöllner, U. (2003) Praxishandbuch Projektmanagement. Das neue, umfassende Handbuch
für Führungskräfte und Projektmitarbeiter, Bonn.


![[MICRO1-2] Chandler (1990) - Conclusion - Scale and Scope](https://static.documents.pub/doc/80x56/5537559f4a7959fe128b4d1c/micro1-2-chandler-1990-conclusion-scale-and-scope.jpg)


