Page 1
SYNTHESIS Scale-dependent species–area andspecies–isolation relationships: a reviewand a test study from a fragmentedsemi-arid agro-ecosystemItamar Giladi1,2*, Felix May3,4, Michael Ristow3, Florian Jeltsch3
and Yaron Ziv2
1Mitrani Department of Desert Ecology, The
Jacob Blaustein Institutes for Desert Research,
Ben-Gurion University of the Negev,
Midreshet Ben-Gurion 84990, Israel,2Department of Life Sciences, Ben-Gurion
University of the Negev, Beer Sheva 84105,
Israel, 3Department of Plant Ecology and
Conservation Biology, The University of
Potsdam, Potsdam 14469, Germany,4Department of Ecological Modelling, Helmholtz
Centre for Environmental Research – UFZ,
D-04318 Leipzig, Germany
*Correspondence: Itamar Giladi, Mitrani
Department of Desert Ecology, The Jacob
Blaustein Institutes for Desert Research,
Ben-Gurion University of the Negev, 84990,
Midreshet Ben-Gurion, Israel.
E-mail: [email protected]
ABSTRACT
Aim Patterns that relate species richness with fragment area (the species–area
relationship, SAR) and with isolation (the species–isolation relationship, SIR)
are well documented. However, those that relate species density – the number
of species within a standardized area – with fragment area (D-SAR) or isola-
tion (D-SIR) have not been sufficiently explored, despite the potential for such
an analysis to disentangle the underlying mechanisms of SARs and SIRs. Previ-
ous spatial theory predicts that a significant D-SAR or D-SIR is unlikely to
emerge in taxa with high dispersal limitation, such as plants. Furthermore, a
recent model predicts that the detection and the significance of D-SARs or
D-SIRs may decrease with grain size. We combined a literature review with
grain size-dependent sampling in a fragmented landscape to evaluate the
prevalence and grain size-dependent nature of D-SARs and D-SIRs in plants.
Location Worldwide (review) and a semi-arid agro-ecosystem in Israel (case
study).
Methods We combined an extensive literature review of 31 D-SAR studies of
plants in fragmented landscapes with an empirical study in which we analysed
grain size-dependent D-SARs and D-SIRs using a grain size-dependent hierar-
chical sampling of species density and species richness in a fragmented, semi-
arid agro-ecosystem.
Results We found that significantly increasing D-SARs are rare in plant stud-
ies. Furthermore, we found that the detection of a significant D-SAR is often
possible only after the data have been stratified by species, habitat or landscape
characteristics. The results from our case study indicated that the significance
and the slopes of both D-SARs and D-SIRs increase as grain size decreases.
Main conclusions These results call for a careful consideration of scale while
analysing and interpreting the responses of species richness and species density
to fragmentation. Our results suggest that grain size-dependent analyses of
D-SARs and D-SIRs may help to disentangle the mechanisms that generate
SARs and SIRs and may enable early detection of the effects of fragmentation
on plant biodiversity.
Keywords
Conservation biogeography, extinction debt, habitat fragmentation, habitat
islands, island biogeography theory, island ecology, isolation, scale-dependence,
species–area relationship, species density.
ª 2014 John Wiley & Sons Ltd http://wileyonlinelibrary.com/journal/jbi 1doi:10.1111/jbi.12299
Journal of Biogeography (J. Biogeogr.) (2014)
Page 2
INTRODUCTION
The island biogeography theory (IBT; MacArthur & Wilson,
1967) is based on two fundamental premises: a decrease in
extinction rate with island area and a decrease in colonization
rate with island isolation. These premises underlie two impor-
tant ecological patterns: an increase in species richness with
island area (species–area relationship, SAR) and a decrease in
species richness with island isolation (species–isolation
relationship, SIR) (Rosenzweig, 1995; Whittaker & Fern�andez-
Palacios, 2007). Inspired by the IBT and driven by growing
interest in and concern about the effects of habitat loss and
habitat fragmentation on biodiversity, many studies have
focused on SARs, SIRs and their underlying mechanisms in
fragmented (patch-matrix) landscapes (Lindborg & Eriksson,
2004; Adriaens et al., 2006; Cousins, 2006; Vellend et al., 2006;
Watling & Donnelly, 2006; Cousins et al., 2007; Laurance,
2008; Prevedello & Vieira, 2010; Fahrig, 2013; Hanski et al.,
2013).
Evidence for decreasing SIRs in fragmented landscapes is
scarce (Fahrig, 2003; Watling & Donnelly, 2006). One expla-
nation for the lack of evidence is the slow response of organ-
isms to fragmentation that may conceal SIRs in recently
fragmented landscapes, an effect known as the extinction
debt (Helm et al., 2006; Vellend et al., 2006; Cousins, 2009).
In contrast, the evidence for increasing SARs in fragmented
landscapes is overwhelming (Fahrig, 2003; Watling &
Donnelly, 2006). But whereas a decreasing SIR is attributed
exclusively to the decrease in the colonization rate with the
increase in isolation as proposed by the IBT, an increasing
SAR in fragmented systems can be attributed to one or more
non-mutually exclusive mechanisms that may operate simul-
taneously. Those mechanisms are often classified into five
main categories (Table 1; Hill et al., 1994; Turner & Tjørve,
2005; see also Scheiner et al., 2011, for a comprehensive list
of potential mechanisms). Three of these mechanisms are
related to sampling, which may refer to the allocation and
distribution of sampling efforts by the researchers (random
sampling) or to the natural ‘sampling’ process of a larger
species pool by natural sampling units, such as islands or
fragments (random placement and the target area). The two
other mechanisms, which are ecological in nature, relate to
the habitat heterogeneity and the equilibrium hypotheses. As
these mechanisms can act either individually or in concert,
the mere documentation of a significantly increasing SAR
does not constitute a rigorous test of any of them, instead
dictating the need for additional measures to distinguish the
potential contribution of each mechanism (Hill et al., 1994;
Lomolino, 2001; Cook et al., 2002; Turner & Tjørve, 2005;
Laurance, 2008; Matias et al., 2010; Hanski et al., 2013).
One proposed approach for disentangling the effects of
various mechanisms on SARs is to test the relationship
between the number of species within a standardized sam-
pling unit located within a fragment and the area of that frag-
ment (Kelly et al., 1989; Holt, 1992, 1993; Hill et al., 1994;
Gotelli & Graves, 1996; Hoyle, 2004; Schoereder et al., 2004;
Helm et al., 2006). In the following we will refer (1) to the
number of species in a standardized area as ‘species density’,
acknowledging that the terms ‘point-diversity’, ‘local species
richness’ and ‘a- diversity’ have been used in the same sense
(Gray, 2000; Cousins & Vanhoenacker, 2011; Giladi et al.,
2011), (2) to the relationship between fragment area and spe-
cies density as D-SAR, and (3) to the relationship between
fragment isolation and species density as D-SIR.
Species density is often highly correlated with and used as
a proxy for fragment-level species richness (Cook et al.,
2002; Lindborg & Eriksson, 2004). Consequently, D-SARs
and D-SIRs are sometimes analysed and interpreted as SARs
and SIRs, respectively. Patterns based on species density
(D-SARs and D-SIRs) can be understood to be the results of
processes operating at two levels, the first of which links
large-scale species richness (e.g. landscape species pool) with
fragment-level species richness, and the second of which
links fragment-level species richness with species density
(P€artel et al., 1996; Stiles & Scheiner, 2010). This conceptual-
ization, however, does not necessarily mean that the two sets
of processes are independent of each other. Specifically, the
existence and strength of a correlation between fragment-
level species richness and species density may depend
strongly on determinants of the fragment-level species pool
(P€artel et al., 1996) and on the grain size at which species
density is measured (Stiles & Scheiner, 2010).
Table 1 Processes and mechanisms hypothesized to contribute to the generation of an increasing species–area relationship (SAR), the
rationale underlying each proposed mechanism, and references to early classical works that developed these ideas.
Hypothesis Rationale References
Random sampling (a) Number of individuals sampled
increases with sampling effort.
(b) Species richness increases with sample size.
Preston (1962), Connor & McCoy (1979), Coleman (1981)
Random placement (a) Total number of individuals increases with area.
(b) Species richness increases with
number of individuals.
Connor & McCoy (1979), Coleman (1981)
Habitat diversity hypothesis (a) Habitat diversity increases with area.
(b) The contribution of different habitats
to species richness is complementary.
Williams (1943, 1964), MacArthur (1972)
Target area effect Colonization rate increases with area Connor & McCoy (1979, 2001) Gilpin & Diamond (1976)
Equilibrium hypothesis Extinction rate decreases with area Preston (1962), MacArthur & Wilson (1967)
Journal of Biogeographyª 2014 John Wiley & Sons Ltd
2
I. Giladi et al.
Page 3
The construction of the D-SAR is based on uniform sam-
pling that controls for random sampling and random place-
ment effects and that may also control for habitat
heterogeneity. Therefore, some authors have suggested that
the only mechanisms capable of generating a D-SAR are
those proposed by the equilibrium hypothesis and by the tar-
get area effect, which some authors have merged into a single
hypothesis (Kelly et al., 1989; Holt, 1992, 1993; Hill et al.,
1994; Gotelli & Graves, 1996; Hoyle, 2004; Schoereder et al.,
2004; Helm et al., 2006). In two influential papers on analy-
sing and interpreting D-SARs, Holt (1992, 1993) emphasized
that an increasing D-SAR is compatible with the habitat het-
erogeneity hypothesis (Table 1), arguing that the exchange of
transient species among habitats within a fragment, called
the ‘spillover effect’, augments species density within each
habitat. Thus, larger and more heterogeneous fragments,
which have higher species richness, will also have higher spe-
cies density, leading to an increasing D-SAR. As these
among-habitat enrichment processes are linked to dispersal
ability, Holt (1992) predicted that increasing D-SARs are
unlikely to be found for organisms with limited dispersal
capabilities, such as plants. To the best of our knowledge,
however, that prediction has not been tested.
The lack of evidence for increasing D-SARs in plants may
also be the result of the slow response of plants to habitat
fragmentation (Eriksson et al., 2002; Helm et al., 2006; but
see K€orner & Jeltsch, 2008). Recently, Cousins & Vanhoenac-
ker (2011) presented a model predicting that the response of
plant species to fragmentation will occur faster the smaller
the grain size. The rationale behind this model is that local
extinction caused by the negative effects of the post-fragmen-
tation increase in extinction and decrease in re-colonization
is most pronounced at the smaller scales and is buffered by
the within-fragment movement of individuals at larger scales.
Thus, during the transitional periods that follow fragmenta-
tion events, only small-scale (but not larger-scale) species
density is expected to correlate with fragment area and with
fragment isolation.
When sampling species density, habitat heterogeneity
within a sampling unit is expected to increase and resemble
fragment-level habitat heterogeneity as the size of that unit
increases. Thus, if the mechanism of habitat heterogeneity is
the main driver of the D-SAR, we should expect an increase
in the slope and significance of the D-SAR as grain size
increases (but see Scheiner et al., 2000). If D-SARs were gen-
erated mainly by the processes proposed by the target area
and equilibrium hypotheses, however, we would expect these
effects to be most apparent when the sampling units are
most homogenous, i.e. mainly at smaller grain sizes. If
D-SARs and D-SIRs are indeed grain size-dependent, our
ability to detect these patterns and to draw correct inference
from their analyses may vary with grain size. Interestingly,
although the responses of species density to its various
determinants have been shown to depend on grain size, very
few studies have assigned importance to the choice of grain
size in the analysis of species density response to area
(D-SAR) or isolation (D-SIR) (Scheiner et al., 2000; Stiles &
Scheiner, 2010; Brudvig & Damschen, 2011; Giladi et al.,
2011; Thornton et al., 2011). For D-SAR or D-SIR construc-
tion, the choice of grain size is often based on conventions
or practical considerations, or it is arbitrary, and specific
justification is seldom given (Kohn & Walsh, 1994; Rey
Benayas et al., 1999). To the best of our knowledge, ours is
the first study to systematically investigate the sensitivity of
D-SARs, D-SIRs and their slopes to grain size.
We combined an extensive literature review with an empir-
ical study to address several predictions about the prevalence,
detectability and interpretation of D-SARs and D-SIRs in
studies of plants in fragmented landscapes. If D-SARs are
attributed mainly to the spillover effect among habitats within
fragments, which necessitates considerable dispersal for colo-
nization to take place [Holt’s (1992, 1993) prediction], then
D-SARs in plant studies will have a slope of zero (P1). We
therefore assessed the prevalence of statistically significant
D-SARs in plant studies and compared it with the prevalence
of statistically significant SARs. If habitat heterogeneity is the
main mechanism driving D-SARs, we would expect stronger
correlations between species density and fragment area as
grain size increases (P2). Alternatively, if D-SARs are mainly
attributable to the target area effect and the equilibrium
hypothesis, then both D-SARs and D-SIRs should be most
evident when species density is measured at small grain size
(P3) (Cousins & Vanhoenacker, 2011). Finally, we expect
D-SARs, and especially D-SIRs, to be more pronounced when
historical rather than current landscape configurations are
used (P4). We evaluated these predictions against the existing
literature where these patterns were tested. Predictions P2
and P3 were also tested within our study system in a species-
rich fragmented Mediterranean landscape where species
density was simultaneously measured at different grain sizes.
MATERIALS AND METHODS
Literature search
We reviewed the evidence in the literature for D-SARs and
D-SIRs in plant studies by searching the literature for studies
that correlated species density of plants with fragment area
and/or with fragment isolation. In November 2012, we
searched the ISI Web of Science for candidate manuscripts
using two search chains – one focused on the D-SAR and
the other on the D-SIR. The first chain included (species
density OR local species richness OR alpha diversity) AND
(species–area OR SAR) AND plants. The second chain
included (species density OR local species richness OR alpha
diversity) AND fragmentation AND isolation AND plants.
We also employed a forward citation search of some early
papers on the subject (Kelly et al., 1989; Hill et al., 1994)
and evaluated those included in a recent review on a related
topic (Lindborg et al., 2012). We then read the abstract of
each candidate manuscript to determine whether it included
data and analyses relevant to D-SARs and/or D-SIRs. When-
Journal of Biogeographyª 2014 John Wiley & Sons Ltd
3
Scale-dependent species–area and species–isolation relationships
Page 4
ever an abstract was not sufficiently informative, we carefully
read the methods and results sections to decide which papers
to include in our analysis. For each manuscript included in
our analysis, we recorded the main vegetation type, which
pattern – SAR, SIR, D-SAR or D-SIR – was tested, which
patterns had a non-zero slope, the grain size used in species
density measurements, the method for calculating connectiv-
ity/isolation, stratification of the data, and the functional
form used to model each pattern.
Grain size-dependent D-SARs and D-SIRs
in a fragmented semi-arid agro-ecosystem
Study area
The study area is a 3.2 km 9 4 km landscape in central
Israel (31°31020″–31°33040″ N, 34°46050″–34°50020″ E)
located within a transition zone between Mediterranean and
desert ecosystems (Fig. 1). The climate is a typical semi-arid
with short mild winters and long, dry, hot summers. Average
annual temperature is 19 °C (12 °C in January, and 26 °C in
August; Goldreich, 2003). Average annual rainfall is 376 mm
(average for 1998–2009, measured within 3 km of the study
area boundaries; Data from the Ministry of Agriculture,
Israel). Soil types in the study area are mainly light-brown
loessial soils and light-brown rendzina (Dan et al., 1976).
The area has experienced grazing by sheep and goats and
small-scale agriculture for thousands of years (Naveh & Dan,
1973; Ackermann et al., 2008). Intensified agricultural prac-
tices over the past 60 years have reshaped the landscape,
such that today it comprises a mosaic of fragments of natural
vegetation within a predominately agricultural matrix
(Mazor, 2006; Svoray et al., 2007; Yaacobi et al., 2007).
At the time of the research, the study area contained 76
fragments of natural vegetation. These vary in size from
continuous (> 100 ha) to very small (< 100 m2) fragments,
the main vegetation types of which comprise semi-steppe
low scrubland and grassland with a decreasing shrub cover
from east to west. The most dominant perennial species are
the dwarf shrub Sarcopoterium spinosum among the scrub-
land vegetation, and the tussock grasses Hyparrhenia hirta
and Hordeum bulbosum in the grassland. The region’s flora is
species rich, including 415 vascular plant species observed
within the study area alone (I.G. and M.R., pers. obs.). The
percentage cover of the dominant shrubs in a plot varies
from 0 to 53% (mean � SD, 0.066 � 0.136) for Sarcopoteri-
um spinosum and 0 to 28% for Hyparrhenia hirta
(0.064 � 0.066). Plant density (measured at a grain size of
0.0625 m2) varies from 253 to 624 individuals m�2
(mean � SD, 423 � 109) (Giladi et al., 2011).
Vegetation sampling
Vegetation sampling was conducted in 39 fragments chosen
to represent wide ranges of fragment area and fragment
isolation (Fig. 1). About half of these fragments (20) were
sampled using uniform size, hierarchically nested sampling
plots. An initial set of 14 fragments were sampled using
225-m2 plots (which included 25-m2 subplots; details below
and in Giladi et al., 2011). This set was supplemented with
six additional fragments that were sampled using 25-m2 plots
to represent combinations of fragment area and isolation
that were absent from the initial set. The number of plots
placed within each fragment varied correlatively with frag-
ment area and ranged from 1 to 7 (see Appendix S1 in the
Supporting Information). Such a proportional sampling was
chosen to ensure that fragments of different sizes were ade-
quately represented and as a first approximation for frag-
ment-level species richness (Schoereder et al., 2004).
However, as such proportionality entails a strong sampling
Figure 1 Map of the study area in the
Lachish region of central Israel. Fragmentsof semi-natural vegetation that are within
the study area are marked with black lines.Fragments that were sampled for species
richness are shaded black. Fragments thatare currently larger than 15 ha (current
‘mainland’) are shaded white and fragmentsthat were mainland 20 years ago but have
since been either fragmented or disturbed(historical ‘mainland’) are marked with
stripes.
Journal of Biogeographyª 2014 John Wiley & Sons Ltd
4
I. Giladi et al.
Page 5
bias, sampling of fragment-level species richness of all 39
fragments was completed by a thorough survey of all plant
species by experienced botanists (M.R. and I.G.) very familiar
with the local flora.
In line with similar studies, the time spent surveying each
fragment was adjusted relative to fragment size and habitat
diversity (€Oster et al., 2007; Reitalu et al., 2012). Surveying
continued until a sharp decrease in the discovery rate of new
species was noticed by the surveyors. Fragment survey time
varied from approximately half an hour for the smallest and
most uniform fragments to a full day for the largest and most
diverse fragments. The uniform sampling was done according
to a hierarchical nested design modified after Kalkhan et al.
(2007). It yielded estimates of mean species density at three
grain sizes (0.0625, 1 and 25 m2) for 20 fragments, for 14 of
which the mean species density were also estimated at the
225-m2 grain size (for details see Giladi et al., 2011). All vas-
cular plant species within the sampling units were recorded at
the height of the growing season between early March and
early April, in either 2009 or 2010, and whole fragment spe-
cies lists were completed in 2010 and 2011. Plant identifica-
tion followed Feinbrun-Dothan & Danin (1991).
Fragment size and isolation measurements
We used rectified aerial photographs (Ofek Aerial Phototm,
Netanya, Israel, 2005, pixel size = 1 m2) to identify frag-
ments of natural vegetation within the study area. We then
demarcated their boundaries on a digitized map and stored
the information as vector-based coverage in a geographical
information system (GIS) platform (ArcInfoTM; ESRI, Red-
lands, CA, USA). The data were converted to a raster-based
layer (grid cell size = 5 m 9 5 m) and exported to frag-
stats© (McGarigal et al., 2002) to calculate fragment area,
distance to nearest neighbour, fragment proximity index and
distance to the ‘mainland’. The proximity index is a measure
of fragment isolation that quantifies the spatial context of a
fragment in relation to neighbouring fragments. For each
fragment i, the proximity index (PIi) is given by:
PI ¼Xn
j¼1
aj
h2ij(1)
where aij is the area of fragment j, hij the distance (edge-to-
edge) between fragment i and fragment j, and the summa-
tion is done over all n fragments that are within a certain
search radius rs of the focal fragment i. We present the data
analysis conducted with a proximity index calculated using
an rs of 1000 m (different radii yield similar proximity
values; Giladi et al., 2011).
In line with similar studies, the fragmented landscape in
our study does not contain a single, well-defined mainland.
Therefore, we defined each fragment of natural vegetation
larger than 15 ha as a mainland. Some of the fragments that
would have met our criteria for ‘mainland’ status 20 years
ago have since been further divided by the construction of a
road two years prior to the onset of the study or have been
drastically altered by landscaping activities and the planting
of exotic trees. Therefore, we calculated distance to the main-
land for two mainland scenarios: one (DistM1) only consid-
ered fragments that met mainland criteria at the time of the
study, and the second (DistM2) considered fragments that
met these criteria 20 years ago (Fig. 1).
Data analysis and statistics
The total number of species recorded in each fragment
(SRfragment) and the mean species density at each of the
smaller grain sizes (SpD0.0625, SpD1, SpD25, SpD225 at 0.0625,
1, 25 and 225 m2, respectively) were treated as the main
response variables. Fragment area, proximity index, Euclid-
ean nearest neighbour distance (ENN) and distance to the
mainland (for both scenarios DistM1 and DistM2) were ini-
tially treated as candidate explanatory variables. Prior to any
statistical analysis, fragment area, proximity index and dis-
tances to mainland were all log10-transformed. This was
done mainly to concur with two of the most common mod-
els of SAR used in plant studies, the power model and the
exponential (semi-log) model (Tjørve, 2003; Dengler, 2009;
Triantis et al., 2012). Because the data analysis in the main
text of this manuscript was based on assuming a power
model, we log-transformed species richness and species den-
sity prior to data analysis. However, we tested the robustness
of our main conclusions by repeating the analyses using an
exponential model.
After testing for correlation among independent vari-
ables, a set of uncorrelated explanatory variables was then
used in a series of linear models to test for their effects
on species richness and species density at each of the sam-
pling scales. We conducted all of the above mentioned
analyses separately for each sampling scale using the R sta-
tistical platform (R Development Core Team, 2012). We
used the ‘lm’ and the ‘anova’ functions in R for the con-
struction and analyses of the linear models, respectively.
The analysis of species richness and species density at each
sampling scale was performed with all the available data
for that scale.
RESULTS
Literature search
We found 31 studies of plants in fragmented landscapes that
tested for D-SARs, D-SIRs or both. About half of the studies
(18) were conducted in grasslands, less than a third (nine
studies) in forests or woodlands, and the rest in other,
mainly open, habitats (Appendix S2). Twenty-eight of these
studies tested D-SARs, 24 tested D-SIRs, 15 of them tested
SARs and only 10 tested SIRs.
Of the 15 studies that tested SARs the pattern was found
to be significantly increasing in most (87%), whereas only
36% of the 28 studies that tested for D-SARs found statistical
significance. Of the 10 and 24 studies that tested SIRs or
Journal of Biogeographyª 2014 John Wiley & Sons Ltd
5
Scale-dependent species–area and species–isolation relationships
Page 6
D-SIRs, 40% or 58%, respectively, found significantly
decreasing relationships (Table 2). Among the 15 studies that
tested for both SARs and D-SARs, four supported both pat-
terns, neither pattern was significant in two studies, and in
nine studies only the SAR was significantly increasing. Of the
nine studies that tested for both SIRs and D-SIRs, four
found full or partial support (i.e. for particular subsets of the
data) for both patterns, another four studies found that nei-
ther of the isolation patterns was significant, and one study
supported a significantly increasing D-SIR, but in that case
SIR had a slope of zero. All of the studies that found a sig-
nificantly positive SAR used direct measures of fragment-
level species richness and of the explanatory factors, but
without data stratification. Much of the support for the
other three patterns, however, was obtained only after the
data were stratified by plant characteristics, habitat or
landscape characteristics, or when historical landscape
configuration was used to calculate fragment area and
fragment isolation (Table 2).
The grain size used to measure species density in plant
studies that tested for D-SARs and/or D-SIRs ranged from
0.025 to 2800 m2, but most studies used a single grain size.
The plot sizes used in studies in which D-SARs and/or
D-SIRs were found to be significant ranged from 0.25 to
2800 m2. The grain size used in studies in which the D-SAR
was significant was similar to that used in studies in which
the D-SAR was not significant (median = 4 and 16 m2,
respectively, Wilcoxon test, W = 107, P = 0.93). The grain
size used in studies in which the D-SIR was significant was
somewhat smaller than in studies in which the D-SIR was
not significance (median = 4 and 100 m2, respectively), but
this difference was only marginally significant (Wilcoxon test,
W = 47, P = 0.06).
Only seven of the studies used the power model, 10 stud-
ies used the exponential model, 10 others used the linear
model, and the remainder used other models (e.g. categorical
or nonlinear relationships; Appendix S2). Most studies that
tested more than one relationship used the same functional
form for all the relationships tested within the study. The
analysis of the SAR was consistent across the functional
forms, with 4 vs. 1, 6 vs. 0, and 3 vs. 1 significant and non-
significant SAR for power, exponential and linear models,
respectively. The D-SAR gained little support in studies that
used the power or linear model (1 significant vs. 6 n.s. and 2
significant vs. 4 n.s., respectively) and an equal amount of
support (5 significant vs. 5 n.s.) when the exponential model
was used. Interestingly, support for the D-SIR was the weak-
est when the power model was used (0 significant vs. 2 n.s.),
equivocal for the exponential model (3 significant vs. 3 n.s.)
and most evident when the linear model was used (7
significant vs. 3 n.s.). Similar findings were observed for SIR,
although the low number of studies that tested this relation-
ship precludes drawing any strong conclusions. In general,
the results of our analysis were sensitive to the models cho-
sen by the researchers, an observation that should be consid-
ered in future studies.
Grain size-dependent D-SARs and D-SIRs
in a fragmented semi-arid agro-ecosystem
Initial examination of the explanatory variables indicated
that fragment proximity was negatively correlated with all
other measures of connectivity (ENN and distance to main-
land) and that the two measurements of distance to main-
land were highly correlated (with many fragments having the
same value for both; Table 3). Therefore, we conducted the
rest of the analysis with fragment area, DistM1 and ENN as
uncorrelated candidate explanatory variables.
In general, we found a positive relationship between frag-
ment area and species richness (SAR) and between fragment
area and species density (D-SAR) at different grain sizes
(Fig. 2). However, the D-SAR was significant for the three
smaller grain sizes, but was not significant for the 225-m2
grain size (Fig. 2). Most importantly, the slope of the D-SAR
in the linearized power model (z) decreased linearly with log
(grain size), with the slope of the D-SAR at the smallest grain
sizes comparable to that of the SAR [F1,2 = 128, P = 0.008,
linear regression of slope against log(grain size); Fig. 3].
Table 2 Summarized results of the literature review. The table
shows the numbers of independent studies that tested for aspecies–area relationship (SAR), species density–area relationship
(D-SAR), species–isolation relationship (SIR), and speciesdensity–isolation relationship (D-SIR) of plants in fragmented
systems. The table includes the number of studies that foundsupport for each of these four patterns (as reported in the
original papers or deduced from the results), of studiessupporting each pattern where data were stratified by plant
characteristics, habitat or landscape characteristics and of studiesin which only historical landscape configuration significantly
explained species richness or species density. A list of studiesand more detail can be found in Appendix S2.
SAR D-SAR SIR D-SIR
Number of independent tests 15 28 10 24
Total number of studies
where a pattern is significant
13 10 4 14
Number of studies where
pattern is significant only
after stratifying data by
plant characteristics
0 2 1 4
Number of studies where
pattern is significant only
after stratifying data by
habitat or landscape
characteristics
0 3 0 1
Number of studies where
pattern is significant only
when historical landscape
configuration is used
0 1 3 4
% support 87 36 40 58
% support when data are
not stratified and
current landscape
configuration is used
87 14 0 25
Journal of Biogeographyª 2014 John Wiley & Sons Ltd
6
I. Giladi et al.
Page 7
Apart from fragment area, the only other explanatory vari-
able that showed a significant effect on species density was
distance to the mainland (DistM1) (Table 4a). Its effect on
species density was significant when species density was mea-
sured using smaller grain sizes (SpD0.0625, SpD1, SpD25), but
significant effect of distance to the mainland was not
observed for either large grain size species density (SpD225)
or species richness (SRfragment) (Fig. 4). When significant, the
effect of DistM1 was negative, such that fragments situated
far from the mainland exhibited lower species density than
those near the mainland (Table 4a). The slope of the D-SIR
became flatter with increasing grain size, although this trend
was not statistically significant [F1,2 = 3.07, P = 0.22, linear
regression of slope against log(grain size); Fig. 5].
The lack of significance of the D-SAR or D-SIR at the 225-
m2 scale may have been a result of the smaller sample size avail-
able at this scale (14 fragments) as opposed to the larger sample
sizes (20 fragments) used at the other sampling scales (Appen-
dix S1). We tested this possibility by repeating our grain size-
dependent analysis, this time eliminating from the analysis all
fragments for which data were not available for all grain sizes.
The results were qualitatively similar to those obtained with
the full data set for the effect of area, but the effect of distance
to mainland remained significant only at the smallest grain size
(Table 4b). Repeating the analysis using the exponential model
yielded qualitatively similar results, with significantly increas-
ing D-SARs and significantly decreasing D-SIRs at all grain
sizes except 225 m2 (Appendix S3). The changes in the slopes
of D-SARs and D-SIRs with grain size did not follow the same
pattern as in the power model and always intensified with grain
size. However, the slope of the exponential model has a
different meaning than the z-value of the power model and is
inherently sensitive to the measurement scale, and as such, in
contrast to the slope of the power model, it cannot be used for
comparison (Tjørve & Tjørve, 2008).
DISCUSSION
Overall, our review of the literature on plant studies in frag-
mented landscapes confirms the well-established ubiquity of
Table 3 Correlation matrix for explanatory variables – fragment
area, proximity index (PI), distance to the nearest fragment(ENN), and distance to current or historical mainland (DistM1
and DistM2, respectively) measured for 39 fragments of semi-natural vegetation in the Lachish fragmented agro-ecosystem in
central Israel. All variables were log10-transformed prior to thecalculation of correlation coefficients (Pearson’s r). Numbers in
bold represent significant correlations (n = 39 for all thecorrelation tests).
Area PI ENN DistM1
PI 0.05
ENN �0.16 �0.68
DistM1 �0.02 �0.63 0.32
DistM2 0.03 �0.87 0.44 0.71
●
●
●
●
●
●
●●
●
●
●
●●
●
● ●
●
●
●
●
3.0 3.5 4.0 4.5
0.7
0.8
0.9
1.0
log(Area)
log(
SpD
0.06
25)
●
●
●● ●
●
●
●
●
●
●
●●
●
●
●
●
●
●
●
3.0 3.5 4.0 4.51.1
1.2
1.3
1.4
1.5
log(Area)
log(
SpD
1)
●
●
●●
●
●
●
●
●
●
●
●
●
●
● ●
●
●●
●
3.0 3.5 4.0 4.5
1.551.601.651.701.751.80
log(Area)
log(
SpD
25)
●
●
●
●
●
● ●
●
● ●
●
●●
●
3.0 3.5 4.0 4.51.85
1.90
1.95
2.00
log(Area)
log(
SpD
225)
●
●
●● ●
●
●
●
●
●
●
●
●
●
●
●
●
●
●
●
●
●
●
●
●
●
●
●
●
●
●
●
●
●
●
●
●
●
●
3.0 3.5 4.0 4.51.9
2.0
2.1
2.2
2.3
log(Area)
log(
SR
)
Figure 2 The relationship between plantspecies density (measured at different grain
sizes) and fragment area (D-SAR) andbetween plant species richness (SR –measured at the whole fragment level) andfragment area (SAR) in the Lachish
fragmented agro-ecosystem in central Israel.Trend lines were added whenever the slope
was significantly different from zero(P < 0.05). n = 20 for the D-SARs at
0.0625, 1 and 25 m2 grain-size, n = 14 forthe D-SAR at the 225 m2 grain size and
n = 39 for the SAR.
Journal of Biogeographyª 2014 John Wiley & Sons Ltd
7
Scale-dependent species–area and species–isolation relationships
Page 8
SARs in general. Evidence of the other three patterns that
we tested for (D-SAR, SIR and D-SIR) is weaker, suggesting
that these patterns are not affected by the entire suite of
mechanisms that generate SARs. In addition, the literature
review suggests that, when comparing across studies, D-
SARs are independent of grain size whereas D-SIRs become
more pronounced with the decrease in grain size. Our case
study analysis, however, clearly shows that the detection of
both relationships is grain size-dependent. The relatively
weak support for an increasing D-SAR found in the litera-
ture review agrees with our first prediction (P1), which is
based on that by Holt (1992), who stated that species den-
sity of poorly dispersed taxa (e.g. plants) will be unrelated
to fragment area. However, our detailed literature review,
together with the results of our field study in a semi-arid
agro-ecosystem, suggest that limited dispersal is not the only
reason for the observed weak support for an increasing
D-SAR in plants. Specifically, increasing D-SARs (within a
study) and decreasing D-SIRs (both among and within
studies) are more likely to be detected when species density
is measured at smaller grain sizes. This scale-dependency of
D-SARs and D-SIRs is not predicted by the habitat hetero-
geneity hypothesis (P2), but it is in agreement with the pat-
terns predicted by the equilibrium hypothesis and the target
area effect (P3) and with the model by Cousins & Vanhoe-
nacker (2011), which assumes a slow response of plants to
fragmentation.
Evidence for SARs and D-SARs of plants
in fragmented landscapes
In contrast to the overwhelming support for the existence of
an increasing SAR, evidence for an increasing D-SAR was
only found in 40% of the studies that tested for it (Table 2,
Appendix S2). Furthermore, the detection of an increasing
D-SAR was rarely straightforward. For example, for half of
the cases in which D-SARs increased significantly, detection
of that change required that the data be stratified according
to characteristics of landscape (e.g. land use, management
practices, habitat type) and/or of species (taxonomic or
ecological) prior to the analysis. Cousins (2006) tested for
D-SARs in two types of landscapes that differed in terms of
agricultural practice used (modern versus traditional) and
found an increasing D-SAR in the former only. Kelly et al.
(1989) stratified their data by habitat and found a significant
D-SAR for only one out of five habitat types (a north-facing
slope in beech forest). The variance in species density
explained by the D-SAR increased when the analysis was
restricted to one habitat type (dry pasture; Kohn & Walsh,
1994), or to plants that are rare at the local and landscape
scales (Cagnolo et al., 2009). Helm et al. (2006), Petit et al.
(2004), Rodr�ıguez-Loinaz et al. (2012) and Brueckmann
et al. (2010) found increasing D-SARs only when the analysis
was restricted to specialists (or indicator species) of habitat
types that can only be found in the fragments. Lobel et al.
(2006) found significant D-SARs for bryophytes and lichens
but not for vascular plants, and Rodr�ıguez-Loinaz et al.
(2012) found stronger patterns for ferns than for vascular
plants.
Overall, the literature review indicates that the D-SAR pat-
tern in plants is often masked by sources of variation, some of
which can be controlled for by stratification of the data. As
such, exposing a significant D-SAR may require data stratifica-
tion by habitat, thereby controlling for variation in habitat het-
erogeneity within the sampling unit, which may significantly
affect species density (Giladi et al., 2011). Stratification by spe-
cies habitat affinity may enhance D-SARs by focusing on those
species that are most sensitive to area-dependent extinction
and isolation-dependent colonization (Cook et al., 2002;
Dupr�e & Ehrl�en, 2002; Cousins & Vanhoenacker, 2011).
Evidence for SIRs and D-SIRs of plants
in fragmented landscapes
The proportion of studies that found that habitat isolation
significantly affects fragment-level species richness (SIR) is
lower than that indicating an effect of fragment area (SAR;
Table 2, Appendix S2). Similar to the observed support for
D-SARs, evidence of D-SIRs was often apparent only when
the species lists were stratified by species affinity to habitat
(specialist versus generalists; Cook et al., 2002; Petit et al.,
2004; Brueckmann et al., 2010; Reitalu et al., 2012) or by
taxonomic group (Lobel et al., 2006). In general, more sup-
port was found when the species analysed were specialists of
●
0.05
0.10
0.15
Sampling scale
(D)−
SA
R s
lope
, (z)
0.0625 m2 1 m2 25 m2 225 m2 Fragment
Figure 3 The slopes of species–area relationship (SAR), species
density–area relationship (D-SAR) for plant species in theLachish fragmented agro-ecosystem in central Israel, as a
function of the sampling scale used. Symbols (squares and solidlines for D-SAR, circle and dashed line for SAR) represent
estimates of the slope of a log–log species richness (density)–area relationship with error bars representing standard errors of
the slope estimates.
Journal of Biogeographyª 2014 John Wiley & Sons Ltd
8
I. Giladi et al.
Page 9
habitat types that can only be found in the fragments and/or
when the analysis was restricted to ‘lower plants’ (bryo-
phytes, lichens and ferns).
The relatively weak support found for the isolation effect
on species richness in fragmented landscapes has several pos-
sible explanations (Kochy & Rydin, 1997; Watling & Donnel-
ly, 2006). First, both the magnitude and the variance of
fragment isolation in many plant studies may not be suffi-
cient to generate statistically detectable patterns, even if such
effects exist (Watling & Donnelly, 2006; Cousins, 2009). Sec-
ond, functional connectivity in many fragmented landscapes
may be higher than what is initially presumed due to the
permeability of the apparently ‘hostile’ matrix (Cook et al.,
2002; Prevedello & Vieira, 2010). Third, the slow dynamics
of plants, which often lead to the accumulation of an extinc-
tion debt, tend to obscure isolation effects unless an appro-
priate time lag in the response of plant communities to
fragmentation is taken into account (Lindborg & Eriksson,
Table 4 Summary of linear models analysing the effects of fragment area, distance to mainland (DistM1), proximity index and distance
to nearest neighbour (NND) on plant species density (at different grain sizes) and plant species richness in the Lachish agro-ecosystemin central Israel. Estimates and standard errors of significant coefficients are in bold. In one set of analyses (a) we used all the available
data for each sampling scale [therefore, the degrees of freedom (d.f.) differ among scales]. Another set of analyses (b) was restricted tothose fragments that had measurements at all sampling scales.
Response variable Scale [m2] d.f.res Explanatory variables Coefficient estimate � SD F P
(a)
Species density 0.0625 15 Area
DistM1
Proximity
NND
0.138 � 0.03
�0.09 � 0.03
21.80
10.02
0.08
0.03
<0.0010.006
n.s.
n.s.
Species density 1 15 Area
DistM1
Proximity
NND
0.117 � 0.032
�0.092 � 0.034
12.21
7.41
0.034
0.079
0.003
0.016
n.s.
n.s.
Species density 25 15 Area
DistM1
Proximity
NND
0.076 � 0.027
0.064 � 0.027
8.08
5.75
0.52
0.08
0.01
0.03
n.s.
n.s.
Species density 225 9 Area
DistM1
Proximity
NND
2.73
1.81
0.02
0.36
n.s.
n.s.
n.s.
n.s.
Species richness Fragment 34 Area
DistM1
Proximity
NND
0.141 � 0.020 49.69
2.07
0.18
0.23
<0.001n.s.
n.s.
n.s.
(b)
Species density 0.0625 9 Area
DistM1
Proximity
NND
0.136 � 0.03
�0.08 � 0.03
16.99
5.82
0.33
0.04
0.003
0.04
n.s.
n.s.
Species density 1 9 Area
DistM1
Proximity
NND
0.124 � 0.038
�0.073 � 0.040
10.44
3.25
0.18
0.16
0.01
0.10
n.s.
n.s.
Species density 25 9 Area
DistM1
Proximity
NND
0.080 � 0.027
�0.052 � 0.028
8.98
3.34
0.68
0.02
0.015
0.1
n.s.
n.s.
Species density 225 9 Area
DistM1
Proximity
NND
2.73
1.81
0.02
0.36
n.s.
n.s.
n.s.
n.s.
Species richness Fragment 9 Area
DistM1
Proximity
NND
0.158 � 0.038 17.31
3.42
0.018
0.23
0.002
n.s.
n.s.
n.s.
n.s., not significant.
Journal of Biogeographyª 2014 John Wiley & Sons Ltd
9
Scale-dependent species–area and species–isolation relationships
Page 10
2004; Helm et al., 2006; Vellend et al., 2006; Cousins, 2009;
Kuussaari et al., 2009).
Evidence for SAR, D-SARs, SIR and D-SIRs
in a fragmented semi-arid agro-ecosystem
In general, our empirical results are congruent with the two
patterns predicted by island biogeography theory, e.g.
decreasing species–isolation relationships (SIR/D-SIR) and
increasing species–area relationships (SAR/D-SAR). Further-
more, the increasing D-SARs that we detected in our data
suggest that the increasing SAR can be at least partially
attributed to area-dependent colonization and/or extinction
rates, as proposed by the equilibrium and the target area
effect hypotheses. However, our scale-dependent sampling
and analysis also suggest that the presence and/or the detec-
tion of an increasing D-SAR and a decreasing D-SIR and
their slopes are grain size-dependent and become more pro-
nounced as grain size decreases.
Contrary to the dearth of similar findings in the literature,
we successfully detected increasing D-SARs and decreasing
D-SIRs without stratifying the data and while using current
landscape configuration rather than incorporating a time lag
into the analysis. There are several possible reasons for these
findings. First, the flora in the study regions is characterized
by an exceptionally high (67%) percentage of annuals, which,
relative to perennials, are considered more prone to extinc-
tion and respond to fragmentation more rapidly (Lindborg,
●
●
●
●
●
●
●●
●
●
●
●●
●
●●
●
●
●
●
1.5 2.0 2.5 3.0
0.7
0.8
0.9
1.0
log(DistMain)
log(
SpD
0.06
25)
●
●
●● ●
●
●
●
●
●
●
●●
●
●
●
●
●
●
●
1.5 2.0 2.5 3.01.1
1.2
1.3
1.4
1.5
log(DistMain)
log(
SpD
1)
●
●
●●
●
●
●
●
●
●
●
●
●
●
●●
●
● ●
●
1.5 2.0 2.5 3.0
1.551.601.651.701.751.80
log(DistMain)
log(
SpD
25)
●
●
●
●
●
● ●
●
●●
●
● ●
●
1.5 2.0 2.5 3.01.85
1.90
1.95
2.00
log(DistMain)
log(
SpD
225)
●
●
●● ●
●
●
●
●
●
●
●
●
●
●
●
●
●
●
●
●
●
●
●
●
●
●
●
●
●
●
●
●
●
●
●
●
●
●
1.5 2.0 2.5 3.01.9
2.0
2.1
2.2
2.3
log(DistMain)
log(
SR
)
Figure 4 The relationship between plantspecies density (measured at different grain
sizes) and fragment isolation (D-SIR) andbetween plant species richness (SR –measured at a whole fragment level) andfragment isolation (SIR) in the Lachish
fragmented agro-ecosystem in central Israel.Fragment isolation is represented here as
the edge to edge distance of a targetfragment from the nearest current
‘mainland’. Trend lines were addedwhenever the slope was significantly
different from zero (P < 0.05). n = 20 forthe D-SIRs at 0.0625, 1 and 25 m2 grain-
size, n = 14 for the D-SIR at the 225 m2
grain size and n = 39 for the SIR.
●
−0.12
−0.10
−0.08
−0.06
−0.04
−0.02
Sampling scale
(D)−
SIR
slo
pe
0.0625 m2 1 m2 25 m2 225 m2 Fragment
Figure 5 The slopes of species–isolation relationship (SIR),species density–isolation relationship (D-SIR) for plant species
in the Lachish fragmented agro-ecosystem in central Israel, as afunction of the sampling scale used. Symbols (squares and solid
lines for D-SIR, circle and dashed line for SIR) representestimates of the slopes of species richness (density)–isolationrelationship with error bars representing standard errors of theslope estimates.
Journal of Biogeographyª 2014 John Wiley & Sons Ltd
10
I. Giladi et al.
Page 11
2007; Johansson et al., 2011; cf. Adriaens et al., 2006). The
community dynamics in the study landscape have been
shown to fit a regional model of isolated communities that
are dominated by extinction events and in which coloniza-
tion events are extremely rare (May et al., 2013). Second, a
series of historical aerial photographs of the study site indi-
cate that the landscape’s configuration, and consequently its
level of habitat fragmentation, has changed little over the
past 60 years (I. Giladi, unpublished). Third, our multi-scale
sampling of species density increased the chance that we
would detect significant D-SARs and D-SIRs at scale(s)
where area and isolation effects are least obscured by other
determinants of species density.
Grain size-dependent D-SARs and D-SIRs
A model suggested by Cousins & Vanhoenacker (2011) pre-
sumes that the response of plant species to fragmentation
occurs faster at smaller grain sizes than at larger ones. Accord-
ing to the model, during the transition phase that follows
fragmentation, fine grain, but not large grain, species density
will be correlated with fragmentation effects. Previous analysis
of our study system showed that it is currently in such a tran-
sition phase and that it carries an extinction debt that has not
been fully paid yet (May et al., 2013). Thus, our analysis sup-
ports the predictions of the Cousins & Vanhoenacker (2011)
model. Furthermore, to the best of our knowledge, ours is the
first study to demonstrate a decrease in the positive slope of
the D-SAR and a mirroring attenuation of the negative slope
of the D-SIR with increasing grain size. Interestingly, with the
exception of the analysis by Tangney et al. (1990), the signifi-
cance of D-SARs in the literature is scale-independent.
The lack of evidence in the literature of D-SAR grain size-
dependency is intriguing given that the response of species
density to other determinants, such as climatic gradient, habi-
tat heterogeneity, management practices and distance from
edge, has been shown to vary with grain size (Kiviniemi & Eri-
ksson, 2002; Cousins et al., 2007; Brudvig & Damschen, 2011;
Giladi et al., 2011; Thornton et al., 2011). While the influence
of habitat heterogeneity on species density may increase with
grain size (Giladi et al., 2011), the effects of the other determi-
nants may diminish with grain size, especially when small
grain size also entails habitat homogeneity (Stiles & Scheiner,
2010; Giladi et al., 2011). The evidence for grain size-depen-
dent D-SARs in the literature may be limited because most
studies that tested for D-SARs used only one grain size.
Indeed, only seven of the studies that we reviewed conducted
grain size-dependent analyses of D-SARs, and five of these
studies also investigated grain size-dependent D-SIRs. Of the
seven studies that incorporated grain size-dependent analyses,
three (Kiviniemi & Eriksson, 2002; Stiles & Scheiner, 2010;
Brudvig & Damschen, 2011) reported insignificant D-SARs at
all grain sizes. Tangney et al. (1990) found significant D-SARs
at two grain sizes (4 m2 and 10 m2).
The three other studies, which can be classified as testing
scale-dependent D-SARs, actually tested D-SARs at one grain
size and then contrasted those results with another type of
species–area relationship, in which the cumulative number of
species from a fixed number of sampling plots within a frag-
ment is regressed against fragment size (Lindborg & Eriks-
son, 2004; €Oster et al., 2007; Cousins & Vanhoenacker,
2011). This ‘cumulative’ SAR maintains equal sampling effort
(i.e. total sampling area) across fragments (as a ‘regular’
D-SAR), but the extent of the sampling usually increases
with fragment size. Although the effects of sampling effort
and extent on species richness reflect different processes and
thus are not interchangeable (Azovsky, 2011), cumulative
‘SARs’ are sometimes treated as controlling for both sam-
pling and extent or for neither. This duality is reflected in
the terminology, analysis and interpretation that different
studies ascribe to these cumulative (D)-SARs. For example,
relying on previous analysis showing that their cumulative
sampling is sufficient to represent fragment-level species rich-
ness, Lindborg & Eriksson (2004) referred to their cumula-
tive SAR as a ‘regular’ SAR, and found that both this pattern
and regular D-SAR (at the 1-m2 scale) were insignificant.
In contrast, €Oster et al. (2007) constructed a D-SAR (at the
1-m2 scale) and two cumulative SARs (for ten 1-m2 plots,
total area = 10 m2, and for fifty 0.01-m2 subplots, total
area = 0.5 m2) and referred to all of these patterns as
D-SARs. They found that the cumulative (D)-SARs were
both significantly increasing whereas the ‘regular’ D-SAR was
not. Cousins & Vanhoenacker (2011) referred to a D-SAR
(at the 0.25-m2 scale) and a cumulative (D)-SAR as alpha
and gamma diversity SARs, respectively. They found that
alpha diversity was correlated with current fragment area
whereas gamma diversity was correlated with historical frag-
ment area. The placement of sampling plots for cumulative
(D)-SARs is often either randomly selected, equally spaced
or specifically chosen to represent various sections/habitats
of a fragment. Therefore, although cumulative (D)-SARs
control for total sampling area, the extent, the aggregation
and the representation of habitat heterogeneity in each frag-
ment in cumulative (D)-SARs are correlated with fragment
size, and therefore, they are expected to be affected by
mechanisms similar to those that generate fragment-level
SARs. For that reason, interpreting the difference between
cumulative (D)-SARs and D-SARs as simply a matter of
scale-dependency (as, for example, by €Oster et al., 2007)
neglects some important discrepancies between the methods
that may also point to fundamental differences in the
mechanisms that generate these patterns (Azovsky, 2011).
The discussion in the literature about the theoretical, eco-
logical and statistical properties of the functional forms used
to model SARs is ongoing and lively (Tjørve, 2003, 2009;
Dengler, 2009; Scheiner, 2009; Triantis et al., 2012). How-
ever, little effort has been devoted to delineating the func-
tions that best describe either D-SARs or D-SIRs. In most of
the studies that we reviewed, the function used to model the
SAR (mainly either power or exponential) was also used to
model the D-SAR. We found that the degree of support for
both D-SARs and D-SIRs varied depending on the functional
Journal of Biogeographyª 2014 John Wiley & Sons Ltd
11
Scale-dependent species–area and species–isolation relationships
Page 12
form used, but we could not detect any systematic change.
In our case study, both the D-SAR and the D-SIR were simi-
larly sensitive to grain size, regardless of whether we used the
power or the exponential model. Nevertheless, questions
about which functional form is the most appropriate for
modelling D-SARs and D-SIRs and the possibility that the
dependence of these patterns on grain size varies with func-
tional form across and within studies are still unresolved
issues that require further research.
Mechanisms explaining the patterns
The variation observed in the degrees of support for the rela-
tionships we examined may reflect differences in the relative
importance of the mechanisms underlying each pattern. In
general, species density is often highly correlated with, and
thus can be reasonably explained by, fragment-level species
richness (P€artel et al., 1996). However, even when local and
fragment-level species richness are highly correlated (Table 5
for this study), each may be explained by different determi-
nants (Stiles & Scheiner, 2010; Reitalu et al., 2012). In any
case, the two patterns of species–isolation (SIR and D-SIR)
and D-SAR are thought to be generated by a subset of the
mechanisms that generate significantly increasing SARs (Hill
et al., 1994; Turner & Tjørve, 2005).
The analysis of D-SARs is often advocated as a test of the
mechanisms associated with the equilibrium hypothesis after
controlling for the effects of sampling and habitat heteroge-
neity (Bruun, 2000; Krauss et al., 2004). Alternatively, an
increasing D-SAR can be explained by the habitat heteroge-
neity hypothesis of SAR, which can generate an increasing
D-SAR via two different pathways. First, if habitat diversity
within a standardized area (e.g. sampling plot) is positively
correlated with fragment area, then an increasing D-SAR
may be evident. However, in our study system, habitat heter-
ogeneity within a standardized plot (measured either at the
1, 25 or 225-m2 grain sizes) is not correlated with fragment
area (see Giladi et al., 2011, for details). Second, D-SARs
may still be found to be increasing if the diverse habitats that
constitute the entire fragment contribute to species density
(a spillover effect; Holt, 1992, 1993). However, it is not yet
clear at which spatial scale(s) the spillover effect should be
most prominent (Rosenzweig, 1995; Cook et al., 2002;
Kadmon & Allouche, 2007; Whittaker & Fern�andez-Palacios,
2007; Lundholm, 2009; Matias et al., 2010; Tamme et al.,
2010). The contribution of the spillover effect to D-SARs is
often linked with a graphical representation of parallel
within-island species–area curves, the ‘elevations’ of which
increase with fragment size (e.g. Cook et al., 2002). Interest-
ingly, in our study system the slope of these curves actually
decreases with fragment area (Appendix S1). Furthermore, as
both theoretical considerations and empirical results suggest
that the effect of habitat heterogeneity on species density is
expected to increase with grain size (P2) (Kadmon & Allou-
che, 2007; Tamme et al., 2010; Giladi et al., 2011, and refer-
ences herein), habitat heterogeneity is unlikely to explain the
pattern of grain size-dependency that we observed. There-
fore, a grain size-dependent study of D-SARs combined with
scale-sensitive quantification and/or scale-sensitive modelling
of the spillover effect is needed to understand if and how the
habitat heterogeneity hypothesis explains increasing and
grain size-dependent D-SARs.
CONCLUSIONS
Understanding the response of biodiversity to habitat loss
and fragmentation, an issue that is of immense importance
for conservation, is a hotly discussed topic in the literature.
The challenges created by apparent inconsistencies in the
responses of plants to fragmentation were recently addressed
by proposing and testing several interesting ideas that were
partially successful in reconciling apparent contradictions.
Among these proposed explanations are the slow response of
plant communities to fragmentation (which creates an
extinction debt), the partial connectivity that intervening
matrices provide, and the differential responses of plant
groups representing different traits. The elucidation of these
issues will help to better understand and potentially predict
plant response to fragmentation. Our study points to two
additional criteria that should be considered. First, a clear
distinction must be made between patterns that are based on
species density, accumulated number of species and frag-
ment-level species richness. Because these different patterns
point to different mechanisms, a useful synthesis of our
common knowledge necessitates that information concerning
this distinction will be clearly presented and easy to extract
from publications. Second, in using species density to study
fragmentation effects, one should be aware that the results
and the derived conclusion are grain size-dependent.
Although a positive correlation between species density and
fragment-level species richness may be common, the SAR
and the D-SAR are not the same pattern, are not generated
by the same mechanisms, and the detection of one cannot be
inferred as evidence for the other. As our results show, the
link between these patterns may be scale dependent, although
the generality of this dependence can only be verified by
additional studies that will examine grain size-dependent
Table 5 Correlation matrix for plant species density (SpD,
measured at different grain sizes given in m2) and speciesrichness (SR) in semi-natural fragments in the Lachish agro-
ecosystem in central Israel. The correlation coefficients(Pearson’s r) were calculated using the subset of fragments that
had full sets of measurements of SR and SpD at all grain sizes(n = 14). All the correlation coefficients are significantly
positive.
SpD0.0625 SpD1 SpD25 SpD225 SR
SpD0.0625 1 0.93 0.84 0.71 0.84
SpD1 1 0.92 0.85 0.89
SpD25 1 0.94 0.84
SpD225 1 0.77
SR 1
Journal of Biogeographyª 2014 John Wiley & Sons Ltd
12
I. Giladi et al.
Page 13
D-SARs and D-SIRs using different functional forms within
the same study system.
ACKNOWLEDGEMENTS
The authors wish to thank Yoni Gavish for thoughtful dis-
cussion and Zehava Sigal, Amitay Cohen, Uri Ben-Yoseph,
Roni Shachal and Ouria Oren for assistance in the field. This
research was supported by grant no. 913-100.12/2006 from
the German Israeli Foundation for Research and Develop-
ment to Y.Z. and F.J. and by grant no. 751/09 from the
Israel Science Foundation to Y.Z. We thank Patrick Martin
for very careful and thorough English editing of the whole
manuscript. We thank Samuel Scheiner, two anonymous ref-
erees and the editors Kostas Triantis and Robert Whittaker
for very helpful comments that improved the quality and the
clarity of this publication. This is publication no. 826 of the
Mitrani Department of Desert Ecology. We confirm that
there are no conflicts of interest for any of the authors.
REFERENCES
Ackermann, O., Svoray, T. & Haiman, M. (2008) Nari (cal-
crete) outcrop contribution to ancient agricultural terraces
in the Southern Shephelah, Israel: insights from digital ter-
rain analysis and a geoarchaeological field survey. Journal
of Archaeological Science, 35, 930–941.
Adriaens, D., Honnay, O. & Hermy, M. (2006) No evidence
of a plant extinction debt in highly fragmented calcareous
grasslands in Belgium. Biological Conservation, 133, 212–
224.
Azovsky, A.I. (2011) Species–area and species–sampling effort
relationships: disentangling the effects. Ecography, 34, 18–30.
Brudvig, L.A. & Damschen, E.I. (2011) Land-use history, his-
torical connectivity, and land management interact to
determine longleaf pine woodland understory richness and
composition. Ecography, 34, 257–266.
Brueckmann, S.V., Krauss, J. & Steffan-Dewenter, I. (2010)
Butterfly and plant specialists suffer from reduced connec-
tivity in fragmented landscapes. Journal of Applied Ecology,
47, 799–809.
Bruun, H.H. (2000) Patterns of species richness in dry grass-
land patches in an agricultural landscape. Ecography, 23,
641–650.
Cagnolo, L., Valladares, G., Salvo, A., Cabido, M. & Zak, M.
(2009) Habitat fragmentation and species loss across three
interacting trophic levels: effects of life-history and food-
web traits. Conservation Biology, 23, 1167–1175.
Coleman, B.D. (1981) On random placement and species–
area relations. Mathematical Biosciences, 54, 191–215.
Connor, E.F. & McCoy, E.D. (1979) Statistics and biology of
the species–area relationship. The American Naturalist,
113, 791–833.
Connor, E.F. & McCoy, E.D. (2001) Species–area relation-
ships. Encyclopedia of biodiversity (ed. by S.A. Levin), pp.
397–412. Academic Press, New York.
Cook, W.M., Lane, K.T., Foster, B.L. & Holt, R.D. (2002)
Island theory, matrix effects and species richness patterns
in habitat fragments. Ecology Letters, 5, 619–623.
Cousins, S.A.O. (2006) Plant species richness in midfield
islets and road verges – The effect of landscape fragmenta-
tion. Biological Conservation, 127, 500–509.
Cousins, S.A.O. (2009) Extinction debt in fragmented grass-
lands: paid or not? Journal of Vegetation Science, 20, 3–7.
Cousins, S.A.O. & Vanhoenacker, D. (2011) Detection of
extinction debt depends on scale and specialisation. Biolog-
ical Conservation, 144, 782–787.
Cousins, S.A.O., Ohlson, H. & Eriksson, O. (2007) Effects of
historical and present fragmentation on plant species
diversity in semi-natural grasslands in Swedish rural land-
scapes. Landscape Ecology, 22, 723–730.
Dan, J., Yaalon, D.H., Koyumdjisky, H. & Raz, Z. (1976) The soils
of Israel. Ministry of Agriculture, Volcani Center, Bet Dagan.
Dengler, J. (2009) Which function describes the species–area
relationship best? A review and empirical evaluation. Jour-
nal of Biogeography, 36, 728–744.
Dupr�e, C. & Ehrl�en, J. (2002) Habitat configuration, spe-
cies traits and plant distributions. Journal of Ecology, 90,
796–805.
Eriksson, O., Cousins, S.A.O. & Bruun, H.H. (2002) Land-use
history and fragmentation of traditionally managed grasslands
in Scandinavia. Journal of Vegetation Science, 13, 743–748.
Fahrig, L. (2003) Effects of habitat fragmentation on biodi-
versity. Annual Review of Ecology, Evolution, and Systemat-
ics, 34, 487–515.
Fahrig, L. (2013) Rethinking patch size and isolation effects:
the habitat amount hypothesis. Journal of Biogeography,
40, 1649–1663.
Feinbrun-Dothan, N. & Danin, A. (1991) Analytical flora
of Eretz-Israel. Cana Publishing House, Jerusalem, Israel.
Giladi, I., Ziv, Y., May, F. & Jeltsch, F. (2011) Scale-depen-
dent determinants of plant species richness in a semi-arid
fragmented agro-ecosystem. Journal of Vegetation Science,
22, 983–996.
Gilpin, M.E. & Diamond, J.M. (1976) Calculation of immi-
gration and extinction curves from the species–area–
distance relation. Proceedings of the National Academy of
Sciences USA, 73, 4130–4134.
Goldreich, Y. (2003) The climate of Israel: observations,
research and applications. Kluwer Academic, New York.
Gotelli, N.J. & Graves, G.R. (1996) Null models in ecology.
Smithsonian Institution Press, Washington, DC.
Gray, J.S. (2000) The measurement of marine species diver-
sity, with an application to the benthic fauna of the Nor-
wegian continental shelf. Journal of Experimental Marine
Biology and Ecology, 250, 23–49.
Hanski, I., Zurita, G.A., Bellocq, M.I. & Rybicki, J. (2013)
Species-fragmented area relationship. Proceedings of the
National Academy of Sciences USA, 110, 12715–12720.
Helm, A., Hanski, I. & P€artel, M. (2006) Slow response of
plant species richness to habitat loss and fragmentation.
Ecology Letters, 9, 72–77.
Journal of Biogeographyª 2014 John Wiley & Sons Ltd
13
Scale-dependent species–area and species–isolation relationships
Page 14
Hill, J.L., Curran, P.J. & Foody, G.M. (1994) The effect of
sampling on the species–area curve. Global Ecology and
Biogeography Letters, 4, 97–106.
Holt, R.D. (1992) A neglected facet of island biogeography:
the role of internal spatial dynamics in area effects. Theo-
retical Population Biology, 41, 354–371.
Holt, R.D. (1993) Ecology at the mesoscale: the influence of
regional processes on local community dynamics. Species
diversity in ecological communities (ed. by R.E. Ricklefs and D.
Schluter), pp. 77–88. University of Chicago Press, Chicago.
Hoyle, M. (2004) Causes of the species–area relationship by
trophic level in a field-based microecosystem. Proceedings
of the Royal Society B: Biological Sciences, 271, 1159–1164.
Johansson, V.A., Cousins, S.A.O. & Eriksson, E. (2011) Rem-
nant populations and plant functional traits in abandoned
semi-natural grasslands. Folia Geobotanica, 46, 165–179.
Kadmon, R. & Allouche, O. (2007) Integrating the effects of
area, isolation, and habitat heterogeneity on species diver-
sity: a unification of island biogeography and niche theory.
The American Naturalist, 170, 443–454.
Kalkhan, M.A., Stafford, E.J. & Stohlgren, T.J. (2007) Rapid
plant diversity assessment using a pixel nested plot design: a
case study in Beaver Meadows, Rocky Mountain National
Park, Colorado, USA. Diversity and Distributions, 13, 379–388.
Kelly, B.J., Wilson, J.B. & Mark, A.F. (1989) Causes of the
species–area relation: a study of islands in Lake Manapo-
uri, New Zealand. Journal of Ecology, 77, 1021–1028.
Kiviniemi, K. & Eriksson, E. (2002) Size-related deterioration
of semi-natural grassland fragments in Sweden. Diversity
and Distribution, 8, 21–29.
Kochy, M. & Rydin, H. (1997) Biogeography of vascular
plants on habitat islands, peninsulas and mainlands in an
east-central Swedish agricultural landscape. Nordic Journal
of Botany, 17, 215–223.
Kohn, D.D. & Walsh, D.M. (1994) Plant species richness –
the effect of island size and habitat diversity. Journal of
Ecology, 82, 367–377.
K€orner, K. & Jeltsch, F. (2008) Detecting general plant func-
tional type responses in fragmented landscapes using spa-
tially-explicit simulations. Ecological Modelling, 210, 287–300.
Krauss, J., Klein, A.M., Steffan-Dewenter, I. & Tscharntke, T.
(2004) Effects of habitat area, isolation, and landscape
diversity on plant species richness of calcareous grasslands.
Biodiversity and Conservation, 13, 1427–1439.
Kuussaari, M., Bommarco, R., Heikkinen, R.K., Helm, A., Krauss,
J., Lindborg, R., Ockinger, E., P€artel, M., Pino, J., Roda, F., Ste-
fanescu, C., Teder, T., Zobel, M. & Steffan-Dewenter, I. (2009)
Extinction debt: a challenge for biodiversity conservation.
Trends in Ecology and Evolution, 24, 564–571.
Laurance, W.F. (2008) Theory meets reality: how habitat
fragmentation research has transcended island biogeo-
graphic theory. Biological Conservation, 141, 1731–1744.
Lindborg, R. (2007) Evaluating the distribution of plant life-
history traits in relation to current and historical landscape
configurations. Journal of Ecology, 95, 555–564.
Lindborg, R. & Eriksson, O. (2004) Historical landscape con-
nectivity affects present plant species diversity. Ecology, 85,
1840–1845.
Lindborg, R., Helm, A., Bommarco, R., Heikkinen, R.K.,
Kuhn, I., Pykala, J. & P€artel, M. (2012) Effect of habitat
area and isolation on plant trait distribution in European
forests and grasslands. Ecography, 35, 356–363.
Lobel, S., Dengler, J. & Hobohm, C. (2006) Species richness
of vascular plants, bryophytes and lichens in dry grass-
lands: the effects of environment, landscape structure and
competition. Folia Geobotanica, 41, 377–393.
Lomolino, M.V. (2001) The species–area relationship: new
challenges for an old pattern. Progress in Physical Geogra-
phy, 25, 1–21.
Lundholm, J.T. (2009) Plant species diversity and environ-
mental heterogeneity: spatial scale and competing hypothe-
ses. Journal of Vegetation Science, 20, 377–391.
MacArthur, R.H. (1972) Geographical ecology: patterns in the
distribution of species. Princeton University Press, Prince-
ton, NJ.
MacArthur, R.H. & Wilson, E.O. (1967) The theory of island
biogeography. Princeton University Press, Princeton, NJ.
Matias, M.G., Underwood, A.J., Hochuli, D.F. & Coleman,
R.A. (2010) Independent effects of patch size and struc-
tural complexity on diversity of benthic macroinverte-
brates. Ecology, 91, 1908–1915.
May, F., Giladi, I., Ristow, M., Ziv, Y. & Jeltsch, F. (2013)
Metacommunity, mainland-island system or island commu-
nities? Assessing the regional dynamics of plant communi-
ties in a fragmented landscape. Ecography, 36, 842–853.
Mazor, S. (2006) Landscape change in the Southern Judea low-
lands and the effect of patch attributes on species richness in
semi-arid environment: embedding fuzzy logic in GIS.
Department of Geography and Environmental Develop-
ment, Ben-Gurion University, Beer Sheva.
McGarigal, K., Cushman, S.A., Neel, M.C. & Ene, E. (2002)
FRAGSTATS: spatial pattern analysis program for categori-
cal maps. University of Massachusetts, Amherst, MA.
Naveh, Z. & Dan, J. (1973) The human degradation of Medi-
terranean landscapes in Israel. Mediterranean type ecosys-
tems: origin and structure (ed. by F. Castri and H.A.
Mooney) pp. 370–390. Springer-Verlag, New York.€Oster, M., Cousins, S.A.O. & Eriksson, O. (2007) Size and
heterogeneity rather than landscape context determine
plant species richness in semi-natural grasslands. Journal of
Vegetation Science, 18, 859–868.
P€artel, M., Zobel, M., Zobel, K. & van der Maarel, E. (1996)
The species pool and its relation to species richness: evidence
from Estonian plant communities. Oikos, 75, 111–117.
Petit, S., Griffiths, L., Smart, S.S., Smith, G.M., Stuart, R.C.
& Wright, S.M. (2004) Effects of area and isolation of
woodland patches on herbaceous plant species richness
across Great Britain. Landscape Ecology, 19, 463–471.
Preston, F.W. (1962) The canonical distribution of common-
ness and rarity: Part II. Ecology, 43, 410–432.
Journal of Biogeographyª 2014 John Wiley & Sons Ltd
14
I. Giladi et al.
Page 15
Prevedello, J.A. & Vieira, M.V. (2010) Does the type of
matrix matter? A quantitative review of the evidence. Bio-
diversity and Conservation, 19, 1205–1223.
R Development Core Team (2012) R: a language and envi-
ronment for statistical computing. R Foundation for Statisti-
cal Computing, Vienna, Austria.
Reitalu, T., Purschke, O., Johansson, L.J., Hall, K., Sykes,
M.T. & Prentice, H.C. (2012) Responses of grassland spe-
cies richness to local and landscape factors depend on spa-
tial scale and habitat specialization. Journal of Vegetation
Science, 23, 41–51.
Rey Benayas, J.M., Colomer, M.G.S. & Levassor, C. (1999)
Effects of area, environmental status and environmental
variation on species richness per unit area in Mediterra-
nean wetlands. Journal of Vegetation Science, 10, 275–280.
Rodr�ıguez-Loinaz, G., Amazega, I. & Onaindia, M. (2012)
Does forest fragmentation affect the same way all growth
forms? Journal of Environmental Management, 94, 125–131.
Rosenzweig, M.L. (1995) Species diversity in space and time.
Cambridge University Press, Cambridge, UK.
Scheiner, S.M. (2009) (2009) The terminology and use of
species–area relationships: a response to Dengler. Journal
of Biogeography, 36, 2005–2008.
Scheiner, S.M., Cox, S.B., Willig, M., Mittelbach, G.G., Osen-
berg, C. & Kaspari, M. (2000) Species richness, species–
area curves and Simpson’s paradox. Evolutionary Ecology
Research, 2, 791–802.
Scheiner, S.M., Chiarucci, A., Fox, G.A., Helmus, M.R.,
McGlinn, D.J. & Willig, M.R. (2011) The underpinnings
of the relationship of species richness with space and time.
Ecological Monographs, 81, 195–213.
Schoereder, J.H., Galbiati, C., Ribas, C.R., Sobrinho, T.G.,
Sperber, C.F., DeSouza, O. & Lopes-Andrade, C. (2004)
Should we use proportional sampling for species–area
studies? Journal of Biogeography, 31, 1219–1226.
Stiles, A. & Scheiner, S.M. (2010) A multi-scale analysis of
fragmentation effects on remnant plant species richness in
Phoenix, Arizona. Journal of Biogeography, 37, 1721–1729.
Svoray, T., Mazor, S. & Pua, B. (2007) How is shrub cover
related to soil moisture and patch geometry in the frag-
mented landscape of the Northern Negev desert? Land-
scape Ecology, 22, 105–116.
Tamme, R., Hiiesalu, I., Laanisto, L., Szava-Kovats, R. &
P€artel, M. (2010) Environmental heterogeneity, species
diversity and co-existence at different spatial scales. Journal
of Vegetation Science, 21, 796–801.
Tangney, R.S., Wilson, J.B. & Mark, A.F. (1990) Bryophyte
island biogeography: a study in Lake Manapouri, New
Zealand. Oikos, 59, 21–26.
Thornton, D.H., Branch, L.C. & Sunquist, M.E. (2011) The
influence of landscape, patch, and within-patch factors on
species presence and abundance: a review of focal patch
studies. Landscape Ecology, 26, 7–18.
Tjørve, E. (2003) Shapes and functions of species–area
curves: a review of possible models. Journal of Biogeogra-
phy, 30, 827–835.
Tjørve, E. (2009) Shapes and functions of species–area curves
(II): a review of new models and parameterizations. Jour-
nal of Biogeography, 36, 1435–1445.
Tjørve, E. & Tjørve, K.M.C. (2008) The species–area relation-
ship, self-similarity, and the true meaning of the z-value.
Ecology, 89, 3528–3533.
Triantis, K.A., Guilhaumon, F. & Whittaker, R.J. (2012) The
island species–area relationship: biology and statistics.
Journal of Biogeography, 39, 215–231.
Turner, W.R. & Tjørve, E. (2005) Scale-dependence in spe-
cies–area relationships. Ecography, 28, 721–730.
Vellend, M., Verheyen, K., Jacquemyn, H., Kolb, A., Van
Calster, H., Peterken, G. & Hermy, M. (2006) Extinction
debt of forest plants persists for more than a century fol-
lowing habitat fragmentation. Ecology, 87, 542–548.
Watling, J.I. & Donnelly, M.A. (2006) Fragments as islands:
a synthesis of faunal responses to habitat patchiness. Con-
servation Biology, 20, 1016–1025.
Whittaker, R.J. & Fern�andez-Palacios, J.M. (2007) Island bio-
geography: ecology, evolution, and conservation, 2nd edn.
Oxford University Press, Oxford.
Williams, C.B. (1943) Area and the number of species. Nat-
ure, 152, 262–265.
Williams, C.B. (1964) Patterns in the balance of nature. Aca-
demic Press, London.
Yaacobi, G., Ziv, Y. & Rosenzweig, M.L. (2007) Effects of
interactive scale-dependent variables on beetle diversity
patterns in a semi-arid agricultural landscape. Landscape
Ecology, 22, 687–703.
SUPPORTING INFORMATION
Additional Supporting Information may be found in the
online version of this article:
Appendix S1 List of fragments sampled, their attributes,
and plant species richness and species density.
Appendix S2 List of studies used in the literature review.
Appendix S3 Figures showing species–area and species–
isolation relationships using an exponential model.
BIOSKETCHES
This work is part of an ongoing collaboration between the
research groups of Yaron Ziv and Florian Jeltsch that
combines large-scale field data and spatially explicit model-
ling to study plant scale-dependent biodiversity and life-his-
tory traits in a heterogeneous landscape.
Author contributions: The study was designed by I.G., F.J.
and Y.Z.; I.G. and M.R. collected the data for the case study;
I.G. and F.M. compiled the literature review and performed
the data analysis; and I.G. wrote the first draft of the manu-
script and all authors contributed substantially to revisions.
Editor: Kostas Triantis
Journal of Biogeographyª 2014 John Wiley & Sons Ltd
15
Scale-dependent species–area and species–isolation relationships


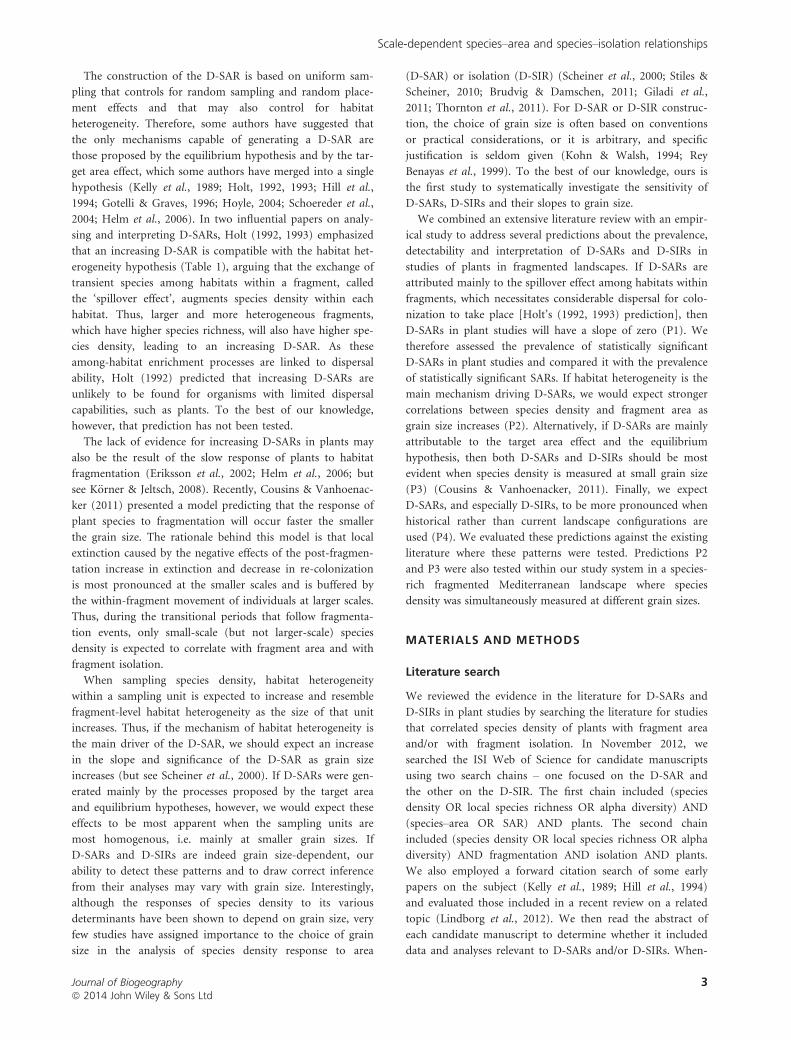


![FjZhi^dc d[ i]Z LZZ` =dl XVc ViiZci^dc id YZiV^a ]Zae ...pellston.weebly.com/.../7/19473561/case_of_the_slippery_salamander.pdf · salamander she’s ever seen.” He shook his head.](https://static.documents.pub/doc/80x56/5c98cc8209d3f21c3a8c4db4/fjzhidc-d-iz-lzz-dl-xvc-viizcidc-id-yziva-zae-salamander-shes.jpg)


