39
SCALES CORPORATION LIMITED YOUR DIVERSIFIED AGRIBUSINESS PORTFOLIO 2015 Annual Shareholders’ Meeting

SCALES
CORPORATION
LIMITED YOUR DIVERSIFIED
AGRIBUSINESS PORTFOLIO
2015 Annual Shareholders’ Meeting
June 2015 Scales – 2015 Annual Shareholders’ Meeting
AGENDA
• Welcome
• Chairman’s review
• Managing Director’s review
• Ordinary business and resolutions
2

June 2015 Scales – 2015 Annual Shareholders’ Meeting
CHAIRMAN’S REVIEW
• Restructured Board
• Successful transition to a NZX listed company
• Exceeded our IPO forecasts
3
A landmark year for Scales.
June 2015 Scales – 2015 Annual Shareholders’ Meeting
MANAGING DIRECTOR’S REVIEW
• Who we are, what we do, and why we are different
• 2014 highlights
• Mr Apple’s technology led growth
• Our strategy for delivering growth
• The year ahead
• Investor return performance
4

1 WHO WE ARE, WHAT
WE DO, AND WHY WE
ARE DIFFERENT

June 2015 Scales – 2015 Annual Shareholders’ Meeting
WE ARE A DIVERSIFIED AGRIBUSINESS
PORTFOLIO
6
Scales is a diversified agribusiness group with 117 years of trading experience.
The Group comprises 8 operating companies organised into 3 trading divisions
managed by a corporate office.
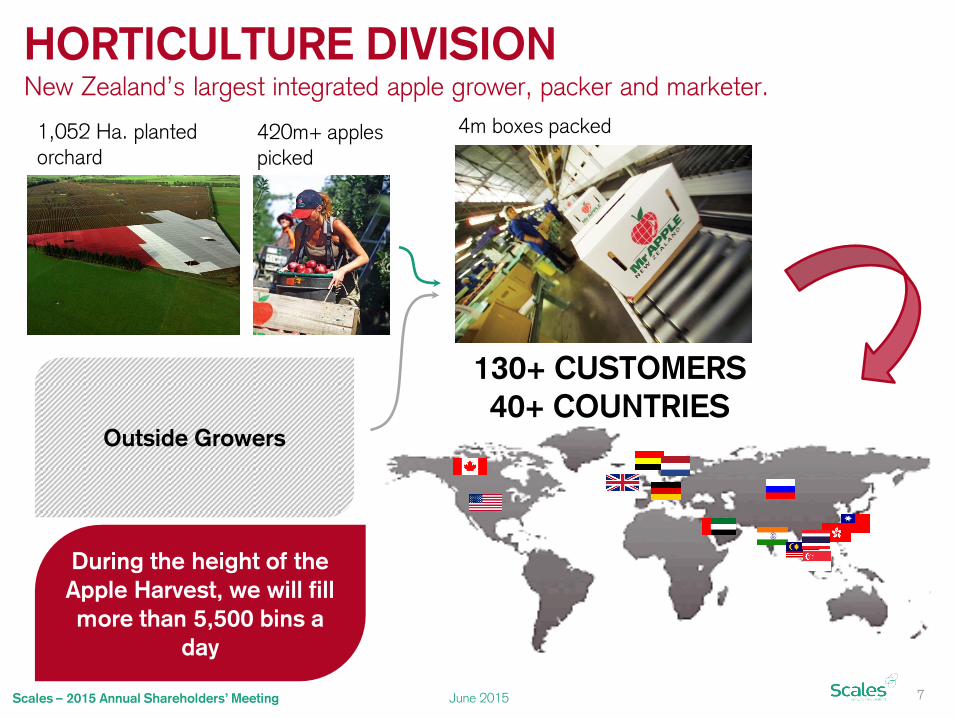
HORTICULTURE DIVISION New Zealand’s largest integrated apple grower, packer and marketer.
1,052 Ha. planted orchard
420m+ apples picked
4m boxes packed
Outside Growers
130+ CUSTOMERS
40+ COUNTRIES
During the height of the
Apple Harvest, we will fill
more than 5,500 bins a
day
7 June 2015 Scales – 2015 Annual Shareholders’ Meeting
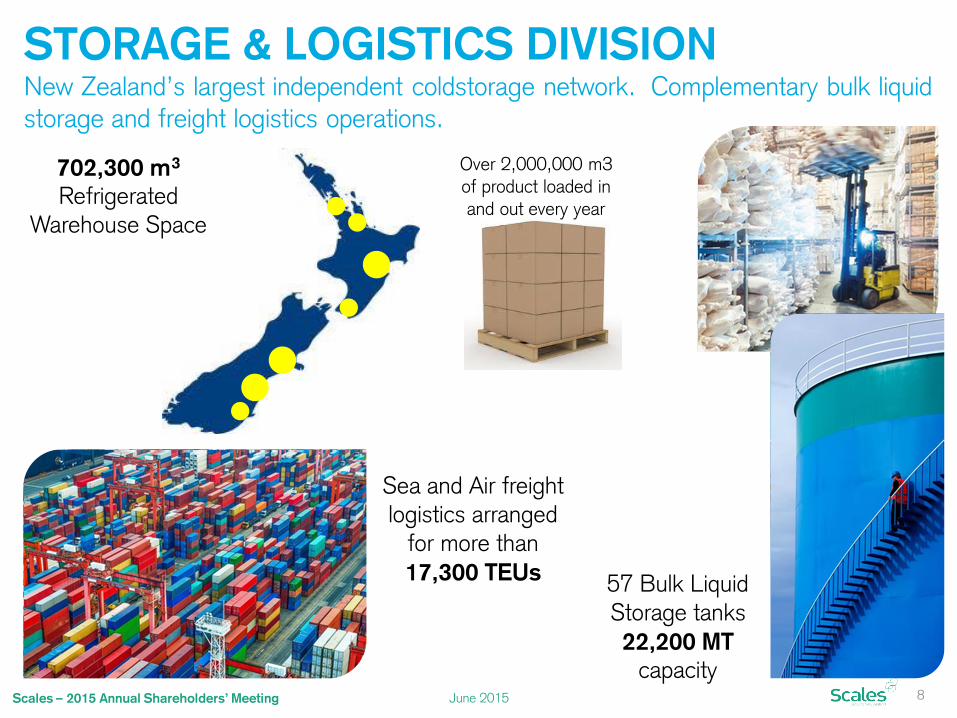
STORAGE & LOGISTICS DIVISION New Zealand’s largest independent coldstorage network. Complementary bulk liquid
storage and freight logistics operations.
702,300 m3
Refrigerated Warehouse Space
Over 2,000,000 m3
of product loaded in
and out every year
57 Bulk Liquid
Storage tanks
22,200 MT
capacity
Sea and Air freight logistics arranged
for more than
17,300 TEUs
8 June 2015 Scales – 2015 Annual Shareholders’ Meeting

FOOD INGREDIENTS DIVISION Petfood and Apple Juice Concentrate.
16.4m kg Petfood Ingredients sold
4.6m Litres
Juice Concentrate
• Apple
• Organic • Kiwfruit
9 June 2015 Scales – 2015 Annual Shareholders’ Meeting

June 2015 Scales – 2015 Annual Shareholders’ Meeting
DIVERSIFIED BY
SECTOR AND
REGION
• Asset rich portfolio, scale efficiencies, very high entry barriers.
Horticulture Division:
— Multiple packhouses, coolstores, and
>1,000 ha of planted apple orchard.
Storage & Logistics Division:
— Coldstores near most major NZ
ports.
— Bulk Liquid storage terminals in
Hawke’s Bay and Timaru.
Food Ingredients:
— North and South Island petfood
production facilities to capture
offtake from key meat regions.
10
National coverage, critical scale.
June 2015 Scales – 2015 Annual Shareholders’ Meeting
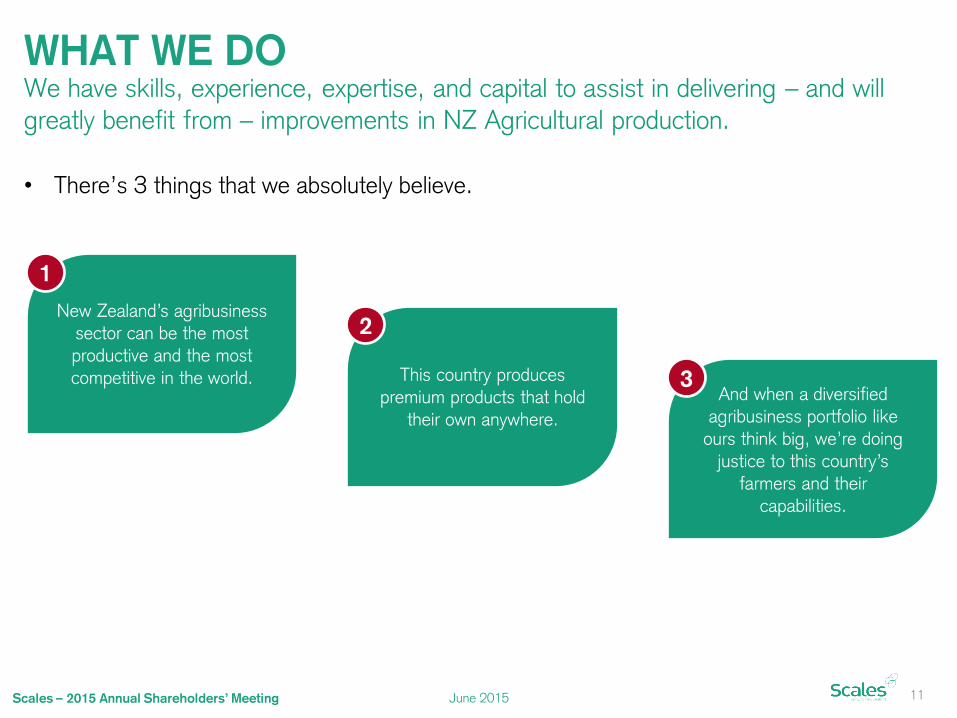
WHAT WE DO
• There’s 3 things that we absolutely believe.
11
We have skills, experience, expertise, and capital to assist in delivering – and will
greatly benefit from – improvements in NZ Agricultural production.
New Zealand’s agribusiness
sector can be the most
productive and the most
competitive in the world. This country produces
premium products that hold
their own anywhere.
And when a diversified
agribusiness portfolio like
ours think big, we’re doing
justice to this country’s
farmers and their
capabilities.
1
2
3

June 2015 Scales – 2015 Annual Shareholders’ Meeting
WHY WE ARE DIFFERENT
• We have been endowed with:
Passionate, innovative, and experienced people operating in an empowering culture.
Diversified, strategically located, highly productive, and vertically-integrated agribusiness assets.
Access to rapidly growing export markets.
• With these endowments, we:
Add value to our portfolio by providing specialist governance, strategic direction, capital support, and critical mass.
Have specialist networks and insights to direct future investment.
Have extensive industry experience – our people are at the leading edge of their fields.
Provide our shareholders with unique access and investment exposure to growth-focused, NZ-
based, primary production and servicing businesses.
• Focus on cash returns to shareholders:
Pre-tax dividend yield 8.7%, tax paid yield 6.25% will be delivered to shareholders that bought in at the IPO price of $1.60.
12
We have the expertise, experience and financial capability to help transform New
Zealand into a global agribusiness super-power amongst the world’s temperate
climates.

2 2014 HIGHLIGHTS

June 2015 Scales – 2015 Annual Shareholders’ Meeting
TRADING AHEAD OF IPO FORECASTS
• We are committed to delivering on our IPO forecasts and so far have met those targets.
14
Financial performance targets exceeded.
$’000 2014 Actual 2014 IPO Forecast
Variance
Revenue 263,262 253,927 +3.7%
Gross Margin 81,273 77,256 +5.2%
Underlying EBITDA 39,849 38,811 +2.7%
Underlying Net Profit 19,763 18,530 +6.7%
Net Profit from Continuing Operations 18,076 15,655 +15.5%

June 2015 Scales – 2015 Annual Shareholders’ Meeting
$23.9m57%
$12.3m29%
$5.7m14%
Mr Apple$23.5m
Share of Fern Ridge$0.5m
Coldstores$10.3m
Liqueo$1.3m
Scales Logistics$0.8m
Meateor$4.6m
Share of Profruit$1.0m HORTICULTURE
STORAGE &
LOGISTICS
EBITDA COMPOSITION
15
FY2014A EBITDA by Division and Business (NZ$)
FOOD
INGREDIENTS
Group EBITDA $39.8m (after deducting corporate costs of $2.1m)

June 2015 Scales – 2015 Annual Shareholders’ Meeting
STRENGTH THROUGH DIVERSITY
16
Consistent, and predictable, financial performance through diversification.
2014 EBITDA by Division, Variance to PFI ($000)
1,404
(1,652)
1,775
(489)
1,038
Horticulture Storage & Logistics Food Ingredients Corp. & Other Group
• Since listing, some of the challenges identified in our Prospectus have arisen. With our
diversified economic strength, and through careful management of those risks, Group
performance exceeded targets.
Varietal and customer diversification, our strong brand presence, and early season strong international demand meant that Mr Apple was largely immunised against late season European weakness resulting from the Russian food import ban.
A colder and wetter spring resulted in a later start to the cropping and meat production season. Load-outs for customers higher than usual given strong international food demand.
A beneficiary of the strong international food demand that negatively impacted our Storage & Logistics division.

June 2015 Scales – 2015 Annual Shareholders’ Meeting
MEETING OR EXCEEDING KPIs
17
$’000 2014 Actual 2014 IPO Forecast
Variance
Horticulture:
Total Volume Sold (Mr Apple + External Growers) 3,970 3,887 +2.1%
Total Mr Apple Volume Sold 2,752 2,569 +7.1%
Comprising:
Premium Apples
- Mr Apple total own volumes sold (TCE 000s) 1,036 984 +5.3%
- Weighted average price (NZD / TCE – FOB) $32.8 $30.5 +7.5%
Traditional Apples
- Mr Apple total own volumes sold (TCE 000s) 1,716 1,585 +8.3%
- Weighted average price (NZD / TCE – FOB) $24.8 $25.1 -1.2%
Storage & Logistics
Total refrigerated coldstorage space (at end of year, m3 000s) 606.6 606.6 -
Total capacity of all bulk liquid storage tanks (MT 000s) 22,200 22,200 -
TEUs shipped 17,336 n/a
Airfreight tonnes arranged 1,623 n/a
Food Ingredients
Petfood ingredients sold (million kgs) 16.4 15.8 +3.5%

June 2015 Scales – 2015 Annual Shareholders’ Meeting
STRONG BALANCE SHEET
18
Assets by Category
103.0 101.6
42.144.3
26.9 31.4
25.6 27.3
0.0
50.0
100.0
150.0
200.0
250.0
2013 2014
Working Capital and Other Biological Assets
Other PP&E Land & Buildings
Net Assets
Banking Covenants FY2014
Actual IPO Forecast
Interest Cover Ratio
Ratio 11.8x 9.1x
Covenant 3.0x 3.0x
Headroom 293% 203%
Senior Term Debt Leverage Ratio (times covered)
Ratio 0.8x 0.8x
Covenant (must be less than) 2.5x 2.5x
Headroom 213% 213%
• We have a large asset base centred
around our material investment in land and buildings.
• We currently have considerable headroom in our banking covenants.

3 MR APPLE’S
TECHNOLOGY LED
GROWTH

June 2015 Scales – 2015 Annual Shareholders’ Meeting
A GLOBAL LEADER
20
We combine excellent growing conditions, technology, and the world’s best apple
orchardists working collaboratively to achieve (what we think are) the world’s leading
apple yields.
• Our yields are:
16% higher than the NZ average.
~3x higher than the global average.
Consistent.
• Without giving away any secrets, the next few slides cover some of the technology we
employ to achieve world leading yields.
57.5
66.9
0
10
20
30
40
50
60
70
Yields per Hectare (Gross Production in Metric Tonnes, 2011-13)
Source: World Apple Review 2014, Mr Apple.

June 2015 Scales – 2015 Annual Shareholders’ Meeting
FROM ART TO SCIENCE
21
Mr Apple is a highly efficient and effective apple grower, packer and marketer.
Growing: • 53 Global Gap accredited orchards. • 100 wind machines providing frost
protection. • 90% of our orchards are permanently
irrigated. • $2.1m invested in ~500 kilometres of
reflective foil. • $11.3m invested in 301 hectares of
premium varieties. • Technology focus – proprietary, best-
in-class software accessible on iPads in the orchard.
Harvesting: • Scientific-based approach to ensure
apples meet stringent maturity standards (brix, firmness, starch).
• As a result, Mr Apple apples last longer and store better with limited loss in quality, allowing us to service the market over the entire season.
• Multiple picks optimising growing conditions.
• Experienced fruit pickers with high level of return seasonal employees through RSE scheme.
Grading: • Automated defect grading,
complemented by inhouse software with commercial opportunities removes human error.
• $3.4m invested in world leading grading equipment, instantly analysing an apple to sort by size, colour profile, and reject fruit with defects.
• Significantly enhances consistency, and ensures all cartons meet customer specifications.
-750
1,5002,2503,0003,7504,500
2008 2009 2010 2011 2012 2013 2014
To deliver consistent and
improving yields every year.
Gross Production / Ha. (TCEs)

June 2015 Scales – 2015 Annual Shareholders’ Meeting
FROM ART TO SCIENCE (CONT’D)
22
Cool Chain: • Mr Apple has invested more than
$10.6m in state of the art forced air cooling.
• Ability to SmartFresh, pre-cool, store, and Controlled Atmosphere (CA) store over 25,000 pallets.
• During the harvest 800 pallets are cooled from a field temperature of 22C down to a pulp temperature <2C every day.
• Full vertical integration permits the most efficient utilisation of our coolstore investment.
Shipping: • Dedicated shipping team ensures
customer’s shipments are completed on time, as required.
• Relationships with multiple shipping lines to accommodate global distribution all season long.
• Fully automated in-house logistics system.
Globally Leading Brands: • Our commitment to product
excellence, supplemented by our marketing support means that our brands are highly sought after.
• Insights and networks are being established and developed throughout China and the wider Asian markets via our participation in the Primary Collaboration NZ (Shanghai) Joint Venture.
4 OUR STRATEGY FOR
CREATING GROWTH

June 2015 Scales – 2015 Annual Shareholders’ Meeting
24
Scales’ Vision: To be the foremost investor in, and grower of, New Zealand agribusinesses by
leveraging our unique insights, experience, and access to collaborative
synergies.
Our long-term goal: To generate a long-run average 15% Return on Capital employed across our
portfolio.*
*Calculated as Underlying EBIT / Capital Employed, where Underlying EBIT is calculated as Underlying Net Profit plus Net Financing Costs and Tax, and Capital Employed is calculated as Non Current
Assets plus Current Assets (excluding any Cash or Cash Equivalent balances) less Current Liabilities (excluding any Overdraft or Short-Term Debt balances).

June 2015 Scales – 2015 Annual Shareholders’ Meeting
ORGANIC GROWTH STRATEGY
• Our pre-IPO growth strategy was focused around an intensive 3-5 year investment in our Horticultural division. With that investment largely completed and paying dividends, our
attention is now fully on our Storage & Logistics and Food Ingredients divisions.
25
Progressing the next phase of our growth strategy.
Horticulture
Orchard Redevelopment
Cool Chain
Packhouse Efficiency
On Orchard Technology
Develop a fully national coldstore network
Establishing specialist air freighting operation (Balance Cargo)
Maximise coldstore efficiencies
Use Auckland presence to expand our broader logistics offering
Develop and expand protein supply sources
Broaden product range
Storage & Logistics
Food Ingredients
IPO Today

June 2015 Scales – 2015 Annual Shareholders’ Meeting
FOCUSING ON STORAGE & LOGISTICS
26
Our current investment cycle is focused on achieving even better returns from our
Storage & Logistics division.
• Established perishable
airfreight specialist division Balance Cargo – growing
strongly.
• Auckland Coldstore –
construction progressing well. Opening for business Q4.
Auckland Coldstore will become a base from which to expand broader logistics offering.
• Investing in efficiencies and
capabilities in Timaru coldstores and bulk liquid
operations.

June 2015 Scales – 2015 Annual Shareholders’ Meeting
EXPANDING OUR REACH
• We have the skills, networks and experience to add value to the New Zealand agricultural sector.
• We continue to actively investigate ways we can develop our existing divisions or extend our agribusiness reach either by:
Acquiring appropriate ‘bolt-on’ businesses to support our existing operating divisions.
Developing new divisions or market sectors.
In some cases this may mean we invest offshore to support our local operations (e.g. petfood ingredients
sourcing from Australia).
• But we will remain patient and disciplined. All investment should:
Align with our core beliefs.
Deliver collaborative synergies and align with our core competencies.
Have scale, enhance scale, or be able to achieve scale.
Be forecast to meet our minimum Return on Capital Employment benchmark of 15% across the portfolio.
27

June 2015 Scales – 2015 Annual Shareholders’ Meeting
CLEARLY DEFINED OBJECTIVES
• Our Annual Report clearly outlines our Near and Medium Term Objectives, both for the
Group and for each of our operating divisions.
• Our Group objectives are repeated below:
28
OUR OBJECTIVES
NEAR TERM OBJECTIVES (<2 YEARS) MEDIUM TERM OBJECTIVES (2-5 YEARS)
Align Health & Safety practices across the Group to meet
global best practice.
Be recognised as one of New Zealand’s safest companies to
work for.
Meet or exceed Financial Performance projections in our
Prospectus.
Deliver meaningful growth in our existing, or potentially new,
divisions through organic investment and/or acquisition.
Enhance current business activities by continuing to invest in
their growth and unlock their potential.

5 THE YEAR AHEAD
June 2015 Scales – 2015 Annual Shareholders’ Meeting
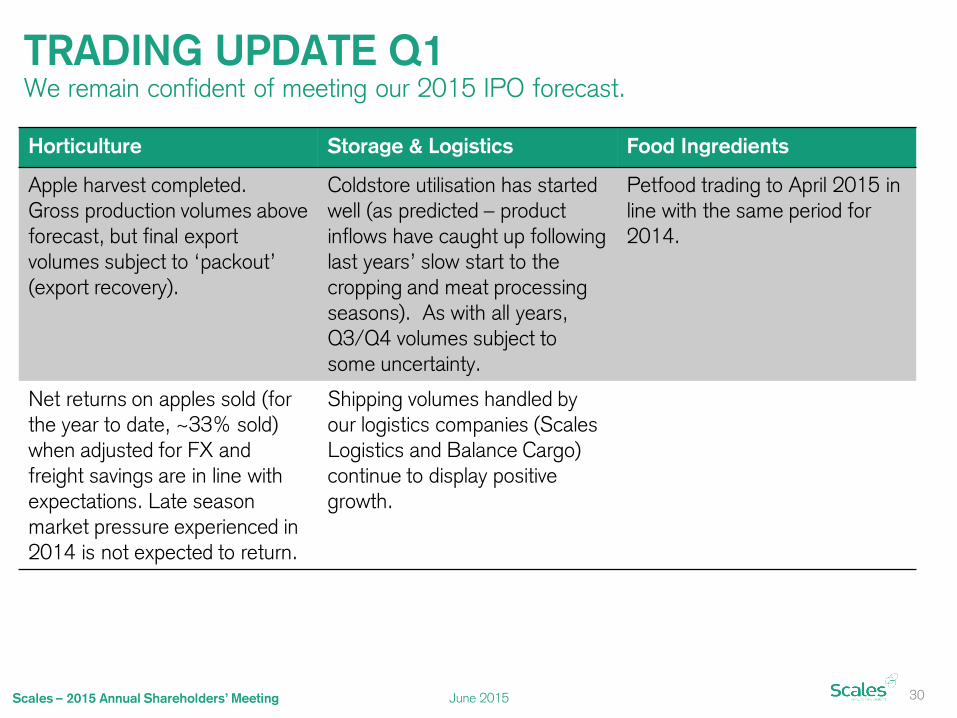
TRADING UPDATE Q1
30
We remain confident of meeting our 2015 IPO forecast.
Horticulture Storage & Logistics Food Ingredients
Apple harvest completed. Gross production volumes above forecast, but final export volumes subject to ‘packout’ (export recovery).
Coldstore utilisation has started well (as predicted – product inflows have caught up following last years’ slow start to the cropping and meat processing seasons). As with all years, Q3/Q4 volumes subject to some uncertainty.
Petfood trading to April 2015 in line with the same period for 2014.
Net returns on apples sold (for the year to date, ~33% sold) when adjusted for FX and freight savings are in line with expectations. Late season market pressure experienced in 2014 is not expected to return.
Shipping volumes handled by our logistics companies (Scales Logistics and Balance Cargo) continue to display positive growth.
6 INVESTOR
RETURNS

June 2015 Scales – 2015 Annual Shareholders’ Meeting
0
200
400
600
800
1,000
1,200
1,400
1,600
1,800
2,000
$1.20
$1.30
$1.40
$1.50
$1.60
$1.70
$1.80
Jul-14 Sep-14 Oct-14 Nov-14 Jan-15 Feb-15 Apr-15 May-15
SHARE PRICE AND VOLUME
• Solid share price appreciation since mid-October 2014.
• 10% return on issue price to date (being $0.03 cash dividend + current* share price of
$1.73 on $1.60 issue price).
• Average of ~200,000 shares traded every day (last two months).
32
$1.73 Current*
Share Price
Share
Pric
e
Volu
me
$0.03 fully-imputed
dividend paid
*Share Price as at close on 5 June 2015.
$0.07 fully-imputed
final dividend
announced

June 2015 Scales – 2015 Annual Shareholders’ Meeting
DIVIDEND YIELD
• At current pricing, Scales offers a leading dividend yield.
The chart below compares the dividend yield of all companies in the NZX50 and how Scales compares to those companies (NB. For clarification, Scales is not currently included in the NZX50).
33
0.0%
2.0%
4.0%
6.0%
8.0%
10.0%
12.0%
14.0%
A2 M
ilk
Coats
Dili
gent
Orion H
ealth
Paci
fic
Edge
Xero
Metli
feca
re
Sum
mers
et
Rym
an H
ealth
care
PFI
Metr
oG
lass
F&
P H
ealth
care
Vita
l Health
care
Main
freig
ht
Pre
cinct
Pro
pert
ies
Fonte
rra F
und
Arg
osy
Goodm
an P
ropert
y
Auck
land A
irport
Port
of
Taura
nga
Fle
tcher
Build
ing
Nuple
x
Infr
atil
Fre
ightw
ays
Sky
City
West
pac
Kiw
i Inco
me
Air N
Z
AN
Z B
ank
Conta
ct E
nerg
y
Tra
deM
e
Rest
aura
nt B
rands
Sky
TV
Z E
nerg
y
Tru
stpow
er
Mig
hty
Riv
er
Pow
er
Vect
or
Meridia
n
Heart
land
Tow
er
EB
OS
NZ
X
Sca
les
Ware
house
DN
Z P
ropert
y
Ste
el &
Tube
Skelle
rup
Spark
Genesi
s E
nerg
y
Choru
s
Kath
mandu
Gross Dividend Yield*, Based on Closing Prices as at 29 May 2015
*Dividend yield calculations exclude special dividends paid. For all companies, yields are based on dividends paid in the last 12 months (or the most recent dividend within the last 12 months plus the value of a declared dividend to be paid in the next few weeks). Yields include any imputation credits attached to dividends.

QUESTIONS

ORDINARY BUSINESS
AND RESOLUTIONS

June 2015 Scales – 2015 Annual Shareholders’ Meeting
RESOLUTION 1
36
Remuneration of auditor
POSTAL AND PROXY VOTING
FOR 64,617,221 99.27%
AGAINST 54,194 0.08%
DISCRETIONARY 418,409 0.64%
ABSTAIN 113,689 N/A

June 2015 Scales – 2015 Annual Shareholders’ Meeting
RESOLUTION 2
37
Re-election of Nicholas Harris
POSTAL AND PROXY VOTING
FOR 64,612,810 99.28%
AGAINST 1,000 0.00%
DISCRETIONARY 465,739 0.72%
ABSTAIN 123,964 N/A
June 2015 Scales – 2015 Annual Shareholders’ Meeting
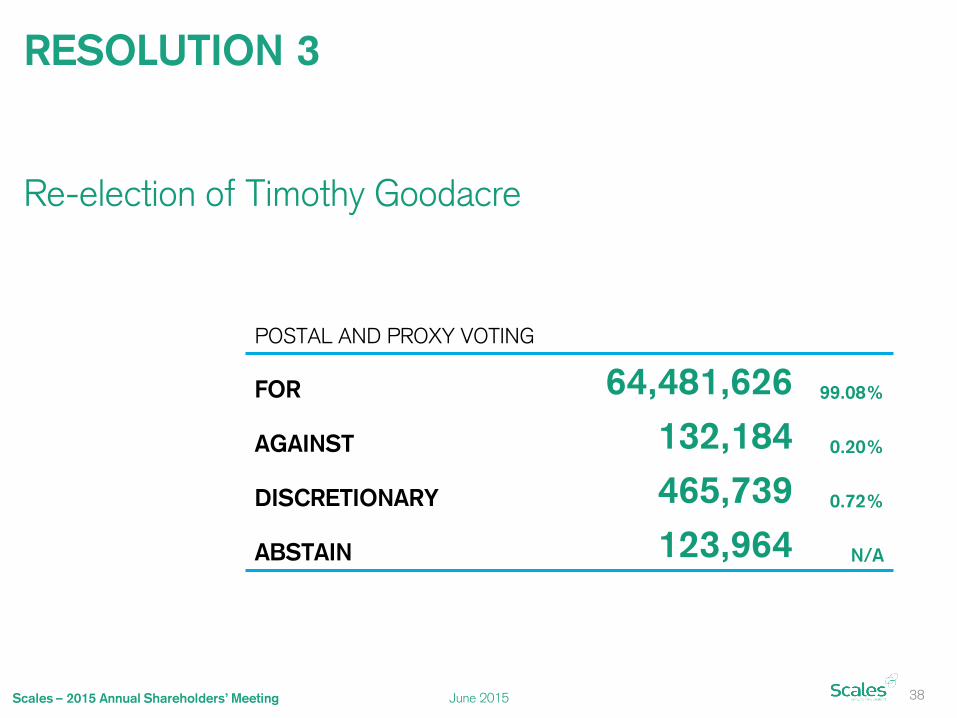
RESOLUTION 3
38
Re-election of Timothy Goodacre
POSTAL AND PROXY VOTING
FOR 64,481,626 99.08%
AGAINST 132,184 0.20%
DISCRETIONARY 465,739 0.72%
ABSTAIN 123,964 N/A

June 2015 Scales – 2015 Annual Shareholders’ Meeting
DISCLAIMER Please do not read this presentation in isolation This presentation supplements our full year results announcement dated 26 February 2015 and Annual Report dated 27 March 2015. It should be read subject to and in conjunction with the additional information in that release, other material which we have released to the NZX, and our Investment Statement and Prospectus.
There is no offer or investment advice in this presentation This presentation is for information purposes only. It is not an offer of securities, or a proposal or invitation to make any such offer. It is not investment advice or a securities recommendation, and does not take into account any person’s individual circumstances or objectives. Every investor should make an independent assessment of Scales Corporation on the basis of independent expert financial advice.
Non-GAAP financial measures Our results are reported under NZ IFRS. This presentation includes non-GAAP financial measures which are not prepared in accordance with NZ IFRS. The non-GAAP financial measures used in this presentation include: • EBITDA. We calculate EBITDA by adding back (or deducting) depreciation, amortisation, finance expense / (income), and taxation expense to net earnings / (loss)
from continuing operations. • EBIT. We calculate EBIT by adding back (or deducting) finance expense / (income), and taxation expense to net earnings / (loss) from continuing operations. • Underlying EBITDA and EBIT are calculated by adding back (or deducting) any non-cash IFRS adjustments and IPO offer costs. • Underlying Net Profit is calculated by adding back or (or deducting) the after-tax effect of any non-cash IFRS adjustments, discontinued operations, and IPO offer
costs We believe that these non-GAAP financial measures provide useful information to readers to assist in the understanding of our financial performance, financial position or returns, but that they should not be viewed in isolation, nor considered as a substitute for measures reported in accordance with NZIFRS. Non-GAAP financial measures may not be comparable to similarly titled amounts reported by other companies.
Disclaimer To the maximum extent permitted by law, we will not be liable (whether in tort (including negligence) or otherwise) to you or any other person in relation to this presentation, including any error in it.


