Page 1
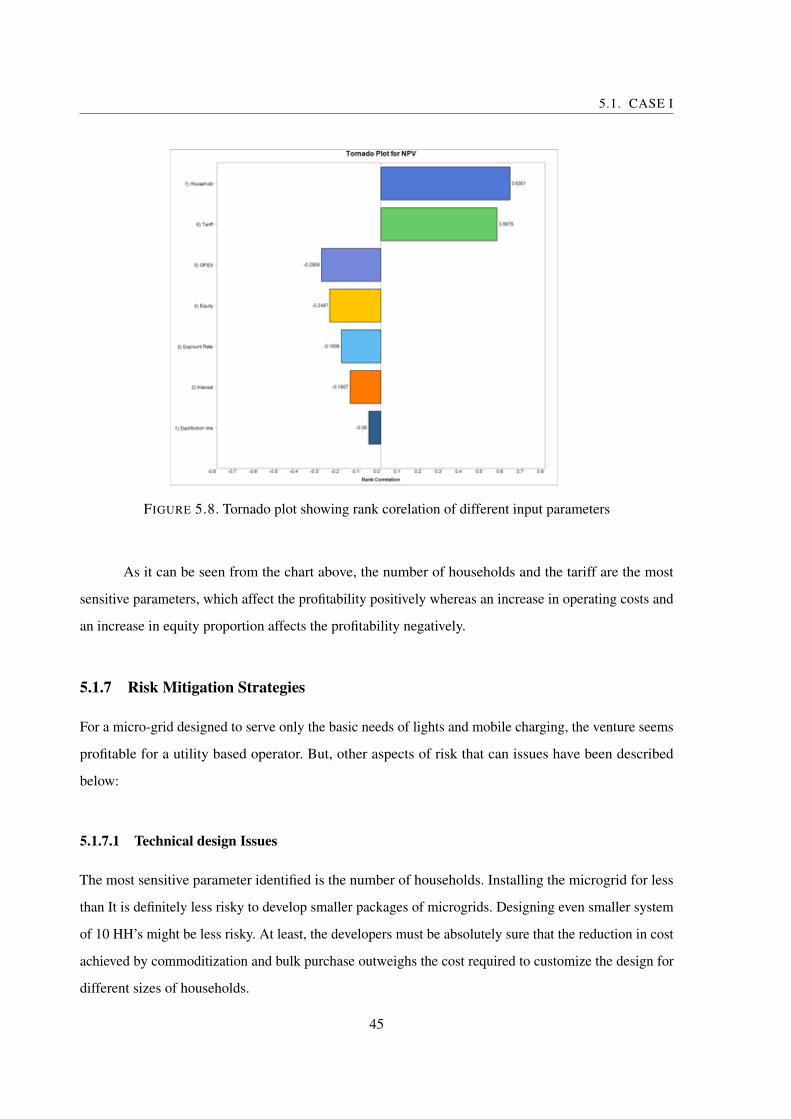
Scaling up of off-grid Solar Micro gridsMoving towards a "utility in a box" model for rapid deployment
By
ANJAL NIRAULA
Department of EngineeringUNIVERSITY OF EDINBURGH
A dissertation submitted to the University of Edinburgh in accor-dance with the requirements of the degree of MSC SUSTAINABLE
ENERGY SYSTEMS in the Faculty of Engineering.
14 AUGUST 2015
Word count: 19055
Page 3
ABSTRACT
T he study looks at obstacles and opportunities of scaling up solar energy based microgrids to
provide access to 1.3 billion people still without energy access. The objective was to evaluate
standardized approach to minigrid design by identifying crucial parameters that would make
microgrids economically feasible for private investors while delivering affordable energy services to the
people. The study focuses on numerous academic studies and also on the field experience of practitioners
and attempts to develop standard technical designs for microgrids. The study finds that models that focus
on providing basic access to energy in a geographically dense regions or models that leverage the use of
productive end use services to generate tangible value to the community hold potential for scaling up.
The possible mitigation measures for such risk have also been proposed.
Standardizing structures for such microgrid projects in terms of technology design, financing
structure, and the O&M structure will help private developers achieve scale by allowing them to lower
transaction costs and unlock institutional investment, which has been widely considered as the bottleneck
to rapid scaling up of rural electrification. But, achieving these objective will require tremendous
collaboration between the private sector, project developers, investors, and government agencies.
i
Page 5
AUTHOR’S DECLARATION
I declare that the work in this dissertation was carried out in accordance with therequirements of the University’s Regulations and Code of Practice and that it has notbeen submitted for any other academic award. Except where indicated by specific
reference in the text, the work is the candidate’s own work. Work done in collaborationwith, or with the assistance of, others, is indicated as such. Any views expressed in thedissertation are those of the author.
SIGNED: .................................................... DATE: ..........................................
iii
Page 7
TABLE OF CONTENTS
Page
List of Tables vii
List of Figures ix
1 Introduction 11.1 Aims and Objectives . . . . . . . . . . . . . . . . . . . . . . . . . . . . . . . . . . . 4
1.2 Reporting approach and structure . . . . . . . . . . . . . . . . . . . . . . . . . . . . . 4
1.3 Introducing the “Utility in a box” approach . . . . . . . . . . . . . . . . . . . . . . . 5
2 Background and Literature Review 72.1 Energy Access Today . . . . . . . . . . . . . . . . . . . . . . . . . . . . . . . . . . . 7
2.2 Providing access to sustainable energy solutions . . . . . . . . . . . . . . . . . . . . . 8
2.2.1 Energy Security . . . . . . . . . . . . . . . . . . . . . . . . . . . . . . . . . . 9
2.2.2 Energy Equity . . . . . . . . . . . . . . . . . . . . . . . . . . . . . . . . . . 9
2.2.3 Environmental Sustainability . . . . . . . . . . . . . . . . . . . . . . . . . . . 10
2.3 Grid Extension vs. Decentralized generation . . . . . . . . . . . . . . . . . . . . . . . 12
2.4 Micro/Mini grids vs Consumer product . . . . . . . . . . . . . . . . . . . . . . . . . 13
2.5 Financial barrier and the role of private sector . . . . . . . . . . . . . . . . . . . . . . 14
2.6 Scaling up Microgrids . . . . . . . . . . . . . . . . . . . . . . . . . . . . . . . . . . . 15
2.7 Microgrid design in the academic literature . . . . . . . . . . . . . . . . . . . . . . . 17
2.8 Factors affecting the commercial viability of the design . . . . . . . . . . . . . . . . . 19
3 Assessment of existing business models 233.1 OMC . . . . . . . . . . . . . . . . . . . . . . . . . . . . . . . . . . . . . . . . . . . 24
3.2 Mera Gao Power . . . . . . . . . . . . . . . . . . . . . . . . . . . . . . . . . . . . . 26
4 Methodology 274.1 Identifying a list of common sets of services . . . . . . . . . . . . . . . . . . . . . . . 27
4.2 Developing a technical design . . . . . . . . . . . . . . . . . . . . . . . . . . . . . . 29
4.2.1 Estimating Solar Resource Potential . . . . . . . . . . . . . . . . . . . . . . . 29
4.2.2 Sizing PV panels . . . . . . . . . . . . . . . . . . . . . . . . . . . . . . . . . 30
v
Page 8
TABLE OF CONTENTS
4.2.3 Sizing batteries . . . . . . . . . . . . . . . . . . . . . . . . . . . . . . . . . . 30
4.2.4 Charge controller, Inverter and other BoS components . . . . . . . . . . . . . 31
4.2.5 Transmission line design . . . . . . . . . . . . . . . . . . . . . . . . . . . . . 31
4.2.6 Optimization using HOMER . . . . . . . . . . . . . . . . . . . . . . . . . . . 31
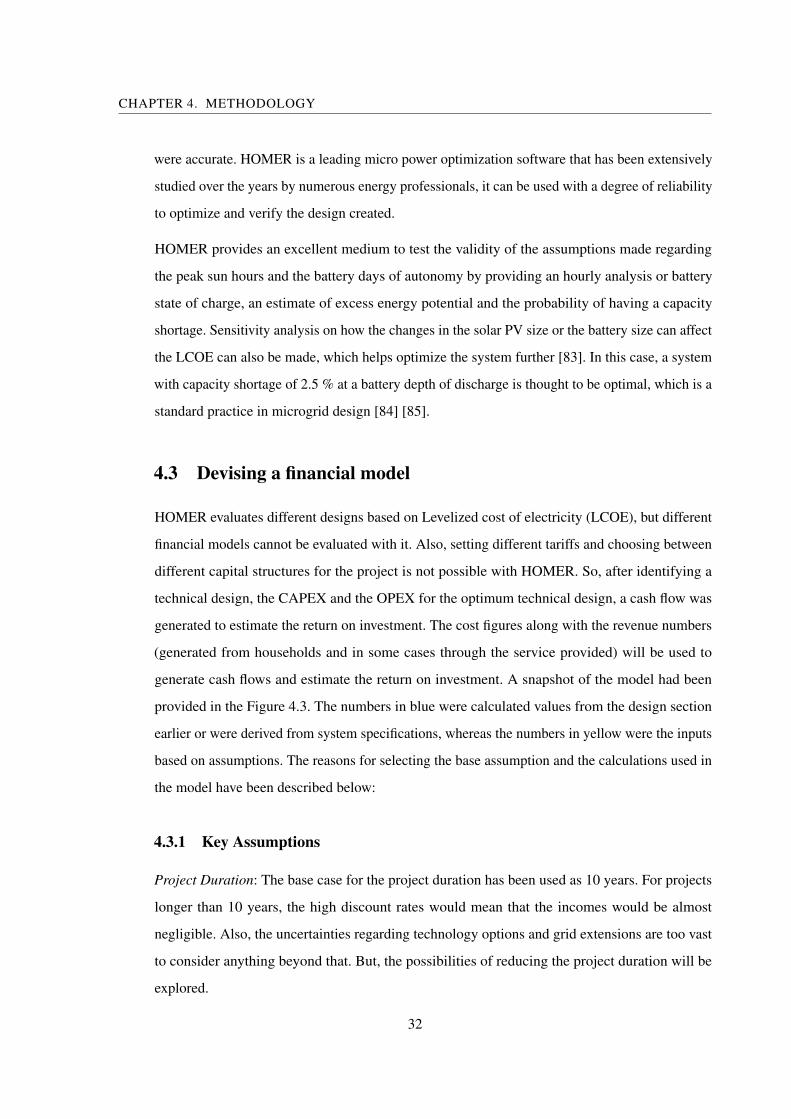
4.3 Devising a financial model . . . . . . . . . . . . . . . . . . . . . . . . . . . . . . . . 32
4.3.1 Key Assumptions . . . . . . . . . . . . . . . . . . . . . . . . . . . . . . . . . 32
4.3.2 Financial Indicators . . . . . . . . . . . . . . . . . . . . . . . . . . . . . . . . 35
4.4 Quantifying the effect of the key parameters . . . . . . . . . . . . . . . . . . . . . . . 35
4.5 Identifying mitigation measures for the most sensitive parameters . . . . . . . . . . . 36
4.6 Identify areas of further innovation . . . . . . . . . . . . . . . . . . . . . . . . . . . . 36
5 Case Studies 375.1 CASE I . . . . . . . . . . . . . . . . . . . . . . . . . . . . . . . . . . . . . . . . . . 37
5.1.1 Estimating Demand . . . . . . . . . . . . . . . . . . . . . . . . . . . . . . . . 37
5.1.2 System Size . . . . . . . . . . . . . . . . . . . . . . . . . . . . . . . . . . . . 38
5.1.3 Cost . . . . . . . . . . . . . . . . . . . . . . . . . . . . . . . . . . . . . . . . 39
5.1.4 Modeliing with HOMER . . . . . . . . . . . . . . . . . . . . . . . . . . . . . 40
5.1.5 Financial cash flow . . . . . . . . . . . . . . . . . . . . . . . . . . . . . . . . 42
5.1.6 Risk Analysis . . . . . . . . . . . . . . . . . . . . . . . . . . . . . . . . . . . 42
5.1.7 Risk Mitigation Strategies . . . . . . . . . . . . . . . . . . . . . . . . . . . . 45
5.2 CASE II . . . . . . . . . . . . . . . . . . . . . . . . . . . . . . . . . . . . . . . . . . 47
5.2.1 Estimating Demand . . . . . . . . . . . . . . . . . . . . . . . . . . . . . . . . 47
5.2.2 System deisgn and costs . . . . . . . . . . . . . . . . . . . . . . . . . . . . . 48
5.2.3 HOMER modelling . . . . . . . . . . . . . . . . . . . . . . . . . . . . . . . . 50
5.2.4 Financial Analysis . . . . . . . . . . . . . . . . . . . . . . . . . . . . . . . . 52
5.2.5 Risk Analysis . . . . . . . . . . . . . . . . . . . . . . . . . . . . . . . . . . . 54
5.2.6 Risk Mitigation Measures . . . . . . . . . . . . . . . . . . . . . . . . . . . . 56
5.3 CASE III . . . . . . . . . . . . . . . . . . . . . . . . . . . . . . . . . . . . . . . . . 59
5.3.1 Estimating Demand . . . . . . . . . . . . . . . . . . . . . . . . . . . . . . . . 59
5.3.2 System Design . . . . . . . . . . . . . . . . . . . . . . . . . . . . . . . . . . 59
5.3.3 Modelling with HOMER . . . . . . . . . . . . . . . . . . . . . . . . . . . . . 60
5.3.4 Cash Flow . . . . . . . . . . . . . . . . . . . . . . . . . . . . . . . . . . . . 61
5.3.5 Risk Analysis . . . . . . . . . . . . . . . . . . . . . . . . . . . . . . . . . . . 62
5.3.6 Risk Mitigation strategies . . . . . . . . . . . . . . . . . . . . . . . . . . . . 63
6 Discussion and Conclusion 65
A Appendix A 71
Bibliography 77
vi
Page 9
LIST OF TABLES
TABLE Page
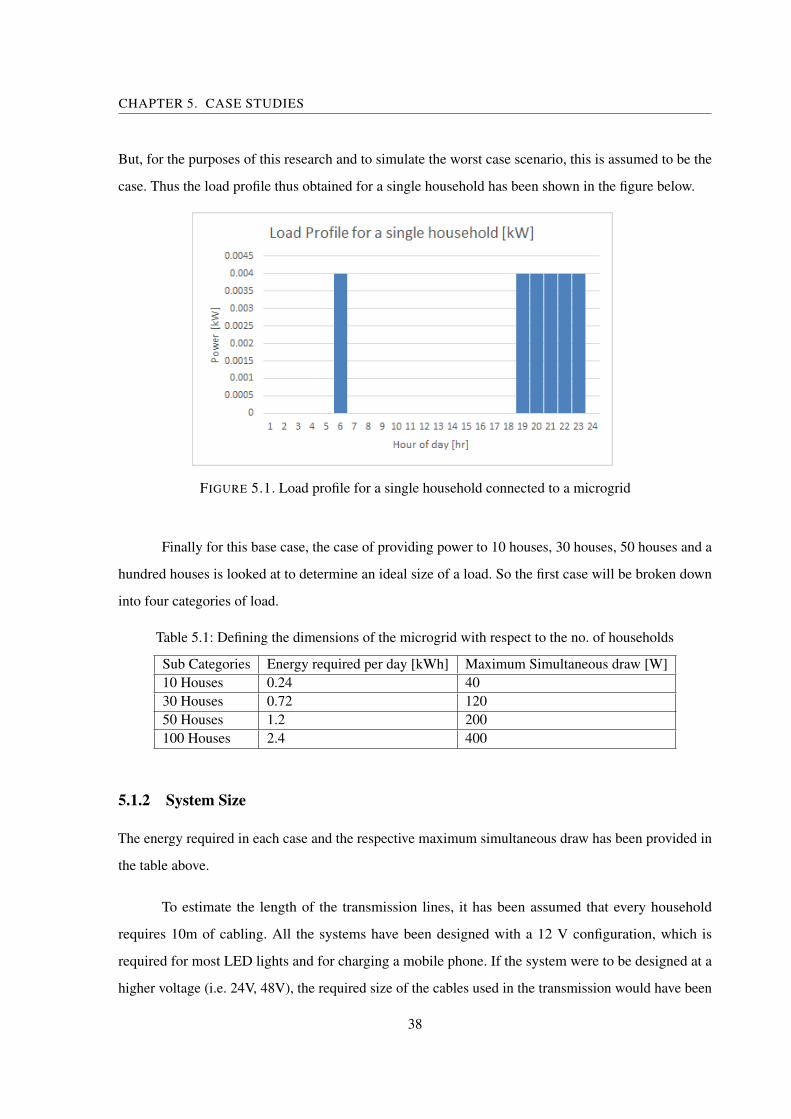
5.1 Defining the dimensions of the microgrid with respect to the no. of households . . . . . . 38
5.2 System configuration for each subgroup . . . . . . . . . . . . . . . . . . . . . . . . . . . 39
5.3 Cost Breakdown for each of the subgroups . . . . . . . . . . . . . . . . . . . . . . . . . . 39
5.4 System components and their respective costs for a chilling centre . . . . . . . . . . . . . 49
5.5 System components and their respective costs for a grinding mill . . . . . . . . . . . . . . 49
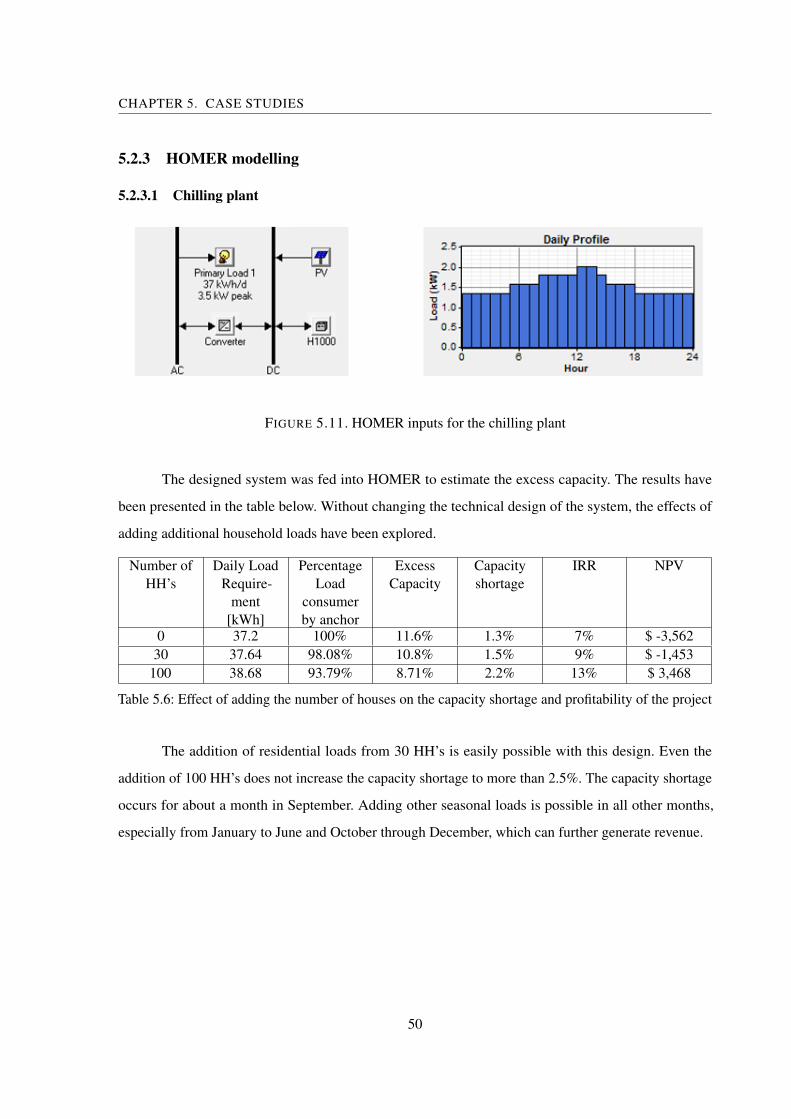
5.6 Effect of adding the number of houses on the capacity shortage and profitability of the project 50
5.7 Decreasing cost/HH with increasing number of households . . . . . . . . . . . . . . . . . 52
5.8 System details with their respective costs . . . . . . . . . . . . . . . . . . . . . . . . . . . 60
vii
Page 11
LIST OF FIGURES
FIGURE Page
2.1 Number of people without access to electricity by region in the new policy scenario (million) 8
2.2 Comparing costs for comparable lighting between kersosne and modern forms of lighting . 10
3.1 Aspects of Microgrid Design . . . . . . . . . . . . . . . . . . . . . . . . . . . . . . . . . 24
3.2 Cost breakdown of a typical OMC plant . . . . . . . . . . . . . . . . . . . . . . . . . . . 25
4.1 Detailed Methodology . . . . . . . . . . . . . . . . . . . . . . . . . . . . . . . . . . . . 28
4.2 Global Solar Resource map . . . . . . . . . . . . . . . . . . . . . . . . . . . . . . . . . . 29
4.3 Sample financial cash flow structure . . . . . . . . . . . . . . . . . . . . . . . . . . . . . 33
5.1 Load profile for a single household connected to a microgrid . . . . . . . . . . . . . . . . 38
5.2 Cost breakdown in percentage for different subgroups of houses . . . . . . . . . . . . . . 40
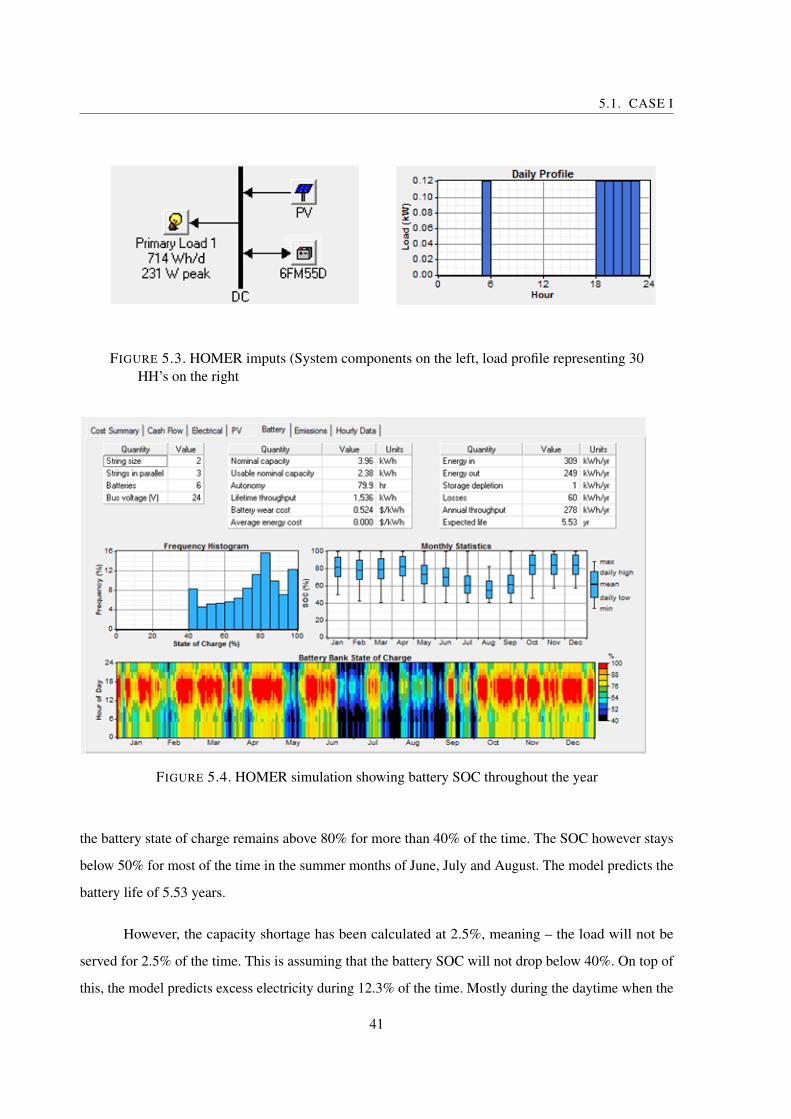
5.3 HOMER imputs (System components on the left, load profile representing 30 HH’s on the
right) . . . . . . . . . . . . . . . . . . . . . . . . . . . . . . . . . . . . . . . . . . . . . 41
5.4 HOMER simulation showing battery SOC throughout the year . . . . . . . . . . . . . . . 41
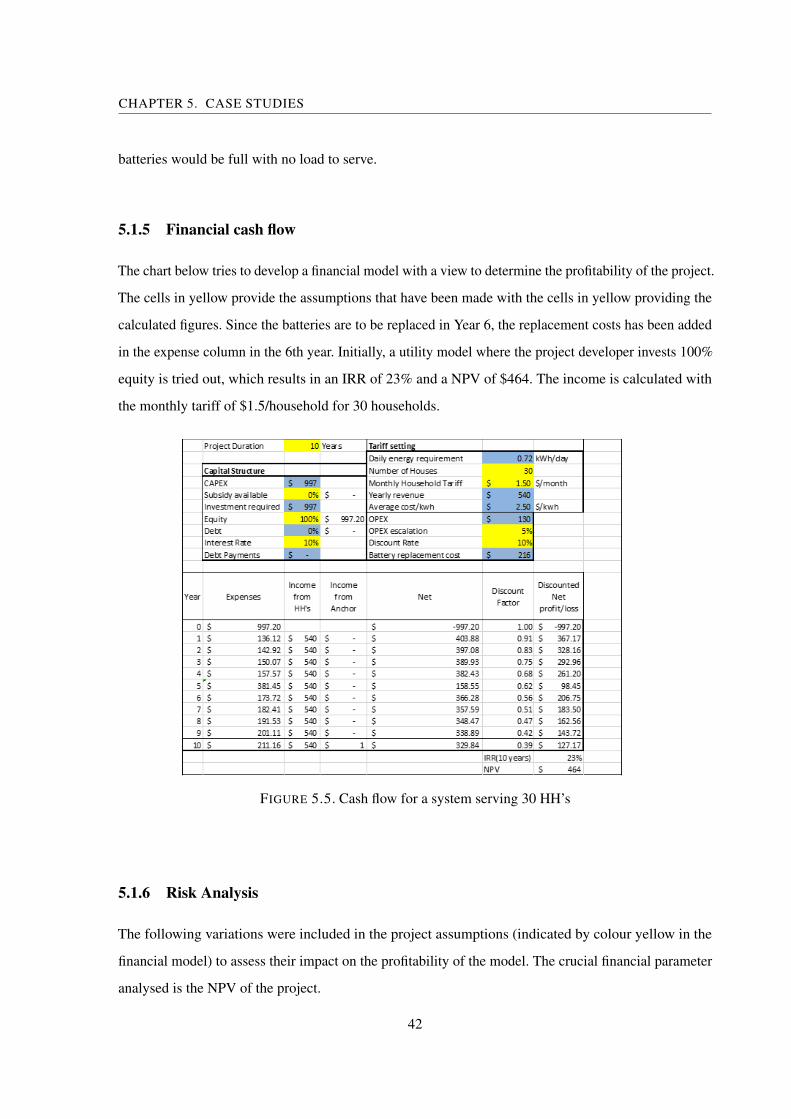
5.5 Cash flow for a system serving 30 HH’s . . . . . . . . . . . . . . . . . . . . . . . . . . . 42
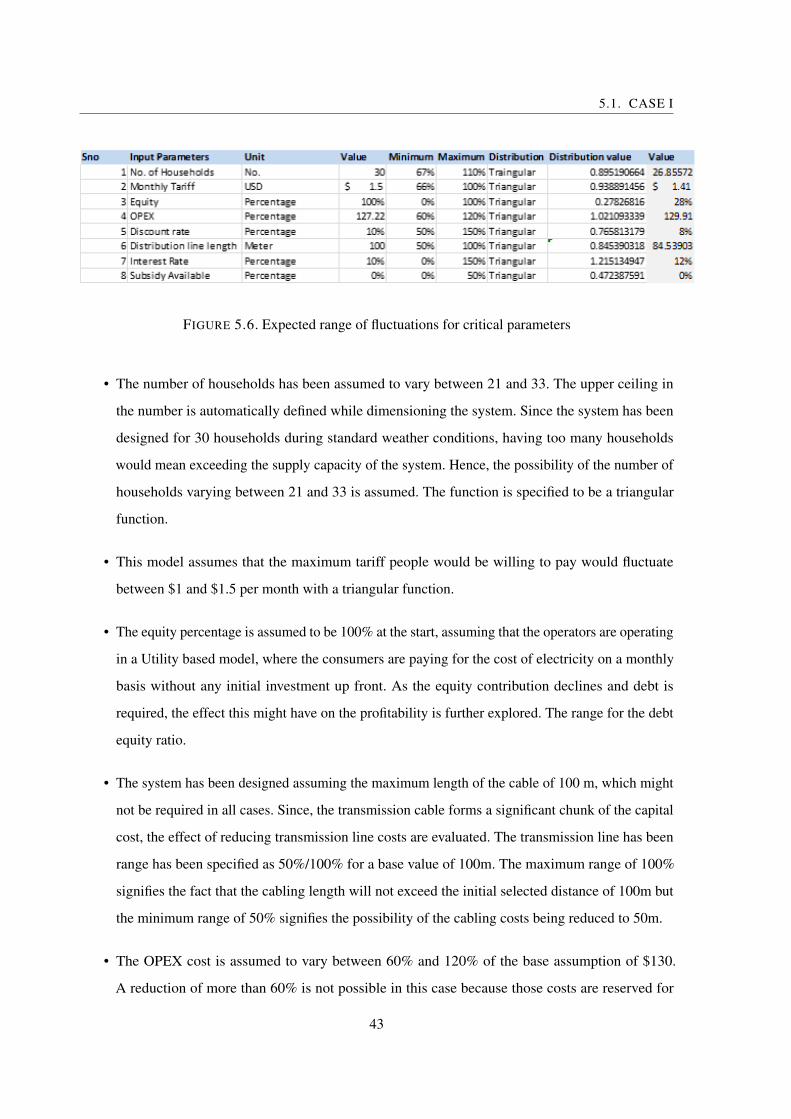
5.6 Expected range of fluctuations for critical parameters . . . . . . . . . . . . . . . . . . . . 43
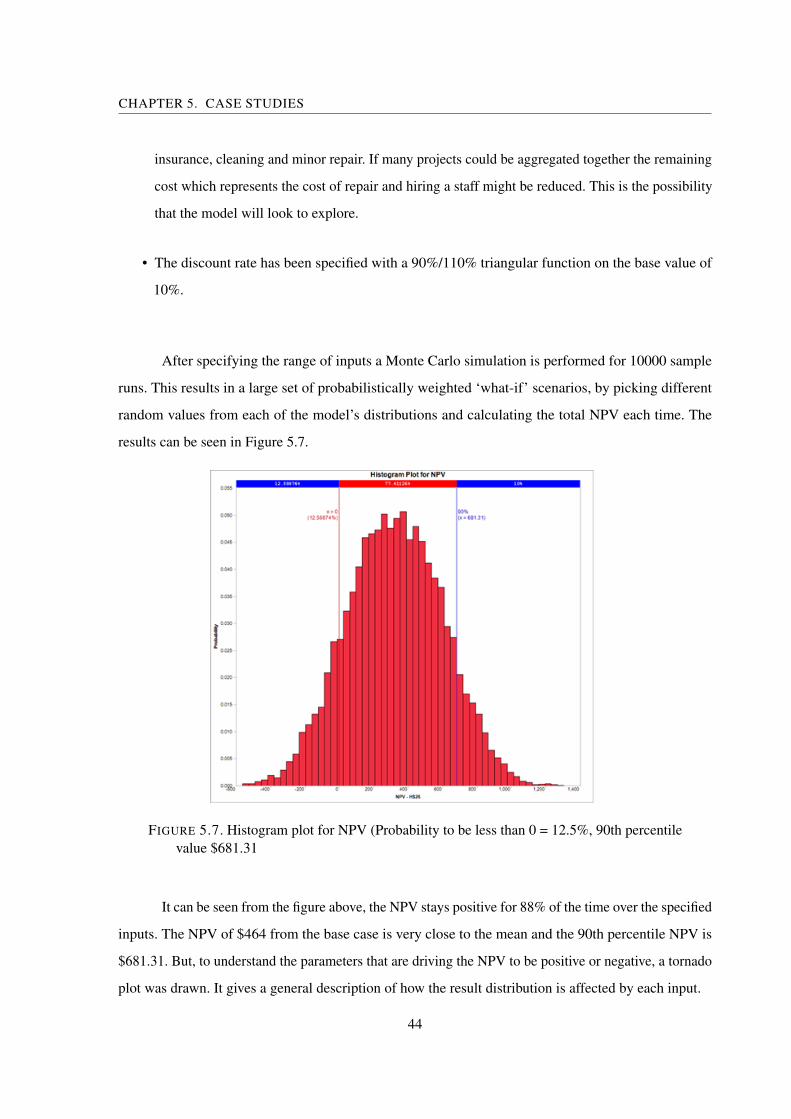
5.7 Histogram plot for NPV (Probability to be less than 0 = 12.5%, 90th percentile value $681.31 44
5.8 Tornado plot showing rank corelation of different input parameters . . . . . . . . . . . . . 45
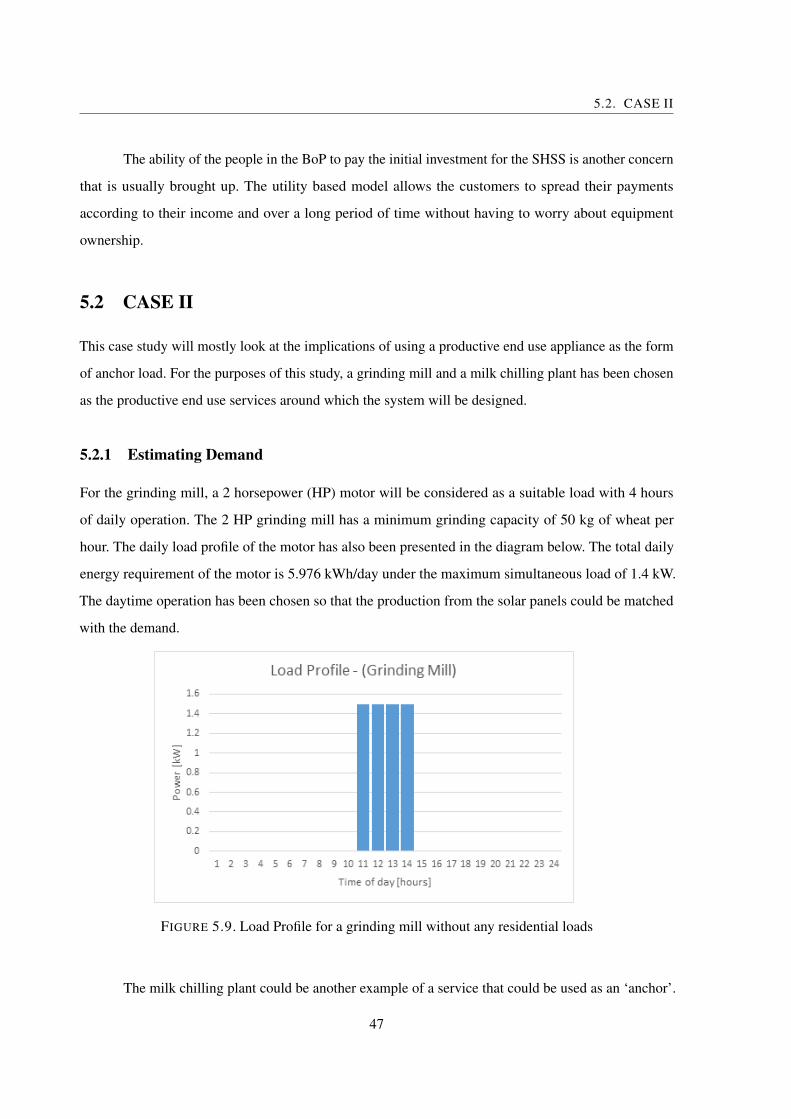
5.9 Load Profile for a grinding mill without any residential loads . . . . . . . . . . . . . . . . 47
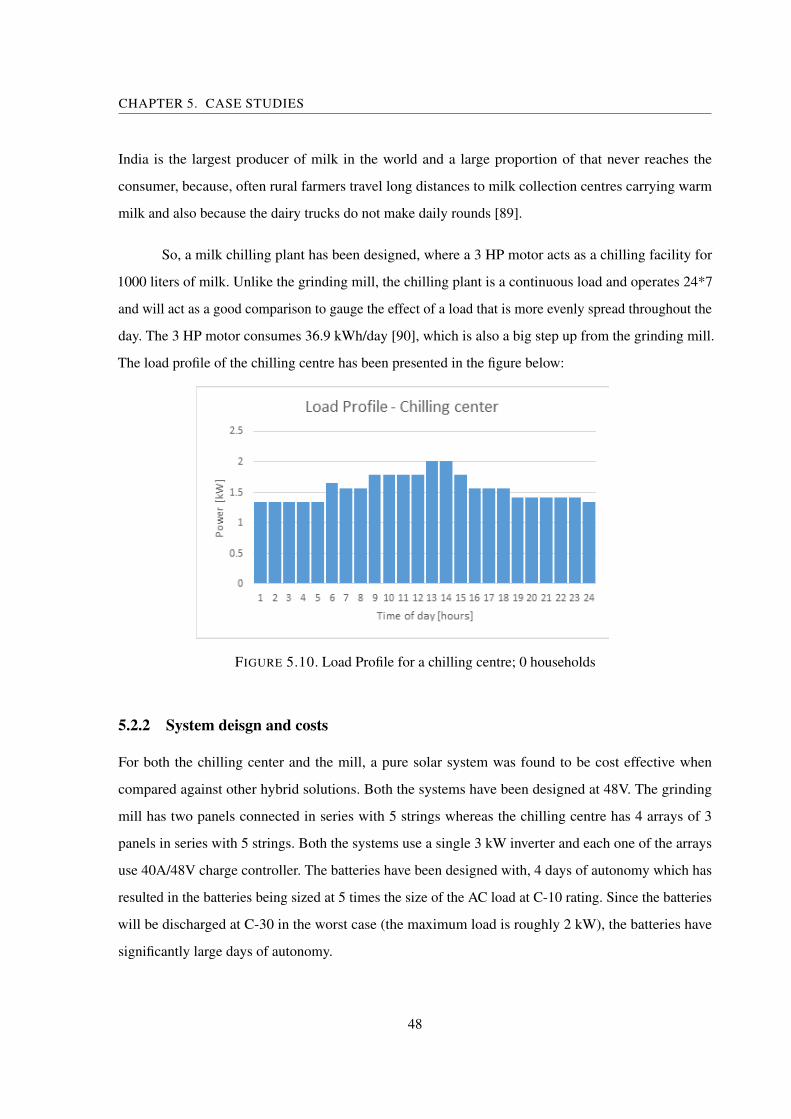
5.10 Load Profile for a chilling centre without any residential loads . . . . . . . . . . . . . . . 48
5.11 HOMER inputs for the chilling plant . . . . . . . . . . . . . . . . . . . . . . . . . . . . . 50
5.12 HOMER inputs for the grinding mill . . . . . . . . . . . . . . . . . . . . . . . . . . . . . 51
5.13 HOMER simulation output showing the excess generation capacity and seasonal production
fluctuations . . . . . . . . . . . . . . . . . . . . . . . . . . . . . . . . . . . . . . . . . . 51
5.14 Cash flow for a chilling center based microgrid . . . . . . . . . . . . . . . . . . . . . . . 53
5.15 Cash flow for a grinding center based microgrid . . . . . . . . . . . . . . . . . . . . . . . 54
5.16 Expected range of fluctuations for critical parameters . . . . . . . . . . . . . . . . . . . . 54
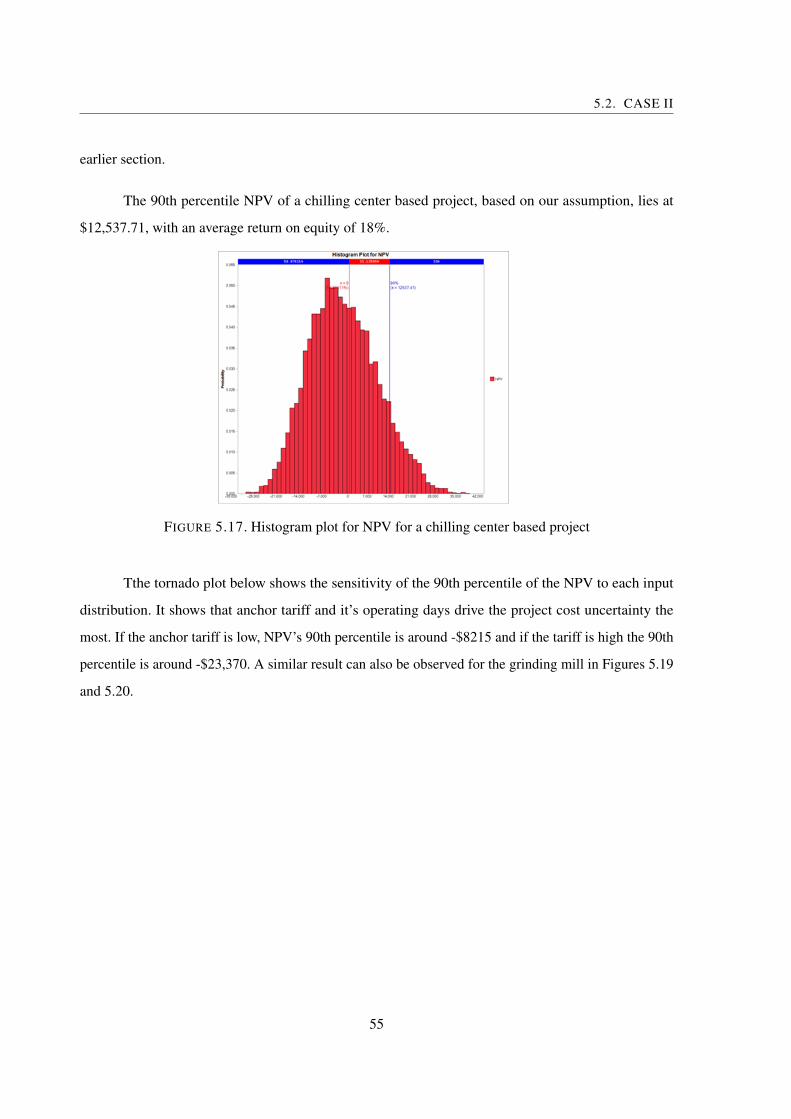
5.17 Histogram plot for NPV for a chilling center based project . . . . . . . . . . . . . . . . . 55
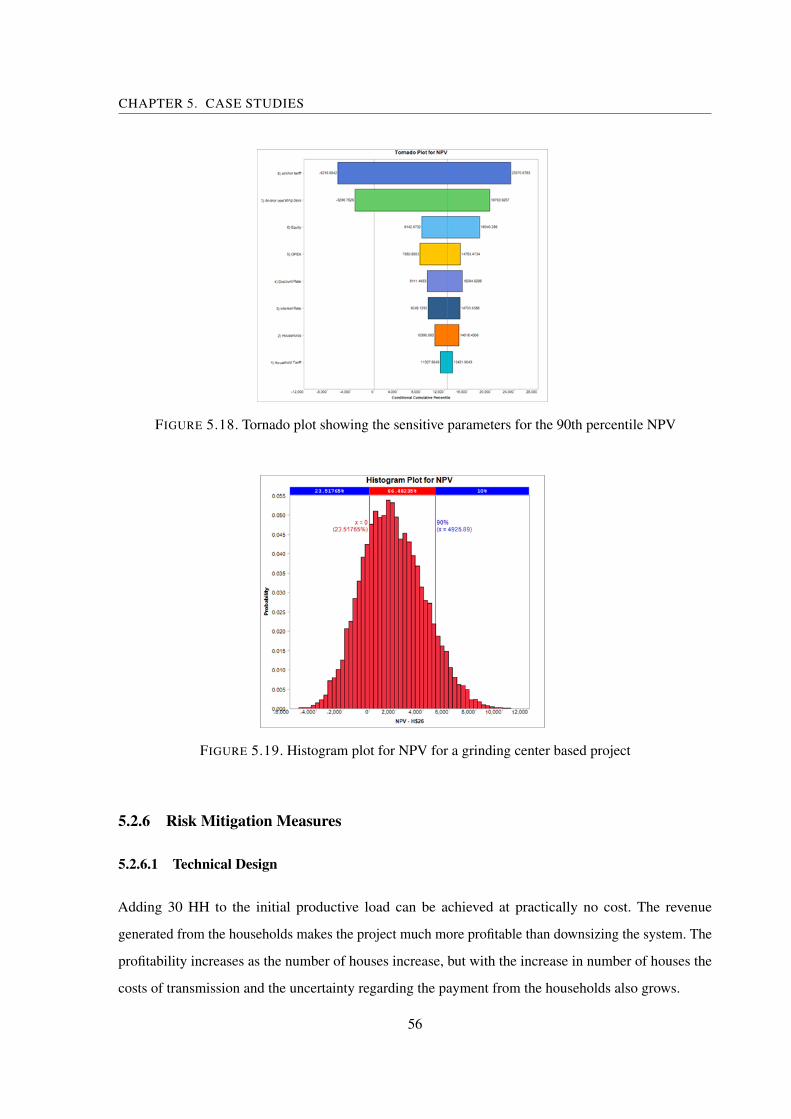
5.18 Tornado plot showing the sensitive parameters for the 90th percentile NPV . . . . . . . . . 56
ix
Page 12
LIST OF FIGURES
5.19 Histogram plot for NPV for a grinding center based project . . . . . . . . . . . . . . . . . 56
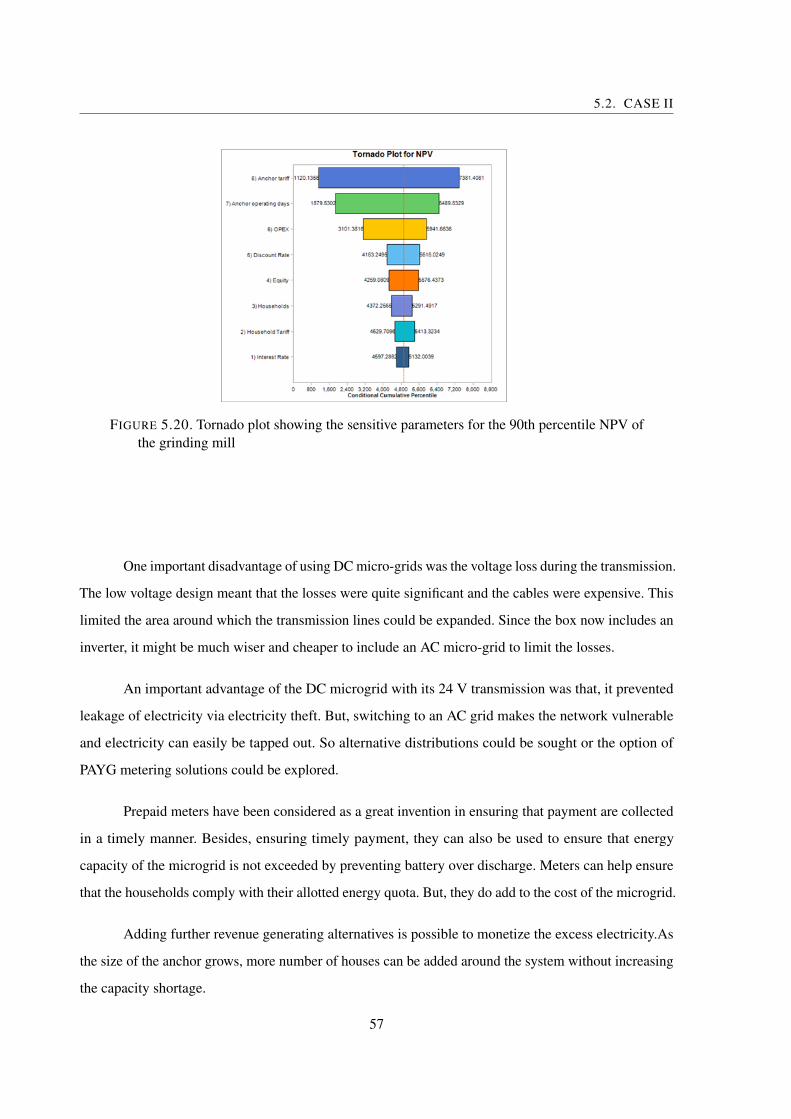
5.20 Tornado plot showing the sensitive parameters for the 90th percentile NPV of the grinding mill 57
5.21 Estimated load profile of a rural health clinic . . . . . . . . . . . . . . . . . . . . . . . . . 60
5.22 HOMER inputs for the clinic . . . . . . . . . . . . . . . . . . . . . . . . . . . . . . . . . 61
5.23 HOMER simulations showing Battery SoC throughout the year . . . . . . . . . . . . . . . 61
5.24 Proposed cash flow for social instituion based projects . . . . . . . . . . . . . . . . . . . 62
5.25 Sample financial cash flow structure . . . . . . . . . . . . . . . . . . . . . . . . . . . . . 62
5.26 Histogram plot fro NPV . . . . . . . . . . . . . . . . . . . . . . . . . . . . . . . . . . . . 63
5.27 Tornado plot showing the sensitivity of the 90th percentile of NPV . . . . . . . . . . . . . 64
x
Page 13
LIST OF SYMBOLS
A Ampere
g Gram
I Current
km Kilometer
kWh/m2/day Kilowatt hours per sqaure meters per day (Solar Insolation)
kW Kilowatt (unit of power)
kWh International Energy Agency
kWp Kilowatt of peak rated solar capacity
R Resistance
l Liters
L Length
m2 Square meters
m3 Square Cube
Vd Voltage Drop
V Volts
Wh/kg Watthour per kg (Energy Density)
$/kg USD per kilogram
xi
Page 14
LIST OF FIGURES
$/month USD per month
xii
Page 15
GLOSSARY
AC Alternating Current
BoS Balance of Systems
BTS Base Transceiver System
BoP Bottom of Pyramid
CDM Clean DEveloment Mechanism
CFL Compact Fluroscent Light
DC Direct Current
GSMA Global System for Mobile Association
HH’s Households
IEA International Energy Agency
IRR Internal Rate of Return
LCOE Levelized Cost of Energy
LED Light Emitting Diodes
MPPT Maximum Power Point Tracking
MPF Minigrid Pooling Fund
O&M Operation and Maintenance
PV Photovoltaic
xiii
Page 16
LIST OF FIGURES
PPA Power Purchase Agreement
PPP Public Private Partnership
SL Solar Lantern
SOC State of Charge
SSMP Sustainable Solar Market Package
SSHS Small Solar Home System
TPES Total Primary Energy Suppl
VRLA Valve Regulated Lead Acid
UN United Nations
USD United State Dollars
xiv
Page 17
CH
AP
TE
R
1INTRODUCTION
T here are 1.3 billion people without access to electricity in the world [1]. In addition to this,
a vast majority of the ‘electrified’ population are subjected to chronic blackouts and brownouts
due to ageing infrastructure and lack of supply [2]. Furthermore, many electricity utilities in
South Asia and sub-Saharan Africa, where majority of the un-electrified population reside, report huge
financial losses [3] which curtail their ability to further invest in grid expansion projects or its reform. In
some isolated remote areas, grid expansion could also be extremely costly and inefficient [4]. In such
situations, using decentralised renewable off-grid generation has emerged as a viable alternative to grid
extension [5] [3].
IEA estimates in their scenario of universal electricity access by 2030 that, 60% of house-
holds gaining electricity access will do so via decentralised mini/ off-grid solutions – primarily relying
on solar[6]. But despite this tremendous potential, most reports claim that a replicable business model
has not been found which would help companies leverage economies of scale and enable a rapid roll-out
of solar mini grids [7]. Even the IEA has conceded that, under their business as usual scenario, without
any ‘vigorous action’, 1 billion people will still be without access to energy by 2030 [1]. The vigorous
action could come in the form of increasing the level of investments, drafting policies that encourage
sustainable technologies, and off grid innovation that help rapid scaling up of off grid technologies [5]
[1] [8].
1
Page 18
CHAPTER 1. INTRODUCTION
A closer look into the telecom industry in Africa suggests that if a profitable model is
identified, and revenue streams are clear, private investors realising the commercial opportunity could be
roped in and the required level of investment could easily be met [9]. In the last 10 years the percentage
of mobile users increased from 16% to 50% in sub Saharan Africa and South Asia, where telecom
operators have invested over $45 billion to increase capacity and extend the coverage [10].
To replicate similar success in rural electrification with minigrids could be much difficult
especially because the technology is different altogether. But, there are definitely some parallels that can
be drawn from the way the mobile networks managed to achieve the level of penetration they did, in
such a short period of time. There are multiple reasons to why the mobile phone technology achieved
this massive success. The primary reason has to deal with the advent of wireless technology which
helped them ‘leapfrog’ the wire based technology and minimize the installation cost drastically [11]. But,
another interesting reason is that they are modular and operators know exactly the costs associated with
each individual BTS unit(telecom towers) and the minimum subscribers or traffic required to recover
those costs [8].
To lure these private investments, having a replicable and scalable business model becomes
crucial. But, there are significant barriers to developing such replicable business models with microgrids.
The primary reason stems from the current model of mini grid electrification itself, which involves
customising the design to each village [12]. Since the economy in the village, availability of resource,
the population, the density, the income levels of all the villages are different from one another, each
design is dissimilar to the other i.e. one size does not fill all [13]. With that being the case, it is hard
to scale up this technology as the transaction costs involved with project development are too high for
private developers [14]. On top of this, the return of investment is not very attractive and the risk profile
varies with each project, which requires significant due diligence on the part of the investor, which again
takes a lot of time and is expensive. The need to move on from these ’one off’ projects and to deliver
replication models becomes essential if the Sustainable Energy For All(SE4ALL) targets are to be met.
The second reason as most of the academic research and reports from International orga-
nizations have highlighted is that, the cost of solar mini-grids are too high and are acting as a major
barrier to rapid scaling up [7] with a recent study conducted by the Lawrence Berkeley National lab,
California claiming the need to bring down the cost of installation of mini-grids by 60-90% to have a
viable business case and make tariffs affordable for the poor [15].
2
Page 19
Unlike other ‘small’ mediums of electrification such as a solar lantern or a small solar home
system (SSHS), minigrids also allows for the use of productive end use services. The socio-economic
value brought by the use of such services can actually be substantial. Some studies in Philippines and
Bangladesh have quantified the benefits of productive end use based businesses at around $75/household
[16]. If this benefit were to be monetized and there was tangible revenue to be made with these businesses,
there might be an opportunity to overcome this affordability barrier even at current costs. Not much
research has actually gone on to focus on these aspects.
Besides the initial capital cost and access to finance [5] some of the other problems regarding
the highly fragmented supply chain [15] and support structure [17] have also been well documented.
However, there seems to be a lack of information in the mini grid community regarding what are the
most important parameters, especially regarding the ideal project size, the capital structure that makes a
project financially viable. This information might help project developers and investors understand the
structure of the mini grids better and help facilitate the scaling up process.
So to facilitate this understanding of scaling up solar microgrids, a design of standard
modular systems around productive end use equipment is proposed whose socio-economic value to the
community could be quantified that can transcend the affordability barrier. Utility in a box is an attempt
to look at a minimal unit of a microgrid size required to power the component and identify dimensions
we need to fine tune to make the unit financially viable. From a macro perspective, such a box would
enable the developers to use standardised equipment to drive down cost and help them choose the right
exploitation path based on their environment, which would also help the rapid scaling up process. Now,
this is by no means to suggest that, the ‘Utility in a box’ would work in all conditions under different
policy environment. But, this will give the practitioners an idea of what crucial consideration a design of
a micro/mini grid entails.
3
Page 20
CHAPTER 1. INTRODUCTION
1.1 Aims and Objectives
• To understand the barriers facing private investment led off grid solar electrification projects in
rural areas.
• To understand the problems of scalability and future growth for an off grid electrification business
model.
• To develop a ‘standard product/template’ for off-grid rural electrification.
• To understand the regulatory, financial and institutional framework under which such a standard
product is economically viable.
• To further the understanding of productive end use services in microgrid design.
• To give practitioners a better understanding of areas where innovation is required
1.2 Reporting approach and structure
The report starts by outlining the ‘utility in a box’ model and thus explain the rationale behind undertaking
this project. It will then cover the current trends and topic of discussions in the field in both the academia
and amongst the practitioners, while also looking into some of the more successful business models. Then,
an attempt will be made at designing three ‘boxes’, or standardised design for off grid electrification
based around basic services, revenue generating services and public institutions. The crucial and the
most sensitive parameters affecting the design will then be identified and finally, ways to minimize the
risk arising from these sensitive parameters will be proposed. To keep the scope of research within
reasonable bounds, the focus of the designs were based around India. The research for this project was
conducted through three different means.
• Thorough study of published papers resulting from prior studies on related subjects.
• Collecting and analysing the data collected from previous studies and literature review.
• Simulating the data through software such as HOMER and EXCEL and Modelrisk.
4
Page 21
1.3. INTRODUCING THE “UTILITY IN A BOX” APPROACH
1.3 Introducing the “Utility in a box” approach
In this study we look at the possibility of developing a ‘utility-in-a-box’ approach to off-grid electrifica-
tion which includes all the key components of decentralized off-grid system (generation, storage, grid
management). The utility-in-a-box model attempts to design a mini grid around a set of basic services
and tries to identify the demographic, economic and regulatory environment in which the model is
financially viable. The services could be as basic as a water pump, a rice mill or a cold storage. Given
the varied range of services, different livelihoods, institutional environments and access to credit, all
aspects of the design cannot be included within the ‘box’ but we will make an attempt to define aspects
which would still have to be customised for locations. However, using such a utility-in-a-box approach
has the following advantages:
• Certainty of demand
A mini grid that caters to only the residential demand suffers from a demand-production mismatch,
meaning - the solar production is mainly during the daytime while the majority of the residential
demand is mostly during the evening. This requires the batteries, which can make up 30-50% of
the total project cost, to be over-sized causing the cost of installation to go up. Introducing an
appliance with a larger load (productive-end use load) allows for some demand side management.
By adjusting the usage hours of the equipment, and reducing excess energy supply, the capacity
factor of the system could be improved.
• Standardised Equipment
The process of integration of various components in a mini grid itself is also very challenging with
a range of equipment with different quality and ranges available. Standardising the components
and sizes will simplify the installation process, ensure a certain level of quality, and also help
drive down costs. It will also facilitate ongoing operation and maintenance.
• Tariffs based on services rather than Levelized costs of Energy (LCOE)
Another advantage of having productive end use equipment as an ‘anchor’ (equipment that
consumes a significant proportion of the energy in a microgrid) is that it creates significant social
value to a community and helps generate revenue. If the tariff around such a microgrid were to
be based on this value of the service rather than the LCOE, there might be a way to increase
5
Page 22
CHAPTER 1. INTRODUCTION
the willingness to pay among the customers and generate significant revenue to make off grid
electrification projects profitable.
• Reduced transaction costs for project developers
There are many factors affecting the profitability of a microgrid design. Since the current method
of design involves customisation of the model around every village or a hamlet, the range of factors
and their level of impact varies with every project. If a design is standardised, and the factors
affecting the profitability and the risks are well defined, it would help developers understand the
crucial considerations that affect the profitability the most and tailor solutions to address those
issues. Especially the issues surrounding, minimum number of customers required to make a
project viable, proportion of anchor load to the residential load, the optimum combination of
debt-equity required or the level of assistance required to make a project profitable.
6
Page 23
CH
AP
TE
R
2BACKGROUND AND LITERATURE REVIEW
2.1 Energy Access Today
The relationship between energy access and growth in human development index has long been estab-
lished and well documented [18]. Access to energy is inherently linked with better healthcare, education,
civic participation and overall quality of life. This prompted the United Nations to form the Sustainable
Energy for All initiative in 2011, with the initial objective of achieving universal access to modern
energy by 2030. The secondary objectives were doubling the renewable energy share in the global energy
mix and doubling the rate of improvement in energy efficiency [19].
But, if the current path of rural electrification is to be continued then the targets will be missed by
a long distance and almost 1 billion people will be without access to electricity in 2030. This is because
the majority of the new connections will be offset by the increase in population in the region [1].
7
Page 24
CHAPTER 2. BACKGROUND AND LITERATURE REVIEW
FIGURE 2.1. Number of people without access to electricity by region in the new policyscenario (million) [1].
Further as the population increases, the demand for energy is only expected to increase will
not only increase in the rural areas but also in the urban developed area, where increasing economic
development will give rise to numerous opportunities which in most cases requires additional energy.
Without access to modern energy services, people generally resort to using kerosene and diesel generators
for electricity. These carbon based fuels are non-renewable and also emit fumes, which causes millions
of deaths every year [18]. On top this, these substitutes can be quite expensive when compared to grid
based electricity [15].
The challenge of providing access to these people have been further exacerbated by the climate
change debate, which comes at a wrong time for the developing countries. The consequences of the
developing countries following in the path of their more developed counterparts by using coal, gas and
other forms of fossil fuel based energy have been well documented by the IPCC report [20]. The main
challenge is in providing access in an affordable and sustainable way.
2.2 Providing access to sustainable energy solutions
The World Energy Council (WEC) has defined energy sustainability in the context of “energy trilemma”.
The three core dimensions of energy trilemma includes ensuring security of energy, providing affordable
energy i.e. energy equity while having minimal impact in the environment i.e. environmental sustain-
8
Page 25
2.2. PROVIDING ACCESS TO SUSTAINABLE ENERGY SOLUTIONS
ability. The countries in the Sub-Saharan region and South Asia, where majority of the people without
access to energy reside, rank poorly in all three dimensions [9]. They is mostly because they suffer from
lack of reliability of supply, high prices and insufficient generation.
2.2.1 Energy Security
Most of these countries are energy poor strictly speaking from the availability of fossil fuel perspective
[21]. In most of these countries, population growth outstrips the pace of electrification and the rate of
electrification is actually declining in some of them. To fuel the growing demand, expensive imported
diesel generators are used – the total cost of which can sometimes exceed 5% of the total annual budget
of a country [22].
The Total Primary Energy Supply (TPES) graph of all these countries also shows a strikingly
similar statistic, with bio-mass based fuel source being the primary source of energy [1]. Similarly
hydropower, despite being largely untapped in both Sub-Saharan region and the South Asia, has achieved
high level of penetration in the electricity balance of most of these countries. But, with the looming
threat posed by the climate change, with frequent droughts and floods, hydropower and biomass cannot
be relied upon for too long to meet the energy needs. This was evidenced in Kenya in 2000, when a
severe drought halved the total energy extracted from hydropower, causing a massive energy crisis.
As the economy of these countries grows, they face a massive challenge in securing energy
supply to -fuel the growth. Diversifying the energy mix of these countries by including other sources of
energy and exploiting massive solar potential might be key in ensuring the security of supply in these
regions.
2.2.2 Energy Equity
The energy costs in Sub-Saharan Africa are prohibitively high when compared with the developed
countries and the rest of the world. It is true in both urban and rural areas. In urban areas, it is estimated
that the use of expensive diesel to run generators adds around 10% to the cost of any manufactured good
[23]. The situation is much worse in rural areas, where the costs of relying on kerosene as the source of
energy can be a 1000 times more expensive than a Compact Fluorescent Light (CFL) [15].
The archaic transmission and distribution systems and resulting losses also contributes in driving
9
Page 26
CHAPTER 2. BACKGROUND AND LITERATURE REVIEW
FIGURE 2.2. Comparing costs for comparable lighting between kersosne and modern formsof lighting [15]
the costs up [24]. When cheaper fossil fuel based energy sources are introduced into the energy mix, the
electricity market is regulated and energy efficiency measures are introduced, the cost of grid electricity
will see a slight decrease as was observed in India and Kenya and a few other developing countries [25].
But, the people in the rural areas that are not connected to the grid will not benefit from these changes as
the cost reduction are not directly passed on to them. People without grid access will continue to pay a
significant proportion of their incomes on purchasing kerosene and other expensive sources of energy.
2.2.3 Environmental Sustainability
Historically, there have been suggestions that a developing nation might have to choose between
achieving energy access and reducing greenhouse gas emissions. The recently published ‘World energy
investment outlook’ [6] also suggests that majority of the investment in these energy poor countries will
indeed be dedicated to coal based power plants [6]. These plants will add significantly to the generating
capacity but managing CO2 emissions from these burgeoning economies will also then become a major
challenge.
10
Page 27
2.2. PROVIDING ACCESS TO SUSTAINABLE ENERGY SOLUTIONS
The countries in the sub Saharan region and the Indian subcontinent currently inhabit 35% of
the world’s population but emit less than 15% of total CO2 emissions [1], with the emissions per capita
well below the global average. But, as the energy access in the region gradually increases, the number is
expected to rise significantly 2050.
To achieve the tremendous economic growth and achieve this human development progress,
some increase in carbon emission is to be expected. But, by following the development path of the
western countries and investing in centralized transmission, the policy makers in the developing nations
need to be wary of getting ‘locked-in’ [26]. ‘Carbon lock in’-has been termed as a state which many
industrialized economies find themselves in. In this state, the countries find themselves relying mostly on
fossil fuel based services which hampers their ability to switch to low carbon based technologies in the
future, despite their many advantages. This is mostly known to occur ‘through a process of technological
and institutional co-evolution driven by path-dependent increasing returns to scale’.
There is ample evidence in the field that mere shifting away from kerosene to modern energy
sources also has grave climate change implications [27] and it is not an either-or proposition. The costs
of renewable energy is high in developed countries, which is not the case for developing countries and
coal is cheaper and easier, but the external costs associated with it have not been accounted for [28] .
The energy trilemma is both a challenge and an opportunity for the countries in this region.
Providing access to clean and affordable energy has emerged as a major challenge. The major challenges
include managing the ageing infrastructure, while reducing non-technical losses and congestion losses
[24] , which forces a lot of utility companies to bear significant financial losses. Implementing these
reforms while overcoming the political driven regulations and a completely non-transparent bureaucratic
apparatus will require some doing.
This also presents an opportunity to leapfrog into a low carbon based, more sustainable energy
solution with renewable energy technologies. They will help diversify the energy mix, ensuring security
of energy supply and reduce dependency on foreign imports. Even the cost of renewable energy
technologies is cheaper for people without access to energy, which is opposite the case in developed
countries.
11
Page 28
CHAPTER 2. BACKGROUND AND LITERATURE REVIEW
2.3 Grid Extension vs. Decentralized generation
Historically, increasing energy access has generally been achieved through a centralized system of
generation, transmission and distribution. This method of distribution was developed over the years by
distributing huge capital costs over large number of customers living in a densely populated region and
consuming a large amount of energy [29]. But, in most rural areas, the population is sparsely distributed
and the demand is quite insignificant. In these cases, grid expansion could be extremely costly and also
highly inefficient [4].
Despite these inefficiencies, energy access was mostly being pursued through grid extension only
up until the recent past, mostly because of “combination of regulations, historical path dependence and
deep-seated norms” [29]. The notion that the only way for these countries to emerge out of their poverty,
by following in the footsteps of western and other developed nations through centralized transmission is
not true at all [30]. The developing countries have not yet made commitments to invest in infrastructures
that push them towards the state of lock in. While, decentralized energy generation specifically through
renewable energy technologies will help them create jobs, introduce innovations and be self-sustained
[31]. This concept that developing nations could bypass the state that the developing countries found
themselves in by focusing on decentralized generation technologies is termed as ‘leapfrogging’. This
has been observed already via the tremendous penetration of the mobile phone technology in Africa and
Asia, which would have been impossible to achieve with the conventional wire-based telephones [32].
Hence, the recent policy in increasing energy access in developing nations has seen in increased
in focus towards decentralized energy generation [33]. Decentralized generation, as defined by a recent
paper published by the World Bank group, is “a bottom up approach in which grid electrification
occurs through the creation of isolated or connected minigrids operated by private, cooperative, or
community based organizations” and now appears as an important rural electrification strategy across
most developing nations.
Despite the inherent advantages of distributed generation in improving energy access, the
diffusion still remains low. To develop the understanding of why that is the case, especially in terms of
solar microgrids is the fundamental question that this research will try to answer.
12
Page 29
2.4. MICRO/MINI GRIDS VS CONSUMER PRODUCT
2.4 Micro/Mini grids vs Consumer product
Distributed generation can further be classified into micro/mini grids or consumer based products.
‘Mini-grid’ refers to small power plants, with sizes ranging from 1kW – 100kW, which generate power
close to the distribution site and connect multiple households and businesses[34]. While consumer
products, which includes – Solar Lanterns (SL) and Small Solar Home Systems (SSHS) are products
for individual households which provides access to basic lighting services and in the case of SSHS, an
option to charge mobile phones. Small solar home systems (SHS) and solar lanterns have both emerged
as a dominant off-grid technology in tackling the energy poverty challenge for the remote bottom of the
pyramid (BoP) population in the last decade, with the falling solar prices and improving efficiency of
luminaries [35]. But, in the last few years, a few issues have developed with consumer product such as
SSHS and SL, where the ownership of the system remains with the customer.
Small solar home systems are technical equipment; the operation of which requires certain degree
of expertise. The components most prone to breaking such as the inverter (in case of AC systems) and
batteries are regularly overstressed with little or no maintenance [12]. In case of batteries, the warranty
provided by the supplier is conditional as they specify operating conditions such as the level of discharge,
number of cycles and operational temperatures. These conditions are rarely met during operation which
places no obligation on the suppliers to adhere to the terms and conditions of the warranty. The result is
that the batteries die out well before the warranty period.
The small solar home systems also require significant initial capital. The primary way with
which most policy makers and renewable energy professionals circumvent around this problem is to
disseminate these systems with the help of capital subsidies. While, some of these programs have indeed
reported a big success [36], the problem of O&M have not been as well documented. The components
like the batteries or inverters are rarely replaced in case of malfunction because of misuse. Even in
cases where the components function satisfactorily throughout their design life, capital subsidies are not
awarded for replacement. In absence of subsidies for replacement, most people are inclined to revert
back to using kerosene or battery based torchlights.
As rural communities climb up the energy ladder and demand more energy for productive-end-
use and community services, mini-grid technology has in certain contexts emerged as a more economical
solution when compared to grid extension or such commercial products and stand-alone systems [15]
13
Page 30
CHAPTER 2. BACKGROUND AND LITERATURE REVIEW
[37] [4]. With the utility model, the ownnership of the equipment stays with trained professionals which
ensures an optimum functioning of the system. While hydropower based mini grids have been around
for a while in certain countries (Practical Action, 2014), solar energy based mini-grids now form 80%
of the market. This is primarily due to the significant advantages it provides in terms of the ease of
diffusion, modularity and sharply declining costs (Bulusar, et al., 2014). Hence, the proceeding chapters
will look at how such advantages of solar energy based minigrids can be exploited to design modular
microgrids which could be scaled up for faster implementation, while providing a medium to enhance
their livelihoods by the use of productive end use components.
2.5 Financial barrier and the role of private sector
The International Energy Agency [1] has estimated in its new policy scenario that about $14 billion will
be spent on energy access each year until 2030. But, despite that level of investment about 1 billion
people will still be without electricity in the year 2030 [4]. The same study claims that for universal
access to energy the investment in the off grid sector need to be raised to $ 48 billion. Bhattacharya
[38] in his paper ‘Financing Access’ claims that the annual spend of multilateral development banks
are a long way short of the required investment; the budget-constrained developing countries are not
in a financial state to make such investments and the Carbon Development Mechanism (CDM) is very
uncertain post 2012. The paper further calls for a ‘radical shift’ in funding priorities and mechanisms’
and expects the ‘private sector to play an important role’.
Driven by private sectors, the world has already seen an ‘impressive growth’ in the commercial
mobile market, which was not anticipated by the business communities or academia [11]. In the last
six years, the operators have invested over $45 billion to increase capacity and extend the coverage in
sub-Saharan Africa alone [10].
But, a systematic review of literature by [39], on barriers of increased access to energy services
for the poorest people provides finds that, very few literature exists that studies the role of private
developers in rural electrification. Most papers have been written with the aim of fulfilling development
cooperation objectives and end up assessing interventions related to subsidy delivery/grant/assistance.
Subsidies, grants, concessions and low interest loans have been driving rural electrification
efforts in many parts of the world for a long period of time. There have been many success stories in
14
Page 31
2.6. SCALING UP MICROGRIDS
Tunisia, Costa Rica, Thailand and Bangladesh [40] [36]. But, in many cases subsidy based delivery
models cause more harm and if not designed well, they can distort the local market significantly [41]
[42]. In fact, a recent study by [17] found that subsidy delivery models engenders low sense of ownership
and ‘beneficiary ownership play a vital role in the performance and sustainability of PV Programs’ in
rural India.
The development of a strong private sector is crucial for an efficient energy sector [34] [43]
[44]. But, in the case of mini grids most reports claim that most companies find it difficult to develop
a replicable business model that would help them leverage the economies of scale [29] [7]. It is very
difficult to substantiate this claim as there are very limited reports and literature available from the
point-of-view of a private project developer in defining different stages of project development or in
defining the critical success factors. But, recently a paper published by the Climate Group [34] titled
‘The Business Case for Off Grid Energy in India’ has shed some light on the profitability of off grid
market and the growth potential. It claims that companies serving the needs of businesses show potential
for profitability. They expect this market to grow at the rate of 60-70% annually and reach almost a
million people by 2018.
2.6 Scaling up Microgrids
Despite this great potential for market growth, the fact remains that a scalable model for replication has
not been found. The fundamental issue lies in the process of mini grid design itself. Minigrids have to be
designed for different levels of access and cater to people from different socio-economic backgrounds
[45] . Almost all minigrid design manuals propose that conducting a thorough site visit, consulting the
local stakeholders and considering all the political and social aspects can only ensure the long term
sustainability of a project [13].
But, there is very little mention in these papers of the project development and other overhead
costs or a timeline of project implementation with this approach, which would be critical for a private
developer. The ‘long due diligence process, long project development and implementation phases/costs’,
are exactly the issues that have been raised as major barriers for scaling up of projects by private
developers [14] . Now, the three major transaction costs that a private developer has to incur in developing
a project has been identified [46] as Identification costs-which includes all expenses in identifying a
15
Page 32
CHAPTER 2. BACKGROUND AND LITERATURE REVIEW
potential site; evaluation costs (drafting legal documentation/PPA document, identifying right partners
on the ground) and platform costs (setting up the right corporate structure) which could be as much as
$75,000 for a project [47].
Hence to access commercial project financing, and justify these transaction costs developers
must demonstrate scale (in terms of system size) as well as sustainability (adequate cash flow with
acceptable and quantified risks) [46]. An idea of Minigrid Pooling Fund (MPF) has also been suggested
as a possible solution to achieve this scale through project and capital pooling, whereby large number of
projects with similar profile are aggregated into a portfolio, thus ‘diversifying risk and increasing capital
requirements’.
In rural areas, just providing electricity for household energy requirements makes it hard to
achieve scale. For this, either one has to include local businesses with productive end use of electricity
(e.g. rice mills, dairy, water pumping, clinics) [48], or serve a large number of households within a
relatively small geographic area, and more importantly, deploy a massively large number of projects
with similar profile.
Now, in order to achieve this, it becomes important to standardize designs and have better defined
risk profiles for each project [49], which would enable project development to be more streamlined with
more tools, templates, and best practices adoption, and also enable investors to better understand and
quantify the project risks [46].
From the point of view of project developers if a broad definition of what makes a project
profitable is defined, aspects of microgrid design is standardized and the most sensitive parameters
affecting a project are identified, they could circumvent around the normal project development cycle
and avoid having to incur significant project identification and platform costs [14]. This could thus help
them aggregate the projects in a much larger pool which will serve to attract previously unavailable
capital, better leverage philanthropic investment and bring about lower technology costs.
16
Page 33
2.7. MICROGRID DESIGN IN THE ACADEMIC LITERATURE
2.7 Microgrid design in the academic literature
The academic literature on mini grid design have mainly focused on the techno-economic analysis of
the micro-grids using the simulation software HOMER [50] [51] [52] [53]. But, most design studies are
country specific eg-[50],[53] or present a comparison between different technological options eg- [54].
Such comparisons are in most cases greatly determined by the availability of the resource or the local
policy and conditions. Some have made economic feasibility analysis between grid extension and mini
grid deployment [55] [31] and based on the distance from the nearest point of extension, topography
and scale of deployment. They have pre-defined population sizes, population density, willingness to pay,
which sometimes, are gathered via an exhaustive survey [56]. Some [57] [58] have analysed the policy
implications of a governmental intervention or provided policy recommendations to support the future
course of development of renewable energy based rural electrification.
While all the papers are insightful and provide great understanding on the subject, they mostly
involve unique study cases focusing mostly on a particular aspect of mini grid design and hence cannot
be considered as strong examples from which lessons on scalability and replicability of a business
model could be drawn. A research with a more interdisciplinary focus on technical design, financial
feasibility and institutional structure is more likely to come up with a ‘replicable business model for
off-grid electrification’ [29].
A paper by [59] has made an attempt at designing ‘a generic business model checklist’ for
practitioners using a ‘user-centric’ approach, which is an attempt to move away from the technological
and institutional based research of microgrids. While, they do provide a great review of research based
around the technology or the institutional aspects, they have also highlighted the need to place a user
and their needs at the center of a business model and have identified affordability, access to finance,
reliability of supply, and the need to engage local communities as important factors affecting the uptake
of renewable energy based minigrids.
A recent paper by Bhattacharya (2014) [38] has also attempted to conduct a multifocal study by
identifying the optimum size of a microgrid for alternative demand scenarios and proceeding to identify
‘business issues such as tariff, cost recovery, funding and regulatory governance’ that make the project
viable. The paper classifies four demand scenarios into Basic, Basic+, Reliable and Unconstrained, based
on increasing levels of demand. The Basic scenario considers basic supply of few lights and a mobile
17
Page 34
CHAPTER 2. BACKGROUND AND LITERATURE REVIEW
charging service whereas the unconstrained scenario assumes ‘full-fledged supply’ with provisions
for productive end use services. However, not much information has been provided as to what those
productive end use services are. Still, the report provides a great indication of how demand-supply
conditions affect the feasibility of the system as it concludes that the ‘basic electricity supply provision
is the most preferable solution’ to scaling up as it results in ‘moderate monthly bills for consumers, less
capital and less subsidy volume’.
This model of providing basic services has also been field tested in various villages in Uttar
Pradesh and a report published by the Technology and Research Institute (TERI) claims a break even
of 1-2 years for such projects. [60]. While, the model is great at providing people with basic access to
energy such as lights and mobile charging, there is substantial research which points to the fact that,
access to productive end use services through energy is what brings about a real change in people’s lives
and helps solve the wider development objectives [61] [18]. The ‘less capital’ aspect of the design also
means that a large number of projects need to be identified to establish a portfolio of sufficient scale.
However, in the recent past, some of the reports published by some of the International agencies
such as the IFC [7] and WEC [9], which claim that the model that hold the most potential for scaling
up is the anchor model, where a large power consuming source acts as a central power (or the anchor)
consumer that consumes the bulk of the generated power. The project developer then enters on a long
term power purchase contract with the anchor client, which ensures the long term viability of the project
[7] [44]. The people without access to energy, who are inhabiting areas close to the anchor also get
electrified in this process through excess energy. The income generated by electrifying these households
determine the financial profitability of these projects [62]. Another report [56], in a similar vein, calls for
operators to tackle large loads as a way to recover the significant fixed costs invested in such projects and
make use of the advantage that mini grids offer of being able to power productive end use components.
However, there are not many studies that provide an in depth study of the factors affecting the viability
of such project and how such projects can be designed with minimal cost for the private developer i.e.
easily replicable and scalable.
18
Page 35
2.8. FACTORS AFFECTING THE COMMERCIAL VIABILITY OF THE DESIGN
2.8 Factors affecting the commercial viability of the design
Following up on previous work on microgrid design, an attempt to identify the most crucial factors
identified as being important in a microgrid design that determine the profitability of a project has been
has been made in this section. These factors directly affect the commercial viability of the project and
the objective of this dissertation to dissect these factors and understand the effect they have on the
commercial viability of the project. They are mainly the availability of a commercial load [7], number of
customers/population density [63], tariff [64] and the project term [61] [37]. Some of the commercially
viable factors that directly affect the viability have been discussed below:
Anchor Loads: A report prepared by the World Economic Forum [44], identifies the anchor
load based model as the ‘primary market’ for rural electrification, which could provide ‘a scalable and
replicable base for business models for country-wide and global impact’. But their argument like many
others,(also presented earlier) mainly discuss the advantages of the model. Their assertions are not based
at all on practical evidence and provide little information on how large the size of the anchor loads could
be relative to the residential village loads.
Another report prepared by the United States Trade and Development agency, [56] prepared
for Azure power, a microgrid company based in India, concludes that one of the key factors affecting
scalability is having ‘an anchor load or a village size that is on the larger side’. The reasoning behind the
recommendation is that, having a large anchor load allows the sale of a significant amount of energy as
the ‘fixed costs of a microgrid are quite substantial’. It however does not add any further information
on what the exact size of the village (its population density) should be or the proportion of energy
required by the anchor to the proportion of energy consumed by the villages that would make a microgrid
profitable.
Some papers also support the possibility of designing a microgrid around a social or a govern-
mental institution such as a school or a health clinic [7]. Designing a microgrid around such load centers
help the developers secure a long term power purchase contract, and help them build community based
operations around those load centers. Now each anchor load will have its own properties, usage hours
and costs. The loads have further been categorized and classified in following ways:
19
Page 36
CHAPTER 2. BACKGROUND AND LITERATURE REVIEW
• Basic Services – Although, this does not include any productive end use services i.e.‘anchor’ load,
a set of basic services (lighting and mobile charging) that help users avoid their existing kerosene
costs will help act as a baseline on top of which the effect of adding other anchor loads will be
studied.
• Public Service Institutions – Many off-grid communities already have social institutions such
as a rural health clinic or a school set-up. This offers an opportunity for developers to bundle a
group of projects where applications of public service institutions are combined with consumer
demand. This has already been successfully implemented in Philippines under the Sustainable
Solar Market Package (SSMP) [16] which was almost exclusively donor funded. The possibility of
these institutions acting as an anchor and the profitability of such a model will further be explored.
• Revenue Generating Services- The economy of a village usually revolves around a productive
end service. Saw mill, grinding mill and a chilling center are some of the most common revenue
generating end-use appliances in the developing countries [45] [65]. While it is true that designing
a microgrid around some of these revenue generating services does not guarantee an uptake of
energy [66], but the potential of overall socio-economic benefit that could be derived through such
services is quite significant [16]).
Number of customers: Having a significant number of customers is very important to have a
profitable business model [29] [7] [37] as it ensures high level of consumption. But more importantly,
the population density could massively affect the profitability of a model [63] as it limits the system
losses and the need to construct costly transmission lines. So, there is a need to balance between the
number of customers required in a microgrid and the costs incurred on transmission lines.
Tariff :The unelectrified population are clearly a heterogeneous bunch with different income
profiles, wants and needs. Setting the right tariff is very important in ensuring the long term sustainability
of the project.
Most people in the rural areas also have different cycles of earning. There are people who make
daily wage, some people earn weekly incomes, and some people have monthly incomes, whereas farmers
have seasonal income which are mostly dedicated to primary source of necessities such as food, clothing
or other basic necessities [37]. Tailoring payment plans and payment patterns by understanding these
20
Page 37
2.8. FACTORS AFFECTING THE COMMERCIAL VIABILITY OF THE DESIGN
income patterns is possible in case of utility operated microgrids. The tariff also needs to be adjusted for
the anchor client since they are central to the viability of the microgrid and hence have more leverage
[44].
Project Term: One of the principle risks for financing microgrids is the project term [13]. Since
the initial investment costs of a microgrid is quite substantial, the microgrid projects are designed for
longer term. If the grid arrives during the project term, people are inclined to switch to grid because of
grid electricity being much cheaper as compared to microgrids [12] [67]. Thus, possibilities to minimize
risks arising from grid extension will also be explored.
Even though the main focus of the study would be to dissect the above discussed commercially
viable factors. This would have to be achieved by defining a technical design, the operational model
and the regulatory environment under which this could be feasible. The technical design includes the
decisions regarding the components choices, trade-offs regarding the component quality vs price [68],
age old debate of using AC or DC design [69] and the issues of transmission [5]. Then there are some
operational models that will provide finance to energy consumers. Some of the models used by the
practitioners will be discussed and an appropriate model of dissemination discussed [70]. Finally, the
regulatory environment needed for large scale deployment of mini/micro grids will have to be defined to
assess how subsidies and philanthropic investment be successfully delivered in case of these projects
[42].
21
Page 39
CH
AP
TE
R
3ASSESSMENT OF EXISTING BUSINESS MODELS
T he traditional approach of minigrid design involves identifying a location and then adapting
the design to it [71]. While this approach helps benchmark a systematic approach in designing
a mini grid, the customization required to adapt a design to each site hampers the ability of
solar mini grids to scale rapidly.
Some of the off grid solar business models that have recently come up, seem to have identified a
model to suit the needs of a certain demography under certain constraints and are providing them with
fixed set of services without having to change/customize their design too much [72], which does not
inhibit their ability to scale.
It is clear from the reviewed academic literature that the design of these mini/micro grid requires
a multi-dimensional approach while considering a diverse set of factors. Almost all the papers reviewed
acknowledge that the design of a microgrid is a complex problem that needs to look into a whole range
of factors beyond the technical design [37] [13]. After reviewing these literatures, an attempt has been
made at classifying the aspects of mini grid design which might help shed some light on the challenges
to the standardization and scaling up of anchor-based minigrid design while evaluating key features that
made the microgrid models successful. It will also help act as a prelude to the subsequent chapters where
an attempt at understanding the crucial factors affecting the success of those minigrid design is made.
23
Page 40
CHAPTER 3. ASSESSMENT OF EXISTING BUSINESS MODELS
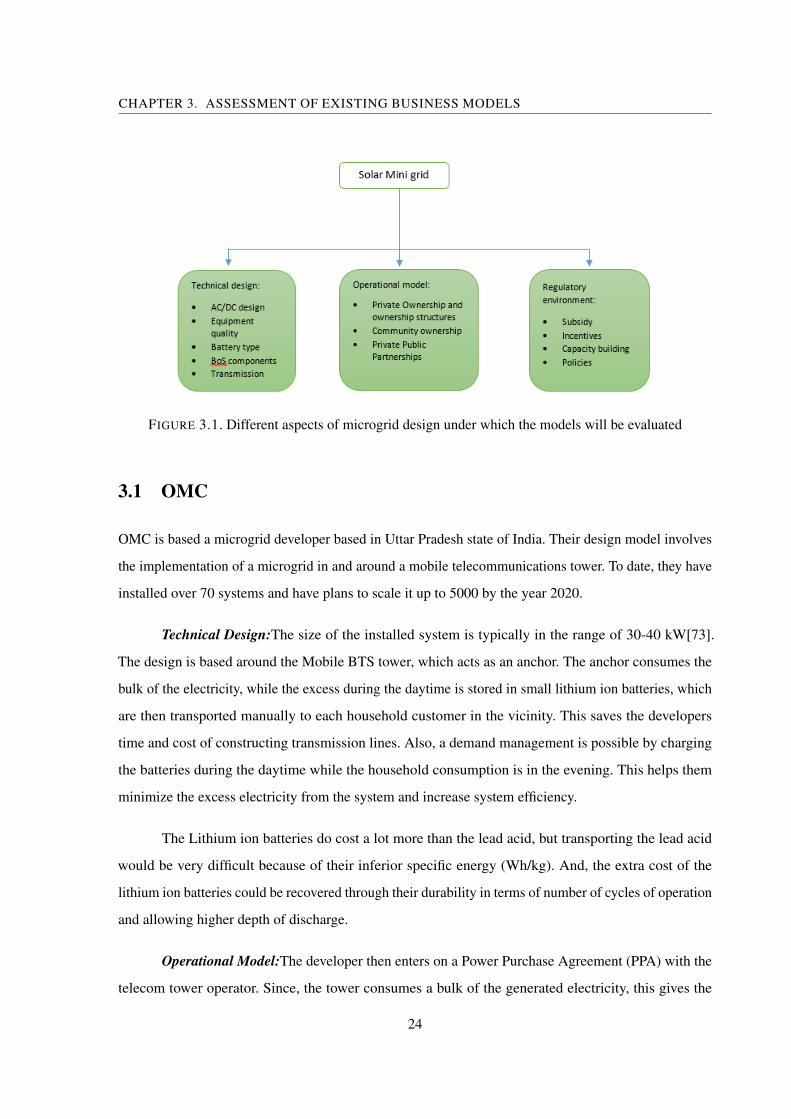
FIGURE 3.1. Different aspects of microgrid design under which the models will be evaluated
3.1 OMC
OMC is based a microgrid developer based in Uttar Pradesh state of India. Their design model involves
the implementation of a microgrid in and around a mobile telecommunications tower. To date, they have
installed over 70 systems and have plans to scale it up to 5000 by the year 2020.
Technical Design:The size of the installed system is typically in the range of 30-40 kW[73].
The design is based around the Mobile BTS tower, which acts as an anchor. The anchor consumes the
bulk of the electricity, while the excess during the daytime is stored in small lithium ion batteries, which
are then transported manually to each household customer in the vicinity. This saves the developers
time and cost of constructing transmission lines. Also, a demand management is possible by charging
the batteries during the daytime while the household consumption is in the evening. This helps them
minimize the excess electricity from the system and increase system efficiency.
The Lithium ion batteries do cost a lot more than the lead acid, but transporting the lead acid
would be very difficult because of their inferior specific energy (Wh/kg). And, the extra cost of the
lithium ion batteries could be recovered through their durability in terms of number of cycles of operation
and allowing higher depth of discharge.
Operational Model:The developer then enters on a Power Purchase Agreement (PPA) with the
telecom tower operator. Since, the tower consumes a bulk of the generated electricity, this gives the
24
Page 41
3.1. OMC
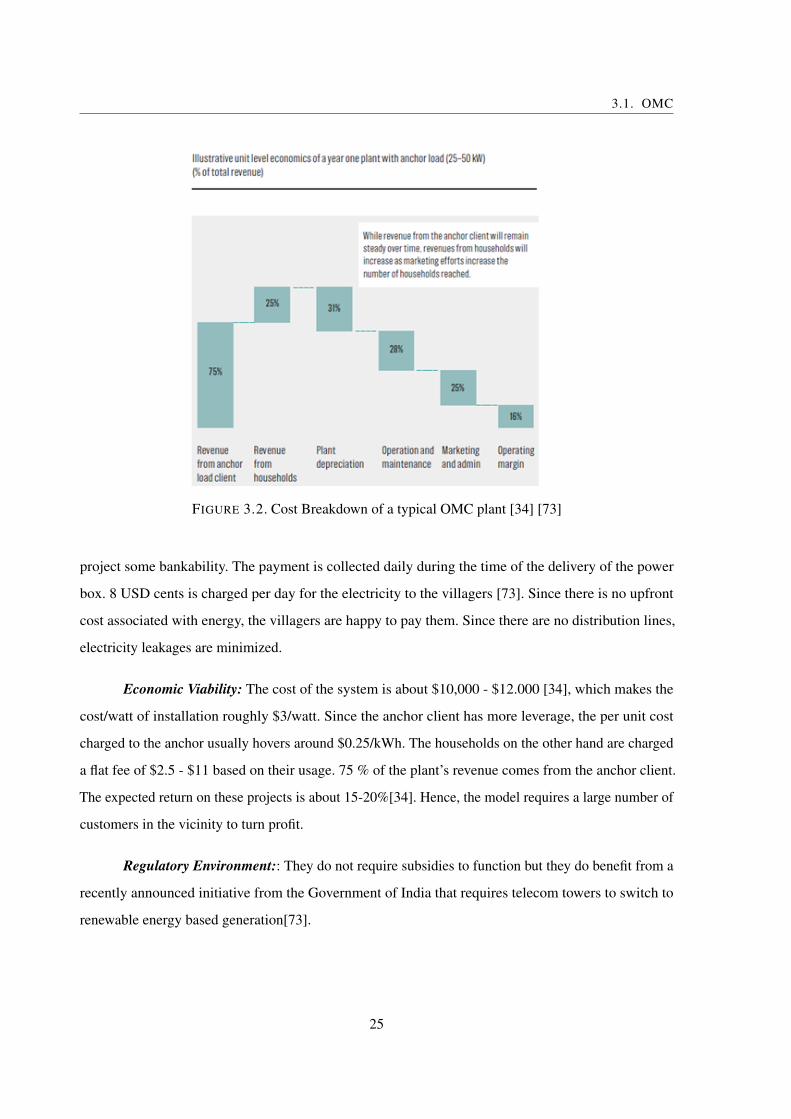
FIGURE 3.2. Cost Breakdown of a typical OMC plant [34] [73]
project some bankability. The payment is collected daily during the time of the delivery of the power
box. 8 USD cents is charged per day for the electricity to the villagers [73]. Since there is no upfront
cost associated with energy, the villagers are happy to pay them. Since there are no distribution lines,
electricity leakages are minimized.
Economic Viability: The cost of the system is about $10,000 - $12.000 [34], which makes the
cost/watt of installation roughly $3/watt. Since the anchor client has more leverage, the per unit cost
charged to the anchor usually hovers around $0.25/kWh. The households on the other hand are charged
a flat fee of $2.5 - $11 based on their usage. 75 % of the plant’s revenue comes from the anchor client.
The expected return on these projects is about 15-20%[34]. Hence, the model requires a large number of
customers in the vicinity to turn profit.
Regulatory Environment:: They do not require subsidies to function but they do benefit from a
recently announced initiative from the Government of India that requires telecom towers to switch to
renewable energy based generation[73].
25
Page 42
CHAPTER 3. ASSESSMENT OF EXISTING BUSINESS MODELS
3.2 Mera Gao Power
Mera Gao are a microgrid developer based in Uttar Pradesh in India. They were established in 2008
and since their establishment have provided power to over 100,000 individuals in around 1000 villages.
Their operation involves providing people with access to basic lighting.
Technical Design:The microgrid is a basic DC-microgrid which consists of a monocrystalline
solar panel, a PWM charge controller and a Lead-acid battery supplying power to LED lights and a
mobile charging point to each household in the vicinity. The limitation of the system is the transmission
length. Since, the source voltage is a DC and the voltage drop has to be within the acceptable limit, the
length of the transmission line cannot be very long. They do not use any meters to control the usage,
but they have no inverter in operation, hence no AC device can be operated at any time of day, which
can both work to their advantage and disadvantage. The advantage is that, the threat of electrificity
theft is nullified. The disadvantage is that most other electrical device would be incompatible with the
microgrid.
Economic Viability:The total installation cost of the systems is less than $1000. The low capital
requirement allows them to recover a nominal monthly flat fee of $2/month from a group of 30-40
houses[67]. Financial breakeven is reached within 3 years [34]. Since the monthly tariff for the customers
is less than their energy cost, a regular payment is ensured.
Operational Model:They operate with a Build Own Operate Maintain (BOOM) model whereby
the ownership of the microgrid stays with them throughout the operation period. The installation time is
very minimal and about 3 or 4 technicians can install the system in less than a day. The customers pay
for the electricity to the microgird operator without the incentive of owning the system at any point. Grid
extension is not possible as well. So, if a reliable grid connection arrives in the area, the microgrid would
become redundant. Their collection methods is pretty unique where an entire community is responsible
for raising monthly tariffs. If a single individual defaults on the payment, the entire community becomes
responsible for the repayment.
Regulatory Environment:They do not require subsidy as well. They did receive an initial support
from USAID of $300,000 initially to operate a few pilot projects but now have raised equity investment
of $1 million on their own [34].
26
Page 43
CH
AP
TE
R
4METHODOLOGY
T he project methodology is designed with an attempt to identify the dimensions of a minimal
unit providing energy services to people without access to electricity. The ways in which the
dimensions could be fine-tuned and the exploitation path that could be adopted towards scaling
up of such units has been explored. A pictorial description of the methodology has been provided below
followed by the description of the stages involved in the methodology.
4.1 Identifying a list of common sets of services
During the first step of the research, a list of possible ‘anchor’ loads in rural areas was selected.
The selection was primarily based on a literature review of past academic research and on past
projects attempted by various International Aid agencies around the world. The selection of
the anchor load will primarily be determined by the demand profile of the load along with the
frequency of use. An ideal anchor load will have a predictable demand profile and will have a
fixed operating hours, preferably during the daytime. This will help in matching the production
with the demand, which might lead to a more efficient use of the mini-grid. As described in the
literature review section earlier, the following classification of anchor loads were made, around
which the design of a microgrid was attempted. The categories of anchor loads are as follows:
27
Page 44
CHAPTER 4. METHODOLOGY
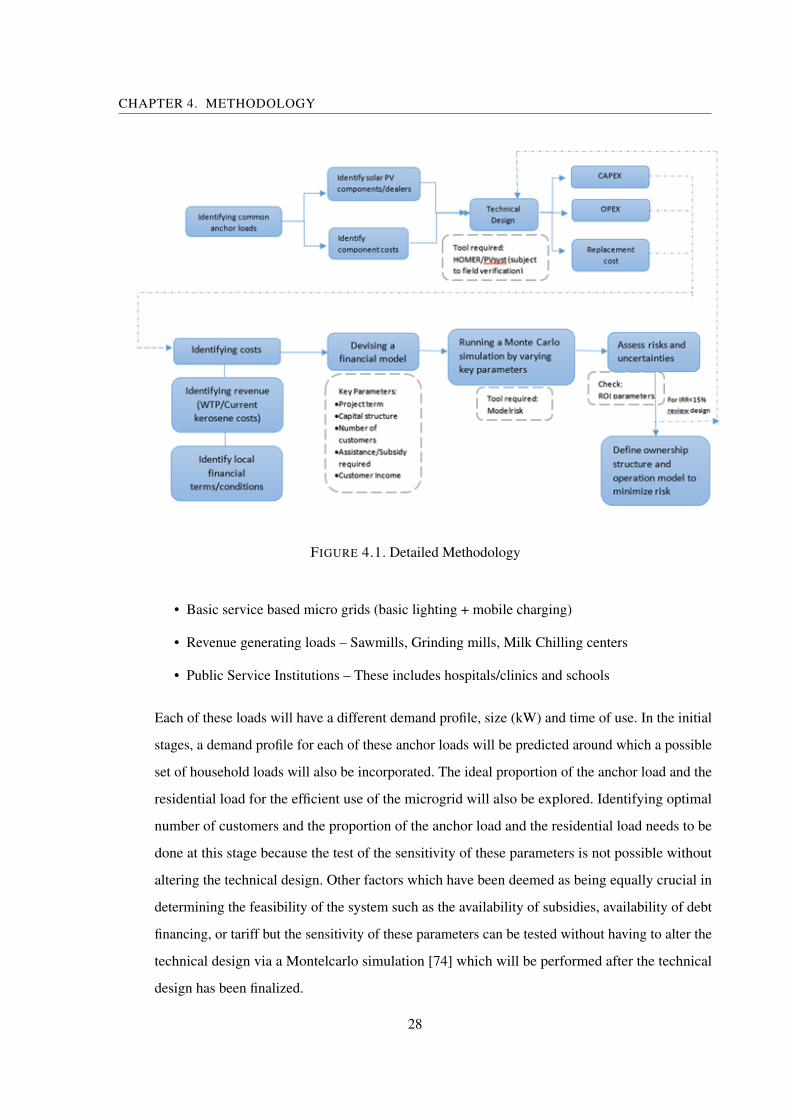
FIGURE 4.1. Detailed Methodology
• Basic service based micro grids (basic lighting + mobile charging)
• Revenue generating loads – Sawmills, Grinding mills, Milk Chilling centers
• Public Service Institutions – These includes hospitals/clinics and schools
Each of these loads will have a different demand profile, size (kW) and time of use. In the initial
stages, a demand profile for each of these anchor loads will be predicted around which a possible
set of household loads will also be incorporated. The ideal proportion of the anchor load and the
residential load for the efficient use of the microgrid will also be explored. Identifying optimal
number of customers and the proportion of the anchor load and the residential load needs to be
done at this stage because the test of the sensitivity of these parameters is not possible without
altering the technical design. Other factors which have been deemed as being equally crucial in
determining the feasibility of the system such as the availability of subsidies, availability of debt
financing, or tariff but the sensitivity of these parameters can be tested without having to alter the
technical design via a Montelcarlo simulation [74] which will be performed after the technical
design has been finalized.
28
Page 45
4.2. DEVELOPING A TECHNICAL DESIGN
4.2 Developing a technical design
The second step would involve identifying a list of available solar PV components and their
cost based on which a system would be designed. The designed system would provide sufficient
power to the ‘anchor’ load while excess power could be routed to the other houses in the villages.
Identifying the ‘excess power potential’ would be crucial, as it would help determine the number
of houses in the vicinity. The technical process has been described in a series of steps below.
4.2.1 Estimating Solar Resource Potential
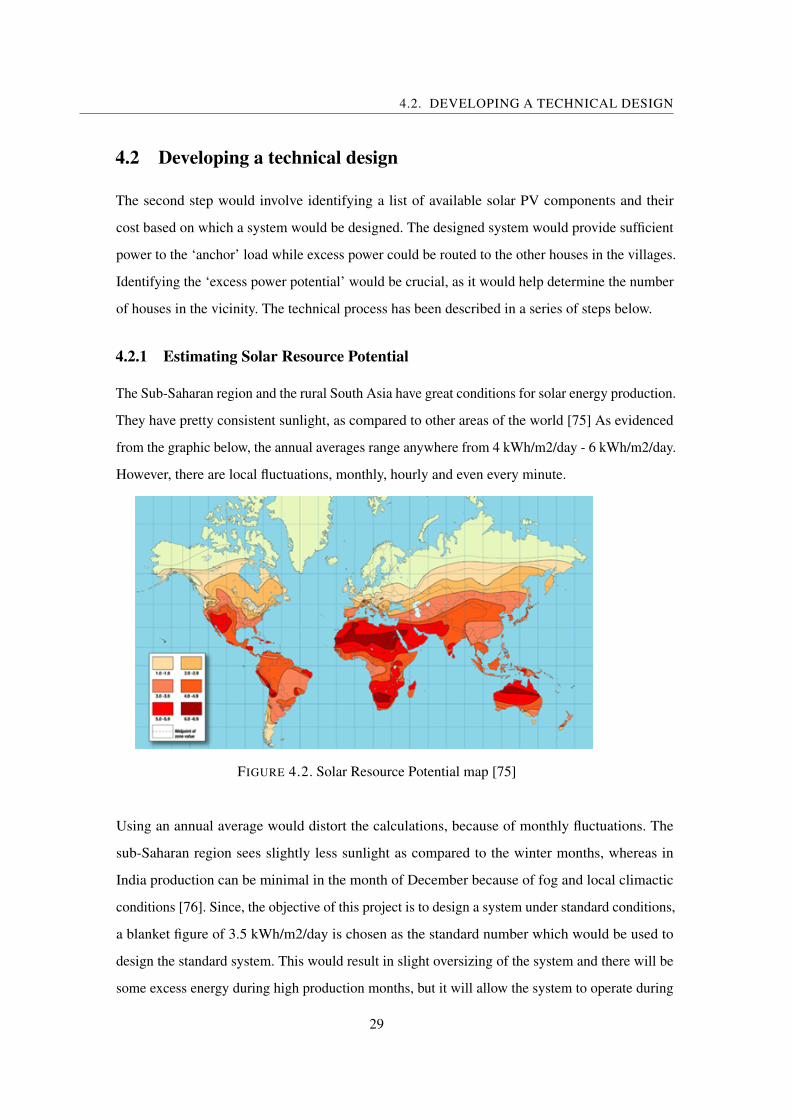
The Sub-Saharan region and the rural South Asia have great conditions for solar energy production.
They have pretty consistent sunlight, as compared to other areas of the world [75] As evidenced
from the graphic below, the annual averages range anywhere from 4 kWh/m2/day - 6 kWh/m2/day.
However, there are local fluctuations, monthly, hourly and even every minute.
FIGURE 4.2. Solar Resource Potential map [75]
Using an annual average would distort the calculations, because of monthly fluctuations. The
sub-Saharan region sees slightly less sunlight as compared to the winter months, whereas in
India production can be minimal in the month of December because of fog and local climactic
conditions [76]. Since, the objective of this project is to design a system under standard conditions,
a blanket figure of 3.5 kWh/m2/day is chosen as the standard number which would be used to
design the standard system. This would result in slight oversizing of the system and there will be
some excess energy during high production months, but it will allow the system to operate during
29
Page 46
CHAPTER 4. METHODOLOGY
the low production months and ensure its smooth operation. Also, the estimated production would
be validated by using HOMER.
4.2.2 Sizing PV panels
After calculating the demand, the first step in designing the PV system was to estimate the solar
PV capacity. Photovoltaic panels were specified with capital and replacement costs of $0.80 per
Watt with an operational life of 25 years[77]. This cost is assumed to include shipping, dealer
mark-ups. A derating factor of 80% was applied to the electric production from each panel. This
factor reduces the PV production by 20% to approximate the varying effects of temperature and
dust on the panels. The panels were modelled as fixed and tilted south at an angle equal to the
latitude of the site.
(4.1) Required PV production [Ereq] ≡Total Load (kWh)
Loss f actors
Thus, to estimate the size of the solar PV panels, the required PV production value was divided by
the peak sun hours to estimate the total capacity of solar panels required.
(4.2) Total solar capacity [Watts] ≡Required PV production[Ereq]
Peak sun hours≡ Ereq
3.5
4.2.3 Sizing batteries
The second step of the design was to estimate the battery size. To account for the fluctuations, the
number of autonomy days required off of the battery banks was selected at 4 days. For systems
designed to serve DC loads, a 12 V configuration was chosen simply because of compatibility with
the loads. For systems that require productive end use components a higher voltage configuration
(i.e. 24V/48V) was specified. The size of the battery bank was calculated as follows:
(4.3) Battery AH rating ≡ Battery requirement (Wh) ∗ Days o f AutonomyBattery Bank Voltage (V ) ∗ Battery E f f iciency
The battery efficiency of 0.8, typically used of a lead acid battery was used for the calculation
[78].
30
Page 47
4.2. DEVELOPING A TECHNICAL DESIGN
4.2.4 Charge controller, Inverter and other BoS components
The charge controller size is determined by the system voltage and the total panel current. Because
of light reflection or edge of the cloud effect, the charge controller is sized 25% higher than the
total array current [79]. For charge controllers rated below 20A at 12 V, a price of $25 dollar was
used. And for charge controllers designed at 45A/48V $250 was used, with a $50 increase in
prices with the increase in the rating of every 5 A [80]. The inverters were assumed to be pure
sine wave inverters and were specified with a cost of $ 0.30 per rated watt [81]. The efficiency of
inverters were assumed to be 90%. For other BoS components such as the mounting structures,
junction box, fuses, disconnects, and protection switches a flat rate of $ 0.30 per Watt of solar PV
was used [82].
4.2.5 Transmission line design
The transmission lines used in the designed are what can be best described as ‘skinny grids’ [5] as
opposed to the conventional grid power lines. These involve using thinner cables, cheaper poles,
sometimes also dug through underground trenches which decrease the cost of the installation
significantly.
The transmission lines were designed with the objective of ensuring a maximum of 10% voltage
drop at the maximum point of consumption. Having a thicker cable would mean lesser loss but
the cost of the cables could also be significant. Hence, a balance must be struck between the
acceptable losses and the cost of the cables. The following formula was used to calculate the
voltage loss in the transmission line based on the value of the DC resistance(R) selected from the
National Electrical Code (NEC); Chapter 9, Table 8.
(4.4) Voltage drop [Vd ] ≡2∗DC Resistance (R) ∗ Distance (L) ∗ Current (I)
1000
4.2.6 Optimization using HOMER
Different design sizes and their consequences on the ‘excess power potential’ and possible capacity
shortage will be analysed using HOMER. The technical design thus calculated from step 2 was fed
into HOMER to gauge whether the production would be able to meet the demand. The proposed
design was then tested with HOMER, under different scenarios to see whether the parameters
31
Page 48
CHAPTER 4. METHODOLOGY
were accurate. HOMER is a leading micro power optimization software that has been extensively
studied over the years by numerous energy professionals, it can be used with a degree of reliability
to optimize and verify the design created.
HOMER provides an excellent medium to test the validity of the assumptions made regarding
the peak sun hours and the battery days of autonomy by providing an hourly analysis or battery
state of charge, an estimate of excess energy potential and the probability of having a capacity
shortage. Sensitivity analysis on how the changes in the solar PV size or the battery size can affect
the LCOE can also be made, which helps optimize the system further [83]. In this case, a system
with capacity shortage of 2.5 % at a battery depth of discharge is thought to be optimal, which is a
standard practice in microgrid design [84] [85].
4.3 Devising a financial model
HOMER evaluates different designs based on Levelized cost of electricity (LCOE), but different
financial models cannot be evaluated with it. Also, setting different tariffs and choosing between
different capital structures for the project is not possible with HOMER. So, after identifying a
technical design, the CAPEX and the OPEX for the optimum technical design, a cash flow was
generated to estimate the return on investment. The cost figures along with the revenue numbers
(generated from households and in some cases through the service provided) will be used to
generate cash flows and estimate the return on investment. A snapshot of the model had been
provided in the Figure 4.3. The numbers in blue were calculated values from the design section
earlier or were derived from system specifications, whereas the numbers in yellow were the inputs
based on assumptions. The reasons for selecting the base assumption and the calculations used in
the model have been described below:
4.3.1 Key Assumptions
Project Duration: The base case for the project duration has been used as 10 years. For projects
longer than 10 years, the high discount rates would mean that the incomes would be almost
negligible. Also, the uncertainties regarding technology options and grid extensions are too vast
to consider anything beyond that. But, the possibilities of reducing the project duration will be
explored.
32
Page 49
4.3. DEVISING A FINANCIAL MODEL
FIGURE 4.3. Sample financial cash flow structure
Capital Structure: The total CAPEX of the project has been derived from the technical design
analysis. But, the options a private developer has, in financing this cost is explored in this section.
Besides, debt and equity, the effect of subsidy has also been considered. The base capital structure
has been selected as a 100% equity investment scenario, where the developer is expected to
finance the project out of his own pocket. The debt-equity ratio would gradually be varied in the
risk analysis section to see the effects of fluctuating interest rates in the model. This would help
us gauge the effect of ownership structures in the profitability of the model. The formulas used in
the model have been described below:
(4.5) Investment required ≡ CAPEX − Subsidy Available
(4.6) Debt required ≡ Investment Required − Equity Available
The required investment can be financed by various combinations of debt and equity. The yearly
debt payments were calculated by using the PMT function in excel. The interest rate of 10% was
33
Page 50
CHAPTER 4. METHODOLOGY
chosen for the base case, but again the sensitivity of that assumption will be evaluated in the next
step.
Discount rate: A discount rate needs to be applied to discount the estimates of future cash flows.
Since the initial investment costs for solar PV projects are much higher, while benefits accrue over
a longer period of time, using a higher discount rate would decrease the profitability of the project.
On the other hand, higher discount rates ensures that the investors get their return sooner rather
than later, which minimizes the risk. But, nonetheless a discount rate of 10% is chose as the base
case, which is the norm with rural electrification projects [56] [86].
Income: Finding out the level that is affordable for the population is therefore of key importance.
A recent study conducted by [15] finds that the 3 segments of BoP population based on their
relative poverty—‘low income’ (earning $3-$5/day), ‘subsistence’ ($1-$3/day), and ‘extremely
poor’ (less than $1/day) have on average a monthly electricity budget of $7.50, $4.50 and $1.50
per household respectively. For the households, the same monthly tariff of $1.5/month has been
used, which would have otherwise been used for the consumption of kerosene. Estimating the
monthly tariff suitable for an anchor load is more complicated.
For an anchor load tariff could be applied by using the avoided cost method or the value of the
service method. With the avoided cost method, a direct comparison would have to be made with
the current cost of energy, which is most likely sourced from a Diesel Generator. It is assumed
that anything below the levelized cost of energy (LCOE) incurred through a comparable diesel
generator would be a fair estimate. Now, if the cost of diesel is assumed to be $1/liter and the
specific fuel consumption of a diesel generator is assumed to be 2.5 kWh/liter [87]. This results in
the minimum cost of electricity for a diesel generator to be around $0.40/kwh. This is the base
tariff that could be used to compute the income from anchor in the model.
The second method or the value of the service method could also be used to set up a tariff where
the revenue generated by the productive end use component is used as a marker for setting up a
tariff. But, to go down that route an analysis must be made regarding the income potential through
that service. It becomes important to look at the operating hours of such an equipment and the
revenue with the product or the service the equipment provides. This analysis varies with each
productive end equipment and the tariff used in this study has been derived from this method.
Expenses: The expenses include costs for minor repair; operation and maintenance; insurance cost
34
Page 51
4.4. QUANTIFYING THE EFFECT OF THE KEY PARAMETERS
against theft, fire and natural disasters and monthly instalments to the bank in case of any debt
being considered in the model.
• Battery Replacement costs: The battery replacement costs have been added in year 5 of the
expenses, and have been directly derived from the technical design above.
• OPEX costs: The operating costs assumes 3% of insurance cost per year 1% on cleaning,
6% on the costs or repair and maintenance. The numbers have been changed slightly for
each of the designs based on the size of the system and also in cases where assumptions
regarding multiple installations have been assumed.
• OPEX escalation rate: The operating cost has been assumed to escalate by a factor of 5%
each year to account for the higher service and maintenance requirements as the equipment
becomes older.
4.3.2 Financial Indicators
Net Cash Flow: Net cash flow is simply the difference between the annual revenue and the
expenses.
NPV: By summing the discounted net cash flow over the project duration cycle the Net Present
Value of the unit is derived. The difference between the present value of cash outflows. NPV
used in capital budgeting to analyse the profitability of an investment or project. NPV analysis is
sensitivity to the reliability of future cash inflows that an investment or project will yield. The
formula used to compute the value has been presented below:
IRR: The Internal Rate of return (IRR) is the discount rate at which the net present value of all
cash flows from is equal to zero. Generally, the higher a projects Internal Rate of Return, the more
desirable it is to undertake a project.
4.4 Quantifying the effect of the key parameters
Risk is defined as randomness that is measurable or quantifiable, i.e. can be described by a
probability distribution.(Source). And, identifying risks, predicting how probable they are and
what kind of effect they might have on the profitability of the project. It is vital in deciding what
to do about them and implementing these decisions.
35
Page 52
CHAPTER 4. METHODOLOGY
The risks arising from each of the assumptions, such as the number of customers, their income,
project duration, and debt-equity ratio – a probability distribution function will be defined to
model their occurrence based on their key characteristics. A Monte Carlo simulation will then be
carried out with the help of a software Modelrisk to identify the 90th percentile of NPV value
based on each of the assumptions specified.Each of the assumption has been assigned a base value
along with the range of values the parameter can take. The next step is to vary one of the variables
and then find the new value of the financial indicators (NPV, IRR) conditional on the changed
value of the variable. This is repeated for all the key variables entering the CBA and repeated
with different changes in the variables. This analysis reveals how sensitive the estimated financial
indicators are to given changes in the considered variables.
The most sensitive parameters will then be identified by evaluating their their respective effect on
the 90th percentile value of NPV.
4.5 Identifying mitigation measures for the most sensitive
parameters
The next step will look to identify measures that could be implemented to mitigate the risk
arising from each of the key parameter. The measures could be in the ownership structure or the
operational model of the project. If a significant amount of risk could be reduced by changing the
technical design, then the technical design will be reviewed and the accompanying changes will
be incorporated.
4.6 Identify areas of further innovation
Any other barriers to reducing risk will be identified. Also, the regulatory framework and interven-
tions that can help replication and rapid scaling up will be identified. And, further innovations that
could help facilitate the scaling up of microgrids will be proposed.
36
Page 53
CH
AP
TE
R
5CASE STUDIES
5.1 CASE I
The first case study looks at designing a package around basic services of lighting and mobile charging.
First, the ideal number of customers required will be explored followed by evaluation of other sensitive
parameters.
5.1.1 Estimating Demand
The base case aims to provide basic energy services to the people currently using kerosene or candles as
their prime source of energy. 1 W of an LED bulb is chosen as a replacement for a wick based kerosene
lamp. Research has shown that such 1 W LED bulb provides 150 times more illumination than a wick
based ‘hurricane’ lamp [88], and thus is considered as an acceptable replacement. Under this model,
each household is provided with 2 units of 1 W LED light and a mobile charging point.
To keep the system simple, and to control the depth of discharge of the batteries a demand
side management is planned whereby, the load is assumed to operate during 5 hours in the evening (6
pm – 11pm) and 1 hour in the morning (5 AM – 6 AM). This could be controlled by using a simple
timer circuit [reference]. Also, it is assumed that all the lights and all the mobile phones would operate
continuously and simultaneously throughout these hours, which is unlikely to happen in the real world.
37
Page 54
CHAPTER 5. CASE STUDIES
But, for the purposes of this research and to simulate the worst case scenario, this is assumed to be the
case. Thus the load profile thus obtained for a single household has been shown in the figure below.
FIGURE 5.1. Load profile for a single household connected to a microgrid
Finally for this base case, the case of providing power to 10 houses, 30 houses, 50 houses and a
hundred houses is looked at to determine an ideal size of a load. So the first case will be broken down
into four categories of load.
Table 5.1: Defining the dimensions of the microgrid with respect to the no. of households
Sub Categories Energy required per day [kWh] Maximum Simultaneous draw [W]10 Houses 0.24 4030 Houses 0.72 12050 Houses 1.2 200100 Houses 2.4 400
5.1.2 System Size
The energy required in each case and the respective maximum simultaneous draw has been provided in
the table above.
To estimate the length of the transmission lines, it has been assumed that every household
requires 10m of cabling. All the systems have been designed with a 12 V configuration, which is
required for most LED lights and for charging a mobile phone. If the system were to be designed at a
higher voltage (i.e. 24V, 48V), the required size of the cables used in the transmission would have been
38
Page 55
5.1. CASE I
Table 5.2: System configuration for each subgroup
Number ofhouseholds
Solar PV size[Watts]
ChargeController
Battery BankSize
TransmissionLine
(ConductorSize)
Max voltagedrop at 100m
10 HH’s 80 10 A 12 V/100Ah 10 AWG 8.1%30 HH’s 240 25 A 12V/300Ah 6 AWG 9.8%50 HH’s 400 40 A 12V/500Ah 4 AWG 10.3%
100 HH’s 800 75 A 12V/1000Ah 1 AWG 8.2%
smaller. But, that would have required the use of 24 Vdc LED lights or the use of DC-DC converters at
each of the houses which would have increase the cost requirements and also the losses in the system.
5.1.3 Cost
Table 5.3: Cost Breakdown for each of the subgroups
Categories Fixed materialcosts (solar
panels, chargecontrollers,
Batteries andBoS
components
Constructioncosts
(Transportation+ Installation)
Transmission(Cabling costs)
Total costs Costs/HH
10 HH’s $252 $50.4 $ 20 $ 332.4 $ 32.2430 HH’s $731 $ 146.2 $ 120 $ 997.2 $ 33.2450 HH’s $ 1210 $ 242 $ 400 $ 1852 $ 37.04100HH’s $2390 $ 478 $ 1200 $ 4068 $ 40.68
From the table 5.3, it can be observed that, there is not much economies of scale with larger
systems. This is mostly because, the fixed material costs are very linear, but the cost of transmission
increases significantly for larger systems. It is likely that the construction cost could be optimized for
larger installation schemes with bulk purchases of BoS materials and proper project management [77],
but this has not been considered in this study.
Because of the increase in the costs of cabling for transmission, the cost/HH also increases for
larger systems (i.e. 50 and 100 HH’s). This is mostly because of the proportion of the transmission
cost goes up with the size of the system as seen in Figure 5.2. Having a smaller system is pretty cost
effective, as can be observed from the table above. While 10 number of household is the cheapest in
terms of cost/HH, the capital cost of each system is still reasonably small at $332.4 and the proportion of
39
Page 56
CHAPTER 5. CASE STUDIES
Operation and Maintenance (O&M) cost spent of them could be significant. For the systems above, an
O&M cost of 11% per year of the CAPEX has been specified which includes insurance cost, maintenance
cost and the wage for the maintenance person. The O&M cost could further be reduced by having a
sufficient number of system of larger size that allows the developers to station a local team at the site of
the operation. Thus, to give the project a sufficient scale, and given the fact that the systems with large
number of households might be hard to locate in a given vicinity, a microgrid with 30 HH has been
considered as an ideal case for which the financial model will be further evaluated.
FIGURE 5.2. Cost breakdown in percentage for different subgroups of houses
5.1.4 Modeliing with HOMER
A system was designed in HOMER that emulated the design estimated above. A 240 Watt solar panel
was chosen along with 2 units of 150Ah/12V batteries. The load profile entered and the components
chosen to meet the demand has been shown below:
After running the simulation, the following results were obtained
The colour map in figure 5.4 presents the battery state of charge throughout the year. As indicated
by the colour legend on the right of the chart, the colour red indicates the period when the battery state
of charge (SOC) is 100% and the colour black indicates the state of charge when the SOC drops down to
40%, which has been used as the minimum state of charge the battery bank can take. The load is dropped
once the battery SOC falls below 40%. The chosen SOC of 40% allows the battery life to extend beyond
5 years which is an important consideration for the financial model. As we can see from the chart above,
40
Page 57
5.1. CASE I
FIGURE 5.3. HOMER imputs (System components on the left, load profile representing 30HH’s on the right
FIGURE 5.4. HOMER simulation showing battery SOC throughout the year
the battery state of charge remains above 80% for more than 40% of the time. The SOC however stays
below 50% for most of the time in the summer months of June, July and August. The model predicts the
battery life of 5.53 years.
However, the capacity shortage has been calculated at 2.5%, meaning – the load will not be
served for 2.5% of the time. This is assuming that the battery SOC will not drop below 40%. On top of
this, the model predicts excess electricity during 12.3% of the time. Mostly during the daytime when the
41
Page 58
CHAPTER 5. CASE STUDIES
batteries would be full with no load to serve.
5.1.5 Financial cash flow
The chart below tries to develop a financial model with a view to determine the profitability of the project.
The cells in yellow provide the assumptions that have been made with the cells in yellow providing the
calculated figures. Since the batteries are to be replaced in Year 6, the replacement costs has been added
in the expense column in the 6th year. Initially, a utility model where the project developer invests 100%
equity is tried out, which results in an IRR of 23% and a NPV of $464. The income is calculated with
the monthly tariff of $1.5/household for 30 households.
FIGURE 5.5. Cash flow for a system serving 30 HH’s
5.1.6 Risk Analysis
The following variations were included in the project assumptions (indicated by colour yellow in the
financial model) to assess their impact on the profitability of the model. The crucial financial parameter
analysed is the NPV of the project.
42
Page 59
5.1. CASE I
FIGURE 5.6. Expected range of fluctuations for critical parameters
• The number of households has been assumed to vary between 21 and 33. The upper ceiling in
the number is automatically defined while dimensioning the system. Since the system has been
designed for 30 households during standard weather conditions, having too many households
would mean exceeding the supply capacity of the system. Hence, the possibility of the number of
households varying between 21 and 33 is assumed. The function is specified to be a triangular
function.
• This model assumes that the maximum tariff people would be willing to pay would fluctuate
between $1 and $1.5 per month with a triangular function.
• The equity percentage is assumed to be 100% at the start, assuming that the operators are operating
in a Utility based model, where the consumers are paying for the cost of electricity on a monthly
basis without any initial investment up front. As the equity contribution declines and debt is
required, the effect this might have on the profitability is further explored. The range for the debt
equity ratio.
• The system has been designed assuming the maximum length of the cable of 100 m, which might
not be required in all cases. Since, the transmission cable forms a significant chunk of the capital
cost, the effect of reducing transmission line costs are evaluated. The transmission line has been
range has been specified as 50%/100% for a base value of 100m. The maximum range of 100%
signifies the fact that the cabling length will not exceed the initial selected distance of 100m but
the minimum range of 50% signifies the possibility of the cabling costs being reduced to 50m.
• The OPEX cost is assumed to vary between 60% and 120% of the base assumption of $130.
A reduction of more than 60% is not possible in this case because those costs are reserved for
43
Page 60
CHAPTER 5. CASE STUDIES
insurance, cleaning and minor repair. If many projects could be aggregated together the remaining
cost which represents the cost of repair and hiring a staff might be reduced. This is the possibility
that the model will look to explore.
• The discount rate has been specified with a 90%/110% triangular function on the base value of
10%.
After specifying the range of inputs a Monte Carlo simulation is performed for 10000 sample
runs. This results in a large set of probabilistically weighted ‘what-if’ scenarios, by picking different
random values from each of the model’s distributions and calculating the total NPV each time. The
results can be seen in Figure 5.7.
FIGURE 5.7. Histogram plot for NPV (Probability to be less than 0 = 12.5%, 90th percentilevalue $681.31
It can be seen from the figure above, the NPV stays positive for 88% of the time over the specified
inputs. The NPV of $464 from the base case is very close to the mean and the 90th percentile NPV is
$681.31. But, to understand the parameters that are driving the NPV to be positive or negative, a tornado
plot was drawn. It gives a general description of how the result distribution is affected by each input.
44
Page 61
5.1. CASE I
FIGURE 5.8. Tornado plot showing rank corelation of different input parameters
As it can be seen from the chart above, the number of households and the tariff are the most
sensitive parameters, which affect the profitability positively whereas an increase in operating costs and
an increase in equity proportion affects the profitability negatively.
5.1.7 Risk Mitigation Strategies
For a micro-grid designed to serve only the basic needs of lights and mobile charging, the venture seems
profitable for a utility based operator. But, other aspects of risk that can issues have been described
below:
5.1.7.1 Technical design Issues
The most sensitive parameter identified is the number of households. Installing the microgrid for less
than It is definitely less risky to develop smaller packages of microgrids. Designing even smaller system
of 10 HH’s might be less risky. At least, the developers must be absolutely sure that the reduction in cost
achieved by commoditization and bulk purchase outweighs the cost required to customize the design for
different sizes of households.
45
Page 62
CHAPTER 5. CASE STUDIES
There is a trade-off in the system between the number of houses and the length of distribution
lines. The higher the number of houses that need to be powered, the larger the load requirement and
the length of the distribution line, which means larger losses. This can be countered by using thicker
distribution cables. But, the cost of thicker/longer distribution lines lowers the profitability. It is wiser to
construct multiple DC microgrids of smaller size rather than constructing a larger microgrid serving
more number of customers. There are still other opportunities to monetize the excess electricity from
the system which occurs all throughout the year except the monsoon season during the months of
June-August. If the excess electricity is monetized, the returns can be further boosted by 5%.
5.1.7.2 Operational Issues
Regarding the project capital structure, having a community ownership is crucial in designing sustainable
systems. But, financing these systems with debt is much cheaper and profitable. Increasing the equity
percentage reduces the NPV of the system. Opportunity to minimize the operating expense exists if
large number of projects were to be aggregated in a small area as it significantly affects the profitability
of a project.
5.1.7.3 Regulatory Issues
Since the model is profitable for the project developers to operate right away, the case for subsidies was
not explored. If there are sufficient people in a vicinity (100m for all the bundles of households explored),
this model definitely looks more feasible than a SSHS. The cost/HH with this mode of electrification is
between $33/Household to $40/Household. This is 4 times less expensive when compared to an isolated
SSHS, a 10 Wp system costs $125 per unit [5], which provides the equivalent amount of energy as in
assumption for a small household, but costs 4 times as much.
Another issue with the SSHS has always been that the SSHS model focuses too much on products
and the competition between suppliers is always to sell products at a cheaper price. This competition
drives them to sell products of lower quality and not focus too much on after sales service. The utility
based micro-grid operators are instead focused on providing effective service and their main focus
is on cost/kwh rather than cost/kw. For lower cost/kwh i.e. levelized cost of energy (LCOE) to be
minimum, using better quality components and ensuring that the system functions at optimum conditions
by providing proper operation and maintenance service is a must.
46
Page 63
5.2. CASE II
The ability of the people in the BoP to pay the initial investment for the SHSS is another concern
that is usually brought up. The utility based model allows the customers to spread their payments
according to their income and over a long period of time without having to worry about equipment
ownership.
5.2 CASE II
This case study will mostly look at the implications of using a productive end use appliance as the form
of anchor load. For the purposes of this study, a grinding mill and a milk chilling plant has been chosen
as the productive end use services around which the system will be designed.
5.2.1 Estimating Demand
For the grinding mill, a 2 horsepower (HP) motor will be considered as a suitable load with 4 hours
of daily operation. The 2 HP grinding mill has a minimum grinding capacity of 50 kg of wheat per
hour. The daily load profile of the motor has also been presented in the diagram below. The total daily
energy requirement of the motor is 5.976 kWh/day under the maximum simultaneous load of 1.4 kW.
The daytime operation has been chosen so that the production from the solar panels could be matched
with the demand.
FIGURE 5.9. Load Profile for a grinding mill without any residential loads
The milk chilling plant could be another example of a service that could be used as an ‘anchor’.
47
Page 64
CHAPTER 5. CASE STUDIES
India is the largest producer of milk in the world and a large proportion of that never reaches the
consumer, because, often rural farmers travel long distances to milk collection centres carrying warm
milk and also because the dairy trucks do not make daily rounds [89].
So, a milk chilling plant has been designed, where a 3 HP motor acts as a chilling facility for
1000 liters of milk. Unlike the grinding mill, the chilling plant is a continuous load and operates 24*7
and will act as a good comparison to gauge the effect of a load that is more evenly spread throughout the
day. The 3 HP motor consumes 36.9 kWh/day [90], which is also a big step up from the grinding mill.
The load profile of the chilling centre has been presented in the figure below:
FIGURE 5.10. Load Profile for a chilling centre; 0 households
5.2.2 System deisgn and costs
For both the chilling center and the mill, a pure solar system was found to be cost effective when
compared against other hybrid solutions. Both the systems have been designed at 48V. The grinding
mill has two panels connected in series with 5 strings whereas the chilling centre has 4 arrays of 3
panels in series with 5 strings. Both the systems use a single 3 kW inverter and each one of the arrays
use 40A/48V charge controller. The batteries have been designed with, 4 days of autonomy which has
resulted in the batteries being sized at 5 times the size of the AC load at C-10 rating. Since the batteries
will be discharged at C-30 in the worst case (the maximum load is roughly 2 kW), the batteries have
significantly large days of autonomy.
48
Page 65
5.2. CASE II
5.2.2.1 Chilling plant
Component Size Description Capital Cost Replacementcost
Lifetime
Solar Panels 12 kW 60 units of200 W
$9600 $9600 25 years
Batteries 192 kWh 24 units of4000 Ah
$23,040 $23,040 5 years
Inverter 300 W 1 unit of 3000W
$ 900 $900 5 years
ChargeController
40A/48 V 4 unit $1000 $1000 5 years
BoS Cabling,Framing,Switches
$ 3600 10 years
LabourTransport
$3400
Table 5.4: System components and their respective costs for a chilling centre
5.2.2.2 For the grinding mill
Component Size Description Capital Cost ReplacementCost
Lifetime
Solar Panels 2 kW 10 units of 200W
$1600 $1600 25 years
Batteries 192 kWh 24 units of600Ah /2V
$3456 $3456 5 years
Inverter 3000 W 1 unit of 3000W $900 $900 5 yearsCharge
Controller40A/48V 1 unit $250 $250 5 years
BoS Cabling,Framing,
Fuse/Switches
$600 10 years
Labour/Transport $620.6(10% ofthe direct costs)
Table 5.5: System components and their respective costs for a grinding mill
In addition to this, the O&M costs have been assumed to be 7% of the total CAPEX for the
grinding mill and 6% of the cost for the chilling centre. The larger size of the chilling center reduces the
proportion of the O&M costs mostly through savings in wages of labour.
49
Page 66
CHAPTER 5. CASE STUDIES
5.2.3 HOMER modelling
5.2.3.1 Chilling plant
FIGURE 5.11. HOMER inputs for the chilling plant
The designed system was fed into HOMER to estimate the excess capacity. The results have
been presented in the table below. Without changing the technical design of the system, the effects of
adding additional household loads have been explored.
Number ofHH’s
Daily LoadRequire-
ment[kWh]
PercentageLoad
consumerby anchor
ExcessCapacity
Capacityshortage
IRR NPV
0 37.2 100% 11.6% 1.3% 7% $ -3,56230 37.64 98.08% 10.8% 1.5% 9% $ -1,453
100 38.68 93.79% 8.71% 2.2% 13% $ 3,468
Table 5.6: Effect of adding the number of houses on the capacity shortage and profitability of the project
The addition of residential loads from 30 HH’s is easily possible with this design. Even the
addition of 100 HH’s does not increase the capacity shortage to more than 2.5%. The capacity shortage
occurs for about a month in September. Adding other seasonal loads is possible in all other months,
especially from January to June and October through December, which can further generate revenue.
50
Page 67
5.2. CASE II
5.2.3.2 Grinding Mill
FIGURE 5.12. HOMER inputs for the grinding mill
The following results from the simulations were obtained for the inputs specified above in figure
5.12.
FIGURE 5.13. HOMER simulation output showing the excess generation capacity and sea-sonal production fluctuations
Tt can be observed that the system is much more efficient when day load is introduced as the
simulation predicts 16% of excess electricity with no capacity shortage at battery depth of discharge
of 40%. Now if the system was to incorporate the household loads from case 1, i.e. 30 HH’s using 2
LED lights and 1 mobile charging point, and was modelled again with the second load profile, which
incorporates the household loads, the excess electricity percentage drops down to 7.25 % with a possible
capacity shortage of 2.6% at a battery depth-of-discharge of 40%. Now, an argument could be made that
the size of the system could be optimized by reducing the size of the solar panels instead. If the size of
51
Page 68
CHAPTER 5. CASE STUDIES
the solar panels were to be reduced to 1.8 kW from the originally designed 2 kW, then a similar result
would be obtained (excess electricity of 7.4% with a capacity shortage of 2.5%). That approach would
minimize the capital cost by $120 whereas electrifying 30 HH’s can increase the rate of return by 6%.
This basically means that, 30 HH’s can get electrified at practically no cost, with a large boost to the
cash flow. If the effect of adding other households to the model is examined the following results will be
obtained.
Numberof HH’s
DailyLoad
Require-ment
[kWh]
Percentageload con-sumed by
anchor
Solar[kW] Battery[kWh]
CAPEX OPEX Cost/HH
100 9.376 71.35% 2.8 kWp 800Ah/48V
$10,138 $ 710 $ 101.38
200 10.76 55.46 % 3.6 kWp 1150Ah/48V
$ 13,574 $ 950 $ 67.87
300 13.176 45 % 4.4 kWp 1400Ah/48V
$ 16,377 $ 1,146 $ 54.59
Table 5.7: Decreasing cost/HH with increasing number of households
The cost/HH is significantly improved by increasing the number of households. Although the
cost of transmission has not been included there which one would assume would increase the cost/HH
figure. But, in this case since an inverter has already been used, AC transmission at a much higher
voltage could be sought for. But, this would increase the chances of tamper and theft, hence metering
solutions may have to be explored by performing a cost benefit analysis.
5.2.4 Financial Analysis
5.2.4.1 Chilling plant
To compute a suitable tariff for the milk chilling facility, the rural milk marketing chain was studied.
The rural farmer sells the milk to the collection agencies at prices of around $ 0.25- $ 0.30 per liter [91].
Now, for the base case scenario, a chilling tariff of $0.04 per liter per day has been proposed, which
adds 20% to the original cost of the milk. One would assume that, but if there was significant revenue to
be made by using the service by the way of avoiding large quantities of milk wastage, this could be an
attractive proposition to the rural farmer. The sensitivity of the tariff is further studied in the next section.
Also, the operation days has been assumed to be 300 days per year.
52
Page 69
5.2. CASE II
FIGURE 5.14. Cash flow for a chilling center based microgrid
For the base case, the model predicts an IRR of 9%, which produces a NPV of $ -1,453.
5.2.4.2 Grinding mill
For the grinding mill the the income comes from two sources; one is the residential houses paying
exactly at the same rate as before and a new method of payment for the anchor load has been proposed.
As described in the methodology a value of the service method is used where the cost of electricity is
transferred to the service being provided. In the case of the grinding mill, the proposed 2 HP motor
would grind 50 kg of wheat per hour. Now, for each kg of grounded wheat a rate of $ 0.05 is charged
instead, and 300 days of operation per hour is assumed then the yearly revenue becomes $ 3,000. This is
much higher than the $ 850 of annual income, if the energy value method of calculation is used where
the tariff for each kWh of energy is charged at $ 0.40. With these assumptions, the rate of return on
this project becomes 19%. Here, the annual revenue of $540 from the household loads has also been
incorporated. Without the household revenue the rate of return drops down to 6%. The case would get
increasingly better when the number of households increases. The sensitivity of all these parameters has
been evaluated in the next section.
Another point to note is that, HOMER predicts the battery life to be 20 years. But, since the
maximum warranty we can typically have for a lead acid batteries are 5 years, we assume that the
replacement costs are added in year 5 anyways.
53
Page 70
CHAPTER 5. CASE STUDIES
FIGURE 5.15. Cash flow for a grinding center based microgrid
5.2.5 Risk Analysis
Similar to case 1, the base value of all the parameters and the minimum and maximum value of the
distribution chosen has been specified in the table above.
FIGURE 5.16. Expected range of fluctuations for critical parameters
Since the chilling center can accommodate 100 households without having to change the size of
the system, a wide range is specified with the maximum being 110, when the capacity shortage starts
to exceeds 2.5%. For the grinding mill the number of households used is 30. All the other parameters
have a similar range to one another and the reasons for selecting these ranges have been specified in the
54
Page 71
5.2. CASE II
earlier section.
The 90th percentile NPV of a chilling center based project, based on our assumption, lies at
$12,537.71, with an average return on equity of 18%.
FIGURE 5.17. Histogram plot for NPV for a chilling center based project
Tthe tornado plot below shows the sensitivity of the 90th percentile of the NPV to each input
distribution. It shows that anchor tariff and it’s operating days drive the project cost uncertainty the
most. If the anchor tariff is low, NPV’s 90th percentile is around -$8215 and if the tariff is high the 90th
percentile is around -$23,370. A similar result can also be observed for the grinding mill in Figures 5.19
and 5.20.
55
Page 72
CHAPTER 5. CASE STUDIES
FIGURE 5.18. Tornado plot showing the sensitive parameters for the 90th percentile NPV
FIGURE 5.19. Histogram plot for NPV for a grinding center based project
5.2.6 Risk Mitigation Measures
5.2.6.1 Technical Design
Adding 30 HH to the initial productive load can be achieved at practically no cost. The revenue
generated from the households makes the project much more profitable than downsizing the system. The
profitability increases as the number of houses increase, but with the increase in number of houses the
costs of transmission and the uncertainty regarding the payment from the households also grows.
56
Page 73
5.2. CASE II
FIGURE 5.20. Tornado plot showing the sensitive parameters for the 90th percentile NPV ofthe grinding mill
One important disadvantage of using DC micro-grids was the voltage loss during the transmission.
The low voltage design meant that the losses were quite significant and the cables were expensive. This
limited the area around which the transmission lines could be expanded. Since the box now includes an
inverter, it might be much wiser and cheaper to include an AC micro-grid to limit the losses.
An important advantage of the DC microgrid with its 24 V transmission was that, it prevented
leakage of electricity via electricity theft. But, switching to an AC grid makes the network vulnerable
and electricity can easily be tapped out. So alternative distributions could be sought or the option of
PAYG metering solutions could be explored.
Prepaid meters have been considered as a great invention in ensuring that payment are collected
in a timely manner. Besides, ensuring timely payment, they can also be used to ensure that energy
capacity of the microgrid is not exceeded by preventing battery over discharge. Meters can help ensure
that the households comply with their allotted energy quota. But, they do add to the cost of the microgrid.
Adding further revenue generating alternatives is possible to monetize the excess electricity.As
the size of the anchor grows, more number of houses can be added around the system without increasing
the capacity shortage.
57
Page 74
CHAPTER 5. CASE STUDIES
5.2.6.2 Operational Model
The main uncertainty arises from the usage hours and the tariff of the anchor loads. The higher the ratio
of debt-to-equity in a project, the higher the potential return to owner’s equity. At the same time, raising
the level of debt also increases the risks to equity since a project’s cash flow is variable and returns are
paid after operational expenses and debt service. Since the project is highly sensitive to operating hours,
the amount of debt should be minimized or support from subsidy should be provided.
If the usage hours and the tariff from the anchor loads could be guaranteed, the risks could be
minimized. If the anchor loads are BTS or ATM’s, which have fixed hours of operation then and energy
consumption is guaranteed, the model is much more stable. A revenue stream from such loads can also
be stable because of a corporate guarantor.
But in this case where the anchor loads are motors or other productive end use appliances – can
their operation be guaranteed all year round? From the model above, the profitability of such anchor
loads rely mostly on the operation days of the anchor load. Who is to be held accountable in case of
non-payment? In cases of such load, the concern for the energy service provider, is not just to supply
reliable electricity but to ensure that enough demand exists for continuous consumption by the anchor.
If having a transmission line starts to get expensive and risks of electricity leakage starts to
increase, then delivering batteries such as the model adopted by OMC needs to be explored. Increasing
HH’s definitely adds to the profitability without adding too much direct system costs.
Decreasing O&M costs needs to be seriously considered, either by scaling up the size of the
project or by bundling together many projects in a close vicinity.
5.2.6.3 Regulatory Environment
Cross sector partnerships must be struck to create a supply chain for the products produced by the
productive end use equipment to ensure continuous usage. For chilling centres this could be dairy farms
based in urban areas which can significantly boost their supply. CAPEX needs to be provided in cases
where revenue from the anchor is seasonal or cannot be guaranteed all year around.
In cases where the operating hours of the anchor loads are low the project term needs to be
extended for the project to be profitable. Also, clear indications of grid extension plans are required from
58
Page 75
5.3. CASE III
the government.
The availability of cheap debt is not the most sensitive parameter, but it does help in keeping the
project profitable.
5.3 CASE III
This case study focuses on designing systems around public service institutions such as a hospital
or a rural health clinic. Most rural electrification policies have provisions for capital subsidies to be
provided to social institutions such as schools or rural health clinics [92] [93]. But, without proper
human resource capacity for operation the systems fail well before the expected period of use [57]. Now,
this case study will look at providing power to these public service institutions through the involvement
of private sector. The study starts by defining a load profile and looking at the sensitivity of each of the
parameters discussed in earlier sections while also looking at alternative methods to provide subsidy to
rural electrification projects besides the 100% grant option, which might incentivize private sector to
maintain and service the system throughout the project term.
5.3.1 Estimating Demand
A health-post operating a refrigeration unit for housing medicines was assumed to be a hypothetical
load around which a microgrid design will be attempted.The total daily energy requirement is around
3.32 kWh with the maximum simultaneous load of 320 W. The load profile under evaluation has been
shown in Figure 5.21.
5.3.2 System Design
The same formulas from Case-1 is now used to size the PV panels, charge controller, an inverter and the
battery bank. The components have been described in the Table 5.8.
The system has been designed at 48 V. There is a single array of solar system will have 2 panels
in series with 4 strings. The array is connected via a MPPT charge controller, to the batteries which are
valve regulated lead acid (VRLA). The O&M cost have been used as 8% of the total CAPEX. i.e. $ 309.
59
Page 76
CHAPTER 5. CASE STUDIES
FIGURE 5.21. Estimated load profile of a rural health clinic
Table 5.8: System details with their respective costs
Component Size Description Capital Cost ReplacementCost
Lifetime
Solar Panels 1.6 kW 8 units of 200W
$960 $960 25 years
Batteries 19.2 kWh 24 units of 300Ah /2V
$1,728 $1,728 5 years
Inverter 1000 W 1 unit of 1000W $300 $300 5 yearsCharge
Controller40A/ 48V 1 unit $250 $250 5 years
BoS Cabling,Framing,Switches
$319 10 years
Labour/Transport
$360 (10% ofthe direct costs)
5.3.3 Modelling with HOMER
It can be observed that the excess electricity amounts to 20% at a capacity shortage of 0.3%. As in
previous cases the number of houses in the vicinity was gradually varied and it was found that if 50 HHs
were included in the system the excess capacity would reduce to 7.66 % with the capacity shortage of
2.5%. Hence the anchor load could accommodate 50 HH without adding any costs to the CAPEX which
is a similar observation as in previous cases.
60
Page 77
5.3. CASE III
FIGURE 5.22. HOMER inputs for the clinic
FIGURE 5.23. HOMER simulations showing Battery SoC throughout the year
5.3.4 Cash Flow
Since the objective of this study is to look at different ways to deliver subsidy to rural electrification
schemes electrifying rural institutions, two different models is looked at. The first models assumes that
an upfront capital subsidy of 50% (i.e. $ 1930) is provided with the remaining 50% provided in a yearly
instalment for a period of 10 years. The second involves looking at a case where no capital subsidy is
provided and the total cost of $3867 is equally spread out over the project term of 10 years. Since there
is no direct revenue to be made from providing electricity to a government operated institutions such
as the household, the annual subsidy acts as a ‘pseudo’ anchor income for the project. The base case
assumptions regarding the tariff charged to the households, discount rate and the interest rate remains
the same.
61
Page 78
CHAPTER 5. CASE STUDIES
FIGURE 5.24. Proposed cash flow for social instituion based projects with annual subsidiesreplacing anchor revenue
For the base case assumptions, the project assumes a NPV of $699.
5.3.5 Risk Analysis
FIGURE 5.25. Sample financial cash flow structure
The table above shows the ranges specified for assumptions taken for the first case (50% capital
subsidy with the rest as annual subsidies) in the first half of the table of Figure 5.25 and the second
case (without the initial capital subsidies but with annual payments awarded ) the second half of the
Figure 5.25. All the other parameters have similar ranges for the reasons specified in the last two cases.
62
Page 79
5.3. CASE III
Two new variables introduced are the annual subsidies which serve the similar function as the anchor
tariff variable specified in the last two cases. The ranges specified for the tariff attempts to evaluate
the effect of the value of the subsidy provided. Higher subsidy obviously translated to higher returns,
but the objective was to understand the proportion of subsidy that should be provided to reduce the
risk/uncertainty arising from small number of households in the vicinity or from non-payment.
From the results of the montecarlo simulation it was clear that the number of houses was the most
sensitive parameter. The 90th percentile NPV was not very different in both the cases. But, the amount
of capital subsidy awarded definitely affects the NPV more than the annual subsidy. This is mainly
because up front subsidies are immune to discount rates and they also decreases the debt requirement
thus decreasing the impacts of interest rates in the profitability. Also, as expected debt is more sensitive
to the case where capital subsidies are not provided.
FIGURE 5.26. Histogram plot fro NPV
If the operating cost can be reduced to 25% of the current cost the 90th percentile of the NPV
could be improved from $1406 to $2191.27, which is pretty massive.
5.3.6 Risk Mitigation strategies
It’s clear that without any subsidies, these projects are simply not feasible. This is because the revenue
from the households are having to cover for the lack of revenue because of the absence of a productive
end use device. But, most rural areas have such a social institution already in place and governments are
awarding subsidies to power such critical service infrastructure.
63
Page 80
CHAPTER 5. CASE STUDIES
FIGURE 5.27. Tornado plot showing the sensitivity of the 90th percentile of NPV
If the capital subsidies and annual subsidies are awarded to such projects, there exists an
opportunity for private sector to include rural households in the project to increase the revenue on these
projects. Under the model which has been considered, the onus is on the private developers and operators
to electrify surrounding households and increase the profitability. The more households they cater to, the
more profitable the projects are. If a cheap debt facility is provided, then with very small equity amount
such projects can be constructed so the returns on the equity could be quite high.
Because of the presence of private developers, the presence of skilled technical personnel in the
project is maintained in case of maintenance. Private players will have easier access to finance and hence
can raise capital for expansion in case of growth/ addition of new households as opposed to communities
taking the initiative.
With a PPP (Private Public Partnership) model of operation, the community can readjust their
tariff payment so that the yearly return is not exceedingly high for the developers. And for the government
this could be a way to phase out the subsidy policies because the income from the households is sufficient
to keep the cash flow profitable. Even without the annual subsidies the 90th percentile of the NPV is
well above $0.
If the residential demand is still quite low, some of the household subsidy could also be passed
on as subsidies to the project.
64
Page 81
CH
AP
TE
R
6DISCUSSION AND CONCLUSION
T he history of microgrids have been long and they have been implemented for decades all
over the world with varying degrees of success. But, in cases where they have succeeded, it
has had tremendous impact on people’s lives by increasing productivity, increase in levels
of education and healthcare services and achieving poverty reduction. But, despite the transformative
power of electricity in people’s lives, the fact remains that there are still 1.3 billion people in the world
without access to electricity.
While historically, microgrids have been implemented through grants and donor funds it has now
become clear that traditional approach of microgrid design and implementation cannot keep up with
the levels of population increase and innovative models need to be designed, which reduce the risks for
investors, help project developers reduce their project development costs and still be able to provide
people with affordable access to energy.
We have now arrived at an interesting juncture in human history where massive technological
improvement has made bootstrapping approaches to microgrid implementation feasible which can
deliver such goals. The emergence of LED technologies have revolutionized lighting industry by offering
massive energy efficiency opportunities. Couple that, with the drop in solar PV prices, improvements in
battery technologies and emergence of low cost distribution networks, the cost of solar microgrids have
never been more feasible. But, despite these improvements replicability and scalability have emerged has
65
Page 82
CHAPTER 6. DISCUSSION AND CONCLUSION
prime concerns which have held back the rapid deployment of microgirds. To understand this feasibility,
this study has attempted to identify likely the challenges in scaling up solar PV based minigrids in the
developing world by trying to identify the conditions under which they might be profitable so that the
private entrepreneurs could be lured into the design, implementation and operation. The objective was
to use standardized approach to design by having as many common equipment as possible to realize
economies of scale and exploit the BoS cost reduction potential.
This desk study looked at three possible design opportunities – providing people with access to
basic services such as lighting and mobile charging, providing people with access to productive end use
services and designing systems in and around social insitutions such as the school or a rural health clinic
which already exists in a rural community.
If a village requires no productive end use services, but has a relatively high population density,
small DC based microgrid offers an ideal solution to provide basic service opportunity.Infact, they are
much more efficient than SSHS Microgrids focusing on deploying basic services are profitable mainly
because of low consumption. Even though the cost/kwh prices are 10 times higher than a grid connection
the overall flat-fee does not come out to be much, especially because the total consumption hovers
around the region of 1-2 kWh/month.
Household appliances like a TV, Fan or a Fridge seems like quite an expensive proposition
especially because it does not directly generate tangible revenue. The LCOE at which such an operation
looks feasible is around $2 – $2.5/kwh. For kerosene based lighting and mobile charging, extremely
low daily energy is required. Most of the times the monthly energy requirement is less than one kWh,
hence at monthly tariff of $1 - $2, microgrids could be profitable. As soon as an appliance like a TV is
introduced, the energy requirement triples to around 4.5 kWh. And, so does the cost. More research
needs to be done towards developing extremely efficiency household appliances which could be powered
with such grids.
If the microgrid centers around an ‘anchor load’ by deploying a productive end use equipment
then the revenue it generates becomes crucial in making a rural electrification project successful. The
socio-economic value created by such productive end use services is significant. But, to help the people
in rural areas realise the potential by unlocking its value is the challenge that microgrid developers will
face. In the case studies, an attempt at unlocking the value was made by passing the cost of electricity
66
Page 83
on to the products/service that the end-use appliance delivers. The tariff for such services was set at
$0.04/kg for grinding mill and $ 0.04/liter/day for chilling centres which is being regularly charged by
the service providers for similar services in other areas. Under such payment strategies the microgrids
seem profitable.
But, the profitability under such a model very much depends on the operating hours of the system.
To guarantee the continuous operation of such unit, a creation of a supply chain by connecting these
systems and their outputs with urban markets is a must. Tremendous collaboration and cross sector
partnerships are required between project developers, private sector companies and local market for
this to materialize. The excess energy generated from these anchor loads provides an opportunity to
electrify households in and around them. The higher the energy consumed by a productive end use load,
the higher the number of households it can accommodate by making use of its excess capacity. Adding
revenue from the households, as witnesses in the case of the chilling plant, can increase the profitability
of these projects by up to 6%. For anchor loads with varying levels of cash flow where increasing the
amount of debt, poses risk to the equity, capital subsidies can then be awarded to minimize the risk. But,
the variability in the cash flow can also be countered by incorporating additional services like a cold
storage, cinema, or a telemedicine to make use of the excess electricity. Reducing operating expenses by
aggregating many projects together offers further chance to boost revenue.
For social institutions such as a rural health post or a hospital, there are significant advantages to
be had by aggregating household loads to them and providing capital subsidies to these projects as dis-
cussed in the section earlier. Aggregating residential loads and institutional loads together, minimizes the
subsidy requirement, increases system efficiency by minimizing excess electricity and achieve economies
of scale by allowing a large system and an opportunity to aggregate projects. From our observation
above reducing the O&M cost down to 25%, increases the 90th percentile of NPV significantly.
But, the requirement of large number of households in a small cluster around the vicinity of the
load restricts the potential regions where this could be implemented. The population density needs to be
high in order for such projects to be feasible. If the population density is high enough, project developers
can further explore battery delivering services to reach higher number of customers while minimizing
transmission costs and electricity theft.
Further research needs to be done into looking at mapping solutions to identify such clusters of
67
Page 84
CHAPTER 6. DISCUSSION AND CONCLUSION
households where these solutions could be implemented. This could further reduce project development
costs and also help in planning and designing of microgrids. Reducing excess electricity and monetizing
it, represents another opportunity to increase revenue for project developers. Metering solutions that
dynamically adjusts prices to demand might be a form to introduce demand side management to ensure
consistent uptake of energy for households. Adding other seasonal productive end use loads to the
demand might be another way to monetize this excess electricity.
Since this was a desk study, some of the parameters could not be tested. For example – some of
assumptions regarding the load operating at maximum throughout the operation will not hold true in
field conditions. This will result in a much smaller demand which in turn will result in a smaller capacity
requirement and hence a smaller investment.Some of these scenarios proposed can only be verified by
running trials on the ground to try out different configurations to understand the level of utilization. By
getting consistent feedback from the communities and running several pilot projects, designs could be
further optimized.
While some may argue that these approaches may just be a stop gap solution and diverts money
from ‘ideal’ forms of grid electrification, they overlook the fact that investment in such projects cost
many times more than decentralized generation and the immediate value these bootstrap approach create
could be immense. Savings from kerosene expenditure could be diverted to other use, working hours are
extended thus productivity increases and even the health impacts by sustained use of kerosene could be
minimized. It’s not clear that throwing a large scale developed world infrastructure at people who have
never had electricity is going to lead to instant wealth and good returns on the money spent electrifying.
But, these small solutions that have faster payback for the investors and provides safer,cleaner and
cheaper source of energy for the people might be right approach in moving forward and achieving the
energy access targets.
68
Page 85
DEDICATION AND ACKNOWLEDGEMENTS
I would like to thank my supervisor Dr. Ewen Mcpherson for being very supportive and understandingthroughout the period of this dissertation. Additionally, I would like to thank Anna Harnmeijer, fromScene Consulting, for meticulously going through the write-up and providing feedback throughout
this year. I would also like to thank Dr. Jamie Fleck from the University of Edinburgh, for his insightson the theories of innovation. Mr. Debajit Palit from The Energy and Research Institute (TERI) alsoprovided great feedback during the proposal stages of the research and Dr. Subhes Bhattacharya and theOASYS India project for inviting me to the conference at De Monfort University and for providing mewith great material for research.
Finally, I would like to thank the UK government scholarship program for supporting my studyhere at the University of Edinburgh.
69
Page 87
AP
PE
ND
IX
AAPPENDIX A
Design Templates orgaized in the following order:
• System design description for CASE - I (30 HH’s)
• System design description for CASE - II (Chilling centre + 100 HH’s)
• System design description for CASE - II (Grinding mill + 30 HH’s)
• System design description for CASE - III (Refrigeration + 50 HH’s)
71
Page 90
APPENDIX A. APPENDIX A
74
Page 93
BIBLIOGRAPHY
[1] IEA, World Energy Outlook.
Paris: International Energy Agency., 2011.
[2] Y. Xue and S. Xiao, “Generalized congestion of power systems: insights from the massive blackouts
in india,” Journal of Modern Power Systems and Clean Energy, vol. 1, no. 2, pp. 91–100, 2013.
[3] K. L. Joseph, “The politics of power: Electricity reform in india,” Energy Policy, vol. 38, pp. 503–
511, 2010.
[4] IED, Identifying the gaps and building the evidence base on low carbon mini-grids.
Francheville: Innovation Energie Developpement, 2014.
[5] S. Craine, E. Mills, and J. Guay, Clean Energy Services For All: Financing Universal Electrification.
San Francisco: Sierra Club, 2014.
[6] IEA, World Investment Outlook.
Paris: International Energy Agency., 2014.
[7] IFC, “From gap to opportunity:business models for scaling up energy access..” Washington DC,
2012.
[8] WEF, Scaling Up Energy Access through Cross Sector Partnerships.
Geneva: World Economic Forum, 2014.
[9] WEC, 2014 World Energy Trilemma Time to get real: the myths and realities of financing energy
systems.
London: World Economic Council, 2014.
[10] GSMA, The Mobile Economy: Sub Saharan Africa.
London: Groupe Speciale Mobile Association., 2014.
77
Page 94
BIBLIOGRAPHY
[11] S. Etzo and G. Collender, “The mobile phone ‘revolution’ in africa: Rhetoric or realty?,” African
affairs (adq045), 2010.
[12] D. Palit and A. Chaurey, “Off-grid rural electrification experiences from south asia: Status and best
practices,” Elsevier, vol. 15, no. 3, pp. 266–276, 2011.
[13] S. Rolland and G. Glania, Hybrid micro-grids for rural electrification - lessons learned.
Brussels: Alliance for Rural Electrification ARE, 2011.
[14] SBI, Scaling up Successful Micro-Utilities for Rural Electrification: Financing Instruments and
Stakeholder Interaction.
Berlin: Sustainable Business Initiative, 2013.
[15] S. Bulusar, Z. Friedman, P. Mehta, S. Mitra, and R. Sathre, 50 Breakthroughs: Critical scientific
and technological advancementneeded for sustainable global development.
Berkeley: Institute for Globally Transformative TEchnologies, Lawrence Berkeley National Lab,
2014.
[16] W. Bank, Designing Sustainable Off-Grid Rural Electrification Projects:Principles and Practices.
Washington DC: The World Bank Group, 2008.
[17] R. R. Borah, D. Palit, and S. Mahapatra, “Comparative analysis of solar photovoltaic lighting
systems in india,” Energy Procedia, vol. 54, pp. 680–689, 2014.
[18] P. Action, Poor’s people energy outlook.
Rugby: Practical Action, 2014.
[19] SE4ALL, Sustainable Energy for All, Action Agenda, Pathways for Concerted Action toward
Sustainable Energy for All.
New York: United Nations., 2012.
[20] IPCC, Renewable Energy Sources and Climate Change Mitigation: Summary for policy makers
and technical summary.
Geneva: Intergovernmental Panel on Climate Change., 2012.
[21] M. J. Bradshaw, “Global energy dilemmas:a geographical perspective,” The Geographical Journal,
vol. 176, no. 4, pp. 275–290, 2010.
78
Page 95
BIBLIOGRAPHY
[22] P. O. Odhengo, Measuring the Burden from Energy Price Reform on Vulnerable Households, Firms
and Design of Mitigating Measures- The Kenyan Experience.
Nairobi: United Nations Environment Programme, 2012.
[23] UNEP, “Green economy and trade and trends, challenges and opportunities..” Nairobi, 2013.
[24] T. E. Times, “India loses 3.1 billion units of electricity to transmission congestion in 2014-15.”
Retrieved 07 12, 2015, from, 2015.
[25] R. (2015), NATIONAL ENERGY AND PETROLEUM POLICY.
Nairobi: Ministry of Energy, 2015.
[26] G. C. Unruh, “Understanding carbon lock-in,” Energy Policy, vol. 28, no. 12, pp. 817–830, 2000.
[27] D. Kammen, P. Altsone, and D. Gershenshon, “Decentralized energy systems for clean electricity
access,” Nature Climate Change, vol. 5, no. 4, pp. 305–314, 2015.
[28] M. Edkins, External cost of electricity generation:Contribution to the Integrated Resource Plan 2
for Electricity.
Cape Town: University of Cape Town, 2010.
[29] H. Zerriffi, Making Small Work: Business Models for Electrifying the World.
Stanford: Stanford University, 2007.
[30] D. Miller, “Selling solar: The diffusion of renewable energy in emerging markets,” RD Management,
vol. 40, no. 2, pp. 209–210, 2010.
[31] S. Szabo, K. Bodis, T. Huld, and M. Moner-Girona, “Energy solutions in rural africa: mapping elec-
trification costs of distributed solar and diesel generation versus grid extension,” Environmental
Research Letters, vol. 6, p. 3, 2011.
[32] N. Scott, S. Batchelor, and . J. B. Ridley, Jonathon, THE IMPACT OF MOBILE PHONES IN
AFRICA.
London: Commission for Africa, 2004.
[33] B. Tenenbaum, C. Greacen, T. Siyambalapitiya, and J. Knuckles, From the bottom up: How Small
Power Producers and Mini-Grids Can Deliver Electrification and Renewable Energy in Africa.
Washington D.C: The World Bank Group, 2015.
79
Page 96
BIBLIOGRAPHY
[34] D. Group, THE BUSINESS CASE FOR OFF-GRID ENERGY IN INDIA.
The Climate Group, 2015.
[35] IFC, “Lighting asia - solar off grid lighting..” Washington D.C, 2012.
[36] D. Barnes and D. Foley, RURAL ELECTRIFICATION IN THE DEVELOPING WORLD: A SUM-
MARY OF LESSONS FROM SUCCESSFUL PROGRAMS.
Washington DC: Joint UNDP/World Bank Energy Sector Management Assistance Programme
(ESMAP, 2004.
[37] D. Schnitzer, D. Lounsbury, J. P. Carvalho, R. Deshmukh, J. Apt, and D. M. Kammen, Microgrids
for Rural Electrification: A critical review of best practices based on seven case studies.
Washington DC: United Nations Foundation, 2014.
[38] S. C. Bhattacharyya, Mini-Grids for Rural Electrification of Developing Countries: Analysis and
Case Studies from South Asia.
Springer, 2014.
[39] J. Watson, R. Byrne, and F. Morgan Jones M., Tsang, “What are the major barriers to increased use
of modern energy services among the world’s poorest people and are interventions to overcome
these effective?,” nvironmental Evidence CEE Review, vol. 11, 2012.
[40] S. R. Khandker, H. A. Samad, Z. K. Sadeque, M. Asaduzzaman, M. Yunus, and K. Haque, Surge
in Solar-Powered Homes: Experience in rural off grid Bangladesh.
Washington DC: World Bank Group, 2014.
[41] E. Martinot, A. Chaurey, D. Lew, J. R. Moreira, and N. Wamukonya, “Renewable energy markets
in developing countries,” Annual Review of Energy and the Environment, vol. 27, pp. 309–348,
2002.
[42] K. Reiche and W. Teplitz, Energy Subsidies: Why, When and How? A think Piece.
Eschborn: Deutsche Gesellschaft fur Technische Zusammenarbeit (GTZ) GmbH, 2009.
[43] C. Gradl and C. Knobloch, How to develop business and fight poverty.
Berlin: Endeva, 2010.
[44] WEF, Scaling Up Energy Access through Cross-sector Partnerships.
Cologny/Geneva: World Economic Forum, 2013.
80
Page 97
BIBLIOGRAPHY
[45] J. Weingart and D. Giovannuci, A Guide to Developing Agricultural Markets and Agro-enterprises.
Washington, DC: ESMAP Report. World Bank, 2002.
[46] D. Gershenson, M. Tilleard, and J. Cusack, Increasing Private Capital Investment into Energy
Access:The Case for Minigrid Pooling Facilities.
Paris: United Nations Energy Programme, 2015.
[47] DEVEX., “Empowering the poor through increasing access to energy - due diligence on potential
investment opportunities in mini-grid and distributed energy in india..” Retrieved July 22, 2015,
August 27.
[48] R. A. Cabraal, D. F. Barnes, and S. G. Agarwal, “Productive uses of energy for rural development,”
Annual Review of Environment and Resources, vol. 20, pp. 117–144, 2005.
[49] N. Thirumurthy, L. Harrington, D. Martin, L. Thomas, J. Takpa, and R. Gergan, Opportunities and
Challenges for Solar Minigrid Development in Rural India.
Colorado: National Renewable Energy Laboratory, 2012.
[50] G. Bekele and B. Palm, “Feasibility study for a standalone solar-wind-based hybrid energy system
for application in ethiopia,” Applied Energy, vol. 87, pp. 487–495, 2009.
[51] R. Sen and S. C. Bhattacharyya, “Off-grid electricity generation with renewable energy technologies
in india:an application of homer,” Renewable Energy, vol. 62, pp. 388–398, 2014.
[52] O. Hafez and K. Bhattacharya, “Optimal planning and design of a renewable energy based supply
system for microgrids,” Renewable Energy, vol. 45, pp. 7–15, 2012.
[53] K. Lau, M. Yousof, S. Arshad, and M. Anwari, “Yatim, a,” M. Performance analysis of hybrid
photovoltaic/diesel energy system under Malaysian conditions. Energy, vol. 35, pp. 3245–3255,
2010.
[54] A. A. Setiawan, Y. Zhao, and C. V. Nayar, “Design, economic analysis and environmental consid-
erations of mini-grid hybrid power system with reverse osmosis desalination plant for remote
areas,” Renewable Energy for Sustainable Development in the Asia Pacific Region, vol. 34,
no. 2, pp. 374–383, 2009.
[55] M. Kashem and M. Hoque, Design and analysis of a mini solar grid in remote area of Bangladesh.
Starkville: IEEE, 2009.
81
Page 98
BIBLIOGRAPHY
[56] USTDA, Assessing the business case for rural solar microgrids in India: A case study approach.
Arlington: United States Trade and Development Association, 2014.
[57] M. Dornan, “Solar-based rural electrification policy design: The renewable energy service company
(resco) model in fiji,” Renewable Energy, vol. 36, no. 2, pp. 797–803, 2011.
[58] X. Zhang and A. Kumar, “Evaluating renewable energy-based rural electrification program in
western china: Emerging problems and possible scenarios,” Renewable and Sustainable Energy
Reviews, vol. 15, no. 1, pp. 773–779, 2011.
[59] S. J. Schillebeeckx, P. Parikh, R. Bansal, and G. George, “An integrated framework for rural
electrification:adopting a user-centric approach to business model development,” Energy Policy,
vol. 48, pp. 687–697, 2012.
[60] TERI, “Solar micro-grids for livelihood enhancement in rural uttar pradesh:processes and baseline.”
Delhi, 2013.
[61] E. Cecelski, Briefing Paper prepared for a Brainstorming Meeting on Asia Alternative Energy
Policy and Project Development Support:Emphasis on Poverty Alleviation and Women.
Washington D.C: World Bank, 2000.
[62] E. Baldwin, J. N. Brass, S. Carley, and L. M. MacLean, “Electrification and rural development:
issues of scale in distributed generation,” Wiley Interdisciplinary Reviews: Energy and Environ-
ment, vol. 4, no. 2, pp. 196–211, 2014.
[63] M. R. Khan, DC Nanogrids: A Low Cost PV Based Solution for Livelihood Enhancement for Rural
Bangladesh.
San Francisco: University of California, Berkeley, 2014.
[64] A. Halff, B. K. Sovacool, and J. Rozhon, Energy Poverty: Global Challenges and Local Solutions
(2014 ed.).
Oxford: Oxford University Press, 2014.
[65] R. E. Fishbein, Survey of Productive Uses of Electricity in Rural Areas.
Washington D.C: The World Bank Group, 2003.
[66] M. Rammelt, Productive Uses of Energy: Opportunities for Rural Electrification.
Eschborn: Deutsche Gesellschaft fur Internationale Zusammenarbeit, 2015.
82
Page 99
BIBLIOGRAPHY
[67] V. Aggarwal, A. Fahey, H. Scheetz, F. Cc, L. H. Simonne, and W. J. Moilanen, S., Rural Energy
Alternatives in India:Opportunities in Financing and Community Engagement for Renewable
Energy Microgrid Projects.
Princeton: Woodrow Wilson School of International and Public Affairs, 2014.
[68] B. Zhao, X. Zhang, J. Chen, C. Wang, and L. GuoM, “Operation optimization of standalone micro-
grids considering lifetime characteristics of battery energy storage system,” IEEE transactions
on sustainable energy, vol. 4, no. 4, pp. 934–943, 2013.
[69] S. Groh, D. Philipp, B. E. Lasch, H. Kirchhoff, D. Islam, and K. D. Khan, M. R., The Battle of
Edison and Westinghouse Revisited: A Comparative Analysis of AC/DC Micro-grids for Rural
Electrification. Berkeley.
Energy and Resources Group, University of California, Berkeley, 2014.
[70] A. Ballesteros, E. Norford, T. Nagle, L. Yonavjak, and S. Alzner, “Implementation strategies
for renewable energy services in low-income,rural areas,” Washington D.C: World Resources
Institute, 2013.
[71] A. Kumar, P. M., D. P., and C. Akanksha, “Approach for standardization of off-grid electrification
projects,” . Renewable and Sustainable Energy reviews, vol. 13, no. 8, pp. 1946–1956, 2009.
[72] C. Jacques, Microgrid-as-a-Service Offers a Collaborative Model to the Conventional Macrogrid.
Boston: Lux Research, 2014.
[73] OMC, “Omc power homepage.” Retrieved 12 13, 2014, 2014.
[74] E. Hartvigsson, E. Ahlgren, M. Sverker, and J. Ehnberg, Rural Electrification Through Minigrids
in Developing Countries: Initial Generation Capacity Effect on Cost-Recovery.
Stockholm: Chalmers University of Technology, 2014.
[75] T. Ramachandraa, R. Jaina, and G. Krishnadas, “Hotspots for solar potential in india,” Renewable
and Sustainable Energy Reviews, vol. 15, no. 6, pp. 3178–3186, 2011.
[76] A. Castellano, A. Kendall, M. Nikomarov, and T. Swemmer, Brighter Africa :The growth potential
of the sub-Saharan electricity sector.
Johannesberg: Mckinsey and Company, 2015.
83
Page 100
BIBLIOGRAPHY
[77] IRENA, RENEWABLE ENERGY TECHNOLOGIES: COST ANALYSIS SERIES.
Abu Dhabi: International Renewable Energy Agency, 2012.
[78] J. W. Stevens and G. P. Corey, A Study of Lead-Acid Battery Efficiency Near Top-of-Charge and
the impact of PV system design.
Albuquerque: PVSC, 1996.
[79] H. Mashelenia and X. Carelseb, “Microcontroller-based charge controller for stand-alone photo-
voltaic systems,” Solar Energy, vol. 61, no. 4, pp. 225–230, 1997.
[80] “Price solar charge controller, price solar charge controller suppliers and manufacturers at al-
ibaba.com.” Retrieved 07 28, 2015, from, 2015.
[81] M. G. Prasanna, S. M. Sameer, and G. n. Hemavathi, “Financial analysis of solar photovoltaic
power plant in india,” Journal of Economics and Finance, pp. 9–15.
[82] M. Chandel, G. Agrawal, S. Mathur, and A. Mathur, “Techno-economic analysis of solar photo-
voltaic power plant for garment zone of jaipur city,” Case Studies in Thermal Engineering,
vol. 2, pp. 1–7, 2014.
[83] T. Lambert, P. Gilman, and P. Lilienthal, MICROPOWER SYSTEM MODELING WITH HOMER.
National Renewable Energy Laboratory, 2006.
[84] S. Rehmana, I. El-Aminb, and F. Ahmada, “Feasibility study of hybrid retrofits to an isolated
off-grid diesel power plant,” Renewable and Sustainable Energy Reviews, vol. 11, no. 4,
pp. 635–653, 2007.
[85] A. H. Mondal and M. Denich, “Hybrid systems for decentralized power generation in bangladesh,”
Energy for Sustainable Development, vol. 14, no. 1, pp. 48–55, 2010.
[86] A. Chaurey and T. Kandpal, “A techno-economic comparison of rural electrification based on solar
home systems and pv microgrids,” Energy Policy, vol. 38, no. 6, pp. 3118–3129, 2010.
[87] F. Power, “Perkins powered generating sets.” Retrieved 07 27, 2015, from, 2012.
[88] E. Mills, Technical and Economic Performance Analysis of Kerosene Lamps and Alternative
Approaches to Illumination in Developing Countries.
San Francsico: Lawrence Berkeley National Laboratory, 2003.
84
Page 101
BIBLIOGRAPHY
[89] “Solar powered milk chillers for rural india.” Retrieved 08 01, 2015, from, 2014.
[90] M. Swain, Energy use in food refrigeration Calculations, assumptions and data sources.
Bristol: Food Refrigeration and Process Engineering Research Centre (FRPERC), 2006.
[91] K. Sharma, Mini Milk Processing Plants at Dairy Farms for better Value Addition.
Ludhiana: Dairy Science College of Guru Angad Dev Veterinary and Animal Sciences, 2009.
[92] X. Lemaire, “Off-grid electrification with solar home systems: The experience of a fee-for-service,”
Energy for Sustainable Development, vol. 15, no. 3, pp. 277–283, 2011.
[93] A. Niez, COMPARATIVE STUDY ON RURAL ELECTRIFICATION POLICIES IN EMERGING
ECONOMIES.
Paris: IEA, 2010.
85