Best Practices For Risk-Based Forecasts Of Land Volatility For Corridor Management And Sustainable Communities Scan Team Report NCHRP Project 20-68A, Scan 10-01 Supported by the National Cooperative Highway Research Program January 2012 The information contained in this report was prepared as part of NCHRP Project 20-68A U.S. Domestic Scan, National Cooperative Highway Research Program. SPECIAL NOTE: This report IS NOT an official publication of the National Cooperative Highway Research Program, Transportation Research Board, National Research Council, or The National Academies.
Transcript
Best Practices For Risk-Based Forecasts Of Land Volatility For Corridor Management And Sustainable Communities
Scan Team ReportNCHRP Project 20-68A, Scan 10-01
Supported by the
National Cooperative Highway Research Program
January 2012
The information contained in this report was prepared as part of NCHRP Project 20-68A U.S. Domestic Scan,
National Cooperative Highway Research Program.
SPECIAL NOTE: This report IS NOT an official publication of the National Cooperative Highway Research
Program, Transportation Research Board, National Research Council, or The National Academies.
BEST PRACTICES FOR RISK-BASED FORECASTS OF LAND VOLATILITY FOR CORRIDOR MANAGEMENT AND SUSTAINABLE COMMUNITIES
AcknowledgmentsThe work described in this document was conducted as part of NCHRP Project 20-68A, the U.S. Domestic Scan program. This program was requested by the American Association of State Highway and Transportation Officials (AASHTO), with funding provided through the National Cooperative Highway Research Program (NCHRP). The NCHRP is supported by annual voluntary contributions from the state departments of transportation. Additional support for selected scans is provided by the U.S. Federal Highway Administration and other agencies.
The purpose of each scan and of Project 20-68A as a whole is to accelerate beneficial innovation by facilita rs who have implemented new practices and others who are able to disseminate knowledge of these new practices and their possible benefits to a broad audience of other users. Each scan addresses a single technical topic selected by AASHTO and the NCHRP 20-68A Project Panel. Further information on the NCHRP 20-68A U.S. Domestic Scan program is available at http://144.171.11.40/cmsfeed/TRBNetProjectDisplay.asp?ProjectID=1570.
This report was prepared by the scan team for Scan 10-01, Best Practices for Risk-Based Forecasts of Land Volatility for Corridor Management and Sustainable Communities, whose members are listed below. Scan planning and logistics are managed by Arora and Associates, P.C.; Harry Capers is the Principal Investigator. NCHRP Project 20-68A is guided by a technical project panel and managed by Andrew C. Lemer, PhD, NCHRP Senior Program Officer.
Marsha Fiol, Virginia Department of Transportation, Chair
Matthew W. DeLong, Michigan Department of Transportation
Polina Knaster, PE, New Jersey Department of Transportation
Charla Glendening, AICP, Arizona Department of Transportation
Jerri Bohard, Oregon Department of Transportation
Charlene Kay, PE, Washington State Department of Transportation
James H. Lambert, PE, PhD, D.WRE, University of Virginia
Shital A. Thekdi, University of Virginia
DisclaimerThe information in this document was taken directly from the submission of the authors. The opinions and conclusions expressed or implied are those of the scan team and are not necessarily those of the Transportation Research Board, the National Research Council, or the program sponsors. This document has not been edited by the Transportation Research Board.
6BEST PRACTICES FOR RISK-BASED FORECASTS OF LAND VOLATILITY FOR CORRIDOR MANAGEMENT AND SUSTAINABLE COMMUNITIES
Scan 10-01 Best Practices For Risk-Based Forecasts Of Land Volatility For Corridor Management And Sustainable Communities
P R E PA R E D BY
R E Q U E S T E D BY T H E
American Association of State Highway and Transportation Officials
Marsha Fiol, Virginia DOT, Chair
Matthew W. DeLong, Michigan DOT
Polina Knaster, PE, PMPNew Jersey DOT
Charla Glendening, AICPArizona DOT
Jerri Bohard, Oregon DOT
Charlene Kay, PE, Washington State DOT
James H. Lambert, PE, PhD, D.WRE,University of Virginia
Shital A. Thekdi, University of Virginia
Arora and Associates, P.C.Lawrenceville, NJ
January 2012
S C A N M A N AG E M E N T
The information contained in this report was prepared as part of NCHRP Project 20 68A U.S. Domestic Scan,
National Cooperative Highway Research Program.
SPECIAL NOTE: This report IS NOT an official publication of the National Cooperative Highway Research
Program, Transportation Research Board, National Research Council, or The National Academies.
I
TA B L E O F C O N T E N T S
Table of ContentsAbbreviations and Acronyms............................................................................................V
Tools, Processes, Functional Conditions, and Tool Compatibility with Functional Requirements................................................................................................10-2
IVBEST PRACTICES FOR RISK-BASED FORECASTS OF LAND VOLATILITY FOR CORRIDOR MANAGEMENT AND SUSTAINABLE COMMUNITIES
List of Appendices Appendix A: Amplifying Questions............................................................................. A-1 Appendix B: Scan Team Contact Information........................................................ B-1 Appendix C: Scan Team Biographical Sketches.................................................... C-1 Appendix D: Itinerary and Meeting Schedule........................................................ D-1 Appendix E: Host Agency Key Contacts................................................................... E-1 Appendix F: Sample of Corridor Analyses for Risk
Management of Corridors in Virginia............................................. F-1
List of FiguresFigure 2.1 ARC Unified Growth Management Policy map used with local agencies to forecast and plan future land use (Source: ARC)............................................... 2-2
Figure 2.2 Pennsylvania land development process aligned with high-occupancy permitting process. The procedures serve as a tool to coordinate with more than 2500 municipal governments. (Source: PennDOT)........................................ 2-4
Figure 2.3 Roles of stakeholders in the Pennsylvania coordination of transportation planning and land use decision-making. The approach guides coordination among the entities responsible for transportation corridor and risk assessments. (Source: PennDOT)............................................................................ 2-6
Figure 4.1 NORPC INDEX model output showing the impact of land use scenarios on organizational goals (Source: NORPC).................................................................... 4-2
Figure 5.1 Life cycle showing the impact of land use change on transportation corridor performance (Source: GDOT)..................................................................... 5-2
Figure 5.2 Example assessment of the development impact for proposed intersections (Source: PennDOT)............................................................................. 5-3
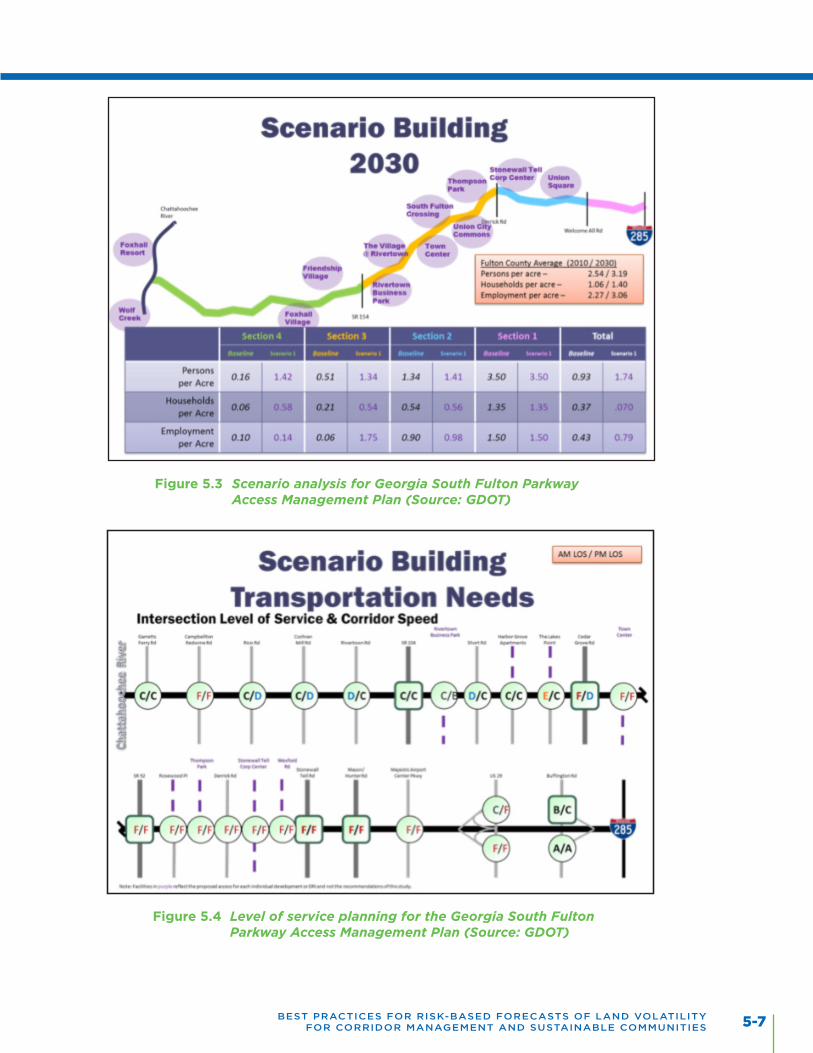
Figure 5.3 Scenario analysis for Georgia South Fulton Parkway Access Management Plan (Source: GDOT)......................................................................... 5-7
Figure 5.4 Level of service planning for the Georgia South Fulton Parkway Access Management Plan (Source: GDOT)............................................................. 5-7
Figure 5.5 Risk-based prioritization of corridor segments based on relationships among access points per mile, risk of land development prediction, and average daily traffic (Source: VDOT, University of Virginia)................................ 5-8
Figure 7.1 Transportation Program Development and Project Delivery Process (Source: PennDOT)................................................................................................... 7-2
Figure 8.1 Likelihood of land development along transportation infrastructure vulnerable to adjacent land development, an example for the Virginia Statewide Mobility System (Source: VDOT, University of Virginia)..................... 8-4
V
TA B L E O F C O N T E N T S
Figure 8.2 Risk management of land development adjacent to multimodal transportation corridors, suggesting the local triggers for land acquisition or other management actions (Source: VDOT, University of Virginia44).......................................................................................... 8-4
Figure F.1 Risk-based prioritization of corridors vulnerable to land use based on Virginia ACPS output for the US 17 corridor (Source: VDOT and University of Virginia)........................................................................... F-2
Figure F.2 Risk-based prioritization of corridors vulnerable to land use based on Virginia ACPS output for the US 1 corridor (Source: VDOT and University of Virginia).............................................................................................. F-2
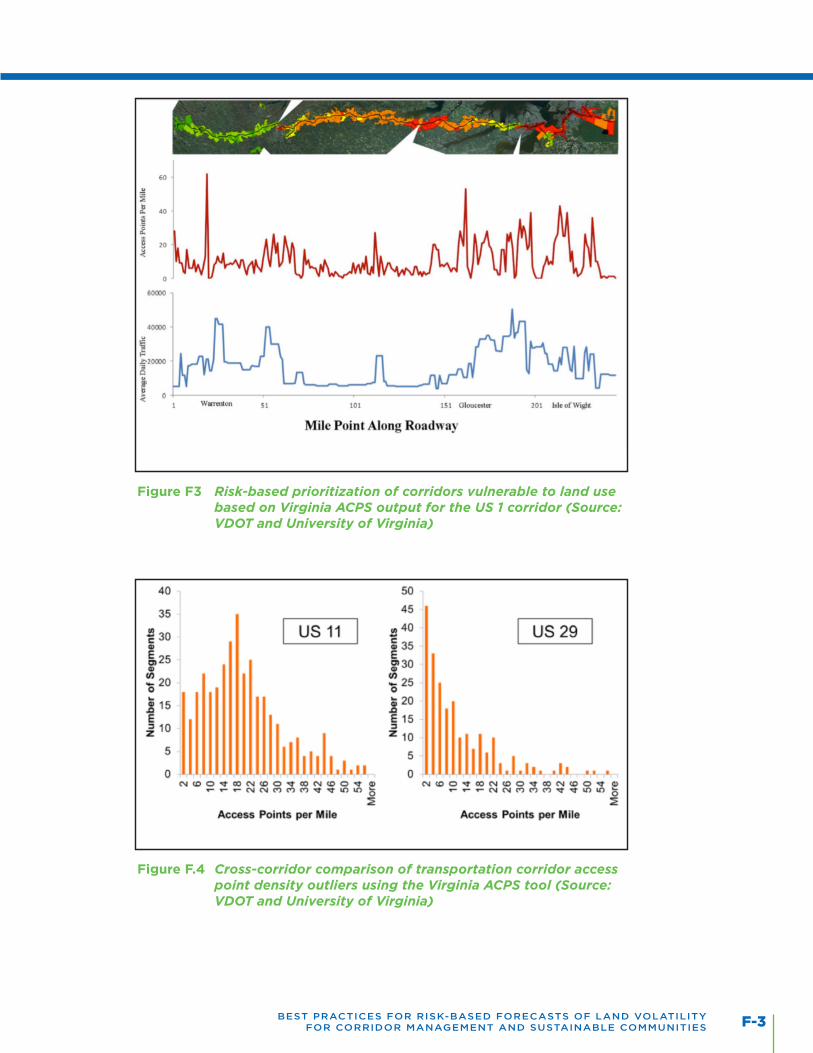
Figure F.3 Risk-based prioritization of corridors vulnerable to land use based on Virginia ACPS output for the US 52 corridor (Source: VDOT and University of Virginia).............................................................................................. F-3
Figure F.4 Cross-corridor comparison of transportation corridor access point density outliers using the Virginia ACPS tool (Source: VDOT and University of Virginia).............................................................................................. F-3
Figure F.5 Transportation corridor access point density count based on functional class using the Virginia ACPS tool.......................................................................... F-4
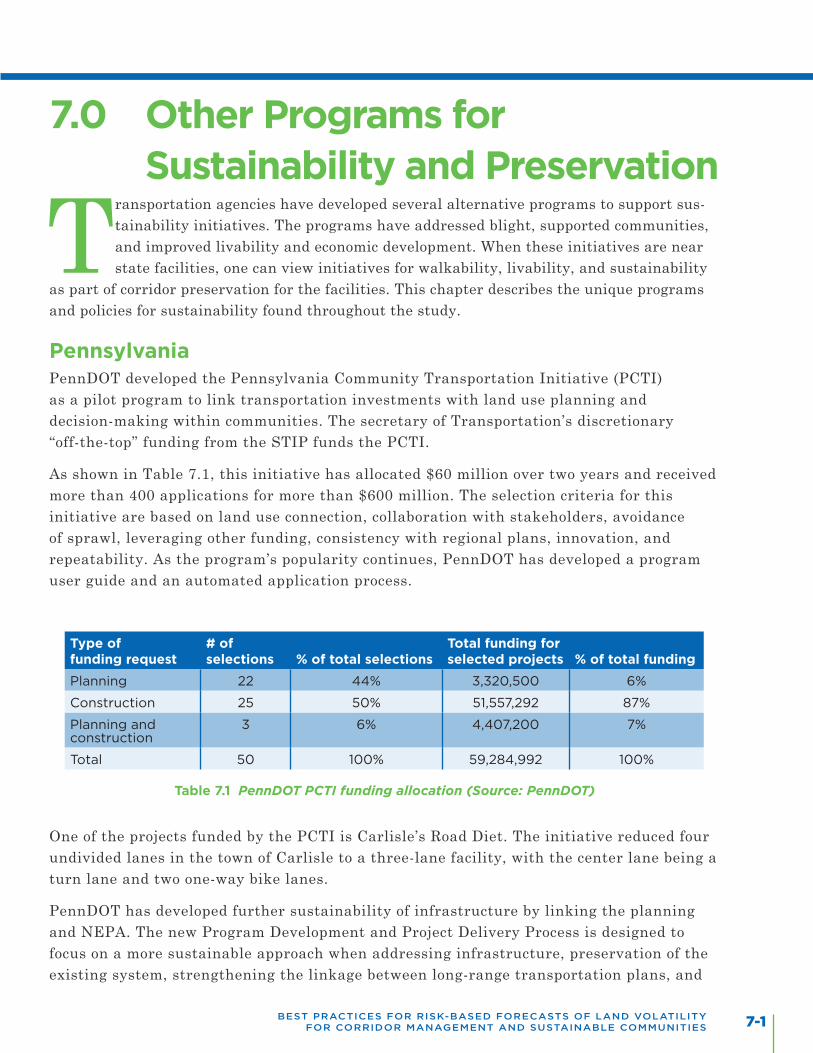
List of TablesTable 7.1 PennDOT PCTI funding allocation (Source: PennDOT)........................................ 7-1
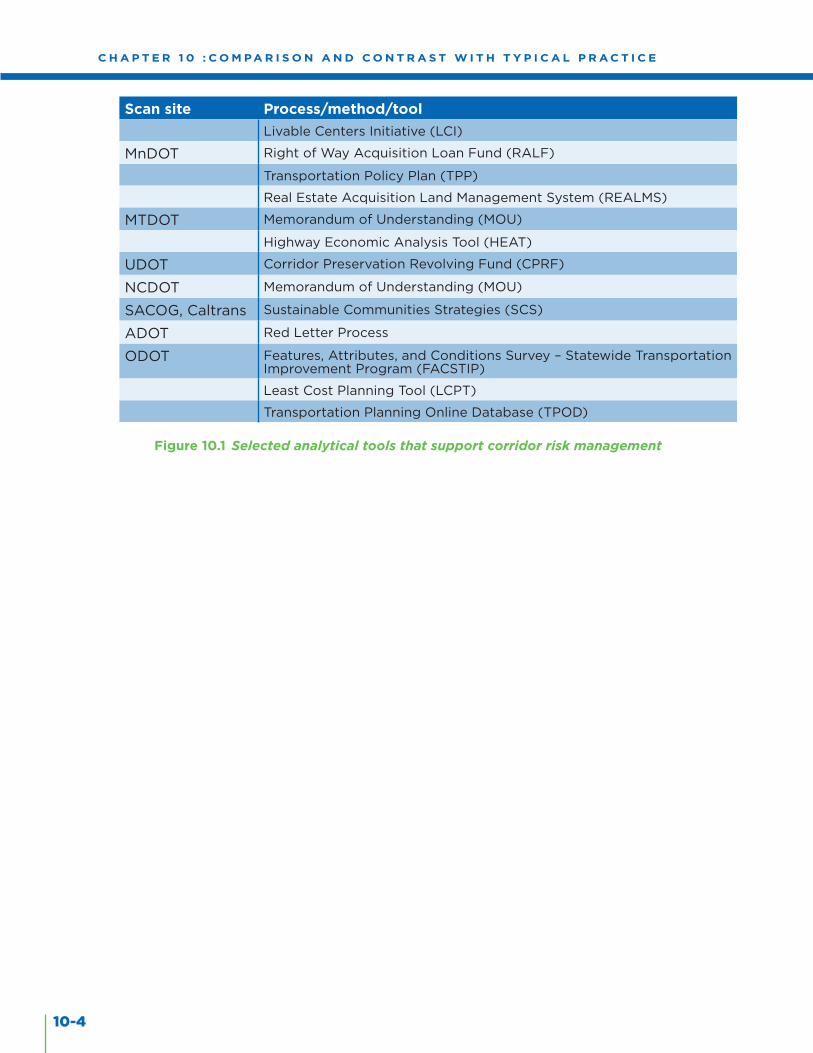
Table 10.1 Selected analytical tools that support corridor risk management........................ 10-3
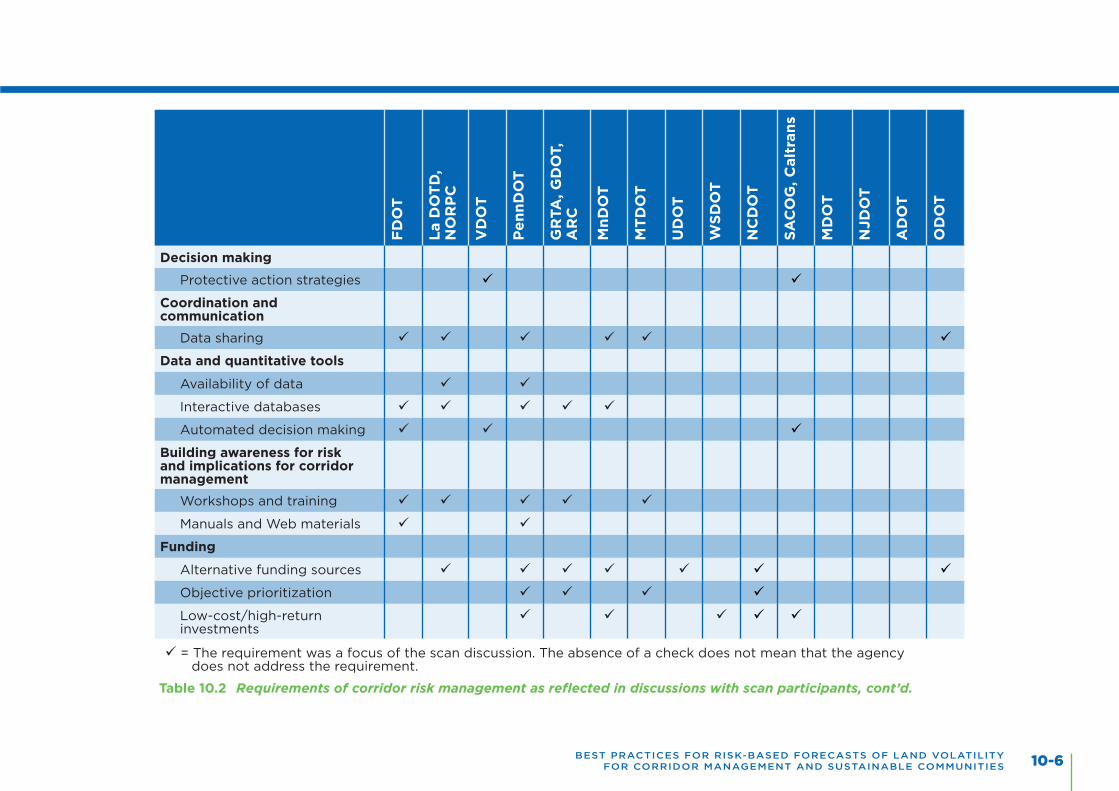
Table 10.2 Requirements of corridor risk management as reflected in discussions with scan participants.............................................................................................. 10-5
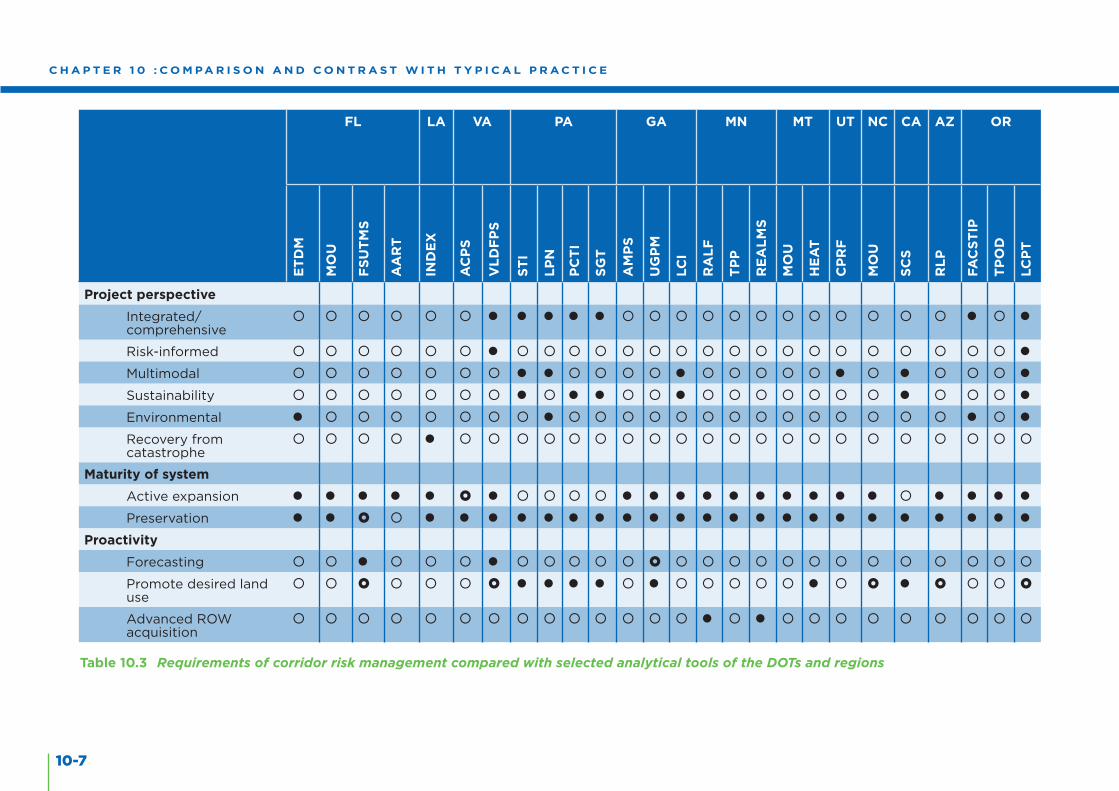
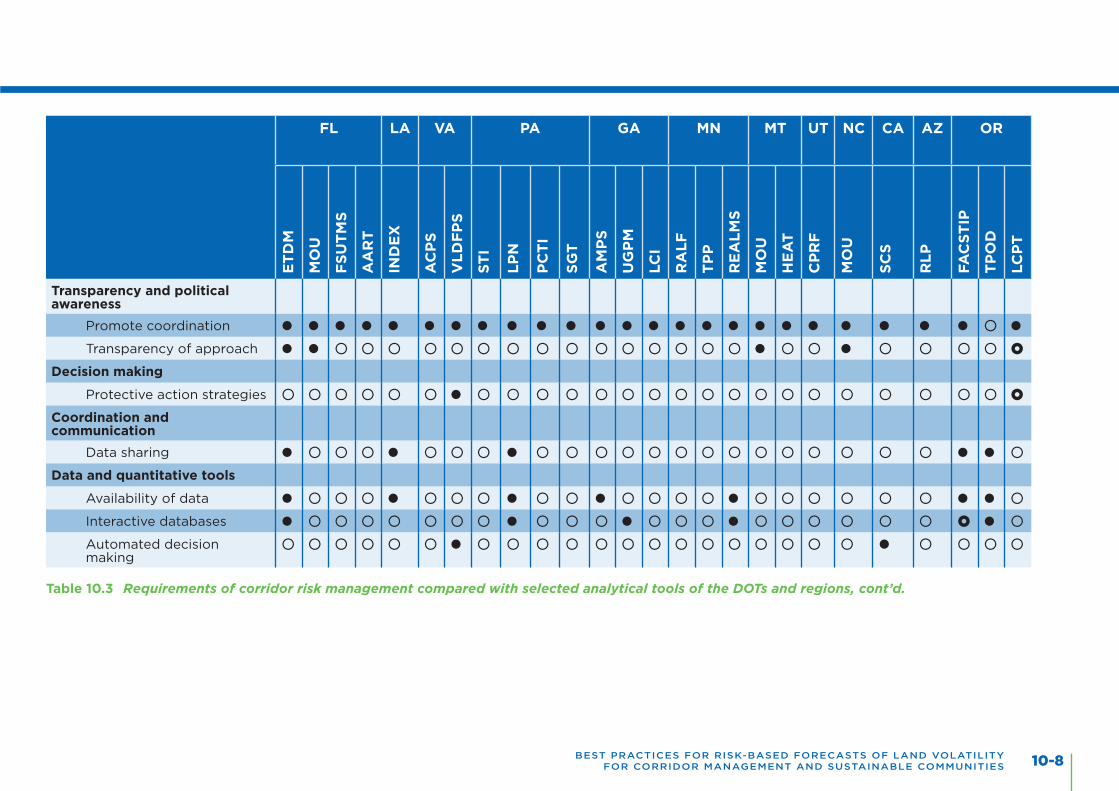
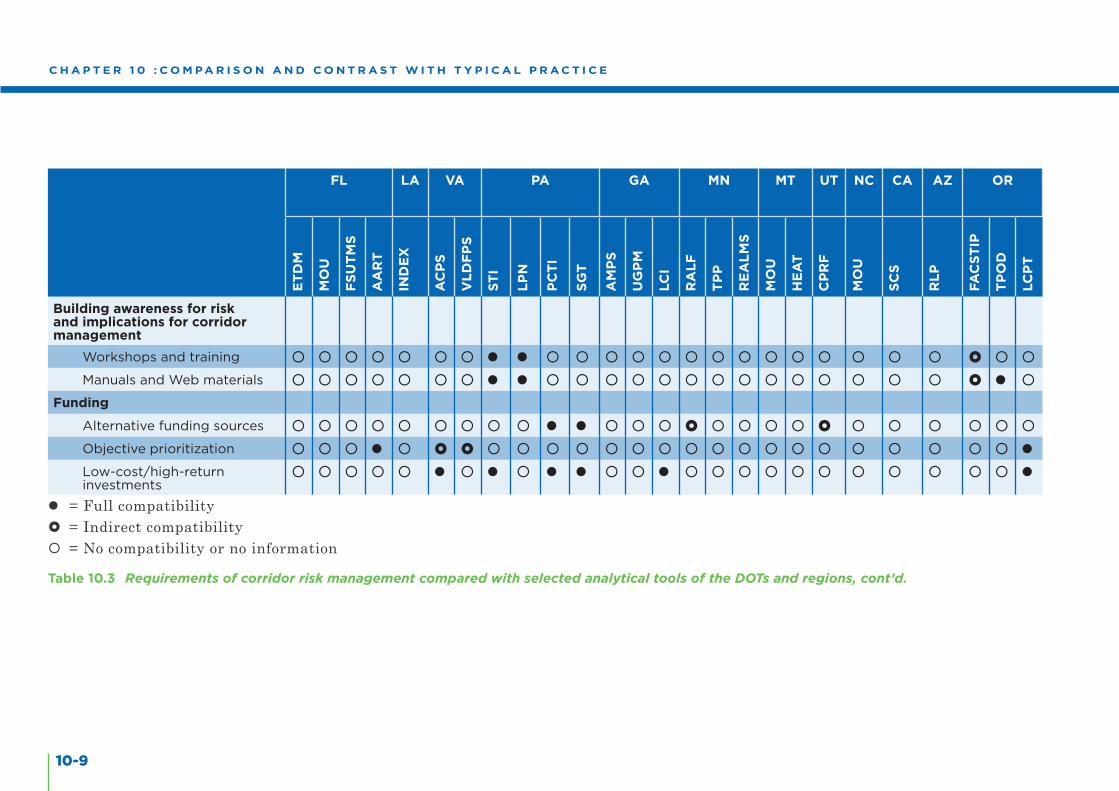
Table 10.3 Requirements of corridor risk management compared with selected analytical tools of the DOTs and regions................................................................ 10-7
Table D.1 Scan Itinerary and Meeting Schedule...................................................................... D-2
VI
A B B R E V I AT I O N S A N D A C R O N Y M S
Abbreviations and AcronymsAASHTO American Association of State Highway and Transportation Officials
AART Alternative Analysis Research Tool (Florida)
ACPS Access Control Prioritization System (Virginia)
ADOT Arizona Department of Transportation
AMPS Access Management Permit System (Georgia)
ARC Atlanta Regional Commission
Caltrans California Department of Transportation
CPRF Corridor Preservation Revolving Fund (Utah)
DOT Department of Transportation
ETDM Efficient Transportation Decision Making (Florida)
FACSTIP Features, Attributes, and Conditions Survey – Statewide Transportation Improvement Program (Oregon)
FDOT Florida Department of Transportation
FHWA Federal Highway Administration
FSUTMS Florida Standard for Urban Transportation Modeling Structure
VLDFPS Virginia Land Development Forecasting and Prioritization System
WSDOT Washington State Department of Transportation
E X E C U T I V E S U M M A R Y
ES-1BEST PRACTICES FOR RISK-BASED FORECASTS OF LAND VOLATILITY FOR CORRIDOR MANAGEMENT AND SUSTAINABLE COMMUNITIES
Executive SummaryIntroduction
Increasingly, federal initiatives for transportation funding are encouraging the development of land use and transportation facilities in a coordinated manner1. The ability to preserve multimodal corridors, through advanced right of way (ROW) acquisition and other methods while also providing efficient access for the desired economic growth of many communities,
is an emerging concern. This leads to a critical need for transportation agencies to evaluate and implement best practices in both the forecasting of land use and complementary corridor management practices. An innovative and unique reframing of this topic is evaluating uncoordi-nated land use as a source of risk to the performance of multimodal transportation corridors in the course of planning, programming, and funding project delivery.
Regional planning organizations and local governments encourage economic growth and land development while simultaneously protecting existing and future corridors and promoting sustainable economic development. Such growth often increases traffic demand on existing highways in the region and, at the same time, makes it more difficult to secure public ROW to provide for the increasing highway demand.
The deferral of advanced and/or concurrent addressing of road improvements resulting from land use development may present compounding societal costs, including higher ROW acquisition costs along with decreased corridor travel times, congestion, and safety concerns. On the other hand, reserving or acquiring land for future highway corridor expansion in anticipation of future demand presents a societal risk, as the land is no longer available for development, funding is obligated, and these actions may appear imprudent if growth does not occur as anticipated. Some transportation agencies have sought to understand the business risks associated with ROW and other land acquisition to support decision-making regarding the preservation of corridors that are predicted to experience increasing travel demands.
This report identifies and reviews analytical processes, methods, and tools that metropolitan/transportation planning organizations (MPOs/TPOs), departments of transportation (DOTs), and other agencies could use to address the following interrelated needs:
n Identifying corridors that may experience capacity issues due to development
n Addressing capacity issues in the development of long-range corridor plans
1 HUD-DOT-EPA Interagency Partnership for Sustainable Communities, Environmental Protection Agency, http://www.epa.gov/dced/partnership/index.html (accessed April 26, 2011)
ES-2
E X E C U T I V E S U M M A R Y
n Assessing the factors that contribute the most to the risks of undesired land uses related to volatile land use and the potential increased demand on the transportation system
n Forecasting land use changes and the associated demand on the transportation facilities by means of methods, models, and data analyses
n Integrating land use forecasts into transportation planning and capital programming with a multiyear horizon
The scan team met with DOT and MPO officials and others involved in state and regional transportation planning and local land use to identify best practices in problem framing, predictive modeling, gathering expert opinion, and using maps and other data to identify changes in potential land development. The findings and recommendations are in several key topic areas, including:
n Forecasting corridor development
n Understanding how transportation systems are influenced by land development
n Prioritizing funding allocations to maximize the beneficial economic effects of land development
n Protecting corridors and communities
n Protecting existing corridors to ensure the facility’s function
The following summarizes some general observations.
n Effective corridor management and risk management address the planning goals and expectations of local government, recognizing the various arenas in which these government officials operate.
n The uniqueness of local conditions can be leveraged to enhance the economic development opportunities in the area.
n The ability to identify when real-estate acquisition or other functions/actions should be triggered based on corridor preservation modeling tools. These tools may prove beneficial in a comprehensive approach to economic development. The need to employ such tools extends across both developed and undeveloped areas.
n Agencies must consider what effective actions can be taken in lieu of expending agency funds in the near term, saving public funds in the long term. Furthermore, agencies should distinguish among the 10- to 30-year planning horizons and the five-year construction or maintenance program’s horizon.
The team’s review of selected existing processes, methods, and tools supports a selection and integration of analytical methods that are appropriate for local conditions. The results will enable planners to compare, prioritize, and benchmark needs for risk management of land
ES-3BEST PRACTICES FOR RISK-BASED FORECASTS OF LAND VOLATILITY FOR CORRIDOR MANAGEMENT AND SUSTAINABLE COMMUNITIES
development that is adjacent to transportation corridors. These results can be used to advance nationwide Federal Highway Administration (FHWA) initiatives (e.g., the HUD-DOT-EPA Partnership for Sustainable Communities2) by lowering construction and operations costs, promoting reliable access to employment, and leveraging federal policies.
Purpose and ScopeThe scan’s purpose was to investigate how MPOs, DOTs, and other agencies have used organizational processes, analytical methods, and data-management tools to address the following issues:
n Identifying corridors that may experience capacity issues due to development
n Addressing capacity issues in the development of long-range corridor plans
n Assessing factors that contribute most to the risk of adjacent land use
n Forecasting land use changes and the associated demand on the transportation facilities by means of methods, models, and data analysis
n Using methods, models, and data to forecast land uses adjacent to transportation facilities
n Integrating land use forecasts into transportation plans with a multiyear horizon
The scan participants represented localities, MPOs, economists, state-level DOTs, and researchers with experience coordinating land use planning and transportation. The states surveyed included California, Florida, Georgia, Louisiana, Minnesota, Montana, North Carolina, Pennsylvania, Utah, Virginia, and Washington. The results also include key findings from the scan team members’ states: Arizona, Michigan, New Jersey, Oregon, Virginia, and Washington. The scan addressed framing problems, using predictive modeling, gathering expert opinion, using maps and other data to identify potential development, and using procedural/methodological support for corridor management.
General Findings and ObservationsThe scan identified processes, methods, and tools that are currently in use and available to be integrated, appropriate for local conditions, for corridor management and risk management. Among other findings, a risk-based approach to corridor preservation was developed as the Virginia DOT Access Control Prioritization System (ACPS) and the Virginia Land Development Forecasting and Prioritization System (VLDFPS). Other processes, methods, and tools can complement and supplement a risk-informed approach.
2 HUD-DOT-EPA Partnership for Sustainable Communities, http://www.epa.gov/smartgrowth/partnership/index.html
ES-4
E X E C U T I V E S U M M A R Y
The scan identified the significant benefit of partnerships among leaders of a region at multiple levels. Areas embracing common goals and working in a partnership with coordination and cooperation among several levels of governance were able to manage the risks of land use changes for their transportation corridors more effectively. Agencies such as the Pennsylvania, Georgia, and Florida DOTs encourage coordination by means of data sharing and interactive databases. Agencies such as the Montana and North Carolina DOTs encourage coordination through Memoranda of Understanding (MOU) with local agencies.
Several sites the scan team visited are engaged in proactive, multi-stakeholder initiatives for land use by promoting an agreed-upon desired land use and performing advanced ROW acquisition. The Metropolitan Council of the Minneapolis-St. Paul metropolitan area, the Utah DOT, and the Washington State DOT are progressive for managing advanced ROW acquisition programs through use of a ROW revolving fund.
Pennsylvania DOT’s guidance manuals and its State Smart Transportation initiative both incorporate sustainability principles. Programs such as the Atlanta Regional Commission’s (ARC’s) Livable Centers Initiative (LCI), the Sacramento Council of Governments’ (SACOG) Sustainable Communities program, and the New Orleans Regional Planning Commission’s (NORPC’s) Complete Streets initiative have developed sustainability programs to fit the unique conditions of their areas.
A few innovative tools for increased objective and automated modeling of the transportation and land use system include the Florida DOT’s Florida Standard for Urban Transportation Modeling Structure (FSUTMS) and Alternative Analysis Research Tool (AART), and Montana DOT’s Highway Economic Analysis Tool (HEAT).
It remains a challenge for DOTs and regional planning organizations across the U.S. to:
n Select and assemble from the above-identified methods an effective and appropriate solution for corridor preservation and management
n Monitor and evaluate the success of such initiatives to reduce costs/resources and gain efficiencies
n Address current and future funding constraints
RecommendationsA comprehensive analytical process for corridor management may not have been realized yet in any region/state of the U.S. Nevertheless, individual DOTs and MPOs exhibit worthy efforts to address the issue. They have identified components of the methodology that will likely eventually be part of such a comprehensive approach. This scan identifies the components/features that reflect the special conditions and needs of their respective regions, states, and localities, as well as multiple attempts by various states, MPOs, and other planning organizations to address the issue and satisfy the need to manage the risk to existing and future corridors. Individual DOTs and MPOs are encouraged to identify and adopt relevant
ES-5BEST PRACTICES FOR RISK-BASED FORECASTS OF LAND VOLATILITY FOR CORRIDOR MANAGEMENT AND SUSTAINABLE COMMUNITIES
components that can be applied to their evolving comprehensive corridor management approaches.
An integration of analytical methods will be unique to local conditions, including available funding, political support, leadership, and commonality of goals. Agencies and regional organizations should consider the following processes, methods, and information tools as they move toward an integrated approach to corridor management:
n Monitoring/tracking of key decision points across agencies and stakeholders, by need and by project, as implemented by Florida DOT
n Systematically documenting purpose, need, existing land use, potential environmental impacts, and narrowing of potential alternatives during the program-development process, as implemented by Pennsylvania DOT
n Coordinating with localities and sharing databases for land use and transportation facilities, as implemented by NORPC
n Systematically documenting and reviewing factors that may impact project scopes, schedules, and budgets prior to a project being programmed on a Transportation Improvement Plan (TIP), as implemented by Pennsylvania DOT
n Educating local authorities and citizens about the factors involved in land use and transportation, as implemented by Montana DOT
n Balancing transportation innovation with the memory/recovery of legacy communities and facilities through data collection and analysis, as implemented by NORPC
n Analyzing the risk of adjacent land development, considering the current densities of access points, forecasts of land development, and current and forecasted travel demands, as implemented by Virginia DOT
n Prioritizing and filtering needs for near-term, mid-term, and long-term action of planners, developers, and citizens, as implemented by Virginia DOT
The details of particular processes, methods, and information tools that support the above summary are provided in the body of this report.
C H A P T E R 1 : I N T R O D U C T I O N
1-1BEST PRACTICES FOR RISK-BASED FORECASTS OF LAND VOLATILITY FOR CORRIDOR MANAGEMENT AND SUSTAINABLE COMMUNITIES
1.0 Introduction
This chapter provides background and the purpose and scope of the scan. Related literature regarding risk and corridor management, information about the scan team and the agencies and organizations visited, and the scan’s interview approach and investiga-tive methods are also provided.
BackgroundExamples of Local Conditions Influencing Corridor Management
An emphasis of the scan was to find which and how local conditions influence the approaches to corridor management and risk management. This section provides a useful example of such influence.
Land use has been a required consideration for the past 50 years through federal legislation including the 1962 Federal-Aid Highway Act, the Intermodal Surface Transportation Efficiency Act, the Transportation Efficiency Act for the 21st Century, and Safe, Accountable, Flexible, and Efficient Transportation Equity Act: A Legacy for Users.
The Federal-Aid Highway Act3 is notable, stating the importance of the connection between land use and infrastructure. This legislation requires that long-range transportation plans be developed in consultation with agencies responsible for land use management.
The Intermodal Surface Transportation Efficiency Act4 (ISTEA) required long-range planning to consider local and state goals and the transportation planning process to consider impact of policy on land use. The Transportation Equity Act for the 21st Century5 (TEA-21), which replaced ISTEA, also promotes coordination between transportation and land use.
The current Safe, Accountable, Flexible, and Efficient Transportation Equity Act: A Legacy for Users6 (SAFETEA-LU) continues the trend of recognizing the need for coordination of transportation planning and land use through a planning factor. It states a need to “protect and enhance the environment, promote energy conservation, improve the quality of life, and promote consistency between transportation improvements and state and local planned growth and economic development patterns.” Additionally, several states require a transportation plan that functionally classifies roads as part of the comprehensive plan.
3 USC Chapter 1 – Federal-Aid Highways, http://uscode.house.gov/download/pls/23C1.txt 4 Intermodal Surface Transportation Efficiency Act of 1991 – Summary, http://ntl.bts.gov/DOCS/ste.html (accessed July 5, 2011) 5 TEA-21 – A Summary, Table of Contents, http://www.fhwa.dot.gov/tea21/sumtoc.htm (accessed July 5, 2011) 6 23 USC Chapter 1 – Federal-Aid Highways, http://uscode.house.gov/download/pls/23C1.txt
1-2
C H A P T E R 1 : I N T R O D U C T I O N
Literature Related to Land Use Forecasting and Analysis
The following technical tools are useful in understanding land-development forecasting and the corridor decision-making process.
In the past, localities have used various methods in their long-range transportation planning process to identify corridors that would benefit from protection. Stokes et al.7 identify corridors based on capacity analysis procedures, such as those described in the Highway Capacity Manual8. Highways that currently have or are projected to have an average annual daily traffic in excess of 5,000 vehicles were considered candidates for corridor preservation programs.9 Other types of analysis used to predict land-development changes include scenario generation and evaluation models, urban economic models, and integrated transportation and land use models.10,11
Several models have been developed to predict land use changes. Lowry models were developed to project land use using demographic and economic data.12 Recent technological advances have allowed for greater use of geographical computation in land use forecasting. Sklar and Costanza incorporated spatial models to analyze watershed land use change.13 Pijanowski et al. couple geographic information systems (GIS) with artificial neural networks to learn patterns of development and forecast land use changes on Michigan’s Grand Traverse Bay Watershed.14 Turner used transition probability matrices to estimate rates of change between land use types.15 Brown et al. modeled land cover change using aerial photography and regression models.16
7 Stokes, RW, ER Russell, and BK Vellanki, Recommended corridor preservation program for Kansas highways, K-TRAN: KSU- 93-1, Kansas State University for the Kansas Department of Transportation, Manhattan, 1994 8 Highway Capacity Manual 2010 (HCM2010), http://www.trb.org/Main/Blurbs/164718.aspx 9 Kleinburd, R, Corridor Preservation in Delaware, Second National Access Management Conference, pp 409–414, National Technical Information Service, Springfield, VA, 1996 10 Johnston, RA and MJ Clay, A graduate course comparing the major types of urban models, UCD-ITS-RR-04-8, Institute of Transportation Studies, Davis, CA, 2004 11 Waddell, P, UrbanSim: Modeling urban development for land use, transportation and environmental planning, Journal of the American Planning Association, 2002, 68(3):297–314 12 Lowry IS, A Model of Metropolis, RM-4035-RC, The RAND Corporation, Santa Monica, CA, 1964 13 Sklar, F and R Costanza, The Development of Dynamic Spatial Models for Landscape Ecology: A Review and Prognosis, Quantitative Methods in Landscape Ecology, MG Turner and R Gardner (Ed), Springer-Verlag, New York, 1991, pp 239–288 14 Pijanowski, BC, DG Brown, BA Shellito, and GA Manik, Using neural networks and GIS to forecast land use changes: a Land Transformation Model, Computers, Environment and Urban Systems, 2002, 26(6):553–575 15 Turner, MU, Spatial Simulation of Landscape Change in Georgia: A Comparison of 3 Transition Models, Landscape Ecology, 1987, 1(1):29–36 16 Brown, DG, BC Pijanowski, and JD Duh, Modeling the relationships between land use and land cover on private lands in the Upper Midwest, USA, Journal of Environmental Management, 2000, 59(4):247–263
1-3BEST PRACTICES FOR RISK-BASED FORECASTS OF LAND VOLATILITY FOR CORRIDOR MANAGEMENT AND SUSTAINABLE COMMUNITIES
Researchers have applied an existing cellular automaton model, SLEUTH17, to the Washing-ton-Baltimore metropolitan region, which has experienced rapid land use change in recent years. The model was calibrated using a historic time series of developed areas derived from remote sensing imagery, and future growth was projected out to 2030 assuming different policy scenarios.18 Other types of models used to predict land development include scenario generation and evaluation models, urban economic models, and integrated transportation and land use models.19,20
The use of state-transition modeling has been documented in various infrastructure protection projects. For example, Arizona’s Pavement Management System utilizes Markov modeling and linear optimization techniques to compute optimal policies for corridor maintenance.21 More recently, highway agencies across the nation have begun to utilize the PONTIS bridge management system, most notably known for modeling bridge element deterioration according to a Markov process. The usage of state-transition modeling is often associated with analysis of optimal steady-state policies that intend to minimize lifecycle costs.22
Risk Assessment and Management Methods Related to Corridor Protection
The applicability of risk assessment and management methods to address land development adjacent to multimodal corridors is an important consideration in this research.
Risk assessment methodology focuses on these three questions23:
n What can go wrong?
n What are the likelihoods?
n What are the consequences?
What can go wrong addresses congestion and the safety concerns resulting from uncoordinated land development. What are the likelihoods, the primary focus of this report, forecasts probabilities of land development on corridors. What are the consequences refers to the societal costs of congestion on passenger productivity and goods movement, costly right of way (ROW) acquisition, retrofits, rezoning, and access management on transportation corridors and agencies.
17 Slope, land use, exclusion, urban extent, transportation, and hill shade 18 Jantz, CA, SJ Goetz, and MK Shelley, Using the SLEUTH urban growth model to simulate the impacts of future policy scenarios on urban land use in the Baltimore–Washington metropolitan area, Environment and
Planning B: Planning and Design, 2004, 31(2):251–271 19 Johnston, RA and MJ Clay, A graduate course comparing the major types of urban models, UCD-ITS-RR-04-8, Institute of Transportation Studies, Davis, CA, 2004 20 Waddell, P, UrbanSim: Modeling urban development for land use, transportation and environmental planning, Journal of the American Planning Association, 2002, 68(3):297–314 21 Golabi, K, R Kulkarni, and G Way, A Statewide Pavement Management System, Interfaces, 1982, 12(6):5–21 22 Golabi, K and R Shepard, Pontis: A System for Maintenance Optimization and Improvement of U.S. Bridge Networks, Interfaces, 1997, 27(1):71–88 23 Kaplan, S and BJ Garrick, On the quantitative definition of risk, Risk Analysis, 1998, 1(1):11–27
1-4
C H A P T E R 1 : I N T R O D U C T I O N
Risk management methodology introduces three additional questions :24
n What can be done?
n What are the trade-offs?
n What are the impacts of current decisions to future options?
What can be done refers to alternatives (e.g., access management and ROW acquisition) that can be taken to avoid the consequences of uncoordinated land development. What are the trade-offs addresses trade-offs among all costs, benefits, and risks. What are the impacts addresses the impacts of current corridor preservation decisions on future options.
Literature Related to Corridor Management
The scan team performed a literature review prior to the tour and compiled relevant information for corridor management and risk management.
Virginia
The team discovered a singular example of relating corridor management with risk management and forecasts of land use along the corridor. The Virginia DOT and the University of Virginia have developed forecasts of the risk of land-development changes and the associated potential increased demand on transportation assets for the primary systems in several of the commonwealth’s counties25,26,27. The DOT and the statewide multimodal planning process (VTrans28) have among their charges a focus on land use and access management in corridor analyses with 10- and 20-year horizons, with less attention to the five-to-10-year horizon.
TexasThe Texas Transportation Institute addressed corridor management, corridor preservation, and simulation of ROW acquisition decision support in several reports. A particular effort has developed decision-making support for early ROW acquisitions29. This model utilized historical ROW acquisition information to analyze statistical information for simulation and optimization tools. The tools provide decision support as optimal strategies for use of early ROW acquisition methods. The institute has also presented related workshops on corridor management and preservation at the local level.
24 Haimes, YY, Risk modeling, assessment, and management (2nd ed), Wiley, New York, 2004 25 University of Virginia Center for Risk Management of Engineering Systems, Land Development Risk Analysis for the Statewide Mobility System, Charlottesville, undated, www.virginia.edu/crmes/corridorprotection/ (accessed January 28, 2011) 26 Linthicum AS and JH Lambert, Risk management for infrastructure corridors vulnerable to adjacent land development, Journal of Risk Research, 2010, 13(8): 983–1006 27 Thekdi SA and JH Lambert, Decision Analysis and Risk Models for Land Development Affecting Infrastructure Systems, Risk Analysis, in publication (2012) 28 Virginia Office of Intermodal Planning and Investment, http://vtrans.org/ 29 Krugler PE, CM Chang-Albitres, RM Feldman, S Butenko, DH Kang, R Seyedshohadaie, Development of Decision-Making Support Tools for Early Right of Way Acquisitions, Texas Transportation Institute, http://tti.tamu.edu/documents/0-5534-2.pdf
1-5BEST PRACTICES FOR RISK-BASED FORECASTS OF LAND VOLATILITY FOR CORRIDOR MANAGEMENT AND SUSTAINABLE COMMUNITIES
Pennsylvania
Several studies authored by the Pennsylvania DOT explored aspects of smart growth and land development within a transportation decision-making context. Its 2009 report Policies and Procedures for Transportation Impact Studies30 discusses steps toward municipal involvement, smart transportation principles, and alternative transportation plans.
MinnesotaThe Minnesota DOT developed a method to identify where economically efficient investments could be made to protect against unexpected or uncoordinated corridor development in the regions surrounding Minneapolis-St. Paul. The DOT has documented the use of land use, income trending, employment trending, and land values within corridor studies31. The agency’s assessment of transportation and land use decision making in the Twin Cities region led to its development of a model for metropolitan governance32. This study recommends stronger policy toward transit-ori-ented development, leading to infrastructure savings and local government coordination.
ColoradoThe Denver Regional Council of Governments developed the Mile High Compact . This voluntary agreement among Denver metro-area cities and counties enables growth management outlined in the Metro Vision plan. The plan identifies areas where growth is expected to occur and aligns transportation investments accordingly. It also emphasizes the need for ROW preservation in developing areas and sustainable mobility.
CaliforniaThe Sacramento Region Blueprint, which links land use and transportation, implemented a set of defined principles to plan transportation investments. The Blueprint growth principles35 include initiatives for mixed use developments and natural resources conservation. In support of the Blueprint vision36, land allocation and growth forecasts were created for evaluation during regional-scale, long-term scenario planning.
30 Policies and Procedures for Transportation Impact Studies Related to Highway Occupancy Permits, ftp://ftp.dot.state.pa.us/public/Bureaus/BOMO/MC/FinalTISGuidelines.pdf 31 CH2M Hill and Center for Transportation Research and Education Iowa State University, Interstate 394 Business Impact Study: Research Summary and Key Findings, http://www.dot.state.mn.us/row/pdfs/FINAL_I-394_Business_Impact_Study.pdf 32 Minnesota Center for Environmental Advocacy, Planning to Succeed? An Assessment of Transportation and Land Use Decision-making in the Twin Cities Region, January 2011, http://www.tlcminnesota.org/pdf/Planning%20to%20Succeed%20PRINTED.pdf 33 Denver Regional Council of Governments. Mile High Compact, http://www.drcog.org/documents/MHC%20signature%20page%208.5%20x%2011.pdf 34 Denver Regional Council of Governments. Metro Vision 2035 Plan, http://www.drcog.org/documents/2011%20MV%202035%20Plan%20for%20Web5-12-11.pdf 35 Sacramento Area Council of Governments, Discussion Draft Blueprint Preferred Scenario for 2050 Map and Growth Principles, http://www.sacregionblueprint.org/sacregionblueprint/the_project/principles.pdf 36 Sacramento Area Council of Governments, Sacramento Region Blueprint: Transportation and Land Use Plan, April 2010, http://www.sacregionblueprint.org/implementation/pdf/blueprint-book.pdf
1-6
C H A P T E R 1 : I N T R O D U C T I O N
The San Diego Association of Governments’ comprehensive land use and regional growth projects have emphasized a need for the consideration of future land development within the regional comprehensive plan. The goals of the plan include the integration of land development and transportation, as well as a focus on encouraging population and job growth away from rural areas in order to make more efficient use of existing urban infrastructure.
Federal Highway AdministrationIn 2005, the FHWA Office of Real Estate Services sponsored a scan to study best practices in advance acquisition and corridor preservation37. This study considered advance acquisition practices emphasizing the need to identify critical parcels and rights of way early in the land-development process. It also explored challenges in funding for ROW acquisition in expectation of the congestion and increased demand resulting from adjacent land development (e.g., the increased role of public/private partnerships in addressing funding shortfalls).
The FHWA Office of Real Estate Services and Office of Planning sponsored a scan in 2003 to examine the integration of ROW, planning, environment, and design38. The topics included:
n Right-of-Way and Planning Aspects of California’s Design Sequencing
n Integration Solutions: Right-of-Way, Planning, Environment, and Design
n Right-of-Way and Planning Aspects of Access Management
Objectives, Purpose, and ScopeWith the above knowledge of past efforts, this scan focused on characterizing how MPOs, DOTs, and other agencies have used analytical methods, including risk-based forecasting and related analysis, to support their activities, including:
n Identifying corridors that may experience capacity issues due to development
n Addressing capacity issues in the development of long-range corridor plans
n Assessing factors that contribute most to risk of adjacent land use
n Forecasting land use changes and the associated demand on the transportation facilities by using methods, models, and data analysis
n Integrating land use forecasts into transportation plans with a multiyear horizon
37 Right of Way Innovation Domestic Scan – Realty – FHWA, http://www.fhwa.dot.gov/realestate/scans/richfreport.htm (accessed July 5, 2011) 38 Final Report – FHWA Right-of-Way and Planning Innovation Domestic Scan – Realty – FHWA, nd, http://www.fhwa.dot.gov/realestate/scans/sffreport.htm
1-7BEST PRACTICES FOR RISK-BASED FORECASTS OF LAND VOLATILITY FOR CORRIDOR MANAGEMENT AND SUSTAINABLE COMMUNITIES
The scan team engaged in a dialogue with DOT and MPO officials and others involved in state and regional land use and transportation planning to identify best practices in problem framing, predictive modeling, gathering expert opinion, and using GIS and other data to identify initial and potential development. The scan’s results focus on the several key issues, including:
n Forecasting corridor development
n Understanding how transportation improvements are influenced by land development
n Prioritizing funding allocations to maximize the beneficial effects of land development
n Protecting rural corridors and communities
Corridor management should address the planning goals and expectations of local government, recognizing the various arenas in which these government officials operate. Readers should keep the unique nature of local conditions in mind while reading this report.
A key issue of corridor management is to better understand when real-estate acquisition or other functions should be triggered, according to a corridor-preservation model. The scope of interest is across both developed and undeveloped areas. The intent of the scan was to consider what effective actions can be taken to avoid expending agency funds in the near term, saving public funds in the long term, and protecting existing corridor functions. Furthermore, the scan considered the relation between the planning horizons and the five-year horizon of a construction or maintenance program. Amplifying questions that guided the scan site visits are provided in Appendix A.
The scan team participants included experts in transportation facilities, particularly highway corridors, representing localities, MPOs, state-level DOTs, as well as researchers with experience in coordination between land use and transportation. The geographic area studied encompasses the continental U.S. The team compiled information that addressed framing problems, using predictive modeling, gathering expert opinion, using mapping and other data to identify initial potential development, and obtaining decision-making support for corridor management with respect to adjacent land development.
The scan team performed a desk scan in April 2011 to focus the scan topic and identify useful site visits. The initiating teleconference with team members included team introductions, a program description, scope clarification, site visit recommendations, and next-step identification. The team members agreed to perform the following tasks as part of the desk scan:
n Generate a contact list of known U.S. experts directly involved with risk-based forecasts of land volatility for corridor management and sustainable communities
n Review relevant literature and legislation for current related studies and implementation
1-8
C H A P T E R 1 : I N T R O D U C T I O N
n Interview experts for further guidance on current related issues and recommendations for scan visits
n Provide a summary of interviews and recommendations to team members for consideration of site selection
The team generated a contact list based on multiple resources. First, the team discussed recommendations for potential site visits during the April teleconference. The literature review process generated contacts from relevant news releases, academic papers, and project Web sites. Additionally, team members asked contacts they interviewed for further contact recommendations. Team members also provided further recommendations based on individual research. Stakeholder recommendations were elicited when the scan topic was presented during the American Real Estate and Urban Economics Association conference in Washington, D.C. In June 2011, the team interviewed experts via phone and e-mail for guidance on current related issues.
Methods for literature review included Web searches, recommendations from scan team members, and cited research within related projects. The team found relevant literature and legislation in academic journals, transportation agency reports, and Web sites for state DOT or MPO implementation projects. Generally, the team asked experts to share current related projects within their jurisdictions as well as any notable related efforts encountered in other localities and states. The team based its recommendations for scan visits on the interest of contacted experts, evidence of innovation, and logistical constraints for scan travel.
The results of the scan study include an identification and review of practices that, with focusing on local and regional conditions, provide a method for planners to compare, prioritize, and benchmark needs for corridor management across a region. The scan thus furthers DOT, HUD, and EPA Partnership for Sustainable Communities initiatives by working to lower transportation costs, promote reliable access to employment and activity centers, and leverage federal policies.
Scan Team InformationThe scan team consisted of members from the Arizona DOT; Michigan DOT; New Jersey DOT; Oregon DOT; Virginia DOT; Washington State DOT; Arora and Associates, P.C.; and the University of Virginia. Team contact information and biographical sketches are provided in Appendix B and Appendix C, respectively.
Host Agencies, Organizations, Sites, and PersonnelThe scan team visited the following organizations in October and November 2011:
n Florida DOT (FDOT), Wilbur White Associates, and Whitehouse Associates
n New Orleans Regional Planning Commission39 (NORPC) and the Louisiana Department of Transportation & Development (La DOTD)
39 Regional Planning Commission of New Orleans, Louisiana, http://www.norpc.org/
1-9BEST PRACTICES FOR RISK-BASED FORECASTS OF LAND VOLATILITY FOR CORRIDOR MANAGEMENT AND SUSTAINABLE COMMUNITIES
n Virginia DOT (VDOT) and the University of Virginia
n Pennsylvania DOT (PennDOT), MPOs, and the 10,000 Friends of Pennsylvania40
n Georgia Regional Transportation Authority (GRTA), the Georgia DOT (GDOT), and the Atlanta Regional Commission (ARC)
n Montana DOT (MTDOT)
n Utah DOT (UDOT), and the U.S. Federal Highway Administration (FHWA)
n Washington State DOT (WSDOT)
n North Carolina DOT (NCDOT)
n Sacramento Council of Governments (SACOG) and the California DOT (Caltrans)
The team’s itinerary and meeting schedule are provided in Appendix D. Host agency key contact information is provided in Appendix E.
The findings of this report are from site visits, interviews, presentations, and incorporated information from the following team member states:
n VDOT (interview/presentation)
n MDOT
n New Jersey DOT (NJDOT)
n Arizona DOT (ADOT)
n Washington State DOT (WSDOT) (interview/presentation)
n Oregon DOT (ODOT)
Scan Process and PlanningThe approach of the scan study consisted of:
n Developing and refining the scope and procedures
n Conducting a desk scan to shortlist potential site visits and interviews
n Further refining potential site visits based on additional information gathering and interest from sites
n Visiting with selected sites
n Developing a summary report of findings
40 10,000 Friends of Pennsylvania, http://10000friends.org/
1-10
C H A P T E R 1 : I N T R O D U C T I O N
Best Practice CategorizationThe best practices in terms of methods, tools, and processes are categorized as follows:
n Local coordination for corridor preservation
n Policy and creative funding
n Desired land use planning
n Preservation of capacity
n Advanced ROW acquisition for current and future corridor preservation
n Data use and availability
C H A P T E R 2 : L O C A L C O O R D I N AT I O N F O R C O R R I D O R P R E S E R VAT I O N
2-1BEST PRACTICES FOR RISK-BASED FORECASTS OF LAND VOLATILITY FOR CORRIDOR MANAGEMENT AND SUSTAINABLE COMMUNITIES
2.0 Local Coordination for Corridor Preservation
Because no one entity is fully responsible for existing and future corridor preserva-tion, there is a need for close coordination, communication, and collaboration among stakeholders. For example, the scan study found that the majority of state agencies do not have authority for land use decisions; thus, they rely on local and regional
agencies to make land use decisions, taking into consideration their effect on the transporta-tion system. Although DOTs, MPOs, regional planning offices (RPOs), localities, and citizens may be aware of their roles within the preservation process, it is important for leaders to encourage coordinated efforts. This chapter describes best practices for stakeholder coordina-tion through communication, coordination, structured agreements, incentives, and education.
Coordination Among StakeholdersThrough Interactive Participation
Communication and coordination are critical for managing the many stakeholders involved in the development of transportation infrastructure. Several agencies have imposed requirements for localities and regions to inform the state agency about development that may impact the transportation system. Agencies that are even more progressive (e.g., UDOT) require that land use plans and access management policies be in place at the local level before certain types of state investment funds can be received.
Several processes to encourage structured communication and coordination among the many stakeholders of the transportation system have been implemented. Those considered best practices are:
n Georgia—The ARC meets with jurisdictions individually to discuss growth, land development patterns, and other land use efforts that may affect the transportation system. It developed its Unified Growth Policy Map (UGPM) to link the local comprehensive plan, local land development policy, and the MPO’s efforts. Figure 2.1 shows the UGPM area types (i.e., urban, developing, suburban, rural, and undeveloped) based on the latest figures for population and jobs.
n California—SACOG’s effort to work with localities to reach agreement on the type and pace of development and to coordinate growth patterns is a notable coordination practice.
n Arizona—ADOT developed a Red Letter Process that enables local agencies to inform ADOT of impending development in or near transportation corridors so that
2-2
ADOT can avert increased costs attributable to developed versus undeveloped land. The process has resulted in significant savings when funding can be located and necessity proven for numerous parcels along the system.
An effective tool for coordination and consensus building among state agencies, MPOs, regional organizations, and developers is a Memorandum of Understanding (MOU). Montana, North Carolina, and Florida have demonstrated successes based on agreements documented in these MOUs. Examples of best practices in use of MOU agreements are:
n Montana—MTDOT and local governments have utilized the MOU to identify roles and responsibilities regarding local governments negotiating with developers. Terms in the MOU are adapted to meet the needs of both the state and local governments. The local government has the ability to pass on the responsibility of addressing the transportation needs to the developer, or the county can provide resolution for the facility’s improvements.
n North Carolina—NCDOT utilizes a Council of Planning (COP) based on collaboration, coordination, and cooperation for selected corridors. An MOU agreement establishes the COP, which is used to bring together stakeholders in a particular corridor several times a year to discuss development and transportation issues to increase mobility by monitoring and managing the
C H A P T E R 2 : L O C A L C O O R D I N AT I O N F O R C O R R I D O R P R E S E R VAT I O N
Figure 2.1 ARC Unified Growth Policy map used with local agencies to forecast and plan future land use (Source: ARC)
2-3BEST PRACTICES FOR RISK-BASED FORECASTS OF LAND VOLATILITY FOR CORRIDOR MANAGEMENT AND SUSTAINABLE COMMUNITIES
corridor. NCDOT found that corridor vision plans that were led by the MPO or other local regional planning organizations were more effective than those COP efforts led by the DOT.
n Florida—FDOT cited the MOU as being influential in facilitating agreement among state agencies to work together with master agreements, agency operating agreements, and funding agreements.
Several organizations have formed task forces to further encourage coordination and cooperation during the land development process. Such partnerships include:
n Florida—The FDOT Model Task Force consists of representatives from MPOs, districts, transit agencies, user groups, FHWA, the Florida Department of Community Affairs, and the Florida Department of Environmental Protection. The establishment of such a task force enables:
l Establishment of policy directions and procedural guidelines for transportation modeling
l Creation of GIS, transit, data, and model advancement committees
l Collaborative standardization of the modeling software
l Dialogue regarding modeling at statewide, regional, and local levels to address such issues as concurrency, modeling tools, consideration of transportation modes, and model run times
l Cooperative development of land use models
n Oregon—The ODOT MPO/Transit Committee includes the planning directors from each of the MPOs and key planning officials from ODOT and the larger transit districts. The committee reviews pending policies and provides a table for the MPO staff to discuss issues and practices. The Oregon MPO Consortium, which consists of elected official representation from each MPO, addresses key policy initiatives that affect the MPO in relation to ODOT initiatives and legislation at the state and federal level.
Case Study: PennDOT High-Occupancy Permit Process
This process involves coordination with local agencies to align the High-Occupancy Permit (HOP) process with the local land development process. Figure 2.2 shows the alignment of Pennsylvania’s land development process with the HOP process.
2-4
The steps in the process are:
n Submit a sketch plan
n Hold public meetings
n Conduct a staff review
n Hold preliminary land development hearings
n Conduct a public review
n Create a land development plan
n Review the land development plan
n Approve the land development plan
n Issue the building permit
Through Technology
Effective use of information technology has enabled several agencies to streamline their communication and decision making with local and regional organizations, as well as document their efforts as they occur. The public’s demand for records and documentation
C H A P T E R 2 : L O C A L C O O R D I N AT I O N F O R C O R R I D O R P R E S E R VAT I O N
Figure 2.2 Pennsylvania land development process aligned with high-occupancy permitting process. The procedures serve as a tool to coordinate with more than 2500 municipal governments. (Source: PennDOT)
2-5BEST PRACTICES FOR RISK-BASED FORECASTS OF LAND VOLATILITY FOR CORRIDOR MANAGEMENT AND SUSTAINABLE COMMUNITIES
has created the need for additional transparency, more efficient allocation of resources, and a heightened level of stakeholder engagement. This section provides examples of best practices discussed in the scan’s interviews.
FloridaFDOT’s Efficient Transportation Decision Making (ETDM) process allows all stakeholders to review projects concurrently. The electronic format of this process enables each stakeholder to see the same information and provides a platform for representatives to raise concerns; however, only the system’s owner can view all stakeholder comments.
The availability of funding to increase external agency support has facilitated involvement by agencies that did not always participate in the past. Each agency identifies a representative who can speak and make decisions on behalf of the agency. The representatives enter their comments in the database and raise any concerns within the specified 45-day review period.
FDOT provides a summary report, which includes next steps, to all review stakeholders within 60 days of the end of the review period. Through the MOU and early coordination with local agencies, the state can anticipate a sense of buy-in from those agencies responsible for ROW reservation/preservation.
PennsylvaniaFigure 2.3 shows the role comparison of PennDOT, MPOs/RPOs, counties, and municipalities. The process for including projects (i.e., capacity-adding construction, maintenance, or operations) in Municipal and State Transportation Improvement Plans (MTIP and STIP, respectively) was recently modified as a result of collaborative evaluation with MPOs and RPOs. The new process brings a requirement of concurrence prior to MPO deviation from the Constrained Long-Range Plan. The process includes the submitter’s documentation and justification of the problem, identification of purpose and need, and other attributes of the situation in an electronic database.
2-6
C H A P T E R 2 : L O C A L C O O R D I N AT I O N F O R C O R R I D O R P R E S E R VAT I O N
The database’s primary purpose was to collect and maintain documentation of long-range plan and Transportation Improvement Plan (TIP) entries as they occur. However, a secondary benefit of the system could be using it as a tool to screen entries to identify corridors that may be of concern. Route number or jurisdiction can be use to retrieve submissions from the database to identify trends, corridor issues, or regional problems.
North CarolinaNorth Carolina’s COP is based on collaboration, coordination, and cooperation for selected corridors. COPs are typically locally driven; however, NCDOT is a major partner due to its extensive ownership of the state’s transportation system.
A Web site facilitates interaction between COP members and enables member jurisdictions to post items of interest related to development or any other issues that may affect the corridor publicly. COP members are sent an e-mail notifying them of the presence of relevant information on the Web site related to their corridor COP. Stakeholders can review the information and respond by sending the submitting county a communication documenting their comments and concerns.
Figure 2.3 Roles of stakeholders in the Pennsylvania coordination of transportation planning and land use decision-making. The approach guides coordination among the entities responsible for transportation corridor and risk assessments. (Source: PennDOT)
2-7BEST PRACTICES FOR RISK-BASED FORECASTS OF LAND VOLATILITY FOR CORRIDOR MANAGEMENT AND SUSTAINABLE COMMUNITIES
OregonODOT has developed the Transportation Planning Online Database (TPOD) as a Web-based GIS tool that allows users to view transportation planning documents using a geospatial interface. This tool has been successful in sharing MPO, locality, and state agency corridor vision plans (e.g., local bike plans, interchange plans, and the county’s comprehensive plan).
Through Educational Resources
Several state agencies have shown leadership in providing tools for local and regional agencies to promote desired land development, while at the same time protecting the adjacent transportation infrastructure. This section presents best practices in this area.
PennsylvaniaPennDOT has authored several handbooks, including:
n The PennDOT Planning Series, which discusses land use planning, local implementation tools for land use and transportation coordination, preservation of public lands and facilities, and access management
n The Smart Transportation Guidebook – Planning and designing highways and streets that support sustainable and livable communities promotes the joint consideration of transportation investments and land use
n Policies and Procedures for Transportation Impact Studies, which supports the evaluation of traffic impacts and mitigation for proposed land development
PennDOT has developed the State Smart Transportation Initiative41 for agency leaders to discuss land use and improvement of capital investment strategies across the nation. PennDOT has also worked on engaging land use partners by:
n Conducting joint training with MPOs, RPOs, and districts
n Creating a municipal outreach campaign
n Engaging state associations
n Heading implementation workshops with state agencies, counties, MPOs/RPOs, and other organizations
FloridaFDOT has improved communication with other agencies by developing guidance handbooks and sponsoring workshops for stakeholders. Handbooks include:
41 State Smart Transportation, http://www.smart-transportation.com/
2-8
C H A P T E R 2 : L O C A L C O O R D I N AT I O N F O R C O R R I D O R P R E S E R VAT I O N
n Comparative Matrix of Local Corridor Management Policies identifies techniques and provides a methodology for the comparison of existing land development regulations in local governments
n Model Land Development & Subdivision Regulations That Support Access Management describes tools for access management and efficient site planning
n Modeling the Interactions Between Land Use and Transportation Investments Using Spatiotemporal Analysis Tools42 uses statistical analysis to model the impact of transportation improvements on land use
n Study of Alternative Land Use Forecasting Models surveys land use forecasting models43 that considers growth scenarios and transportation improvements to demonstrate a forecasting model
These educational tools have encouraged progressive practices, such as businesses adapting their development plans to include access management techniques and more efficiency in site development.
MontanaAs part of MTDOT’s Tranplan2144 initiative, the state provides technical support and leadership to encourage local agencies and organizations to protect the existing transportation system. In addition to webinars and workshops, MTDOT has developed a collaboratively driven Web-based toolkit45 to help local planning, land use, and transportation representatives fulfill their agencies’ responsibilities while also addressing the interrelated goals of transportation and land development. The toolkit provides multiple links to documentation that includes:
n An overview narrative that local planners can provide to their local elected officials as an aid when discussing planning issues
n Links to relevant state codes
n Examples of state and national-level tools to address the linkage between transportation and land development
n Example case studies demonstrating the application of the recommended planning tools
42 Zhao F, SL Shaw, S Chung, and X Xin, Modeling the Interactions Between Land Use and Transportation Investments Using Spatiotemporal Analysis Tools, http://www.dot.state.fl.us/research-center/Completed_Proj/Summary_PL/FDOT_BC851_rpt.pdf 43 Zhao F and S Chung, A Study of Alternative Land Use Forecasting Models, http://www.dot.state.fl.us/research-center/Completed_Proj/Summary_PL/FDOT_BD015_10_rpt.pdf 44 Montana Department of Transportation, http://www.mdt.mt.gov/pubinvolve/tranplan21.shtml 45 Montana Transportation and Land Use Toolkit: Resources for Growing Communities, http://www.mdt.mt.gov/research/toolkit/default.shtml
2-9BEST PRACTICES FOR RISK-BASED FORECASTS OF LAND VOLATILITY FOR CORRIDOR MANAGEMENT AND SUSTAINABLE COMMUNITIES
n Fliers and handouts to share with planning associations
n Other information for distribution to local developers and other interested parties
GeorgiaGDOT has developed publications such as GDOT Regulations for Driveway Encroachment Control46 for developers and local governments requesting permits to access the state highway system for information on design and use procedures. The guidance facilitates consistency and best practices, while promoting a methodology to reduce congestion and improve safety. The Regional Access Management Initiative47, a partnership with GRTA, ARC, and GDOT, has worked to set minimum guidance for local jurisdictions and provide education regarding best practices.
46 Georgia Department of Transportation, Regulations for Driveway and Encroachment Control, http://www.dot.state.ga.us/doingbusiness/PoliciesManuals/roads/Encroachment/DrivewayFull.pdf 47 ARC/GDOT/GRTA Atlanta Regional Access Management Initiative, Program Overview, http://documents.atlantaregional.com/taqc_archive/tp_taqc_presentations_feb_2009.pdf
C H A P T E R 3 : P O L I C Y A N D C R E AT I V E F U N D I N G
3-1BEST PRACTICES FOR RISK-BASED FORECASTS OF LAND VOLATILITY FOR CORRIDOR MANAGEMENT AND SUSTAINABLE COMMUNITIES
3.0 Policy and Creative Funding
As indicated by GDOT, investment in the transportation infrastructure ultimately is an investment in jobs that will lead to further economic prosperity for communities, states, and the country. Several agencies, however, have struggled to compensate for decreasing fuel taxes revenues caused by economic conditions, the rising fuel
economy, and the stagnancy of miles driven. Of course, this situation is only intensified by the realization that much of the current transportation system has reached or will soon reach its expected life span and will need increasing additional funding to maintain or even rehabili-tate segments to preserve the transportation facility. It has become increasingly important for agencies to seek alternative funding sources as well as to support low-cost and high-benefit investment strategies. This chapter describes several best practices in the use of alternative sources for funding, prioritization of limited funding, and identification of critical investments in low-cost, high-benefit corridor protection alternatives.
Alternative Funding SourcesAlternative funding sources have included the following:
n Transportation impact fees or system development charges—Several agencies (e.g., local governments in Oregon and parishes in Louisiana) have instituted transportation impact fees or system development charges for the effect that the land development has on the transportation system. Their purpose is to compensate the locality for necessary improvements resulting from the development’s impact on the area’s transportation system.
n Levy system—Minnesota has imposed a property tax levy system to fund the Right of Way Acquisition Loan Fund (RALF), which is used for advanced ROW acquisition.
n Motor vehicle registration fees—UDOT provides a financial incentive to each county that that chooses to impose a $10 motor vehicle registration fee. The agency, which uses the fees to fund its corridor preservation fund, matches investments on state highway corridors in those counties electing to impose the fee. UDOT has also implemented a 2.5% rental vehicle tax and has earmarked a percentage of the state sales tax for first- and second-class counties (i.e., those with populations of at least 125,000).
n State sales tax—Georgia is in the process of acquiring new funding sources and is planning for investment. An ongoing regional proposition is to institute a 1% sales tax for 10 years, which will be used toward capital projects and local transportation projects. The collected taxes are 100% regional funds and
3-2
C H A P T E R 3 : P O L I C Y A N D C R E AT I V E F U N D I N G
therefore could be utilized for corridor preservation (e.g., acquiring ROW and developing local access management plans).
n Taxing districts—In Georgia, transportation improvements can be funded through the creation of taxing districts. Recent legislation allows developers to create infrastructure districts that tax district residents and commercial properties to fund infrastructure costs, including transportation and water/sewer for very large developments. Local governments have also used Community Improvement Districts to allow business owners to tax themselves to improve mobility.
Funding PrioritizationThere is a critical need for state and local agencies to prioritize limited funding for corridor preservation projects.
Montana
MTDOT has developed a performance management process to determine the optimal federal funds allocation. Performance goals include congestion, LOS, pavement, number of obsolete and deficient bridges, and accidents and fatalities.
Georgia
In Georgia, the counties, cities, and GDOT developed criteria for prioritizing projects to be funded by the pending sales tax. Additionally, the ARC has adopted the Strategic Regional Thoroughfare Plan48, which gives priority consideration for thoroughfare networks that service multiple modes of travel, including walking, bicycling, driving, and riding transit. These thoroughfare networks connect people and/or goods to important places in the metropolitan region. The thoroughfare management process follows these steps:
n Assess deficiencies
n Identify improvements
n Prioritize and implement improvements
n Collect and monitor performance data
Pennsylvania
As part of the smart transportation initiative, PennDOT works to choose projects with a high value/price ratio. Specifically, projects that:
3-3BEST PRACTICES FOR RISK-BASED FORECASTS OF LAND VOLATILITY FOR CORRIDOR MANAGEMENT AND SUSTAINABLE COMMUNITIES
n Look beyond level of service
n Consider safety first
n Accommodate all modes
n Discourage sprawl
n Develop local governments as strong land use partners
Low-Cost, High-Benefit Solutions for Corridor PreservationEconomic conditions, availability of technology, and progressive practices have led to greater opportunities to implement low-cost, high-benefit corridor preservation alternatives. MnDOT, PennDOT, WSDOT, and other state agencies have responded to the emerging trend for states and MPOs to implement more cost-efficient corridor preservation alternatives that circumvent the need for physical corridor expansion and expensive ROW acquisition.
Pennsylvania
A 2004 Pennsylvania transportation reassessment led to the cancellation of 14 high-cost expansion projects. As a result, the state’s Smart Transportation initiative has led to improved decision-making earlier in program development, which takes into consideration the land development process. More-recent initiatives have focused on:
n Studying the consolidation of small transit systems
n Enhancing stakeholder collaboration
n Reducing the number of structurally deficient bridges
n Providing for upgrades and improvements for rail freight, airports, ports, and other modes of transportation
California
SACOG has focused efforts on investing in multimodal alternatives and intelligent transportation systems to improve mobility on existing systems.
C H A P T E R 4 : D E S I R E D L A N D U S E P L A N N I N G
4-1BEST PRACTICES FOR RISK-BASED FORECASTS OF LAND VOLATILITY FOR CORRIDOR MANAGEMENT AND SUSTAINABLE COMMUNITIES
4.0 Desired Land Use Planning
Corridor preservation requires careful planning of land uses surrounding the trans-portation infrastructure. This chapter provides examples of best practices for desired land use planning.
North Carolina
In North Carolina, local governments are required to have a current land development plan in place to receive transportation planning assistance from NCDOT. This Comprehensive Transportation Plan is a key component in NCDOT’s project prioritization and project programming process. Consequently, NCDOT, MPOs, and local governments work together to develop a vision for the future of the corridor through an official corridor map.
In the event a proposed development is anticipated to impact a proposed corridor alignment, a detailed functional design is prepared; this may lead to a request for development setbacks. Localities must begin detailed project planning within three years of filing the official map. Once filed, the maps have legal standing.
Pennsylvania
PennDOT requires that the Municipalities Planning Code land use and growth management policy plan be updated once every 10 years. This document must identify regionally significant land uses, including a specific plan for prime agricultural land. The plan identifies community objectives for future land development and for the movement of people and goods.
Louisiana
NORPC has adopted the map-based INDEX49 model. The model measures the existing conditions of land use plans; visualizes alternative planning scenarios; analyzes scenario transportation system performance based on community objectives; and consequently shows the linkage between housing, transit, and jobs. Figure 4.1 shows an example of scenario ranking output from the INDEX model.
49 Criterion Planners, Our Work > INDEX software > the tool, http://www.crit.com/
4-2
C H A P T E R 4 : D E S I R E D L A N D U S E P L A N N I N G
NORPC has used the tool to foster open conversation concerning land use by conducting workshops to “paint” the future land use at the regional and local levels. The INDEX model allows stakeholders and leaders to visualize the consequences of land use scenarios in terms of percentage of population impacted, employment, transportation, and other factors.
Figure 4.1 NORPC INDEX model output showing the impact of land use scenarios on organizational goals (Source: NORPC)
C H A P T E R 5 : P R E S E R VAT I O N O F C A PA C I T Y
5-1BEST PRACTICES FOR RISK-BASED FORECASTS OF LAND VOLATILITY FOR CORRIDOR MANAGEMENT AND SUSTAINABLE COMMUNITIES
5.0 Preservation of Capacity
The preservation of existing transportation corridor capacity involves planning to avoid the possible negative impact of uncoordinated land development by using access management techniques and managing the transportation network as a whole. This report considers the function of the corridor from both the perspective of
those who are traveling through the area on the corridor, as well as those who are accessing properties along the corridor.
This chapter describes best practices in evaluating the impact of land development on the transportation infrastructure, methods for access management for existing corridor preservation, and methods for evaluating access points for the entire transportation network.
Evaluating The Impact Of Land Development On The Transportation InfrastructureSeveral agencies have communicated the need for proactive evaluation of development impacts on the transportation network. Many sites visited during the scan noted that a moderate level of congestion is viewed as an indication of economic prosperity. Comments indicated that congestion is good as long as there is a plan for it. This section describes best practices for evaluating impacts on the transportation system.
Louisiana
NORPC has been effective in land use zoning by adopting a new master plan called the Land Use Plan. The strategies for integration of land use and transportation consist of:
n Managing access
n Encouraging mixed use development
n Controlling lot sizes or density
n Retrofitting heavy-volume elevated streets to at-grade boulevards
n Making transit-oriented development along existing and new transit lines
NORPC identifies potential growth corridors in coordination with local planning departments and local economic development organizations. Identified lands are typically within the levee system, are not classified as wetlands, and are serviced by existing sewer and water systems. Identified lands are also evaluated during development of the metropolitan transportation plan and TIP. NORPC asks organizations to identify where large-scale development will occur based on developers/land owners seeking land entitlements. The local planning department is responsible for addressing unexpected land development through required permitting and zoning processes.
5-2
C H A P T E R 5 : P R E S E R VAT I O N O F C A PA C I T Y
Georgia
GDOT has identified the impact of land use change on the transportation infrastructure through a life cycle approach. Figure 5.1 shows the transportation life cycle, indicating the cycle of arterial improvement.
Pennsylvania
Figure 5.2 shows the PennDOT process of assessing the development impact for proposed intersections. If a level-of-service requirement is not met at the intersections affected by the site development, the applicant is expected to fund construction improvements that will mitigate impacts. If improvements are determined to be infeasible, the options are:
n Marginal degradation of level of service involving local land use and transportation plan
n Significant degradation of level of service involving an Alternative Transportation Plan (e.g., alternative routes, access management plans, multimodal plans, pedestrian, transit, bike, and park and rides)
n A design waiver for level of service
Figure 5.1 Life cycle showing the impact of land use change on transportation corridor performance (Source: GDOT)
5-3BEST PRACTICES FOR RISK-BASED FORECASTS OF LAND VOLATILITY FOR CORRIDOR MANAGEMENT AND SUSTAINABLE COMMUNITIES
Florida
FDOT evaluates developments of regional impact and negotiates mitigation by ROW donation or ROW mitigation.
Georgia
GRTA utilizes a different process of developments of regional impact that assesses a development’s impact on the transportation network and proposes mitigation. GRTA reviews proposed developments (i.e., land use revisions) over a set threshold in size and intensity as developments of regional impact. Mitigation may include:
n Preservation of ROW for the future improvement
n Improvement to preserve the existing level of service
n Access management
n Highway improvement in support of state/local plans
n Providing alternate routes
n Increased internal connectivity, parking, sidewalk, bike/pedestrian facilities
n Preserving frontage for future external access
Figure 5.2 Example assessment of the development impact for proposed intersections (Source: PennDOT)
5-4
C H A P T E R 5 : P R E S E R VAT I O N O F C A PA C I T Y
Montana
MTDOT requires developers to identify impacts to the transportation system and propose appropriate mitigation. In turn, MTDOT negotiates the mitigation actions prior to allowing access to the system.
Washington State
Under Washington State’s Growth Management Act, local governments must estimate potential transportation impacts resulting from their land use decisions and identify mitigating transportation system improvements.
Utah
UDOT requires that access management or other corridor preservation policies be in place at the local level to qualify for funding through certain programs.
Methods for Access Management for Existing Corridor PreservationThe preservation of existing transportation corridors by coordinating land use generally involves management of access points along the corridor. Access management is the careful planning of the location, types, and design of access, driveways, median openings, interchanges, and medians.
Sites with successful access management strategies benefitted from improved performance and safety due to the reduction of conflict points. Discussions held during the scan indicated that the most efficient application of the access management principles occurs when the process is implemented during the land development phase. After the development occurs and access rights have been determined, it is very difficult to renegotiate access rights.
The benefits of access management include:
n According to GDOT access management and access control are good for business because it expands the corridor’s mobility, thereby increasing the customer base of the businesses along the corridor because they are accessible to more potential clients. Many sites encourage sharing driveways and other tactics.
n For FDOT, the main concern for access management is safety, rather than growth management. Secondary reasons for access management include:
l Reducing the risk of transportation construction
l Protecting the investment of the adjacent land owners as the future facility is established
l Allowing for operational improvements, which can be less costly and still effective
Host sites referred to multiple methods for managing access points along corridors.
5-5BEST PRACTICES FOR RISK-BASED FORECASTS OF LAND VOLATILITY FOR CORRIDOR MANAGEMENT AND SUSTAINABLE COMMUNITIES
Georgia
GDOT has developed the Access Management Permit System (AMPS) Web-based database. This communication tool contains all new access permit applications and their processing status. Varied levels of site access are available to local governments, the public, developers, and state agencies. The AMPS database:
n Links to a GIS network
n Can be overlaid with state project information
n Allows users to track the status throughout the process
n Enhances the department’s ability to track locations of conflicts and inconsistencies with spacing guidelines
All entrance permits are included, with the exception of those entrances built as part of the road’s original construction.
Virginia
VDOT is working to establish a comprehensive access management program that includes corridor protection. The agency currently manages ROW purchases in the project development process of VDOT’s Six-Year Improvement Program50 and Statewide Transportation Improvement Program51. VDOT’s Secondary Street Acceptance Requirements requires local governments to provide land development planning information to VDOT.
Arizona
ADOT’s statewide access management plan categorizes every mile of the state highway system into desirable access control parameters.
Montana
MTDOT requires that the developer not adversely affect the road and fund mitigation, if necessary. Access does not have to be on the state system; they can direct that access by local or other roads.
Case Study: Georgia South Fulton Parkway Access Management PlanThis corridor plan was an opportunity to be proactive in managing the access point density of a corridor with minimal current developments. The study process was outreach, needs
50 Virginia Department of Transportation, VDOT Six-Year Improvement Program, Richmond, undated, http://syip.virginiadot.org/Pages/allProjects.aspx (accessed January 28, 2011)
51 Virginia Department of Transportation, Statewide Transportation Improvement Program, Richmond, undated, http://www.virginiadot.org/about/stip.asp (accessed January 28, 2011)
5-6
C H A P T E R 5 : P R E S E R VAT I O N O F C A PA C I T Y
assessment (data collection and assessment), improvement development process, and corridor plan.
GDOT undertook this study with goals that included maintaining mobility while enhancing access, contributing to the economic vitality of the region, integrating land uses, enhancing livability, and protecting existing resources and communities. This study involved an 18-mile state route with multiple land uses, several counties and cities, and 96 different property owners.
The study developed future alternative build-out scenarios and compared the results to develop the access management plan. Figure 5.3 shows the results of the scenario analysis, which consisted of a baseline scenario and alternative scenarios based on population growth, job growth, and others. Figure 5.4 shows maps that were created to evaluate potential placement of access points and the resulting level of service determined by a corridor traffic simulation model (CORSIM). The level-of-service map essentially demonstrated the level of service implications of requested access point permits.
The study recommended the following:
n Create parallel roadways
n Allow no driveways
n Provide turn lanes along side streets
n Convert some full medians to directional medians
n Implement continuous flow intersections
n Construct roundabouts
n Widen to six lanes, where appropriate
5-7BEST PRACTICES FOR RISK-BASED FORECASTS OF LAND VOLATILITY FOR CORRIDOR MANAGEMENT AND SUSTAINABLE COMMUNITIES
Figure 5.3 Scenario analysis for Georgia South Fulton Parkway Access Management Plan (Source: GDOT)
Figure 5.4 Level of service planning for the Georgia South Fulton Parkway Access Management Plan (Source: GDOT)
5-8
C H A P T E R 5 : P R E S E R VAT I O N O F C A PA C I T Y
Methods for Evaluating Access Points for the Entire Transportation NetworkA partnership between VDOT and the University of Virginia developed the Access Control Prioritization System (ACPS), which concurrently evaluates access point density with forecasts of the risk of land-development to transportation assets for the primary systems in several Virginia counties. Figure 5.5 compares access point density, traffic volume, and the likelihood of development along the one-mile segments of a corridor. The varied land parcel colors represent the risk priority scores, and a gradient color scale assigns the priority scores to highlight potential risk areas with the route roadway.
Traffic volume is measured by the average daily traffic for each mile segment and graphed along the linear roadway mileage; the linear mile densities are graphed in the same manner to chart the progression along the route mileage. This management layer helps decision makers identify segments that would benefit from proactive steps to protect the corridor from future uncoordinated land development and helps to prioritize these segments for resource allocation. Segments with a high priority score indicate possible areas where proactive steps may be taken to ensure that the corridor’s function is not jeopardized by uncoordinated future land development.
Figure 5.5 Risk-based prioritization of corridor segments based on relationships among access points per mile, risk of land development prediction, and average daily traffic (Source: VDOT, University of Virginia)
5-9BEST PRACTICES FOR RISK-BASED FORECASTS OF LAND VOLATILITY FOR CORRIDOR MANAGEMENT AND SUSTAINABLE COMMUNITIES
Segments also exhibiting high density of access points and high traffic volume indicate significant current development (in addition to the predicted future development), which would make implementation of an access management protection plan costly. Conversely, at-risk segments low in traffic volume and access point density may be more cost-effective to protect, since they represent areas that are expected to develop but have not yet done so.
The corridor samples from the Virginia approach shown in Appendix F can be compared, benchmarked, and used for prioritization.
CHAPTER 7 : ADVANCED RIGHT OF WAY ACQUISITION FOR CURRENT AND FUTURE CORRIDOR PRESERVATION
6-1BEST PRACTICES FOR RISK-BASED FORECASTS OF LAND VOLATILITY FOR CORRIDOR MANAGEMENT AND SUSTAINABLE COMMUNITIES
6.0 Advanced Right of Way Acquisition for Current and Future Corridor Preservation
Given limited financial resources and other limitations, state agencies have become increasingly creative in their corridor preservation and ROW acquisition methods. The preservation of both existing and future transportation corridors generally involves ROW acquisition to acquire key parcels that would be lost to development
and purchase of hardship properties.
In practice, disparities exist in the time between acquisition and project use. The disparities exist due to funding availability, regulatory constraints, resources, and studies questioning the cost benefits of advanced ROW acquisition.
There has been some debate on whether ROW acquisition far in advance of corridor needs is a fiscally sound practice. Some agencies view corridor preservation as a method to save money by managing development, thereby ensuring that access management principles are incorporated into the facility’s ultimate design. This, in turn, would avoid land appreciation, preempt development, assist homeowners and developers, and preserve the intent of the facility and associated highway ROW.
Financial Benefits of Early Land AcquisitionMnDOT conducted a study that investigated the financial benefits of early acquisition of land for transportation purposes. Advanced ROW acquisition programs assume that land prices will continue to rise. However, the study pointed out that the programs must consider the opportunity cost (i.e., foregone interest) of the money. Theoretically, the present value of the land purchase should be reflected in the current value, making it more cost-effective for organizations to wait until they must have the land prior to purchasing it.
There may be situations where it is a sound investment to purchase earlier. The study concluded that advanced acquisition is not effective for parcels that are already developed. Farmland may be worth acquiring; however, it would be worth analysis to determine if land value trends hold for more years than in this analysis. Purchasing specific parcels is worthwhile if they are in clear danger of being developed to much higher value uses, which would multiply their value and related cost to the transportation agency.
Risks of Identifying Corridors for AcquisitionUDOT pointed out the risks of identifying corridors for acquisition. Once a corridor is
6-2
CHAPTER 7 : ADVANCED RIGHT OF WAY ACQUISITION FOR CURRENT AND FUTURE CORRIDOR PRESERVATION
under development or has been identified as a transportation corridor or a corridor for significant improvement (change), agencies encounter impacts (e.g., development speculation, buying bare ground to avoid development, or hardship on existing properties) that they must address immediately. This situation results in agencies paying some costs out of their own funding if the planning for the corridor has not yet advanced through the National Environmental Policy Act (NEPA) process.
Advanced Right of Way Acquisition ExamplesMinnesota
The Metropolitan Council RALF is a revolving loan program for purchasing rights of way within the Twin Cities’ seven-county metropolitan area that may be needed for future highway development. A regional property tax levy authorized in state statute funds the program, which involves a willing seller and a willing buyer (i.e., no condemnations and no relocation costs except in cases of hardship). A council property tax levy totals approximately $3 million annually.
The program purchases undeveloped/vacant land to prevent development within an identified and officially mapped highway corridor. This is a revolving fund; the council lends the money to the city, the city buys and land, and when the highway is constructed, MnDOT buys the parcel from the city at the original purchase price plus expenses. This occurs after the environmental document is approved. These early purchases meet all FHWA requirements so that federal dollars can be utilized when the corridor is ready and the NEPA Record of Decision is obtained. The city then repays the council the amount of the original RALF loan; the proceeds are able to revolve and fund additional RALF loans.
Utah
The UDOT Corridor Preservation Revolving Fund (CPRF) emphasizes the need to preempt commercial and industrial development on bare land. The acquisition is strictly on a voluntary basis. The legislature created the fund as an open and transparent process to prevent hardship situations. All funds are provided by the state, generated by a legislated surcharge on car rental and local sales tax. UDOT administers the fund to purchase ROW along the proposed corridor and holds it until the project becomes active.
UDOT’s process is similar to MnDOT’s RALF program, except that instead of a Metropolitan Counsel administering the funds and the city purchasing the ROW, UDOT administers the fund and purchases the ROW. Because the program is state funded, the funds can be used for more than just highway acquisition. UDOT estimates that for every $1 spent on bare ground, preservation saves $14 to $20 of the cost of purchasing developed ground.
Florida
FDOT has used advanced acquisition to protect a corridor after the project has moved into the advanced planning stages. However, recent economic conditions have led the state
6-3BEST PRACTICES FOR RISK-BASED FORECASTS OF LAND VOLATILITY FOR CORRIDOR MANAGEMENT AND SUSTAINABLE COMMUNITIES
to adopt a policy of dealing with what it has at the time of the project versus taking any protective actions.
FDOT’s 1990 Master Reservation Program along transportation corridors to reserve setbacks and ROW was found to be unconstitutional. Now the agency relies on assistance from local governments for ROW reservation.
Louisiana
The La DOTD and NORPC have encountered complications in the decision to exercise advance acquisition due to uncertainty in future population. Although the region had the opportunity to acquire land after the Hurricane Katrina population shifts, federal emergency repair time constraints complicated decisions about re-visioning of existing corridors.
Montana
MTDOT does some advance acquisition, usually on a hardship basis.
Oregon
ODOT does not have reserved funds for advanced ROW acquisition. Acquiring ROW in advance of a project’s environmental decision under NEPA is normally when the agency requests funding authorization from FHWA for ROW activities. ODOT seeks early acquisition of ROW using one of two methods:
n By making an early acquisition request to FHWA for authorization for hardship/protective purchases utilizing federal aid funding
n By using agency funds and seeking credit or reimbursement from FHWA
ODOT will occasionally seek early FHWA authorization for hardship or protective purchases for projects in the current STIP.
Arizona
ADOT has used advance acquisitions and protective buying to avert development and alleviate hardships. While not part of ADOT’s current program, previous years have included discretionary lumps sums for purchases ahead of normal project schedules.
Georgia
GDOT may elect to utilize advanced acquisition processes on federal aid projects if a project is first approved in the STIP a developer is planning to build a project (e.g., an office building or a shopping center) within the footprint of the proposed alignment. Depending on the developer’s phase, this process can save thousands and even millions of dollars per advanced acquisition.
GDOT may also elect to acquire ROW by advanced acquisition processes for certain hardship requests upon FHWA approval. Property owners, however, submit their hardship request for GDOT’s preliminary review and subsequent submittal for FHWA final review and approval.
6-4
CHAPTER 7 : ADVANCED RIGHT OF WAY ACQUISITION FOR CURRENT AND FUTURE CORRIDOR PRESERVATION
North Carolina
NCDOT may adopt an official corridor map to preserve ROW. The agency has the right to delay the developer up to three years while deciding whether to purchase the ROW through advanced acquisition.
C H A P T E R 7 : O T H E R P R O G R A M S F O R S U S TA I N A B I L I T Y A N D P R E S E R VAT I O N
7-1BEST PRACTICES FOR RISK-BASED FORECASTS OF LAND VOLATILITY FOR CORRIDOR MANAGEMENT AND SUSTAINABLE COMMUNITIES
7.0 Other Programs for Sustainability and Preservation
Transportation agencies have developed several alternative programs to support sus-tainability initiatives. The programs have addressed blight, supported communities, and improved livability and economic development. When these initiatives are near state facilities, one can view initiatives for walkability, livability, and sustainability
as part of corridor preservation for the facilities. This chapter describes the unique programs and policies for sustainability found throughout the study.
PennsylvaniaPennDOT developed the Pennsylvania Community Transportation Initiative (PCTI) as a pilot program to link transportation investments with land use planning and decision-making within communities. The secretary of Transportation’s discretionary “off-the-top” funding from the STIP funds the PCTI.
As shown in Table 7.1, this initiative has allocated $60 million over two years and received more than 400 applications for more than $600 million. The selection criteria for this initiative are based on land use connection, collaboration with stakeholders, avoidance of sprawl, leveraging other funding, consistency with regional plans, innovation, and repeatability. As the program’s popularity continues, PennDOT has developed a program user guide and an automated application process.
Type of funding request
# of selections % of total selections
Total funding for selected projects % of total funding
Planning 22 44% 3,320,500 6%
Construction 25 50% 51,557,292 87%
Planning and construction
3 6% 4,407,200 7%
Total 50 100% 59,284,992 100%
One of the projects funded by the PCTI is Carlisle’s Road Diet. The initiative reduced four undivided lanes in the town of Carlisle to a three-lane facility, with the center lane being a turn lane and two one-way bike lanes.
PennDOT has developed further sustainability of infrastructure by linking the planning and NEPA. The new Program Development and Project Delivery Process is designed to focus on a more sustainable approach when addressing infrastructure, preservation of the existing system, strengthening the linkage between long-range transportation plans, and
C H A P T E R 7 : O T H E R P R O G R A M S F O R S U S TA I N A B I L I T Y A N D P R E S E R VAT I O N
ensuring that environmental concerns are understood earlier in the planning process. As shown in Figure 7.1, the steps are:
n Assessment of asset management needs, conferring with MPOs/RPOs on investment strategy and screening problems from the public
n Identification in LRTP and screening of nonasset efforts
n Initiation and clarification of needs
n Definition and community context screening
n Identification in TIP/STIP
n Preliminary engineering/NEPA
n Final design and construction
Several of Pennsylvania’s MPOs have developed their own programs designed to improve the linkage between transportation and land use. For example, the Lancaster MPO initiated the Smart Growth Transportation (SGT) program, which was approved in June 2011 ($1 million per year surface transportation urban funding starting in federal fiscal year 2012; 20% match). The SGT program is tailored to target 20% of the funds to planning studies and 80% to project construction. The recipients of the funded studies and project must utilize those resources in the county’s designated growth areas. This tool potentially could be used to fund studies and projects that address the preservation of corridors that are experiencing and/or projected to experience exponential growth.
OregonODOT has developed a Flex Funds Program, which is similar to PennDOT’s program. The agency recently completed its first round of projects and is in the process of selecting its second round. A portion of the flexible federal funds available through the FHWA Surface Transportation Program, approximately $22 million every two years, will be used to support sustainable nonhighway transportation projects, programs, and services
Figure 7.1 Transportation Program Development and Project Delivery Process (Source: PennDOT)
7-3BEST PRACTICES FOR RISK-BASED FORECASTS OF LAND VOLATILITY FOR CORRIDOR MANAGEMENT AND SUSTAINABLE COMMUNITIES
that positively impact modal connectivity, mobility and access, livability, energy use, and the overall operation of the transportation system. Projects identified for these funds are expected to help create livable and sustainable communities where multimodal transportation facilities, services, and programs provide safe, comfortable, and convenient options that support active living.
ODOT also has a program entitled Transportation Growth Management, which was created in 1993 to support local efforts to improve transportation options, boost economic vitality, and enhance the livability of communities throughout the state. As a nonregulatory program in which participation is voluntary, TGM collaborates with local governments, providing them with funding for planning projects that lead to more livable, economically vital, transportation-efficient, sustainable, pedestrian-friendly communities.
LouisianaAs part of New Orleans’ recovery from Hurricane Katrina, the NORPC partners are working to build prosperity and livability in all areas. Incorporated into this is the complete streets concept of treating all modes (i.e., pedestrians, bikers, transit riders, and automobile and truck drivers) fairly on each corridor. Currently, New Orleans is ranked sixth among the nation’s cities for commuting to work, a statistic that was not likely pre-Katrina. As streets are repaved through submerged roads funds, bicycle lanes and sidewalks are considered and included as appropriate.
GeorgiaThe ARC Livable Centers Initiative (LCI) provides funding for projects incorporating livability and walkability. The effort gives the planning needed to reach agreement on the function, future vision, and project identification for the future of those corridors.
MinnesotaMnDOT’s Transportation Policy Plan (TPP) aims to promote efficient land use by encouraging any choice other than single-occupancy vehicles and focusing on low-cost improvements.
CaliforniaCaltrans and California MPOs are working together to address how the state will achieve maximum feasible emission reductions pursuant to state law (i.e., Assembly Bill 32). The MPOs are creating Sustainable Communities Strategies (SCS) that demonstrate how development patterns, the transportation network, policies, and programs can work together to achieve greenhouse gas emission reduction targets.
While the SCS represents a regional blueprint for transportation, housing, and land use that is focused on reducing driving and associated greenhouse gas emissions, Caltrans’s California Interregional Blueprint is assessing how the SCS will influence
7-4
C H A P T E R 7 : O T H E R P R O G R A M S F O R S U S TA I N A B I L I T Y A N D P R E S E R VAT I O N
the configuration of the statewide multimodal transportation system. The blueprint will articulate the state’s vision for an integrated, multimodal interregional transportation system that complements the SCS and land use visions and, ultimately, identify a system that will meet the greenhouse gas emission levels identified in Assembly Bill 32.
C H A P T E R 8 : DATA U S E A N DAVA I L A B I L I T Y
8-1BEST PRACTICES FOR RISK-BASED FORECASTS OF LAND VOLATILITY FOR CORRIDOR MANAGEMENT AND SUSTAINABLE COMMUNITIES
8.0 Data Use and Availability
Data availability and analysis have proven to be effective in the evaluation and management of corridors and adjacent land use. The best practices for methods and tools have included geospatial databases containing relevant features, interactive information-sharing databases, and quantitative modeling for decision-making
purposes. Agencies have expressed the need for tools that are automated, require minimal agency staff resources, and provide implementable recommendations.
Databases for Storage of Critical InformationLouisiana
NORPC has used cluster analysis to consider the geographic co-location of various assets. The analysis makes use of data that contains detailed geospatial information around the region. The data provides index model layers for concentrations of employment, trends, marketing data, and other factors. NORPC has worked with versions of the American Planning Association’s Land-Use Coding Standard52 for standardization, regional land use coding, and for existing and proposed land use development. The land use and transportation elements consist of activity, function, structure, and development.
The cluster analysis found gaps in transit access, prioritization of transportation improvements, employment forecasts, housing population forecasts, and others. This enabled parish plans to determine where development is expected to occur. NORPC worked with parishes to develop consensus in the forecasts and conduct travel-demand modeling that is consistent with fiscal constraints.
Oregon
ODOT maintains extensive GIS layers that are shared with the local governments in the development of their plans. ODOT has also developed the Features, Attributes, and Conditions Survey – Statewide Transportation Improvement Program (FACSTIP) asset management tool to allow individuals involved in project scoping and development to quickly assess information on the system’s conditions. This visualization tool allows users to access proposed STIP projects as well as the conditions of pavement, bridges, culverts, and other assets overlaid on an arterial photo.
52 Toward a Standardized Land use Coding Standard, http://www.planning.org/lbcs/background/scopingpaper.htm
8-2
Georgia
GDOT’s AMPS Web-based access permit application database is a communication tool that contains all new access permit applications and their processing status. Project managers can use the information to preserve ROW by having a developer implement improvements, set up escrow accounts, or dedicate land or maintain a buffer for a desired typical section. The system links to a GIS network that covers all state routes. The database also contains GIS square footage of buildings, housing permits, building permits, and can track where growth and development is occurring.
Minnesota
MnDOT’s Real Estate Acquisition Land Management System (REALMS) uses GIS to manage ROW, allowing both the agency to eliminate paper files and ROW agents to use a central database. The database includes parcel layers from the MnDOT district office, tax parcel maps from the counties, letters, plats, and approvals. This system served as a driving force for:
n Consistency and conformity of business processes in terms of appraisal forms, condemnation forms, and other paperwork
n Reduction of paper files
n Management of each parcel by ROW managers
Tools for Desired Land Use Management and ForecastingFlorida
FDOT and the Whitehouse Group are in the process of building the Florida Standard for Urban Transportation Modeling Structure53 (FSUTMS) land use model framework. Federal requirements for consistent land use forecasting have led FDOT seek analytic methods and planning within transportation forecasting. MPOs traditionally take a lead role in land use forecasts; however, some have deferred the role to the DOT. FSUTMS fosters trust in the modeling land use and transportation assumptions that can ultimately facilitate local, regional, statewide, and perhaps private (i.e., developer) determination to collaboratively preserve transportation corridors.
The model task force includes representatives from MPOs, district offices, RPOs, and other stakeholders. The meetings are a forum for all stakeholders to have a voice in what should be incorporated into the standardized models. Although this process is in the early stages, the model has a standardized modeling structure (i.e., common software and platform,
C H A P T E R 8 : DATA U S E A N DAVA I L A B I L I T Y
8-3BEST PRACTICES FOR RISK-BASED FORECASTS OF LAND VOLATILITY FOR CORRIDOR MANAGEMENT AND SUSTAINABLE COMMUNITIES
centralized training, sharing of data and surveys, and variations within model from MPO to MPO). It also considers the cost of data collection and processing, time to develop and implement, staff time and training, run time, and initial and recurring costs.
the cost of data collection and processing, time to develop and implement, staff time and training, run time, and initial and recurring costs.
Virginia
A partnership between VDOT and the University of Virginia led to the development of the Virginia Land Development Forecasting and Prioritization System (VLDFPS) to forecast of the risk of land-development to transportation assets for the primary systems in several Virginia counties54.
VDOT and the statewide multimodal planning process (VTrans) have focused on land use and access management in corridor analyses with two- and 20-year horizons, with less attention to the five-to-10-year horizon. The process includes a layering of methods, including:
n Use of predictive modeling using elicitation of factors most influencing land development
n Identification of combinations of factors influencing land development
n Use of public geospatial data sources
n Filtering of factors through a scenario-based influence diagram
n Consideration of several perspectives influencing land development (e.g., demographic, economic, land-use, and suitability for development)
n Use of decision tree analysis to evaluate corridor protection alternatives
n Use of rule-based modeling
n Use of state transition modeling
Figure 8.1 shows the estimated likelihood in the baseline scenario of land development along the corridors of the Virginia Statewide Mobility System. The darker areas have the highest likelihood of development within one mile of the corridor, while the lighter areas have the lowest likelihood. Using the data and influence diagram output, spatial analysis is used to estimate the likelihood of land development for relatively small sections of corridor and create graphical scalable outputs. Figure 8.2 shows a sample balancing/weighting of costs, benefits, and likelihoods to identify priority corridors for investment using decision tree analysis.
54 University of Virginia Center for Risk Management of Engineering Systems, Land Development Risk Analysis for the Statewide Mobility System, Charlottesville, undated, www.virginia.edu/crmes/corridorprotection/ (accessed January 28, 2011)
8-4
C H A P T E R 8 : DATA U S E A N DAVA I L A B I L I T Y
Figure 8.1 Likelihood of land development along transportation infrastructure vulnerable to adjacent land development, an example for the Virginia Statewide Mobility System (Source: VDOT, University of Virginia55)
Figure 8.2 Risk management of land development adjacent to multimodal trans portation corridors, suggesting the local triggers for land acquisition or other management actions (Source: VDOT, University of Virginia44)
55 Thekdi SA and JH Lambert, Decision analysis and risk models for land development affecting infrastructure systems, to appear in Risk Analysis: An International Journal, 2011
8-5BEST PRACTICES FOR RISK-BASED FORECASTS OF LAND VOLATILITY FOR CORRIDOR MANAGEMENT AND SUSTAINABLE COMMUNITIES
Other Tools for Coordination of Transportation and Land UseMinnesota
MnDOT has utilized the economic real estate model Cube Land56 to identify areas expected to experience development pressures and, ultimately, aid in the prioritization of RALF projects. The model:
n Emphasizes accessibility and development by considering localized development potential
n May have the potential to be a marketing tool to recruit companies
n Studies interactions among demand, rent, and supply models and constraints
n Outputs land use, real estate units, households, and employees for each transportation analysis zone
n Uses national and historic trends for households, population, and employment
n Allocates to transportation analysis zone areas with Regional Economic Models, Inc.57 (REMI)
n Is responsive to changes in accessibility at highway and transit
n Considers the impact of various scenarios
n Considers willingness to pay for locations and probabilistic demand
MnDOT performs several iterations and averages the results while seeking equilibrium. The model output is the number of real estate units, land use, number of employees, and number households. The agency performs sensitivity tests to test the model’s response to changes in inputs. Output can be translated to regional impacts on the economy.
Montana
The MTDOT Highway Economic Analysis Tool58 (HEAT) tool evaluates the impact of an improvement along a corridor in terms of attracting businesses. The planning level cost-estimation tool from the HEAT program is used to assess the impacts of roads and consequently the effect of the change on businesses. The model runs on a GIS platform and is used as a desktop application. The model measures project development costs, travel performance impact, industry analysis, tourism (i.e., input), and business location estimates. MTDOT then uses REMI to translate the results to gross domestic product, employment, and tourism impacts.
56 Cube Land Land Use Forecasting, Citilabs, http://www.citilabs.com/products/cube/cube-land 57 The REMI Model, Transportation, http://www.remi.com/the-remi-model/topic-areas/transportation 58 Highway Economic Analysis Tool, Cambridge Systematics, http://www.camsys.com/pro_planpro_heat.htm
8-6
C H A P T E R 8 : DATA U S E A N DAVA I L A B I L I T Y
California
SACOG and Caltrans have developed activity-based models to demonstrate how people make decisions and expand beyond traditional four-step models. For example, the tour-based models allow mode choice to be conditioned on what residents do during the day.
Using computational resources allows the agency to tie performance back to individual households, consider miles traveled per household, quantify congestion, consider mode choice by household, and aggregate by demographic factors. The organizations have also used the models for some isolated economic work and for estimating the value of time when a construction project is completed early. They have also worked to combine the effort to forecast housing, land use, and transportation needs and have identified how much of the growth lies within the existing zoning and how much requires policy change.
Georgia
GDOT and ARC have used the Corridor Traffic Simulation Model59 (CORSIM) to evaluate the impact of access points and the REMI model for county-level economic forecasting. ARC has also used the Production, Exchange and Consumption Allocation System60 model to forecast square footage costs of real estate for land use and growth.
Florida
FDOT’s ETDM process is a tool that transformed the agency’s coordination processes by providing early involvement, assisting with evaluation of alternatives based on agency-provided criteria/data sets, and providing the opportunity to share the project early using a GIS environmental screening Web-based tool. The ETDM process provides:
n A Web-based means to communicate and archive project planning developments and commitments
n Support for agencies to centralize simultaneous opportunities to review and comment on conceptual projects
n Alternatives analysis
n Continuous updating/review opportunities
The ETDM process steps are data entry, GIS analysis, project review, and summary reports. During the prescreening phase, the tool assists with comparison and prioritization of projects and identifies environmental issues. The project review phase coordinates and evaluates projects and stakeholders. The 550 GIS data layers and 200 defined analyses are continuously updated based on a predetermined agreed-upon schedule. The summary report consists of degrees of effect, including a color-coded summary of effects,
59 CTSIS-CORSIM, McTRANS™ Moving Technology, http://mctrans.ce.ufl.edu/featured/tsis/ 60 Production, Exchange, and Consumption Allocation System, Urban Land Use and Transportation Center, University of California—Davis, http://pecas.ultrans.ucdavis.edu/
8-7BEST PRACTICES FOR RISK-BASED FORECASTS OF LAND VOLATILITY FOR CORRIDOR MANAGEMENT AND SUSTAINABLE COMMUNITIES
commitments, federal consistency determination, purpose and need statement, GIS maps showing environmental resources, technical studies, permits and conditions, and commitments and recommendations. The ETDM process and reporting are excellent tools to memorialize the decision-making process as well as any commitments made during the selection of the preferred alternative.
Analytical Tools for Future Corridor Planning Florida
FDOT, with assistance from a transportation consultant, has developed the Alternative Analysis Research Tool (AART), an automated tool to aid in the identification of potential and preferred transportation corridors. The suitability surface identifies second-best and other potential corridors or segments for the least-impact path. Although few new alignments are being proposed, the tool could also be utilized to compare and select bypasses, as well as widening and alignment improvements.
AART allows FDOT to meet NEPA requirements, provide a streamlined automated framework, and quickly respond to the public after evaluating proposed changes. This tool uses GIS and advanced datasets to identify new corridors of the shortest distance and with the least environmental impact to surroundings, thus minimizing risks.
The methodology involves initial identification of numerous corridors, eventually short-listing them based on ranking criteria developed through the coordination of a diverse group of stakeholders. The criteria-ranking feature of AART compares attributes with a rank of between 1 and 10. A higher rank implies that the project should be discouraged near some attribute (i.e., higher repels, lower attracts). The influence ranking allows for comparison among layers, each layer showing a group of attributes. Each layer is a given a weight (i.e., environmental = x, infrastructure = y, and culture = z) such that weights total 100% (i.e., x + y + z = 100%). The user can specify areas that should be avoided in case of unique wetlands, protected species, historic structure, archeology, and other factors.
AART makes use of the Florida Geographic Data Library, which has statewide parcel coverage but only summarizes assessed values rather than an estimate of ROW costs. Within the statewide corridor transportation alternative study, office responsibilities are:
n District—sketch interstate plan
n Regional—corridor master action plan
n Local—project development and environmental review
Oregon
ODOT is in the process of developing a Least Cost Planning Tool (LCPT), intended for use at the regional level. The LCPT would typically include more than one corridor and assess a group of actions (e.g., highway improvements and increased transit). The output would
8-8
C H A P T E R 8 : DATA U S E A N DAVA I L A B I L I T Y
match up to a series of performance indications ranging from mobility and accessibility to quality of life concerns from the community.
C H A P T E R 9 : F U R T H E R O B S E R VAT I O N S
9-1BEST PRACTICES FOR RISK-BASED FORECASTS OF LAND VOLATILITY FOR CORRIDOR MANAGEMENT AND SUSTAINABLE COMMUNITIES
9.0 Further Observations
In addition to the scan’s findings and recommendations, other important observations made during the scan include the following.
n Many of the identified tools assume availability of funding. Given current economic conditions, many agencies have transitioned their focus to small projects with immediate high ROI activities. As a result, many agencies recognize that low-cost/high-benefit investment and prioritization strategies prove to be beneficial in both favorable and unfavorable economic conditions.
n Looking at the big picture is something that many progressive agencies have in common, as they have a regional focus, rather than a piecemeal perspective.
n There is a need to interweave the various fractured tools together for a more comprehensive decision-making system. Unfortunately, the scan research found no existing comprehensive methodology that could be applied or scaled to fit various situations. Interviews with the scan sites uncovered a vast inequity of resources among similar entities that were operating in differing political climates.
n Several states demonstrated leadership in growth optimization. NCDOT through the MOU process, PennDOT through education, and FDOT through documentation of its decision points all achieved unity in purpose and goals while building partnerships with stakeholders and peers.
n Utah, Washington, and other states are notable for their holistic view of how roads connect through and to communities.
C H A P T E R 1 0 : C O M PA R I S O N A N D C O N T R A S T W I T H T Y P I C A L P R A C T I C E
10-1BEST PRACTICES FOR RISK-BASED FORECASTS OF LAND VOLATILITY FOR CORRIDOR MANAGEMENT AND SUSTAINABLE COMMUNITIES
10.0 Comparison and Contrast with Typical Practice Overview
Each of the sites visited is noteworthy for process documentation, databases, and educational outreach. The Pennsylvania method of collecting documentation for TIP and eventually STIP is valuable for documentation purposes. Virginia’s process, which is similar, is still in a conceptual stage. These are all tools that
could be worked into a methodology to put into corridors that need to be preserved.
Florida, driven by the environmental risk side, collects obstacles to implementation and links NEPA and planning in the early stages. Pennsylvania is holistic in project value by delivering a project through the process. The common thread that made both processes successful is the involvement and support of organizations in developing and endorsing tools.
FDOT, PennDOT, and NORPC invested many resources in developing their partnerships before they tried to utilize them, and each partnership is the result of varying motivations:
n FDOT—funds MPO positions, with a focus on addressing environmental issues
n NORPC—became a de facto resource, emerging from a natural disaster as a leader
n PennDOT—provides the necessary manuals and tools, building initiatives based on the political focus of leaders
FDOT’s tools encourage sharing and maintaining consistent information on project development, whether EDTM, AART, or its modeling work. Given the size of the state and the diversity of its MPOs and local government, FDOT is developing tools that will allow for agreement on the information and methods used to analyze the data from a variety of partners. These efforts have an inherent efficiency that reduces the time needed for decision making, which also minimizes opportunities for decision appeals.
NORPC is notable for maintaining a highly valuable database consisting of utilities, demographics, population characteristics, and data. Its most valuable tool is its modeling by generating data, keeping it updated, and distributing it to those in need. The INDEX model will lead to further enhancements of its transit system by promoting dense, livable, walkable cities. Although use of the data in an INDEX model is not oriented for this extreme situation, there is value in the objectiveness of the data and analysis methods. NORPC’s creative use of surrogate variables for model parameters allows for understanding of features that may not otherwise be available. The INDEX model is all
10-2
C H A P T E R 1 0 : C O M PA R I S O N A N D C O N T R A S T W I T H T Y P I C A L P R A C T I C E
about scenario planning: what is the plausible future, based on assumptions. By keeping the modeling in-house, NORPC is able to maintain the technical expertise of and continue the educational outreach to interested parties. The use of the INDEX model is significantly enhanced by the strong and entrenched coordination efforts that exist between NORPC and the local governments, because these governments provide some of the data.
Florida’s approach to access management, with guidance documents or the review of local government techniques, is invaluable. The training around the benefit to the system (in particular, how it increases the system life span) resonates with local governments when coupled with safety advantages.
NORPC is a leader in partnership with other municipalities through outreach and education. It has been particularly successful in obtaining nontraditional funding though grants. It also appears that it is more focused around project management than may be typical for an MPO. This gives NORPC some leeway and knowledge about which projects need to be done in support of the corridors and guiding the corridors that they want with financial support.
GDOT’s AMPS tool presents an opportunity to identify, monitor, and communicate land use changes and potential impacts along corridors. Combined with other tools, AMPS could provide a mechanism to predict potential highway improvement and modal and transit needs.
ARC’s Strategic Regional Thoroughfare Plan process provides a defined opportunity to gain regional consensus on the definitions for “regional” and “thoroughfare” and coordinated prioritization of modal corridors, including bikers, transit riders, pedestrians, and automobile and truck drivers.
Tools, Processes, Functional Conditions, and Tool Compatibility with Functional RequirementsTable 10.1 summarizes the most relevant tools and processes studied during the scan. The relevance of protective actions for corridor preservation is dependent upon the individual conditions and initiatives of each site (e.g., existing corridor preservation, new corridor preservation, sites focused on environmental regulations, states with funding shortages, states with increased funding opportunities, sites recovering from natural disasters, and others).
Table 10.2 summarizes the functional conditions of each scan visit site as discussed during the scan meetings. The functional conditions are:
n Project perspective—local initiatives (e.g., a risk-based focus, multimodal focus, environmental conditions, and recovery from catastrophe)
n System maturity—the level of transportation system expansion that is expected to occur in the future
10-3BEST PRACTICES FOR RISK-BASED FORECASTS OF LAND VOLATILITY FOR CORRIDOR MANAGEMENT AND SUSTAINABLE COMMUNITIES
n Proactivity—local initiatives for forecasting land development and promoting desired land uses
n Transparency and political awareness—local initiatives for coordination and transparency of decisions
n Decision making—local initiatives for objective or automated decision making for corridor protection
n Coordination and communication—local needs for data sharing among stakeholders
n Data and quantitative tools—the availability and interactivity of databases and automated models for corridor protection decision making
n Building awareness for risk and implications for corridor management—training and written resources for encouraging corridor protection
n Funding—local initiatives for seeking alternative funding sources, methods for prioritizing limited funding, and low-cost/high-benefit investment selection
The absence of a checkmark in Table 10.2 implies that a particular functional requirement was not a focus of the scan discussion; it does not imply that the agency does not have the functional requirement in place.
Table 10.3 summarizes the compatibility of the elicited tools with the functional requirements of agencies. A fully shaded circle represents full compatibility, a partially shaded circle represents indirect compatibility, and an empty circle represents no compatibility or no information.
Scan site Process/method/tool
FDOT Efficient Transportation Decision Making (ETDM)
Memorandum of Understanding (MOU)
Florida Standard for Urban Transportation Modeling Structure (FSUTMS)
Alternative Analysis Research Tool (AART)
La DOTD, NORPC INDEX model
VDOT Access Control Prioritization System (ACPS)
Virginia Land Development Forecasting and Prioritization System (VLDFPS)
PennDOT Smart Transportation Initiative (STI)
Policies and Procedures for Transportation Impact Studies (PPTIS)
Linking Planning and NEPA Screening Forms System (LPN)
Pennsylvania Community Transportation Initiative (PCTI)
Smart Growth Transportation Program (SGT)
GRTA, GDOT, Access Management Permit System (AMPS)
ARC Unified Growth Policy Map (UGPM)
10-4
Scan site Process/method/tool
Livable Centers Initiative (LCI)
MnDOT Right of Way Acquisition Loan Fund (RALF)
Transportation Policy Plan (TPP)
Real Estate Acquisition Land Management System (REALMS)
Table 10.3 Requirements of corridor risk management compared with selected analytical tools of the DOTs and regions
10-8BEST PRACTICES FOR RISK-BASED FORECASTS OF LAND VOLATILITY FOR CORRIDOR MANAGEMENT AND SUSTAINABLE COMMUNITIES
FL LA VA PA GA MN MT UT NC CA AZ OR
ET
DM
MO
U
FS
UT
MS
AA
RT
IND
EX
AC
PS
VL
DF
PS
ST
I
LP
N
PC
TI
SG
T
AM
PS
UG
PM
LC
I
RA
LF
TP
P
RE
AL
MS
MO
U
HE
AT
CP
RF
MO
U
SC
S
RL
P
FA
CS
TIP
TP
OD
LC
PT
Transparency and political awareness
Promote coordination l l l l l l l l l l l l l l l l l l l l l l l l ¡ l Transparency of approach l l ¡ ¡ ¡ ¡ ¡ ¡ ¡ ¡ ¡ ¡ ¡ ¡ ¡ ¡ ¡ l ¡ ¡ l ¡ ¡ ¡ ¡ £Decision making
Data sharing l ¡ ¡ ¡ l ¡ ¡ ¡ l ¡ ¡ ¡ ¡ ¡ ¡ ¡ ¡ ¡ ¡ ¡ ¡ ¡ ¡ l l ¡Data and quantitative tools
Availability of data l ¡ ¡ ¡ l ¡ ¡ ¡ l ¡ ¡ l ¡ ¡ ¡ ¡ l ¡ ¡ ¡ ¡ ¡ ¡ l l ¡ Interactive databases l ¡ ¡ ¡ ¡ ¡ ¡ ¡ l ¡ ¡ ¡ l ¡ ¡ ¡ l ¡ ¡ ¡ ¡ ¡ ¡ £ l ¡ Automated decision
investments¡ ¡ ¡ ¡ ¡ l ¡ l ¡ l l ¡ ¡ l ¡ ¡ ¡ ¡ ¡ ¡ ¡ ¡ ¡ ¡ ¡ l
l= Full compatibility £= Indirect compatibility ¡= No compatibility or no information
Table 10.3 Requirements of corridor risk management compared with selected analytical tools of the DOTs and regions, cont’d.
C H A P T E R 1 1 : R E C O M M E N DAT I O N S
11-1BEST PRACTICES FOR RISK-BASED FORECASTS OF LAND VOLATILITY FOR CORRIDOR MANAGEMENT AND SUSTAINABLE COMMUNITIES
11.0 Recommendations
Based on the preceding findings, the scan team identified the following recommen-dations:
n Stakeholder coordination—State agencies, MPOs, local governments, economic development groups, and others share the responsibility of identifying means to preserve the system. State DOTs should and can start the conversation with data; however, they need to coordinate with MPOs and others in local government. Enabling local officials to serve as champions has been effective.
n Integrated perspective—Agencies should not look at transportation corridor preservation in isolation. Rather, they should consider the role of transportation in land use, prioritization, funding, the economy, and other areas.
n Risk management—The impact of land development on transportation corridors should be analyzed and addressed as a source of risk to corridor performance and communities.
n Education—This report provides several examples of educational guidebooks, workshops, and Web-based toolkits used to facilitate efficient and proactive land use decision-making at various levels of government.
n Data—The collection and use of accurate system data is helpful in the management of corridors. For example, NORPC served as a clearinghouse for critical emergency response data and some agencies have leveraged data to better coordinate stakeholder involvement.
n Performance measures—The risk-based study topic implies measurements that are comparable with health, safety, and environment. VDOT assessed access along corridors to quantify changes at the local level. Several agencies have used electronic access-management permit systems; however, they have greater opportunity for tracking detail. Organizations should also look at benefits (i.e., economic and others) for compliance with recommendations.
n Prioritization in context of resources—A filtering/prioritization process needs to be used to ensure that projects in the TIP/STIP align with regional goals. Limited funds have shifted from projects into preserving/conserving existing facilities.
n Resources—Despite the varied availability of funding, agencies still need to be prepared to respond to the expected growing demand. They need to spend the limited funds more wisely. Additionally, agencies must seek out additional funds, if necessary, through levies, taxes, surcharges, or other methods.
11-2
C H A P T E R 1 1 : R E C O M M E N DAT I O N S
n Transparency—Bringing objective evidence to the decision-making process can help ameliorate uncertainties.
n Proactivity—Agencies must be prepared to respond to future/current demand. Funds must be allocated wisely to enable agencies to position themselves to respond when funding is available.
n Multimodal integration—Preservation of corridors includes providing multimodal facilities in lieu of roadway expansion. Transitionally, corridor preservation entailed only access management with lane and capacity improvements. Modern methods involve replacing car trips with alternative modes.
n Quantitative tools—Emerging technologies have driven decision-making sophistication. Availability of data from geospatial databases have allowed agencies to display, retrieve, and show relevance to the system while providing details and visualizations at the parcel level.
C H A P T E R 1 2 : R E C O M M E N DAT I O N S
12-1BEST PRACTICES FOR RISK-BASED FORECASTS OF LAND VOLATILITY FOR CORRIDOR MANAGEMENT AND SUSTAINABLE COMMUNITIES
12.0 Recommendations
T he implementation strategy is designed to promote awareness of the scan’s results by local officials, DOTs, and regional planning organizations. The components of the implementation strategy are:
n Develop an NCHRP 20-7 research statement on how to educate and engage local officials in corridor management and risk management
n Develop and field a survey to characterize training opportunities for corridor management and risk management
n Develop a webinar to present scan findings, including presentations by host agencies, on the following topics
l Risk management
l Local coordination
l Access management tools and processes
l ROW and advance acquisition
l Innovative funding and policies
l Data and information systems
n Make a presentation to the American Metropolitan Planning Organization
n Make a TRB poster presentation or conduct a workshop with the AASHTO Standing Committee on Planning, the TRB Committee on Land Development, and the AASHTO Committee on Geographic Information Systems
n Make presentations to team members’ home organizations
n Promote performance measures for corridor protection and improvement
n Track and respond to regulatory changes, including flexibility in application of rules for advance acquisition, preservation of ROW, and other relevant topics
n Make a presentation to AASHTO
n Promote the topic of corridor risk management in the international World Roads Association
n Publish one or more archival journal papers on risk management and corridor development
The scan’s chair and contractor Arora and Associates are guiding the implementation strategy.
A P P E N D I X A : A M P L I F Y I N G Q U E S T I O N S
A-1BEST PRACTICES FOR RISK-BASED FORECASTS OF LAND VOLATILITY FOR CORRIDOR MANAGEMENT AND SUSTAINABLE COMMUNITIES
Appendix A:
Amplifying Questions
A-2
A P P E N D I X A : A M P L I F Y I N G Q U E S T I O N S
The scan team developed the following amplifying questions for the participating DOTs and entities selected for site visits. There is no implied order of importance to the questions, and the relative focus and interests of the agencies across these questions are expected to be different.
1. Corridor management methods to address strategies to promote desired land use
1.1. Provide an overall assessment of how your organization identifies corridors that need focused attention due to land development.
1.2. Describe state and local legislation regarding coordination between transportation and land use.
1.3. Describe the actions used in response to unexpected land development.
1.4. Describe the managing parties for these actions, from planning to implementation.
1.5. Describe the tools, technologies, policies, datasets, and procedures, allowing for interaction between land use developers, local agencies, and/or the DOT for land use decisions.
1.6. Describe actions used to prepare for land development.
1.7. Describe the managing parties for these actions, from planning to implementation.
1.8. Describe methods used to forecast land development and identify corridors requiring investment during the planning process.
1.9. Describe the use and role of access management plans, corridor management plans, and other studies. Describe how they are used to promote desired land uses along these corridors.
1.10. any political (including legislative), economic, or social factors that have impacted efforts discussed in the previous questions.
1.11. Describe any other obstacles/constraints to addressing land use by the DOT and how they were corrected.
1.12. Describe notable exceptions to the methods discussed earlier.
1.13. Describe the types of areas that receive greater consideration for proactive steps (e.g., urban or rural).
1.14. Describe when right-of-way involvement begins and what tools are utilized.
1.15. Describe performance measures and targets (e.g., financial, safety, congestion, or other qualitative) to evaluate a program.
A-3BEST PRACTICES FOR RISK-BASED FORECASTS OF LAND VOLATILITY FOR CORRIDOR MANAGEMENT AND SUSTAINABLE COMMUNITIES
2. Special/distinguishing characters of the local situation
2.1. Provide an overview of how your agency is organized. In particular, describe the structural relationship between corridor management and land use. Describe any obstacles or challenges in coordinating land use and transportation due to the current organizational structure and how you have or are working to overcome them.
2.2. Describe the coordination and responsibilities among the state DOT, MPOs, and localities for the consideration of land use and development of plans (e.g., TIPs, LRTP, or metropolitan transportation plan, etc.).
2.3. Describe your state’s public transportation programs in terms of corridor ownership and maintenance.
2.4. Describe the frequency and duration for program updates in terms of new TIPs, STIPs, and other plans.
2.5. Describe transportation program funding sources for each transportation mode in terms of:
n Federal funds
n Toll corridors
n State funding
n Local government funding
n Impact fees
n Other innovative funding
2.6. Describe how funds from the previous question are allocated towards corridor preservation, corridor management, and access management plans.
2.7. Describe any current projects directly related to corridor management and/or related promotion of desired land use.
2.8. Describe any impacts of land development on congestion, mobility/ accessibility, freight movement, and safety within your organization.
2.9. Describe what policies and funding mechanisms are followed for real estate activities in corridor protection/preservation (e.g., advanced acquisition, development rights, or development agreements).
A-4
A P P E N D I X A : A M P L I F Y I N G Q U E S T I O N S
3.Financial needs for corridor management to address strategies to promote desired land use
3.1. Describe the funding prioritization and allocation process for corridor management.
3.2. Describe if and how funds are made available for advanced acquisition of right of way.
3.3. Describe the source of the aforementioned funding.
3.4. Describe where in the NEPA process this is accomplished.
3.5. Describe whether funding is specifically set aside for corridor management and corridor preservation.
3.6. Describe the perceived tradeoffs between corridor performance (e.g., congestion or travel time) and cost in response to strategies to promote desired land use.
3.7. Describe return on investment models to address protection/preservation of corridors and strategies to promote desired land use.
3.8. Describe any cost/benefit analysis to address protection of corridors and strategies to promote desired land use
4. Transferability and general lessons to be learned
4.1. Describe if and how decision making for corridor management will be improved or implemented over time.
4.2. Describe any incentive programs for localities to develop in a particular way and coordinate development with other agencies.
4.3. Describe methods and ideas explored that are transferable to other states and localities.
4.4. Describe any potential future collaboration among regions to improve corridor management.
4.5. Describe whether results are transferrable to other transportation modes besides highways.
4.6. Describe any other general information (i.e., Is there anything else that might help us with this study effort?).
4.7. Describe other initiatives of your organization relating to land management plans with localities (e.g., procedures or policies).
A P P E N D I X B : S C A N T E A M C O N TA C T I N F O R M AT I O N
B-1BEST PRACTICES FOR RISK-BASED FORECASTS OF LAND VOLATILITY FOR CORRIDOR MANAGEMENT AND SUSTAINABLE COMMUNITIES
Appendix B:
Scan Team Contact Information
B-2
A P P E N D I X B : S C A N T E A M C O N TA C T I N F O R M AT I O N
Marsha C. Fiol – AASHTO Chair Transportation and Mobility Planning Director Virginia Department of Transportation Transportation and Mobility Planning Division 1401 East Broad St. Richmond, VA 23219 Phone: (804) 786-2985 E-mail: [email protected]
Matthew W. DeLong Administrator, Real Estate Division Michigan Department of Transportation Bureau of Highway Development 425 W. Ottawa St. PO Box 30050 Lansing, MI 48909 Phone: (517) 373-2200 Direct: (517) 373-2717 Fax: (517) 373-2209 E-mail: [email protected]
Polina Knaster, PE PMP District Program Manager, Right of Way Central District New Jersey Department of Transportation PO Box 600 Trenton, NJ 08625 Phone: (732) 625-4261 Fax: (732) 625-4270 E-mail: [email protected]
Charla Glendening, AICP Senior Transportation Planner Arizona Department of Transportation Multimodal Planning Division 206 S. 17th Ave., Mail Drop 310B Phoenix, AZ 85007 Phone: (602) 712-7376 E-mail: [email protected]
B-3BEST PRACTICES FOR RISK-BASED FORECASTS OF LAND VOLATILITY FOR CORRIDOR MANAGEMENT AND SUSTAINABLE COMMUNITIES
Jerri Bohard Transportation Development Division Administrator Oregon Department of Transportation 555 13th Street, NE Mill Creek Office Park, Suite 2 Salem, OR 97310 Phone: (503) 986-3435 E-mail: [email protected]
Charlene Kay, PE Eastern Region Transportation Planning Manager Washington State Department of Transportation 2714 North Mayfair St. Spokane, WA 99207-2090 Phone: (509) 324-6195 Fax: (509) 324-6005 E-mail: [email protected]
James H. Lambert, PE, D.WRE, PhD – SME Assistant Director, Center for Risk Management of Engineering Systems Research Associate Professor, Department of Systems and Information Engineering University of Virginia PO Box 400747 112C Olsson Hall, 151 Engineers Way Charlottesville, VA 22904 Phone: (434) 982-2072/ (434) 924-0960 Fax: (434) 924-0865 E-mail: [email protected]
Shital Thekdi, PhD – Assistant to SME Consultant Department of Systems and Information Engineering University of Virginia PO Box 400747 Charlottesville, VA 22904 Phone: (734) 945-3945 E-mail: [email protected]
A P P E N D I X C : S C A N T E A M B I O G R A P H I C A L S K E T C H E S
C-1BEST PRACTICES FOR RISK-BASED FORECASTS OF LAND VOLATILITY FOR CORRIDOR MANAGEMENT AND SUSTAINABLE COMMUNITIES
Appendix C:
Scan Team Biographical Sketches
C-2
A P P E N D I X C : S C A N T E A M B I O G R A P H I C A L S K E T C H E S
MARSHA FIOL (AASHTO CHAIR) serves as State Transportation Planner for the Virginia Department of Transportation (VDOT). In this role, she oversees the functions related to the department’s land development efforts, as well as the agency’s transportation planning efforts in the central and district offices. She has more than two decades’ experience working with VDOT in traffic engineering, permitting, project funding, and transportation planning positions, both in the field offices and in the central office. Fiol has served as Program Manager for the Rural Transportation Planning Program, as Section Manager for the Statewide Policy and Planning Section, and as a representative on the commonwealth’s Multimodal Advisory Committee. She also served as Assistant Division Administrator for Policy and Planning in VDOT’s Transportation and Mobility Planning Division prior to taking on the position of Administrator of the Transportation and Mobility Planning Division. She serves as Chairman for the Virginia Center for Transportation and Innovation Research – Transportation Planning Research Advisory Committee (TPRAC), and was a past committee member of the Transportation and Housing Alliance Grant Program and the Virginia Multimodal Grant Program. Fiol serves as the Virginia representative on the Institute for Trade and Transportation Studies Advisory Committee. She serves on the Transportation Research Board’s Standing Committee on Transportation Planning for Small and Medium-Sized Communities and serves as a panel member on the National Cooperative Highway Research Program’s Domestic Scan Program. She has participated in efforts to develop the Governor’s Multimodal Strategic Plan for the Commonwealth of Virginia, VDOT’s Business (Strategic) Plan, and the Commonwealth Transportation Board’s Strategic Plan.
JAMES H. LAMBERT (SUBJECT MATTER EXPERT) is the Associate Director of the Center for Risk Management of Engineering Systems and a Research Associate Professor of Systems and Information Engineering at the University of Virginia. He has been a principal investigator for more than 30 projects since 1996 involving risk management, infrastructure systems, and multimodal transportation. He is an author/coauthor of more than 60 publications in archival journals and numerous other conference papers and technical reports. Lambert has led efforts to model risk of land development adjacent to multimodal transportation systems. He is a licensed professional engineer and Diplomate of the American Academy of Water Resources Engineers, a specialty certification of the American Society of Civil Engineers. Lambert received his PhD and master of science degrees in Civil Engineering from University of Virginia and his bachelor’s degree from Princeton University.
MATTHEW DELONG is the Administrator of the Michigan Department of Transporta-tion’s (MDOT’s) Real Estate Division. For the past nine years DeLong has overseen all phases of MDOT’s real estate operations, including appraisal, acquisition, relocation, and property management, and is responsible for all advanced acquisition activities and permitting functions for MDOT. DeLong is the Vice-Chair of the AASHTO Subcommittee on Right of Way and Utilities and has served on several AASHTO/NCHRP research panels, most recently as Co-Chair of the International Scan on Outdoor Advertising Control. He
C-3BEST PRACTICES FOR RISK-BASED FORECASTS OF LAND VOLATILITY FOR CORRIDOR MANAGEMENT AND SUSTAINABLE COMMUNITIES
has worked for the State of Michigan and MDOT since 1986, holding positions with the legislature, the State Transportation Commission, the Director’s Office, and served as a Region Administrator. DeLong holds master’s and bachelor’s degrees in Civil Engineering from Michigan State University.
POLINA KNASTER is a Program Manager in the Division of Right of Way and Access Management in the New Jersey Department of Transportation (NJDOT). In this role, she is responsible for delivery of all necessary ROW services throughout the life cycle of capital projects, from concept development through construction. Her work includes developing and administering ROW training for DOT staff and consulting firms, leading the effort to develop the design guidelines section for the ROW Engineering Manual to optimize ROW acquisition and make various process improvements to benefit the delivery of NJDOT capital projects. Knaster has worked for NJDOT for 25 years and has served as a senior engineer and a project manager. She holds a master’s degree in engineering management from the New Jersey Institute of Technology and a bachelor’s degree in Civil Engineering from Polytechnic Institute of New York. She is a licensed professional engineer and a certified Project Management Professional.
CHARLA GLENDENING is a Senior Transportation Planner for the Arizona Department of Transportation (ADOT) in Phoenix. She serves as the ADOT liaison to metropolitan planning organizations and the Council of Governments. Glendening is the ADOT Project Manager for numerous transportation planning studies and, in recent years, has specialized in issues related to rural areas. Her experience also includes six years in the private sector as a Land Use Consultant and six years as a City Planner for the City of Phoenix. She received her bachelor’s degree in Urban Planning from the University of Colorado, Boulder. She is a certified professional planner through the American Planning Association.
JERRI BOHARD is the Administrator for the Transportation Development Division (TDD) for the Oregon Department of Transportation (ODOT). In this role, she is responsible for the oversight of the agency’s research program, its asset management integration efforts, its long-range planning and policy efforts, and ODOT’s data collection and mapping needs, both in support of the federal requirements and to meet the needs of ODOT’s five regional offices. During the past year, she served as the Interim Deputy Director for Operations, a new position reflecting the agency’s emphasis on becoming a multimodal agency. This effort lead to the integration of the divisions of Rail, Transit, Highway, and Safety, along with the Transportation Program Office and the Office of Innovative Partnerships. The Transportation Development Division is the part of ODOT that works with local governments and the agency’s regional offices to develop long- and short-term transportation planning that is integrated with the local governments’ land use plans and the economic development opportunities at the local and state level. TDD is responsible for producing the long-range Oregon Transportation Plan, the Oregon Highway Plan, and individual plans for specific highway corridors. Bohard is a member
C-4
A P P E N D I X C : S C A N T E A M B I O G R A P H I C A L S K E T C H E S
of AASHTO’s Standing Committee on Planning and the TRB Statewide Multimodal Transportation Planning Committee. She received her master’s degree from Texas A&M University and her bachelor’s degree from Jacksonville University, Florida.
CHARLENE KAY is the Eastern Region Transportation Planning Manager for the Washington State Department of Transportation (WSDOT). During the past 24 years, Kay has served the department in the areas of construction, design, and planning. Currently, she serves as the agency’s representative on several regional and community planning advisory boards and technical committees, including the Inland Pacific Hub and the North-East Area Development Advisory Board. Kay leads a team that collaborates with various metropolitan and regional transportation planning organizations, local jurisdictions, tribes, transit providers, modal organizations, and stakeholders. Her office provides technical advice and assistance on regional transportation matters, including current land use and long-range comprehensive planning, and conducts a variety of extensive planning studies, with an emphasis in performance measures, modeling, GIS analysis, and freight issues. She serves on the professional advisory committee for the Eastern Washington University (EWU) School of Public Administration and is a guest lecturer for EWU’s Urban and Regional Planning Department on the topic of transportation planning. She is an Eno Transportation Foundation Leadership Development Conference fellow and is a member of the Young Professionals in Transportation. As a licensed Professional Civil Engineer, Kay received her bachelor of science degree from Temple University and holds master’s degrees in urban and regional planning and public administration from EWU.
A P P E N D I X D : I T I N E R A R Y A N D M E E T I N G S C H E D U L E
D-1BEST PRACTICES FOR RISK-BASED FORECASTS OF LAND VOLATILITY FOR CORRIDOR MANAGEMENT AND SUSTAINABLE COMMUNITIES
Appendix D:
Itinerary and Meeting Schedule
D-2
A P P E N D I X D : I T I N E R A R Y A N D M E E T I N G S C H E D U L E
Table D.1 provides the scan’s itinerary and meeting schedule. Participating localities/regions/DOTs included:
n Tallahassee, Florida
n New Orleans, Louisiana
n Harrisburg, Pennsylvania
n Atlanta, Georgia
n Sacramento, California
n Salt Lake City, Utah
The team held several Web meetings with Washington State DOT, Minnesota DOT (MnDOT), Montana DOT (MTDOT), and North Carolina DOT (NCDOT).
Date Activity Location
10/2/2011 Team meeting Tallahassee, FL
10/3/2011 Meeting with FDOT Tallahassee, FL
10/4/2011 Meeting with NORPC New Orleans, LA
10/5/2011 Reverse scan with VDOT New Orleans, LA
10/6/2011 Meeting with PennDOT Harrisburg, PA
10/7/2011 Midterm meeting Harrisburg, PA
10/30/2011 Team meeting Atlanta, GA
10/31/2011 Meeting with GDOT Atlanta, GA
11/1/2011 Web meeting with MnDOT and MTDOT Salt Lake City, UT
11/2/2011 Meeting with UDOT Salt Lake City, UT
11/3/2011 Meeting with Caltrans Sacramento, CA
11/4/2011 Web meeting with NCDOT and WSDOT Sacramento, CA
11/5/2011 Final meeting Sacramento, CA
Table D.1 Scan Itinerary and meeting schedule
D-3BEST PRACTICES FOR RISK-BASED FORECASTS OF LAND VOLATILITY FOR CORRIDOR MANAGEMENT AND SUSTAINABLE COMMUNITIES
A P P E N D I X E : H O S T A G E N C Y K E Y C O N TA C T S
E-1BEST PRACTICES FOR RISK-BASED FORECASTS OF LAND VOLATILITY FOR CORRIDOR MANAGEMENT AND SUSTAINABLE COMMUNITIES
Appendix E:
Host Agency Key Contacts
E-2
A P P E N D I X E : H O S T A G E N C Y K E Y C O N TA C T S
CaliforniaBrent Green, Chief, Division of Right of Way, Land Surveys, and Utilities California Department of Transportation 1120 N St. Sacramento, CA 95814 Phone: (916) 654-5075 E-mail: [email protected]
Gordon Garry Director of Research & Analysis Sacramento Area Council of Governments (SACOG) 1415 L St., Suite 300 Sacramento, CA 95814 Phone: (916) 340-6230 E-mail: [email protected]
Florida John Garner Manager, Right of Way Production & Operation Florida Department of Transportation 605 Suwannee St., MS 22 Tallahassee, FL 32399-0450 Phone: (850) 414-4557 E-mail: [email protected]
Tom Shields Deputy Director, Right of Way Production & Operation Florida Department of Transportation 605 Suwannee St., MS 22 Tallahassee, FL 32399-0450 Phone: (850) 414-4557 E-mail: [email protected]
E-3BEST PRACTICES FOR RISK-BASED FORECASTS OF LAND VOLATILITY FOR CORRIDOR MANAGEMENT AND SUSTAINABLE COMMUNITIES
Georgia Phil Copeland Right of Way Administrator Georgia Department of Transportation One Georgia Center 600 West Peachtree St. Atlanta, GA 30308 Phone: (404) 347-0227 E-mail: [email protected]
Troy Byers Asst. State Right of Way Administrator Georgia Department of Transportation One Georgia Center 600 West Peachtree St. Room 1432 Atlanta, GA 30308 Phone: (404) 347-0179 E-mail: [email protected]
Laura F. Beall, AICP Division Director, Land Use Georgia Regional Transportation Authority 245 Peachtree Center Ave., NE, Suite 800 Atlanta, GA 30303 Phone: (404) 463-3068 Fax: (770) 344-5251 E-mail: [email protected]
Kofi Wakhisi Principal Transportation Planner Atlanta Regional Commission 40 Courtland St., NE Atlanta, GA 30303 Phone: (404) 463-3173 E-mail: [email protected]
E-4
A P P E N D I X E : H O S T A G E N C Y K E Y C O N TA C T S
Louisiana Kevin Szatmary Real Estate administrator Louisiana Department of Transportation & Development Room 332S 1201 Capitol Access Rd. PO Box 94245 Baton Rouge, LA 70804-9245 Phone: (225) 242-4579 E-mail: [email protected]
Walter R. Brooks Executive Director, Planning New Orleans Regional Planning Commission 10 Veterans Memorial Blvd. New Orleans, LA 70124 Phone: (504) 483-8500 Direct Line: (504) 483-8512 E-mail: [email protected]
Jeffery W. Roesel, AICP Director of Planning New Orleans Regional Planning Commission 10 Veterans Memorial Blvd. New Orleans, LA 70124 Phone: (504) 483-8528 E-mail: [email protected]
Jason Sappington, AICP Transportation Planner New Orleans Regional Planning Commission 10 Veterans Memorial Blvd. New Orleans, LA 70124 Phone: (504) 483-8507 E-mail: [email protected]
E-5BEST PRACTICES FOR RISK-BASED FORECASTS OF LAND VOLATILITY FOR CORRIDOR MANAGEMENT AND SUSTAINABLE COMMUNITIES
Lynn E. Dupont, ASLA, GISP Principal Planner/GIS Coordinator New Orleans Regional Planning Commission 10 Veterans Memorial Blvd. New Orleans, LA 70124 Phone: (504) 483-8514 E-mail: [email protected]
Minnesota Tim Henkel Division Director, Modal Planning and Program Management Minnesota Department of Transportation Mail Stop 120, Room 431 395 John Ireland Blvd. Saint Paul, MN 55155-1899 Phone: (651) 366-4829 Fax: (651) 366-4795 E-mail: [email protected]
Amy Vennewitz Deputy Director - Finance & Planning Metropolitan Council 390 Robert St. North St. Paul, MN 55101-1805 Phone: (651) 602-1000 E-mail: [email protected]
Montana Lynn Zanto Administrator, Rail, Transit, and Planning Montana Department of Transportation PO Box 201001 Helena, MT 59620-1001 Phone: (406) 444-3445 E-mail: [email protected]
E-6
A P P E N D I X E : H O S T A G E N C Y K E Y C O N TA C T S
North Carolina
Linda Dosse North Carolina Department of Transportation Transportation Planning Branch 1554 Mail Service Center Raleigh, NC 27699-1554 Phone: (919) 707-0973 E-mail: [email protected]
Pennsylvania
James D. Ritzman, PE Deputy Secretary for Planning Pennsylvania Department of Transportation Keystone Building 400 North St., 8th Floor Harrisburg, PA 17120-0095 Phone: (717) 787-3154 Fax: (717) 787-5491 E-mail: [email protected]
Brian D. Wall Transportation Planning Specialist Supervisor Planning and Contract Management Pennsylvania Department of Transportation Keystone Building 400 North St., 6th Floor Harrisburg, PA 17105-3365 Phone: (717) 772-0827 E-mail: [email protected]
E-7BEST PRACTICES FOR RISK-BASED FORECASTS OF LAND VOLATILITY FOR CORRIDOR MANAGEMENT AND SUSTAINABLE COMMUNITIES
Brian Hare Division Manager, Planning and Contract Management Center for Program Development and Management Pennsylvania Department of Transportation Keystone Building 400 North St., 6th Floor Harrisburg, PA 17105-3365 Phone: (717) 787-7335 E-mail: [email protected]
Hugh McGowan Transportation Planning Manager Planning and Contract Management Pennsylvania Department of Transportation Keystone Building 400 North St., 6th Floor Harrisburg, PA 17105-3365 Phone: (717) 787-5978 E-mail: [email protected]
James L. Arey, Jr. Division Manager, Funding and Twelve-Year Program Center for Program Development and Management Pennsylvania Department of Transportation Keystone Building 400 North St., 6th Floor Harrisburg, PA 17105-3365 Phone: (717) 787-5248 E-mail: [email protected]
Utah Lyle D. McMillan Director of Right of Way Utah Department of Transportation 4501 South 2700 West Salt Lake City, UT 84119 Phone: (801) 965-4331 E-mail: [email protected]
E-8
A P P E N D I X E : H O S T A G E N C Y K E Y C O N TA C T S
Virginia
Marsha C. Fiol Transportation and Mobility Planning Director Transportation and Mobility Planning Division Virginia Department of Transportation 1401 East Broad St. Richmond, VA 23219 Phone: (804) 786-2985 E-mail: [email protected]
Washington State
Mike Palazzo Director; Real Estate Services Washington State Department of Transportation 310 Maple Park Ave. SE PO Box 47338 Olympia, WA 98504-7338 Phone: (360) 705-7306 E-mail: [email protected]
Brian J. Smith Director, Strategic Planning and Programming Washington State Department of Transportation 310 Maple Park Ave. SE PO Box 47373 Olympia, WA 98504-7373 Phone: (360) 705-7958 Fax: (360) 705-6813 E-mail: [email protected]
E-9BEST PRACTICES FOR RISK-BASED FORECASTS OF LAND VOLATILITY FOR CORRIDOR MANAGEMENT AND SUSTAINABLE COMMUNITIES
Judy Lorenzo Manager , HQ Transportation Planning Office Washington State Department of Transportation Strategic Planning Division MS47370 – Room 1A3 310 Maple Park Ave. SE Olympia, WA 98504-7370 Phone: (360) 705-7274 E-mail: [email protected]
A P P E N D I X F : S A M P L E O F C O R R I D O R A N A LY S E S F O R R I S K M A N A G E M E N T O F C O R R I D O R S I N V I R G I N I A
F-1BEST PRACTICES FOR RISK-BASED FORECASTS OF LAND VOLATILITY FOR CORRIDOR MANAGEMENT AND SUSTAINABLE COMMUNITIES
A P P E N D I X F : S A M P L E O F C O R R I D O R A N A LY S E S F O R R I S K M A N A G E M E N T O F C O R R I D O R S I N V I R G I N I A
Appendix F:
Sample of Corridor Analyses for Risk Management of Corridors in Virginia
F-2
A P P E N D I X F : S A M P L E O F C O R R I D O R A N A LY S E S F O R R I S K M A N A G E M E N T O F C O R R I D O R S I N V I R G I N I A
Figure F.1 Risk-based prioritization of corridors vulnerable to land use based on Virginia ACPS output for the US 17 corridor (Source: VDOT and University of Virginia)
Figure F.2 Risk-based prioritization of corridors vulnerable to land use based on Virginia ACPS output for the US 1 corridor (Source: VDOT and University of Virginia)
F-3BEST PRACTICES FOR RISK-BASED FORECASTS OF LAND VOLATILITY FOR CORRIDOR MANAGEMENT AND SUSTAINABLE COMMUNITIES
Figure F3 Risk-based prioritization of corridors vulnerable to land use based on Virginia ACPS output for the US 1 corridor (Source: VDOT and University of Virginia)
Figure F.4 Cross-corridor comparison of transportation corridor access point density outliers using the Virginia ACPS tool (Source: VDOT and University of Virginia)
F-4
A P P E N D I X F : S A M P L E O F C O R R I D O R A N A LY S E S F O R R I S K M A N A G E M E N T O F C O R R I D O R S I N V I R G I N I A
Figure F.4 Transportation corridor access point density count based on functional class using the Virginia ACPS tool (Source: VDOT and University of Virginia)
F-5BEST PRACTICES FOR RISK-BASED FORECASTS OF LAND VOLATILITY FOR CORRIDOR MANAGEMENT AND SUSTAINABLE COMMUNITIES