12
1 Scanning Electrochemical Microscope ______________________________________________________________________________ CH Instruments
1
Scanning Electrochemical Microscope
______________________________________________________________________________
CH Instruments
2
Model 920C Scanning Electrochemical Microscope
The scanning electrochemical microscope (SECM) was introduced in 19891 as an instrument that could
examine chemistry at high resolution near interfaces. By detecting reactions that occur at a small electrode (the tip)
as it is scanned in close proximity to a surface, the SECM can be employed to obtain chemical reactivity images of
surfaces and quantitative measurements of reaction rates. Numerous studies with the SECM have now been
reported from a number of laboratories all over the world, and the instrument has been used for a wide range of
applications, including studies of corrosion, biological systems (e.g., enzymes, skin, leaves), membranes, and
liquid/liquid interfaces.2 Trapping and electrochemical detection of single molecules with the SECM has also been
reported.
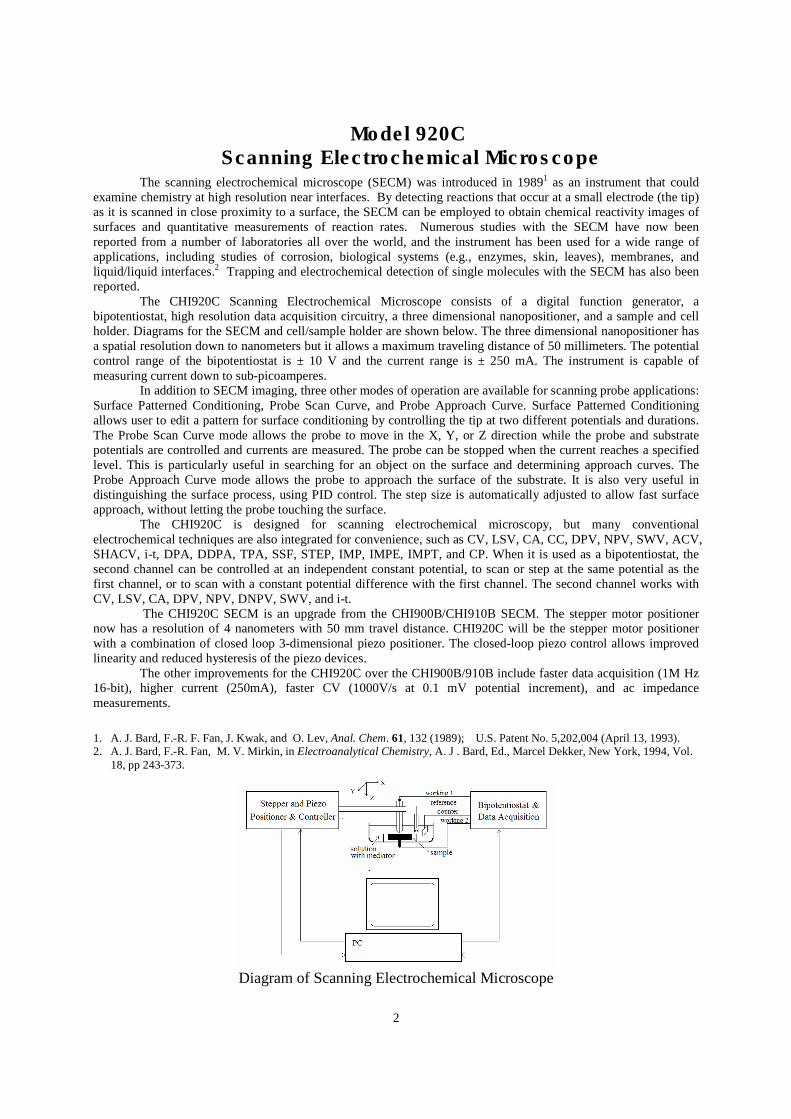
The CHI920C Scanning Electrochemical Microscope consists of a digital function generator, a
bipotentiostat, high resolution data acquisition circuitry, a three dimensional nanopositioner, and a sample and cell
holder. Diagrams for the SECM and cell/sample holder are shown below. The three dimensional nanopositioner has
a spatial resolution down to nanometers but it allows a maximum traveling distance of 50 millimeters. The potential
control range of the bipotentiostat is ± 10 V and the current range is ± 250 mA. The instrument is capable of
measuring current down to sub-picoamperes.
In addition to SECM imaging, three other modes of operation are available for scanning probe applications:
Surface Patterned Conditioning, Probe Scan Curve, and Probe Approach Curve. Surface Patterned Conditioning
allows user to edit a pattern for surface conditioning by controlling the tip at two different potentials and durations.
The Probe Scan Curve mode allows the probe to move in the X, Y, or Z direction while the probe and substrate
potentials are controlled and currents are measured. The probe can be stopped when the current reaches a specified
level. This is particularly useful in searching for an object on the surface and determining approach curves. The
Probe Approach Curve mode allows the probe to approach the surface of the substrate. It is also very useful in
distinguishing the surface process, using PID control. The step size is automatically adjusted to allow fast surface
approach, without letting the probe touching the surface.
The CHI920C is designed for scanning electrochemical microscopy, but many conventional
electrochemical techniques are also integrated for convenience, such as CV, LSV, CA, CC, DPV, NPV, SWV, ACV,
SHACV, i-t, DPA, DDPA, TPA, SSF, STEP, IMP, IMPE, IMPT, and CP. When it is used as a bipotentiostat, the
second channel can be controlled at an independent constant potential, to scan or step at the same potential as the
first channel, or to scan with a constant potential difference with the first channel. The second channel works with
CV, LSV, CA, DPV, NPV, DNPV, SWV, and i-t.
The CHI920C SECM is an upgrade from the CHI900B/CHI910B SECM. The stepper motor positioner
now has a resolution of 4 nanometers with 50 mm travel distance. CHI920C will be the stepper motor positioner
with a combination of closed loop 3-dimensional piezo positioner. The closed-loop piezo control allows improved
linearity and reduced hysteresis of the piezo devices.
The other improvements for the CHI920C over the CHI900B/910B include faster data acquisition (1M Hz
16-bit), higher current (250mA), faster CV (1000V/s at 0.1 mV potential increment), and ac impedance
measurements.
1. A. J. Bard, F.-R. F. Fan, J. Kwak, and O. Lev, Anal. Chem. 61, 132 (1989); U.S. Patent No. 5,202,004 (April 13, 1993).
2. A. J. Bard, F.-R. Fan, M. V. Mirkin, in Electroanalytical Chemistry, A. J . Bard, Ed., Marcel Dekker, New York, 1994, Vol.
18, pp 243-373.
Diagram of Scanning Electrochemical Microscope
3
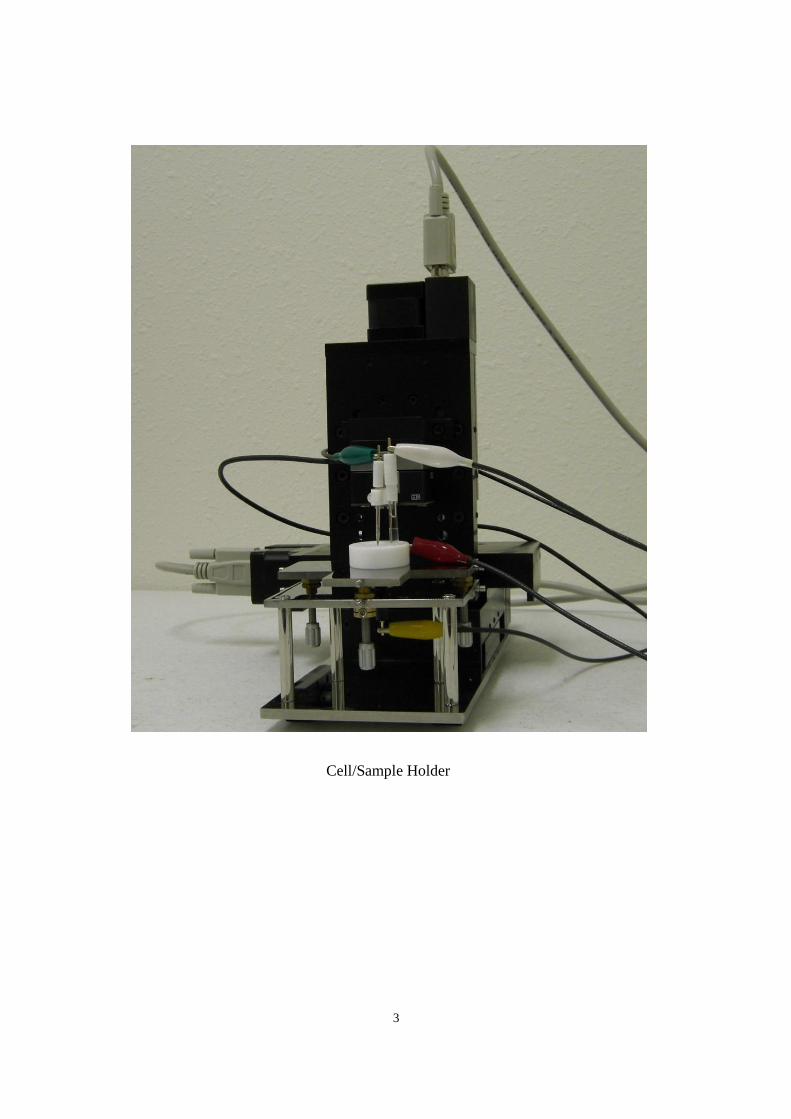
Cell/Sample Holder
4
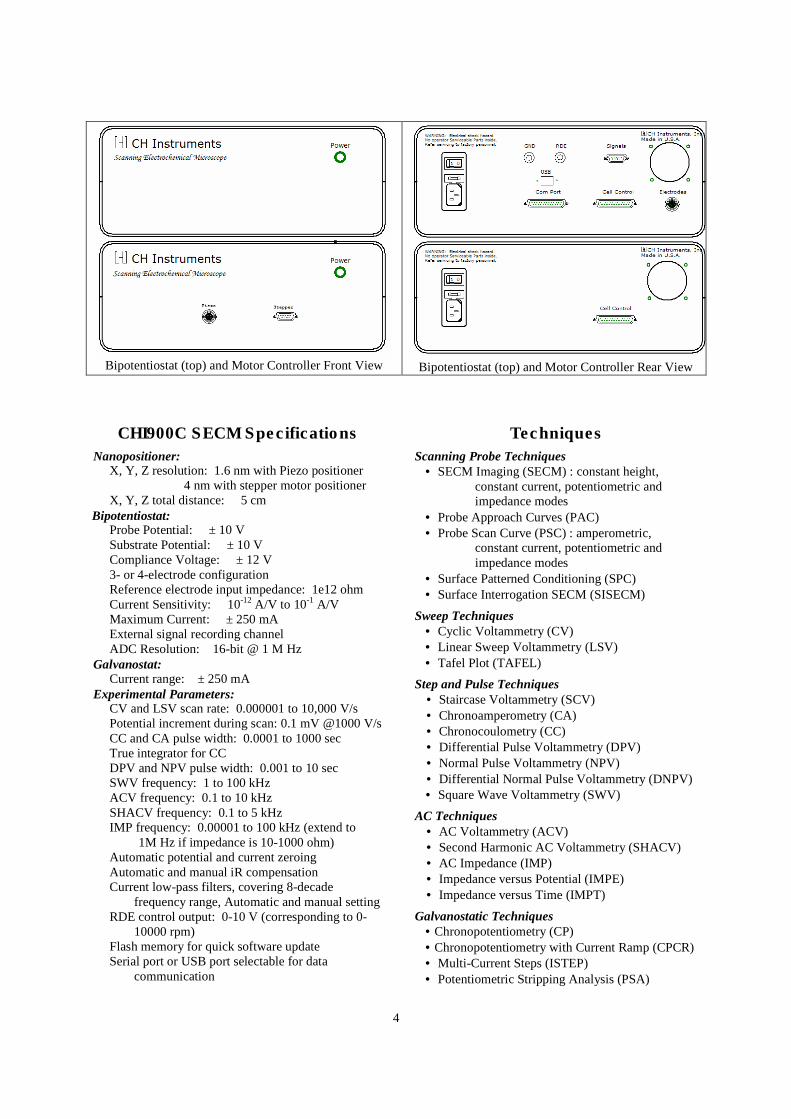
Bipotentiostat (top) and Motor Controller Front View Bipotentiostat (top) and Motor Controller Rear View
CHI900C SECM Specifications
Nanopositioner: X, Y, Z resolution: 1.6 nm with Piezo positioner
4 nm with stepper motor positioner
X, Y, Z total distance: 5 cm
Bipotentiostat: Probe Potential: ± 10 V
Substrate Potential: ± 10 V
Compliance Voltage: ± 12 V
3- or 4-electrode configuration
Reference electrode input impedance: 1e12 ohm
Current Sensitivity: 10-12
A/V to 10-1
A/V
Maximum Current: ± 250 mA
External signal recording channel
ADC Resolution: 16-bit @ 1 M Hz
Galvanostat: Current range: ± 250 mA
Experimental Parameters: CV and LSV scan rate: 0.000001 to 10,000 V/s
Potential increment during scan: 0.1 mV @1000 V/s
CC and CA pulse width: 0.0001 to 1000 sec
True integrator for CC
DPV and NPV pulse width: 0.001 to 10 sec
SWV frequency: 1 to 100 kHz
ACV frequency: 0.1 to 10 kHz
SHACV frequency: 0.1 to 5 kHz
IMP frequency: 0.00001 to 100 kHz (extend to
1M Hz if impedance is 10-1000 ohm)
Automatic potential and current zeroing
Automatic and manual iR compensation
Current low-pass filters, covering 8-decade
frequency range, Automatic and manual setting
RDE control output: 0-10 V (corresponding to 0-
10000 rpm)
Flash memory for quick software update
Serial port or USB port selectable for data
communication
Techniques
Scanning Probe Techniques
• SECM Imaging (SECM) : constant height,
constant current, potentiometric and
impedance modes
• Probe Approach Curves (PAC)
• Probe Scan Curve (PSC) : amperometric,
constant current, potentiometric and
impedance modes
• Surface Patterned Conditioning (SPC)
• Surface Interrogation SECM (SISECM)
Sweep Techniques
• Cyclic Voltammetry (CV)
• Linear Sweep Voltammetry (LSV)
• Tafel Plot (TAFEL)
Step and Pulse Techniques
• Staircase Voltammetry (SCV)
• Chronoamperometry (CA)
• Chronocoulometry (CC)
• Differential Pulse Voltammetry (DPV)
• Normal Pulse Voltammetry (NPV)
• Differential Normal Pulse Voltammetry (DNPV)
• Square Wave Voltammetry (SWV)
AC Techniques
• AC Voltammetry (ACV)
• Second Harmonic AC Voltammetry (SHACV)
• AC Impedance (IMP)
• Impedance versus Potential (IMPE)
• Impedance versus Time (IMPT)
Galvanostatic Techniques
• Chronopotentiometry (CP)
• Chronopotentiometry with Current Ramp (CPCR)
• Multi-Current Steps (ISTEP)
• Potentiometric Stripping Analysis (PSA)

5
Other Features: Real Time Absolute and Relative Distance Display
Real Time Probe and Substrate Current Display
Dual channel measurements for CV, LSV, CA,
DPV, NPV, SWV, i-t
Cell control: purge, stir, knock
Automatic potential and current zeroing
Current low-pass filters, covering 8-decade
frequency range, Automatic and manual
setting
RDE control output: 0-10 V (corresponding to 0-
10000 rpm)
Flash memory for quick software update
Serial port or USB port selectable for data
communication
Digital CV simulator, user defined mechanisms
Impedance simulator and fitting program
Other Techniques
• Amperometric i-t Curve (i-t)
• Differential Pulse Amperometry (DPA)
• Double Differential Pulse Amperometry (DDPA)
• Triple Pulse Amperometry (TPA)
• Integrated Pulse Amperometric Detection (IPAD)
• Bulk Electrolysis with Coulometry (BE)
• Hydrodynamic Modulation Voltammetry (HMV)
• Sweep-Step Functions (SSF)
• Multi-Potential Steps (STEP)
• Electrochemical Noise Measurements (ECN)
• Open Circuit Potential - Time (OCPT)
• Various Stripping Voltammetry
• Potentiometry
Applications
• Electrode surface studies
• Corrosion
• Biological samples
• Solid dissolution
• Liquid/liquid interfaces
• Membranes
6
Principles and Applications of SECM
I. Operational Principles of SECM
As in other types of scanning probe microscopes,
SECM is based on the movement of a very small
electrode (the tip) near the surface of a conductive or
insulating substrate.1 In amperometric SECM ex-
periments, the tip is usually a conventional ultra-
microelectrode (UME) fabricated as a conductive disk
of metal or carbon in an insulating sheath of glass or
polymer. Potentiometric SECM experiments with ion-
selective tips are also possible.2
In amperometric experiments, the tip current is
perturbed by the presence of the substrate. When the tip
is far (i.e. greater than several tip diameters) from the
substrate, as shown in Fig. 1A, the steady-state current,
iT,∞, is given by
iT,∞ = 4nFDCa
where F is Faraday’s constant, n is the number of
electrons transferred in the tip reaction (O + ne → R),
D is the diffusion coefficient of species O, C is the
concentration, and a is the tip radius. When the tip is
moved toward the surface of an insulating substrate, the
tip current, iT, decreases because the insulating sheath
of the tip blocks diffusion of O to the tip from the bulk
solution. The closer the tip gets to the substrate, the
smaller iT becomes (Fig 1B). On the other hand, with a
conductive substrate, species R can be oxidized back to
O. This produces an additional flux of O to the tip and
hence an increase in iT (Fig. 1C). In this case, the
smaller the value of d, the larger iT will be, with iT → ∞
as d → 0, assuming the oxidation of R on the substrate
is diffusion-limited. These simple principles form the
basis for the feedback mode of SECM operation.
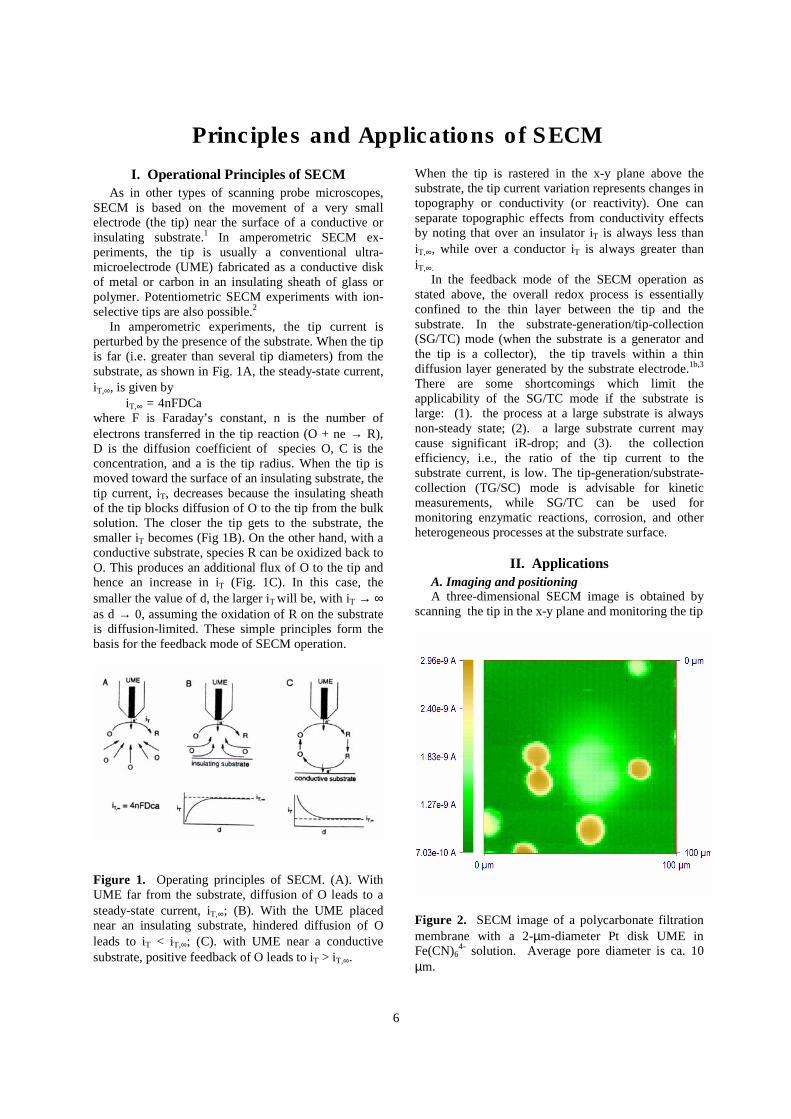
Figure 1. Operating principles of SECM. (A). With
UME far from the substrate, diffusion of O leads to a
steady-state current, iT,∞; (B). With the UME placed
near an insulating substrate, hindered diffusion of O
leads to iT < iT,∞; (C). with UME near a conductive
substrate, positive feedback of O leads to iT > iT,∞.
When the tip is rastered in the x-y plane above the
substrate, the tip current variation represents changes in
topography or conductivity (or reactivity). One can
separate topographic effects from conductivity effects
by noting that over an insulator iT is always less than
iT,∞, while over a conductor iT is always greater than
iT,∞.
In the feedback mode of the SECM operation as
stated above, the overall redox process is essentially
confined to the thin layer between the tip and the
substrate. In the substrate-generation/tip-collection
(SG/TC) mode (when the substrate is a generator and
the tip is a collector), the tip travels within a thin
diffusion layer generated by the substrate electrode.1b,3
There are some shortcomings which limit the
applicability of the SG/TC mode if the substrate is
large: (1). the process at a large substrate is always
non-steady state; (2). a large substrate current may
cause significant iR-drop; and (3). the collection
efficiency, i.e., the ratio of the tip current to the
substrate current, is low. The tip-generation/substrate-
collection (TG/SC) mode is advisable for kinetic
measurements, while SG/TC can be used for
monitoring enzymatic reactions, corrosion, and other
heterogeneous processes at the substrate surface.
II. Applications
A. Imaging and positioning A three-dimensional SECM image is obtained by
scanning the tip in the x-y plane and monitoring the tip
Figure 2. SECM image of a polycarbonate filtration
membrane with a 2-µm-diameter Pt disk UME in
Fe(CN)64-
solution. Average pore diameter is ca. 10
µm.
7
current, iT, as a function of tip location. A particular
advantage of SECM in imaging applications, compared
to other types of scanning probe microscopy, is that the
response observed can be interpreted based on fairly
rigorous theory, and hence the measured current can be
employed to estimate the tip-substrate distance.
Moreover, SECM can be used to image the surfaces of
different types of substrates, both conductors and
insulators, immersed in solutions. The resolution
attainable with SECM depends upon the tip radius. For
example, Fig. 2 shows one SECM image of a filtration
membrane obtained with a 2-µm-diameter Pt disk tip in
Fe(CN)64-
solution. Average pore diameter is ca. 10
µm. An image demonstrating the local activity of an
enzymatic reaction on a filtration membrane is shown
in Fig. 9 as described below.
B. Studies of heterogeneous electron transfer
reactions SECM has been employed in heterogeneous kinetic
studies on various metal, carbon and semiconductor
substrates.4 In this application, the x-y scanning feature
of SECM is usually not used. In this mode, SECM has
many features of UME and thin layer electrochemistry
with a number of advantages. For example, the
characteristic flux to an UME spaced a distance, d,
from a conductive substrate is of the order of DC/d,
independent of the tip radius, a, when d < a. Thus, very
high fluxes and thus high currents can be obtained. For
example, the measurement of the very fast kinetics
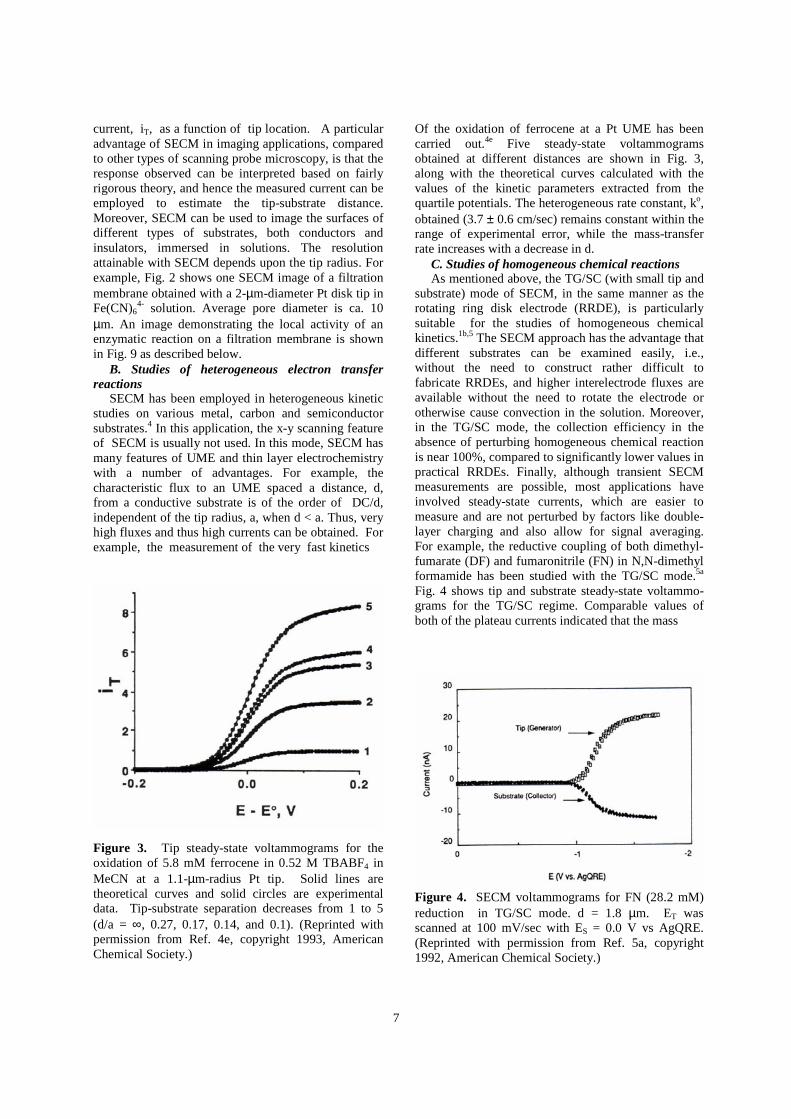
Figure 3. Tip steady-state voltammograms for the
oxidation of 5.8 mM ferrocene in 0.52 M TBABF4 in
MeCN at a 1.1-µm-radius Pt tip. Solid lines are
theoretical curves and solid circles are experimental
data. Tip-substrate separation decreases from 1 to 5
(d/a = ∞, 0.27, 0.17, 0.14, and 0.1). (Reprinted with
permission from Ref. 4e, copyright 1993, American
Chemical Society.)
Of the oxidation of ferrocene at a Pt UME has been
carried out.4e
Five steady-state voltammograms
obtained at different distances are shown in Fig. 3,
along with the theoretical curves calculated with the
values of the kinetic parameters extracted from the
quartile potentials. The heterogeneous rate constant, ko,
obtained (3.7 ± 0.6 cm/sec) remains constant within the
range of experimental error, while the mass-transfer
rate increases with a decrease in d.
C. Studies of homogeneous chemical reactions As mentioned above, the TG/SC (with small tip and
substrate) mode of SECM, in the same manner as the
rotating ring disk electrode (RRDE), is particularly
suitable for the studies of homogeneous chemical
kinetics.1b,5
The SECM approach has the advantage that
different substrates can be examined easily, i.e.,
without the need to construct rather difficult to
fabricate RRDEs, and higher interelectrode fluxes are
available without the need to rotate the electrode or
otherwise cause convection in the solution. Moreover,
in the TG/SC mode, the collection efficiency in the
absence of perturbing homogeneous chemical reaction
is near 100%, compared to significantly lower values in
practical RRDEs. Finally, although transient SECM
measurements are possible, most applications have
involved steady-state currents, which are easier to
measure and are not perturbed by factors like double-
layer charging and also allow for signal averaging.
For example, the reductive coupling of both dimethyl-
fumarate (DF) and fumaronitrile (FN) in N,N-dimethyl
formamide has been studied with the TG/SC mode.5a
Fig. 4 shows tip and substrate steady-state voltammo-
grams for the TG/SC regime. Comparable values of
both of the plateau currents indicated that the mass
Figure 4. SECM voltammograms for FN (28.2 mM)
reduction in TG/SC mode. d = 1.8 µm. ET was
scanned at 100 mV/sec with ES = 0.0 V vs AgQRE.
(Reprinted with permission from Ref. 5a, copyright
1992, American Chemical Society.)
8
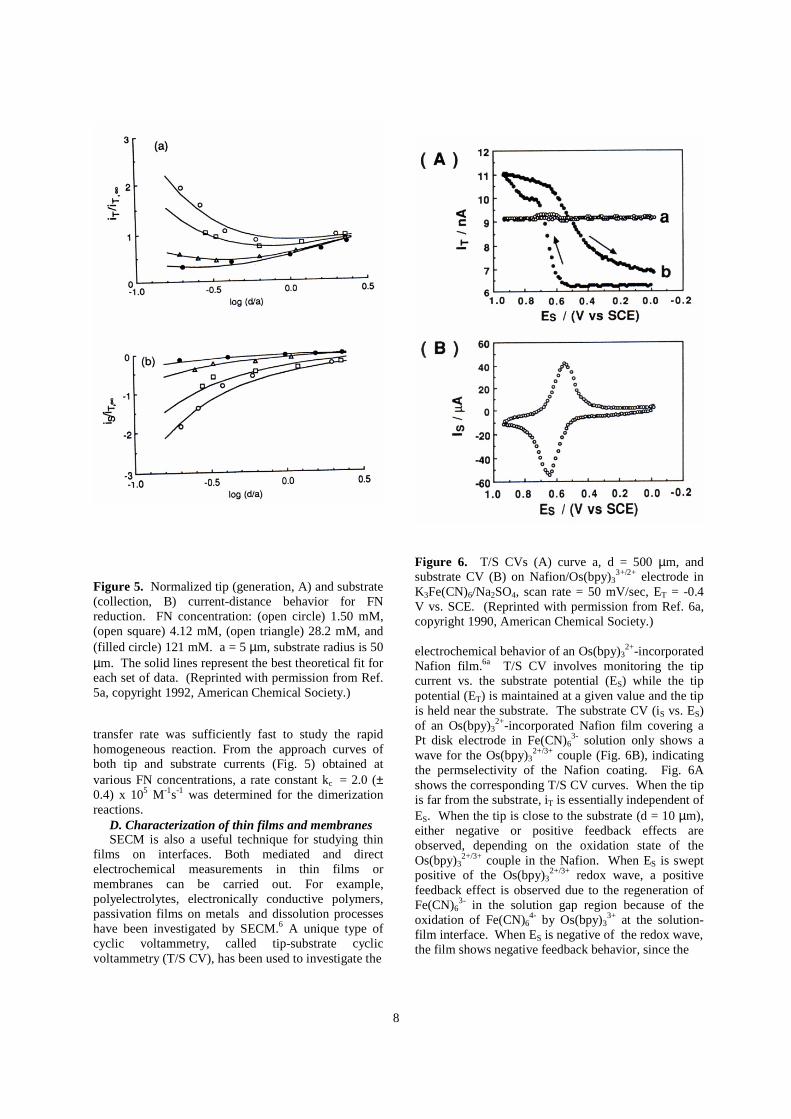
Figure 5. Normalized tip (generation, A) and substrate
(collection, B) current-distance behavior for FN
reduction. FN concentration: (open circle) 1.50 mM,
(open square) 4.12 mM, (open triangle) 28.2 mM, and
(filled circle) 121 mM. a = 5 µm, substrate radius is 50
µm. The solid lines represent the best theoretical fit for
each set of data. (Reprinted with permission from Ref.
5a, copyright 1992, American Chemical Society.)
transfer rate was sufficiently fast to study the rapid
homogeneous reaction. From the approach curves of
both tip and substrate currents (Fig. 5) obtained at
various FN concentrations, a rate constant kc = 2.0 (±
0.4) x 105 M
-1s
-1 was determined for the dimerization
reactions.
D. Characterization of thin films and membranes SECM is also a useful technique for studying thin
films on interfaces. Both mediated and direct
electrochemical measurements in thin films or
membranes can be carried out. For example,
polyelectrolytes, electronically conductive polymers,
passivation films on metals and dissolution processes
have been investigated by SECM.6 A unique type of
cyclic voltammetry, called tip-substrate cyclic
voltammetry (T/S CV), has been used to investigate the
Figure 6. T/S CVs (A) curve a, d = 500 µm, and
substrate CV (B) on Nafion/Os(bpy)33+/2+
electrode in
K3Fe(CN)6/Na2SO4, scan rate = 50 mV/sec, ET = -0.4
V vs. SCE. (Reprinted with permission from Ref. 6a,
copyright 1990, American Chemical Society.)
electrochemical behavior of an Os(bpy)32+
-incorporated
Nafion film.6a
T/S CV involves monitoring the tip
current vs. the substrate potential (ES) while the tip
potential (ET) is maintained at a given value and the tip
is held near the substrate. The substrate CV (iS vs. ES)
of an Os(bpy)32+
-incorporated Nafion film covering a
Pt disk electrode in Fe(CN)63-
solution only shows a
wave for the Os(bpy)32+/3+
couple (Fig. 6B), indicating
the permselectivity of the Nafion coating. Fig. 6A
shows the corresponding T/S CV curves. When the tip
is far from the substrate, iT is essentially independent of
ES. When the tip is close to the substrate (d = 10 µm),
either negative or positive feedback effects are
observed, depending on the oxidation state of the
Os(bpy)32+/3+
couple in the Nafion. When ES is swept
positive of the Os(bpy)32+/3+
redox wave, a positive
feedback effect is observed due to the regeneration of
Fe(CN)63-
in the solution gap region because of the
oxidation of Fe(CN)64-
by Os(bpy)33+
at the solution-
film interface. When ES is negative of the redox wave,
the film shows negative feedback behavior, since the
9
Os(bpy)32+
formed is unable to oxidize tip-generated
Fe(CN)64-
back to Fe(CN)63-
.
E. Liquid-liquid interfaces One of the most promising applications of SECM is
the study of charge transport at the interface between
two immiscible electrolyte solution (ITIES).7 Unlike
conventional techniques, SECM allows for the studies
of both ion and electron transfer at the interface. For
example, uphill electron transfer, in which an electron
is transferred uphill from a redox couple with a higher
standard reduction potential in one phase to another
redox couple having a lower standard reduction
potential in a second immiscible phase has been
demonstrated using the system TCNQ (in 1,2-
dichroloethane (DCE))/ferrocyanide (in water).7c
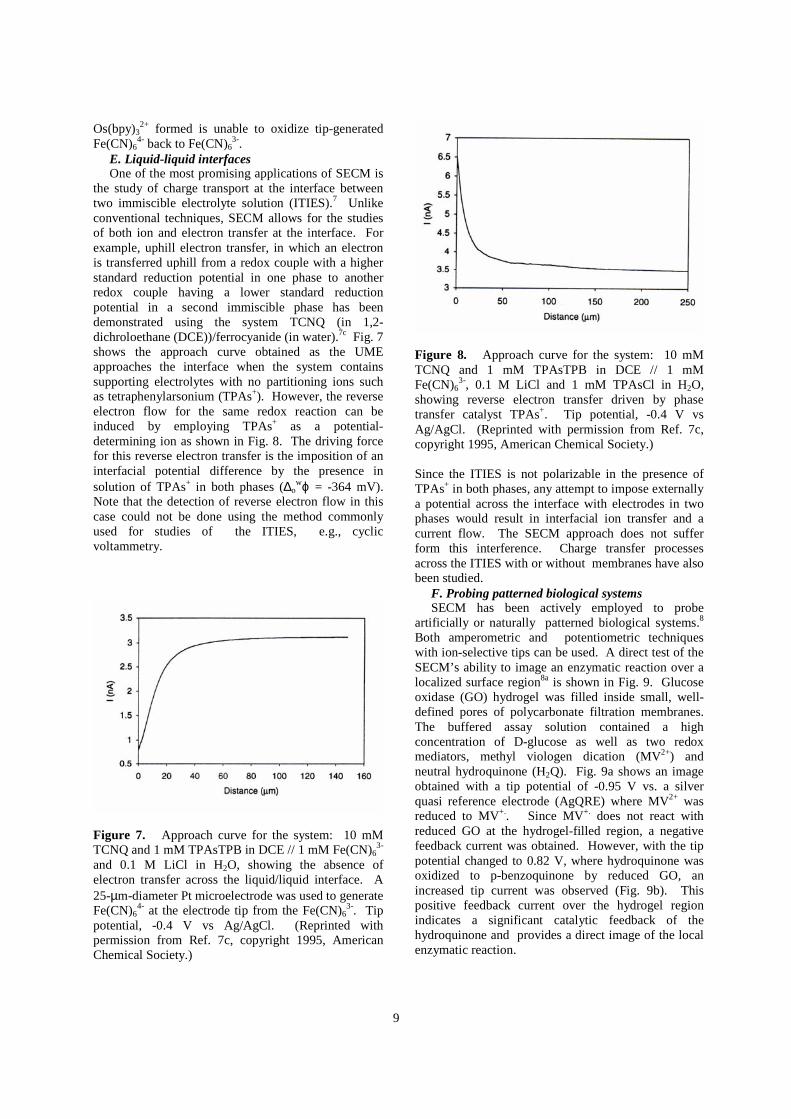
Fig. 7
shows the approach curve obtained as the UME
approaches the interface when the system contains
supporting electrolytes with no partitioning ions such
as tetraphenylarsonium (TPAs+). However, the reverse
electron flow for the same redox reaction can be
induced by employing TPAs+ as a potential-
determining ion as shown in Fig. 8. The driving force
for this reverse electron transfer is the imposition of an
interfacial potential difference by the presence in
solution of TPAs+ in both phases (∆o
wϕ = -364 mV).
Note that the detection of reverse electron flow in this
case could not be done using the method commonly
used for studies of the ITIES, e.g., cyclic
voltammetry.
Figure 7. Approach curve for the system: 10 mM
TCNQ and 1 mM TPAsTPB in DCE // 1 mM Fe(CN)63-
and 0.1 M LiCl in H2O, showing the absence of
electron transfer across the liquid/liquid interface. A
25-µm-diameter Pt microelectrode was used to generate
Fe(CN)64-
at the electrode tip from the Fe(CN)63-
. Tip
potential, -0.4 V vs Ag/AgCl. (Reprinted with
permission from Ref. 7c, copyright 1995, American
Chemical Society.)
Figure 8. Approach curve for the system: 10 mM
TCNQ and 1 mM TPAsTPB in DCE // 1 mM
Fe(CN)63-
, 0.1 M LiCl and 1 mM TPAsCl in H2O,
showing reverse electron transfer driven by phase
transfer catalyst TPAs+. Tip potential, -0.4 V vs
Ag/AgCl. (Reprinted with permission from Ref. 7c,
copyright 1995, American Chemical Society.)
Since the ITIES is not polarizable in the presence of
TPAs+ in both phases, any attempt to impose externally
a potential across the interface with electrodes in two
phases would result in interfacial ion transfer and a
current flow. The SECM approach does not suffer
form this interference. Charge transfer processes
across the ITIES with or without membranes have also
been studied.
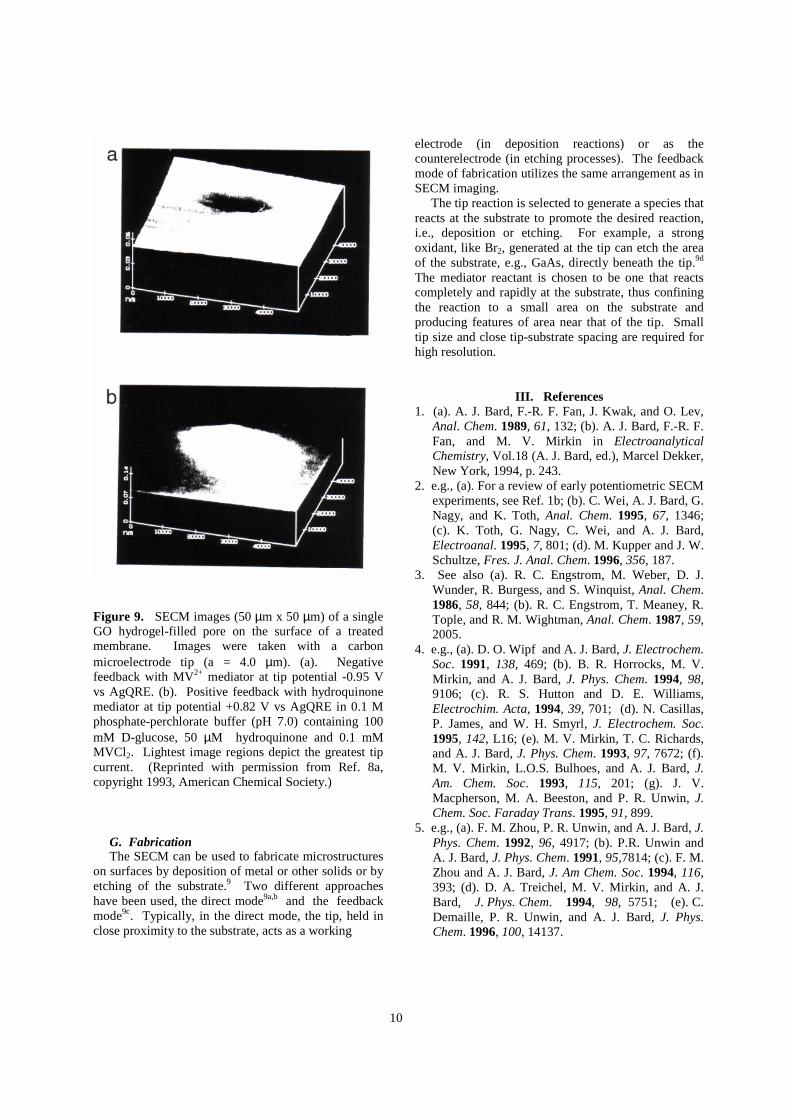
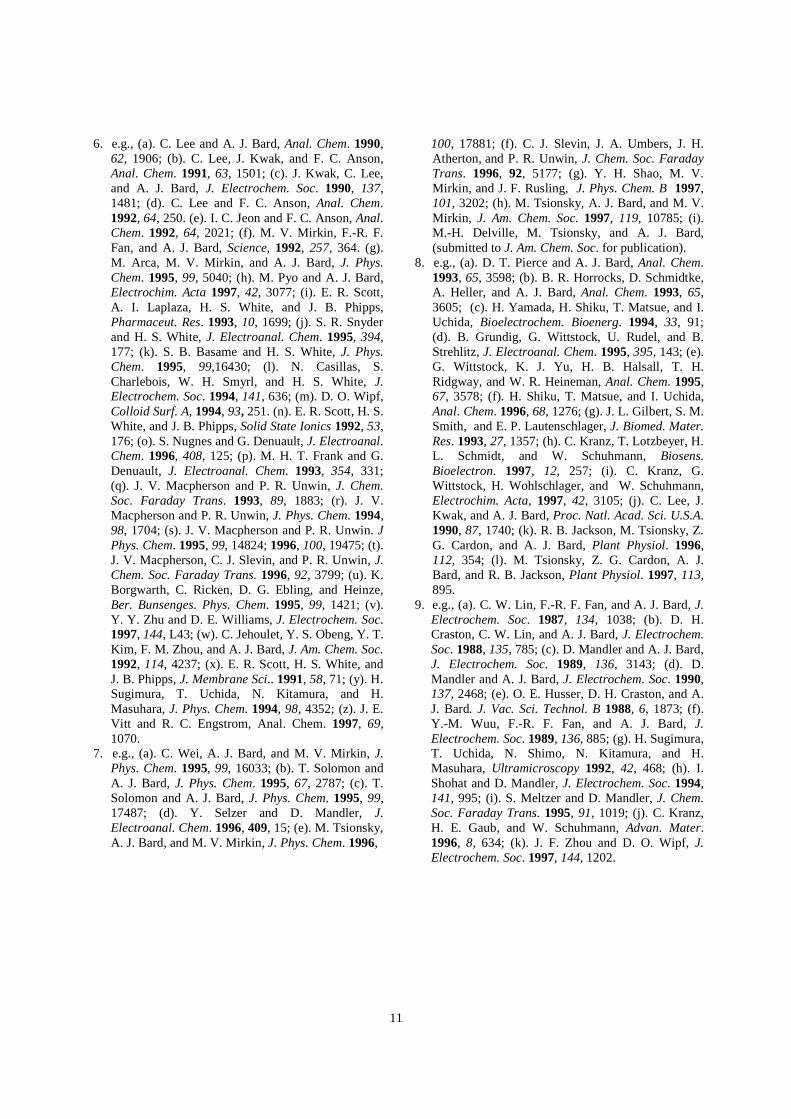
F. Probing patterned biological systems SECM has been actively employed to probe
artificially or naturally patterned biological systems.8
Both amperometric and potentiometric techniques
with ion-selective tips can be used. A direct test of the
SECM’s ability to image an enzymatic reaction over a
localized surface region8a
is shown in Fig. 9. Glucose
oxidase (GO) hydrogel was filled inside small, well-
defined pores of polycarbonate filtration membranes.
The buffered assay solution contained a high
concentration of D-glucose as well as two redox
mediators, methyl viologen dication (MV2+) and
neutral hydroquinone (H2Q). Fig. 9a shows an image
obtained with a tip potential of -0.95 V vs. a silver
quasi reference electrode (AgQRE) where MV2+
was
reduced to MV+.
. Since MV+.
does not react with
reduced GO at the hydrogel-filled region, a negative
feedback current was obtained. However, with the tip
potential changed to 0.82 V, where hydroquinone was
oxidized to p-benzoquinone by reduced GO, an
increased tip current was observed (Fig. 9b). This
positive feedback current over the hydrogel region
indicates a significant catalytic feedback of the
hydroquinone and provides a direct image of the local
enzymatic reaction.
10
Figure 9. SECM images (50 µm x 50 µm) of a single
GO hydrogel-filled pore on the surface of a treated
membrane. Images were taken with a carbon
microelectrode tip (a = 4.0 µm). (a). Negative
feedback with MV2+
mediator at tip potential -0.95 V
vs AgQRE. (b). Positive feedback with hydroquinone
mediator at tip potential +0.82 V vs AgQRE in 0.1 M
phosphate-perchlorate buffer (pH 7.0) containing 100
mM D-glucose, 50 µM hydroquinone and 0.1 mM
MVCl2. Lightest image regions depict the greatest tip
current. (Reprinted with permission from Ref. 8a,
copyright 1993, American Chemical Society.)
G. Fabrication The SECM can be used to fabricate microstructures
on surfaces by deposition of metal or other solids or by
etching of the substrate.9 Two different approaches
have been used, the direct mode9a,b
and the feedback
mode9c
. Typically, in the direct mode, the tip, held in
close proximity to the substrate, acts as a working
electrode (in deposition reactions) or as the
counterelectrode (in etching processes). The feedback
mode of fabrication utilizes the same arrangement as in
SECM imaging.
The tip reaction is selected to generate a species that
reacts at the substrate to promote the desired reaction,
i.e., deposition or etching. For example, a strong
oxidant, like Br2, generated at the tip can etch the area
of the substrate, e.g., GaAs, directly beneath the tip.9d
The mediator reactant is chosen to be one that reacts
completely and rapidly at the substrate, thus confining
the reaction to a small area on the substrate and
producing features of area near that of the tip. Small
tip size and close tip-substrate spacing are required for
high resolution.
III. References
1. (a). A. J. Bard, F.-R. F. Fan, J. Kwak, and O. Lev,
Anal. Chem. 1989, 61, 132; (b). A. J. Bard, F.-R. F.
Fan, and M. V. Mirkin in Electroanalytical
Chemistry, Vol.18 (A. J. Bard, ed.), Marcel Dekker,
New York, 1994, p. 243.
2. e.g., (a). For a review of early potentiometric SECM
experiments, see Ref. 1b; (b). C. Wei, A. J. Bard, G.
Nagy, and K. Toth, Anal. Chem. 1995, 67, 1346;
(c). K. Toth, G. Nagy, C. Wei, and A. J. Bard,
Electroanal. 1995, 7, 801; (d). M. Kupper and J. W.
Schultze, Fres. J. Anal. Chem. 1996, 356, 187.
3. See also (a). R. C. Engstrom, M. Weber, D. J.
Wunder, R. Burgess, and S. Winquist, Anal. Chem.
1986, 58, 844; (b). R. C. Engstrom, T. Meaney, R.
Tople, and R. M. Wightman, Anal. Chem. 1987, 59,
2005.
4. e.g., (a). D. O. Wipf and A. J. Bard, J. Electrochem.
Soc. 1991, 138, 469; (b). B. R. Horrocks, M. V.
Mirkin, and A. J. Bard, J. Phys. Chem. 1994, 98,
9106; (c). R. S. Hutton and D. E. Williams,
Electrochim. Acta, 1994, 39, 701; (d). N. Casillas,
P. James, and W. H. Smyrl, J. Electrochem. Soc.
1995, 142, L16; (e). M. V. Mirkin, T. C. Richards,
and A. J. Bard, J. Phys. Chem. 1993, 97, 7672; (f).
M. V. Mirkin, L.O.S. Bulhoes, and A. J. Bard, J.
Am. Chem. Soc. 1993, 115, 201; (g). J. V.
Macpherson, M. A. Beeston, and P. R. Unwin, J.
Chem. Soc. Faraday Trans. 1995, 91, 899.
5. e.g., (a). F. M. Zhou, P. R. Unwin, and A. J. Bard, J.
Phys. Chem. 1992, 96, 4917; (b). P.R. Unwin and
A. J. Bard, J. Phys. Chem. 1991, 95,7814; (c). F. M.
Zhou and A. J. Bard, J. Am Chem. Soc. 1994, 116,
393; (d). D. A. Treichel, M. V. Mirkin, and A. J.
Bard, J. Phys. Chem. 1994, 98, 5751; (e). C.
Demaille, P. R. Unwin, and A. J. Bard, J. Phys.
Chem. 1996, 100, 14137.
11
6. e.g., (a). C. Lee and A. J. Bard, Anal. Chem. 1990,
62, 1906; (b). C. Lee, J. Kwak, and F. C. Anson,
Anal. Chem. 1991, 63, 1501; (c). J. Kwak, C. Lee,
and A. J. Bard, J. Electrochem. Soc. 1990, 137,
1481; (d). C. Lee and F. C. Anson, Anal. Chem.
1992, 64, 250. (e). I. C. Jeon and F. C. Anson, Anal.
Chem. 1992, 64, 2021; (f). M. V. Mirkin, F.-R. F.
Fan, and A. J. Bard, Science, 1992, 257, 364. (g).
M. Arca, M. V. Mirkin, and A. J. Bard, J. Phys.
Chem. 1995, 99, 5040; (h). M. Pyo and A. J. Bard,
Electrochim. Acta 1997, 42, 3077; (i). E. R. Scott,
A. I. Laplaza, H. S. White, and J. B. Phipps,
Pharmaceut. Res. 1993, 10, 1699; (j). S. R. Snyder
and H. S. White, J. Electroanal. Chem. 1995, 394,
177; (k). S. B. Basame and H. S. White, J. Phys.
Chem. 1995, 99,16430; (l). N. Casillas, S.
Charlebois, W. H. Smyrl, and H. S. White, J.
Electrochem. Soc. 1994, 141, 636; (m). D. O. Wipf,
Colloid Surf. A, 1994, 93, 251. (n). E. R. Scott, H. S.
White, and J. B. Phipps, Solid State Ionics 1992, 53,
176; (o). S. Nugnes and G. Denuault, J. Electroanal.
Chem. 1996, 408, 125; (p). M. H. T. Frank and G.
Denuault, J. Electroanal. Chem. 1993, 354, 331;
(q). J. V. Macpherson and P. R. Unwin, J. Chem.
Soc. Faraday Trans. 1993, 89, 1883; (r). J. V.
Macpherson and P. R. Unwin, J. Phys. Chem. 1994,
98, 1704; (s). J. V. Macpherson and P. R. Unwin. J
Phys. Chem. 1995, 99, 14824; 1996, 100, 19475; (t).
J. V. Macpherson, C. J. Slevin, and P. R. Unwin, J.
Chem. Soc. Faraday Trans. 1996, 92, 3799; (u). K.
Borgwarth, C. Ricken, D. G. Ebling, and Heinze,
Ber. Bunsenges. Phys. Chem. 1995, 99, 1421; (v).
Y. Y. Zhu and D. E. Williams, J. Electrochem. Soc.
1997, 144, L43; (w). C. Jehoulet, Y. S. Obeng, Y. T.
Kim, F. M. Zhou, and A. J. Bard, J. Am. Chem. Soc.
1992, 114, 4237; (x). E. R. Scott, H. S. White, and
J. B. Phipps, J. Membrane Sci.. 1991, 58, 71; (y). H.
Sugimura, T. Uchida, N. Kitamura, and H.
Masuhara, J. Phys. Chem. 1994, 98, 4352; (z). J. E.
Vitt and R. C. Engstrom, Anal. Chem. 1997, 69,
1070.
7. e.g., (a). C. Wei, A. J. Bard, and M. V. Mirkin, J.
Phys. Chem. 1995, 99, 16033; (b). T. Solomon and
A. J. Bard, J. Phys. Chem. 1995, 67, 2787; (c). T.
Solomon and A. J. Bard, J. Phys. Chem. 1995, 99,
17487; (d). Y. Selzer and D. Mandler, J.
Electroanal. Chem. 1996, 409, 15; (e). M. Tsionsky,
A. J. Bard, and M. V. Mirkin, J. Phys. Chem. 1996,
100, 17881; (f). C. J. Slevin, J. A. Umbers, J. H.
Atherton, and P. R. Unwin, J. Chem. Soc. Faraday
Trans. 1996, 92, 5177; (g). Y. H. Shao, M. V.
Mirkin, and J. F. Rusling, J. Phys. Chem. B 1997,
101, 3202; (h). M. Tsionsky, A. J. Bard, and M. V.
Mirkin, J. Am. Chem. Soc. 1997, 119, 10785; (i).
M.-H. Delville, M. Tsionsky, and A. J. Bard,
(submitted to J. Am. Chem. Soc. for publication).
8. e.g., (a). D. T. Pierce and A. J. Bard, Anal. Chem.
1993, 65, 3598; (b). B. R. Horrocks, D. Schmidtke,
A. Heller, and A. J. Bard, Anal. Chem. 1993, 65,
3605; (c). H. Yamada, H. Shiku, T. Matsue, and I.
Uchida, Bioelectrochem. Bioenerg. 1994, 33, 91;
(d). B. Grundig, G. Wittstock, U. Rudel, and B.
Strehlitz, J. Electroanal. Chem. 1995, 395, 143; (e).
G. Wittstock, K. J. Yu, H. B. Halsall, T. H.
Ridgway, and W. R. Heineman, Anal. Chem. 1995,
67, 3578; (f). H. Shiku, T. Matsue, and I. Uchida,
Anal. Chem. 1996, 68, 1276; (g). J. L. Gilbert, S. M.
Smith, and E. P. Lautenschlager, J. Biomed. Mater.
Res. 1993, 27, 1357; (h). C. Kranz, T. Lotzbeyer, H.
L. Schmidt, and W. Schuhmann, Biosens.
Bioelectron. 1997, 12, 257; (i). C. Kranz, G.
Wittstock, H. Wohlschlager, and W. Schuhmann,
Electrochim. Acta, 1997, 42, 3105; (j). C. Lee, J.
Kwak, and A. J. Bard, Proc. Natl. Acad. Sci. U.S.A.
1990, 87, 1740; (k). R. B. Jackson, M. Tsionsky, Z.
G. Cardon, and A. J. Bard, Plant Physiol. 1996,
112, 354; (l). M. Tsionsky, Z. G. Cardon, A. J.
Bard, and R. B. Jackson, Plant Physiol. 1997, 113,
895.
9. e.g., (a). C. W. Lin, F.-R. F. Fan, and A. J. Bard, J.
Electrochem. Soc. 1987, 134, 1038; (b). D. H.
Craston, C. W. Lin, and A. J. Bard, J. Electrochem.
Soc. 1988, 135, 785; (c). D. Mandler and A. J. Bard,
J. Electrochem. Soc. 1989, 136, 3143; (d). D.
Mandler and A. J. Bard, J. Electrochem. Soc. 1990,
137, 2468; (e). O. E. Husser, D. H. Craston, and A.
J. Bard. J. Vac. Sci. Technol. B 1988, 6, 1873; (f).
Y.-M. Wuu, F.-R. F. Fan, and A. J. Bard, J.
Electrochem. Soc. 1989, 136, 885; (g). H. Sugimura,
T. Uchida, N. Shimo, N. Kitamura, and H.
Masuhara, Ultramicroscopy 1992, 42, 468; (h). I.
Shohat and D. Mandler, J. Electrochem. Soc. 1994,
141, 995; (i). S. Meltzer and D. Mandler, J. Chem.
Soc. Faraday Trans. 1995, 91, 1019; (j). C. Kranz,
H. E. Gaub, and W. Schuhmann, Advan. Mater.
1996, 8, 634; (k). J. F. Zhou and D. O. Wipf, J.
Electrochem. Soc. 1997, 144, 1202.

12
Bridge on Colorado River,
Austin, Texas
Our office building in
Austin, Texas.
Warranty: One-year warranty on electronic parts and labor, 90-day warranty on accessories.
Demo Software: Free demo software available upon request.
CH Instruments, Inc. 3700 Tennison Hill Drive • Austin, TX 78738 • USA
Tel: (512) 402-0176 • Fax: (512) 402-0186
E-mail: [email protected]
Web Page: http://www.chinstruments.com August 2008 CH Instruments
Send to:


