Scanning electron microscopy of cells and tissuesunder fully hydrated conditionsStephan Thiberge*†, Amotz Nechushtan‡§, David Sprinzak‡§, Opher Gileadi‡§, Vered Behar‡§, Ory Zik‡§,Yehuda Chowers¶, Shulamit Michaeli�, Joseph Schlessinger§**, and Elisha Moses*§††
*Department of Physics of Complex Systems, The Weizmann Institute of Science, Rehovot 76100, Israel; ‡Quantomix, Ltd., 12 Hamada Street, WeizmannScience Park, Rehovot 70400, Israel; ¶Department of Gastroenterology, Chaim Sheba Medical Center, Tel-Hashomer 52621, Israel; �Faculty of Life Sciences,Bar-Ilan University, Ramat-Gan 52900, Israel; and **Department of Pharmacology, Yale University School of Medicine, New Haven, CT 06520
Communicated by Roger D. Kornberg§, Stanford University School of Medicine, Stanford, CA, January 6, 2004 (received for review July 23, 2003)
A capability for scanning electron microscopy of wet biologicalspecimens is presented. A membrane that is transparent to elec-trons protects the fully hydrated sample from the vacuum. Theresult is a hybrid technique combining the ease of use and abilityto see into cells of optical microscopy with the higher resolution ofelectron microscopy. The resolution of low-contrast materials is�100 nm, whereas in high-contrast materials the resolution canreach 10 nm. Standard immunogold techniques and heavy-metalstains can be applied and viewed in the fluid to improve thecontrast. Images present a striking combination of whole-cellmorphology with a wealth of internal details. A possibility fordirect inspection of tissue slices transpires, imaging only theexternal layer of cells. Simultaneous imaging with photonsexcited by the electrons incorporates data on material distribu-tion, indicating a potential for multilabeling and specific scin-tillating markers.
E lectron microscopy (EM) has been an indispensable tool forthe life and medical sciences since its inception more than
half a century ago. Much of the substantial advances in the fieldwere propelled by the need to find methods to best preserve andanalyze structures at a state most closely approximating thenative state. Little if any attention has been given to wet samples,under the assumption that it was practically impossible. How-ever, an ability to observe fully hydrated samples at room or bodytemperatures could help eliminate many artifacts of samplepreparation and allow routine and reproducible imaging.
Recent progress in adaptation of scanning EM (SEM) forobservation of partially hydrated samples relies on technologicalimprovements in differential pumping capabilities and of detec-tors, which together allow conditions that sustain the sample ina vapor environment [e.g., environmental SEM (1–3)]. However,the goal of imaging wet, fully f luid samples has not been met bythese advances until now. The question of whether imaging atacceptable resolution and contrast is at all possible and what canbe seen once cells are imaged remained open.
We present here a significant step in this direction, in whichwet samples can be maintained in fully physiological conditionsand imaged with little loss of resolution compared to standardSEM. Wet SEM relies on a thin, membranous partition thatprotects the sample from the vacuum while being transparent tothe beam electrons. This approach was proposed at the adventof the scanning electron microscope (early attempts are best seenin the work shown in ref. 4) but yielded an unacceptableresolution due to the unavailability of adequate materials at thattime. Developments in polymer technology have yielded thinmembranes that are practically transparent to energetic elec-trons yet are tough enough to withstand atmospheric pressuredifferences. The volume imaged is in close proximity to themembrane, typically probing a few micrometers into the sample.This is ideal for the inspection of fluids or objects that are in closecontact with the surface. The presence of fluid helps in pre-venting charging effects and eliminates the need to coat thesample.
This imaging system enables a number of observations thatpreviously were inaccessible to SEM. First, SEM can now beused to probe the inside of whole cells, giving information onorganelles and internal structure. Second, staining and goldimmunolabeling can be imaged with no subsequent critical-pointdrying and coating (5). Third, we show that tissue sections canbe viewed, giving structural information on the connectivity andorganization of cells and extracellular structures in situ.
Another important advantage is the development of concur-rent monitoring of light emitted from molecules inside thesample that are excited by the electron beam (6) [cathodolumi-nescence (CL)], which gives a complementary view of materialdistribution, including the ability to distinguish multiple labels.
Ultimately, the resolution available for untreated biologicalsamples is limited by the physical constraints on EM. Because weare imaging the differences in scattering between low atomicnumber (Z) components such as carbon (cells) and oxygen(water), the contrast is often low and may depend strongly on thelocal concentration of heavier ions. Although this lowers theresolution, images are still much better than feasible by usingoptical methods and (as discussed below) are better than what anaive theoretical estimate based on electron scattering in mate-rials gives.
MethodsChambers. The sample holder centers on a rigid enclosure with awindow that consists of a thin, electron-transparent partitionmembrane. Beam electrons go through the partition membrane,probe the sample, and scatter back to the backscattered electron(BSE) detector placed above the sample. Several membraneshave been tested, of which polyimide membranes of 145 nm inthickness were found to be the most appropriate. Variations onthe basic design have been developed that allow different modesof insertion of the specimen to close contact with the membrane.For example, adherent cultured cells can be grown directly onthe partition medium; bacteria, mammalian, or other cells grownin suspension can be adsorbed or centrifuged onto the mem-brane before imaging; and tissues may be brought to directcontact with the membrane manually or mechanically. Anotherdesign incorporates a small leakage hole to the microscopechamber that is calculated to maintain the sample at lowpressures while keeping it fully hydrated. This reduces the strainon the membrane, improves the endurance of the membrane,
Abbreviations: EM, electron microscopy; SEM, scanning EM; CL, cathodoluminescence; Z,atomic number; BSE, backscattered electron; CHO, Chinese hamster ovary; TEM, transmis-sion EM.
†Present address: Departments of Electrical Engineering and Molecular Biology, PrincetonUniversity, Princeton, NJ 08540.
§Quantomix, Ltd., may profit from the publication of the results of this study. A.N., D.S,O.G., V.B., and O.Z. are employees of Quantomix, Ltd. E.M. and J.S. are members of theQuantomix Scientific Advisory Board. R.D.K. is an adviser to Quantomix.
††To whom correspondence should be addressed. E-mail: [email protected].
and enables ultrathin membranes (down to 50 nm) to be used forincreased resolution. The polyimide membrane was treated byfibronectin to enhance affinity of cells, whereas bacterial adhe-sion was achieved with poly-(L-lysine).
Staining Methods. Staining was done following standard methods.Unless specified otherwise, cells and tissues were fixed with 3%paraformaldehyde and 2% glutaraldehyde in 0.1 M cacodylatebuffer containing 1% sucrose and then rinsed in the same buffer.For uranyl acetate staining, the fixed samples were rinsedextensively in water, treated with 1% tannic acid for 5 min, rinsedin water, and stained with uranyl acetate (0.1–2% solution, pH3.5) for 15–30 min. Osmium tetroxide staining was performed bywashing the fixed samples in water and then incubating for 10–30min in 1% osmium tetroxide in water. In all cases, the sampleswere rinsed in water and viewed in the wet state.
Resolution. Theoretically, the resolution of wet SEM depends onthe volume sampled by Rutherford scattering of electrons(BSE). This volume depends mainly on the Z of the sample andthe acceleration voltage, or energy, of the beam electrons and isapproximated by the Kanaya–Okayama radius (5). For biologicalsamples, the Z is low (e.g., carbon Z � 6 and oxygen Z � 8), andthe radius of interaction is typically a few micrometers foracceleration voltages of 15–30 kV. Surprisingly, as Fig. 1B shows,the actual resolution is an order of magnitude better, because fatdroplets in milk �100 nm can be resolved. This is because themultiply scattered BSEs probe such a large region (on the scaleof a few micrometers) that their signal varies only slowly frompoint to point. The contrast then is obtained from electrons thatscatter back after only a few interactions. These probe a muchsmaller region, on the scale of the width of the beam in thesample, and define a high resolution (similar to that discussed inchapter 4.6.2 of ref. 5). The viscosity inside a cell limits thermalmotion such that, theoretically, resolution of unfixed objectsabove �20 nm is possible. Images similar to that shown in Fig.1C were used to evaluate the resolution numerically (7), givingvalues in the range of 100–120 nm. We found that emulsionsyield a strong signal (and are easier to resolve than polymericbeads), presumably because they deform to wet the membraneand have more material close to the surface.
CL Images. CL images are obtained simultaneously with BSEimages. A light guide at the bottom of our sample efficientlycollects the light and brings it to the entrance of the photomul-tiplier of a single photon-counting module. The data are col-lected into a timer–counter computer card, which also receivesdigital signals from the microscope when a frame and a new scanline are initiated. Using these three signals, a computer programreconstitutes the CL image in parallel to the image collected inthe standard electron channel.
ResultsUntreated Samples. Notably, we observe that, even in unstainedsamples, the differences between water and oil droplets (Fig. 1B and C) or between different constituents of the cell (Fig. 1D)generate sufficient contrast to distinguish them. In cells,higher-Z materials such as salts, phosphor, and iron, which maybe concentrated in different regions, tend to improve thecontrast. Fig. 1D shows an untreated Chinese hamster ovary(CHO) cell in normal culture medium at room temperature. Thecell outline and the nucleus with its internal structure are clearlyvisible, as are a series of dark, spherical particles in the cyto-plasm. The identification of these particles as lipid droplets isdiscussed below.
Heavy-Metal Staining. The limits on resolution and contrast whenobserving low-Z materials suggest that substantial advantages
Fig. 1. Imaging of unstained specimens. (A) Wet-SEM sample holder (sche-matic). The sample is depicted here as cultured cells grown on the thin partitionmembrane (a) that separates the vacuum (Vac) from the fluid in the holder.Imaging is done in scanning electron microscope: the electron beam (thick arrow)penetrates into the sample, and BSEs (thin blue arrow) are detected by a BSEdetector (b). A grid (dashed line) is used to support and reinforce the membrane.A light guide (c) is introduced at the bottom for CL applications (see text and Fig.4). The membranes are mounted on a plastic ring and treated with extracellularmatrixproteins.Cells in theirappropriategrowthmediumaredepositedontothemembrane and incubated. Before observation, the membrane is turned upsidedown and assembled onto the sample holder. Different microscopes were used:JEOL6400SEM,FEI (Hillsboro,OR)XL30ESEM,andFEIXL30ESEM-FEGinboth low[0.1 torr (1 torr � 133 Pa)] and high (�10�5 torr) vacuum modes. (B) Low-fat(1.5%) milk (voltage, 12 kV). (C) As described for B. (D) Untreated CHO cell grownon a fibronectin-coated membrane in normal growth medium.
Thiberge et al. PNAS � March 9, 2004 � vol. 101 � no. 10 � 3347
APP
LIED
PHYS
ICA
LSC
IEN
CES
APP
LIED
BIO
LOG
ICA
LSC
IEN
CES
can be achieved by staining the cells with high-Z markers suchas electron-dense stains or nanoparticle gold labels. Indeed, weare able to detect gold beads in water down to a diameter of 10nm by using ultrathin membranes (data not shown).
Differential staining of organelles inside cells using electron-dense materials is a standard in EM technique, although notusually applied for SEM. Fig. 2 shows a rich variety of structuresinside of cultured cells that were grown directly on the partitionmembrane and then fixed and stained with uranyl acetate (8).Intracellular organelles are clearly visible, including internaldetails of mitochondria (Fig. 2C), actin stress fibers (Fig. 2D),and complex tubular and cytoskeletal structures (Fig. 2 A and B).The higher beam energy in Fig. 2C probes internal structure,whereas at lower energy (Fig. 2D), the surface close to themembrane is visualized. Thus, different energies can be used toobtain three-dimensional information.
Nanoparticle Gold Markers. High resolution and specificity ofdetection can be achieved by binding of antibodies or otherligands. As with other EM methods, labeling is done mostconveniently by using gold nanoparticles. In contrast with trans-mission EM (TEM), which samples only very thin and oftenarbitrary sections, wet SEM allows a quick switching between thelocal and global view of labeling all over the cell. Fig. 3 A and Bshow how 40-nm nanoparticle gold-labeled monoclonal anti-epidermal growth factor receptor antibodies were used forlabeling the epidermal growth factor receptors on intact A431cancer cells. Fixation is often useful and convenient even in wetSEM and may facilitate the labeling as well as the transfer to themicroscope. The cells presented here are also stained with uranylacetate, which allows alignment of the labeled receptors with thegeneral structure of the cells. The high contrast and uniform sizeof the nanoparticles enable unambiguous identification andlocalization. Knowing the precise localization of single receptormolecules opens the possibility of measuring events such asepidermal growth factor-induced receptor dimerization. Stain-ing of the cells is not needed for the labeling, and we haveincluded an image of unstained, labeled cells (Fig. 7, which ispublished as supporting information on the PNAS web site).Also shown is an image demonstrating that marking of internalparts of the cell is possible (Fig. 8, which is published assupporting information on the PNAS web site), in this case, themarking of mitochondria with gold beads. Labeling of actinfilaments inside of cells has also been achieved by using sub-nanometer gold particles, followed by silver enhancement (datanot shown).
An example of gold labeling on bacteria is given in Fig. 3C.Here, the putative gastrin receptor of Helicobacter pylori (9) isdetected by incubation with complexes of biotinylated gastrinand streptavidin-coated 20-nm gold nanoparticles. Administer-ing the biotinylated gastrin before that of the streptavidin-coatedgold yielded almost no attachment of nanoparticles to thebacterium. This result was obtained independently of the timebetween the two steps, suggesting that the uptake of gastrin intoH. pylori is almost immediate. The fact that complexed gastrindid not enter the cells points to the possibility of defining thelimits of the size of particles that can be internalized by thebacteria.
Comparison of Imaging Techniques (Trypanosoma brucei). It is usefulto compare this technology with existing imaging techniquesusing a single-model system. Such a study is detailed in Fig. 4,using the parasite T. brucei procyclic form that propagates in themidgut of the tsetse fly. The first three images display existingmodes of imaging: optical f luorescence microscopy (Fig. 4A),differential interference contrast microscopy (Fig. 4B), andTEM (Fig. 4C). The strength of existing techniques is apparent:localized marking in fluorescence and detailed sections in TEM.
Fig. 2. Imaging of stained cells. Asterisks denote nuclei, and thin arrowsdenote mitochondria. (A) HeLa cells grown on the membrane in normalgrowth medium, then fixed with paraformaldehyde, and stained with uranylacetate (imaged at 12 kV). (B) Magnification of the marked rectangle shownin A. (C) CHO cell fixed with glutaraldehyde and paraformaldehyde, stainedwith uranyl acetate, and maintained in water (imaged at 30 kV). The thickarrow denotes a mitochondrion that surrounds a lipid droplet. (Inset) Highermagnification showing mitochondria (thin arrows). (D) Actin fibers in stainedCHO cells. Treatment and imaging are as described for A.
3348 � www.pnas.org�cgi�doi�10.1073�pnas.0400088101 Thiberge et al.
The untreated optical (Fig. 4B) and wet-SEM (Fig. 4D) imagesdelineate the borders of the cell but are low in contrast and lackdetail. Both emphasize the nucleus, but other organelles thatappear in the differential interference contrast image are notclearly identified, whereas the wet-SEM image brings out thelipid droplets to an advantage. Osmium tetroxide staining (Fig.
4E) is not as useful in this system, emphasizing mostly the lipiddroplets and some unidentified inner organelles. The strongestimaging is seen in Fig. 4F, for which uranyl acetate staining wasused. The advantage of intact imaging with which the full cell canbe seen (along with its fine internal structures that can beobserved in detail) is apparent, especially in comparison to TEMimaging (Fig. 4C). Finally, wet-SEM imaging of whole-cell-specific marking with antibodies against the major glycosylphos-phatidylinositol-anchored surface coat protein EP procyclin (10)is shown in Fig. 4 G and H. Interestingly, EP procyclin is knownto cover the whole cell uniformly, but the observed signal isclustered. We attribute this to the tendency of the underlyinglipid rafts to cluster under the influence of antibodies, a processthat fixation in formaldehyde is unable to prevent. The goldmarkers also elucidate the three-dimensional conformation ofthe cell in a manner that is reminiscent of what standard SEMcan image (an excellent, representative SEM image of T. bruceican be found at http:��tryps.rockefeller.edu�crosslab�intro.html).
Obviously, TEM will have better resolution, in general, thanwet SEM, but the images presented in the example of T. brucei
Fig. 3. Imaging of nanoparticle gold markers on cells. The arrowheadsdenote gold nanoparticles. (A) Epidermal growth factor receptors immuno-labeled with 40-nm gold nanoparticles on A431 cells and counterstained withuranyl acetate (imaged at 30 kV). (B) Magnification of the marked rectangleshown in E. (C) Putative gastrin receptors on H. pylori bacterium, afterincubation with complexed biotinylated gastrin on streptavidin-coated 20-nmgold particles, followed by glutaraldehyde and sedimentation onto the poly-(L-lysine)-coated membrane (imaged at 20 kV).
Fig. 4. Multimodal imaging of T. brucei. The typical length of a cell is 20 �min length and 3 �m in width. (A) Confocal fluorescence microscopy. Anti-EPprocyclin antibodies (Cedarline) were used, and the binding was detectedwith anti-mouse linked to fluorescein isothiocyanate (green). Staining of thenucleus and kinetoplast was with propidium iodide (red). (B) Optical (differ-ential interference contrast) imaging. (C) TEM sections of a cell, followed byuranyl acetate staining, revealing internal organelles. (D) Wet-SEM imaging ofwhole, hydrated, unstained cells. (E) As described for D using osmium tetrox-ide staining. (F) As described for D using uranyl acetate staining. (G) Nano-particle gold markers linked to anti-mouse antibodies, showing the locationof the surface EP procyclin protein and enabling at the same time a three-dimensional view. (H) Higher magnification of the midsection of the cellshown in G, elucidating an area of three-dimensional helicity in the cell.
Thiberge et al. PNAS � March 9, 2004 � vol. 101 � no. 10 � 3349
APP
LIED
PHYS
ICA
LSC
IEN
CES
APP
LIED
BIO
LOG
ICA
LSC
IEN
CES
for comparison are ‘‘typical’’ images obtained in the samelaboratory. Because wet SEM is different in its utility than TEMand optical microscopy, in T. brucei it can be seen as animportant complementary capability, and one can expect thatthe full picture would be given by a combination of optical, TEM,and wet-SEM technique.
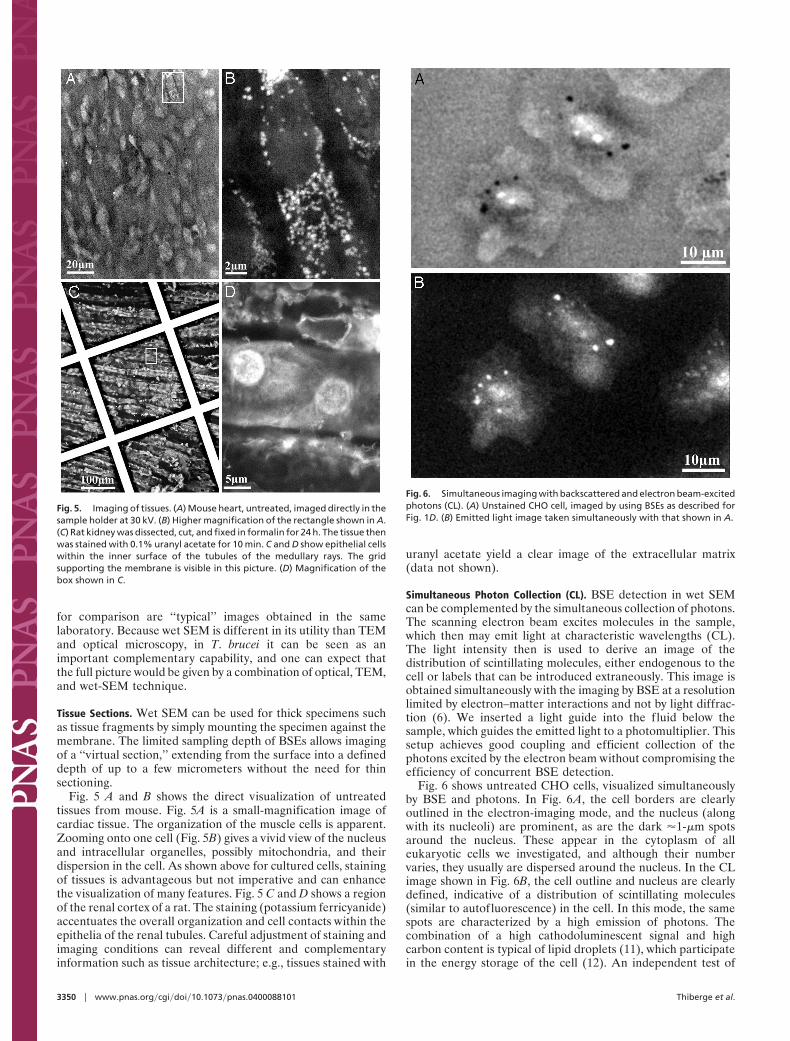
Tissue Sections. Wet SEM can be used for thick specimens suchas tissue fragments by simply mounting the specimen against themembrane. The limited sampling depth of BSEs allows imagingof a ‘‘virtual section,’’ extending from the surface into a defineddepth of up to a few micrometers without the need for thinsectioning.
Fig. 5 A and B shows the direct visualization of untreatedtissues from mouse. Fig. 5A is a small-magnification image ofcardiac tissue. The organization of the muscle cells is apparent.Zooming onto one cell (Fig. 5B) gives a vivid view of the nucleusand intracellular organelles, possibly mitochondria, and theirdispersion in the cell. As shown above for cultured cells, stainingof tissues is advantageous but not imperative and can enhancethe visualization of many features. Fig. 5 C and D shows a regionof the renal cortex of a rat. The staining (potassium ferricyanide)accentuates the overall organization and cell contacts within theepithelia of the renal tubules. Careful adjustment of staining andimaging conditions can reveal different and complementaryinformation such as tissue architecture; e.g., tissues stained with
uranyl acetate yield a clear image of the extracellular matrix(data not shown).
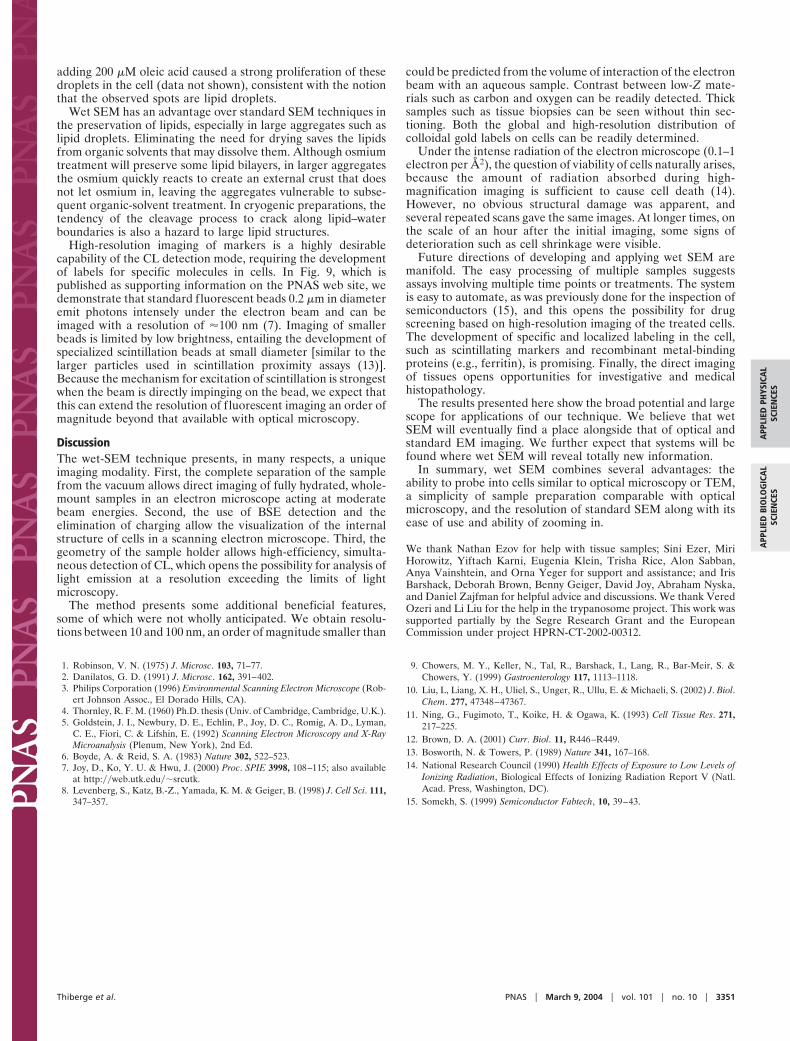
Simultaneous Photon Collection (CL). BSE detection in wet SEMcan be complemented by the simultaneous collection of photons.The scanning electron beam excites molecules in the sample,which then may emit light at characteristic wavelengths (CL).The light intensity then is used to derive an image of thedistribution of scintillating molecules, either endogenous to thecell or labels that can be introduced extraneously. This image isobtained simultaneously with the imaging by BSE at a resolutionlimited by electron–matter interactions and not by light diffrac-tion (6). We inserted a light guide into the fluid below thesample, which guides the emitted light to a photomultiplier. Thissetup achieves good coupling and efficient collection of thephotons excited by the electron beam without compromising theefficiency of concurrent BSE detection.
Fig. 6 shows untreated CHO cells, visualized simultaneouslyby BSE and photons. In Fig. 6A, the cell borders are clearlyoutlined in the electron-imaging mode, and the nucleus (alongwith its nucleoli) are prominent, as are the dark �1-�m spotsaround the nucleus. These appear in the cytoplasm of alleukaryotic cells we investigated, and although their numbervaries, they usually are dispersed around the nucleus. In the CLimage shown in Fig. 6B, the cell outline and nucleus are clearlydefined, indicative of a distribution of scintillating molecules(similar to autofluorescence) in the cell. In this mode, the samespots are characterized by a high emission of photons. Thecombination of a high cathodoluminescent signal and highcarbon content is typical of lipid droplets (11), which participatein the energy storage of the cell (12). An independent test of
Fig. 5. Imaging of tissues. (A) Mouse heart, untreated, imaged directly in thesample holder at 30 kV. (B) Higher magnification of the rectangle shown in A.(C) Rat kidney was dissected, cut, and fixed in formalin for 24 h. The tissue thenwas stained with 0.1% uranyl acetate for 10 min. C and D show epithelial cellswithin the inner surface of the tubules of the medullary rays. The gridsupporting the membrane is visible in this picture. (D) Magnification of thebox shown in C.
Fig. 6. Simultaneous imaging with backscattered and electron beam-excitedphotons (CL). (A) Unstained CHO cell, imaged by using BSEs as described forFig. 1D. (B) Emitted light image taken simultaneously with that shown in A.
3350 � www.pnas.org�cgi�doi�10.1073�pnas.0400088101 Thiberge et al.
adding 200 �M oleic acid caused a strong proliferation of thesedroplets in the cell (data not shown), consistent with the notionthat the observed spots are lipid droplets.
Wet SEM has an advantage over standard SEM techniques inthe preservation of lipids, especially in large aggregates such aslipid droplets. Eliminating the need for drying saves the lipidsfrom organic solvents that may dissolve them. Although osmiumtreatment will preserve some lipid bilayers, in larger aggregatesthe osmium quickly reacts to create an external crust that doesnot let osmium in, leaving the aggregates vulnerable to subse-quent organic-solvent treatment. In cryogenic preparations, thetendency of the cleavage process to crack along lipid–waterboundaries is also a hazard to large lipid structures.
High-resolution imaging of markers is a highly desirablecapability of the CL detection mode, requiring the developmentof labels for specific molecules in cells. In Fig. 9, which ispublished as supporting information on the PNAS web site, wedemonstrate that standard fluorescent beads 0.2 �m in diameteremit photons intensely under the electron beam and can beimaged with a resolution of �100 nm (7). Imaging of smallerbeads is limited by low brightness, entailing the development ofspecialized scintillation beads at small diameter [similar to thelarger particles used in scintillation proximity assays (13)].Because the mechanism for excitation of scintillation is strongestwhen the beam is directly impinging on the bead, we expect thatthis can extend the resolution of fluorescent imaging an order ofmagnitude beyond that available with optical microscopy.
DiscussionThe wet-SEM technique presents, in many respects, a uniqueimaging modality. First, the complete separation of the samplefrom the vacuum allows direct imaging of fully hydrated, whole-mount samples in an electron microscope acting at moderatebeam energies. Second, the use of BSE detection and theelimination of charging allow the visualization of the internalstructure of cells in a scanning electron microscope. Third, thegeometry of the sample holder allows high-efficiency, simulta-neous detection of CL, which opens the possibility for analysis oflight emission at a resolution exceeding the limits of lightmicroscopy.
The method presents some additional beneficial features,some of which were not wholly anticipated. We obtain resolu-tions between 10 and 100 nm, an order of magnitude smaller than
could be predicted from the volume of interaction of the electronbeam with an aqueous sample. Contrast between low-Z mate-rials such as carbon and oxygen can be readily detected. Thicksamples such as tissue biopsies can be seen without thin sec-tioning. Both the global and high-resolution distribution ofcolloidal gold labels on cells can be readily determined.
Under the intense radiation of the electron microscope (0.1–1electron per Å2), the question of viability of cells naturally arises,because the amount of radiation absorbed during high-magnification imaging is sufficient to cause cell death (14).However, no obvious structural damage was apparent, andseveral repeated scans gave the same images. At longer times, onthe scale of an hour after the initial imaging, some signs ofdeterioration such as cell shrinkage were visible.
Future directions of developing and applying wet SEM aremanifold. The easy processing of multiple samples suggestsassays involving multiple time points or treatments. The systemis easy to automate, as was previously done for the inspection ofsemiconductors (15), and this opens the possibility for drugscreening based on high-resolution imaging of the treated cells.The development of specific and localized labeling in the cell,such as scintillating markers and recombinant metal-bindingproteins (e.g., ferritin), is promising. Finally, the direct imagingof tissues opens opportunities for investigative and medicalhistopathology.
The results presented here show the broad potential and largescope for applications of our technique. We believe that wetSEM will eventually find a place alongside that of optical andstandard EM imaging. We further expect that systems will befound where wet SEM will reveal totally new information.
In summary, wet SEM combines several advantages: theability to probe into cells similar to optical microscopy or TEM,a simplicity of sample preparation comparable with opticalmicroscopy, and the resolution of standard SEM along with itsease of use and ability of zooming in.
We thank Nathan Ezov for help with tissue samples; Sini Ezer, MiriHorowitz, Yiftach Karni, Eugenia Klein, Trisha Rice, Alon Sabban,Anya Vainshtein, and Orna Yeger for support and assistance; and IrisBarshack, Deborah Brown, Benny Geiger, David Joy, Abraham Nyska,and Daniel Zajfman for helpful advice and discussions. We thank VeredOzeri and Li Liu for the help in the trypanosome project. This work wassupported partially by the Segre Research Grant and the EuropeanCommission under project HPRN-CT-2002-00312.
1. Robinson, V. N. (1975) J. Microsc. 103, 71–77.2. Danilatos, G. D. (1991) J. Microsc. 162, 391–402.3. Philips Corporation (1996) Environmental Scanning Electron Microscope (Rob-
ert Johnson Assoc., El Dorado Hills, CA).4. Thornley, R. F. M. (1960) Ph.D. thesis (Univ. of Cambridge, Cambridge, U.K.).5. Goldstein, J. I., Newbury, D. E., Echlin, P., Joy, D. C., Romig, A. D., Lyman,
C. E., Fiori, C. & Lifshin, E. (1992) Scanning Electron Microscopy and X-RayMicroanalysis (Plenum, New York), 2nd Ed.
6. Boyde, A. & Reid, S. A. (1983) Nature 302, 522–523.7. Joy, D., Ko, Y. U. & Hwu, J. (2000) Proc. SPIE 3998, 108–115; also available
at http:��web.utk.edu��srcutk.8. Levenberg, S., Katz, B.-Z., Yamada, K. M. & Geiger, B. (1998) J. Cell Sci. 111,
347–357.
9. Chowers, M. Y., Keller, N., Tal, R., Barshack, I., Lang, R., Bar-Meir, S. &Chowers, Y. (1999) Gastroenterology 117, 1113–1118.
10. Liu, L, Liang, X. H., Uliel, S., Unger, R., Ullu, E. & Michaeli, S. (2002) J. Biol.Chem. 277, 47348–47367.
11. Ning, G., Fugimoto, T., Koike, H. & Ogawa, K. (1993) Cell Tissue Res. 271,217–225.
12. Brown, D. A. (2001) Curr. Biol. 11, R446–R449.13. Bosworth, N. & Towers, P. (1989) Nature 341, 167–168.14. National Research Council (1990) Health Effects of Exposure to Low Levels of
Ionizing Radiation, Biological Effects of Ionizing Radiation Report V (Natl.Acad. Press, Washington, DC).
15. Somekh, S. (1999) Semiconductor Fabtech, 10, 39–43.
Thiberge et al. PNAS � March 9, 2004 � vol. 101 � no. 10 � 3351