n the field of fluorescence microscopy, total internaleflection fluorescence microscopy �TIRFM� and spec-roscopy have been major techniques in many appli-ations, such as fluorescence kinetic studies ofuorophores at solid–liquid interfaces,1,2 fluorescence
ifetime imaging of living cells,3,4 and single molecu-ar detections.5–12 The ability to strongly reduceackground fluorescence from aqueous solutions haseen their major contribution. Such suppression ofackground fluorescence is achieved by a totally in-ernally reflected laser beam at the interface betweenhe cover glass surface and the aqueous solution, pro-ucing a nonpropagating evanescent field just beyondhe interface, with a penetration depth of less than00 nm. In this way only the fluorescent moleculesear the interface are excited, creating an extremely
The authors are with the Centre for Micro-Photonics, School ofiophysical Sciences and Electrical Engineering, Swinburn Uni-ersity of Technology, P.O. Box 218, Hawthorn, 3122, Australia.. Chon’s e-mail address is [email protected] 10 April 2003; revised manuscript received 27 October
hin optical section that leads to images of high con-rast.
At present, there are two types of TIRFM, therism type1–6,8–12 and the objective type.5–7 In arism-type TIRFM, an evanescent field is generatedt the interface between the prism and a sample byirection of a laser beam at an angle larger than theritical angle, and the fluorescence is collected by anbjective. In an objective-type TIRFM, a high-umerical-aperture �NA� objective of �1.3–1.4 issed to both excite an evanescent field and to collecthe fluorescence, thereby eliminating the placementf a prism. The inherent disadvantage of thebjective-type TIRFM is that only a small portion ofhe objective is utilized in generating an evanescenteld; consequently, positioning and focusing the laseream onto the objective is difficult and tedious.In this paper we propose a new type of TIRFM
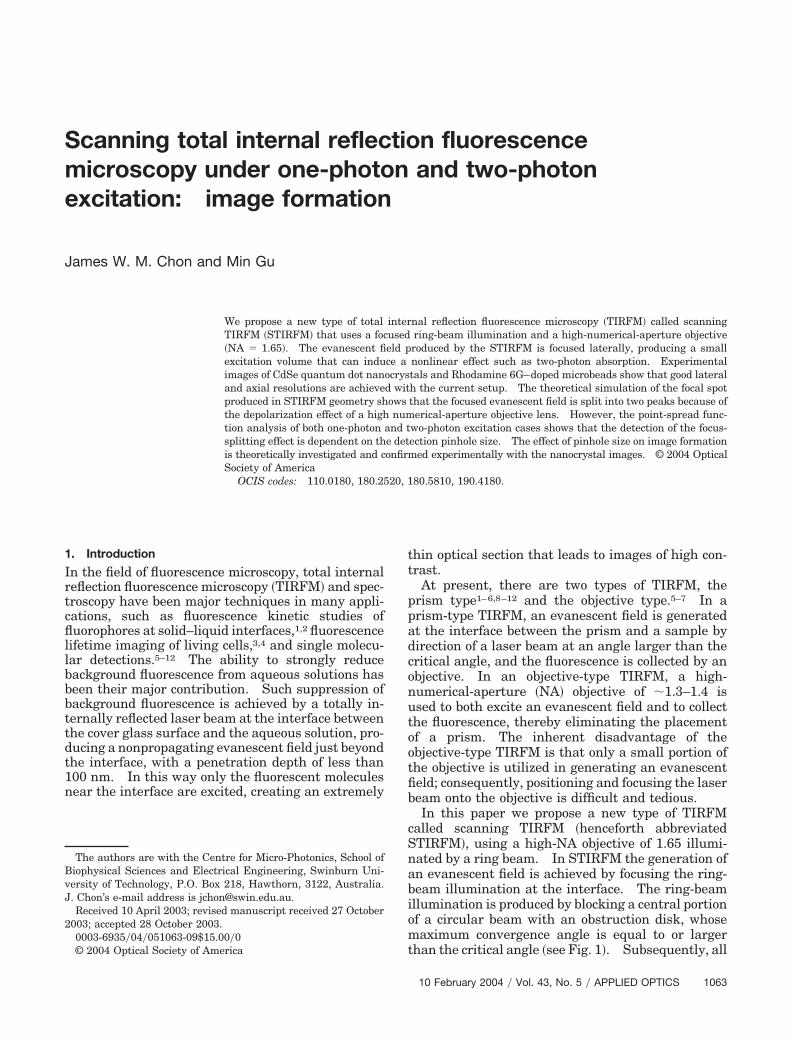
alled scanning TIRFM �henceforth abbreviatedTIRFM�, using a high-NA objective of 1.65 illumi-ated by a ring beam. In STIRFM the generation ofn evanescent field is achieved by focusing the ring-eam illumination at the interface. The ring-beamllumination is produced by blocking a central portionf a circular beam with an obstruction disk, whoseaximum convergence angle is equal to or larger
han the critical angle �see Fig. 1�. Subsequently, all
f the ring-beam illumination is totally internally re-ected to produce an evanescent field at the interface.lthough ring-beam illumination with a high-NA ob-
ective lens has been previously used in studying therientation of single molecules,13–15 the obstructionisk used in these studies opens the propagating com-onents, and therefore the geometry is not that of aIRFM in a strict sense.The geometry of STIRFM has several advantages
ver other types of TIRFM. First, with a high-NAbjective, the portion of the objective that can be uti-ized to produce an evanescent field is significantlyncreased. Second, penetration depth control of thevanescent field is made possible by adjustment ofhe obstruction disk diameter. Third, because theing beam is focused at the interface, the resultingvanescent field is localized in a very small volume.his small volume can induce fluorescence in a small
ig. 1. Concept of STIRFM. The focused evanescent field is pro-uced by focusing the ring-beam illumination at the interface be-ween a coverslip glass and a sample medium by a high-NA �1.65�bjective. The ring beam is produced by centrally obstructing theeam with a circular disk.
0 1 2
wartrtd
rea without exciting the neighboring molecules,hich consequently enhances the signal-to-ackground ratio and increases the resolution. Fur-hermore, with a highly focused beam, it would also beossible to induce a nonlinear effect such as two-hoton absorption at the focus.The aim of this paper is to characterize the single-
nd two-photon imaging performance of STIRFM ando compare it with the point-spread function �PSF�nalysis. In Section 2 we present the theoreticalimulation of the evanescent focal shape produced byhe geometry of STIRFM, and in Section 3 we discusshe single- and two-photon image formation inTIRFM. In Section 4 the experimental setup andhe experimental results of STIRFM are presented toerify the imaging capabilities of the current setup.n particular, we present the images of CdSe quan-um dots and Rhodamine 6G–doped microbeads toharacterize the imaging resolution, the focal shape,nd the evanescent field depth of STIRFM. Finally,e present our conclusions in Section 5.
. Theoretical Simulation of Focus Producedy STIRFM
n STIRFM, shown in Fig. 1, focusing with aigh-NA objective induces the depolarization of the
nput beam. To account for the depolarization ef-ect in simulations of the focus produced byTIRFM, the vectorial Debye theory is em-loyed.16,17 When a linearly polarized coherentonochromatic plane light wave is focused through
n index-mismatched interface by a high-NA objec-ive, the electric field in the focal region of the ob-ective16,17 can be expressed as
E�r2, �, z2� ��i�
�I0 � cos�2��I2i � sin�2��I2j
� 2i cos �I1k�, (1)
here i, j, and k are the unit vectors in the x, y, anddirections, respectively. The incident polarization
s assumed in the x direction. It is clear that E isepolarized and has three components Ex, Ey, and Ez.ariables r2, �, and z2 are the cylindrical coordinatesf an observation point. Here the definition of threeariables I , I , and I is given by
here J0�x�, J1�x�, and J2�x� are the zero-, first-,nd second-order Bessel functions of the first kind,espectively; � and are the convergence angles ofhe waves corresponding to the outer and inneradii of a ring beam, respectively; and ts and tp arehe Fresnel amplitude transmission coefficients forifferent polarization states. The aberration cor-
I0 � �
�
�cos �1�1�2 sin �1�ts � tp cos �2�exp�ik0���1�J0�k1 r2 sin �1�exp��ik2 z2 cos �2�d�1, (2)
I1 � �
�
�cos �1�1�2 sin �1�tp sin �2�exp�ik0���1�J1�k1 r2 sin �1�exp��ik2 z2 cos �2�d�1, (3)
I2 � �
�
�cos �1�1�2 sin �1�ts � tp cos �2�exp�ik0���1�J2�k1 r2 sin �1�exp��ik2 z2 cos �2�d�1, (4)
r
wft
�cd�osjt�rrtsaaoot2Ssc
�aaFi
o1ipc
Fo�nx
Fprobas
ection function ���1� is given by
���1� � �d�n1 cos �1 � n2 cos �2�, (5)
here d is the distance between the interface and theocal point of the objective. The intensity is propor-ional to the modulus squared of Eq. �1�.
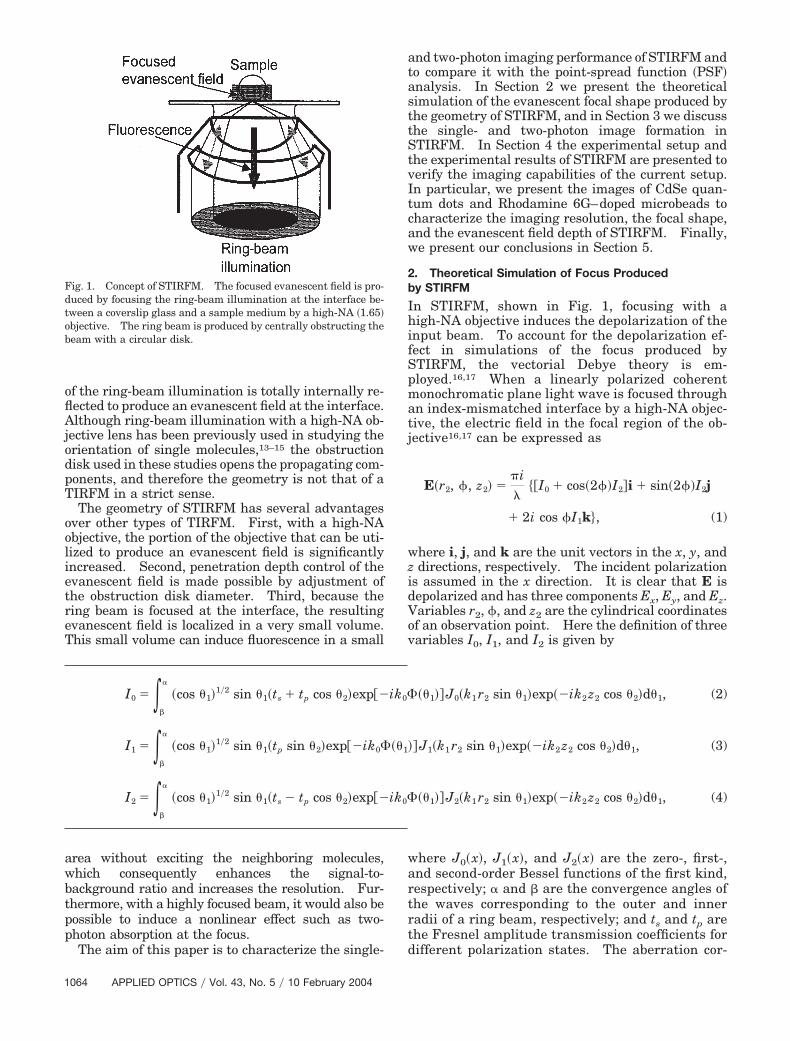
Figure 2 gives the contour plots ��x � kx sin � andy � ky sin �� of the normalized intensity �E�2 and itsomponents �Ex�2, �Ey�2, and �Ez�
2 in the x, y, and zirections near the focal region at the coverslip glassn � 1.78� and air interface �d � 0�, when an objectivef NA � 1.65 is illuminated by a ring beam ε, ob-truction radius normalized by the radius of the ob-ective aperture; εc, obstruction radius correspondingo the critical angle; εouter � 1 �i.e., � � 68°� and εinner
εc �i.e., � 35°�. Because the inner radius of theing beam is calculated to be equal to the criticaladius �εc�, the produced focus is evanescent in na-ure. As expected, because of the factors cos�2��,in�2��, and cos��� in Eq. �1� and because of the rel-tive strength of the Bessel functions, J0�x�, J1�x�,nd J2�x�, the patterns of �Ex�2, �Ey�2, and �Ez�
2 exhibitne, four, and two lobes, respectively. The splittingf the focus in the direction of polarization �x direc-ion� is visibly clear in the �E�2 distribution see Fig.�d�, and it is induced by the contribution from �Ez�
2.imilar to the free-space splitting, the relativetrength or the weighting of the �Ez�
2 to the �Ex�2omponent governs the overall shape of the focus.18
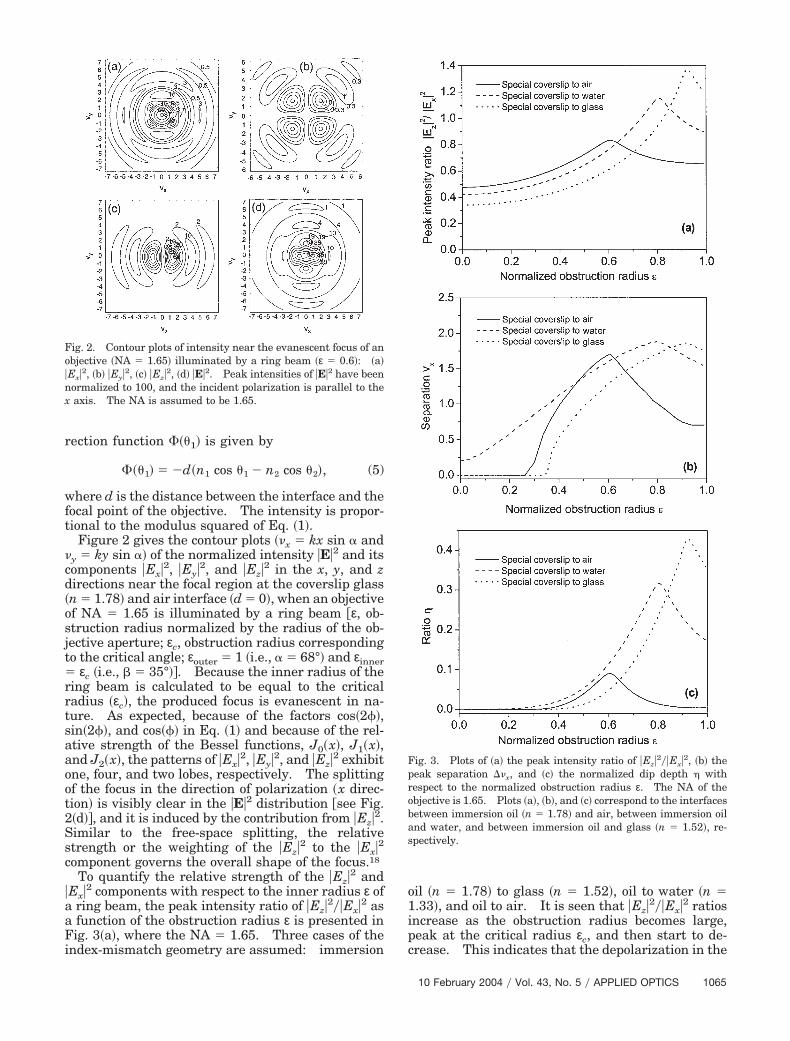
To quantify the relative strength of the �Ez�2 and
Ex�2 components with respect to the inner radius ε ofring beam, the peak intensity ratio of �Ez�
2��Ex�2 asfunction of the obstruction radius ε is presented inig. 3�a�, where the NA � 1.65. Three cases of the
ndex-mismatch geometry are assumed: immersion
ig. 2. Contour plots of intensity near the evanescent focus of anbjective �NA � 1.65� illuminated by a ring beam �ε � 0.6�: �a�Ex�2, �b� �Ey�2, �c� �Ez�2, �d� �E�2. Peak intensities of �E�2 have beenormalized to 100, and the incident polarization is parallel to theaxis. The NA is assumed to be 1.65.
il �n � 1.78� to glass �n � 1.52�, oil to water �n �.33�, and oil to air. It is seen that �Ez�
2��Ex�2 ratiosncrease as the obstruction radius becomes large,eak at the critical radius εc, and then start to de-rease. This indicates that the depolarization in the
ig. 3. Plots of �a� the peak intensity ratio of �Ez�2��Ex�2, �b� theeak separation ��x, and �c� the normalized dip depth � withespect to the normalized obstruction radius ε. The NA of thebjective is 1.65. Plots �a�, �b�, and �c� correspond to the interfacesetween immersion oil �n � 1.78� and air, between immersion oilnd water, and between immersion oil and glass �n � 1.52�, re-pectively.
direction is greatest when the convergence angle isear the critical angle. The decrease in the �Ez�
2�Ex�2 ratio after the critical angle is due to the facthat, for p-polarization case, the �Ez�
2 component ofn evanescent field decreases faster than the �Ex�2omponent as the incident angle further increasesrom the critical angle.6 For an s-polarized evanes-ent field, the �Ez�
2 component is obviously absent.herefore, in our geometry the integration over thezimuthal angle includes both cases of p- and-polarization, resulting in a stronger �Ex�2 compo-ent.The characteristic shape of the two-peak focus
an be described by the peak-to-peak separationistance expressed by the optical coordinate �� andhe normalized dip depth � �defined as the ratio ofhe dip depth between the two peaks to the peakntensity�. The separation �� and the normalizedip depth � versus the normalized obstruction ra-ius ε are presented in Figs. 3�b� and 3�c�, respec-ively. Similarly, the peak-to-peak separation andip depth are increased until the obstruction radiuseaches the critical radius, and then they are de-reased.In the two-peak separation plot Fig. 3�b� we note
hat focus splitting starts at a certain thresholdalue of the obstruction radius and that this thresh-ld obstruction radius is different for each interface.nterestingly, for the interface between the specialoverslip glass and the water, there is a focus-plitting effect present even when there is no ob-truction dashed line in Fig. 3�b�. However, theorresponding dip depth is less than 0.1%, indicat-ng that the focus-splitting effect is barely detect-ble in this case. The threshold value of thebstruction radius for the focus-splitting effect isetermined by the complicated coupling betweenhe �Ez�
2 and the �Ex�2 focal shapes; however, theirorresponding dip-depth ratios generally are negli-ibly small.Comparing the three different cases of the index-ismatched interface, one can observe that focus
plitting is most pronounced in the case of the specialoverslip glass �n � 1.78�–glass �n � 1.52� interface,here the dip-depth ratio � reaches 0.4. In contrast,
he interface between the special coverslip glass andhe air shows the weakest focus-splitting effect.rom these observations, it can be concluded that the
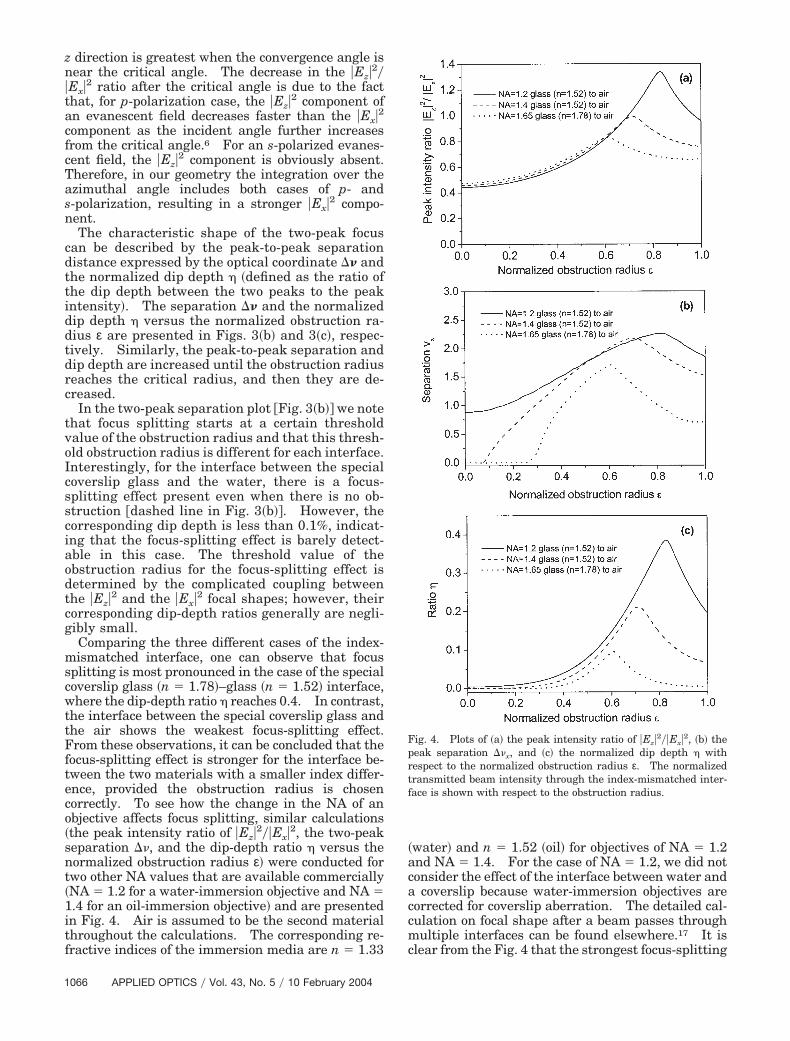
ocus-splitting effect is stronger for the interface be-ween the two materials with a smaller index differ-nce, provided the obstruction radius is chosenorrectly. To see how the change in the NA of anbjective affects focus splitting, similar calculationsthe peak intensity ratio of �Ez�
2��Ex�2, the two-peakeparation ��, and the dip-depth ratio � versus theormalized obstruction radius ε� were conducted forwo other NA values that are available commerciallyNA � 1.2 for a water-immersion objective and NA �.4 for an oil-immersion objective� and are presentedn Fig. 4. Air is assumed to be the second materialhroughout the calculations. The corresponding re-ractive indices of the immersion media are n � 1.33
water� and n � 1.52 �oil� for objectives of NA � 1.2nd NA � 1.4. For the case of NA � 1.2, we did notonsider the effect of the interface between water andcoverslip because water-immersion objectives are
orrected for coverslip aberration. The detailed cal-ulation on focal shape after a beam passes throughultiple interfaces can be found elsewhere.17 It is
lear from the Fig. 4 that the strongest focus-splitting
ig. 4. Plots of �a� the peak intensity ratio of �Ez�2��Ex�2, �b� theeak separation ��x, and �c� the normalized dip depth � withespect to the normalized obstruction radius ε. The normalizedransmitted beam intensity through the index-mismatched inter-ace is shown with respect to the obstruction radius.
ed�p
3o
ItpboptsCtc
wPs
fT
fn
aio
wdledtP
St
o
as
SFtSis
stf�ta
Fwiafl
Fnu
ffect is observed for the NA-1.2 objective, where theifference between the indices of the two materialswater to air� is the smallest, thus confirming ourrevious conclusion.
. Effect of a Detection Pinhole on Image Formationf STIRFM
n Section 2 the detailed theoretical studies predicthat the evanescent focus of STIRFM is split into twoeaks. However, whether such focus splitting cane directly observed in fluorescence images dependsn the detection system and the placement of theinhole. For one-photon excitation, it is necessaryo put a finite-sized pinhole in front of the detectionystem to reduce the background scattered signal.onsequently, the detection path is confocal in na-
ure, and the effective PSF �denoted by H1p�19 in thisase is given by
H1p � hillhdet � D���, (6)
here hill is the PSF for illumination and hdet is theSF for detection. The expression for hill takes theame form as the expression for �E�2, which is given by
hill � �E�2 � �I0�2 � 4�I1�2 cos2 �
� �I2�2 � 2 cos 2�Re�I0 I2*� (7)
or linearly polarized illumination light �� � 532 nm�.he expression for hdet is given by
hdet � �I0�2 � 2�I1�2 � �I2�2 (8)
or randomly polarized fluorescence light �� � 600m�. D��� is the detector �pinhole� function
D��� � �1 � � �d
0 otherwise , (9)
nd R is the two-dimensional convolution operationn a vertical plane. Here �d is the normalized radiusf the detector �pinhole� and is given by
�d �2�
�frd sin �d, (10)
here sin �d is the NA of the collector lens in theetection space, �f is the fluorescence emission wave-ength, and rd is the radius of the detector.19 Gen-rally, if the value of �d is close to zero �a pointetector�, the detector function D��� can be taken ashe Dirac delta function, and therefore the effectiveSF H1p is
H1p � hillhdet. (11)
imilarly, if the detector function is infinitely large,he PSF takes the form
H1p � hill, (12)
wing to the convolution relation.19
The contour plot of the PSF H1p for STIRFM withn infinitely large detector �no pinhole� takes theame form as that shown in Fig. 2�d�, whereas the
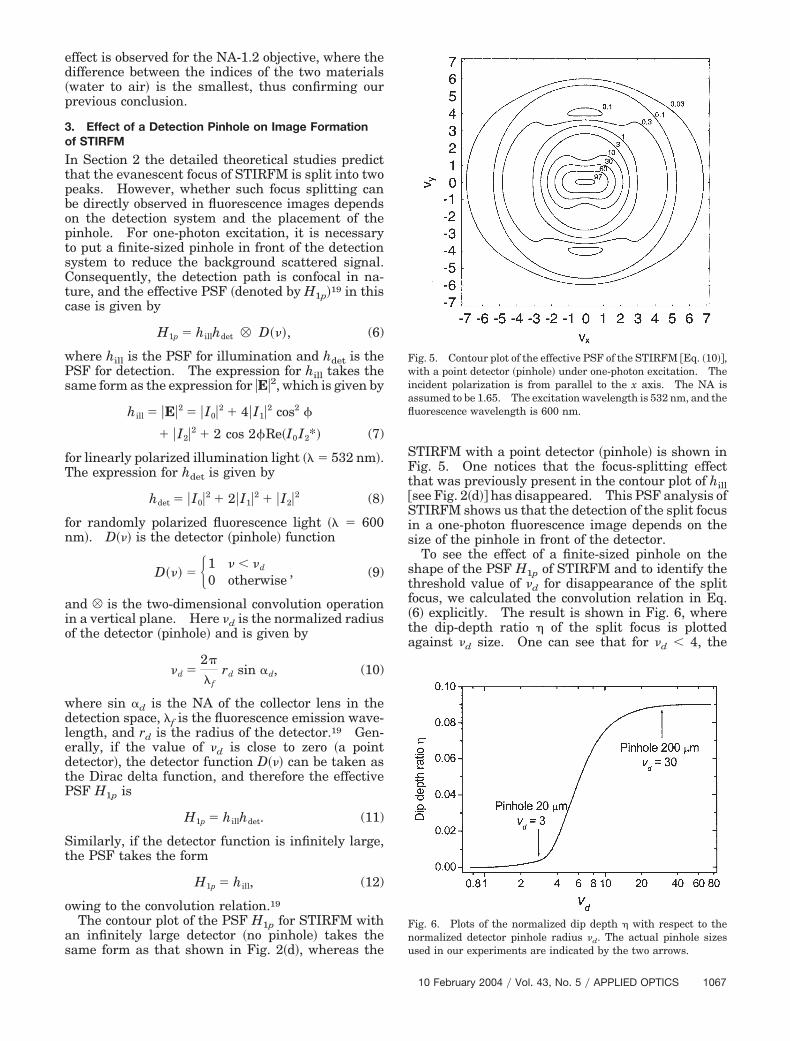
TIRFM with a point detector �pinhole� is shown inig. 5. One notices that the focus-splitting effecthat was previously present in the contour plot of hillsee Fig. 2�d� has disappeared. This PSF analysis ofTIRFM shows us that the detection of the split focus
n a one-photon fluorescence image depends on theize of the pinhole in front of the detector.To see the effect of a finite-sized pinhole on the
hape of the PSF H1p of STIRFM and to identify thehreshold value of �d for disappearance of the splitocus, we calculated the convolution relation in Eq.6� explicitly. The result is shown in Fig. 6, wherehe dip-depth ratio � of the split focus is plottedgainst �d size. One can see that for �d � 4, the
ig. 5. Contour plot of the effective PSF of the STIRFM Eq. �10�,ith a point detector �pinhole� under one-photon excitation. The
ncident polarization is from parallel to the x axis. The NA isssumed to be 1.65. The excitation wavelength is 532 nm, and theuorescence wavelength is 600 nm.
ig. 6. Plots of the normalized dip depth � with respect to theormalized detector pinhole radius �d. The actual pinhole sizessed in our experiments are indicated by the two arrows.
ip-depth ratio � of the split focus is less than 0.008,aking the split focus barely detectable. For �d �
4, the dip-depth ratio � reaches �0.1, which is closeo the value for the infinitely large detector case Fig.�d�. Thus �d � 4 can be approximated to be a pointetector, whereas �d � 14 can be approximated to ben infinitely large detector. This prediction is vali-ated in Section 4.For the two-photon excitation case, the pinhole is
emoved because optical sectioning is intrinsic to two-hoton excitation. As a result, the two-photon PSFs
H2p � hill2. (13)
or linearly polarized illumination light �� � 800m�, the contour plot of the two-photon PSF H2p ishown in Fig. 7. One observes that the focus-plitting effect is more discernible because the inten-ity is squared.In general, image formation in STIRFM is given by
he convolution of the fluorescence intensity of a sam-le with the PSF of the system. As we shall see inection 4, CdSe quantum dot nanocrystals can bereated as point emitters because their diameter ��6m� is much smaller than the Airy function of the
ocus �0.5 �m in full width at half-maximum�.herefore the image of quantum dots can be used as
he approximate effective PSF for STIRFM and besed to characterize the focal spot.
. Experimental Characterization of STIRFM
he experimental configuration of STIRFM is shownn Fig. 8. We used a 532-nm diode-pumped cw laserSpectra-Physics Millenia II� as a one-photon excita-ion light source, and a Ti:sapphire ultrashort-pulsed
ig. 7. Contour plot of the effective PSF of the STIRFM underwo-photon excitation. The incident polarization is parallel to the
axis. The NA is assumed to be 1.65. The excitation wave-ength is 800 nm.
aser �Spectra-Physics Tsunami�, operating at aavelength of 800 nm, as a two-photon light source.he laser beam was expanded and focused at thelass–air interface by an objective �NA � 1.65; Olym-us�. A central obstruction disk �diameter � 4.3m, εc � 0.62� was inserted just before the reflection
t the dichroic beamsplitter, producing a ring-beamllumination. An evanescent field was produced athe focus by obstruction of all the beams with a con-ergence angle smaller than the critical angle of in-idence. Fluorescence produced from the focus washen collected by the same objective and refocused atphotomultiplier tube �Oriel PMT Model 70680� to
etect its intensity. For one-photon imaging, a 20m diameter ��d � 3� and a 200 �m diameter ��d �0� pinholes were placed in front of the PMT to testhe image formation predictions from section III.or two-photon imaging, a 200 �m diameter pinhole
�d � 30� was used mainly to reduce the backgroundcattered light. For collecting the fluorescence in-ensity, the sample was scanned in the x and y direc-ions by a scanning stage �Physik Instrumente Model-517.3CL� to build up a two-dimensional fluores-ence image. A special coverslip glass and immer-ion oil for the NA-1.65 objective had a refractivendex of 1.78. The high refractive index of the im-
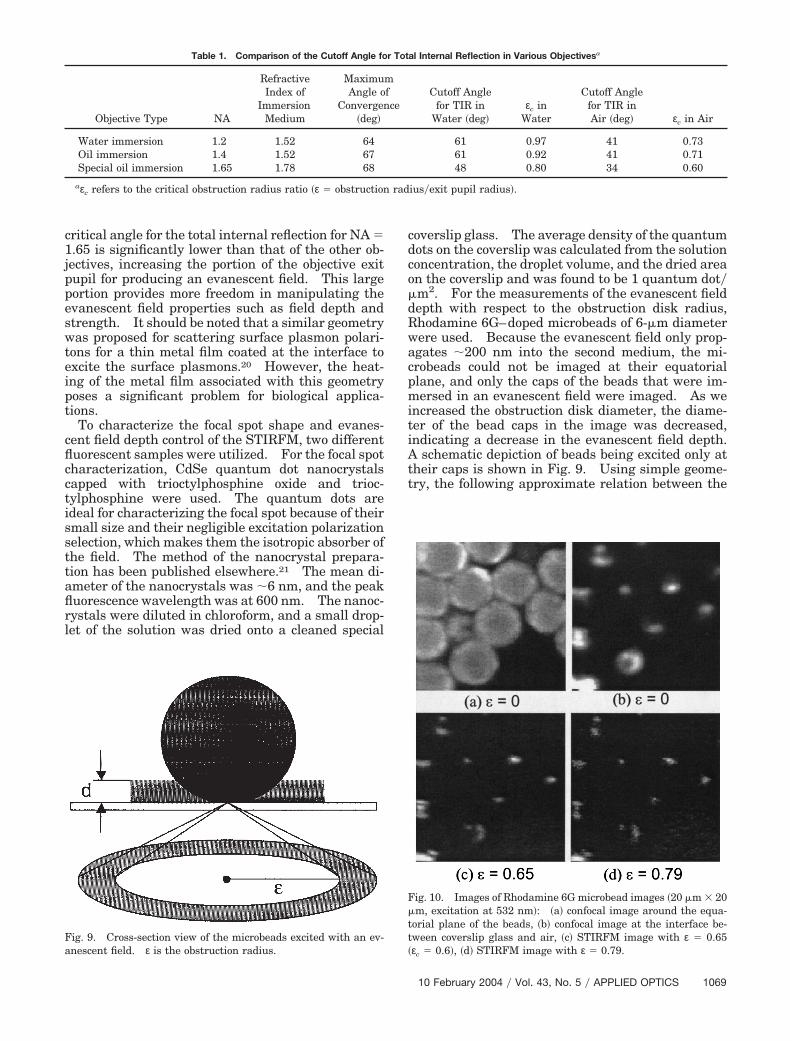
ersion oil and the coverslip glass increases the por-ion of the objective exit pupil in producing anvanescent field. For comparison, Table 1 shows theotal internal reflection angles and the maximumonvergence angles of three different high-NA objec-ives, as well as the ratio of the critical obstructionadius to the exit pupil radius �εc� for the total inter-al reflection. It is clear from the table that the
ig. 8. Experimental setup. Ring-beam illumination is pro-uced by centrally obstructing the circular beam with an opaqueisk just before the dichroic beam splitter. QWP, quarter-wavelate; GTP, Glan–Thompson polarizer; OD, obstruction disk; SS,canning stage; DB, dichroic beam splitter; NC, nanocrystal sam-le; OL, objective lens �NA � 1.65�; PH, pinhole; PC, personalomputer.
c1jppeswteipt
cflcctissttaflrl
cdco�dRwacpmitiAtt
Fa
F�tt�
rad
ritical angle for the total internal reflection for NA �.65 is significantly lower than that of the other ob-ectives, increasing the portion of the objective exitupil for producing an evanescent field. This largeortion provides more freedom in manipulating thevanescent field properties such as field depth andtrength. It should be noted that a similar geometryas proposed for scattering surface plasmon polari-
ons for a thin metal film coated at the interface toxcite the surface plasmons.20 However, the heat-ng of the metal film associated with this geometryoses a significant problem for biological applica-ions.
To characterize the focal spot shape and evanes-ent field depth control of the STIRFM, two differentuorescent samples were utilized. For the focal spotharacterization, CdSe quantum dot nanocrystalsapped with trioctylphosphine oxide and trioc-ylphosphine were used. The quantum dots aredeal for characterizing the focal spot because of theirmall size and their negligible excitation polarizationelection, which makes them the isotropic absorber ofhe field. The method of the nanocrystal prepara-ion has been published elsewhere.21 The mean di-meter of the nanocrystals was �6 nm, and the peakuorescence wavelength was at 600 nm. The nanoc-ystals were diluted in chloroform, and a small drop-et of the solution was dried onto a cleaned special
ig. 9. Cross-section view of the microbeads excited with an ev-nescent field. ε is the obstruction radius.
aεc refers to the critical obstruction radius ratio �ε � obstruction
overslip glass. The average density of the quantumots on the coverslip was calculated from the solutiononcentration, the droplet volume, and the dried arean the coverslip and was found to be 1 quantum dot�m2. For the measurements of the evanescent fieldepth with respect to the obstruction disk radius,hodamine 6G–doped microbeads of 6-�m diameterere used. Because the evanescent field only prop-gates �200 nm into the second medium, the mi-robeads could not be imaged at their equatoriallane, and only the caps of the beads that were im-ersed in an evanescent field were imaged. As we
ncreased the obstruction disk diameter, the diame-er of the bead caps in the image was decreased,ndicating a decrease in the evanescent field depth.
schematic depiction of beads being excited only atheir caps is shown in Fig. 9. Using simple geome-ry, the following approximate relation between the
ig. 10. Images of Rhodamine 6G microbead images �20 �m � 20m, excitation at 532 nm�: �a� confocal image around the equa-
orial plane of the beads, �b� confocal image at the interface be-ween coverslip glass and air, �c� STIRFM image with ε � 0.65ε � 0.6�, �d� STIRFM image with ε � 0.79.
iameter a of the cap image and the evanescent fieldepth d may be derived
d � r � r2 � �a�2�21�2, (14)
here r is the radius of the bead. Here the diameterof the cap image is defined by the full width at
alf-maximum of the bead image. With Eq. �14� theelative evanescent field depths were measured withespect to the obstruction disk size.
Figure 10 shows the one-photon fluorescence im-ges of Rhodamine 6G microbeads in confocal micros-opy and STIRFM. Figs. 10�a� and 10�b� areonfocal images of the microbeads around the equa-orial plane and at the interface, respectively. Themage at the interface see Fig. 10�b� shows that
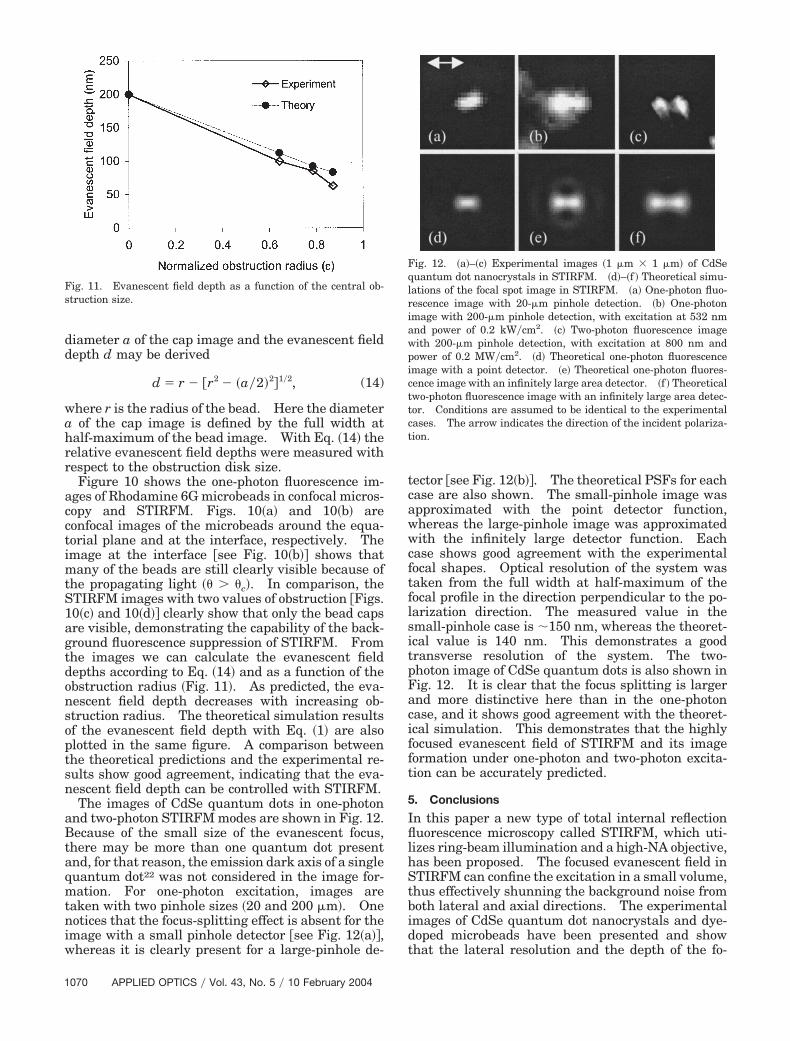
any of the beads are still clearly visible because ofhe propagating light �� � �c�. In comparison, theTIRFM images with two values of obstruction Figs.0�c� and 10�d� clearly show that only the bead capsre visible, demonstrating the capability of the back-round fluorescence suppression of STIRFM. Fromhe images we can calculate the evanescent fieldepths according to Eq. �14� and as a function of thebstruction radius �Fig. 11�. As predicted, the eva-escent field depth decreases with increasing ob-truction radius. The theoretical simulation resultsf the evanescent field depth with Eq. �1� are alsolotted in the same figure. A comparison betweenhe theoretical predictions and the experimental re-ults show good agreement, indicating that the eva-escent field depth can be controlled with STIRFM.The images of CdSe quantum dots in one-photon
nd two-photon STIRFM modes are shown in Fig. 12.ecause of the small size of the evanescent focus,
here may be more than one quantum dot presentnd, for that reason, the emission dark axis of a singleuantum dot22 was not considered in the image for-ation. For one-photon excitation, images are
aken with two pinhole sizes �20 and 200 �m�. Oneotices that the focus-splitting effect is absent for the
mage with a small pinhole detector see Fig. 12�a�,hereas it is clearly present for a large-pinhole de-
ig. 11. Evanescent field depth as a function of the central ob-truction size.
ector see Fig. 12�b�. The theoretical PSFs for eachase are also shown. The small-pinhole image waspproximated with the point detector function,hereas the large-pinhole image was approximatedith the infinitely large detector function. Each
ase shows good agreement with the experimentalocal shapes. Optical resolution of the system wasaken from the full width at half-maximum of theocal profile in the direction perpendicular to the po-arization direction. The measured value in themall-pinhole case is �150 nm, whereas the theoret-cal value is 140 nm. This demonstrates a goodransverse resolution of the system. The two-hoton image of CdSe quantum dots is also shown inig. 12. It is clear that the focus splitting is largernd more distinctive here than in the one-photonase, and it shows good agreement with the theoret-cal simulation. This demonstrates that the highlyocused evanescent field of STIRFM and its imageormation under one-photon and two-photon excita-ion can be accurately predicted.
. Conclusions
n this paper a new type of total internal reflectionuorescence microscopy called STIRFM, which uti-
izes ring-beam illumination and a high-NA objective,as been proposed. The focused evanescent field inTIRFM can confine the excitation in a small volume,hus effectively shunning the background noise fromoth lateral and axial directions. The experimentalmages of CdSe quantum dot nanocrystals and dye-oped microbeads have been presented and showhat the lateral resolution and the depth of the fo-
ig. 12. �a�–�c� Experimental images �1 �m � 1 �m� of CdSeuantum dot nanocrystals in STIRFM. �d�–�f � Theoretical simu-ations of the focal spot image in STIRFM. �a� One-photon fluo-escence image with 20-�m pinhole detection. �b� One-photonmage with 200-�m pinhole detection, with excitation at 532 nmnd power of 0.2 kW�cm2. �c� Two-photon fluorescence imageith 200-�m pinhole detection, with excitation at 800 nm andower of 0.2 MW�cm2. �d� Theoretical one-photon fluorescencemage with a point detector. �e� Theoretical one-photon fluores-ence image with an infinitely large area detector. �f � Theoreticalwo-photon fluorescence image with an infinitely large area detec-or. Conditions are assumed to be identical to the experimentalases. The arrow indicates the direction of the incident polariza-ion.
caifdsqTtu
rilnp
BMmkC
R
1
1
1
1
1
1
1
1
1
1
2
2
2
2
used evanescent field of STIRFM can be well char-cterized and controlled. A rigorous theoreticalnvestigation of the electric field structure near theocus in STIRFM has shown focus splitting due toepolarization. An appropriate PSF analysis of theystem has been provided for the interpretation of theuantum dot images and the focus-splitting effect.o increase the transverse resolution and to remove
he elongation of the focal spot in STIRFM, one canse the apodization method for a lens of the future.23
It is expected that STIRFM will play an importantole in the area of single molecular detection; near-nterface fluorescence kinetic studies; fluorescenceifetime imaging; and near-field applications, such asear-field trapping, near-field fabrication, and two-hoton near-field microscopy.
The authors thank Paul Mulvaney and Craigullen of the School of Chemistry, The University ofelbourne, for CdSe quantum dot samples and forany interesting discussions. The authors also ac-
nowledge support from the Australian Researchouncil.
eferences1. H. Watarai and F. Funaki, “Total internal reflection fluores-
cence measurements of protonation equilibria of Rhodamine Band Octadecylrhodamine B at a toluene�water interface,”Langmuir 12, 6717–6720 �1996�.
2. M. Toriumi and M. Yanagimachi, “Time-resolved total-internal-reflection fluorescence spectroscopy and its applica-tions to solid�polymer interface layers,” in Microchemistry,Spectroscopy and Chemistry in Small Domains, H. Masuhara,F. De Schryver, N. Kitamura, and N. Tamai, eds. �Elsevier,New York, 1994�, pp. 257–268.
3. K. Stock, R. Sailer, W. S. L. Strauss, R. Pavesi, M. Lyttek, H.Emmert, and H. Schneckenburger, “Total internal reflectionfluorescence spectroscopy and microscopy �TIRFS�TIRFM� incell biology and photobiology,” in Fluorescence Microscopy andFluorescent Probes, A. Kotyk, ed. �Espero Publishing, Prague,1999�, Vol. 3, pp. 67–79.
4. R. Sailer, K. Stock, W. S. L. Strauss, M. Lyttek, and H.Schneckenburger, “Total internal reflection fluorescence mi-croscopy �TIRFM� of acridine orange in single cells,” Endocy-tobiosis & Cell Res. 14, 129–136 �2001�.
5. W. P. Ambrose, P. M. Goodwin, and J. P. Nolan, “Single-molecule detection with total internal reflection excitation:comparing signal-to-background and total signals in differentgeometries,” Cytometry 36, 224–231 �1999�.
6. M. F. Paige, E. J. Bjerneld, and W. E. Moerner, “A comparisonof through-the-objective total internal reflection microscopyand epi-fluorescence microscopy for single-molecule fluores-cence imaging,” Single Mol. 2, 191–201 �2001�.
7. M. Tokunaga, K. Kitamura, K. Saito, A. H. Iwane, and T.
Yanagida, “Single molecule imaging of fluorophores and enzy-matic reactions achieved by objective-type total internal reflec-tion fluorescence microscopy,” Biochem. Biophys. Res.Commun. 235, 47–53 �1997�.
8. T. Funatsu, Y. Harada, M. Tokunaga, K. Saito, and T.Yanagida, “Imaging of single fluorescent molecules and indi-vidual ATP turnovers by single myosin molecules in aqueoussolution,” Nature 374, 555–559 �1995�.
9. R. D. Vale, T. Funatsu, D. W. Pierce, L. Romberg, Y. Harada,and T. Yanagida, “Direct observation of single kinesin mole-cules moving along microtubules,” Nature 380, 451–453�1996�.
0. T. Wazawa, Y. Ishii, T. Funatsu, and T. Yanagida, “Spectralfluctuation of a single fluophore conjugated to a protein mol-ecule,” Biophys. J. 78, 1561–1569 �2000�.
1. Y. Sako, S. Minoghchi, and T. Yanagida, “Single-molecule im-aging of EGFR signaling on the surface of living cells,” Nat.Cell Biol. 2, 168–172 �2000�.
2. R. M. Dickson, D. J. Norris, Y. L. Tzeng, and W. E. Moerner,“Three-dimensional imaging of single molecules solvated inpores of poly�acrylamide� gels,” Science 274, 966–968 �1996�.
3. B. Sick, B. Hecht, and L. Novotny, “Orientational imaging ofsingle molecules by annular illumination,” Phys. Rev. Lett. 85,4482–4485 �2000�.
4. B. Sick, B. Hecht, U. P. Wild, and L. Novotny, “Probing con-fined fields with single molecules and vice versa,” J. Microsc.202, 365–373 �2000�.
5. L. Novotny, M. R. Beversluis, K. S. Youngworth, and T. G.Brown, “Longitudinal field modes probed by single molecules,”Phys. Rev. Lett. 86, 5251–5254 �2001�.
6. P. Torok, P. Varga, Z. Laczik, and G. R. Booker, “Electromag-netic diffraction of light focused through a planar interfacebetween materials of mismatched refractive indices: an inte-gral representation,” J. Opt. Soc. Am. A 12, 325–332 �1995�.
7. M. Gu, Advanced Optical Imaging Theory �Springer, Heidel-berg, 2003�.
8. J. W. M. Chon, X. Gan, and M. Gu, “Splitting of the focal spotof a high numerical-aperture objective in free space,” Appl.Phys. Lett. 81, 1576–1578 �2002�.
9. M. Gu, Principles of Three-Dimensional Imaging in ConfocalMicroscopy �World Scientific, Singapore, 1996�.
0. H. Kano, S. Mizuguchi, and S. Kawata, “Excitation of surface-plasmon polaritons by a focused laser beam,” J. Opt. Soc. Am.B 15, 1381–1386 �1998�.
1. C. B. Murray, D. J. Norris, and M. G. Bawendi, “Synthesis andcharacterization of nearly monodisperse CdE �E � S, Se, Te�semiconductor nanocrystallites,” J. Am. Chem. Soc. 115,8706–8715 �1993�.
2. S. A. Empedocles, R. Neuhauser, and M. G. Bawendi, “Three-dimensional orientation measurements of symmetric singlechromophores using polarization microscopy,” Nature 399,126–130 �1999�.
3. G. Toraldo di Francia, “Super-gain antennas and optical re-solving power,” Nuovo Cimento Suppl. 9, 426–428 �1952�.