68
AUGUST 1964 survey of CURRENT BUSINESS U.S. DEPARTMENT OF COMMERCE OFFICE OF BUSINESS ECONOMICS Digitized for FRASER http://fraser.stlouisfed.org/ Federal Reserve Bank of St. Louis

AUGUST 1964
survey of
CURRENTBUSINESS
U.S. DEPARTMENT OF COMMERCE
OFFICE OF BUSINESS ECONOMICS
Digitized for FRASER http://fraser.stlouisfed.org/ Federal Reserve Bank of St. Louis

SURVEY OF CURRENT BUSINESS
AUGUST 1964 VOL. 44, NO.
ContentsTHE BUSINESS SITUATION PAGE
Summary , . 1
Gross National Product Continues Sharp Increase in Second
Quarter 3
Pattern of Second Quarter Advance 3
The Tax Cut 5
ARTICLES
Foreign Investments in 1963-64 8
Portfolio and Short-Term Investments 8
Direct Investments Abroad 9
Earnings and Income 12
Foreign Investments in the U.S. 13
Overall Investment Position 24
Personal Income by States and Regions in 1963 15
U.S. Department of Commerce
Luther II. HodgesSecretary
Richard H. HoltonAssistant Secretary for
Economic Affairs
Office of Business EconomiesGeorge Jaszi
Director
Louis J. ParadisoAssociate Director
Murray F. FossEditor
K. Celeste StokesStatistics Editor
Billy Jo ETurGraphics
STAFF CONTRIBUTORSTO THIS ISSUE
Business Review and Features:David R. Hull, Jr.Robert B. Bretzfelcler
Articles:Samuel PizerFrederick Cutler
Julius N. FreidlinZalie V. Warner
Regional Economies Division Stai
Subscription prices, including weekly stistical supplements, are $4 a year for <mestic and $7.50 for foreign mailing. Sin;issue 30 cents.
Make checks payable to the Supertendent of Documents and send to UGovernment Printing Office, WashingtcD.C., 20402, or to any U.S. DepartmentCommerce Field Office.
U.S. DEPARTMENT OF COMMERCE FIELD OFFICESAlbuquerque, N. Mex., 87101, U.S. Courthouse. Phone
247-0311.Anchorage, Alaska, 99501, Loussae-Sogn Bldg. BR
2-9611.Atlanta, Ga., 30303 75 Forsyth St. NW. JA 2-4121.Baltimore, Md., 21200, 305 U.S. Customhouse PL
2-8460Birmingham, Ala., 35203, 2030 Third Ave. N Phone
325-3131.Boston, Mass., 02110, 80 Federal St. CA 3-2312.Buffalo, N.Y., 14203, 117 Ellicott St. 842-3208Charleston, S.C., 29401, No. 4 North Atlantic Wharf.
Phone 722-6551.Charleston, W. Va., 25301, 500 Quarrier St. Phone 343-
6196.Cheyenne, Wyo., 82001, 16th St. and Capitol Ave.
Phone 634-2731.Chicago, 111., 60604, 1486 New Federal Bldg. Phone
828-4400.Cincinnati, Ohio, 45202, 550 Main Street. Phone 381-
2200.Cleveland, Ohio, 44101, E. 6th St. and Superior Ave.
Phone 241-7900.
Dallas, Tex.. 75202,1114 Commerce St. HI 9-3287.Denver, Colo., 80202, 142 New Customhouse. Phone
534-41.01.Des IVloir.es, lov/a, 50309 1216 Paramount Bids. Phone
284-4222Detroit, Mich., 43226, 445 Federal Bldg. Phone 226-
6088.Greensboro, N.C., 27402, 407 U.S. Post Office Bldg.
Phone 273-8234.Hartford, Conn., 06103,18 Asylum St. Phone 244-3530.Honolulu, Hawaii, 9G813, 202 International Savings
Bldg. Phone 338-667.Houston, Tex., 77002, 515 Rusk Are, CA 8-0611.Jacksonville, Fla., 32202, 512 Greenleaf Bldg. EL 4-7111.Kansas City, Mo., 64106, 911 Walnut St. BA 1-7000.Los Angeles, Calif., 90015, 1031 S. Broadway. Phone
688-2330.Memphis, Tenn., 38103, 345 Federal Office Bldg. 534-
3211.Miami, Fla., 33132, 51 S.W. First Ave. FR 7-2581.Milwaukee, Wis., 53203, 238 W. Wisconsin Ave. BR
2-8600.Minneapolis, Minn., 55401, Federal Bldg. Phone 334-
2133.
New Orleans, La., 70130, 333 St. Charles Ave. Phone527-6546.
New York, N.Y., 10001, Empire State Bldg. LO 3-3377.Philadelphia, Pa., 19107, 1015 Chestnut St. WA 3-2400.Phoenix, Ariz., 85025, 230 N. First Ave. Phone 261-3285.Pittsburgh, Pa., 15222, 355 Fifth Ave. Phone 644-2851.Portland, Oreg., 97204, 217 Old U.S. Courthouse Bldg.
Phone 226-3361.Reno, Nev., 89502, 1479 Wells Ave. FA 2-7133.Richmond, Va., 23240, 2105 Federal Bldg. Phone 649-
3611.St. Louis, Mo., 63103, 2511 Federal Bldg. MA 2-4243.Salt Lake City, Utah, 84111,125 South State St. Phone
524-5116.San Francisco, Calif., 94102, 450 Golden Gate Ave.
556-5864.Santurce, Puerto Rico, 00907,605 Condado Ave. Phone
723-4640.Savannah, Ga., 31402, 235 U.S. Courthouse and P.O.
Bldg. AD 2-4755.Seattle, Wash., 98104, 809 Federal Office Bldg. MU
2-3300.
Digitized for FRASER http://fraser.stlouisfed.org/ Federal Reserve Bank of St. Louis

By the Office of Business Economics
wciuon*••jULY was another month of risingbusiness activity, after allowance forseasonal influences. Important meas-ures such as personal income, industrialproduction, retail sales and n on farmemployment were higher than in June.The July increases put all of theseindicators above their respective secondquarter averages, starting the 14thquarter of expansion in the presentcyclical advance.
The latest developments follow asecond quarter increase in GNP of $10billion, the fourth large quarterly risein a row. Heightened demand in mostfinal markets contributed to the ad-vance, but the expansion in consumerexpeiiditures was predominant. A moredetailed review accompanying the reg-ular second quarter income and productstatistics is presented in later pages ofthis issue.
Retail sales higher
Increased consumer buying, underthe influence of rising disposable in-come, was the major stimulus to theincreased economic activity in the firsthalf of this year. This summer retailsales are continuing to show strength.The preliminary report on retail tradefor July put sales at a new peak, about 1percent (seasonally adjusted) above therevised June rate and above theprevious high readied,in May.
Sales were up in both durable goodsand nondurable goods stores fromJune to July. For durables the Julyrate was about 1 percent above thesecond quarter average, and for non-durables, about 2 percent.
The durable goods rise over themonth was rather sharp, and reflectedsome recovery in automotive sales,which had fallen the month beforebecause of the trucking strike thatheld back deliveries from East Coastplants to retail dealers. Since the
strike was not settled until the end ofthe third week in July the month'sperformance looked comparatively good,gaged by unit sales o! new domestic cars.The seasonally adjusted annual rate ofsales was in excess of 7% million ve-hicles, well above the June rate and not
EXPANSION HAS ACCELERATED
SINCE MID-1963 , . .
Billion $
650
As Gams in FINAL PURCHASESHave Been Strong <. * <
650
600
550
500
450
50
0
-50
i i i I i i i
And INVENTORY ACCUMULATIONHas Continue*! Moderate
Current $
PRICES Have Advanced Slowly
Index, 1963 ~ 100
125
100;
75
Implicit GNP Deflator
1961 1962 1963 1964
Seasonally Adjusted, at Annual Rate
O.S. Department of Commerce, Gfftce+of Business Economics 64-3-1
far from the 734 million average ratefor the first 5 months of 1964.Although retail stocks are high, thefavorable selling pace in the mostrecent weeks suggests that the cleanupof 1964 models is proceeding in anorderly fashion.
Personal income and employmentadvance
Personal income rose about $1^billion at a seasonally adjusted annualrate to reach a total of $491 billion inJuly. Somewhat more than $1 billionof the rise reflected increased wageand salary payments, about evenlydivided among the major industrygroupings.
The rise in payrolls during the monthwas primarily the result of increasedemployment. The IK > i if arm establish-ment total was up about 140,000, afterseasonal ad jus tmen t ; except for govern-ment employment, which dippedslightly, increases were quite generalby industry division. The July risewas the eighth successive monthlyadvance in employment, which liasrisen by more than 1/2 million overthe past year.
Unemployment lower
The sustained rise in the demand forlabor has brought about a distinct im-provement in the overall unemploy-ment situation this spring and summer.The number of jobless fell more thanusual from June to July, to a seasonallyadjusted total of 3.6 million, and theunemployment rate declined to 4.9 per-cent. In the past 3 months the ratehas moved irregularly lower, averaging5.1 percent, the lowest 3-month averagein 5 years. The incidence of unemploy-ment still varies widely but the recentimprovement has been rather general,as may be seen in the following table.
1Digitized for FRASER http://fraser.stlouisfed.org/ Federal Reserve Bank of St. Louis

SURVEY OF CURRENT BUSINESS August 11W4
Unemployment Rate, Seasonally Adjusted
3 months ending
! Men ! \Vomenj I1 20 ; 20 ! Mar- j Teen-
Total! years ; years i ried ! agersand and ; men j
: over over ! |
July 19H3
October 1953
Januarv 1964
April 1964
July 1964 .__ _
o 7
5 5
5. 7
5 4
5.1
4 4
4.2
4.4
3 9
3.8
o 4
5.6
5 5
5 5
5.0
3 2
3.0
3.3
2 9
2.7
16 5
15.2
15.5
14 8
14.7
Balance of payments deficit rises
Preliminary estimates of the secondquarter balance of payments indicate adeterioration as compared with the first-quarter of 1964. Measured by changesin U.S. official monetary reserves and inliquid liabilities to foreigners, the sea-sonally adjusted balance was adverse byabout $790 million in the spring quarter,as compared with a first quarter deficitof about $75 million. The second quar-ter total includes as liquid liabilitiesforeign purchases of $122 million ofconvertible special Government se-curities.
Although the change in the balancefrom the first to the second quarterappears to have been large, it was notunexpected, as the international trans-actions during the first quarter includedmany which were temporarily favorableto the U.S. balance of payments.
New Orders
Xew orders received by manufac-turers of durable goods, winch hadmoved up sharply in the first quarterof this year, increased further duringthe second quarter, reflecting the risingdemand for durable goods. The sec-ond quarter rate of orders was morethan 3 percent above that of the firstquarter and almost 10 percent higherthan the corresponding 1963 figure.
Shipments by durable goods indus-tries have also increased this year, butthe inflow of new orders has exceededshipments in each month since January.As a result, the volume of unfilled orderslias shown a steady rise since the begin-ning of the year and has increased rela-
tive to sales. In the second half of1963 backlogs declined slightly, bothin level and relative to sales.
The fluctuating volume of defenseorders frequently introduces an elementof irregularity into the new ordersseries. Part of this year's overall in-crease is due to an upsurge in defenseorders during the first quarter from thevery low fourth quarter 1963 level.However, the exclusion of defense fromthe total, as may be seen in the accom-panying chart, would still leave theorder rate during the second quarter ata record level for the current expansion.
Primary metals orders up
A feature of the April-June periodhas been the sustained strength in theflow of orders to producers of primarymetals. Orders received bv these in-
NEW ORDERS-DURABLE GOODSINDUSTRIES
Billion $
24
22
20
18
16
14
12
10
Total, Excluding Defense '
Machinery and Equipment
\
1962 1963 1964Seasonally Adjusted
* Defense products include communicationequipment, complete a i r c r a f t , a i r c ra f t parts,
and ordnance.
U.S. Department o f 'Commerce, Off ice of Business Economics 64-8-2
dustries rose 10 percent as comparedwith the prior 3-month period, withsteel mill orders up about 15 percentand other primary metals 5 percenthigher. The increasing inflow of newbusiness to iron and steel producershas been reflected in rising steel milloutput this year. This strengtheningof demand has lengthened deliverytimes for many mill products, and liasled a majority of producers to antici-pate an improvement in the rate ofAugust shipments over the July level.
Rise in machinery
New orders for machinery and equip-ment are responding to the step-upin business investment programs nowtaking place and scheduled for therest of the year. The first-to-secondquarter gain was close to 9 percent,and incoming business during Mayand June was at peak levels. Neworders received have exceeded ship-ments by these industries eacli monththis year, continuing a trend in progresssince November 1962.
While most machinery and equip-ment industries have experienced somerise in orders, the most significantgains have taken place in nonelectricalmachinery. Orders for such equip-ment have advanced for seven succes-sive quarters, with an accelerationevident in the past two quarters.Builders of machine tools have reporteda sharp jump in bookings with demandfrom the automotive industry especiallyheavy. Industries manufacturing con-sumer durable goods have been re-ceiving orders at a fast pace throughoutthe first half as consumer spendingfor their products has been stepped upat the retail level.
Railroad freight car orders haveclimbed dramatically. The number ofcars placed on order so far in 1964is up 45 percent from a year earlier,as the carriers continue to modernizetheir rolling stock, and attempt toprovide the specialized types of equip-ment demanded by many shippers.
Digitized for FRASER http://fraser.stlouisfed.org/ Federal Reserve Bank of St. Louis

August 1964 SURVEY OF CURRENT BUSINESS
Gross National Product Continues Sharp Increase in Second Quarter
Reflecting the underlying- strength ofconsumer, business, and governmentdemand, the GNP expanded again inthe second quarter of 1964 to reach$618^ billion at a seasonally adjustedannual rate. This was a gain of nearly$10 billion, or more than 1% percent,over the preceding quarter. Withprices continuing their slow rise—thelatest was about one-half of 1 percent—the second quarter advance in the realvolume of output exceeded 1 percent,about matching the average quarterlyproduction gain since mid-1963,
The major feature of the quarter wasthe sharp $12 billion advance in dis-posable personal income, reflecting ris-ing activity and the first full quartereffect of the tax cut. The income in-crease was about equally divided be-tween consumption and saving-.
The rise in GNP over the past yearrepresents a distinct acceleration in thepresent expansion, reflecting more rapidincreases- in demand in most finalmarkets (see chart). Nonetheless cy-clical excesses have been avoided. Theprice rise has been moderate. Inven-tory accumulation has not been largeand stocks remain low relative to sales.Capital investment has been moving-higher but at a rather steady pace.Profit margins continue strong, tendingto rise slowly during the past year.
Pattern of Second QuarterAdvance
The second quarter GNP gains werewidely distributed. Demand in nearlyall major domestic final markets washigher in the spring than in the winterquarter, and inventory accumulation—although continuing moderate—was ata somewhat faster pace than in thefirst quarter.
Consumer demand higher
With the tax cut reflected in pay-checks throughout the quarter, morethan half of the GNP rise was accountedfor by a $6 billion increase in consumerpurchases. This was less than the $9billion advance in the opening quarterof 1964 but clearl}7 exceeded the average
quarterly increases of the current ex-pansion. For the first two quarters of1964 combined, the advance in con-sumption expenditures was the largesthalf-yearly rise in peace time.
Demand for household furniture andappliances and for apparel, food and awide range of miscellaneous nondurablesand semidurables has been very strongso far this year. Since the fourthquarter expenditures for consumergoods except autos have increased 2percent per quarter. In the earlier
THREE PHASES OF THE BUSINESS
EXPANSION
Increases in the REAL VOLUME of OUTPUTAccelerated During the Past Year
Average Percent ChangePer Quarter U
0 1 2 3 4 5
GNP, TOTAL: • : ) i i96i -n 1952
U 1962-H 19631963-11 1964
Demand in Most FINAL MARKETS Grew MoreRapidly
FinalPurchases
Business FixedInvestment
Consumer
Federal
State andLocal
Res iden t ia lConstruct ion
Recent Gains by TYPE OF PRODUCT EvenlyDistributed
Serv ices
Construct ion
NondurableGoods
DurableGoods
-U Based en 1954 dol lar data,
U.S. Department of Commerce, Off ice of Business Ecanomics 6 4 - 8 - 3
part of the business expansion, demandfor this combined group of itemsad vane sd more slowly—at an average of1 percent per quarter.
Automobile sales, on the other hand,were little changed in the spring fromthe very high first quarter pace, partlybecause of the trucking strike towardthe end of the second quarter. Ascompared with the fourth quarter 1963rate, car sales in the spring quarterwere $1 billion higher.
Fixed investment mixed
Business investment in plant andequipment rose three-quarters of abillion dollars in the second quarterto reach a seasonally adjusted annualrate of $57/4 billion. In five successivequarterly advances, business fixed in-vestment has risen $7% billion, ornearly 15 percent, following the hesita-tion of late 1962—early 1963. Thelatest OBE-SEC Plant and EquipmentSurvey indicates that there will be acontinued strong rise in investment atleast through the end of 1964.
The value of residential constructionput in place, at a seasonally adjustedannual rate of $2$% billion in the springquarter, was down three-quarters of abillion dollars from the first quarter.This dip has reflected mainly someweakening in the strong 3-year advancein multi-family housing.
Inventory accumulation higher butstill moderate
So far in 1964, inventory accumula-tion has been restrained and below themoderate rate of late 1963. In thesecond quarter additions to stocks wereat a $3% billion annual rate, up about$1% billion over the first quarter. Mostof the second quarter stock buildingwas in durable goods, in contrast to thefirst quarter concentration in non-durables. Furthermore, the bulk ofthe latest increase was in trade stocks.There were sizable but offsettingchanges within manufacturing indus-tries; most durable goods industries,particularly machinery, added to in-ventories.
Government purchases spurt
A $4% billion rise in government out-lays for goods and services in the springquarter carried the total to $129% bil-lion at a seasonally adjusted annual
Digitized for FRASER http://fraser.stlouisfed.org/ Federal Reserve Bank of St. Louis

PERSONAL INCOME, TAXES, SPENDING,
AND SAVING
Billion525
500
475
450
75
50
25
0
450
425
400
375
400
375
350
50
25
0
Perc12
8
4
$
PERSONAL INCOME
-
^^i i i 1 i i i
_ TAXES.!/
Federal
\
~ Sfafe and Local —
\I I I 1 i l l
DISPOSABLE INCOME
y
i i i i i i i
CONSUMPTION EXPENDITURES
i i ] 1 i i i
SAVING
i i i I i i i
ent
SAVING RATE -£/
i i i 1 i i i1963 1964
-^•'Personal tax and nontax payments.
— ' Sav ng as a percent of disposable
personal income.
U.S. Department of Commerce. Office of Business Economics 64-8-4
SURVEY OF CURRENT BUSINESS
rate. The steady rise in State and localexpenditures continued. Highway con-struction outlays were little changedbut increases in other State and localconstruction expenditures and in pay-rolls brought about a gain of $1%billion, or 2% percent.
Federal Government outlays, for thefirst time in over a year, were up sub-stantially due to a large rise in nationaldefense expenditures. Expanded De-partment of Defense outlays in Juneaccounted for most of the recentincreases; spending by the NationalAeronautics and Space Administrationwas also up. Nondefense purchaseswere somewhat lower, reflecting mainlydampened price support activity by theCommodity Credit Corporation.
National defense purchases of goodsand services have followed a ratheruneven course this year, and the largesecond quarter rise in Defense Depart-ment purchases does not appear tosignal a reversal of the longer trend inthese outlays. Defense spending in thefirst half of 1964 was virtually the sameas in the second half of 1963, which inturn was only fractionally higher thanthe rate in the first half of that year.
Gains reflected in national income
The continuing business advance wasreflected in an $8% billion secondquarter gain in national income to$506/2 billion. Most of the gain was incompensation of employees, which rose$6 billion as a result of increasedemployment and wage rates. Theemployment rise was strong enough toreduce the unemployment rate in thesecond quarter to about 5/4 percent—the lowest quarterly average in thecurrent business expansion.
Corporate profits, including the in-ventory valuation adjustment, rosesomewhat to reach $57/2 billion accord-ing to preliminary estimates. Themoderate second quarter gain followeda sharp $8/2 billion first quarter rise.Profit margins—as measured by theshare of profits in corporate grossproduct—have continued to be veryfavorable so far in 1964, with bothquarters exceeding the already highfourth quarter 1963 rate.
August
CORPORATE PROFITS, TAXES,DIVIDENDS, AND INTERNAL FUNDS
Billion $65
60
55
50
45
30
25
20
35
30
25
20
15
10
40
50
BEFORE TAX PROFITS^
CORPORATE T A X E S
AFTER TAX PROFITS
UNDISTRIBUTED PROFITS
35 -
30 L
CAPITAL CONSUMPTIONALLOWANCES
45 -
40
35
INTERNAL FUNDS
J_1963 1964
Quarterly, Seasonally Adjusted, at Annual Rate
—'Excludes inventory valuat ion adjustment.
—/Undistributed prof i ts and cap i ta ! consumption
allowances.
U.S. Department of Commerce. Of f ice of Busm
Digitized for FRASER http://fraser.stlouisfed.org/ Federal Reserve Bank of St. Louis

liMi-4 SURVEY OF CURRENT BUSINESS
The Tax CutThe direct income effects of the 1964
Federal tax reduction are shown in theaccompanying two charts on personaland corporate income. In addition toraising disposable personal income andafter-tax profits of the business sector,the tax law revisions also, of course,affected the Federal fiscal position.
Personal income and taxes
Since the tax cut became effective onMarch 5, its direct effects on disposablepersonal income can be traced mostclearly by examining changes from thefourth quarter of 1963 to the secondquarter of 1964. Over this periodpersonal income rose by $13% billion,an advance not much different from therise in the second half of 1963, Dis-posable income had advanced by anaverage of $6 billion per quarter in thesecond half of last year, and—in theabsence of the tax law changes—theincrease in disposable income wouldhave continued at roughly this rate inthe opening two quarters of this year,given the actual increase in personalincome.
In fact, spendable income was upmuch more sharply: by more than $8 bil-lion in the first quarter and by $12billion in the second quarter, or morethan $20 billion at an annual rate forthe 6-month period. It is estimatedthat the tax reduction directly increasedspendable income by roughly $9 billion(annual rate) in the first half. The 2%percent advance in disposable income,in the spring quarter, it may be noted,was the sharpest in the current expan-sion and the second largest quarterlyadvance since the end of the Korean War.
Due to a number of offsets the actualdecline in total personal taxes (includ-ing State and local) over the half yearwas only $6/4 billion rather than ap-proximately $9 billion. As economicactivity and income continued to rise,State and local taxes increased by one-half of a billion dollars. The impact ofrising incomes also tended to limit thedecline in Federal personal taxes, whichfell $7^ billion over the half year. Thedecrease in withheld income taxes wassomewhat larger than this but otherFederal taxes (especially payments un-der the quarterly declarations system)continued to rise.
Personal spending and saving
The tax cut has stimulated consurnp-tion expenditures this year although itis difficult to make a precise estimate of
the size of this increase. It is alsoevident that so far a good part of thetax cut has been saved.
As pointed out above, personal con-
Table 1. — Gross National Product in Current and Constant Dollars (1-3, 1-5)
Gross national product
Personal consumption expendi-tures
Durable goodsNondurable good'sServices
Gross private domestic invest-ment
New construction
Residential n on farmOther . ..
Producers' dura ) - le equipment.
Change in business! nventories _
NonfarmFarm
Nat exports of goods and services, _
ExportsImports
Government purchases of goodsand services
Federal
National defenseOtherLess: Government sales
State and local
1961 1962 1963
1963
II III IV
1964
I II
Seasonally adjusted at ;annual rates
1961 1962 1963
1963
II III IV
1964
I II
Seasonally adjusted atannual rates
Billions of current dollars • Billions of 19.54 dollars
518. 7
337. 3
43.7155 4138.3
G8 8
41.0
'n i19.8
25.9
1.9
1. 53
4.6
27.623.0
108.0
57. 4
49.08.9.6
50.6
556.2
356.8
48.4169 0146.4
79.1
44.2
23 620.6
29. 0
5.9
5.3.6
4.0
29. 225. 2
116.3
62.9
53. 610.2
.9
53.5
583.9
375.0
52. 1167.5155. 3
82.0
46.6
25 '>21.3
31.0
4.4
3.9
4.4
30.726.3
122.6
64.7
55.210.3
.8
57.9
577.4
372. 0
51.5166. 6153. 9
80.2
45.9
25. 120.8
30.7
3.6
3.2. 5
4.3
30.526.3
120.9
64.3
55.29.9.9
56.7
587.2
377.4
52.2168. 6156. 6
82.8
47.2
25. 421. 9
31.4
4.2
3.7.5
4.2
31.026.8
122.8
64.4
55.59.5.6
58.4
599.0
381. 3
53.6168. 9158. 8
87.1
48.3
26. 222.1
32.4
6.4
6.0.4
5.8
32.626.9
124.8
64.9
55.310.5
.9
59.9
608.8
390.0
55.9172.9161.1
85.9
49.2
26.922.3
34.2
2.5
2.2.3
7.7
34.526.8
125.2
64.3
54.011.51.2
60.9
618.6
396. 1
57.0175. 3163.8
87.2
48.9
26.222.7
34.6
3.7
3.4.3
5.7
33.727.9
129.6
67.1
57.011.0
.9
62.5
447.9
303.8
41.4143.5118. 9
57.4
34.3
18.216.1
21.4
1.7
1.5.2
2.5
25.823.3
84.3
44.8
39.4
476.4
318.5
45.7148.3124. 5
65.9
36.7
20. 116. 5
24.0
5.2
4.8.4
2.2
27. 525.3
89.8
49.4
40.3
492.6
330.6
49.3151. 6129. 7
67.7
37.9
21.216.7
25.6
4.1
3.6.5
2.2
29.126. 8
92.1
49.7
42.4
487.9
328.6
48.6151. 1128. 9
66.2
37.5
21.216.4
25.4
3.3
2.7.5
2.1
28.926.8
91.0
49.4
41.7
494.8
332.4
49.4152. 5130.6
68.1
38.2
21.217.0
25.9
4.0
3.4.6
2.0
29.427.4
92.3
49.6
42.7
502.0
334.4
50. 8152. 1131. 6
71.7
39.0
21.817. 2
26. 8
5.9
5.5.4
3.5
30.927.4
92.4
48. 9
43.4
508. 0
340. 9
53.1155. 2132. 6
70.1
39.6
22 317.3
28.1
2. 4
2.1.3
5.4
32.727.3
91.6
47.8
43.8
513.5
345.0
54. 0157. 4133.7
70.8
39.2
21.617.5
28.3
3.3
3.0.3
3.4
31.928. 5
94.3
49.8
44.5
Table 2.—National Income by Type of Income (1-8, 1-9)[Billions of dollars]
National income.
Compensation of employeesWages and salaries
PrivateMilitaryGovernment civilian
Supplements t o wages and salariesEmployer contributions for social insuranceOther labor income _ _
Employer contributions to private pensionand welfare funds
Other
Proprietors' incomeBusiness and professional
Income of unincorporated enterprisesInventory valuation adjustment
Farm
Rentalincome of persons
Corporate profits and inventory valuation adji stment _ _ _Profits before tax
Profits tax liabilityProfits after tax
DividendsUndistributed profits
Inventory valuation adjustment
Net interest
1961
426.9
302.2278 8997 o10.241.623.411.811. 6
9.22 4
48.235 335.3
0r> 912.2
44.144.222 321.915.26.7-.1
20.1
1962
455.6
323.1297. 1241.610.844.725.913.612.3
9.72.6
49.836.636. 6
013.2
12.2
48.448.223.225.016. 58.5.3
22.1
1963
478.5
340. 3312.1252.910.948.328.215.113.1
10.42 7
50.637.637. 6
013.0
12.3
50.851.324.626.718.08.7-.4
24.4
1963
II III IV
1964
I II
Seasonally adjusted at annual rates
474.6
338.1310.1251.610.747.827.915.013.0
50.137.3
12.8
12.3
50.251.124.526.617.78.9-.9
24.0
481.9
342.7314.3255. 010.748.728.415.213.2
50.737.8
12.9
12.4
51.451.324.526.717.98.9
2
24.7
490.0
347.7318.8257.6
11.749.628.815.413.4
51.538.3
13.2
12.4
53.154.326.028.319.19.2
-1.2
25.4
498.4
352.5323. 2260. 811.750. 729.415.713.7
51.238.6
12.6
12.4
56.456. 625. 431.219.411.8-.2
25.9
1506.6
358.6328.265.11.51.29. 915.914.0
51.739.1
12.6
12.4
J57.457.425. 831.719.811. 9—.1
26.5
1. Second-quarter national income total and the corporate profits share are based on preliminary estimates and are subject,to revision in next month's S U R V E Y .Digitized for FRASER
http://fraser.stlouisfed.org/ Federal Reserve Bank of St. Louis

6 SURVEY OF CURRENT BUSINESS August 1964
sumption expenditures increased bynearly $15 billion from the close of 1963to the spring of 1964. In the sameperiod, personal saving rose $5% billionand the saving rate (personal savingas a percent of disposable income) rosefrom a little over 7 percent to a littleover 8 percent. The second quarterrate is near the upper end of the com-paratively narrow range of 6 to 8)2 per-
cent in which the personal saving ratehas fluctuated since the end of theKorean War. In the past increases indisposable income about as large as the2% percent gain of the second quarter1964 have typically been associatedwitli large increases in the saving rate.However, the length of time it hastaken for the rate to return to a moretypical figure has varied.
Table 3.—Personal Income and Its Use (H-2)
[Billions of dollars]
Personal income
Wage and salary disbursementsCommodity-producing industries
Manufacturing onlyDistributive industriesService industries . . _ . _ _Government-
Other labor income
Proprietors' incomeBusiness and professionalFarm
Rental income of persons
DividendsPersonal interest in come
Transfer paymentsOld-age and survivor s insurance benefitsState unemployment insurance benefitsVeterans' benefitsOther
Less: Personal contributions for social insurance. _
Less. Personal tax and nontax paymentsFederalState and local
Equals: Disposable personal income
Less: Personal consumption expendituresEquals: Personal saving
Addendum- Disposable personal income in constant(1954) dollars
1961
417.6
278.8110.887. 572. 943.451.8
11.6
48.235.312.9
12 2
15.227.5
33.612.64.04.8
12 2
9.6
52.945.17.8
364. 7
337.327. 3
328.2
1962
442.4
297.1118.594. 27 6 . 646.455. 6
12. 3
49.836. 613.2
12.2
16.530. 0
J 4.714.32.94.8
12.7
10.3
57.949.18.8
384.6
356.827.8
343.4
1963
464.1
312.1123.398.080.349.359.2
13. 1
50.637.613.0
12.3
18.032. 9
36. 715.22.85.0
13.7
11.8
61.651.99.6
402. 5
375.027.5
354.9
II
1963
III
Seasonally a(
460. 2
310. 1122.997. 779.749.058.5
13.0
50.137.312.8
12.3
17.732.4
36. 315.3
2. 65.0
13.3
11.7
61.151. 59. 6
399. 1
372.027. 1
352.6
466.3
i 314.3124. 198.581. 049.959.4
13.2
50. 737.812.9
12.4
17.933. 4
36. 515. 42.65.0
13.4
11.9
61.952.2
9. 7404. 4
377. 42 < . 0
356. 3
; 1964. .
IV I II
justed at annual rates
474.5
318.8125.599.981. 950. 261. 3
13.4
51.538.313.2
12.4
19.134.2
37.215.43. 05. 1
13. 6
12.1
63. 353. 49.9
411.2
381.329.9
360.7
480.9
323. 21 26. 7100.682. 751.362. 4
13.7
51.238.612.6
12.4
19.435. 0
38.315.62.85. 2
14. 8
12. 3
61.451.210.2
419. 5
390. 029.5
366.7
487.9
328. 7128.9102.484. 152.463.4
14. 0
51.739. 112.6
12.4
19.835.7
38.016. 12.55.3
14.2
12. 5
56.646.110.5
431.3
396. 135.2
375.7
Table 4.—Gross National Product by Major Type of Product in Current and ConstantDollars (1-6, 1-7)
Gross natio nal product
Final salesInventory change.
518. 7 556. 2 583. 9J577. 4J587. 2 599. 0 608. 8 618. 6 447. 9|476. 4 492. 6 487. 9 494. 8 502. 0;508. OJ513. 5
583. OJ592. 61606. 4;614.9 446.
Goods outputFinal salesInventory change
Durable goods output-Final salesInventory change
Nondurable goods outputFinal salesInventory change..
Services
Construction
Addendum: Auto product.
III
Seasonally adjusted atannual rates
Billions of current dollars
79.,516. 8 550. 31.9
259.8279.5290.257.9 273. 61285.
1.9 5.9 4,
2290.1 289,8:286. 5,285,4| 3 .6l 4.
81296. 71300. 7308,7 290. 3! 298. 2 304.2\ 6.4! 2.5! 3.
94.41105.3 110.41113. 7 108.1J113.494 5J102. 3!l08. 2111. 0 106. o]110. 4- . l j 3.0J 2 .2J 2.7 1.5| 3.0
165. 4 174. 2J179. 8J176. 4J181. 81183. 3185.'171.3 177. 61175. 5|179.
.9! 2.
1961 1962 | 1963
II I III I IV I I II
Seasonally adjusted atannual rates
Billions of 1954 dollars
0 233.3232.
?47i;61250.3 258.OJ245.7i 5.
82.0| 82.5 -.
163. 42.0
. O[ lOO. O l LOO. I IfM). U
i . l 1179. 9 183.9 185.4!. 7 3.4 1.8| 1.2
200. 8! 214. 71228.4 223. 5 231.2
6:151.41149.
1.
234.5239.61241.7
58.1
17.7
62.0J 65.2! 63.7 66.2 67 J 68.6! 68.9
21.91 24.4| 24.2 24.3 25.6 25 .8126.4 14.
l j 91.11 89.:1 j 2. I
61158.81155.7! 2.
4|174.
9 j 51.
8J 18.
488. 5 484. 6 490. 9:496. 1|505. 6 510. 24.1| 3.3 4 .0 | 5.9! 2 .4 3.3
96,94.
1.
6J161.9:159.6' 2.
8:181.
3; 53.
3' 20.
1 257. 7 257.8! 263.2! 266. 2(271. 80!254. 41253. 8J257. 3!263. 8 268. 5H 3.3; 4.0 5.9! 2.4 3.3
I i i I3! 98.7! 94.3! 99.01100.4 105. 44 j 96. 4 j 93. 0! 96.4! 99.8 103.39! 2.3| 1. 2l 2.6! .6 2. 1
! | i I8H59. 0 163. 61164. 21165. 8 166. 461158. 0 160. 8J160. 9J164. Ojl65. 23i 1.0 2.7! 3 .3 j 1.8| 1.2
4|l78.1J183. 5i 184. 2J186. 8! 186. 7
0! 52.11 53. 5| 54.6! 55. o| 55.0
4 20. l| 20.4 21. 6J 21.7 22.0
Corporate income and taxes
In contrast to the personal incometax cut, the entire direct effects of thecorporate tax reduction were reflectedin first quarter after-tax profits. Thedecline in the tax rate, coupled witha continued gain in corporate before-taxprofits, led to a very sharp increase inafter-tax earnings.
In the first quarter, the $2% billionrise in profits before taxes (excludingthe inventory valuation adjustment) atthe old tax rates would have yieldeda rise in after-tax profits of about $1%billion. The actual rise was nearly $3billion, so that roughly $1% billion istraceable to the new tax law. After-taxprofits advanced slightly in the secondquarter, reflecting a rise in before-taxprofits of about three-quarters of abillion dollars.
Federal corporate tax accruals ac-tually declined by only one-half of abillion dollars from fourth quarter tofirst, as the jump in profits before taxesnearly offset the effects of the taxreduction (see chart).
Dividends have continued to rise ata moderate pace this year so that mostof the increase in after-tax income hasgone into retained earnings. The latterhave risen by $2% billion in the past 6months. The increase in corporateinternal funds—retained earnings pluscapital consumption allowances—hasbeen $3% billion, or nearly one-tenth,since the fourth quarter.
The Federal Budget
Reflecting the initial full quartereffects of reduced receipts due to thetax cut and the increase in defense ex-penditures, the Federal deficit on in-come and product account was $9billion at a seasonally adjusted annualrate in the second quarter. This wasa sharp change from the small deficitincurred in the first quarter, which wasmainly the result of the drop in taxes,stemming from the new tax law. In1963, witli revenues rising in line witlieconomic activity and with total Fed-eral outlays changing little during theyear, there was a steady decline in thedeficit, from an annual rate of nearly$5 billion in the opening quarter of theyear to an approximate balance in theclosing quarter.Digitized for FRASER
http://fraser.stlouisfed.org/ Federal Reserve Bank of St. Louis

Alljjnst l!Mi4 SURVEY OF CURRENT BUSINESS
Table 5.—Relation of Gross National Product, National Incomeand Personal Income (1-17, 1-18)
Table 7.—Personal Consumption Expenditures by Major Type (II-6)
[Billions of dollars][minoris 01 dollars] • — • — —
Gross national product
Less: Capital consumption allowances .
Equals: Net national product
Less: Indirect business tax and nontaxliability
Business transfer paymentsStatistical discrepancy
Plus: Subsidies less current surplus of
Less: Corporate profits and inventoryvaluation adjustment
Contributions for social insur-ance
Excess of wage accruals over dis-bursements
Plus: Government transfer payments
Net interest paid by govern-
Dividends -Business transfer payments
Equals: Personal income
1961
518.7
44.5
474.1
49 02.4'} (j
1.6
426.9
44. 1
21 4
0
31.3
7.415. 22.4
417.6
1962
556. 2
48. 7
507.5
52.82.41 8
1.6
455. 6
4S. 4
23 9
0
32.3
8.016.52.4
442.4
1963
583. 9
50.8
533. 1
55. 92 , 49 7
1.0
478. 5
50.8
26 9
0
34.3
8.618.02.4
464.1
II
1963
III IV
19
I
64
II
Seasonally adjusted at annualrates
577. 4
50. 5
526.9
55.32.4
-4.3
1. 1
474, 6
50. 2
26 7
0
33.8
8.417.72.4
460.2
587.2
51.2
536.0
56. 12.4
-3.5
. 9
481. 9
51.4
27 1
0
34.0
8.717.92.4
466. 3
599. 0
51.7
547. 3
57. 32.4
— 1.8
. 7
490.0
53.1
27 5
0
34.7
8.819.12.4
474. 5
608.8
52.5
556. 3
57.92.5
-1. (
1.0
498.4
56.4
28.0
0
35. 9
9.119.42.5
480.9
Goods and services, total _
Durable goods, total
Automobiles and parts565 5
Furniture and household equip-ment
2 5 Other
Nondurable goods, total
Food and beverages
i KQ£ {• Clothing and shoes _ _ . - _ --
Gasoline and oil
' 5 7 ' 4 Other28 4
Services, total0 Housing
35 - Household operation
q g Transportation . _ _ _ _19-8 Other
1901
337. 3
43.7
17.1
19. 3
7.3
155.4
81. 3
28. 7
11.9
33.6
138. 3
44.2
20.4
10.7
63.0
1962
356. 8
48.4
20.6
20. 2
7.6
162.0
84.6
29.9
12.3
35.2
146.4
46.5
21.6
11.3
67.0
1963
375. 0
52.1
22.7
21.4
8.0
167.5
87.1
30. 7
12.8
36.9
155.3
48.9
22.7
11.7
72.0
1963 ! 1964
II III IV 1 II
Seasonally adjusted at annualrates
372.0
51.5
22.6
21.0
7.9
166.6
86.9
30.1
12.8
36.8
153. 9
48.6
22.4
11.7
71.3
377.4
52.2
22.6
21.6
8.0
168.6
87.3
31.3
12.9
37.1
156.6
49.2
22.9
11.7
72.7
381.3
53.6
23.2
22.3
8.2
168.9
87.8
30. 9
13.0
37.3
158.8
49.8
23.0
11.8
74.1
390.0
55.9
24.3
23.1
8.5
172.9
89.7
32.1
13.3
37.8
161.1
50. 5
23.5
92.0
75.1
396.1
57.0
24. 1
24.2
8.8
175.3
90.6
33.2
13.5
38.0
163.8
51.1
24.0
12.2
76.4
487. 9Table 8. — Foreign Transactions in the National Income Account
(IV-2)[Billions of dollars]
Table 6.—Government Receipts and Expenditures(111-3,111-4)
[Billions of dollars]
Federal Government receiptsPersonal tax and nontax receipts. _Corporate profits tax accuralsIndirect business tax and nontax
accrualsContributions for social insurance _
Federal Government expendituresPurchases of goods and services
Transfer pay meritsTo personsForeign (net).. _ .__
Grants-in-aid to State and localgovernments .
Net interest paid
Subsidies less current surplus ofof governments nterprises
Surplus or deficit (— ) on income andproduct account
State ardl ocal government receipts
Personal tax and nontax receipts. _Corporate profits tax accrualsIndirect business tax and nontax
accuralsContributions for social insurance-Federal grants-in-aid
State and local government expendi-tures
Purchases of goods and servicesTransfer payments to personsNet interest paidLess: Current surplus of govern-
ment enter or ises
Surplus or deficit (— ) on income andproduct account
1961
98.345. 120.9
14.118.2
102.657.4
27.425.81. 6
7.2
6. 7
3.9
-4.3
54.5
7.81.3
34.93.2
54.450.65.4.8
2.4
. 1
1962
106.449. 121.8
15. 120.5
110.462. 9
28. ?26.71. 6
8.0
7. 1
4. 2
-4.1
59. 5
8. 81.4
37.83.58.0
57.353. 55.6.8
2.6
2.1
1963
113.651.923.0
15. 623.0
115.264. 7
29.928.3
1.6
9. 1
3.8
-1.5
64.4
9.61.5
40. 23.99. 1
62.057. 96.0.8
2.8
2.4
II
1963
III IV
19
I
64
II
Seasonally adjusted at annualrates Exports of goods and services
112.951.523.0
15.522.9
113. 964.3
29.527.9
1. 6
7. 5
3.9
-1.0
63. 4
9. 61.5
39. 73.88. 7
60.856. 76. 0.8
2.61
114.252. 223.0
15.723. 2
114.964. 4
29. 628.0
1. 6
9.4
7.8
3. 7
— . 7
64. 9
9. 71. 5
40. 43.99. 4
62.458. 46.0.8
2.8
2.4
117.253. 424.4
15.923.5
116.664.9
30.328. 6
1.7
9.9
3.5
.6
66.7
9.91.6
41.34. 09. 9
64.059. 96. 1.8
2.8
2.7
114.851.223.9
15.923.9
117.264.3
31. 129.5
1.6
9.8
8. 3
3.7
-2.4
67.8
10.21. 6
42.14.19 8
65. 360.96.3.9
2. 8
2.4
*P ^ Imports of goods and servicesi 04 9 ^TC^ transfer payments by government _
~ Net foreign investment16 1
27.6
27.6
27.6
23. 01.63.0
29.2
29.2
29.2
25. 21.62.4
30.7
30.7
30.7
26. 31.62.8
Seasonally adjusted at annualrates
30.5
30.5
30.5
26.31.62.6
31. 0
31.0
31.0
26.81.62.6
32.6
32.6
32.6
26.91.74.1
34.5
34.5
34.5
26.81.56.2
33.7
33.7
33.7
27.91.64.1
24.2Table 9.— Sources and Uses of Gross Saving (V-2)
120.2g7* i [Billions of dollars]
30.729.1
1. 6
10. 4
8.4
3.6Gross private saving
1 —9.2 Personal savingUndistributed corporate profits
1 69. 2 C orporate inventory valuation ad-justment
10.5 Capital consumption allowances. _1 1. 6 Excess of wage accruals over dis-
bursements-42. 64.2 Government surplus on income and
10.4 product transactions
Federal66. 9 State and local62. 56. 4 Gross investment.9
Gross private domestic invest-2. 9 ment
Net foreign investment1 2. '} Statistical discrepancy
1961 1962
78.5
27. 36.7
— l44.5
0
-4.2
— 4 3.1
71.8
68.83.0
-2.6
85.3
27.88.5
348.7
0
-1.9
—4. 12. 1
81.5
79. 12.4
-1.8
1963
86.7
27. 58. 7
A
50.8
0
.9
— 1 52.4
84.8
82.02. 8
2 7
II
1963
III IV
19
1
64
II
Seasonally adjusted at annualrates
85.6
27. 18.9
Q
87.2
27. 08. 9
50. 5 i 51. 2
0 0
1.6 1.7
] 0 i 7
82.9
80. 22.6
-4.3
2.4
85.4
82.82.6
-3.5
89.6
29.99.2
— 1 251.7
0
3.3
91.1
87.14. 1
-1.8
93.7
29.511.8
-.252. 5
0
0
— 2 42.4
92.1
85.96.2
-1.6
35. 21 11.9
-. 153.1
0
1-6.9
-9.2
91.3
4.'l
!-1.9
1. See footnote table 2. 1. See footnote table 2.Digitized for FRASER http://fraser.stlouisfed.org/ Federal Reserve Bank of St. Louis

Bv SAMUEL PIZER and FREDERICK CUTLER
Foreign Investments in 1963-64E increases in U.S. private
foreign investments have been a majorfeature of the U.S. balance of paymentsin 1963 and the first half of 1964. Arecord amount of $6.3 billion was addedto these holdings in 1963, raising theaccumulated total to over $66 billion.The increase reflected peak capital out-flows of $4.3 billion, reinvested earningsof over $1.5 billion, and $0.5 billion inimproved market values of securities
PRIVATE CAPITAL OUTFLOW AT RECORDRATE IN EARLY 1964
Short-Term Flow Moves Up SharplyPortfolio Investments Drop Under Impact of
Securities TaxDirect Investments Show Further Moderate
Increases
Billion $
2 -
1 -
1950 52 54 56 58 60 62 64
/Es t ima ted f i r s t ha l f 1964 a t s e a s o n a l l y a d j u s t e dannuaI rate.
Por t fo l io i nves tmen ts compr i se net pu rchases offoreign secur i t ies and loans w i th a matur i t y ofmore than one year .
(table 1). Each major category of in-vestments, direct, portfolio and short-term, scored greater gains than in 1962.
Though data for the first half of 1964are still incomplete, capital outflowappeared to be over a $5 billion annualrate, with short-term lending more thandouble the 1963 amount, direct invest-ments not significantly changed, andportfolio investments slowed down sub-stantially as the effects of the proposedinterest equalization tax (IET) andother market factors were felt. First
half outflows included some unusualfactors, such as very large flows toJapan, a carryover of new foreignsecurity issues negotiated prior to theannouncement of the IET, and in-creased financing related to a rise inexports. If these influences diminishand are not replaced by others, such asa considerable relative increase in capi-tal costs abroad, the first half rate ofoutflow may not be fully sustained inthe remainder of the year.
Portfolio and Short-TermInvestments
In the past year and a half U.S.transactions in foreign securities haveundergone very wide swings. Sales ofnew issues of foreign securities reacheda peak of $1 billion in the first half of1963 (table 5), and then declined toabout $300 million in the second half.The July 1963 announcement of a pro-posed tax on U.S. purchases of mosttypes of foreign securities brought ne-gotiations for new flotations nearly toa halt. Of approximately $670 millionsold to U.S. investors in the period July1963-June 1964, only about $120 mil-lion were of a type subject to the tax,and about half of these were issues ne-gotiated prior to the tax proposal.Canadian sales were largely of issuespreviously arranged for; European is-sues were almost entirely stopped, aswere those of other developed countries.
As the U.S. market for foreign issuescontracted there was a compensatingopening up of European capital marketsto foreign issues. These markets hadabsorbed an average of under $0.5billion of foreign issues annually in1961-63, without exhibiting consistentgrowth. In the first half of 1964 aloneroughly $0.6 billion of foreign issueswere sold in Europe. These weremainly European issues, but includedabout $0.2 billion of Japanese issues.
Some of the sales in Europe werepresumably to foreign investors whohad previously purchased parts of newissues offered in the United States, and
to this extent the shift to Europe asthe locus for new offerings did notchange the actual source of funds. In1962 and 1963 these purchases in theUnited States by nonresidents, prob-ably Europeans for the most part,averaged about $175 million a year(table 5). Whether the European mar-ket will absorb as large a volume ofissues in the period ahead is not clear.Most of the increase has been in theUnited Kingdom, Germany, and Lux-embourg; the Netherlands market hasbeen closed (after being sizable in 1961),the Swiss market has not shared in therecent development, and the Frenchmarket has been very limited. Al-though issues offered in the individualcountries are not necessarily purchasedby residents--Luxembourg being theprime example—each country tends toregulate access depending on the localmonetary situation, and, in general,European countries are currently tight-ening their credit policies.
In addition to lowered purchases ofnew foreign issues, U.S. investors havealso swung over to a net liquidation oftheir holdings of foreign stocks sincemid-1963. In the 12 months throughJune 1963, Americans sold $687 millionof foreign stocks and bought $699million; in the following year thev sold$732 million while buying only $494million. The shift led to a net inflowof about $250 million in capital betweenthe 2 years. The proposed tax con-tributed to the sharp drop in purchases,but domestic investments have alsobecome more attractive; since mid-1962stock markets in the United Stateshave shown considerably stronger andmore consistent gains than thoseabroad.
Bank loans expanded
While the capital outflow throughpurchases of foreign securities was di-minishing, there was an offsetting up-surge in term loans by banks. Theamount outstanding on these loanswith a maturity of over 1 year hadincreased at an annual rate of aboutDigitized for FRASER
http://fraser.stlouisfed.org/ Federal Reserve Bank of St. Louis

11HJ4 SURVEY OF CURRKXT BUSINESS 9
$200 million in 1960-62. The increaserose sharply to $150 million in thefirst half of 1963 and $416 million inthe second (after eliminating for theyear about $280 million of increasesrelated to changes in coverage andother factors). Outflows oi this typeremained high at about $310 millionin the first half of 1964, then appearedto taper off after March.
Nearly $0.5 billion of these bankloans in 1963 went to Western Europe,largely in the fourth quarter, a muchlarger amount than in any earlierperiod. While the loans were spreadover many countries, Italy alone re-ceived about $130 million. Sizablelending to Europe continued into 1964.Japan also received large term loansin 1963 and in 1964.
Short-term lending arid holdings ofcommercial paper reported by U.S.banks also expanded much more rapidlyin 1963 than in 1962, though the $740million outflow was still well below theamounts in 1960-61. Principal bor-rowers in 1963 were Japan, the Philip-pines, a few Latin American countries,and Canada. Most of this lendingrepresents commercial credits which,because they tend to be renewed andexpanded over time, are not muchdifferent in their economic effect fromloans with longer original maturities.
A much faster expansion of thesecredits, amounting to over $950 million,took place in the first half of 1964.Japan remained the principal borrower,the flow to Canada increased, and theUnited Kingdom also received someshort-term funds.
On balance, iionfinancial concerns re-duced their holdings of liquid assetsoutside the United States in 1963,especially of assets recorded in Canada.This year there are indications thattransfers of funds into liquid foreignassets by such firms may again be asignificant factor in the balance of pay-ments, though the data covering thiskind of capital movement are probablyrelatively incomplete. Given the risingvolume of cash available for liquid in-vestment by nonfinancial concerns,changes in relative yields of comparabledomestic and foreign assets may wellresult in substantial shifts of fundsamong countries.
738-650 °—64 2
Direct Investments Abroad
U.S. business stepped up the pace offoreign expansion in 1963, and by allavailable indications will continue tomaintain a vigorous growth rate abroadfor some time ahead. Total additionsto the foreign investments of the parentcompanies amounted to $3.4 billion in1963, second only to the 1957 peak whenpetroleum investments were extraordi-narily high. The additions came fromnet capital outflows of $1.9 billion andreinvested earnings of nearly $1.6 bil-lion, compared with 1962 equivalents of$1.7 billion and $1.2 billion. With thelatest additions, the total book value ofthe direct investments was nearly $41billion at the beginning of 1964.
While the heightened rate of parentcompany investment is related pri-marily to further expansions of pro-ductive facilities and working capitalneeds abroad, perhaps $100-$200 mil-lion of the earnings retained abroad in1963 were withheld until reduced U.S.corporate profit tax rates became effec-tive in 1964. Thus, there were un-usually high dividend distributionsearly in 1964.
Concentration in developed countries
About three-quarters of the growth ofdirect foreign investments in 1963 wasin developed countries, continuing atrend evident for some time, as shown inthe profile chart. Investments inEurope, which had been growing at arate of about $1.1 billion a year in 1961and 1962, were increased by $1.5 billionin 1963.
Manufacturing investments inEurope rose by over $650 million lastyear, but capital flows were lower thanin the previous year in spite of nearly$100 million included for the purchase ofstock in a French company, while un-distributed profits were considerablyhigher. As noted above, the latter mayin part represent only temporarilydelayed dividend payments. Capitalflows were down sharply for France(except for the single large transaction),Germany, and the United Kingdom,but for the United Kingdom this wasmore than matched by a jump in un-distributed profits. It now appearsthat capital requirements for new facili-ties and acquisitions of interests in
existing enterprises will continue high,but less financing from the UnitedStates may be needed.1
The petroleum industry also investedin Europe at an accelerated rate in 1963,especially in Germany and Italy. Thisstep up was related to the expansion ofEuropean refining capacity of U.S.companies by about 20 percent in 1963.While this activity may have slackenedsomewhat in 1964, the exploration anddevelopment of reserves in the NorthSea will probably call forth largeadditional investments.
In Canada, over $850 million wasadded to U.S. direct investmentssubstantially more than in 1961 and1962 and moving toward the peak ratesof 1956-60. Faster growth was evidentfor both manufacturing and petroleum.
1 A report on sources and uses of funds of foreign affiliates isbeing prepared for the October SURVEY of C U R R E N TBUSINESS.
Table 1.—Factors Affecting the U.S. PrivateInvestment Position, 1962 and 1963
(Millions of dollars)
Type of investment 1963
U.S. private investment s abroadTotal, beginning of yearAdd: Capital outflow '
Reinvested earnings . .Price changes and other ad-
justinents__ -Total, end of vear
Direct investmentsValue, beginning of yearAdd: Capital outflow '
Reinvested earningsOther adjustments -'
Value end of vear
Other long-term private invest-ments abroad
Value, beginning of vearAdd: Capital outflow i
Price changesOther adjustments3
Value, end of year
Short-term assets and claimsValue, beginning of yearAdd' Capital outflow '
Enlarged coverage of re-ports _ .
Value, end of vear
Foreign long-term investments in theUnited States
Direct investmentsValue, beginning of vearAdd' Capital inflow '
Reinvested earningsOther adjustment^4
Value, end of vear
Other long-term investmentsValue, beginning of yearAdd: Capital inflow > .. .
Price changesOther adjustments
Value, end of vear
55, 5813, 4341, 198
— 18860 025
34,6 71,6541, 198— 293
37 22,i
14,3891,227— 114
15,506
6, 525553
2157,293
7,392132214
-1257,612
14, 052141
— 1 511— 78
12,604
60, 025r 4. 301
1,565
47566 366
37, 226T 1 , 888
1 , 565—34
40 645
15, 506' 1,679
453— 27
17,611
7, 293T 734
838,110
7,612T — 5
236101
7.944
12, 604r 3041,902
4014, 850
T Revised.1. Included in the balance of payments accounts; revised
series will be in SURVEY OF CURRENT BUSINESS for September1964.
2. For details see note to table 2.3. In 1962 includes ^classifications (+$41 million) and
foreign exchange depreciation ($85 million); in 1963 includesmainly reclassifications.
4. Mainly revaluations of portfolios of foreign controlledinsurance companies.
Digitized for FRASER http://fraser.stlouisfed.org/ Federal Reserve Bank of St. Louis

10 SURVEY OF CURRENT BUSINESS August 11MJ4
Table 2,—-Value of Direct Investments Abroad l bv
Table 3.—Direct-Investment Capital Flow and Undistributed Subsidiary
Table 1.—Direct-Investment Earnings and Income,2
Line
1
2
3
4
5
89
10
11121314151017IS
19
20
21
^2
23242526
27
2<S29303132333435
36
37383V)
40
41
42
43
44454647
48
49
505152
53
Area and country
AH areas, total
Canada, total
Latin American Republics,total.
M e x i c o , C e n t r a lAmerica and WestIndies, total.
HondurasMexico -PanamaOther countries.
South America, total
ArgentinaBrazilChileColombia--PeruUruguayVenezuelaOther countries
Other Western Hemi-sphere
Europe, total-
Common Market, total
Belgium andLuxembourg
France . . _Germany-. . .Italy ..." _ . .Netherlands
Other Europe, total ...
I )onmarkNorway."•i pa inSwedenSwitzerland-.TurkeyUnited KingdomOther Countries-..
\frica, total
LiberiaLibya..Republic of South.
A frica . . . _ _ .Other countries...
Asia, total .
Middle East, total
Far East, total
India.. . . .. _Indonesia . .. _Japan- . _ . .. _.Phillippine Repub-
; lieOther countries,-.
Oceania, total
Australia.New ZealandOther countries
! International
1950
1, 788
3, 579
4, 445
1,488
10662
41558
847
2,957
35f>644540193
't?993
31
131
1. 733
637
692172046384
1, 096
322431582516
847f>3
287
16(**)
140
131
1,001
692
309
385819
149
45
256
2012530
356
1957
25,39}
8, 769
7, 434
2, 234
K M )108739201
1.080
5, 200
333835666396383
2, 46565
618
4, 151
1,680
192464581252191
2,471
425144
1096963
1,974119
664
7224
301
267
2,019
] 1138
881
113169185306
108
698
5834867
1,041
1961 r
U, 667
11,602
8, 236
1,809
I
,*95
830486269
6, 426
6601 , 006
73542543649
3, 007107
954
7,742
3, 104
262860
1,182491309
4, 638
959476
141388
983, 554
193
1,064
160177311
416
2,477
1,240
1,237
190147302410
158
1,108
9576387
1, 485
1962 '
M 22 o
12, 133
8,424
1,912
99867537283
6,511
7991,084
75545545352
2,81696
1. 050
8, 930
3, 722
2861,0301.476
554376
5, 208
11610690
174553108
3,824236
1,271
1X4265357
465
2,500
1,200
1, 300
193160373375
199
1,271
1,0978588
1,647
Table 2
Total
10, 645
13,016
H.«T
2,064
105907620310
6, 593
1, 128768465448
512, 807
98
1.218
10, 351
4.471
3511,2351, 772
668445
5. 880
133123153220(568112
4,216256
1,423
195304415
510
2,784
1,274
1, 510
205167475415
248
1,463
1, 2779889
1, 732
Min-ingand
s m e l t -ing
3,350 !
1, 54!)
1, 093
161
(*)1 16
19
932
( * )30
503(*)240
(*)(* )
210
55
11
10(*)(*,)
45
1(*)(*)
(**}(**)(*)
225
351
(*;(*)
67
191
31
1
31
(*)
(*)
(*)
70
70
""(**")""
963 P
Pe t ro -leum
13,698
3, 133
3, 094
284
Manu-fac-tur-ing
14, 890
5, 746
2, 103
547
(*) (*)
94 12(*) 24
2,810 | 1,556
(* )60
(*)246
56(*)
2, 16645
533
2. 828
1. 330
63261496309201
1, 498
88
401363089
939109
701
(*)(*)(*)
1,925
1,207
718i
( * )(*)(*)(*')
(*)
496
( * )(*)(*)
988
404063
271206420
2025
108
5, 610
2. 515
225759
1,1162HO154
3, 095
262~8236
13111
2, 73547
176
(*)(*)
158
16
42G
33
387
19144110
37
728
69136
Publicutil i-ties i
2,051
4601
710
191
69 I23
2747
520
(*,)190
(*)2721
(*)3719
48
40
32
11032
16
8
(**)i ** )
3(** )(**)(**)
21
9
(*)(*)(**)
6
38
3
35
2(*+)
1
4
1
(*)(*)(*)
745
Trade
3,305 :
747
881
389
r,1
27415
491
38147
1552416
1858
82
1, 234
436
511581086456
797
16112141
2709
36961
81
(*)(*)
47
18
200
10
191
i 222
5364
50
81
23, (**)
Other
3,351
1, 390
776
492
2180
104195201
2S4
33638
223192724
21817
238
585
147
1137483318
438
217
r>
2374
16913
105
195304142
170
21
149
1041462/6214
157
88
4593889
1962 r
1, 654
314
-32
9
-43
25-23
8
-41
96141321142
— 199-2
61
869
485
271242483551
384
22119
3fi119
8170
9
158
17858
48
92
7
99
8
54-12
118
10613
— 1
74
Table 3
Xet capita outflows
1963 P
j
Total
1,888
339
64
85
6253525
— 22
19-12
14-1— 6-1
-36(**)
156
893
579
30163209126
52
313
18
254393
2109
17
104
103712
45
205
62
143
56821
41
100
991
(**)
1 27
Min-ingand
smel t -ing
65
— 6
-5
(*)(*)-4
" " " 11 1 "
-1
(*)(*)-1
(*)
(*)(*)-1
30
7
(*)
"(*)" '
(*)(*)
(*)
(*)(*)
(*)1
(*)
31
(*)(*)
4
(*)
j-n-(*)
1
1
Petro-leum
810
186
-81
22
-2(*)-5
9(*)
-103
(*)-16(*)-14-14(*)—41(**)
77
356
254
53
1238142
103
143
10363
-238
(**)
62
(*)(*)(*)
(**)
153
58
95
(*)(*)(*)(*)
(*)
24
(*)(*)(*)
33
Manu-fac-tur-ing
716
101
107
49
(*)(*)
4225
57
34(**)-31317
-1-2
(**)
41
364
271
16129783513
93
33
111066
477
8
(*)(*)
6
(**)
37
(**)
37
318
15
10
59
61-2
Other
297
51
44
19
-360
2421
25
-154
19(**)-1
171
8
166
55
93189
-2
117
(**)(**)
4-384
22310
3
10376
41
15
5
10
4
60
31
15
383
(**)
— 6
Undistributefsidiary earn
1962
1,198
371
268
121
21
22905
147
32631110
11
291
40
292
81
-733422
12
211
-334
— 2953
9119
47
13
39
3
21
-2
23
^-91414
8
43
338o
115
1963
sub-ngs
p
| Min-i ing
Total andsmel t -
| ing
1,555
52S
173 i
79
2-11363
2 <
94
—357-2
81
-132
2
10
568
141
283'56359
427
864
1252
2786
46
(..,43
2
76
11
64
13316
8
83
7111
1
82
66
45
5
-1
(*)(*) |
(**)
6
(*)(*)
(**)(*)
(**)(*)(*)
(**)
3
-3
(*)
" (* ) ""
(*)(*)
(*)
""(*)"(*)
(*)""(*)"
11
(*)(*)
6
4
1
1
(*)
(*)
5
5
r Revised,t> Preliminary.""Combined in ''other industries."**Less than $500,000.NOTE.—Detail may not add to totals because of rounding.
1. The value of direct investments abroad in 1963 w*as adjusted by $34 million owing tovaluation adjustments on companies' books, profit and losses on liquidations, or transfersto other investment categories. The changes in values from year to year for some countriesand industries are affected not only by the capital flows shown in table 3, but also by theflows between primary and secondary foreign affiliates shown in table.
Digitized for FRASER http://fraser.stlouisfed.org/ Federal Reserve Bank of St. Louis

August 19C4 SURVEY OF (TRRKXT BUSINESS 11
Selected Countries and Years, With Major Industries for
Earnings, by Selected Countries, With Major Industries for 1963
by Selected Countries. With Major Industries for 1963
[Mill ions of dollars]
: Table 3— Continued
11 Undistributed subsid-
Table 4
Earnings Incomei| iary earnings—Con.
1903 *
Petro-leum
182
69
13
1
<**)(*)-3
3<*)
11
(*)-4
(*)23
<*)10
(**)
-24
86
-11
(**)5
-5— 7— 498
_36
(*•")— 2—2
2943
5
(*)(*)(*)
-3
17
9
8
<*)(*)(*)(*)
(*)
8
(*)(*)(*)
7
Manu-factur-
ing
852
338
81
23
(*)(*)
175
(**)
58
-547
(**)
1-1111
18
301
120
2920595(i
181
(**)143
12(**)
1592
22
(*)(*)
21
1
27
(**)
28
34
135
2
64
577
1902
Other !
465
76
74
56
1
-1(**)
552
19
214
— 1(**)-4
(**)111
12
184
33
11977
149
1123
115(**)
25
8
(**)1
15
30
2
27
2—32011
6
5
941
75
4, 235
825
1,010
213
703
10933
797
73827221
1903"
Total
4, 572
930
964
178
_3
7018528
786
52050233
52 702
505-10
169
844
— 1510— 5
161
992
360 394
|
Miningand
smelt-ing
Petro-leum
359 1, 828
94 150
147
20
(*)(*)
11(**)
t
127
(*.)(*)
49(*)
40(*)(*)
(**)
72
4
(*)
41 : d« :59
1973034
484
25
1212
121— 199735
81
150
71
-12
1,040
852
188
IS733340
24
128
112142
138
08 (*)215 ! (*)3133
598
3111218
1531
37024
170
138580
-13
1,120
935
186
14005338
21
145
127171
90
(*)
(*)
(*)(*)
(*)
(*)
31
(*)(*)
17
13
2
2
(*)
(*)
(*)
8
8
480
3
-2(*)-2
3(*)
477
(*)-2
(*)1810
(*)431— 8
52
67
47
Manu-factur-
ing
1, 52!)
544
153
49
(*)(*)
4052
104
15532
107
-1171
18
605
268
Other
856
142
184
106
2/
137719
78
3714110
13(**)
022
19
317
79
5 37 513 3S 1725 100-2
020
—36
(**)
2211
337
220
— 2 ! &
(**)128
65
(*)(*)(*)
-35
1,001
926
75
(*)(*)(*)(*)
(*)
4
(*)(*)(*)
10
17(**)301
4
43
(*)(*)
41
2
52
2
49
8
41912
5
115
10591
301115
242
33
1902
3, 050
476
761
98
(**)7
441928
663
4424041251
1477— 9
130
526
247
3522
1372923
279
54
7 715
1381
0212
31
138528
0
66
6
59
0503420
15
18
148
(**)
80
1327-321115
34
143
33
-10
1,017
854
163
17812523
10
75
095
(**)
32
19(53 "
Total
3, 059
441
801
103
-48
492327
698
5713002505
(**)480— 7
155
507
232
1527
1402425
275
P^35
1430
(**)19918
123
831540
-10
956
832
124
7582020
13
57
516
(**)
19
Min ingand
smelt-ing
293
53
141
20
(*)(*)
11
<
122
(*)(*)
48(*)
40(*)(*)(.**)
69
6
(*)
(*)(*)(*)
(*)
(*)(*)
(*)
(*)
20
(*)(*)
10
8
1
1
(*)
(*)
(*)
3
3
Petro- Manu-leum I fac tu r -
j ing
1, 654
80
466
2
9
(*)1
(**)(*)'
463
(*)2
(*)'155
(*)
660
206
70
25
(*)(*)
22(**)
2
45
200155
(**)422 6— 9
78
73
56
1
(**)
296
134
7295
1117
21
-1(**)(**)-1115
59
(*)(*)(*)
-31
893
825
68
(*)(*)(*)(*)
(*)
-4
(*)(*)(*)
9
1493140
163
21115
(**)150
2
20
(*)(*)
19
1
22
2
18
3(**)
70
3
47
442
Other
451
103
124
56
_9
8102319
69
37(i
105
14(**)
512
7
131
42
5
1848
96
225
12251
3811
Line
1
2
3
4
50789
10
1112131415101718
19
20
21
222324252027
29303132333435
24 36
83 371512
0
40
4
36
3582014
10
12
44
(**)
10
3839
40
41
42
43
44454047
48
49
505152
53
"2. Income is the sum of dividends, interest and branch profits; earnings is the sum of theUnited States share in the net earnings of subsidiaries and branch profits.
3. Data for other countries include Cuba for 1950 ($642 million), and 1957 ($849 million).
indicative of the overall rise in indus-trial activity. U.S. mining investmentsin Canada were relatively low in 1963,but may be larger this year as a resultof the discovery of new ore bodies.
Australia and Japan also received alarger amount of U.S. investment in1963; in Australia manufacturing in-vestments were larger, and in Japanthe increased investment was mainlyfor expanded petroleum refining ca-pacity.
Moderate gains in less-developedcountries
Although the rate of investmentby U.S. companies in the less-developedcountries remained comparatively lowin 1963, some gains were made. Inthe Latin American Republics theamount added to investments was $235million, slightly less than in 1962, in-cluding capital flows of $64 million andreinvested earnings of $173 million.Manufacturing investments declined toabout $200 million, a sharp drop inArgentina offsetting moderate gainselsewhere in the area. Capital flowsfor manufacturing in Brazil remainedsmall but there were sizable undis-tributed profits, presumably reflecting,at least in part, the inability of firmsto make remittances rather than de-cisions to expand. Capital flows frompetroleum companies continued, onbalance, to move toward the UnitedStates, although at a somewhat slowerrate than in 1962.
Substantially higher investments areshowing up in the Caribbean and for-merly dependent territories designatedas "Other Western Hemisphere." Over$165 million was invested in this areain 1963, including not only sizableamounts in mining and petroleum butalso about $60 million for manu-facturing.
African investments by U.S. com-panies were considerably lower in 1963.Petroleum outlays in North Africahave passed their peak rate, manu-facturing in the new nations is stillminimal, but mining investment hasshown some increase. In Asia, on theother hand, petroleum companies raisedtheir investments in Middle East oilresources, and manufacturing firmsmade small increases in their invest-ments.
Digitized for FRASER http://fraser.stlouisfed.org/ Federal Reserve Bank of St. Louis

12 SURVEY OF CTRRKXT BUSINESS Aim-list 1 < M » 4
Manufacturing and petroleuminvestments spurt
Most of the direct foreign investmentactivity is in the manufacturing andpetroleum industries, and both grew atan accelerated rate in 1963. About$1.6 billion was added to the value ofmanufacturing affiliates abroad, withcapital flows rising only slightly fromthe 1962 level to a total of about $700million while reinvested earnings rosesharply to a peak of $850 million.
Table 5.—New Foreign Issues Placed in theUnited States, I960—June 1964
[Millions of dollars; before deducting discounts andcommissions]
Areas
1964 (January-June) p
TotalCanadaEuropeAustralia, Republic of
South Africa, New Zea-land and J apan
Other countries 1
International Bank
1963 (July-December)
TotalCanadaEuropeAustralia, Republic of
South Africa, New Zea-land, and Japan
Other countries
1963 (January-June)
TotalCanadaEurope - - -Australia, Republic of
South Africa, New Zea-land, and Japan
Other countries __
1962Total
CanadaE uropeAustralia, Republic of
South Africa, New Zea-land and Japan
Other countries 3
International Bank
1961Total
CanadaEuropeAustralia, Republic of
South Africa, New Zea-land, and Japan
Other countries _ _ .International Bank
1960Total
Canada _ _E uropeAustralia, Republic of
South Africa, New Zea-land, and Japan. -_ -
Other countriesInternational Bank
Gros
"03"o
432273
15
i 1395
31510669
6674
1, 169669
2285
16352
1, 268476273
2303183
106
61226182
13612112
65625750
65175109
s amosold
"5 °1
146
15
1265
142
20
4874
29425
108
12536
582(*)214
20062
106
2775043
898312
44017935
5067
109
Pri
vate
ly
§of
fere
d ^
286273
13
17310649
18
875644
2 177
3816
68647659
303121
335211
39
4738
2167815
15108
u.s
o
400265
9
1215
27610653
6057
1,038637
2222
13049
1,088458198
168a 180
84
533239
5(
lot12012
557221
24
4217397
Pu
bli
cly
1=
offe
red
3-
123
9
i 1095
104
4257
1952245
9335
423(*)140
1386184
2134017
618312
344144
11
276597
Pri
vate
ly
1 2
offe
red
| M
277265
12
17210648
18
843615
2 177
3714
66545858
303119
32019939
4537
2137713
15108
» Preliminary. *Less than $500,000.1. Includes $50 million offering of Inter-American Develop-
ment Bank bonds,2. Includes $115 million of bonds of Shell Funding Corp.3. Includes $75 million offering of Inter-American Develop-
ment Bank bonds.
NOTE.—The amounts shown for U.S . purchases exceed thefigures used in the balance of payments because the latterexclude discounts and commissions. The International Bank forReconstruction and Development issues are reduced by theamount of delayed deliveries included in subsequent years.
Most of the additional investment wentinto Canada and Europe ($1.1 billion)and other developed countries. In theless developed countries there weregains in "Other Western Hemisphere77
and small increases in a few Asian andsome Latin American countries, but forthe Latin American Republics as awhole manufacturing investments werelower than in 1962.
As noted above, there was a sharprise in the proportion of manufacturingearnings retained abroad, which roseto over 55 percent in 1963, compared to40 percent in 1962 and an average of 50percent in the 1958-61 period.
Within the overall manufacturingcategory, the largest investments madein 1963 were by producers of transpor-tation equipment (largely automobiles)and chemicals. As shown in table 6,there has been a nearly four-fold in-crease in U.S. manufacturing invest-ments abroad since 1950, and the rateof expansion by the automobile andchemical companies lias been evenhigher. Other industry groups withinmanufacturing with notable gainsabroad were machinery (nonelectrical)and primary and fabricated metals.
Petroleum investments abroad wereincreased by $1.0 billion in 1963 ($0.7billion in 1962). There was heightenedactivity in Europe, mainly in refiningbut also in other branches of theindustry, in Middle East producingproperties, in Far Eastern refinery andother operations, and in Canada.
It is estimated that U.S. companiesincreased their production of crude oilabroad by nearly 12 percent in 1963and their foreign refining capacity byabout 10 percent.
Earnings and IncomeEarnings on U.S. direct foreign
investments moved up about 8 percentto $4.6 billion in 1963, keeping fairlyclose to the increase in book values.The overall ratio of earnings to bookvalues remained at about 11 percent,where it has been with little variationsince 1958. About two-thirds of therise in earnings was accounted for bythe manufacturing affiliates, primarilyin Europe and Canada but smallergains showed up in all other areas aswell. With the upsurge of demand inmost European countries earnings gen-erally improved, in contrast to rather
widespread declines in 1902. Higherearnings in Canada resulted from asimilar development.
Petroleum investments showed mod-erately higher earnings in 1963, thoughthe total of $1.8 billion was not muchabove the previous peak in 1957.About half of the gain in 1963 reflectedthe beginning of substantial productionin North Africa, reversing earlier lossesrelated to the exploration and develop-DSRECT JNVESTMENTS
Earnings Grew Less Rapidly Than BookValues in 1963
Manufacturing Earnings Recovered From1962 Slump
Earnings in Petroleum Continued Gradual Increase
Billion $
60
(ratio scale)
40
30
20
10
,_ ALL INDUSTRIES
Book Valuef left scale)
Billion $
12
.61950 52 54 56 58 60 62
-1/tnd of Yeor
U.S. Department cf Commerce, Office of Business Economics 64Digitized for FRASER http://fraser.stlouisfed.org/ Federal Reserve Bank of St. Louis

August 1004 SURVEY OF CURRENT BUSINESS 13
inent process. Petroleum earnings werealso somewhat higher in Asia and inCanada.
Earnings of other industries did notchange materially in 1963; the onlysizable gain was connected with theexpanded activity of affiliates in whole-sale and retail distribution. There wassome reduction in earnings of agricul-tural and mining properties.
Income remittances unchanged
While earnings rose in 1963, there wasno increase in the $3.1 billion that cameto the United States as dividends,interest and branch profits. For in-stance, while earnings in manufacturingoperations rose by $225 million, incomepaid to the United States actuallydropped by nearly $90 million, leadingto an increase of nearly $340 millionin earnings retained abroad. Incomeremittances of this industry were lowerin every area.
The decline in income receipts frommanufacturing affiliates was aboutmatched by higher receipts from petro-
Table 6.—Direct Investments in Manufac-turing Enterprises Abroad, Selected Years,1950-63, by Commodity*
[Mil l ions of dollars; yearend book values]
Manufacturing, total
Food products-Paper and allied
productsChemicals and allied
productsRubber products _ _ -Primary and fabri-
cated metals- _ _ _ .Machinery (except
electrical)-- _ . . _Electrical machinery _Transportation
equipmentOther products
1950
3, 831
483
378
512182
385
420387
485599
1957
8,009
723
722
1,378401
941
927731
1, 204983
1961 i
11,997
1,018
923
2, 059531
1, 373
1, 4631, 004
2, 2401, 386
1962 !
13,250
1, 105
967
2, 260583
1, 495
1, 6261, 106
2, 5(501, 548
1963 i
14,890
1,242
1, 053
2, 580623
1, 659
1, 8051,198
2,9411,789
*Data for a limited number of areas are available on re-quest.
XOTE.—Detail may not add to totals because of rounding.1. 1961, 1962 and 1963 data exclude Cuba. These invest-
ments were estimated at yearend 1960 at $111 million.
Table 7.—Net Capital Flows Between Pri-mary and Secondary Foreign Affiliates,1961-6:5
[Millions of dollars; net inflows ( — ) ]
Canada _ _Latin America
Panama _ .ArgentinaMexico
Europe .FraneeGermanyItalySwitzerlandUnited KingdomOther Europe
Other countries
!1961 |
i4 | .2 i
10 !— 6 i-4 I
i(
-15 f-8 i
-25 ;60 ,
— 6 '-6 !
— &
I1962 | 1963
! -416 -113 14
— 11 —1411 -5
-22 24-14 -5-4 -20
-21 -948 105-9 -4
-22 -43
% -19
leum operations in most areas. Muchof the petroleum investment in produc-ing properties is organized as branchesfor tax reasons, and branch profits arecounted as "received" when earned—for tax purposes and in the balance ofpayments accounts—without regard towhether an actual remittance occurs.Consequently, income receipts (asshown in table 4) tend to be dominatedby the branch profits in petroleum.
Other industries taken together ac-count for substantial earnings andincome receipts, $1.2 billion and $0.7billion, respectively, in 1963, about thesame as in 1962.
Royalties and fees received fromforeign affiliates exceeded $600 millionin 1963, and continued to grow morerapidly than returns in the form ofdividends and profits. For manufac-turing in particular, receipts of royaltiesand fees of nearly $350 million in 1963(table 8) were over half as large asdividends received from foreign affiliates.
Foreign Investments inthe U.S.
During 1963 foreign long-term in-vestments in the United States rose bythe very large amount of $2.6 billion.As shown in table 1, however, about $2billion of this represented the gain inmarket value of U.S. corporate stocksheld abroad, including securities in theportfolio of U.S. branches of foreigninsurance companies. The year before,there had been sharp declines in values,following the market break in May 1962.
Foreign net purchases of U.S. equitysecurities have followed the course ofthe U.S. market quite closely: Netliquidations showed up quickly afterMay 1962, and net purchases againbecame evident in the last quarter ofthe year and throughout 1963. Netpurchases in 1963 were about $200million, which was below the peaks olover $300 million registered in 1959 and1961, but above the $150 million annualaverage since 1951. In spite of thecontinued relatively strong perform-ance of the U.S. stock market, how-ever, there were net foreign sales ofU.S. stocks amounting to nearly $100million in the first half of 1964. Mostof the selling was for British account.
By the end of 1963 the aggregatemarket value of the U.S. corporate
stocks held abroad was estimated at$12.5 billion, with the largest amountsrecorded for Switzerland (nearly $4billion), the United Kingdom (over$2% billion), and Canada ($1% billion).The actual owners, of course, are notnecessarily in the countries of record.
Foreign direct investments
The value of foreign direct invest-ments at the end of 1963 was a littleless than $8 billion, an increase of $330million over the previous year. Thisrise consisted of $235 million in undis-tributed profits of U.S. subsidiaries, a$100 million increase in the marketvalue of securities held by insurancecompanies, and a small reduction fromnet capital outflows.
PROFILE OF U.S. DIRECT INVESTMENTS
ABROAD
Growth Has Been Concentrated in DEVELOPEDCOUNTRIES, With Major Gains inManufacturing and Petroleum
Billion $Year-end Book Values -
15
"10
n]950 60 1 2 3 1950 60 1 2 3 1950 60 1 2 3
Investments in LESS DEVELOPED CountriesShow Minor Increases Since 1960
10
oLfL
r
1950 6C 1 2 3
MANUFACTURING
1950 60 1 2 3 1950 60 1 2 3
PETROLEUM OTHERINDUSTRIES
U.S. Department ol Commerce, Office of Business EconomicsDigitized for FRASER http://fraser.stlouisfed.org/ Federal Reserve Bank of St. Louis

14 SUKVKY OF ( T R R K X T BUSINESS August 1<W4
In 1963 there was a net outflow ofcapital of $5 million from foreign-ownedcompanies in the United States to theirparents and affiliates abroad, as com-pared to a net inflow of $132 million in
Table 8.—Direct Investment Receipts ofRoyalties and Fees,1 by Areas and MajorIndustries, 1961-63
[Mil l ions of dollars]
Area and industry
All Areas, totalPetroleumM anufacturingTradeOther industries. .
C inada, totalPetroleum _ - _ _ _M anufacturingTradeOther industries. - _
Latin America, total . .PetroleumM anufacturingTradeOther industries. -
Europe, totalPetroleumM anufacturingTrade . .Other industries
Other areas, total -PetroleumA'l anufacturingTradeOther industries.
1961
44895
2404767
10214669
14
10324431324
16121
1061916
8237256
14
1962
54897
3035692
1141577
715
12327491631
21019
1392725
10136386
21
1963 P
622108346
65103
11914836
16
12127461731
25918
1763232
12448429
24
p Preliminary.\OTK.— Detail may not add to totals because of roundings.1. Excludes foreign film rentals.
Table 9.—Foreign Direct Investments in theUnited States—Capital Flow by Type,Area and Industry, 1962-63
[Millions of dollars: outflow (-)]
Area and industry
All areas, total
Canada
United Kingdom- .
Other EuropeBelgiumFranceGeriunnvItaly
NetherlandsSweden _ _ _ _SwitzerlandOther ._
Latin America
Japan
Other areas
All industries, total _ _
PetroleumManufacturing......TradeInsuranceOther financeOther .
19
•~ fe^ £" Co^
132
43
19
4357
3199
-191
-73
C
24
—3
132
_99
41833611
-17
62
^
•£ "c• * £ *
38
7
2
273
1424
1(*)
3
1
38
274
61
•^ >5 ̂ c^o oc
-5
44
44
-61— 2
K
— 919
— 35(*)-32
3
-24
-10
3
—5
-4442
-51
3745
196
f>J!K
ici P Oo ^ o'Jr. c ci
— 79
28
12
yr j9
-5— 10
— 6
-50(*)
3
-17
—31
3
-79
—60-8
-39
91~
3
rt
o ̂,̂ >• o
^151
3'>
36
62
11
15
20
21
151
20633
3035
c• .S~ "S
^
-77
— 17
-5
-48
-1
2-47
~7
— 77
— 5-14-14
-'—39-1
5
* Less than *500,900.1. "New investments" represents initial investments in
U.S. companies or increase in equity capital of existingforeign-owned U.S. companies.
2. Primarily represents sale of a controlling interest in aU.S. company in exchange for a minority interest in theU.S. nurcha'-er.
NOTK,— Detail may not add to totals because of rounding.
1962. This development did not re-flect a reduction of new investmentactivity in the form of initial invest-ments in U.S. companies or additionsto equity capital in existing' companies.New investments in 1963 amounted to$150 million, considerably more thanthe $38 million for 1962 (table 9).About $90 million of this total wasinitial investments in U.S. companiesand $60 million represented additionalequity capital in existing companies.
The net outflow for 1963 was largelythe result of activity in open accountsbetween U.S. companies and their par-ent organizations and affiliates abroad,which went from an inflow of $120million in 1962 to an outflow of $80million in 1963. These open accounttransactions fluctuate widely, especiallyfor trading companies. About half ofthe outflow on intercompany accountin 1963, or about $40 million, was ac-counted for by trading companies, andthis was in large measure a repaymentof $80 million of inflows by these com-panies in the previous year. The re-mainder of the 1963 capital outflow wasaccounted for by $77 million of liqui-dations of foreign investments, morethan half of which resulted from thepurchase of a Swiss-owned insurancecompany by a U.S. company throughthe exchange of stock.
Earnings of the foreign-controlledcompanies rose 18 percent in 1963 to$511 million. Of this amount com-panies engaged in petroleum and manu-facturing accounted for $150 millionand $200 million, respectively. Eachshowed considerable gain from the pre-vious year, petroleum earnings risingabout one-fifth and manufacturing one-third. The manufacturing companiesraised their dividends in 1963, b}^ anamount about equal to their increase inearnings, but for some time most ofthe petroleum earnings have remainedundistributed as dividends.
Short-term investments
A further increase of $2.6 billionoccurred in 1963 in foreign holdings ofshort-term assets in the United Statesand various types of U.S. Governmentobligations. Of this amount, about$2.2 billion represented liquid assets—largely deposits in U.S. banks, com-mercial paper held with banks, and
marketable U.S. Government obliga-tions, but including for 1963 an increaseof $702 million in foreign holdings ofnonmarketable U.S. Government ob-ligations convertible into marketableobligations on short notice. It is this$2.2 billion, together with the changein our gold stock and monetary assets—a decrease of $400 million in 1963—that corresponds to a net decline inU.S. monetary liquidity of $2.6 billion
(Continued on page 24)Table 10.—Foreign Direct Investments in
the United States—Earnings, IncomePaid Out, and Undistributed Profits, byArea and by Industry, 1962-63
[Millions of dollars]
Area and industry
Total-
By AreaCanadaUnited KingdomOther Europe _Other areas
By IndustryPetroleumM anufacturingTradeInsuranceOther financeOther industries
bfiCd
y
432
14710517210
126146196575
(*)
1962
*c3
0
8 0
~
258
105657513
14768
658213
£ C3
is 3^•3'S °fi § a~
214
5644
1141
1168815
—2—3
£f
§K
511
177143182
g
154197
1051926
1963
'c3
CD
o d
£
298
128688616
17122
6518616
It'I'll
111,P
236
667797
—4
138
7
5(*)
* Less than $500,000.NOTE.—Detail may not add to totals because of rounding.
Table 11.—Value of Foreign Direct Invest-ments in the United States by Area andIndustry, 1950, 1960-63
[Millions of dollars]
Area and industry
Total .-..
By Area
Canada
United Kingdom
Other Ku.ro peBelgiumFranceGermanyItalv
NetherlandsSwedenSw i 1 7 er 1 an dOther countries
Japan
Other areas
By Industry
PetroleumManufacturing..Transportation _TradeFinance and insuranceOther industries
1950 ! I960
3, 391
1,020
1 168
6,910
1, 934
9 94S
1 059 '9 .inQ( r>0)(00)
334C)348
(2)
134
4051, 138
(3)(3)
1, 065784
15716810?>71
166773
74
sx
181
1, 2382,611
408634
1,810209
|1961 1962 *
7,392 7,612
1, 989 2, 064
9 484 9 474
2, 64415117512089
1.023176S30so
92
182
2. 754" 405
2. 025231
2,771158183152100
1,08217983683
112
190
1,4192, 885
404750
1,943212
1963 P
7,944
2,183
2, 665
2, 826161182149102
1, 13418582589
104
165
1, 5133,018
406706
* 2, 045257
r Revised. P Preliminary.1. Included in other countries.2. Included in other areas.3. Included in other industries.4. Includes approximately $100 million due to upward re-
valuation of securities held by insurance companies.XOTK.— Detail may not add to totals because of rounding.
Digitized for FRASER http://fraser.stlouisfed.org/ Federal Reserve Bank of St. Louis

SUKVKY OF C U R R E N T BUSINESS 15
Personal Income by States and Regions in 1963
Analysis of Employment Changes by County
The Regional Economics Division of the Office of Business Economics hascompleted a statistical analysis of certain factors underlying the employmentgrowth of 3,102 local areas (mostly counties) in the United States for theperiod 1940 to I960. These analytical materials will be published within afew months. Meanwhile, because of the large number of requests which arebeing made for them, OBK is making the machine1 output available1 on alimited basis for immediate inspection. Tho tabulations may bo examinedin the Regional Economics Division of the Office of Business Economics,U.S. Department of Commerce, Washington, D.C.
JL HIS annual report presents OBE'sdetailed estimates of personal incomein the various States and regions in1963. Preliminary figures, togetherwith a brief review of major develop-ments last year, were published in theApril issue of the SURVEY. That issuealso carried a comprehensive review ofgeographic income changes since WorldWar II. The 1963 estimates in thatreport were based on preliminary andincomplete source data and were pre-sented in summary form with only totaland per capita income shown for eachState.
The 1963 income data in the follow-ing pages are revisions of the earlier ag-gregates, but more importantly, theyinclude detailed breakdowns of thetotals by industrial source and type ofpayment. Figures for 1961 and 1962have also been revised, although therevisions are minor. They reflect theconsiderable amount of additional datawhich have become available since theestimates were first prepared, as well asadjustment to the revised nationaltotals published in last month'sSURVEY.
Table 1 shows total personal incomeby States from 1954 through 1963.'Fable 2 presents annual estimates ofper capita income from 1950 forward.
Comparable figures for earlier yearsback to 1929 may be found in "PersonalIncome by States Since 1929," a 1956supplement to the SURVEY, which isavailable in libraries and which maystill be purchased from the Super-intendent of Documents, U.S. Govern-ment Printing Office, Washington, D.C.,,20402, or from the nearest Departmentof Commerce field office.
Disposable personal income
Table 3 contains estimates of totaland per capita disposable income forselected years from 1929 through 1963.Such estimates for all years have notbeen made mainly because of datalimitations. In this connection, how-ever, it may be noted that the regionaldistributions of disposable income andpersonal income in any given year arequite similar, and that long-run geo-graphic shifts in the two measures aremuch the same.
'Fables 4-62a present a breakdown ofpersonal income in each State andregion by major source for the period1961-63. This detail includes wageand salary disbursements classified intoabout 25 separate industries, proprie-tors7 income subdivided into farm andnonfarm components, and totals foreach of the other main types of personalincome. An industrial breakdown of
nonfarm proprietors' income is not pro-vided in view of its questionable valid-ity for separate analytical use, partic-ularly with regard to year-to-yearchanges. Comparable data, for 1929through 1953 are contained in thePersonal Income supplement notedabove. Figures for 1954-56 may befound in the August 1959 issue of theSURVEY; for 1957, in the August 1960SURVEY; for 195S, in the August 1961SURVEY; for 1959, in the August 1962SURVEY; and for I960, in the August1963 issue.
Income by industrial origin
Frequent requests are received forbreakdowns of State personal incomeby industrial source. Available statis-tical data do not permit a completeallocation of total income to the in-dustry of origin in each State. How-ever, in addition to the considerabledetail in tables 4-62a, some additionalclassifications of personal income byindustrial origin have been prepared.
Thus, table 63 shows the amount ofpersonal income received in each Statedirectly from farming, government(separately for Federal and State andlocal), and private nonfarm pursuits.Separate focus on these three sectors
Digitized for FRASER http://fraser.stlouisfed.org/ Federal Reserve Bank of St. Louis

16 SURVEY OF CURRENT BUSINESS
has been found essential for analysis of merit of total personal income. Thisboth the composition and movement oftotal personal income by States andregions.
Table 70 provides an industrial dis-tribution for each State of a large seg-
consists of the combined total of wageand salary disbursements, other laborincome, and proprietors7 income. Thesethree flows together account for aboutfour-fifths of the Nation's personal in-
come and present a broad view of theindustrial composition of each State'seconomy. Also, they represent themost comprehensive measure of currentdollar production that has been con-structed on a geographic basis.
Table 1.—Total Personal Income, by States and Regions, 1954-63
Table 2.—Per Capita Personal Income, by States and Regions, 1950-63
State andregion
United States.. . _.
New England.
MaineNew Hampshire ...Vermont
Massachusetts. .Rhode IslandConnecticut
Mideast
New YorkNew JerseyPennsylvania -
DelawareMarylandDistrict of Columbia
Great Lakes
Michigan .... .OhioIndiana . _ _ _
IllinoisWisconsin _ . .. _
Plains
MinnesotaIowaMissouri
North Dakota . . _ _ .South DakotaNebraskaKansas. ._ __ . -.. -
Southeast _ . _ . .
VirginiaWest VirginiaKentucky-
TennesseeNorth Carolina
GeorgiaFloridaAlabama
MississippiLouis ianaArkansas
Southwest
OklahomaTexasNew Mexico.. _ , .. ...Arizona
Rocky Mountain
MontanaIdahoWyoming _ . . - - . .
ColoradoUtah _ _ - . .
Far West
WashingtonOregonNevadaCalifornia -
Alaska1 lawaii
Table 1 (millions of dollars)
1954
285,339
18,857
1,312894543
9,4031,5155,190
73, 231
34, 18911,62219, 572
9065.0841,858
64, 894
14, 12717,2417,623
19, 7516.152
24, 084
5, 1544,4897,055
783910
2 9593,434
43, 148
5,2562,4143, 627
4, 0565, 02:-!2 414
4, 4145,3123,258
1 , 8363 7561 . 782
19, 136
3, 162J3.391
1.0881,495
6,174
1,071880537
2, 5431,143
35,815
4.9562,919
50827, 432
49$893
1955
306,598
20, 200
1,452952567
10, 0561,6175,556
78,014
36, BOS12, 35120, 706
1,0495,4531,947
70, 208
15, 78518, 5898,251
20, 9686,615
24, 683
5,4504,2607,579
872861
2,2033,458
47, 154
5, 6032, 5863, 782
4, 3475, 5352 604
4,9186, 0883.708
2,0653, 9851,933
20, 513
3,34114,380
1, 1591,633
6,670
1,158917570
2,7831,242
,39,156
5,2113,139
58230, 224
500952
1956
330, 380
21,642
1,5321,006
606
10, 7191,6776,102
84, 058
39,02313, 37922,410
1,2045, 9982,044
75, 341
16,58719,9018,859
22, 8577,137
26, 200
5,7684,5728,082
917926
2,2943,641
50, 971
6,0942,8784, 022
4,6525,9022,711
5,2746,9793,932
2, 0974,4242,006
22, 105
3.57215,4221.2571,854
7,285
1,2291,024
6,4
3,0641,354
42, 778
5, 5023,398
60533, 273
5481,024
1957
348, 724
22, 793
1,5901,071
628
11,3461,6946,464
88,586
41, 19014 20523, 525
1,2156,3812,070
78, 469
16,92320,906
9,212
23,9417,487
28, 099
6.1735, 1108,310
9391,0912, 6383,838
53, 790
6, 3863.0824,203
4,8645,9762,818
5,4327,7634,206
2,1164,8842,060
23, 697
3, 73016,5561,4012,010
7,830
1,2801,072
650
3,3671,461
45, 460
5, 8323,400
64635, 582
5371,098
1958
357, 498
23, 339
1,6541,097
649
11, 6681,7386,533
90, 029
42,06114,40423, 582
1, 2226,6412,119
77, 939
16, 54020. 4949,123
24, 1007,682
29,551
6,4845,2458,666
1,0491,1242, 7364, 247
56, 102
6,6412,9744,347
5,0166, 3002,931
5,6768,4814,382
2,2814,9292,144
24, 869
3,94217,1651,5582,204
8,207
1,3381,121
688
3,550L510
47, 462
5,9773,556
68837, 241
5261,158
1959
381,326
24,701
1,7171,201
697
12,3811, 8326,873
96, 100
45, 19715,49924, 757
1,2997,1332,215
83,188
17, 46721,9779,741
25, 6938,310
30,481
6,7065,4129,260
9861,0272,7884,302
59, 965
7,0433, 0604,563
5, 3466,7163,142
6.0799,3844,617
2,4905,1652,360
26,328
4,08318,1321,6882, 425
8,627
1,3281,180
720
3,7691,630
51,936
6,3723,845
75940, 960
5551,290
19601
399,028
25,904
1,8201,266
734
12, 9521,8757,257
9 9, 666
46, 83716, 19325,539
1,3487,4532,296
86,232
18, 17322, 72210!211
26,5648, 562
32, 086
7,0945,5809,524
1,1071, 2663,0254,490
62,268
7,3793,0994, 672
5,4947, 1383,300
6.3689, 8434,789
2,5525.2402,394
27, 190
4, 30518,486
1 , 7302, 669
9,072
1, 3631, 184
765
4,0391 , 721
54,557
6, 5973, 962
81543,183
6321,421
19611
415,182
27, 002
1,8421,314
754
13, 5791,9417,572
103,329
48, 63317, 06025, 954
1,3847,9422,356
88, 009
18,11423, 08610, 460
27, 4788,871
33; 168
7, 4395,8109,865
9951,2753, 0964,695
65, 452
7,7603,1255,007
5, 8447,6173,472
! 6, 59910, 3194,947
2,7515, 3962, 615
28, 786
4,50219.5691, 795
; 2,9209, 539
1,3451,242
4, 3401,839
57, 748
6, 9464,083
91145, 808
6281,521
19621
439,977
28, 526
1,9181,394
794
14, 2692,0828,069
108,889
51,24318, 07327,015
1, 4668,5552,537
92, 706
19, 26424,21511,041
28, 8959,291
35, 262
7, 7126,075
10, 385
1,4001. 4603,3194,911
69, 922
8,3993, 2245,283
6,1848,1773, 745
7,14511,2215,164
2, 9065, 6922,782
30, 181
4,67520, 4371,8883, 181
10,336
1,5581, 351
810
4,6181, 999
61,907
7,4264,3241,104
49, 053
6611,587
1963 !
461,610
29, 780
1,9711,450
827
14, 8892, 1538,490
113,617
53, 36118, 86128,017
1,5709,1632, 645
97, 073
20, 62425. 16411, 648
30, 0209,617
36, 534
8,1526,399
10, 900
1,3001,3903,3765, 017
74, 360
8,9073,3485,545
6,5888, 6013,944
7,71511,9335,538
3, 1836, 0722,986
31,502
4,85821, 351
1,9533,340
10,667
1,5531, 366
834
4,8312, 083
65, 706
7, 5754,5681, 246
52, 317
7041,667
Table 2 (dollars)
1950
1,491
1,629
1,1931,3161,188
1, 6631,6521,900
1,759
1,8821,7901,566
2,1461, 5802.179
1,660
1.6821,6121,520
1,8261,467
1,411
1,3971,4491,446
1,2681, 2161,4721,380
1,011
1,2341,098
958
9951,012
882
1,017! 1,287
869
i 7331,087
807
1,288
1,1461,3391, 1621,295
1, 425
1,60011,2791,623
1,4441,282
1,788
! 1,6711, 600|1,9381,839
k 831\1,403I
1951
1,649
1,823
1,3001,4701,328
1, 8451, 8152,200
1,914
2,0022,0001,734
2,2851,7672,344
1,872
1. 8651, 8671,695
2, 0351,697
1,530
1,5331, 5541,562
1,3221,4161,5561, 515
1,127
1,3931,2211,121
1,0801,1151,046
1.1411,375
986
7931,173
905
1,419
1, 2831,4531,2901,561
1,643
1,7711,4461,884
1,7201,458
1,975
1,8161,7572,1832,037
2, 6291, 589
1952
1,727
1,908
1,4271.5271,396
1,9161,8462,322
1,994
2,0792,1141, 795
2,3951,8842,411
1,945
1,9461,9541,756
2,0951,760
1,607
1,5891, 6251,661
1,2321,2441,6701,715
1,194
1, 4751,2901,203
1,1321,1521,117
1,2011,4571,044
8551,243
965
1,499
1,4021, 5231,3451, 655
1,699
1,7861,5741,828
1,7911,504
2,068
1,9091,8272, 3652,129
2,4871, 745
1953
1,788
1,958
1,4311,5701,434
1,9571,8982,400
2,076
2,1472, 2161,902
2,5101,9672,276
2,053
2,1342,0181, 913
2,1971,784
1,614
1,648ls 5591,715
1,2461,3451,6051,637
1,237
1,4841, 3071, 250
1,2181,1721,141
1,2391,5351, 084
8861,295
995
1,529
1,4761,5491, 3611,610
1,667
1,7981,4991, 854
1,7141,526
2,103
1,9651,8082,3572, 165
2,3871,782
1954
1,770
1,938
1,4311,6141, 448
1,9361,8542,351
2,051
2, 1612,2141,813
2,4751,9242,244
1,969
2,0071,9241,787
2,1741,709
1,656
1,6481,7061,705
1,2571,3751,7001,691
1,232
1,5091,2531,246
1,2061,2001,081
1,2091,5341, 068
8831,3011,001
1,553
1,4661,5851,3881,604
1,632
1.7471,4941,790
1,6731,500
2,089
1,9521,7672,3632, 154
2, 272i, 768
1955
1,866
2,076
1, 5751,7121, 528
2,0851,9602,489
2,153
2,2702, 3041,915
2. 7181, 9522,434
2,094
2.1782.0611,892
2,2721,804
1,664
1,7101, 5871,795
1,3891,2791,6201,662
1,323
1,5711, 3561,297
1,2701,2851.U7
1,3321,6591, 199
9941,3571,087
1,615
1,5281,6451,4341, 696
1,701
1,8621,5181, 810
1,7581,556
2,210
1,9811,8572, 4252,297
2, 28S1,789
1956
1,975
2,214
1,6441,7741,612
2,2281,9892,716
2, 302
2,4202,4292,065
2,9802, 1032,644
2, 207
2,2202. 1^31,985
2,4401, 908
1,743
1,7691,6821,904
1,4581,3561,6501,725
1,402
1,6471, 5211,385
1, 3511,3481,182
1,4021,7711,258
9891, 4611,136
1,702
1,5951,7321,5271,816
1, 793
1,9021,6541,913
1, 8511,645
2,326
2,0461,9692, 4202,424
2,491\ 1, 862
1957
2,048
2,298
1,6861, 8591,666
2,3291,9842,813
2,406
2,5422,5352,149
2,8932,2202,668
2,260
2.2452,2532,029
2,5051,969
1,856
1, 8631,8641, 951
1,4931,6001,8921,809
1,446
1,6711,6361,429
1,4011,3451,210
1,4181,8291,325
9921, 5651,148
1,772
1,6411,8151,6101, 806
1,884
1,9341,6782,012
1,9891,743
2,397
2,1281, 9602,5142,500
2,3971,916
1958
2,064
2,302
1,7481,8781,708
2,3492,0212,720
2,407
2,5642, 4952, 133
2, 8552,2332,759
2,200
2> 1632,1591,985
2,4511,989
1,954
1,9451, 9212,044
1,6921,6751,9771,984
1,485
1,7021,5821, 453
1,4331,4161,249
1,4691, 8551,360
1,0751,5601,209
1,819
1,7361,8431,7231,868
1, 965
2,0151,7382,137
2,1011,766
2,430
2,1482,0502,5862,526
2,4691,946
1959 1
2,163
2,380
1,7921,9951,806
2,4362, 1452,755
2,524
2,7202,6012, 204
2,9592, 3382,888
2,319
2. 2532, 2862,110
2,5762,123
1,995
1,9851,9722,161
1, 5731,5131,9891,990
1,565
1, 7931,6351,514
1, 5071,4921,327
1,5581, 9591,425
1, 1521,6111,327
1,889
1,7741, 9181,8191,934
2,028
1,9911,7932,215
2,1821,859
2,572
2,2572,1902, 7202,671
2, 5232,118
960i
2,217
2,465
1,8712,0751,892
2,5182,1932,858
2,583
2,7782.6632,256
3,0022.3982,993
2,375
2, 3172.3312,188
2, 63^2,157
2,081
2,0742,0222,204
1,7491,8452,1292,060
1,601
1,8521, 6761,536
1,5391,5621,379
1, 6091, 9671, 462
1. 1681, 6081,338
1,906
1, 8401,9171, 8062, 013
2,083
2,0041,7652, 284
2,2831,910
2,625
2,3002,2252,7912,725
2, 7602,274
19611
2,268
2,565
1,8662,1611,948
2.6482, 2«22, 9^8
2, G40
2,8292,7512,283
3,022? 5243,017
2,400
2,2662, 3312.227
9 7249 2^2
2, 135
2, 1542,0882,277
1,5501,8242,1612, 139
1,654
1,8861, 7271, 035
1,6221, 6351,438
1,6421 , 9691,487
1,2401, 6301, 450
1.955
1, 8811,9731, 8202, 048
2,117
1,9241,8102,280
2, 3571,956
2,691
2, 3559 9QS2, .8742.791
2,6722,358
19621
2,368
2,671
1,9612,2412, 052
2, 7*02,3713, 074
2,741
2,9292, 8432,373
3,1392, 6463, 215
2,516
2,3992,4122,368
2 8612, 312
2,265
2 2282^1902, 406
2,2122, 0252, 2952,217
1,738
1,9771,7951, 713
1,6931, 7381,530
1, 7502, 0651, 557
1 , 2851, 6891, 510
2, 005
1, 9102, 0191, 8942, 141
2, 257
2, 235'1,930i2, 440
2,4402,087
2,789
2,4672,3933, 1542, 881
2,7312,394
1963 l
2,449
2,766
2,0072, 3132,121
2,8532, 4333,185
2,829
3,0132, 9152, 452
3,2982, 7863, 315
2,608
2, 5412,4742,481
2,9482,368
2, 332
2, 3292,3022,518
2,0501,8862,3122^255
1,820
2,0571,8831,792
1,7831,8071,588
1,8642,1111, 655
1, 3901,7761, 607
2,047
1,9532, 0681,9182, 142
2,269
2, 1971,9162, 475
2,4642,119
2, 878
2,4849 5023, 3862,974
2,8392,462
1. Total incudes Alaska and Hawaii 1960-63 but not in earlier years.Digitized for FRASER http://fraser.stlouisfed.org/ Federal Reserve Bank of St. Louis

11.K54 SURVEY OF CURRENT BUSINESS 17
Tables 63-70 of the Personal Incomesupplement present comparable data onthe industrial breakdown of personalincome for selected years since 1929.Each August issue of the SURVEY hascarried these two tables in terms of the
current year. Because of data revi-sions, the industrial breakdowns byState after 1950, shown in tables 63 and70 of both the 1956 Personal Incomesupplement and August issues of theSURVEY from 1957 through 1963, are
not strictly comparable with the cor-respondingly numbered tables in thisissue. Comparable figures have beenprepared for 1957 to serve as an inter-mediate benchmark between 1950 and1963. They are available on request.
Table 3.—Total and Per Capita Disposable Personal Income, by States and Regions, Selected Years 1929-63
United States
New England
MaineNew HampshireVermont
MassachusettsRhode IslandConnecticut— ._
IVIideast
New YorkNew JerseyPennsylvania..
DelawareMarylandDistrict of Columbia
Great Lakes
Michigan.OhioIndiana
IllinoisWisconsin
Plains
MinnesotaIowra -Missouri
North DakotaSouth DakotaNebraskaKansas
Southeast
VirginiaWest VirginiaKentucky
TennesseeNorth CarolinaSouth Carolina
GeorgiaFlorida _Alabama
i\l ississippiLouisiana _ _ __Arkansas
Southwest
Oklahoma - _ _TexasNew MexicoArizona
Rocky Mountain
M out anaIdahoWyoming
Colorado _ _Utah
Far West__
WashingtonOregonNevadaCalifornia
Alaska1 lawaii
Total (millions of dollars)
11)29
83, 020
G, 901
407315220
3, 724577
1, 598
26, 361
13,3813, 5937, 332
2221,230
603
19, 636
3, 6735,0371, 934
7 0501, 942
7,402
1,4941, 3852,221
247281797977
9,785
1,032782
1,000
9631,021
462
998727839
561848552
4,169
1, 0562, 699
167247
1,575
305219148
625278
7, 191
1, 138.627
5 349
1940
75, 924
6,169
432275178
3, 261515
1,508
22, 952
11,1423, 3256, 199
2321, 265
789
17,310
3,5024,4751,854
5 8041, 675
6,336
1,4221, 2361,928
218224564744
10, 094
1 232758893
9701,134
572
1,031937782
464834487
3, 985
8442,708
193240
1, 552
311236148
595262
7, 526
1. 12465895
5, 649
1946
157, 003
10,874
859515333
5,562951
2, 654
41,246
19, 6456,129
11,213
3832,5541,322
34, 245
6,9388,8223,998
11,0393,448
13, 950
2,8982,7374,045
545595
1,3071,823
24, 826
3,0801, 5582, 060
2, 4282, 9711,387
2, 5082, 5171, 994
1,1811,9101, 232
9,588
1, 8316, 688
464605
3,364
601543309
1,268643
18,910
2, 8821, 666
20914. 153
1950
204, 729
13, 769
1,012644416
6, 9961,1703,531
53, 327
24, 9387, 899
14, 991
5653, 3351,599
46, 020
9, 77611,7115,515
14, 4384,580
18, 192
3,7873,4945,233
718742
1,8032,415
31, 722
3,6992,0572,612
3,0563,8321, 749
3, 2553,3292,471
1,5112, 7061,445
13, 388
2, 2939, 459
736900
4,584
884694435
1,744827
23, 727
3, 6312, 205
27617, 615
239 639 622
1953
247, 752
16,306
1, 165756487
8,0961, 3594,443
62, 559
28, 3719, 968
17, 584
6954,3031,638
57, 194
12, 54015, 0237,132
17, 0595, 440
20, 485
4, 4393, 6686,148
694807
1, 8682,861
39,001
4. 6392,3133, 260
3, 6644,4352,331
4, 0524,4963,037
1,7643,3431, 667
16, 532
2,81111, 499
9371,285
5, 433
975790479
2, 1671, 022
30, 242
4, 2772,537
38223, 046
1955
271, 240
17, 789
1,333851512
8,8111,4314,851
67, 981
31, 49510, 92818, 272
8344,7421,710
61,871
13, 87316, 3487,388
18, 4665, 796
22, 108
4,8193,8316,772
802795
1,9893,100
42, 902
5, 0252, 3543,400
3.9705,0792, 403
4,4945, 4713,387
1,9373,5951,787
18, 405
3,00812, 893
1, 0391, 465
5,941
1,041826507
2, 4491,118
34, 243
4, 6312, 750
49526, 307
783 851
1957
306, 510
19,971
1,433943557
9,9281,4965,614
76, 818
35, 42612, 49120, 543
1.0085, 5561,794
68, 647
14, 78118, 3018,155
20, 8846,526
25, 087
5,4304,5957,375
8401,0012,4063,440
48, 184
5, 6222, 7533,705
4,3915,4102, 568
4,8906, 8753,784
1, 9474,3571,882
21, 023
3,30314, 7071,2391,774
6, 945
1. 140958573
2, 9691, 305
39, 835
5. 1012, 955
55031, 109
4859(11
1959
334, 935
21,613
1, 5571,062
616
10, 7931,6205, 965
83, 121
38, 68813, 60421, 673
1,0856, 1911,880
73, 150
15, 38319, 3338,651
22, 5277,256
27,080
5,8804,8238,214
881933
2, 5043,845
53, 663
6,1982, 7454, 059
4,8076, 0522,844
5,4598,3584,142
2,2804,5732,146
23, 400
3,61816, 1431,4992, 140
7,609
1, 1741, 042
035
3, 3121, 446
45, 299
5, 0033,302
0,5835, 736
497| 1, 122
1961
362, 517
23, 479
1, 6471, 151
663
11,8011, 6946,523
88, 747
41, 14614, 84422, 701
1,1506, 9032,003
76, 996
15, 87320, 203
9, 259
23, 9477,714
29, 248
6, 4755,1468, 686
8921,1592, 7384,152
58, 357
6, 7932,7804,460
5,2276, 8323,128
5,8789, 1404,424
2,5164, 8062,373
25, 427
3, 96517, 293
1, 5892, 580
8, 345
1,1871,089
682
3. 7671, 620
50, 078
6, 0673, 519
77439, 718
5521, 288
1963
400, 284
25, 742
1, 7451, 264
' 727
12, 8291,8797,298
96, 896
44, 92016,31024, 268
1,2887, 8862, 224
84, 173
17, 93921, 84010, 222
25, 9518,221
32, 056
7,0405,6599, 541
1, 1741,2572, 9944,391
65, 757
7,7332, 9624, 875
5,7827, 6273, 523
6. 83010. 5364, 917
2, 8955. 4022, 675
27, 663
4, 27218. 7381, 7152, 938
9,315
1, 3791, 194
728
4,1841, 830
56, 649
6,5443,9181, 082
45, 105
0131, 420
Per capita (dollars)
1929
682
849
586675613
881844
1,003
934
1,099901754
941759
1, 248
780
766760600
927662
558
581563613
366407580523
360
4?6455384
370326266
344503317
281407298
1464
445468398574
581
582490664
620547
885
732602856907
1940
575
730
509559490
755716883
757
828796626
862688
1,143
648
659646540
734533
469
510487509
341349429416
333
453397312
330317301
331489275
213352249
407
363421363481
515
557452592
527475
761
640600841813
1946
1,116
1,221
1, 0291, 040
974
1, 2261,2041,389
1,320
1,4621,3601, 135
1,2771,1471,480
1,205
1,1811, 1741,080
1,3521,088
1,058
1, 0591,1091,076
9561,0121,0411,011
782
914852747
789797713
7711,018
686
570752683
912
859929826979
1,082
1, 1691, 0671,221
1, 0601,008
1, 399
1, 2531. 2411.4411,455
1950
1,354
1,477
1,1111, 2131,103
1, 4921,5021,738
1,578
1,6731,6251,425
1,7601,4041,964
1,505
1, 5231, 4641, 395
1,6491,328
1,293
1, 2641,3331, 326
1, 1661,1381,3621, 261
938
1,1341. 025
883
925944825
9431,180
808
6971, 002
758
1,176
1,0461, 2211,0711,190
1,304
1,4781, 1721,490
1, 3041,188
1, 608
1, 5221,4391, 7041, 650
1953
1, 565
1,707
1,2841,3771,288
1,6971,6702,084
1,789
1, 8311,9361. 660
1, 9911, 6831, 976
1,786
1, 8431, 7511, 703
1, 9061, 553
1,427
1, 4491,3911, 506
1,1211,2321,4241,441
1,118
1,3191.1871,118
1, 1021. 0641, 046
1, 1251.369
984
8281, 164
916
1,354
1,3131, 3691.2091, 436
1,470
1. 6041, 3411, 624
1. 4901, 364
1,821
1,7211, 5631, 9491.873
1955
1,651
1,828
1, 4461,5311,380
1, 8271,7352,173
1, 876
1, 9592,0381, 690
2, 1611, 6972, 138
1,846
1, 9141,8121, 694
2, 0011,581
1,490
1,5121, 4271, 604
1,2771,1811, 4621,490
1,204
1, 4091,2341, 166
1,1601,1791, 059
1,2171, 4911, 095
9331, 2241,004
1,449
1, 3761,4751. 2861.521
1,515
1.0741. 3681.610
1.5471,401
1,933
1, 7611. 0272. 0622, 004
561 1,166 1,207 1.569 1,600
1957
1,800
2,013
1, 5201, 6371,477
2, 0381, 7522,443
2, 086
2,1862,2291,877
2, 4001,9332,312
1,977
1, 9611, 9721, 796
2,1851, 716
1, 657
1, 6391, 6761, 732
1, 3351, 4681, 7261,621
1,296
1.4711, 4011, 260
1, 2651,2181,103
1,2761,6201, 192
9131, 3961,048
1,572
1, 4531 , 6131,4241, 594
1.671
1. 7221 , 4991,774
1, 7541,557
2,100
1, 8841, 703
! 2, 1402, 190
2. 1651,677
1959
1,900
2,083
1,6251,7641, 596
2.1231, 8972, 391
2,183
2, 3282, 2831, 929
2,4722, 0292,451
2, 039
1, 9842,0111,874
2,2591, 853
1,772
1,7411, 7571, 916
1, 4051,3741, 7861,778
1,401
1,5781, 4661,347
1, 3551,3441,201
1, 3991,7451,278
1.0551,4261,206
1,679
1,5721,7081, 6151,707
1,789
1, 7601, 5841, 954
1, 9181. 649
2,243
1 . !>K51.8802. 3582. 331
2, 2801.842
1961
1, 981
2,230
1,669, 893
1, 713
2, 3()'l1, 9742, 548
2,267
2, 3932, 3941, 997
2,5112, 1942, 565
2,100
1, 9862, 0401, 972
2,3741, 932
1, 883
1, 8761, 8492,005
1, 3891, 6581,9111, 892
1,474
1, 6511, 5371.457
1, 4501, 4601, 295
1, 4631,7441, 330
1,1341, 4521,315
1,727
1, 6561.7431,6121, 809
1,852
1, 6981. 5872,012
2. 0461, 723
2,334
2, 0571. 9SOo 44-)2. 420
2, 349| 1.997
1963
2, 12.3
2,391
1,7772,0161,864
2, 4592, 1232, 737
2,412
2, 5372, 5212, 124
2, 7062, 3982,787
2,261
2,2102,1472, 178
2, 5492,024
2,046
2,0112,0362,204
1,8521, 7062, 0511,973
1,610
1,7851, 6661.575
1,5651, 6021,419
i 1,650| 1,864
1,469
1,2(541.5801,440
1,798
1,7181, 8151, 685
I 1,885
1,981
i 1,950! 1,675i 2, 160
1 2. 134| 1.862
2, 481
2. 1462, 1402. 940
: 2. 504
! 2,4722. 097
1. Total includes Alaska and Hawaii 1961 and 1903 but not in earlier years.
73S-G500—64-Digitized for FRASER http://fraser.stlouisfed.org/ Federal Reserve Bank of St. Louis

IS SURVEY OF CURRENT BUSINESS
Tables 1-27.—Fes
Line
1
34
4 a
jj
89
1011121314151017I X19
20
23•>4
26OJ
293031
32
333435
36
37
38
Item
Personal income _ - _ _
Wage and salary disbursementsFarmsAlining __ _ _ _ _
Anthracite _ _ _ _Bituminous and other soft coal miningCrude petroleum and natural gasATining and quarrying, except fuel - -
Contract construction. _Manufacturing _ _ _ _ _ _Wholesale and retail trade _Finance, insurance, and real estate
Banking and other finance _ _ .Insurance and real estate
Transportation _ _RailroadsHighway freight and warehousingOther transportation . _ _ _
Communications and public utilitiesTelephone, telegraph, and other communi-
cationsElectric, gas, and other public utilities
ServicesHotels and other lodging, places _ _ .Personal services and private households-Business and repair servicesAmusement and recreation __ _ .Professional, social, and related services
Government- _ _Federal, civilianFederal, military..State and local _
Other industries
Other labor income
Proprietors' income _ _ .FarmNor) farm . _ . ._
Property income..
Transfer payments __ _ . _
Less: Personal contributions for social in-surance _ _ _. .. _ _ __ _
Table 4.— United States
19G1
415, 182
276,4173, 0703, 740
62783
1, 7441, 151
15,87787, 40949, 99713, 4545, 8627, 592
14 3965,2004,7334,4638, 464
4,6203,844
29, 9001,5726,7025,5322,144
13, 95049, 40513, 7508,187
27, 468645
11, 587
48, 22012, 92735, 293
54, 925
33, 606
9,573
1902 1963
439, 977
294, 6953, 0133, 763
56775
1, 7691, 163
16, 90394, 17452, 85214, 1836, 1258, 058
14 9925,2445, 1044, 6448, 790
4, 8083,982
32, 2531,6496,9096, 1792, 231
15, 28553, 10114, 5158,823
29, 763671
12,299
49, 82213, 22036, 602
58, 772
34, 674
10, 285
461, 610
309, 7212. 9583, 798
58785
1, 7831, 17°
17, 82798, 04255, 72014,9696, 4508, 519
15 3985,2075, 4134,7789, 175
5, 0174,158
34, 3611,7247,0476,6292,322
16, 63956, 78315, 5608,967
32, 256690
13,098
50, 63813, 02837, 610
63, 251
36, 687
11,785
Table 5. New England
1961 | 1902 19(13
27,002 28,526 29,780
18,409 19,516 20,293112 109 ! 10S28 28 | 28
Table 6.— Maine
19')1 1962 19* ',3
Table 7.— NewHampshire
1961
1.842 i 1,918 1,971 1,3141 |
1,206 1,255 1,292 89425 I 26 | 26 i 72| 2 2 1
_ _ _ _ _ _ _ _ _ ! _ _ _l
9~
9047, 2823,116
983362621583153256175539
299240
2,09388
42835889
1,1292, 771
689485
1, 59858
744
2,074148
1,925
3,860
2,460
604
128
9727, 7193, 2851,027
374653600144277178560
312248
2, 26492
442410
941,2262,894
703495
1,69656
787
2,138140
1,998
4,167
2,561
644
128
1,0257,8133, 4031,081
392689612142292179581
323258
2,42595
447453100
1,3303,093
756480
1,85762
822
2,178121
2, 057
4,490
2,734
738
I
614192014118225224181038
16101
102963
532596873
1189
38
20839
168
253
180
43
2 J62
4442064319245123199
39
2317
107102894
572676973
1249
40
21238
173
271
185
45
259
4502144520255224208
41
2318
111102794
622847375
13610
42
20331
172
292
193
51
147
36012933122125
7125
28
1513969
1897
541685340761
33
11810
107
183
114
28
1902
1, 394
954
1
1963
1, 450
989
1
Table 8. — Vermont
19(51
754
461146
1962 1003
794 827 {
489 51112 13 ;
6 : 6 :
;1
385138351322267
136
29
1613
1051018117
591765542781
35
1208
112
196
118
30
151
38414737142427
146
28
1612
1131019138
641925943901
36
1194
115
213
127
34
ft
148
188
11221282
15
97
566
1223
3476174
541
19
1133974
105
73
17
1
628
1638220g
12201092
15
87
63
1333
3779175
571
20
1083077
120
75
18
()30 i
164 !87218
13209
102
16
97
728
13
54181194
58
21
1072582
130
80
21
[Millions of dollars]
Line
23456
89
10111213141516171819
202122232425262728293031
32
333435
36
37
38
Item
Personal income
Wage and salary disbursements _ _FarmsMining _ _
Bituminous and other soft coal miningCrude petroleum and natural gasMining and quarrying, except fuel
Contract construction _ _ _ _ _ _ _ _ManufacturingWholesale and retail trade _ _ _Finance, insurance, and real estate
Banking and other financeInsurance a n d real estate _ _ _ _ _
Transportation _ _ _ _ _RailroadsHighway freight and warehousingOther transportation
Communications and public utilitiesTelephone, telegraph, and other communi-
cations.Electric, gas, and other public utilities
ServicesHotels and other lodging places _ _Personal services and private households.. _Business and repair servicesAmusement and recreationProfessional, social, and related servicesGovernmentFederal, civilianFederal, military - _ _ _ _State and local
Other industries _ _ _ _ _
Other labor income _ _ _ _
Proprietors' incomeFarmNonfarm
Property income - -
Transfer payments
Less: Personal contributions for social insur-ance
Table 16.— Delaware
1961
1,384
8729
(3)
(3)(»)
6638611431171542151116198
11823
26125
361202133661
49
1022676
312
71
23
1962
1,466
9189
(3)
rs)(3)
6641012132171640151312199
10893
27146
401302235731
52
10629
341
74
24
1963
1,570
9938
(3)
(3)(3)
7444513234181641151412219
12943
28156
421422338811
58
1032281
369
76
29
Table 17.— Maryland
1961
7,942
5,68028131
(3)12
3501, 366
959253
941582931168196
16688
78629
2516910136
2981,606
840252514
18
204
64576
568
1, 036
593
217
1962
8, 555
6, 13329141
(3)13
3951,4481,017
26997
17231311389
11117794
83719
2617613838
3401,734
912267556
17
217
688
616
1, 113
643
239
1963
9, 163
6,61228151
14418
1, 5011,084
29010418731411393
108189102
88809
2818016240
3981, 9461,049
291606
235
70059
642
1, 203
693
279
Table 18.— District ofColumbia
1961
2,356
1,526
401825018325024
7203622
13250136729
6135860691
7792
4
38
194
194
395
302
99
1962
2,537
1,646
6043
1965519365324
214026
14278
1469326
1579177408294
4
42
201
201
423
327
101
1963
2,645
1,695
6345
2055920385425
7214429
15268
1570346
14395476089
1054
44
207
207
456
356
114
Table 19.— Great Lakes
1961
88, 009
59, 99733641613497
1853,114
25, 26810, 3262,4601,0431,4173,0021,2251,211
5661,715
849
8665,421
2421,081
942300
2,8567, 8591,649
6675,544
81
2,906
9,0762,3076, 768
11,195
6,751
1,916
1962
92, 706
63, 84833342213799
1863,130
27, 50410, 8172, 5621,0881,4743,1321, 2361, 305
5911,764
873
8915, 778
2491,0961,016
3073, 1098,3181,743
7035,871
89
3, 078
9,2382,2516, 986
11,820
6,774
2,052
1963
97, 073
67, 08533542413899
1873,301
28, 88811,3402, 6721, 1351,5373,2301,2341,381
6161,822
899
9236, 153
2561,1211, 086
3213, 3688,8311, 836
6616, 334
89
3, 263
9, 3752,2107, 166
12, 678
7,020
2,349
Table 20.— Michigan
1961
18, 114
12,4327186
(3)1274
5385,7731,948
406186220428129220
79374177
1971.069
3721917260
5811,727
255134
1. 33811
666
1,670300
1,370
2,296
1,416
367
1962
19, 264
13, 4906883
(3)1073
5406, 4842,051
41819022845313323881
381179
2021,156
3822519160
6421,846
281147
1,41711
732
1 1,674266
1,408
2, 403
1,362
397
1963
20, 624
14,5847083
1073
6177,0372, 196
43920323647113425384
397187
2101,249
3823221364
7022,013
292144
1, 57711
795
1,745275
1 1, 470
| 2, 513
1,394
467Digitized for FRASER http://fraser.stlouisfed.org/ Federal Reserve Bank of St. Louis

Aim-list 11H14 SURVEY OF CURRENT BUSINESS 19
by Major Sources, 1961-63[Millions of dollars]
Table 9.
1%1
13, 579
9, 2903112
111
4153,4311,064
511204308307
70133104274155
1181,186
43217247
44635
1,43039020983030
376
93831
907
1,868
1,416
308
— Massa
1902
chusetts
1903
14, 269
9, 756
14, 889
10,11.')30 3012 12
Table 10.— Rhode Island
1961 1902 1903
Table 11.— Connecticut
1901
1, 941
1,35631
| |
1 111
4403,5911,747
535213323319
07145107285163
1221, 283
4422328446
6871,485
394210881
29
398
97034
936
1,964
1,508
326
12472
3, 5051, 845
50122234032460
152105290169
1281,373
45224314
47742
1,60242419598333
412
99830
968
2,112
1,626
373
107
50(522103234040
720134019
20126
431157
69286
7592
1193
55
1313
128
260
192
52
2,082
1, 44431
172
53623405234243
723134120
21135
432168
7531277
102133
3
57
1333
130
306
196
55
2, 153
1,4813
7, 572
5, 26232
1 fi
177
530240
092444447
24134220
22144
433168
823168199
1363
60
1363
133
330
208
62
0288
2,41882031097
220137310441
14579
66528
171227825
2855538666
40114
224
56626
541
1,191
485
156
1902
8, 069
5,61831
0
0319
2, 001878330
99231141300942
15283
6857118
1298826
3105769063
42313
236
59526
569
1,309
479
169
1903
8, 490
5, 907296
0337
2,714925348103244145297244
15786
72612
181319628
33961810064
45414
252
61528
586
1,412
502
197
Table 12.— Mideast
1901 1902 1903
i103, 329
70,617279309
0215320
1283, 028
23, 50112,9114, 1931,9142, 2793,7151,0771, 0711,5062, 2641,294
9698,551
4261,8331, 920
5753,797
11, 0893,7421, 0406,306
118
3, 043
8,757722
8,035
15, 039
8,262
2,389
108, 889
74, 5492(55372
5(515130
1303, 969
24, 73813, 4034, 3431, 9492, 3953, 8531, 0731,1441,0302, 3381,334
1, 0039,174
4411,8722,116
6034,142
11,9143, 9581,0976,859
120
3,154
8,845576
8,269
16, 354
8,522
2,533
113,617
77, 44825137958
14931
1414, 075
25, 20914,0814,5172, 0082, 5093, 9281,0521,2181,0582, 4351,392
1, 0449,715
4591,8982 224"'6304,498
12, 6774, 2091, 0847,384
121
3,338
9,077625
8,453
17, 646
8,997
2,887
Table 13.— New York
1961 1 902
48, 633
32, 82712163
18
541,0499, 5080, 7702, 5841,2011, 3231, 009
350401919
1, 104727
3774. 520
259895
1,134378
1,8554, 7241,049
2893,386
53
1,302
4,220286
3,935
7,661
3,711
1,088
51,243
34, 54311167
11056
1,8449, 9507, 0782, 6701,2801, 3901,704
349417938
1, 140748
3924,808
267918
1,218397
2,0075,1171,077
3113,729
55
1,348
4,267228
4,039
8,397
3,826
1,139
1903
53,361
35, 70510209
]1157
1, 85310, 0817, 3082, 7011, 3081,4531 , 722
342442939
1, 185783
4025, 080
'281931
1,208422
2,1775,4291,157
2913,981
55
1,437
4,384271
4,113
9,084
4,050
1,297
Table 14. — New Jersey
1901
17, 060
12, 0904520
20088
4, 8002, 004
539201338000127209204301186
1751,340
48303390
71527
1,55537623794218
562
1,47386
1,388
2,125
1,181
371
1 902 1 903
Table 15. — Pennsylvania
1901
18, 073
12,8364024
124
7405,1892,108
500200354708120293288370190
1801,442
51298441
75578
1,63039324499318
591
1,53073
1,457
2,281
1,239
403
18,861
13, 3774720
(3)
20704
5, 3012, 237
590217373735123313299386198
1881, 525
52305449
77641
1,748410232
1,10618
618
1,55163
1,488
2,456
1,320
461
25, 954
17, 62170
27202
1501842
8247, 2802,881
730323413999440302251577263
3141,729
78372254
79946
2,223764152
1,30625
888
2,123249
1,874
3,510
2,404
591
1902 1903
27,015
18, 47370
2(5656
1481943
8047, 6982, 943
756329427
1, 036446325266591268
3241,838
8038427381
1,0202,386
814158
1,41425
904
2,052174
1,879
3,799
2,412
626
28, 017
19, 066(55
2(5858
1944
9037, 8903, 054
783341441
1,0(52435349279010271
3381,940
7938429683
1, 0972,458
810143
1,50526
946
2,132210
1,923
4,079
2,501
707
Line
1
234
4 a,
( i7s9
101 11213141510171819
202122232425262728293031
32
333435
36
37
38
[Millions of dollars]
Table 21.— Ohio
1961
23,086
15, 90859108502533756
7, 0382, 053586252335839340326173433218
2151, 365
5429722087707
2,044543152
1, 34926
815
2,093380
1,712
2, 973
1, 832
534
1962
24, 215
16,82561115512935780
7, 5572,7846162673498(56342350174440225
2211, 440
5530223388761
2,132569161
1,40228
857
2,122349
1,773
3, 186
1,796
570
1963
25, 164
17, 49061119533036822
7,8832,852639275364887337372179460233
2281,528
5630725090825
2,214577152
1,48526
903
2,159350
1,809
3,411
1,843
642
Table 22.— Indiana
1961
10,460
7,104465223822352
3,2651,1412701171533631681405020292
1094992411663252729011876664813
378
1,270472798
1,159
767
218
1962
11,041
7,631445322822346
3,6141,2132811211603711081584520094
1125362512072262949521977268315
394
1,290463827
1,199
763
235
1963
11,648
8,082475321824385
3,7921,2882941301643781641694521496
118573261237828318
1,0412146476318
416
1, 347490857
1,287
787
272
Table 23.— Illinois
1961
27,478
18,81898150625237
1,1326, 7473,620984399585
1,126500411215540284
2561,995103356420104
1,0122,403551269
1,58325
795
2,850711
2,139
3, 571
2,057
614
1962
28,895
19,811100152645137
1,1287,1993,7631,025419606
1,185507442236555291
2642,121107355451107
1, 1002,554578275
1, 70027
827
2,942747
2, 196
3,802
2,166
653
1963
30,020
20, 56197153645138
1,1237,4303,9551,004432632
1,230511466254509298
2722,235110362472112
1, 1782, 679626257
1, 79626
869
2,972744
2, 228
4, 086
2,274
743
Table 24.— Wisconsin
1961
8,871
5,7356220
20336
2, 44590321289123246891084916778
8949224946624284784113466267
252
1,193444749
1, 196
680
184
1962
9,291
6,0926019
19336
2, 6511, 00522291132257861165417584
9252524957025
311834118486687
268
1,209427783
1,230
688
197
1963
9,617
6,3676116
16354
2, 7461,05023095141264881215418285
9656826977427344884127447137
280
1,152351801
1,321
722
225
Table 25.— Plains
1961
33, 168
19, 7253262541082162
1,3145,1554,072974438535
1,387728412247670347
3282, 038
9639026999
1,1853,493813504
2,17636
749
6,3532,9023,390
4,418
2,654
730
1962
35,262
20, 9143442531179163
1,3935,5234,2741,036471564
1,430730443256700359
3412,188
99401298102
1,2873,734851542
2, 34239
815
6,9363,4403,496
4,641
2,737
782
1963
36, 534
21, 8523232481178159
1,4355, 7804,4861,087495591
1,444725458261725368
3572,306106407319105
1,3703,971929537
2,50540
864
6,8743,3313, 544
4,975
2,859
890
Table 26.— Minnesota
1961
7,432
4,6365993
(3)
93310
1,250961237108129311164757214271
72513257666223247491394356710
178
1,214525689
957
605
157
1962
7,712
4,9266494
(3)
94320
1,3001,004252116130324164818014873
75552267873223537911464759910
194
1,142435706
999
618
167
1963
8,152
5,1265987
(3)
87331
1,4131,048262120142323159848015375
78582287978223768561634365011
207
1,287574713
1,071
648
187
Table 27.— Iowa
1961
5,810
3,10474141
(3)
13184919644150668416997571611254
58311136234151875181042439110
116
1,434779654
818
454
114
1962
6,075
3,26284162
(3)
15178962672156688917296601511354
59335136540162025641102642810
123
1,479810668
864
468
121
1963
6,399
3,43181162
(3)
14197
1,0297031(50729417797041511554
00351136645162125871202344411
130
1,563879684
926
485
136
Line
1
23450
8910111213141516171819
202122232425262728293031
32
233435
36
37
38Digitized for FRASER http://fraser.stlouisfed.org/ Federal Reserve Bank of St. Louis

20 SURVEY OF CURRENT BUSINESS
[Millions of dollars]
August 1(.H)4
Tables 28-51.—Personal Income
Line
1
234
6789
10111213141516171819
202122232425262728293031
32
333435
36
37
38
Item
Personal income.. _ _
Wage and salary disbursementsFarms. _Mining
Bituminous and other soft coal miningCrude petroleum and natural gasMining and quarrying, except fuel
Contract constructionManufacturing _ _Wholesale and retail trade . _ .Finance, insurance, and real estate
Banking and other financeInsurance and real estate
TransportationRailroadsHighway freight and warehousingOther transportation
Communications and public utilitiesTelephone, telegraph, and other communica-
tionsElectric, gas, and other public utilitiesServices
Hotels and other lodging placesPersonal services and private households. _Business and repair servicesAmusement and recreationProfessional, social, and related services
GovernmentFederal, civilian. _ __ . __ _ __ __Federal, militaryState and local _ _ _
Other industries
Other labor income
Proprietors' incomeFarmNonfarm _ _ _ _ _ _
Property income
Transfer payments
Less: Personal contributions for social insur-ance
Table 28.— Missouri
1961
9,865
6,313513651
29361
1,9411, 326
326142184478193171114223
11510864933
13810535
338914274143497
8
252
1,422513909
1,280
824
227
1962
10, 385
6,683553561
28387
2,0881,370
351158192488193179115233
12011368734
14011436
364982289148545
9
274
1,465529936
1,355
852
243
1963
10, 900
7,083523751
31443
2.2201,452
368116202498192186120243
12411972835
14312537
3881,034
318138578
9
292
1. 463495968
1,456
889
283
Table 29.-NorthDakota
1961
995
57927102
15226
142261314453493
24
141170
41042
49156323391
19
20281
121
128
90
22
1962
1, 400
638319261
6927
1562814154634103
25
1411734
1042
521723641
"?21
542416126
130
92
23
1963
1,300
67527
9261
6736
1623115164734103
27
1512774
1152
551923948
1051
22
395267128
140
95
26
Table 30.— SouthDakota
1961
1,275
6452212
(3)128768
1442615123112153
25
1312653
1244
421645023911
20
382217166
162
99
33
1962
I1,460
7032313
(3)139470
159281612371222
426
1312754
1274
491765226981
23
500327174
167
104
37
1963
1, 390
6972214
(3)146871
1613017133312174
27
1413764
1244
531955532
1081
25
421263158
179
109
41
Table 31. -Nebraska
1961 1982
3,096
1,7615212
51393203731064265
14284391956
4017
1829
33269
105375
8976
2113
56
696352344
436
219
72
3, 319
1,8534611
1413383981144469
14685412059
4218
1981035299
1153989185
2223
61
800444356
452
231
77
1963
3,376
1,9104410
55
1413384181174671
14685412062
4319
2051136289
1214269793
2364
63
766408358
483
241
87
Table 32.— Kansas
1961
4,695
2,68741762
678
1826304811025448
210145462094
4251
2499
582913
141618126163329
4
109
1,004496508
638
362
105
1962 1963
4,911
2, 85041752
667
1976795151075652
216146511996
4353
26810613114
153651128168355
4
119
1,008479530
674
373
114
5,017
2,93040742
66
1876815431136054
221146561999
4356
28611613514
166681137160384
4
125
980445535
720
392
129
[Millions of dollars]
Line
123456789
10111213141516171819
202122232425262728293031
32
333435
36
37
38
Item
Personal income. _ _Wage and salary disbursements
Farms. _ _ __ _. _ _Mining
Bituminous and other >oft coal minineCrude petroleum and natural gasMining and quarrying, except fuel
Contract construction. _ _ _ManufacturingWholesale and retail tradeFinance, insurance, and real estate
Banking and other financeInsurance and real estate
TransportationRailroadsHighway freight and warehousingOther transportation
Communications and public utilitiesTelephone, telegraph, and other communi-
cationsElectric, gas, and other public utilitiesServices
Hotels and other lodging placesPersonal services and private households-Business and repair servicesAmusement and recreation __ _Professional, social, and related services
GovernmentFederal, civilianFederal militaryState and local
Other industries __
Other labor income -
Proprietors' income - -FarmNonfarm
Property income
Transfer payments _
Less: Personal contributions for social insur-ance
Table 40.— Georgia
1961
6,599i. 507
6023
(?)22
2041, 256
85623498
1362601038671
136
8056
41519
1606221
1541,034
315295424
30
150
868975593
687
537
151
1962
7,1454,956
5724
(3)23
2361,401
9282551091462781069675
142
8458
45320
1677022
1741,153
34134346830
165
889253636
744
556
166
1963
7,7155,348
6024
(3)9
2581, 5251,004
27611815828810210482
155
9263
46821
1727423
1781,260
37439748931
183
979313666
806
591
192
Table 4L— Florida
1961
10,3196,197
11838
36497961
1,3754031532503288570
174180
11763
86810326511960
3211,393
30135673637
192
1,419413
1,006
1,751
967
206
1962
11,2216,767
12240
337
5351,0541,555
4361602753328777
169195
13066
976108276153
67371
1,48332036779739
210
1,474397
1,077
1,950
1,047
226
1963
11, 9337,199
12142
438
5701,1091, 631
462172289342
7782
184208
13771
1, 038112283149
70424
1,63534641387639
227
1,506404
1, 102
2,117
1, 142
258
Table 42.— Alabama
1961
4,9473,324
3458362
201649855241435290
146614738
102
4854
32411
1156511
122810388119334
5
144
662! 225
437
482
465
130
1962
5,1643,510
3351312
17163
1,0845541505594
151635038
104
5054
33511
1185911
136879401125353
5
150
65821?446
498
492
143
1963
5,5383,745
3246292
14181
1,14858816160
101161645641
109
5257
36612
1197311
152946425125396
6
160
738272466
538
519
162
Table 43.— Mississippi
1961
2, 7511,599
5229
253
894032636632346430221256
2630
1609
68166
6240991
111207
8
62
618328290
258
281
68
1962
2,9061,743
5129
264
93460285
7033377031
1553
2831
173107018
670
44595
125225
8
68
594288305
284
288
73
1963
3, 1831, 858
523,
284
107500303
7635407431261761
3032
1851170216
77462105118239
9
76
723404319
304
306
85
Table 44.— Louisiana
1961
5,3963,517
48260
24120
2386626501567086
2456649
130134
5777
40119
1245819
181712128114471
12
164
674195479
636
519
114
1962
5, 6923,739
45270
25020
2487076891627389
2506652
132137
5878
42920
1286420
19879114216348513
172
! 6901 193
497
| 680
533
1963
6,0723,982
49278
25820
269780734 i1737895
259 •;6457
138142
6281
45820
1277421
216825154159512
15
186
755240514
730
560
141
Digitized for FRASER http://fraser.stlouisfed.org/ Federal Reserve Bank of St. Louis

August 1964
by Major Sources, 1961-63
SURVEY OF CURRENT BUSINESS
[Millions of dollars]
21
Table 33.— Southeast
1961
65, 452
42, 682680949453317179
2,45211, 3987,4671, 921780
1,1412, 264894704667
1, 260673
5874,341262
1,431628215
1, 8069, 8092, 9202, 3924, 497141
1,860
9,1613, 4705, 691
7,579
5,870
1, 501
1962
69, 922
46, 171670958446328183
2,67612, 5278,0782,062834
1,2282,361919773669
1, 320714
6054,729276
1,486722233
2,01210, 6453, 1262,6484,871147
1,797
9,3583, 3536, 005
8,163
6,070
1,639
1963
74,360
49,250700982460338184
2,91713, 3488,5952, 216900
1,3162, 468917837714
1,379747
6325, 097291
1,515825242
2, 22411, 3953,3712,7825,242152
1,938
9,8163,5816,235
8,806
6,438
1,889
Table 34.— Virginia
1961
7,760
5,652636551113334
1,190893226841423111268310214686
60539301629923225
1, 86787550848418
184
777206572
864
521
238
1962
8,399
6,140596652
(3)
14374
1,31796125096154315131899415592
635983117111526255
2, 02796353952618
207
830215615
931
552
262
1963
8,907
6,620617054116428
1,3761, 0282751031723311349610116499
656743417814126297
2,1951, 03658757218
224
774121653
1,004
589
304
Table 35.— West Virginia
1961
3,125
2,08012269249173946663006026341439430199932
6715393817117928461152082
154
27342231
337
351
69
1962
3, 224
2,150102702461959470330661263514795341910133
68163103819118529359152202
155
27435239
356
363
74
1963
3, 348
2,2429
280257176997363216427361519536209728
69170103820128931465132362
163
27129242
378
378
84
Table 36.— Kentucky
1961
5,007
3,079421351071710177889500105495518010248309543
52286127631181496661631973075
145
780372408
533
590
120
1962
5,283
3,348431361081612216970530111525919110754309944
54306137933191637411742153525
156
816382434
562
532
132
1963
5,545
3,547491401101614232
1,0385671195664201112582110347
56330138236201797611792133695
169
846398448
603
533
153
Table 37.— Tennessee
1961
5, 844
3,86441279
(3)19206
1,312707180701102028286338266
16392151236316175711220943974
156
796285511
643
515
130
1962
6,184
4,15738289
(3)
19218
1, 435753192741182138594348468
174221612572161927692331014354
168
790262528
681
528
140
1963
6,588
4,45444298
(3)21236
1,5348042057912622589101348870
18447181288117203837255994834
180
831282548
732
554
163
Table 38.— NorthCarolina
1962
7,617
4,9909217
17239
1,80881419686110224661263212165
56451181735117192
1,01716131054611
168
1,262604658
773
573
149
1962
8,177
5,4249017
17254
1,98288121092119244681403613072
57488191815919210
1,11616935159612
190
1,3C8615693
817
600
163
1963
8,601
5,75310414
14279
2,088934227100127260691524013172
59538211858320229
1,16418535562412
204
1,304581722
885
644
188
Table 39.— SouthCarolina
1961
3,472
2,398445
51198963281003565652426155430
24214882337845711342182184
79
454176278
347
264
70
1962
3,745
2,618415
51349973571063868702429165732
25234984418926131442232464
88
469174295
371
276
76
1963
3,944
2,758385
5138
1,0533761124171742532166034
262561085508
1046421532332564
93
483180303
400
298
88
Line
1
2345678910111213141516171819
202122232425262728293031
32
333435
36
37
38
[Millions of dollars]
Table 45.— Arkansas
1961
2,6151,474
76241131091371256552530975630105423
311389461476130684561666
62
578350228
269
289
57
1962
2 7821,619
792311211110418279602733995634105824
3415294918868£"G85811707
67
567327241
289
301
62
1963
2,9861,744
8123112111194623046530361025538106125
3516510482287635494701907
73
606354252
311
324
72
Table 46.— Southwest
1961
28,78618,400
4301,182
4976202
1,2393,2753,538842368474
1,075343323409659303
3561,96610753931294914
4, 1481,1521,0251,971
46
761
4,5721,6112,961
3,641
2,049
639
1962
30,18119,533
4181,195
4988202
1,3013,5233,746900391508
1,130346339444679315
3642,149113558362102
1,0134,4431,2331,1052,105
50
814
4,4921,4653,026
3,859
2,176
692
1963
31,50220,488
3821,192
4991196
1,3273,7133,968962420543
1,146344356447713334
3792,287120571374105
1,1164,7471,3441,1402,263
51
870
4,4471,3623,085
4,145
2,338
787
Table 47.— Oklahoma
1961
4,5022,701
412623
2518
16240550411858601554052649847
51266126543131326802431363018
114
790289502
581
425
109
1962
4,6752,883
372643
2529
178440539127616616340556810349
54291126746141527322591513238
120
750230521
595
445
117
1963
4,858
Table 48.— Texas
1961
19,5693,012 | 12I561
342652
2549
186462565133666816540586810650
57311136947131687752791553418
127
742213530
637
475
135
302708
67137762
2,5062,488592249342801244229328434201
2331,288
6339519664571
2,647664721
1,26232
544
3,0521,0591,993
2,542
1,288
417
1962
20,43713,262
302718
68335788
2,6732,621631266366842246239357444209
2361,397
6640822367632
2,811711773
1,32736
577
2,983956
2,027
2,693
1,376
453
1963
21,35113,934
270720
68436833
2,8142,778674285389854244251359468223
2451,489
7141623868695
2, 999774792
1,43337
619
2,940863
2,077
2,892
1,478
512
Table 49.— New Mexico
1961
1,7951,222
2610515450958519045202655291885120
301781025236
115388129881703
41
274108166
174
127
43
1962
1,8881,290
2510415449959619848212657301985221
302001125346
123413134951833
46
275105169
192
131
46
1963
1,9531,334
24962524210194208532330583019105423
321991126256
130444149981973
47
278110168
207
139
51
Table 50.— Arizona
1961
2,9201,917
60107
107219278355864146643024107534
412342254511296434117792383
62
456155301
344
210
69
1962
3,1812,098
54110
110240314387944351683028117936
4426124575915106489128862733
71
483174309
379
226
76
1963
3,3402,208
54109
(1)1092073444171024656693028118539
4628824606417122529142952923
77
487177310
409
247
88
Table 51.— RockyMountains
1961
9,5396,2001562822594163524
1,0831,19925212912442523012669215115
100626501108036350
1,4355042197132
229
1,404453950
1,224
734
250
1962
10,3366,6191542692291156556
1, 1561,26927213413743623513368224119
105682541138837390
1,5995322717963
248
1,606632974
1,366
763
266
1963
10,6676,9181532742088165533
1, 2061,32728814314544323513869235124
111711561149137412
1,7465892858723
262
1,515542972
1,472
804
304
Line
12345678910111213141516171819
202122232425262728293031
32
333435
36
37
38
Digitized for FRASER http://fraser.stlouisfed.org/ Federal Reserve Bank of St. Louis
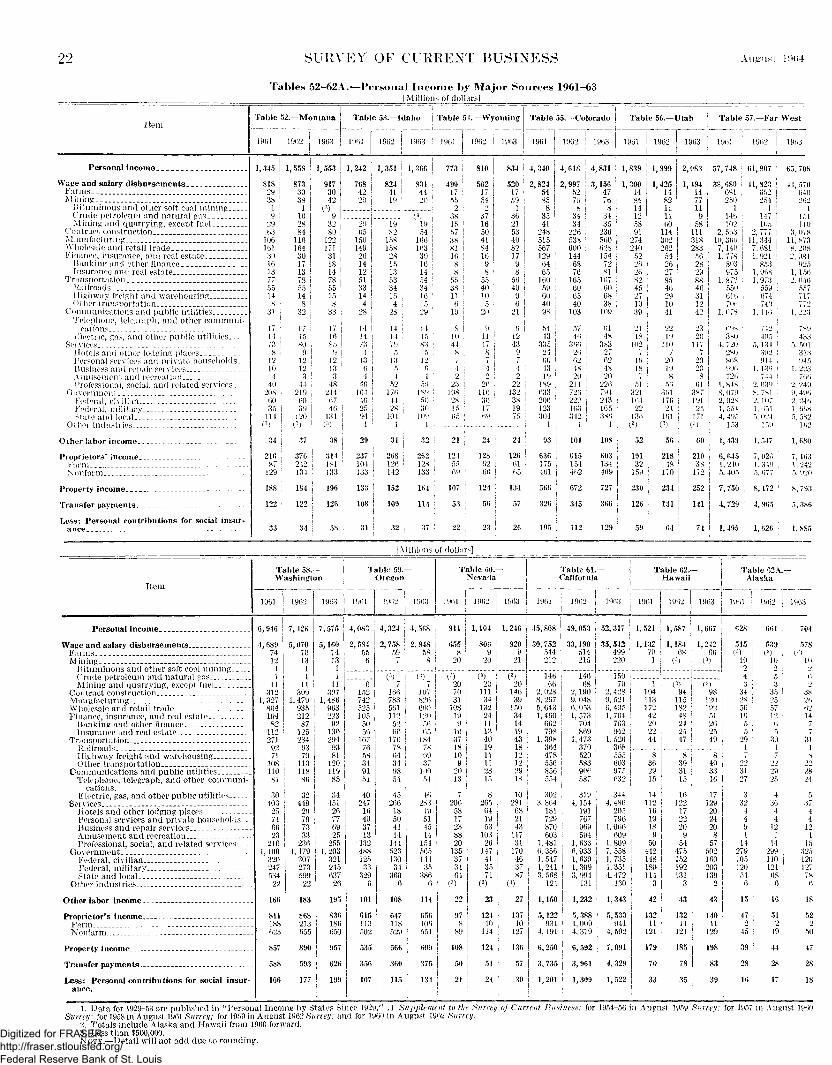
22 SURVEY OF CURRENT BUSINESS August 1 J M 5 4
Tables 52-62A.—Personal Income by Major Sources 1961-63[Millions of dollars]
Item
Personal income
Wage and salary disbursements _Farms _M in ing
Bituminous and other soft coal mining("rude petroleum arid natural gasMining and quarrying, exceot fuel
Contract construction __ _ _ „ .Manufactur ingWholesale and retail tradeFinance, insurance, and real estate
Banking and other financeInsurance and real estate
TransnortationRailroads __ _ _ _Highway freight and warehousingOther transportation. _ .
Communications and public utilitiesTelephone, telegraph, and other communi-
eat ions . - -Kleetric, gas, and other public utilities.
Services - - - - - -Hotels and other lodging placesPersonal services und private households. -Business and repair servicesAmusement and recreation _ . - -Professional, social, and related services
GovernmentFederal, civilianFederal, mil i taryState and local - _
Other industries
Oilier labor income
Proprietors' income - -FarmNonfarm
Property income _ . ._
Transfer payments _ . _ .
Less: Personal contributions for social insur-ance
Table
1961
1, 345
818293819
99(53
106161301613
55148
31
1714
81210
440
2080035
114(3)
34
21687
129
188
122
52. — Montana
1962
1 558
8733038
1102884
11616430
1378
148
i 32
! 17! 15! SO
912
: 12
> 344
': 219; (10! 39t 120
! (3>
| 37
! 3761 242
134
184
122
!1 34
1963
1,553
9173042
(3)9
3280
199
1713118147855158
33
1716859
12133
482446746
131(3)
38
! 314181
! 133
196
126
! 38
Table 53.— Idaho Table 51.— Wyoir
1961
1,242
768
20
iShi2614125133144
28
141473
1364
4616446
! 25941
29
237I 104| 133
! 133
108
! 31
1962 | 1963 1961 1962 1
1,351 1,366 773 810
824 ! 831 490 50241 i 44 ; 17 1719 ! 20 l 55 54
i 2 2(«) j 3S 37
19 j 19 ! 15 1682 ! 54 57 50
158 i 166 1 38 41158 ! 163 | 81 84
28 ! 30 ! 16 1615 ; 16 i 8 9 \13 | 14 ! 8 853 ' 54 • 55 55 i34 ; 34 38 40 !
15 1 16 ! 11 104 i 5 . 6 5 !
28 | 29 1 19 20
14 1 14 j 8 9 !14 i 15 ; 10 ! 11 !
79 ; 83 ! 44 \ 47 I5 5 '. 8 ! 8
13 12 7 ; 7 !5 6 4 '; 4 !4 4 2 2 i
52 i 56 : 23 ! 26 :176 I 18<» ; 108 i 116 ;
44 ; 50 '• 28 ;. 3028 i 30 1 15 I 17
104 • 109 65 ' 69 •! i ; i i ;
[ 31 i 32 i 21 1 24 ;
268 ! 262 ' 124 , 128 i126 i 128 j 55 1 62 I
j 142 133 ; 69 | 66 j
152 164 i 107 124 j
109 114 i 53 ! 56I i 1 ! !
32 ; 37 ! 22 ! 23 i
ling Table 55. — Colorado
963 1961 1962
834 4,340 4,618
520 2, 824 2, 99717 54 5259 85 76
1 8 836 35 3421 41 3453 248 22640 515 1 53882 567 60017 129 1449 64 688 65 ! 76
56 160 ! 16540 59 i 60
9 1 60 1 656 40 i 40
21 98 103
9 54 5712 43 4643 ': 335 i 360
9 i 24 ! 2(57 : 00 1 624 I 43 i 482 : 19 1 20
22 i 189 l: 211132 | 633 ! 720
38 ! 206 I 22219 i 123 i 1(5375 ! 304 1 342
i 1 i 1
24 93 101
126 i 636 | 61561 i 175 1 15465 ! 461 462
134 566 I 672
57 ! 326 345
26 105 112
1963
4,831
3, 15647768
3435
236560628154
81167606838
109
614S
i 3S?
i 62i 48i 20! 226i 7941 2431 165i 386| 1
i 108
i 603i 134
469i• 7^7
1 366j
129
Table 56.— Utah
1961
1, 839
1, 300148414125891
9~4
240; 59
262682
1 45i 27i 10i 39
2118: 102
i 19i is1 51J 321I 164! 22
136( 3 )
; 52
1 191i 32
159
230
| 126
59
1962
1,999
1,4251482111160
114302262
54
9~
8546291041
2219
110
20198
5636117624
161! (3.)
56
! 21848
170
234
131
64
1963
2, 083
1,494
119
581113182835628298846311242
i 2320
; 117
20! 20
861
! 387j 191
1 171; (3)
; 60
! 210! 38
172
252
141
74
Table 57.— Far West
1901 1 1902 j 1903
57,748 61,907 65,706
38,680 i 41,823 i 44,570681 ; 652 ! 040950 ! '>54 i .),;•>
1 1 1 ! 1146 147 i 15110° 105 ! 110
2, 503 2, 777 ! 3 07810,366 11,344 I 11,873
7,140 7,681 ! 8.2081. 778 1,921 i 2 081
803 853 1 925975 1,068 : 1, 156
1,872 1,973 i 2.046550 559 i 557616 674 717706 ! 740 772
1,078 j 1. 146 ; 1.223
69S 742 7x93^0 : 405 ' 433
4. 720 ' 5, 134 ! 5, 5012*0 ; 302 ! 31 S808 i 1)14 i 945996 ! 1.130 i 1.223720 : 744 ! 700
1,848 : 2,039 ; 2, 2498, 079 S, 7*1 ! 9, 4902,02s 2, 107 ; 2.2461, 554 1,051 1, 0084, 495 5, 024 5. 5S2
153 159 ; 1(52
| 1,439 1,547 1,680
6,645 7,026 7,163; 1.240 1,349 1,242
5, 405 5, 677 5. 920
7,750 ; 8,172 ! 8,793
4,729 4,965 5,386
1,495 1,626 1,885
[Millions of dollars]
Item
Personal income
Wage and salary disbursementsFarmsM in ing
Bituminous and other soft coal miningOrude petroleum and natural s'asMining and quarrying, except fuel
Contract construction _ _ _ _ _ManufacturingWholesale and retail tradeFinance, insurance, and real estate. .
Ban kin0" and other financeInsurance and real estate
TransDortation .Railroad^Highway freight and warehousing.. __ _Other transportation
Communications and public utilitiesTelephone, telegraph, and other communi-
cations.Electric, gas, and other public utilities ..
ServicesHotels and other lodging placesPersonal services and private households. ...Business and repair services\-inusement and recreationProfessional, social, and related services
GovernmentFederal civilianFederal military ..State and local
Other industries -
Other labor income
Proprietor's incomeFarm - - - -I\ronfarm
Property income
Transfer payments
Less: Personal contributions for social insur-ance.
Table 58.—Washington
1961
6,946
4, 689741211
11312
1 32786419482
112271
9271
10811081
30403
25746623
2161, 100
32024753499
166
811188023
857
588
166
1962
7,426
5,070 1701311
11309
1,479935212"871252849379
11311880
32449
29797333
2301,179
307273
i 59922
183
868i 213
055
890
593
177
Table 59.—Oregon
19(53 1901
7,575
5, 1607413
111
3071,486
96322392
1302949381
12011985
34451
20770925
2551,203
321245037
26
195
836180050
| 957
626
199
4,083
2, 584556
6
11055056
1677658349151
4024716493713
•33248812533
3296
101
615113502
535
356
107
1962
4, 324
2,75859 !
( 3 ) _
160783561112
52 ;
601767864349854
45266
18504114
14452313034
3606
108
647118529
566
360
115
1903
4, 568
2, 948588
( ; ; )
19782660!)1205665
184780937
10054
46283
19514514
15456514435
3866
114
656106551
609
375
134
Table GO.—Nevada
1961
911
655^s
'>()
(?)207031
108199
103718109
2013
2065817238820
135373404
(3)
22
978
89
108
50
21
1 962
1,104
8069
20
(3)20
11134
132241113401911
M15
8265
641953
10326
147413571
(3)
23
12410
114
124
51
24
19(53
1, 246
9209
21
(3)20
14639
150341419431812122918
10281
682143
11731
170463787
(3)
27
13710
127
136
57
30
Table 61.—California
1961
45, 808
30, 752544
14666
2, 0288, 2675,6431,460
662798
1,398364478556850554
3023,864
181729870603
1,4816, 3561,5471,2413. 568
124
1, 150
5, 122931
4,191
6,250
3, 735
1,201
1962
49, 053
33,190514215
14668
2, 1909.0486, 0531, 573
704869
1, 473370520583906587
3194,154
191767969594
1, 6330, 9331, 6301, 3093, 994
131
1,232
5, 3881,0094,379
6, 592
3, 961
1, 309
1 963
52, 317
35,512499220
15070
2, 4289, 5216, 4951, 704
763942
1, 526368555603975632
3444,486
205796
1. 066609
1. 8097,5581,7351, 3514, 472
! 130
1, 343
5, 533941
! 4, 592
7,091
4,329
1,522
Table 62.—Hawaii
1961
1,521
1, 132701
1962
1, 587
1,18468
( 3 )
\i (=0
104 i 94113 i 115172 I 182
42 ' 4820 ' 2422 ; 2444 47
8362915
14112
1619189
50442148180114
3
42
13211
121
179
70
33
8393115
16122
1722209
54475152192131
3
43
13211
121
185
78
35
1963
1,667
1,24266
(3)
(3)98
12019251262549
8403316
171292024208
57502160203139
2
43
14011
129
198
83
39
Table r,2A.—Alaska
1 j1961 j 1962 1 1963
628 661 704
515 1 539 578(3) 1 (3) , ( 3 >
10 j 10 109 ! 2 • §>
4 ! 5 ; 63 ! 3 i 2
34 1 35 i 3828 ! 25 i 2656 : 57 ! 6210 12 ! 14
5 , 6 ! 7
29 '• 30 i 311 • i ; i7 7 8
92 1 ->9 • 9931 i 29 2827 ! 25 ! 24
3 ; 4 ! 532 : 36 i 37
4 ^ 4 i 44 4 1 49 i 12 ! 121 ! 1 1 1
14 i 14 i 15279 ! 299 \ 325105 j 110 j 120120 i 121 i 127
54 '. 68 i 7K0 6 i 0
15 16 i 18
47 51 522 2 i 2
45 : 49 ' 50
39 i 44 ; 47
28 28 28
16 17 18
1. Data for 1929-53 are published in "Personal Income by States Since 1929," A Supplement to the Surrey of Current Business; for 1954-56 in August 1959 Survey; for 1957 in August 1960Survey; for 1958 in August 1961 Survey; for 1959 in August 1962 Survey; and for I960 in August 1962 Surrey.
2. Totals include Alaska and Hawaii from 1960 forward.3. Less than $500,000.NOTE.—Detail will not add due to rounding.
Digitized for FRASER http://fraser.stlouisfed.org/ Federal Reserve Bank of St. Louis

August 11 KM SURVEY OF CUEEENT BUSINESS 23
Table 63.—Broad Industrial Sources of Personal Income, by States and Regions, 1963 l
Table 70.— Industrial Sources of Civilian Income Received by Persons for Participation in Current Production,by States and Regions, 1963 l
[Millions of dollars]
StaU- and region
Table 03 Table 70
Totalpersonalincome
Farmin-
come l
Governmentincome
disbursements ~2
FederalStateand
local
Privatenonfarmincome 3
Total ! Farms I MiningContract i Mann- sale andconstrue-; fac- j retail
tion l turing j trade
Finance, Com-insur- Trans- j munica- '. Serv- > Gov-ance, ! pqrta- j t i o n s a n d j ices ; ern-
andrea l ! tion ; public ; ; ment ;estate ! ; utilities ;
United States-
New England.
461,610 15,718 54,283 37,039 354,570 ! ! 363,707 ! 16,005 \
29,780
MaineNew Hampshire _Vermont _ -
MassachusettsRhode IslandConnecticut
14,
S,
113,
DelawareM ar y landDistrict of Columbia-_
Great Lakes
3,563 2,152 1 23,838 | ! 22,761 230
1138
2,015 i345 i589 j
16110066
1,146164515
1,4441, 127
631
11,6691,6387, 329
1,4561,096
632
12,634 I 8,604 j 91,521
366 i108 I269
4,6401,231 !1,847
97,073 2,503
130 I1,903 |1, 126 i
8,448 !
1,601 !
' 997 i
43,720 M15,757 1 122,826 1 1
1.319 I6,516 |1,383||
78,995 I I
l 020 |1,617 i
828 i405 814
Plains 36,534 | 3,595 i 4,001
MinnesotaIowaMissouriNorth Dakota._
South Dakota._NebraskaKansas
8,152 i0,399 !
10,900 i1,300 |
1,390 i3,376 i5,017
i280 !445 |477
744612
1,181 j' 180 I
195 !433 j656
7,127
1,770 j1,691 !
819 I
2,852 i 26,086 I
j 8 /b
41,166 37315,286 I 11021,957 i 275
11,1.13 ! 317,242 j 871,853 !
|78,921 2,517
16,951 34520,362 j 4119,762 i 537
3,656
729494713115
120255426
6.056 I4,349 |8,469 j
716 i
Southeast- 74,360 i 4,212 j 11,369 | 6,095
VirginiaWest Virginia.Kentucky
TennesseeNorth Carolina.South Carolina,.
8,907 i3,348 |5,545
6,5888, 6013,944
17938
440
2,109404840
607291437
52,684
322 i 818676 ! 1,066215 I 639
Georgia...Florida....Alabama..
Mississippi..Louisiana. _ .Arkansas
367515300
448284428
1. 2181,742
944 j
475 i(580434 |
584955490
290674238
4, 9066, 1572,805
5,5468,721 !3,804 i
1,970 I4,434 i1,886 |
28,983
, 100!, 640!, 863
58,045 ! 4,287j
7,015 j 1832,654 j 394,337 I 447
5,348 j 3276,886 ! 6863, 090 ! 218
6,094 ! 3738,502 i 5274,501 | 305
2,525 |4, 749 |2,344 |
450290436
31,502 j 1,716
OklahomaTexasNew Mexico.Arizona
Rocky Mountain.
Montana..IdahoWyoming.
Colorado...Utah
4,85821, 351
1, 9533,340
10, 667
1, 5531, 366
834
Far West..
Washington..OregonNevadaCalifornia
4,8312, 083
65,706
7,5754, 5681,246
52, 317
2421,115
132227
683
20816977
17851
1,845
25616118
1,410
Alaska..Hawaii..
7041, 667
4,283 ! 2,620 22,883 ! i 24,604 I 1,747
7742, 730347432
1,507
666330
7,778
1, 072497127
6,082
267433
4641, 617220319
992 j
14412281
461184
6,370
71542394
5,138
80147
3,37815, 8891, 2542, 362
7,485
3,714 I 24716,664 i 1,1351,556 I 1342,670 | 231
I8,383 i 696
1,218 ! 2121.090 | 172647 ! 78
3,5261, 518
49, 713
5, 5323,4871,007
39, 687
3551,010
51,660 i 1,887
5, 9333,6751,046
41, 006
518 |1.215 !
448
23,149 106,263 | 69,308 j
1,306 8,365 j 4,074 j• I I
84 i 477 j65 407 !39 17
60794
417
4,989 27,544 j 16,947
19,024 |
1,303 |
16,922 |
677 j
60 |3124
2,192969
1. 117
9053883
11, 0245, 7558, 594
4881,631 I
4,216 i 31,281 | 14,074
8, 824 !2,718 j3, 701 |
165 I1, 285 !
254 i
I
833 ;1,063483 ;1, 381 |
456 :
7,681 !8, 523 I4,105 !
2,756 !3.482 I1,645
4, 801 !1,390
1,5171,1002, 386
3S
1,306 !996
1,808 I232
101187
234582 |782 i
330 '217 i455 !
43 [
42 !147 !160
3,903 j 14,382 i 11,087
513127327
330401185
375748
1,483803
1,122i
1,644 i2,237 i1,111 !
1,6331, 190 !1,250 |
542 '869498
1, 287418731
1,0241, 226
504
245 '288 i137 |
336 |653 !194 !
457932396
2631. 168129261
333152 I
4,110 | 5,160
7793,617
265499
216210 |105
804342
1,306
13517848
603342
190914
79150
394
4,022 12,887 10,023
396285173
3,168
41116
1, 59990443
10, 341
138
1,192789182
7, 860
77249
31118559
2,438
1959
5,373 : 4,288
1,900 ;799 :
1, 142
40346
74
3,322 : 3,545 •
557 512 '813 979 i372 i 421
1.337290
2,012 | 6,221 I 5,940 1,394 j 1,625 |
40101244
2,834 | 2,719
328 \ 36081 ! 167
154 ! 227
25128681
312373178
84285115
1,333 | 1,260
1859346576
20574
2,993 2,236
32420746
1. 659
3455
10,135
643
453118
32847
174
49,204
3,387
1, 807 i198 i889
48,135
2,628
210150
1.416219 !
2,680 13,565 • 11,675
1.300 0,975428 2, 180072 2.806
2,014 i 9,034
1.837 :
2,305 i'888 I
3, 143 '801
808 ; 3,517 i 3,455
874
8,212
1. 8772, 074
982
836 !592 i
1,085 !108 j
30 !69 iIll i
1,519 |
179 !108 !
114 |j
96 !144 i66 |
170 |228120 I
6815868
453 ;
7,261 !
939 |272 1486 i
648 !
767 :362 I
671 i1,419 !
508 I
267676246
817 i567 f903 |145 |
164 !335 :524
8,680 !
1,628302552
743813412
870 ;1,230 ;
829 '
346 ;669 i286
791 j 3,362 i 3,635
119 I519 i
60 !93 1
4912,173
265433
260 1,063
o- i
32 i23 |
12147 (
1,351 j
132114 j
32 j1.073 !
13713966
702470334
6. 278
52179 ;
626 :2,223 i
349437
1,473 S
199 I160 i114 !
!634 j366
7,875 1
964 i533134
6.244 <
200302 •'
1,295
116
189
6130
16
82
79
251
334
11
8238
396210
122714
85
18546
38141
257
213
Footnotes to Table 63:1. Consists of net income of farm proprietors, farm wages, and farm "other" labor income,
less personal contributions under the OASI program.2. Consists of income disbursed directly to persons by the Federal and State and local
governments. Comprises wages and salaries (net of employee contributions for Social insur-ance), other labor income, interest and transfer payments.
3. Equals total personal income less farm income and government income disbursements.Note.-—U.S. totals include Alaska and Hawaii.
Footnotes to Table 70:1. Consists of wage and salary disbursements, other labor income, and proprietors' income.2. Does not include earnings of military personnel.3. Less than $500,000.NOTE.—U.S. totals include Alaska and Hawaii.
Digitized for FRASER http://fraser.stlouisfed.org/ Federal Reserve Bank of St. Louis

24 SURVEY OF CURRENT BUSINESS August 11)04
(Continued from page If)
for the year, or $1.9 billion if the specialissues of $702 million are not countedas liquid.
The remainder of the aggregate in-crease of $2.6 billion in foreign hold-ings consisted primarily of an increaseof over $450 million in various U.S.Government liabilities, of which thelargest were advances by foreign gov-ernments on military purchases here,special nonmarketable obligations is-sued to international organizations inconnection with subscriptions, and non-marketable nonconvertible issues heldby foreign governments.
Overall Investment Position
The statement of international assetsand liabilities shown in table 12 is oftenused as a measure of internationalfinancial strength of the United States.Although the sum total of U.S. foreignassets exceeds the sum of foreign hold-ings here by nearly $37 billion (notincluding as an asset the U.S. goldstock), the types of assets and liabilities,and their valuations, are so differentthat the net difference, without qualifi-cations, has little significance. This isespecially so when comparisons aremade over a long period of time.
On the asset side, a comparison of1963 with 1950 shows that while privateforeign investments have expanded by$47 billion, the gold stock has declinedover $7 billion, and the increase of $9.3billion in U.S. Government assets in-cludes over $6 billion payable in foreigncurrencies of limited usefulness. De-ducting these amounts gives an adjustedincrease in private and Governmentassets of $44 billion. On the liabilitiesside the overall increase from 1950 wasabout $34 billion, so that the adjustedincrease in net foreign assets after 1950would be about $10 billion.
The 1950-63 expansion of U.S. assetsabroad was largely in direct investments($29 billion). While it is probably truethat the book values used are lower thanthe replacement cost of assets or marketvaluations of the enterprises, the extentof the difference would vary so muchamong industries and areas that nooverall evaluation can be made.
On the other hand, the increase offoreign assets in the United States since1950 was largely in short-term assetsand Government obligations ($19 bil-lion) and in corporate stocks ($9.6 bil-lion), with a smaller increase in directinvestments ($4.6 billion). Of the in-crease in the holdings of corporatestocks, about $2 billion represented netforeign purchases in the period and theremainder resulted from rising marketvaluations.
Another approach to an evaluationof the significance of the changes in thedebtor-creditor position involves a com-parison of the earnings derived frominvestments. Earnings of U.S. privateinvestments abroad rose from $2 billionID 1950 to $5.6 billion in 1963, whilecomparable foreign earnings ID theUnited States rose from $500 millionto $1 billion. On this basis there wasclearly a considerable strengthening ofthe U.S. international position.
Table 12.—International Investment Position of the United States, Total 1950, by Area1962-63
[Millions of dollars]
Type of investment
U.S. assets and investments abroad,total
Gold vtock (not included in totdl)
Private investments
Lone-ten n
DirectForeign dollar bondsOther foreign 1 tone's 2
Foreign corporate stocksBanking claimsOther
Reported by 1 tanksOther
U.S. Government credits andclaims
Long-term credits :i
Repayable in dollars 4
Repayable in foreign curren-cies etc 5
Foreign currencies and short-term claims. _
IMF gold tranche position andmonetary author i t ies ' hold-ings of convertible currencies
Foreign assets and investments inthe United States, total
Long-term
DirectCorporate stocksCorporate, s tate , and munici-
pal bondsOther
Short-term assets and U.S. Gov-ernment obligations
Private obligations
Reported bv banksOther
U.S. Government obligations. _
Bills and certificatesMarketable bonds and notes.Nonmarketable bonds and
notesOthe r - ..
Total
1950
31,539
'92 820
19,004
17. 488
11,7881, 6921 4601,175
390977
1, 516
886630
1962 r
80,343
16, 057
60,025
52. 732
37. 2206. 348
8004,714l.%01 678
7, 293
5, 1012 19°
WesternEurope
1963 p 1962 r
88,15422,409
15 -596
66,366
58, 256
40, 6457, 35f
14, 524
12, 959
8, 930534
595. 145 2. 1132, 8151 520
8,110
5,8489 2(5'->
12,53520,31821,788
10 768 ! 16. 042H7. 146
n. a.
n.a.
322
1,445
17,635
7,997
3, 3912, 925
1811, 500
9,638
6,477
5, 751726
3,161
1,5081,470
183
n.a.
n.a.
3,113
1,163
46,280
20, 216
7, 61210, 336
6571,611
26. 064
13, 344
12 579765
12, 720
9,3792,110
251980
13, 160
3, 986
3, 395
1,247
51,478
22, 794
7,94412, 485
7021, 663
28, 684
14,878
14, 128750
13, 806
8,72062,742
8931,451
1963 P
24,818
16, 993
15, 352
10, 35177960
2. 319577 1,081746 762
1,565 1,641
869 912696 729
7,885 7,825j
7.211! 7.029
n.a.
n.a.
578
96
26,490
14, 369
5. 2457,697
439988
12, 121
5,321
4,936385
6,800
5,237708
251604
5, 992
1,037
587
209
29,876
16, 237
5,4919, 307
460979
13, 639
5, 827
5,414413
7,812
5, 348e 741
768955
Canada
1962 r
19,915
1963 P
21,574
LatinAmericanRepu )lics
1962 '
15,222
Otherforeign
countries
1963 P 1962 r
15,743
1963 f
17,90421,110
19,90821,568 12, 111 12,368 10,645
18, 612 20, 255 10, 185 10, 380 8, 140
12,13313,016; 8,424! 8,657! 6,0923,289! 3, 861 i 335! 358^ 1.104
551 596; 24! 24 692,3011 2.46li 64; 65i 236
104234
1, 296
526770
7
75246
1,313
611702
6
4
3
7,350
3,520
2,0641, 242
(*}214
3. 830
1,899
1,80990
1,931
1,540389
3
3
7,767
3,884
2,1831,490
(')211
3,883
2,018
1,93781
1,865
1,0516687
19S1 2 2
878460
1, 926
1,535391
3,111
2, 922
n.a.
n a
189
4,018
1, 223
141785
76221
2, 795
2,431
2,291140
364
93125
965311
1,988
1,588400
3,375
3, 133
2,871
262
242
4, 789
1,393
112935
77269
3,396
2,901
2,786115
495
225698
146 172
401238
2, 505
2. 171334
7,259
4.940
n.a.
n.a
2, 319
5,444
953
162563
40188
4,491
3,170
3,020150
1, 321
1,15589
77
12,630
9, 463
6, 8891,284
95300694201
3, 167
2, 737430
8,480
5, 942
3, 255
*> 687
2, 538
6,111
1, 097
158687
48204
5,014
3, 675
3,534141
1,339
1,142682
115
Interna-t ional insti-tutions andunallocated
1962 r
4,893
2,837
2, 836
1 1,6471, 0862 103
1
(*)1
2, 056
909
n.a.
n a
23
1, 064
2,978
151
49
102
2, 827
523
523(*)
2,304
1,354799
151
1963p
4,909
2,807
2, 806
1 1 , 7321 , 074
1
_
2,102
1,042
1,042
2.5
1,035
2, 935
183
_ _ _ _ _ _
117
2, 752
457
4570)
2, 295
95461,134
207
• Revised. 1 Preliminary. na Not available. (*) Negligible.1. Represents the estimated investment in shipping companies registered primarily in Panama and Liberia.2. Consists primarily of securities payable in foreign currencies, but includes some dollar obligations including through
1962 participations and loans made by the International Bank for Reconstruction and Development. Subsequent to 1962participations in IBRD loans are included under banking claims and "other" long term, according to country of obligor.
3. Excludes World War I debts that are not currently being serviced.4. Includes indebtedness repayable in U.S. dollars, or optionally in foreign currencies when option rests with U.S. Gov-
ernment.5. Includes indebtedness which the borrower may contractually, or at its option, repay with its currency, with a third
country's currency, or by delivery of materials or transfer of services.6. New series "based on a Federal Reserve Board survey as of July 31, 1963. Data to reconcile the old arid new series are
not available.7. Includes non-interest-bearing demand notes issued in payment of subscriptions to international and regional organi-
zations (other than IMF) , portfolio fund certificates sold abroad by Export-Import Bank, liabilities associated with Govern-ment grant and capital transactions (including restricted accounts), and advances for military exports and other governmentsales. '
Digitized for FRASER http://fraser.stlouisfed.org/ Federal Reserve Bank of St. Louis

BUSINESS STATISTICSA HE STATISTICS here update series published in the 1963 edition of BUSINESS STATISTICS, biennial Statistical Supplement to the SURVEY
OF CURRENT BUSINESS. That volume (price $2.00) contains data by months, or quarters, for the years 1959 through 1962 (1951-62, for majorquarterly series) and averages of monthly or quarterly data for all years back to 1939; it also provides a description of each series and referencesto sources of earlier figures. Series added or significantly revised after the 1963 BUSINESS STATISTICS went to press are indicated by an asterisk(*) and a dagger (f) , respectively; certain revisions for 1962 issued too late for inclusion in the aforementioned volume appear in the monthlySURVEY beginning with the August 1963 issue. Also, unless otherwise noted, revised monthly data (for periods not shown herein) correspondingto revised monthly averages are available upon request. Except as otherwise stated, the terms ''unadjusted" and "adjusted" refer to adjustmentfor seasonal variation.
Statistics originating in Government agencies are not copyrighted and may be reprinted freely,through the courtesy of the compilers, and are subject to their copyrights.
Data from private sources are provided
Unless otherwise stated, statistics through 1962and descriptive notes are shown in the 1963edition of BUSINESS STATISTICS
1961 | 1962 | 1963
Annual total
1961
III IV
1962
I II III IV
( '•'' ' 1963
I II
Seasonally adjusted quarterly totals at
III | IV
1964
I II III
annual rates
GENERAL BUSINESS INDICATORS—Quarterly Series
NATIONAL INCOME AND PRODUCT
National income, totalf bil. $--
Conipencation of employees, total do
W'i(Tes and salaries total do _ .Private -- ^°- --"Military - -- d°Government civilian do_
Supplements to wages and salaries doProprietors' income totalcf do
Business and professionalc? _ do_Farm d°
Rental income of persons doCorporate profits and inventory valuation adjust-
ment total - _bil. $
Corporate profits before tax, total. _.do_ __Corporate profits tax liability doCorporate profits after tax _ _do_
Dividends doUndistributed, profits do
Inventory valuation adjustment do.
Net interest do
Gro^s national product, totalf _- do
Personal consumption expenditures, total. .do
I)urable goods, total© doAutomobiles and parts. _. _ _ -do_ _.Furniture and household equipment. _.do
Nondurable goods, total © _ _ doClothing and shoes _ _ d o _ __Food and alcoholic beverages ..doGasoline and oil .do. _
Services, total© _ _ doHousehold operation do_ _.Rousing doTransportation. do
Gross private domestic investment, total do
New construction ...do. .Residential nonfarm do
Producers' durable equipment doChange in business inventories do
Nonfarm . do_-
Net exports of goods and services _ _ do_Exports . . . doImports do
Govt. purchases of goods and services, totaL.doFederal (less Government sales) do.
National defense 9 doState and local do
By major type of product:fFinal sales, total do
Goods, total doDurable goods doNondurable goods do
Services doConstruction do
Inventory change, total doDurable goods doNondurable goods do
426. 9
! 302. 2
278. 8227.010.241.623.448.235. 312.912.2
44.1
44.222.321.915.26.7-.1
20.1
518.7
337. 3
43 717. 119.3
155.428.781.311.9
138 320.444 210.7
68. 8
41 021 125.91.91.5
4.627 623.0
108.057 449 o50 6
516. 8257 994.5
163. 4200 858 1
1.9J !
2.0 '
455. 6
323. 1
297.1241. 610.844.725.949.836.613.212.2
48.4
48.223.225.016.58.5.3
22.1
556. 2
356.8
48.420.620.2
162.029.984.612.3
146.421.646.511.3
79.1
44 223 629.05.95.3
4.099 225.2
116.362 953 653 5
550. 3273 6102.3171.3214 762 0
5.93 02.' 9
478.5
340.3
312.1252. 910.948.328.250.637. 613.012.3
50.8
51.324.626.718. 08.7-.4
24.4
583.9
375.0
52.122.721.4
167.530.787.112.8
155 322.748 911.7
82.0
46 695 231.04.43.9
4.430 726.3
122.664 755 257 9
579. 59g5 g
108. 2177.6998 465 2
4.4
2 9
429. 7
304.7
281. 1228.910.042.223.648.535. 712.812.2
44.0
44.322.322.015.16.9-.3
20.4
522. 4
339.1
44 317.419.5
155. 728.781.411.9
139 120.644 410.7
71.3
41 321 526.33.73 3
4.227 823.7
107.957 148 650 9
518.7258 895.4
163. 4901 8
co 9
3.79 ^
I!4
442.4
310.7
286.8233.2
10.842.823.949. 636.313.312. 2
49.0
49.324.824.515.78.8-.3
20.9
536.9
345. 2
46 018 619.9
157 829. 482.212.0
141 420 945 o10.8
74.9
41 992 1
27.45.65 2
4.328 424.1
112. 659 850 952 8
531. 4264 898.4
166. 59QfJ g
CQ 7
5.63c\2. 0
447.2
316.6
291.2236. 511.143. 625. 450. 036. 313.712.2
47.1
47.222.724.516.18.4-.1
21.3
545.5
350.5
47 419 720.1
159 529 683.212 2
143 621 345 611. 1
77.4
42 522 528.16.96 4
3 428 024.6
114.361 459 5Pj9 g
538. 79('0 Q
100. 2168. 791Q A
6.90 Q
2.9 '
454.3
322.4
296. 6241. 511.044.125 849. 936. 613.312.2
48.0
47.923 024.916.48.5.0
21.8
553 4
354.0
47 720 319.9
161 029 784.112 2
145 321 346 211 2
78.9
44 123 528.86.15 5
4 329 625.3
116.163 655 3co r
547.39""} £,
103. 5170. 091 9 9
6.1
3.0
457.8
325.3
299.2243. 510.745.026 149. 736. 713 012.2
48.3
48.123 125.016.58.5.1
22 3
559 0
358.5
48 420 520.3
162 930 085 212 3
147 221 746 811 4
80.2
45 524 429.65.14 4
4 429 725.3
115. 969 453 0CO C
554. 0
101.4172.6
5.1
2.0
463. 2
328.0
301.6244.810.546.326 449 736. 912 812 2
50.3
49 423 825 717.18 6.9
22 9
566 6
364.0
50 221 820.6
164 430 285 912 5
149 522 047 511 5
79.9
44 904 o29.75.44 8
3 929 425.5
118.763 8CO C
561. 2
104.1174.1
5.4
3.6
467.9
332.7
305.3247.510.647.297 450 337 113 212 3
49 1
48 923 425 517.28 3
2
23 5
571 8
369.2
51 12? 420.8
166 030 486 412 7
152 129 448 011 6
77.9
44 724 329.63.6.3 0
3 490 Q
25.4
121.465 1
568. 2
105. 0175.8
3.6 |
2.0
474.6
338.1
310. 1251. 610.747.827 9
50 137 312 812 3
50 2
51 124 526 617.78 9
— 9
24 0
577 4
372.0
51 522 621.0
166 630 186 912 8
153 922 448 6117
80.2
45 925 130.73.63 2
4 3OA K
26.3
120. 9A4 ^
573. 7
111.0175.5
63. 7
3.62:i
481.9
342.7
314 3255. 0
10.748 79S 450 737 812 912 4
51 4
51 324 526*717.98 9
2
24 7
587 2
377.4
/y? 229 (521.6
168 631 387 312 9
156 62° 949 211 7
82.8
47 225 431.44.23 7
4 2O1 A
26.8
122.8(\A A
583. 0285. 7106. 6179. 1
66. 2
4.2
2.7
490.0
347.7
318 8257. 6
11. 749 6°8 8
51 538 313 9
12 4
53 1
54 39fi 09g 319.19 2
— 1 2
25 4
599 0
381. 3
53 693 922.3
168 930 987 813 0
158 893 Q
49 811 8
87.1
48 39A 9
32.46.46 0
5 8
26.9
124.8
59. 9
592. 6290. 3110.4179.9
67.8
6.43. 03.4
498.4
35° 5
393 2°60 8
11.750 799 4
51 9
38 6I9 612 4
56 4
56 695 431 9
19. 411 8— 2
25 9
608 8
390.0
55 994 323.1
172 932 189 713 3
161 193 c
12 0
85.9
4Q 9
34.22.59 9
ol' r
26.8
125.2
60. 9
606. 4
114.3183.9239. 668. 6
2. 5.7
1.8
"506 6
358 6
328 79 65 3
11 751 799 9
51 739 iI9 6I9 4
f 57 4
*>r>7 47>95 8P31 7pl9. 8f'll 9
1
26 5
r g;[g (J
r 396. 1
r C7 A
94 1
24.2T 1 7r o
33 290 613 5
94. n
I9 2r87. 2
r 34. 6
r 5 7
r 27. 9r 129. 6
57. 062. 5
614.9304. 3119.01S5. 4241.768. 9
3.7
1.2
. _
r Revised, p Preliminary, f Revised series. Estimates of national income and productand personal income have been revised back to 1961 (see p. 8 ff. of the July 1964 SURVEY);revisions prior to May 1963 for personal income appear on p. 15 of the July 1964 SURVEY
eflncludes inventory valuation adjustment.9 Government sales are not deducted.
parately.
S-lDigitized for FRASER http://fraser.stlouisfed.org/ Federal Reserve Bank of St. Louis

S-2 SUKVEY OF CURRENT BUSINESS August l!M'i4
Unless otherwise stated, statistics through 1962and descriptive notes fire shown in the 1963edition of BUSINESS STATISTICS
1961 1 1962 1 1963
Annual total
1961
III IV
1962
I II III IV
1963
I II III IV
1964
1 II III
GENERAL BUSINESS INDICATORS—Quarterly Series—Continued
NATIONAL INCOME AND PRODUCT— Con.Quarterly Data Seasonally Adjusted at Annual Rates
GNP in constant (1954) dollarsG-ross national product totalf bil. $
Personal consumption expenditures, total.. do
Durable goods doNondurable goods - doServices do
Gross private domestic investment total do
New construction doProducers' durable equipment - doChange In business Inventories do
Net exports of goods and services do
Govt. purchases of goods and services, totaL.doFederal doState and local do
DISPOSITION OF PERSONAL INCOMEfQuarterly Data Seasonally Adjusted at Annual RatesPersonal Income total bll. $T/ess1 Personal tax and nontax pavments _ doFqiials1 Disposable personal Income _ _ d o
Personal saving § doNEW PLANT AND EQUIPMENT
EXPENDITUREStin ad justed quarterly or annual totals:
All industries bll. $ .
Manufacturing - doDurable goods Industries doNondurable goods Industries _ do _ _
Mining doRailroads -- do_ __Transportation, other than rail _ _ . doPublic utilities doCommunications doCommercial and other do
Seas. adj. qtrly. totals at annual rates:
r> hi rf~1 dnstrles do' uraLue goo , , ., r~.~ -,
T? 11 n doj-taiiroat. a- -- -- ,-L rf.t-i /\n
Public utilities do
BUSINESS POPULATIONFirms In operation, end of quarter (seasonally ad-
justed) - thous
U.S. BALANCE OF INTERNATIONALPAYMENTScft
Quarterly Data are Seasonally Adjusted
Imports:Merchandise. - doMilitary expenditures doOther services do
Remittances and pensions doGovt. grants and capital outflows do
Direct investments ...doTvong-term portfolio doShort-term ..do
\i ^ receipts recorded do
Exports:Merchandise doServices and military sales do
Foreign capital other than liquid funds (net). do
Excess of recorded receipts or payments (— ) .. .doUnrecorded transactions (net) do
Total net receipts or payments ( — ) do__Net receipts or payments (— ), incl. transactions in
non marketable, medium-term convertible Govt.
447.9
303. 8
41.4143. 5118.9
57.4
34.321.41.7
2.5
84.344.839.4
417.652.9
364.7
27.3
34. 37
13.686.277.40
.98
.671.855. 523.228.46
< 4, 713
31,791
14,4972,9545, 401
7054,054
4,1801,5991, 0251, 556
30, 419
19,9138, 525
1.274707
-1,372-998
-2,370
476.4
318.5
45.7148.3124.5
65.9
36.724. 05.2
2.2
89.849.440.3
442.457.9
384. 6
27.8
37.31
14.687.037.65
1.08.85
2.075.483.639.52
*4,755
33, 486
16, 1343, 0445, 843
7384,293
3, 4341,6541,227
553
32, 394
20, 5769, 508
1,2801,030
— 1,092-1,111
-2,203
492. 6
330. 6
49.3151. 6129. 7
67.7
37.925. 64.1
2.2
92.149.742.4
464.161. 6
402. 5
27.5
39.22
15.697.857.84
1.041.101.925.653.79
10.03
4 4, 797
35, 710
16, 9312,8976, 332
8264, 522
4,2021,8621,644
696
33, 352
21,9389, 735
969710
-2,358-286
-2,644
-1.942
450. 6
305. 1
41.8143.9119.4
59.4
34.621.63.2
2.0
84.044.639.4
420. 653.3
367. 3
28.2
8.65
3.341.501.84
.25
.16
.471.50
.782.16
34.70
13.656.107.55
1.00.65
1.905.653.208.60
4, 760
8, 005
3, 826695
1,346
1741,034
930435259236
7,262
4, 9872, 134
9942
— 74343
-700
462. 5
310. 0
43.7145. 6120. 8
62.7
35.299 7
^8
2.1
87.747.040. 7
428. 654.4
374. 2
29.1
9.54
3.881.792.09
.26
. 16
. 501.54
.882.32
35.40
14.006.407.60
1.00.60
1.955.553.359.00
4, 770
8,616
3, 881714
1,389
1741, 206
1,252377445430
7,717
5, 1212,187
196213
-899-332
-1,231
469. 1
314.2
44.8146.6122.7
64.8
35.523. 26.1
1.3
88 848.440.4
434.756. 1
378. 5
28.0
8.02
3.141.441.69
.26
.16
.471.06.88
2.06
35. 70
14.206.557. 60
1.15.70
2. 055.153.708.75
4, 780
8,447
3, 948758
1,412
1871,074
1 , 068260390418
7, 706
5, 0322,198
150326
-741
-748
475.1
316. 6
44.9147.8123.8
65.8
36. 623.85.4
2.8
89.950.239.8
441. 057.6
383. 4
29.4
9.50
3.691.771.92
.27
.26
.601.37.93
2.37
36.95
14.456.957.50
1.05.95
2.255.403.659.25
4,790
8,151
4, 058749
1,462
1891,065
628446303
-121
7, 925
5. 2372, 397
23754
—226-214
-440
478. 3
319.8
45. 6149. 1125.0
66.3
37.524.44.4
2.8
89.449.240.2
444. 558. 5
386,0
27.5
9.62
3.721.791.93
.28
.24
.501.54.87
2.48
38.35
15.057.257.80
1.101.002.005.753.609.85
4,800
8, 312
4,088745
1 , 465
1771,066
771417208146
8, 408
5, 2882. 339
606175
96-430
-334
483.0
323. 6
47.6149.5126. 5
66. 5
37.024.74.9
2.1
90.749.940.9
449.759.3
390.4
26.4
10.18
4.132.032.10
.27
.20
.501.52.95
2.60
37.95
15.007.307.70
1.00.80
1.905.453.60
10.20
4,815
8, 576
4. 040792
1 , 504
1851,088
967531326110
8, 355
5, 0192, 574
287475
-221-460
-681
485.4
327.0
48. 5150.7127.8
64.7
36. 824. 63.4
1.3
92.450.741.8
455. 260.1
395. 1
25.9
8.25
3.271.621.65
.24
.21
.391.04.85
2.26
36. 95
14.857.357.50
1.05.90
1.705.203.559.65
4.825
8, 603
4,017747
1,529
2131,041
1, 056581521
-46
7, 655
4,9842, 432
16673
-948-124
-1,072
-722
487.9
328.6
48.6151.1128.9
66.2
37.525.43.3
2.1
91.049.441.7
460. 261.1
399.1
27.1
9.74
3.921.961.95
.26
.28
.541.40.95
2.41
38.05
15. 307.657.65
1.001.002.055.453.659.65
4,835
9, 679
4,197731
1,578
2191,333
1,621451598572
8, 337
5,4592.421
190267
-1,34242
-1,300
-1,148
494.8
332. 4
49.4152.5130.6
68.1
38.225.94.0
2.0
92.349.642.7
466. 361.9
404.4
27.0
10.14
3.951.961.99
.27
.29
.451.60.93
2.64
40.00
15.958.008.00
1.051.201.855.903.85
10.20
4,850
8, 383
4, 353711
1,595
2031,009
512236302
-26
8, 528
5, 5972, 375
424132
145-277
-132
43
502. 0
334. 4
50.8152.1131.6
71.7
39.026.85.9
3.5
92.448.943.4
474. 563.3
411.2
29.9
11.09
4.562.312.25
.28
.33
.541.611.062.72
41.20
16. 458.308.15
1.051.352.105.804.05
10. 45
4,860
9, 045
4, 364708
1,630
1911, 139
1, 013594223196
8, 832
5,8982,507
189238
-21373
-140
-115
508. 0
340. 9
53.1155. 2132.6
70.1
39. 628.12.4
5.4
91.647.843.8
480.961.4
419. 5
29.5
9.40
3.791.931.87
.26
.32
.511. 18.97
2.37
42.55
17.408.858.55
1.151.402.305.954.05
10. 25
4,875
9,113
4, 347720
1,613
202897
1,334463226645
9,179
6, 0872,771
216105
66-108
-42
-42
r 513 5
345 0 i
54.0157. 4133.7
70.8
39. 228.33.3
3.4
94.349.844.5
487.9* 56. 6
'431.3
r 35. 2
111.05
4.542.292.26
.28
.38
.601.53
33.72
i 43. 35
17. 858.958.90
1.051.302.156. 15
3 14. 85
4, 895
p 4, 550
p 6, 020
ap_789
«*-667
-' 11. 19
4.622.232.39
.28
.34
.531. 63
s 3. 79
-1 44. 30
18. 609.009. 5f>
1. 101.35
6.00
3 15.05
r Revised. » Preliminary. is based on incomplete data. tSee corresponding note on p. S-l (revisions prior to 3d qtr.i Estimates for Apr .-June 1964 based on anticipated capital expenditures of business. 19(51 appear on p. 8 ff. of the Ju y 1964 SURVEY).2 Estimates for July-Sept. 1964 based on anticipated capital expenditures of business. §Personal saving is excess of disposable income over personal consumption expenditures
Anticipated expenditures for the year 1964 are as follows (in bil. $): All industries, 43.92; shown as a component of gross national product on p. S-l.manufacturing, total, 18.25; durable goods industries, 9.05; nondurable goods industries, d*More complete details are given in the quarterly reviews in the Mar., June, Sept.9 20; mining, 1 09; railroads, 1.44; transportation, 2.21; public utilities, 6.03; commercial and and Dec. issues of the SURVEY.other (incl. communications), 14.90. » Includes communications. {Revisions for 1960— 2d qtr. 1961 appear on p. 10 of the June 1964 SURVEY.
* Unadiusted Data represent firms in operation as of Jan. 1; estimate for Jan. 1, 1963, a Preliminary revision for 1st qtr. 1964 is —$75 mil.; other revisions will appear in the Sept.J ' 1964 SURVEY.Digitized for FRASER http://fraser.stlouisfed.org/ Federal Reserve Bank of St. Louis

August 1!>64 SUEVEY OF CURRENT BUSINESS S-3
Unless otherwise stated, statistics through 1962and descriptive notes are shown in the 1963edition of BUSINESS STATISTICS
1962 1963 v
Monthlyaverage
1963
June July Aug. Sept. Oct. Nov. Dec.
1964
Jan. Feb. Mar. Apr. May June July
GENERAL BUSINESS INDICATORS—Monthly Series
PERSONAL INCOME, BY SOURCEf
Seasonally adjusted, at annualrates:fTotal personal income bil. $__
Wage and salary disbursements, total do
Commodity-producing industries, total.doManufacturing only -do
Distributive industries do__
Service industries - do__ _Government - do
Other labor income do -Proprietors' income:
lousiness and professional do__ _Farm do
Tlentil income of persons doDividends -- --doPersonal Interest income - do...-Transfer payments doLess personal contributions for social insurance
bil. $_-
Total nona°ricultural income do
FARM INCOME AND MARKETINGS*
Cash receipts from farming, including Governmentpayments (48 States), totalt mil. $._
Farm marketings and CCC loans, total doCrops doLivestock and products, total 9 do
Dairy products _ d o _ _ .M^eat animals doPoultry and eggs - do__
Indexes of cash receipts from marketings and CCCloans, unadjusted:!
All commodities _ _ _ - 1957-59= 100__Crops _ doLivestock and products do
Indexes of volume of farm marketings, unadjusted :|All commodities 1957-59= 100_.
Crops doLivestock and products do --
INDUSTRIAL PRODUCTION
Federal Reserve Index of Quantity Out-put
Unadj., total index (incl. utilities) 1957-59=100..By industry groupings:
Manufacturing, total doDurable manufactures doNondurable manufactures do
Mining doUtilities __ _ do
By market groupings:Final products, total do
Consumer goods doAutomotive and home goods . doApparel and staples do
Equipment, including defense do
Materials doDurable goods materials doNondurable materials do
Seas, adj., total index (incl. utilities)^ doBy industry groupings:
Manufacturing total do
Durable manufactures 9 doPrimary metals do
Iron and steel doNonferrous metals and products do
Fabricated metal products doStructural metal parts do
Machinery doNonelectrical machinery doElectrical machinery do
Transportation equipment _._doMotor vehicles and parts doAircraft and other equipment do
Instruments and related products doClay, glass, and stone products doLumber and products doFurniture and fixtures doMiscellaneous manufactures do
Nondurable manufactures doTextile mill products _ _ _ d oApparel products _ _ do _.Leather and products. _ doPaper and products do
M42. 4
297.1
118.594.276 6
46 455.612 3
36 613.2
12 216.530.034 7
10.3
424 9
3, 151
3,0061,3391,668
403971269
112117108
111112110
118.3
118 7117 9119 8105 0131.3
119 7119 7125 9117 7119.6
117.0114 1120 0
118.3
118 7
117.9104 6100 6119.1117.1113.2
123 5119.7128.5
118.3134.1103.9
123.0111.1106. 1126. 8122.2
119.8115.2118 9102.3119.7
1 464. 1
312.1
123.398.080 3
49 359 213 1
37 613.0
12 318 032.936 7
11.8
446 6
3 218
3,0771 4201,657
4039tr>9
275
115124108
115118113
124.3
124 7124 4125 1107 8140 7
124 8125 1134 3122 2124.2
123. 6121 1126 2
124.3
124 7
124.4113 1109 5126.3123.4120.2
1?9 1126.7132 2
127.0146.1109.5
130.2117.5109 0133.1124.9
125 1117.1lf;5 599.8
125.2
462.7
311.9
123.898.380 0
49 358 713 0
37 412.7
12 318 432. 636 2
11.8
445 5
2 508
2 492984
1 508413826244
938698
9578
107
127.9
128 8129.8127 6111 3
127.1128 1142.0123 7124.8
128.6129 2128.0
125.5
126 1
127.0125.8126 1125.5123.9120.6
129 0126.0132 9
130.3153. 4109.4
130.3118.6106 3132. 8124.2
125 0116.2124 999.6
125.8
464.0
312.9
123. 798.280 5
49 859 013 1
12.9
12 317 733.036 3
11.9
446 6
2 991
2 8641 9511 613
398936963
107109105
108106109
120.5
120.5121.0119 8105 3
121.7121 3124.3120 4122.6
119.4118 7120.1
125.7
126 1
126.3122 8117 1123.5124.4121.7
129 4126. 8132 9
127.8147.3110.1
131. 0119.7105 3135.0125.7
125 8117.6196 999.9
126.3
466.1
314.0
123.698.080.9
50.059.413 2
37 812.9
12 317.833.436 6
11.9
448 8
3 099
2,9691, 2961, 673
389984284
111113109
113113113
123. 8
123 4118.1130 0112 2
123.8124 3105 7130 2122.6
123.9118 7129.2
125.1
125 3
124.5109 4102 6126.4125.7122.0
130 4128.0133 6
126. 1143.0110.5
131.1118.6108 5134.8126.1
126 4118. 5126 9102. 1126.7
468. 9
316.0
125.099.481 5
49 959.713 3
37 912.9
19 418 033.736 6
11.8
451 6
3 843
3,5121 8061, 706
3841 006
998
131158111
131151115
128.3
19§ 7126 6131 4111 4
130 0131 7135 4130 5126.3
126.8124 0129 6
125. 4
125 9
125.1107 7100 0129.4125. 6122. 5
131 6130.2133 6
127.7145.5111.2
132.4119.1109 6135.3126.8
196 9119.4127 1103.6125. 9
472.7
318. 2
125.499.781 8
50 061.013 4
38 213.2
19 418.534.037 1
12.1
455 1
5 338
4,7272 7012,026
4031 977
330
176236139
176227138
129.9
131 1129 3133 3111 0
131 9134 2148 6129 6126.9
128.1195 3131 0
125.9
126 7
126.2108 4100 0130.7126.8123.0
139 o131.1133 3
130.3150.5111.8
132.5120.4112 2135.3126.2
197 4119.7127 3102.9127.0
473 8
318.3
125.199.781 8
50 161 313 5
38 9
13 2
12 418 834.237 2
11.9
456 1
4 394
4 9012 46°1 738
OQA
qnn
156915
159210
127.1
128.2128.4127.9108.1
127.7128 5147.7122 4126.1
126.5123.2129.8
126.1
127 0
126.4109 5103 5132.9126.0123.1
132 8132.1133 7
130.4151.9110.7
131.9120.3HI s136.4127.1
127 7120.4128 5100.0127.3
477 1
320.0
126. 0100.282 0
50 561 513 5
38 413 2
12 420 134.437 2
12.1
459 5
3 473
3 4251 8861 539
A AQ
90 e
198165
131160
124.5
125 1127.2122 5106.7
125.3123 9141.7118 2128.5
123.8121 0126.8
126.8
127 7
127.1110 4104 9134.7126.8123.0
133 4133.5133 3
130.8152.4110.9
132.7121.2110 6137.6127.6
128 5119.5129 0101.2127.6
2477.3479 4
320.8
125. 6100.082 4
50 862 113 6
38 312 8
12 419 334.7
2 39 7
12. 2
2 469 1
3 454
3 3731 6921 681
4.1 7
977
126148i no
1°8145
125.7
125.8126.7124 7107.9
126. 7126 1138 7122 1128.0
124.9121 1128 8
127.7
128 5
128.1113 6108 3132.2128.2124.4
134 7135.2134 0
130.8151.9111.1
132.2121.2112 2137. 3128.6
128 9118.8129 497.8
128.7
480 5
323.6
127.1100.782 8
51 462 413 7
38 712 6
19 419 435.037 5
12.34AO K
9 gn
9 354870
1 484OQQ
941
8876
8970
128.3
129.1129.5128 5108.3
128.5128 9144 4124 0127.5
128. 1125 3131.0
128.2
129 1
128.9117 6114 5139.9129.0126.0
133 6132.9134 5
131.1153.0110.8
133.6124.1117 3138.1129.7
129 4119.8131 799.3
129. 1
482 9
325.1
127.4101.183 1
51 969 713 8
38 812 4
19 419 635.337 8
12.4
466 1
9 610
9 414773
1 6414.^9
9fi9
9068
9056
129.0
130.0131.3128 4107.6
128 5127 7144 1122 5130.1
129.6127 4131.8
129.0
129 9
130.0120 9118 1142.6129.3127.8
135 9136.7134 9
130.1151.1110.6
134.2125.3116 1139.0130.4
129 8118.9131 896.3
130.4
486 6
327.7
128.8102.383 7
52 163 013 9
39 012 5
12 419 835.538 2
12.5
4.fiQ 7
9 533
9 434781
1 653497
9^fi
9168
Q1
52
' 131. 7
133 0134.1
' 131 7* 109. 8
130.7130 3
* 148 3124 6131.5
r 132.6r 131 2r 134 0
r 130. 5
131 4
131.6r 123 8r 123 7
138.5129.5129. 2
137 5138.1136 8
133.0156.2112.0
134.7125.2115 4139.8131.4
131 1119. 4
r 130 5'98.4132. 9
487 8
328.7
128.7102.384 2
52 363 414 0
39 112 6
12 419 835. 738 0
12.5
470 7
9 314
9 294793
1 571JK9
9AH
O K
63
DO
48
r 132. 3
r 133 7134.8
r 139 3r 111.6
' 130. 5r 129 9r 145 9*• 124 9r 131. 8
133.9' 133 9r 133. 9
••131. 3
r 132 9
r 132. 6127 1
r 127 8r 136. 1r 130. 3
128.1
r 138 5r 139. 6*• 137 0
' 134. 1'157.4>• 112. 8
r 134. 6r 124. 3r 114 9r 140. 5M31.9
r 131 7••119.2
132 6104.9
r 134. 3
f 489 3
r 330. 1
r 129. 4r 102. 7
r 84 6
' 52 463.814 1
39 3' 12. 6
12 419.935.9
'•37 6
12.6
'472 1
2 512
2, 495970
1, 525418827254
938599
10184
114
r 134. 2
r 135 4r 13(5 4
r 134 or H3 0
r 133 9134 i
r 150 2199 o
r 133. 4
r 134. 5r 134 gr 134 2
r 131. 7
r 132 f)
133.1r 196 6
125 7136. 7
r 130. 9129.7
140 0r 141. 8r 137 6
134.7157.8113.4
134.9126.6107 9
r 142. 7* 132. 0
r 131 5119.9
129.8
490 8
331.3
129.7102. 984 8
52 664 114 2
39 512.4
12 420.036.037 7
12.7
473 8
127. 1
197 4128 1126 4108 5
127 3126 •>129125129. 7
127. 1127197
132. 7
133 G
134. 51311\>9
133131
14')143140
135158113
135127
145134
139 5
r Revised. *> Preliminary. i The total and components are annual totals. 2 Ital-icized total for Jan. 1964 excludes stepped-up rate of Government life insurance dividendpayments to veterans; total disbursements of $172 million multiplied by 12 (to put on annualrate basis) amounted to $2.1 billion . Figures for transfer payments and total nonagriculturalincome reflecting similar exclusion are as follows: Transfer payments—$37.6 billion; non-agricultural income—$460.1 billion. fSee corresponding note on p. S-l. JRevised series.Dollar figures and indexes of cash receipts revised beginning 1961 (indexes shifted to 1957-59
base). Physical volume indexes revised beginning 1955 to reflect change to the 1957-59 refer-ence base and incorporation of latest Census revisions. Data prior to May 1963 appear inthe Dept. of Agriculture publication, Farm Income Situation, July 1964. 9 Includes datafor items not shown separately. c^Seas. adjusted industrial production indexes for the totaland for industry and market groupings revised beginning Jan. 1961 to incorporate new sea-sonal factors; data prior to May 1963 will be shown later. <• Corrected.
Digitized for FRASER http://fraser.stlouisfed.org/ Federal Reserve Bank of St. Louis

S-4 SURVEY OF CURRENT BUSINESS August li>f>4
Unless otherwise stated, statistics through 1962and descriptive notes are shown in the 1963edition of BUSINESS STATISTICS
1962 j 1963 P
Monthlyaverage
1963
June July Aug. Sept. Oct. Nov. Dec.
1964
Jan. Feb. Mar. Apr. May June ! July r-
GENERAL BUSINESS INDICATORS—Continued
INDUSTRIAL PRODUCTION— ContinuedFederal Reserve Index of Quantity Output — Con.
Seasonally adjusted indexes— Continued 0By industry groupings— Continued
Nondurable manufactures — ContinuedPrinting and publishing 1957-59=100-.
Newspapers do_ _-Chemicals and products - _do_ _-
Industrial chemicals do _Petroleum products _-do
Rubber and plastics products doFood** ?nd beverages do
Food manufactures doBeverages do
Tobacco products do _ _
Minin^ - - doCoaf doCrude oil and natural gas -do
Crude oil -- - do_ _.
Stone and earth minerals _ __ do
Utilities _ d o _ _Electric doGas do
By market groupings: ©Final products total do
Consumer goods doAutomotive and home goods do
Automotive products do\utos doAuto parts and allied products do
Home goods 9 - doAppliances, TV, and radios doFurniture and rues do
Apparel and staples _ _ _ - doApparel, incl. knit goods and shoos doConsume** staples do
Processed foods do
Beverages and tobacco doDrugs soap and toiletries doNewspapers, magazines, books doConsumer fuel and lighting - do
Equipment, including defense 9 doBusiness equipment do
Industrial equipment -do _Commercial equipment doFreight and passenger equipment do __Farm equipment do
Materials doDurable goods materials 9 do
Consumer durable _ _ doEquipment doConstruction do -
Nondurable materials 9 do _ _Business supplies _ do _
Containers doGeneral business supplies do
Business fuel and power 9 doMineral fuels doNonresidenttal utilities _ _ _ _ _ do
BUSINESS SALES AND INVENTORIES §Mfg. and trade sales (seas, adj.), totaljf mil. $__
Manufacturing, totalf doDurable goods industries doNondurable goods industries do
Retail trade, total t - doDurable goods stores doNondurable goods stores do
Merchant wholesalers, totalfcf doDurable goods establishments doNondurable goods establishmentscf do
Mfg. and trade inventories, book value, end of yearor month (seas, adj.), totalf mil. $,_
Manufacturing, totalf - - - ._ -doDurable goods industries doNondurable goods industries do
Retail trade totalf doDurable goods stores doNondurable goods stores do
Merchant wholesalers, totalfcf doDurable goods establishments doNondurable goods establishmentscf do
114.6108.5136.1147.5112.9
130.6113.5113.8111.5112.0
105.095.3
105. 5105. 1112.6109. 7
131.3133. 1125.9
119.7119.7125.9
131.1135. 9124.9
122.2118.2123.9
117.7114.5118.7113.7
111.7129 9116.7126.1
119.6122.1117.2143.1117.2107.7
117.0114.1127.5118.9110. 4
120. 0116.5117.1116.3
111.7104.9129.9
165,078
33. 30817, 18416. 124
19.6136. 245
13, 36712, 1585, 0217, 136
100, 271
57, 75334. 32623. 427
27 93811. 72816.21014, 5808, 1086,472
116.4108.0148.5162.5117.1
138.9116.4116.7114.9115.1
107.8102. 4107.9108. 2112.3112.1
140. 7142.5135. 2
124. 8125.1134.3
141.1149. 5130. 1
129. 4124. 7131.3
122. 2117.5123. 6116.5
115.0140. 0117. 8134.4
124. 2128.3122.9142. 4132.1121.6
123.6121.1137.2125.4116.3
126.2120.1120.3120. 1
117.2109. 3138.8
i 68,002
34, 77418, 07116, 704
20, 5366,675
13, 86112, 6925.2447,448
104, 435
60, 14736, 02824, 119
98 69111,96516, 72615, 5978,4477,150
118. 1112.5147.5160.6118.2
137.0116.2116.4115.6115.4
109.3107.1108.9109. 5112.8113.9
141.0143.4133.3
r 1°5 1r 125. 8r 136. 2
<• 145. 6159. 9
* 126. 9
' 129. 7r 127. 8r 131.8
' 122. 5117.4
r 123. 9* 116.3
' 118. 2r 139.6r 118.3r 134. 6r 123. 7
127 8122. 8142.2128. 1
'116.0r 125 8r 125.2' 143.4
' 125. 7'116.5
' 126. 4r 120 7T 121 0r 19Q 6
r H8 3
' 110 9r 138. 3
67, 983
34, 94218 24216, 700
20, 4866 630
13, 85612, 5555, 2287, 327
101,693
58, 70635. 15623, 550
28 12411 61416 51014. 863
8, 2766, 587
117.6111.6149.7163.0119.5
136.0116.7116.8116.7117.9
110.2107.1110. 3110.9110.3113. 5
144.0146. 8135.4
r 195 2r 125. 7' 133. 9
' 140. 1r 151.5
125. 3
' r>9. 6' 125. 6r 132. 7
' 123. 1118. 7r r>4 3
r 115. 5
' 120. 4T 142 6r 118.3' 134. 7
r 124. 2r 198 8
123.6r 142.3r 131. 5' 117.6
r 125 9' 124. 5r 141. 1r 126 1r 117. 5
r 127 4r 190 0
119 9r 120 1
r H9 5
r H9 2
' 140 3
69, 244
35, 64118 74616, 895
20, 7196 773
13, 94612, 8845,2787,606
102, 134
58, 88435. 34623, 538
28 25911 67316 58614, 9918,2556,736
118.3112. 8150.5164.2117.6
140.1116.8116.9116.6116.8
111.2108.0111.3111.711°. 8113.4
144.0146.9134.6
r 196 1' 196. 4r 135. 4
r 141.4r 151.3' 128. 3
r 131.2T 19tf 0
' 133. 1
'123.6r 119.7r 124. 7r 116.7
r 118. 1' 142. 5r 118.6r 135. 4
r 125. 2r 130 0' 124.8' 141.4
' 134. 5r 122. 3
r 124.8••121.4r 135. 3' 126. 8' 117.9
' r?8. 3r 121. 5' 119 5r 122 5
r H9 9r 113 0r 140. 5
68, 250
34, 73618 16016, 576
20, 6666 562
14 10412, 8485. 2977,551
102, 205
58, 91735, 50723, 410
28 14811 60416 54415, 1408,3216,819
118.4113.7152.4166.5117.0
142.5116.7117.5112. 5115.7
109.9106.2109. 9109.8112.4113.3
142.3145. 1133. 4
r 196 3' 126. 3r 136. 4r 142. 9'153.3r 129. 4
'131.7r 128. 1r 132. 1
' 123. 2' 117.9' 124.7* 116. 7
r 115.2' 144. 5r 117.9' 135. 7
' 126. 1
131 0' 125. 5
141.6r 137. 5r 125. 7
T 124. 9r 122. 0
'138.6' 127. 5
"•118.9
' 127. 9' 120. 7r 118. 1' I99. 1r 118 7r 111.3' 140. 2
68, 029
34, 67217 93716, 735
20, 4266 606
13 82012, 9315,3547,577
102, 535
59, 08735, 53623, 551
28 14711 60516 54215,3018,3876, 914
117.8111.9153.2168.3119.0
142.1117.5117.8116.5114.1
108.6104.1108.4109.1111.9113.5
140. 5143.3131.7
r l'>7 0
' 127. 3r 137. 9
' 145.8' 154. 8r 133. 9
131.3' 125.7r 133. 0r 124. 1' 120. 0r 125. 3r 117.6
'118.3r 143. 9' 117.8r 135. 6
' 127. 1
13° 0126. 6141. 2
' 139.2r 130.8
r 125 4r 122. 2' 139. 5r 127. 7r 118.6
' 128. 7T 122. 5* 192 5r r?2 5r 118 3r 110 0r 141. 1
68,884
35 21418 59016 694
20 7166 941
13? 77512, 9545,3237, 631
103, 167
59, 32235, 58123, 74198 357ll' 66416 69315,4888,4307.058
118.5113.2154.3169.3118.5
144.3117.0117.5114.5114.6
107.4102. 1107. 2108. 1112.2113.1
140. 0143. 6128. 6
' 126 9r 126. 8'138.3
' 145.8' 155. 1<- 133. 5
r 133. 1
' 128. 4'134.4
' 123. 2r 119.9r 124. 17 116.9
' 115. 6' 142. 0' 117. 1' 134. 6
' 127. 0r 132 0-•127.3
139.0' 139. 6' 134. 4r 125 6
122.5' 141.3' 127. 4r 118.9r 128. 8' 122. 5r 123 8r 122 0
r H8 1r 109 2T 141.7
68, 338
35, 00418 97216, 732
20, 5586 734
13, 89412, 7765,3007,476
103, 926
59. 78035, 70424, 07698 65111 85616, 79515,4958,4307,065
121.3119.2154.3171.6116.6
144.2118.7119.2116.5115.8
107.0103.4106.2106. 6119, 9113.4
142.3146. 0130.7
r 19S 0T 127. 9r 139. 0
' 146. 0r 155. 6
r 133. 4
' 134. 0' 128.4r 135.3
••124.4r 120. 1r 125. 7' 118.9
' 117. 2r 142. 7'120.4' 135. 1
'128.3133 9
' 128. 5
140.2r 139. 9'131.6
r 125 9r 122. 6r 142. 8r 128. 7r 118. 9
r 129. 2T 122. 9
121 3' 193 8
r H8 1T 108 9' 142. 2
70, 026
36 02118 47617 545
21 0196 831
14 18812, 9865, 3487, 638
104,435
60, 14736, 02824, 119
98 691ll'96516 72615, 5978,4477,150
119.5113.9154.7173.1116.0
145.0120.8121.3118.4112.7
108.8104.0108.3108.5116.4113.5
144. 5148.3
r i98. 5128. 9
r 139. 7
'146.6155. 3
r 135. 2
'134.8127. 5
r 136. 1r 125. 5r 120. 4r 1^7.0r 121.4
' 116. 5142.2
r 121. 5' 136. 5
' 127. 5r 132 4
128. 9141.6
r 137. 0r 131.2r 126. 7' 123. 0' 141. 9' 129 2r 119.6
'130.4124. 4125. 1124 0
119 1110.2142.7
70, 992
36, 67719,14417, 533
21,0006 855
14,14513,3155,4367, 879
r 104,839
59,99135, 95524, 036
'99 03012, 109
r 16, 92115,8188,5697,249
121.2114.5154.5173.3119.1
145.3120.6119.8125.0105.6
108.999.2
109.1107.8118.8114.7
143.4146.5
198 1' 128. 8' 140.7
145. 5156.5131.1
r 137. 3131.3
' 138. 1r 125. 0-120.7'126.2' 120. 2
118.5140. 1
' 123. 7'134.7r 126. 5r 131 1
127.9140.4
r 137. 8' 126. 0
' 128 1' 125. 8' 144. 3r 129. 6r 123. 2
' 130. 6' 125. 2
125 5r 195 1
118 7109 3143.5
71,013
36 23519 02717 208
21 5337 262
14 97113,2455,5487, 696
' 104,780
60,10835,94524,163
r9g 95412 103
r 16 85115,7198 5597.159
121.8115.2155.2174.9119.7
145.1120.3119.7123.8118.2
108.894.5
109.7109. 0119.8115. 0
144.8148.3
r 198 7' 128.8r 139.7
'144.3152. 5
r 133. 4r 136. 4
128. 7r 139. 0
' 124. 6118. 7126.3
r 118.4
121.9140 1
r 125. 1' 136. 2r 128.6r 133 7
131.9141.0
r 135. 8' 127. 6r 199 3' 127. 3r 141.9r 130.4' 193. 4
' 130. 8' 194 9
193 6' 195 6
118 7108 9144 5
705 649
36 22218 88717 335
21 2236 939
14 28413, 2045,5607,644
' 105,029
60, 32636. 07924, 247
'98 96912 936
r!6 73315,7348 4787.256
123.6117.2157.0
' 176. 7120. 8
149.4190.6
' 120. 0124.1127.5
' 109. 998 7
' 110. 0109.6124.2114.3
' 147. 5151 3
r no 6r 130 8r 142.4
149 3160 0135. 2
r 137.7130.7
' 139. 7
r J97 9
r 121. 5
' 198 8' 19Q 8
125.2142 8
' 126. 7138 5
' 130. 2' 135 8
133 9143 1
r 140. 8' 126. 6
r 130 6' 129. 0' 144 1' 131 6' 193 8
' 132 3196 1127 0125 7
r 120 7' 110 3' 147 9
71,787
37 16719 35917' 808
21 3927 010
14 38213, 2285,5067,722
' 105,652
60, 53136, 27724, 254
'99 94212 340
r!6 90215,8798,5197.360
123.9117.1
' 156. 6173.4
' 122. 0
152.5' 120. 1' 120. 2
119.3129.2
'111.2106. 1
' 110.5' 110. 1' 119.5r 116.8
' 148. 3152.3
r 131 1r 131.0' 143. 0
' 151.4160. 3
r 139. 6
' 137. 1r 130. 1' 141. 1
'127.2123. 1
' 128 3' 120. 2
122.6' 144. 5' 124. 7
138.7
'131.2' 137 8' 135. 7' 141. 9' 143.9' 130. 7
' 131.2' 129. 8'143.8' 132.9' 123. 5
' 132. 7' 126. 6
128. 1' 125 8
r 199 2
' 112 0148.9
'72,660
'37,186r 19. 138' 18, 048
'21,777' 7, 218
r 14, 559r 13, 697' 5, 766' 7, 930
' 105,786
' 60, 598'36,300'24,228
'99 205'12 39Q' 16, 885' 16, 053' 8, 618r 7, 435
124.3117.2158.2
121.4
119.6119.2
' 111.8' 105 1
111.3111.1118.8119. 5
' 149. 5
r 131 7r 131 6' 143. 7r 150. 9' 161 7
136. 7
138. 6131. 9143. 5
r 19g '>
r 1°9 4119 9
~~147~8~126.0
' 132. 0139 1137. 4143.6141.9
T 131 g130.8147.8133 1122.6
' 133. 0124 7I'M 9
195 0
' 193 0' ll9 7
72, 339
37 01519 17917, 836
21 6756 969
14 70613,6495,7497, 899
105, 913
60, 37736,47123, 906
29 465I9 38717 07816, 0718 7417.330
125
112 310*)11°112
149 0
139 "i139 3146
1 ̂1G3
198
J9Q
132. 9141
133 1132
135
193113
r Revised. p Preliminary. 1 Total and components are based on unadjusted data.®See note marked "c?" on p. S-3.9 Includes data for items not shown separately.§ The term "business" here includes only manufacturing and trade. Business inven-
tories as shown on p. S-l cover data for all types of producers, both farm and nonfarm.Unadjusted data for manufacturing are shown on p. S-5; those for retail trade on p. S-ll.
tSee note marked "t" on p. S-4 of the Nov. 1963 SURVEY. fRevised series. For a
detailed description of the changes affecting these series and data for earlier periods, seepp. 16-19 of the Dec. 1963 SURVEY. cf Total manufacturing and trade sales and inventoriesand merchant wholesalers' sales and inventories have been expanded to cover all merchantwholesalers, including wholesalers of farm product raw materials; also, seasonally adjusteddata beginning Jan. 1960 for merchant wholesalers' sales and inventories revised to reflectnew seasonal and trading day factors. Revisions for earlier periods appear on p. 24 of theMay 1964 SURVEY.
Digitized for FRASER http://fraser.stlouisfed.org/ Federal Reserve Bank of St. Louis

August 10(>4 SURVEY OF CURRENT BUSINESS S-5
Unless otherwise stated, statistics through 1962and descriptive notes are shown in the 1963edition of BUSINESS STATISTICS
1962 1963
Monthlyaverage
1963
June July Aug. Sept. Oct. Nov. Dee.
1964
Jan. Feb. Mar. Apr. May June July
GENERAL BUSINESS INDICATORS—Continued
BUSINESS SALES AND INVENTORIES— Con.Inventory-sales ratios:
Manufacturing and trade, total! § ratio
Manufacturing, total § doDurable goods industries _ _. do -
Purchased materials doGoods in process _ _ _ _ doFinished goods do
Nondurable goods industries doPurchased materials _ - doGoods in process doFinished goods do -
Retail trade, total t§ _. _ do _ . _Durable goods stores doNondurable goods stores - - - - -do
Merchant wholesalers, totaled1. _ _ do-_ _Durable goods establishments do. _ _Nondurable goods establishments cf do _ _ _
MANUFACTURERS' SALES, INVENTORIES,AND ORDERS
Manufacturers' export sales:*Durable goods industries (unadj.), total.- mil. $
Shipments (not seas, adj.), totalf do
Durable goods industries, total? _ _ _ doStone, clay, and glass products - _ _ do ___Primary metals do
Blast furnaces, steel mills ___ - _ -doFabricated metal products do
Machinery, except electrical _ __ do _ _ .Electrical machinery _ _ _ _ _ doTransportation equipment _ do _ _
Motor vehicles and parts - _ _ doInstruments and related products _ _ _ _ do - -
Nondurable goods industries, total 9 - do __Food and kindred products -_ doTobacco products. doTextile mill products doPaper and allied products doChemicals and allied products __ . doPetroleum and coal products doRubber and plastics products do
Shipments (seas, adj.), totalf doBy industry group:
Durable goods industries, total 9 - doStone clay and glass products doPrimary metals do
Blast furnaces, steel mills doFabricated metal products doMachinery, except electrical doElectrical machinery doTransportation equipment do
M'otor vehicles and parts doInstruments and related products do
Nondurable goods industries, total 9 doFood and kindred product^ doTobacco products doTextile mill products doPaper and allied products. _ _ _ d o _ _Chemicals and allied products _ _ _ . doPetroleum and coal products doRubber and plastics products do
By market category:Home goods and apparel doConsumer staples doEquipment and defense prod., excl. auto.doAutomotive equipment _ _ doConstruction materials and supplies doOther materials and supplies _ _ do
Supplementary market categories:Consumer durables doDefense products doMachinery and equipment do
Inventories, end of year or month :fBook value (unadjusted), total do
Durable goods industries, total doNondurable goods industries, total do
Book value (seasonally adjusted), total doBy industry group:
Durable goods industries, total $ _ _ doStone, clay, and glass products. doPrimary metals - - - _ _ do
Blast furnaces, steel mills ._ ._ do -Fabricated metal products doMachinery, except electrical do -Electrical machinery _ do -~Transportation equipment __ _ do __
Motor vehicles and parts doInstruments and related products, -do
1.51
1.701.96.62.80.54
1.42.60.20.62
.38
.82
.18
.19
.60
.90
33, 308
17, 184961
2,8351,5221,859
2,3662,3014,4532,806
55716, 1245,577
3771,2631,3142.4491,433
710
2 3, 2962 7, 0022 4, 1672 3, 1402 2, 770
2 12, 932
2 1,3362 2, 0912 3, 095
3 57, 41933, 89123, 528
357,753
34, 3261,4925,8733,5283,8616,4864,9006,7992,4131,365 1
1.50
1.691.94.59.80.55
1.41.59.20.63
1.371.751.191.181.58.90
678
34, 774
18, 071947
2,9441,5861,877
2,5172,3984,8483,154
58316, 7045,832
3831,3781,3552,5681,451
772
2 3, 3132 7, 2582 4, 2422 3. 5712 2. 796
2 13, 594
2 1,3802 2, 0962 3, 215
^ 59, 73835, 56524, 173
•560,147
36, 0281,5445,9183.5333, 9996,9105,0557,3312,6101,468
1.50
1.681.93.59.80.54
1.41.58.20.63
1.371.751.191.181.58.90
687
36, 527
19, 5991,0693,3421,9052,019
2,7422,5855, 1653, 405
61416, 9285,961
4011,4521,3882,6321,478
80534, 942
18, 242948
3,1481,8071, 8662,4972 4614,8143 182
58216,7005 81 6
3751, 3791,3282,5151,482
752
3,4787, 1684, 1673, 6202,771
13, 738
1,4142,0343, 215
58, 99735, 48323, 51458, 706
35,1561,5065,8733,4943,8796. 6?74,9707,2372,5951,405
1.47
1.651.89.58.79.53
1.39.58.20.62
1.361.721.191.161.56.89
592
32, 744
17, 014999
2,7271,5431,785
2.3012,1794, 6793.060
52415, 7305,637
3901,2011,2542,3961,435
71235, 641
18, 746962
3,1591,8151, 9252,5302,5315,0563, 284
60016, 8955 820
3741,4051,3792, 6111, 462
793
3,4077, 2584,3813,7382,844
14, 013
1,4172, 1793, 292
58, 56835, 18723, 381
58, 884
35, 3461,4915,8313,4593, 9276,7124, 9687 3702,6361,416
1.50
1.701.96.60.80.55
1.41.58.20.64
1.361.771.171.181.57.90
605
33, 761
16, 8801,0352,7551,4541,990
2,3922,3643,6481,841
56916. 8815,797
4091,4271,3662,5261,475
73634, 736
18,160914
2, 8571,4791,8742, 5652,4334,9792,997
58816, 576
5 835393
1. 3641,3232, 5291,477
737
3,2877,2784,3513, 4062, 793
13, 621
1,4162, 3533, 252
58. 68135, 30123, 380
58, 917
35, 5071,5355,8283, 4553,9336,7595, 0097 3112,7311,434
1.51
1.701.98.61.8156
1.41.58.20.63
1.381 761.201.181 57.91
682
36, 028
18, 2781,0422 7881,4211,986
2,5952, 5594,5532,791
62517, 7506,241
3851,5151,4532,7361,456
79934, 672
17, 937938
2,7421,3921 8552,6102 3704,8973 155
16, 7355 916
3771. 4011, 3952, 5781 451
772
3, 2017, 3374,3143, 5732, 762
13, 485
1,3722, 1333,272
58, 83735. 37023, 467
59, 087
35. 5361,5515 8493,4963,8896 7634, 9977 3782, 6671,446
1.50
1.681.91.59.79.54
1.43.59.20.63
1.371 681.211.201.58.92
756
36, 821
19, 1801,0892,9281,4842,054
2,5442,5225,2683,544
61017, 6416,184
3831,5011,4272,6741,442
85635, 214
18, 590986
2,9041,4691 9432.6152 3855,1583 362
58916, 6245 870
3841,3631,3732, 5761 428
794
3, 2077,2884, 3763,7972. 933
13,613
1,3682,1673, 293
59. 02635. 30023, 72659, 322
35, 5811,5175 8613, 5003,9136 8005, 0437 2562,6691,454
1 52
1.711.95.60.80.56
1.44.59
20.65
1.39] 761.211.211 59.94
689
35, 377
18, 457960
2 8521,4681 881
2,4702,4845,2213,512
61016, 9205,983
3941 4561,3592,5091,424
76335 004
18, 272977
2,8921 5121 9132 5822 3694 9663 934
59416, 7325 961
3791 4001, 3662, 5781 409
781
3 1697 3824, 2863 6352, 907
13, 625
1 3562, 1323, 258
59, 44535, 35924, 08659, 780
35, 7041, 5355 9033, 5323,9176 8395, 0667 2202, 5951, 452
1 49
1 671.95
59.8056
1.37.5620
.62
1 371 751 181.201 58.94
789
34, 594
18 118798
2 7451,4051 807
2,5772,4905,2373,387
63616, 4765,913
3931 3561,3042,3691,521
78436, 021
18, 476953
2,9811 5701 9102 6522 4324 9093 123
59117, 5456 193
4031 4661,4152,6401 475
836
3 4737 6724,4353 5382,811
14, 092
1 4542,1693, 362
59, 73835, 56524, 173
60, 147
36, 0281,5445 9183,5333,9996 9105, 0557 3312, 6101,468
1 48
1 641 88
577754
1.37552062
3877201958
.92
683
34,110
17,595788
2 9671, 5911 777
2,4892,2544,9403,311
53716,5155,946
3331 3151,3022,5731,492
767
36, 677
19,1441 0183,0671 6051 9942 7372 4795 1173 297
60617,5336 247
3651 4651,3682,7031 455
815
3 5197 6864, 5663 7103,002
14,194
1 4692,2313,428
60,09435,87524,21959,991
35,9551,5395 9083 5193,9716 9265,0737 2722, 61 41,480
1 48
1 661 89
577854
1.40562064
r l 341 671 181 191 54.93
716
36 818
19 208842
3 1581 7151 911
2 7842 5935 3063 455
59917,6106,171
3391,4571,3982,7431,498
83636, 235
19, 027999
3 0341 6492 Oil2 6749 4635 0753 331
59317, 2086 049
3531 4051,3622 7351 474
836
3,3957, 4904,4833, 7283,119
14, 014
1,4682,1813,344
60, 48636, 17324,313
60, 108
35, 9451,5355 9143,5113, 9656 8695,0887 3592, 6631,477
1 49
1.671.91
57.79
54
1.40562064
r 1.361 761 171. 191 52.95
778
37, 069
19 471873
3 2231,7371 906
2,8962 5555, 2853 487
61117, 5986 120
3681 4771 4032 8031,421
83336 "9
18 887940
3 039
1 6151 9679 6962 5055 0183 310
60617,3356131' 387
1 4601 3632 7461 445
811
3 3877, 6074, 4453,7162, 967
14, 100
1 4762, 0953,409
60, 66136, 39424, 267
60, 326
36, 0791,5365 9723,5613,9786 8915, 0397 4'?52, 7021, 503
1.47
1.631.87.56.78.53
1.36.54.19.63
1.371 761 181.201.55.95
781
38 091
20 242987
3 3701 8431 989
2,9572 4985,6193 748
60917, 8496,101
3791 4631 4972,9921,484
90137 167
19 359952
3 1741 7191 9439 7389 5305 9313 468
61617, 808
6 <->0'')394
1 4721,4042 8271 520
873
3 4157 7664, 5723 8792, 916
14 619
1 4832, 2333,407
60, 80736, 60S24, 19960, 531
36, 2771, 5515 9543 5473, 971
6 9555, 0947 4462,7161, 527
rl. 46
"•1.63••1.90
r .57.79
r .54
1.34r .53
.19
.62
1.34r 1 71
1.16'1.17r 1.49'.94
r 804r37 465
'19 781r 1,017'3 318T 1,815r 1 975
' 2, 939' 2, 440r 5, 304r 3, 495
'604
' 17, 684' 6, 247
r 399r 1 428r 1 390r 2, 953T 1,501
'863r37 186
'19 138r 929
r 3 154r \ 732r \ 9Q6
r 2 782r 2 530r 5 056T 3 979
r 611
' 18, 048r 6 3'>5
r 3g9r 1 481r 1, 395r 2,818r i 546
'853
r 3 594r 7 865r 4, 618r 3 676r 2, 934
r!4 569
T 1 482' 2, 198r 3, 483
"•60,950r 36, 785'24,165'60,528
'36,300'1,579
6 014' 3 594r 3, 951
r 6 9635, 062
' 7 389' 2, 713' 1,540
1.46
1 631.90
57.7954
1.34.5319
.62
1 361 781 161.181 52.93
801
38 746
20 5931,0743 3221,7662 077
3,1012 6005,5133,615
63218, 1536,472
4261 5341 4692,8511, 524
92437 015
19 179944
3 0921 6441 9102 8262 4665 2?03 426
59717, 8366 317
3991 4591*4012 7341 516
861
3 4457 8714,5793 8442, 912
14 364
1 4612, 1853, 501
60, 68236, 79523, 88760, 377
36, 4711,5926 0213 6253, 9567 0285, 0677 4082, 7001,551
r Revised. 1 Advance estimate. 2 Based on data not seasonally adjusted. 3 Totaland components are end-of-year data, t See note marked "f" on p. S-4 of Nov. 1963 SURVEY.
§ See note marked "f" on p. S-4. <? See corresponding note on p. S-4.*New series. Represents estimated total value of durable goods products directly ex-
ported by durable goods manufacturers; data prior to Oct. 1962 are not available. t Revisedseries. Effective with the Dec. 1963 SURVEY, data reflect the following major changes: Intro-duction of the Annual Survey of Manufactures as the new benchmark, revision of sample de-
sign, refinement of industry reporting, expansion of industry groups published, and revision ofseasonal factors. In addition, data by market groupings are presented for the first time. Datafor shipments and new orders not seasonally adjusted are adjusted for trading day variation.Revisions back to 1947 and a detailed description of the current revision appear in the CensusBureau publication, "Manufacturers' Shipments, Inventories, and Orders: 1947-63 Re-vised."
9 Includes data for items not shown separately.
Digitized for FRASER http://fraser.stlouisfed.org/ Federal Reserve Bank of St. Louis

S-6 SURVEY OF CURRENT BUSINESS August 1064
Unless otherwise stated, statistics through 1962and descriptive notes are shown in the 1963edition of BUSINESS STATISTICS
1962 1963
End ofyear
1963
June July Aug. Sept. Oct. Nov. Dec.
1964
Jan. Feb. Mar. Apr. May June July
GENERAL BUSINESS INDICATORS—Continued
MANUFACTURERS' SALESJNVENTORIES,AND ORDERS— Continued
Inventories, end of year or month — Continued!Book value (seasonally adjusted)— Continued
By industry group— ContinuedDurable goods industries — Continued
By stage of fabrication:Materials and supplies 9 mil .$__
Primary metals doMachinery (elec . and none lee.) ...doTransportation equipment do
Work in process 9 do.Primary metals doMachinery (elec. and nonelec.) doTransportation equipment _ .do
Finished goods 9 -doPrimary metals doMachinery (elec. and nonelec.)- do__ _Transportation equipment do
Nondurable goods industries, total 9 doFood and kindred products doTobacco products—. doTextile mill products do
Paper and allied products _ _doChemicals and allied products do_ __Petroleum and coal products do__Rubber and plastics products do
By stage of fabrication:Materials and supplies doWork in process doFinished goods . _ -do
By market category:Home goods and apparel doConsumer staples -doEquip, and defense prod., excl. auto doAutomotive equipment _ ._ doConstruction materials and supplies doOther materials and supplies do
Supplementary market categories:Consumer durables doDefence products doMachinery and equipment do
New orders, net (not seas, adj.), totalf ._ do
Durable goods industries, total doNondurable goods industries, total do
New orders not (seas adj.), totalf ._._ . _do _By industry group:
Durable goods industries, total 9 do
Blast furnaces steel mills _doFabricated metal products doMachinery, except electrical _.doFlectrical machinerv doTransportation equipment do
Aircraft and parts do
Nondurable goods industries total doIndustries with unfilled orders© doIndustries without unfilled orders'! do
By market category:Home goods and apparel doConsumer staples doFquip and defense prod., excl. auto __do_Automotive equipment doConstruction materials and" supplies doOther materials and supplies do
Supplementary market categories:Consumer durables doDefense products doMachinery and equipment do
Unfilled orders, end of year or month (unadjusted),totalf mil $
Durable goods industries, total__ doNondur. goods indust. with unfilled orders©-do
Unfilled orders, end of year or month (seasonallyadjusted) totalf mil $
By industry group:Durable goods industries, total 9 do
Primary metals _doBlast furnaces, steel mills.. __do
Fabricated metal products... doMachinery, except electrical. doElectrical machinery doTransportation equipment _do
Aircraft and parts - do
Nondur. goods indust. with] unfilled orders©-do
By market category:Home goods, apparel, consumer staples.. -doKquip. and defense prod., inch auto doConstruction materials and supplies doOther materials and supplies do
Supplementary market categories:
Defense products do. _Machinery and equipment.. do
' Revised. l Monthly average. 2 Advance (ponents (inch market categories) are monthly averagjusted. fSee corresponding note on p. S-5. 91]rately. ©Includes textile mill products, leather a]
10,5712,3332,9681,782
14,1291,8165,0344,142
9,5931,7213,381
824
23, 4276,0802,3912,608
1,6883,6001,8091,138
9,7703. 304
10,246
5, 9559,515
11, 8283,0015,042
22,412
2, 7225,' 3438,098
33, 167
17,08516,082
33, 167
17,0852,7181,4001,8482,3642,2854,4841,342
16, 0824,124
11,957
3,2737,0004,1553,1622,767
12, 809
1,3252,0813,090
46, 242
43, 6662,576
46, 784
44, 0943,7612,0573,9446,3046.964
18,06213, 570
2,690
1, 73624, 7134,868
15, 467
1,19418, 1489,828
estimatees basednicludes cad prodi
10. 8792,2593, 0091,956
14, 8571,9015,2494,467
10, 2921,7583.707
908
24, 1190, 0282.3142, 886
1,8003,8181,7361, 157
9,7693,479
10, 871
6,3899,525
12, 3633,2455, 290
23, 335
2,9555,5838,539
35, 036
18, 30016, 736
3 35, 036
18, 3002,9591,5921,8862,5742,4104,9701,398
16, 7364,411
12, 325
3,3397,2574,3683,5782,803
13, 691
1,4042,1563,326
49, 149
46, 1932.. 956
49, 796
46. 6763,9302,1204,0627,0277,114
19, 36814, 446
3,120
1.98726, 1974,986
16, 626
1,40718, 72411,186
3Don new olatafor iicts, pap
10, 7662,2123,0281, 943
14, 6291,8775,1994,422
£,8471,7493, 510
847
23, 5505, 9522, 3892,661
1,7113,6671,8341,167
9,6793,328
10,452
6,0839,470
12,0423,2215,072
22, 818
2,8045, 5528, 245
35,833
18,86716, 966
34, 425
17,6822,6501,2771,9502, 5242,4374, 6981,151
16, 7434,301
12, 442
3,5027,1744,2043,4872,828
13, 230
1,4341,8993,292
49, 836
46,9292,907
50, 052
47, 2854,7372,9604,2046,6287,053
19,50714, 913
2,767
1,92426, 2484,942
16, 938
1,31819, 41910, 482
ata for trders notterns noer and a
10,8102,1983, 0831, 873
14, 7401,8085,2324, 566
P, 8521,7793, 512
859
23, 5386,0002, 3622, 6CO
1.7253,6941,8351,173
9,7183,354
10, 559
6,0059,525
12, 1493,2485, 076
22, 881
2,7975, 6478,317
32, 829
17,08915, 740
35, 207
18,2752,6051,2621,8752,6082,4145, 2461,678
16,9324,560
12, 372
3,4387,2634,3043,6462,919
13, 637
1,4162,3973,334
49, 916
47, 0042,912
49, 542
46,7454, 2202, 4174,1806,7116, 991
19. 43014, 880
2,797
1,95526, 0755,027
16, 485
1,32519, 34710, 549
otal andseasonal; shownlied pro
10,9812,2033,0891,C90
14,5911,8185,2234,4149, 9491,7423.575
869
23,4105,9172, 3412.G89
1,7283.7181.8521,164
9, 6943,364
10,648
6, 0409, 438
12, 1723.3315, 146
22, 790
2, 8555, 4968, 365
33, 779
16, 94616,833
34, 930
18,0602,4861,1981, 9502, 5292. 5685,0051,484
16,8704,490
12, 380
3,5817,2774,5923,4842,917
13, 079
1,4262,3573,307
49, 945
47. 0862,859
49, 552
46, 6953,8622, 1504,1916,7647,122
19, 48114, 819
2,857
1,98726, 4845,133
15, 948
1,31519, 39910, 650com-
lyad-sepa-
3ucts,
10,9172. 2323, 0012,012
14,5791, 8525.1724,468
10, 0401.7653, 587
898
23, 5515,9792, 3392, 668
1,7433,7221,8301,155
9, 6603,347
10, 544
6, 1499,447
12, 2493, 2685, 099
22, 875
2, 8655,5718,343
36,217
18, 50217,715
34,991
18,2442,7121,3711,8082,6082.2635.4301,754
16, 7474,495
12, 252
3,1777,3344,4243,5532,712
13, 791
1,3122,4663,415
50, 131
47, 3062, 825
49, 982
47,0703,8222,1024, 1246,7807, 062
19, 99815, 199
2, 912
1.98926, 6645,116
16,213
1,25419, 74610, 754
andpare zeandnand p
10, 8782,2512,9541,989
14, 6391,8455,2884,386
10, 0641, 7653,601
88123, 741
6, 0572,3172,800
1,7573.7341,7881.159
9,8443,344
10. 553
6,1799,502
12, 1893,2585.135
23, 059
2,9235,4908,395
36, 601
18, 88317, 718
35, 354
18, 6223,0131,5901,9102,6692,4105,0941,272
16, 7324,528
12, 204
3,1997,2984,0693,8062,938
14, 044
1,3791,9223,441
49, 902
46. 9992, 903
50, 140
47, 1693,8592, 1724, 1046,8847.058
20, 06015, 189
2, 971
1,97726, 4835,111
16, 569
1.31319. 62510, 931
rinting aro. 11>lated prolastics p
10, 8802,2562,9921, 960
14, 6481, 8825,2604, 363
10. 1761, 7653, 653
897
24,0766. 0602.3452. 895
1,7723. 7691,7951,167
9, 8263, 428
10. 822
6, 3219, 571
12,2773, 2005,189
23, 222
2, 9235,5028, 485
35, 174
18, 14017, 034
34, 953
18, 1132, 9641, 5291,8582,6172,4774,6801,189
16, 8404,635
12, 205
3.1367, 3714,2893,6112,807
13, 739
1,3871,9683,273
49, 696
46, 6843, 012
50, 132
47, 0763,9302,1934. 0596,9337,111
19,86914, 9853, 056
1,94526, 5025,017
16, 668
1,35219,429
10, 8792, 2593,0091,956
14, 8571,9015,2494, 467
10, 2921, 7583. 707
908
24, 1196, 0282.3142, 886
1, 8003, 8181,7361,157
9, 7693, 479
10. 871
6, 3899, 525
12. 3633,2455.290
23, 335
2,9555,5838,539
34, 045
17, 62316, 422
35, 619
17, 9742,9381,4561,9142,7412,4634,327
801
17, 6454,835
12, 810
3,5037,6824,1333,4752,723
14, 103
1,5141,4763,612
49, 149
46, 1932,956
49, 796
46, 6763,9302,1204, 0627,0277, 114
19, 36814, 446
3, 120
1,98726, 1974, 986
16, 626
1,40718, 724
10, 928 11, 186
nd publishing inc"or these industr)ducts, petroleum*oducts) sales are
10,8212,2332,9891,958
14,8281,8955, 3054,402
10, 3061,7803, 705
912
24,0366, 0522, 3572,846
1,7923,8721,7751,125
9,6663,452
10,918
6, 2429, 597
12,3033,2415,311
23, 297
2,9385,4668, 558
35,010
18, 55816, 452
37, 148
19,7403,1471,6412,0432,8082,6875,4331,730
17, 4084,531
12,877
3,4447,7004,9913,7282,967
14,318
1,4202,6733,617
50, 049
47, 1542, 895
50, 083
47, 0724,0222, 1684,0817,0697,153
19,72414, 723
3,011
1,90826, 534
4,95216,689
1,33819, 06211,326
ustries; iies (foodand coalconsider*
10, 7862,2322,9921,952
14, 8751,8985. 2514,499
10, 2841,7843.714
908
24, 1636. 1362,3742,8391,7923, 8941, 7861,127
9,6613,403
11,099
6,2319,730
12, 2883, 2995, 296
23, 264
2,9315, 4658, 524
37, 539
19, 92717, 612
36, 657
19, 4993,0741,6852,0182,7632,5745,1791,537
17, 1584,486
12, 672
3,4557,4954,6073,7143, 113
14, 273
1,5202,4013,413
50, 760
47,8632,897
50, 586
47, 6444,1692, 2814, 0997,0727,337
19,80514, 919
2,942
1,99426, 5984,967
17, 027
1,40819,36511,348
infilled cand kiiproduct
^d equal
10, 817c 2, 256
2,9731,967
15,0011,9265, 2534,539
10,2611,7903, 704
919
24, 2476,1952,3442,821
1,7973,9021,8011,129
9,6323,446
11,169
6, 2269,780
12, 3053,3475, 290
23, 378
2,9175, 4578,550
37, 508
19, 95117, 557
36, 547
19, 2623,1031,6752,0072,7712,5475,1641,421
17, 2854,552
12, 733
3,4447,5934,4953,7972,983
14, 235
1,5052,1773,455
51, 199
48, 3412,858
50, 697
47, 8054,0822. 2034,1907,1697,383
19, 82114, 990
2,892
2, 06126, 5555, 044
17, 037
1,44019, 36311, 442
>rders foridred prs, chemicto new o
10, 8302,2802, 9621,930
15, 1121,9025, 3614. 583
10, 3351, 7723, 726-933
24, 2546,1652, 3632, 789
1,7893, 9261, 7681,131
9,5343, 459
11.261
6,3139,782
12, 3703,3595, 352
23, 355
2, 9645, 4298. 673
38, 517
20, 66217, 855
38, 184
20,4613, 6412,0772, 0712,9382,5205,6071,605
17, 7234,678
13, 045
3,3967, 7564,8584,0403,038
15, 096
1,4852,3673,610
51, 626
48, 7642,862
51, 679
48, 8404,4852,5254,3117,3257,347
20, 29415, 305
2,. 839
2,01627, 0595,123
17,481
1.41019,61311, 622
other ncoducts,als and arders.
'10, 828' 2, 249
2, 989' 1, 928' 15, 127r 1, 970' 5, 348r 4, 523
' 10, 345' 1, 795' 3, 688
>-938
'24,228r 6, 137r 2, 353r 2, 768
r 1,801r 3, 935r 1.767
1,133
r 9, 528r 3 452
"•11,248
' 6, 296r 9, 745' 12, 361
'3 34°
' 5, 353'23,431
' 2. 938r 5, 394' 8, 677
-37,859
•-20,095r 17, 764-37,893
••19,945' 3, 175r 1, 727r 1, 968' 2, 956' 2, 571' 5, 538r 1, 646
'17,948' 4, 739
r 13, 209
r 3, 480' 7. 859r 5, 323* 3, 641'3,017' 14, 573
r 1, 492
r 2, 482r 3, 929
'52,018
'49,076' 2, 942
'52,004
'49,225' 4, 513' 2, 540r 4, 366' 7, 421' 7, 402'20,443'15,301
' 2, 779
' 1, 997'27,404'5,167' 17, 436
' 1,418'19, 670'11,931
ndurabl(tobacco iHied pro
c Corre<
10, 8972, 2453, 0271,938
15, 2081, 9715,3884, 515
10, 3661, 8053, 680
955
23, 90fi5, 9782, 3202, 763
1,8083, 903'1, 7351, 134
9, 4633 496
11,017
6, 2289, 552
12, 4883. 3385.377
23, 394
2, 9565, 4018,788
39, 200
21, 05818, 14237, 745
19,9123,4631,9331,9922, 9822,4605,3161,293
17,8334,740
13, 093
3,3857,8805,0083,8933,001
14, 578
1,4112, 1263,877
52, 474
49, 5432,931
52, 581
49, 7854,7982, 7484,4267, 5787, 428
20, 46115, 158
2,796
1,91227, 8245,204
17, 641
1,35419, 60712, 306
3 goods iiproducts1ucts, an2ted.
'.'.'.".'.'..'.
idustriesapparel
d rubberDigitized for FRASER http://fraser.stlouisfed.org/ Federal Reserve Bank of St. Louis

August 1964 SURVEY OF CURRENT BUSINESS S-7
Unless otherwise stated, statistics through 1962and descriptive notes are shown in the 1963edition of BUSINESS STATISTICS
1962 1963
Monthlyaverage
1963
June July Aug. Sept. Oct. Nov. Dec.
1964
Jan. Feb. Mar. Apr. May June July
GENERAL BUSINESS INDICATOR S— Continued
BUSINESS INCORPORATIONS d*Now incorporations (50 States and Dist. Col.):t
Unadjusted number
INDUSTRIAL AND COMMERCIALFAILURES <?
Failures total number-
Corn rnercial service _. doConstruction doManufacturing and mining _ doRetail trade doWholesale trade do
Liabilities (current), total thous. $_.Commercial service doConstruction doA'Tanufacturincr and mining doRetail trade do\Vhole^alc trade do
Failure annual rate (seasonally adjusted)No. per 10,000 concerns. _
15, 171
1,315
112225215629134
101,1337,831
20, 29533, 33329, 14310, 531
i 60. 8
15, 534
1,198
114200201557126
112,7167, 425
19. 28046, 47524. 94714. 589
i 56.3
15,06015,536
1,211
120158206591136
86,1519,559
11,92530, 55220, 69713,418
57.8
15,95915,431
1,155
101180173590111
120, 5097,614
31, 35045, 95526, 4639, 127
57.1
1 5,27716,093
1, 135
108210187522108
65,2335,304
12,39418, 74819, 3419, 446
54.5
13,82415,689
1,051
113189167467115
85,9186,579
21, 52228, 14915, 64414, 024
59.4
16,80816,275
1,262
133207217578127
91,83410, 75812, 98132, 77723. 60311.715
59. 6
12,97515,759
1,115
129198186479123
262,1124,171
20, 325197,94226. 83212, 842
55. 1
15,47215,867
998
91198176433100
68, 4273, 764
13, 93522, 66216, 84911,217
51.2
18, 82516, 193
1,217
109201205570132
96, 7315, 721
22. 16629. 64927. 37611.819
53.9
15,49516, 086
1,241
109204211572145
123, 935
7,23814. 93326. 26022. 68052, 824
55. 3
17, 67616, 064
1,320
131210212625142
110,99911,68620, 77620, 76219,51532, 260
56. n
17,36516, 242
1,197
101201216554125
112,88410, 35527, 87230, 65028, 15115.856
51.3
16, 39415, 932
1,075
92179188501115
93,41910, 24514,68737, 78223. 291
7.414
49. 4
16, 85615, 797
1,157
123219146563106
144, 496
SO, 90915,3491 7, 95121,6948, 593
53. 2
COMMODITY PRICES
PRICES RECEIVED AND PAID BY FARMERSPrices received, all farm productsO-__1910-14=100._
frops doCommercial vegetables do
Feed grains and hay doFood grains do
Fruit _ .- _ _ d o _Oil-bearing crops doPotatoes (incl. drv edible beans) _ __.do _ _Tobacco do
Livestock and products doDairy products doMeat animals _ _ _ _ __ doPoultry and eggs doWool - do
Prices paid:All commodities and services do
Family living items. __do _ _Production items do
All commodities and services, interest, taxes, andwage rates (parity index)! 1910-14=100
Parity ratio §£ . _ do
CONSUMER PRICES(U.S. Department of Labor Indexes)
All items 1957-59=100__Special group indexes:
Al l items less shelter _ _ _ _ _ _ _ doA l l items less food _ _ _ _ _ _ _ _ _ __do
Commodities^ doNondurables _ _ _ _ _ _ d oDurables^ _ _ _ _ _ do -
N e w cars. _ _ _ _ _ _ _ _ _ _ d oUsed cars__ _ _ . _. _ _ _ . __ do
Commodities less foodf doServices^ _ _ _ do
Food 9 doMeats, poultry, and fish doDairy products doFruits and vegetables do
Housing.. __ _ _ _ doShelter?* do
Rent - -- _ _ _ . _ _ doHomeownersbip* do
Fuel and utilities* doHousehold furnishings and operation* do
Apparel and upkeep* doTransportation do
Private doPublic. do _
Health and recreation 9* doMedical care _ _ doPersonal care _ _ _ _ _ _ „ d oReading and recreation do
244
231243
153226
296248157530
255253310145252
280294270
307
2 79
105.4
105 4106 1
103 2103 6101 8102 1115 2
102.8110 9
103 6101. 7104 1105.0
104. 8105 6105 7105. 6106. 1101.5
103.6107 2105 9115 4
109. 4114 2106 5109.6
242
237231
164224
279258157494
245253290146969
2832989 73
312
2 78
106.7
106 7107 4
104 1104 Q102 1101 5116 6
103.5113 0
105 1100.2103 8111.0
106 0106 9106 8107.0107.0102.4
104 8107 8106 4116 9
111.4I1 7 0107 ()111.5
241
244246
169215
3199 58149499
239231295134280
283298272
312
77
106.6
106 6107 3
104 0104 8102 0101 2117 7
103.3112 9
105 098.4
102 8115. 6
105 9106 8106 7106.8106. 7102.4
104 5107 4106 1116 6
111.4117 °107 8110.9
243
237238
170205
256181496
249940308138275
284299273
313
78
107.1
107 1107 5
104 6105 5102 1100 5118 1
103.5113 1
106 2100.2103 3118.7
106 0107 0106 7107.1106. 7102.4
104 5107 8106 4116 6
111.7117 3108 0111! 5
242
2321942 < 1168206
274955200479
250°513031429f>0
283298273
312
78
107.1
107 2107 6
104 6105 5102 1100 2119 0
103.6113 3
106 0101.4104 2114.2
106 0107 0106 8107.1106. 4102. 5
104 7108 3106 9117 1
111.9117 41()8 0112.1
242
939189276171213
264953161498
9509()92941499 56
283997273
311
78
107.1
1Q7 1
107 8
104 4105 3102 299 8
120 1
103.7113 5
105 4101.5104 3108.1
106 2107 1107 0107.2107.0102.7
105 4"*07 9106 5117 1
1 12. 1117 ^108 2112.3
242
935205
1()9
223
979964140495
2482699 861489g9
282297272
311
78
107.2
107 2108 1
104 5105 2109 7103 1120 0
104.2113 7
104 9100.4104 6106.3
106 3107 3107 1107.4107.3102.6
105 9TOO n
117 6
112.3117 7108 4112!?
242
9412502741582249 94971144490
943979979150965
282298971
311
78
107.4
107 4108 4
104 7105 4103 1103 2121 0
104.5110 Q
105 199.7
108.2
106 6107 71 07 9108.0107. 5102.7
106 1
117 6
112.4n 7 Q1 no A
112.8
237
941254264164226
303965144478
9342699Q0
146970
282298970,
311
76
107.6
107 5108 5
104 9105 6103 0102 1120 3
104.5
1 AC A
99.2
109.8
106 91 ns n
108.4107.6102.9
106 1
m o
112.7
108 8113.1
243
243270254166230
3002681 50488
249
965274154274
283298270
313
70
3 107.64 107.7
107 6108 4
104 91 AC 7
102 91 AO 0
119 6
104.3
1 O^ ft
98.3
112.4I AC Q
108.5107.7102.7
105 0
108. 0110 0
112.7
113.1
240
949986~ \249164229
9999631 56490
9Q7960969147281
283299971
qi q
77
3 107. 6107.6
107 5lAO A
104 &
1 AO A
m rj
104.1
98.3
113.9
inp> Qi ns °.
108.8106.8102.7
105 1
107. 2
112.9
113.3
239
941
259166215
9Q3''60
4. on
99-
9~Q
1449 At
28390S
3 107 8107 7
104.3
97 2
115.1
108. 9107.3102.8
108. 9107. 4
113.1
113.6
2369 43230267168225
316
191
9 3094°.-439 fix
136301
283
0"1
3 108 0107 8
107 7
104.3114.8
97 0104. 1115. 7
108.6107.4102. 9
1 A- C
109. 0107.6
113.4
114.0
235
948235271168218
^~'
%1
9949 6 3
1 31
282
3 107 9107 8
1 A,7 7
104.3114.9
96 6103.9115. 7
108.4107.2102. 9
109. 1107. 7
113.5
114. 1
232941240274168170
3019 46392489
294934264133299
282300969
313
74
3 108. 2108.0
lO'7 9ins 8
1 A K A
1 AO A
m 7
104.3
96.8104. 0120.2
108.7107.1102. 9
109. 2107. 8
113.5119. 3
114.0
234
234237274163162
272247307489
234040275139293
282'-{0/1
qi o
7K
T Revised. 1 Based on unadjusted data. 2 Annual data for 1961-63 for parity ratioadjusted for government payments made directly to farmers are as follows (unit as above):83; 83; 81. Descriptive material and annual data back to 1933 appear in the Dept of Agri-culture publication, "Agricultural Prices," January 1964. s "All items" index on oldbasis. i New series. Beginning Jan. 1964 the index reflects the following changes- (1)updated weighting factors and price data base; (2) improvements in statistical procedures;(3) a more comprehensive index, incl. single workers living alone, as well as families of wageearners and clerical workers; (4) expansion of the "market basket" from 325 to 400 items;and (5) increase in the sample of priced cities to 50 metropolitan areas and cities in the U Sincl. Alaska and Hawaii. The new series has been linked to the old series as of Dec. 1963to provide continuous series (see exceptions in notes "V' and "*"). More complete in-formation and data are available from, the Bureau of Labor Statistics, U.S. Dept. of Labor(Washington, B.C., 20210).
cFCompiled by Dun & Bradstreet, Inc. (failures data are for 48 States and Dist. Col.).t Re vised beginning Jan. 1963 (unadj. and seas, adj.) to incl. data for District of Columbia.
Seas. adj. data revised beginning Jan. 1962 to reflect new seas, factors. Revisions for Jan.-Dec. 1962, respectively, (seas, adj . ) are as follows (number): 15,599; 15,758; 15,670; 15,372;15,245; 14,947; 15,171; 15,056; 15,249; 14,892; 14,951; 14,985. ©Revised beginning 1961 to
§ Ratio of prices received to prices paid (incl. interest, taxes, and wage rates). IDatabeginning 1962 as shown here are not comparable with "old series" data formerly published.
9 Incl. data not shown separately. *New indexes.Digitized for FRASER http://fraser.stlouisfed.org/ Federal Reserve Bank of St. Louis

S-8 SUEVEY OF CUEEENT BUSINESS August 1964
Unless otherwise stated, statistics through 1962and descriptive notes are shown in the 1963edition of BUSINESS STATISTICS
1962 196.3
Monthlyaverage
1963
June July Au?. Sept. Oct. Nov. Dec.
1964
Jan. Feb. Mar. Apr. May June July
COMMODITY PRICES—Continued
WHOLESALE PRICESd1
( U.S. Department, of Labor Indexes}Spot market prices, basic commodities:
22 Commodities 1957-59=100 _9 Foodstuffs do13 Raw industrials do
All commodities _- doBy stage of processing:
Crude materials for further processing doIntermediate materials, supplies, etc__.__doFinished goodsO do
By durability of product:Durable goods _ - doNondurable goods . . do
Total manufactures doDurable manufactures doNondurable manufactures do
Farm products 9 - - doFruits and vegetables, fresh and dried doGrains -_ doLivestock and live poultry do
Foods processed 9 -- doCereal and bakery products doDairy products and ice cream _ _ do_ __Fruits and vegetables canned frozen doMeats poultry and fish . do __
Commod. other than farm prod, and foods.do
Chemicals and allied products 9 ...doChemicals industrial - do _Drugs and Pharmaceuticals doFats and oils inedible doFertilizer materials doPrepared paint do
Fuel and related prod., and power 9 - doCoal _ -doElectric power Jan. 1958= 100..Gas fuels doPetroleum products, refined 1957-59=100—
Furniture, other household durables 9 ---doAppliances household do _Furniture, household _ doRadio receivers and phonographs do
Hides skins, and leather products 9 _ do _-Footwear - doHides and skins doLeather do
Lumber and wood products _ _ do_Lumber do _
Machinery and motive prod. 9 ___ __doAgricultural machinery and equip doConstruction machinery and equip doElectrical machinery and equip doM^otor vehicles do
Metals and metal products 9 - - - doHeating equipment doIron and steel do
]\Tonmetallic mineral products 9 _ doCls?y products, structural do _ _Concrete products doGypsum products do
Pulp paper and allied products _ do. _ -Paper do
Rubber and products - _- do__ -Tires and tubes do
Textile products and apparel 9 doApp?rel - do —Cotton products - - do
Silk products - - do\Vool products do
Tobacco prod and bottled beverages 9 doBeverages alcoholic doCigarettes - - do- --
Miscellaneous - doToys sporting goods __ do
PURCHASING POWER OF THE DOLLARAs measured by —
Wholesale prices 1957-59=100..Coisumer prices - --- - do ,
1 93.089.895.4
100.6
97.1100.2101.7
101.0100.1
100.8101.3100.1
97.797.798.896.2
101.2107.6106.998.099.1
100.8
97.596.396.076.3
101.9103.8
100.296.8
102.8119.298.2
98.894.0
103.886.194.2
107.4108.6106.2108.596.596.5
102.3109.5107.898.4
100.8
100.093.299.399.2
101.8103. 5102. 6105.0100.0102.693.387.1
100.6101.5101.793 9
125. 999.1
104.1101.0101. 4107.3100.8
99.494.9
193.592.993.9
100.3
95.0100.5101.4
101.099.6
100.6101.399.8
95.796.1
101.988.8
101.1107.3107.5103.993.3
100.7
96.394.895.180.399.9
103.8
99.896.9
102.0122.897.2
98.191.8
104.682.89? 3
104.2108 384.0
101 998.698.9
102.2111.1109.697.4
100 0
100. 192 999.199. 1
101.3103.6101. 7105 499.2
102.493.890. 1
100. 5101.9100. 393 9
139'. 9100. 9
106. 1101.0104. 1110.4101.0
99.793.7
93.592.993.9
100.3
94.8100.6101.5
100.999.8
100.8101.2100.2
94.997.1
101.489.3
102.4107.0106.6104.694.1
100.7
96.395.095.280.6
100.8103.0
100.994.9
102.2120.399.9
98.191.9
104 .583.492.5
104.5108.285.8
102.598.399.2
102.0111.0109.697.799.3
100.093.399.098.7
101.2104 .0101.9105 .099.4
102.293.189.1
100.3102.099.793 8
148.0100.8
105.8101 .0105 .6108.1100.7
99.793.8
93.893 494 2
100 6
96.1100.6101 8
101.1100.1
101.0101.5100.4
96.897.099.594 4
102.2106 4107.3105 796 3
100.8
96.094.795.181.499.8
103 0
100.495.8
102.0121 298.7
98.091.7
104.581.591 9
104 3108 483 5
102 2101 6102.1
102.1110.9109.797.299.8
100.093.399.099.0
100.9103. 5101.2105. 099.0
102. 293.089.1
100.4102. 299.893 7
134.5100. 5
107. 5101.0105. 6110.4101.0
99.493.4
92 690 394 2
100.4
95.7100. 5101.4
101.299.6
100.8101.5100.0
96.392.598.593 5
100.9106 0107.9104 895 2
100.8
96.094.695.081. 796.9
103 9
98.996.2
101.9120 996.1
98.191.7
104.681.591 9
103 6108 480 5
100 1102 6102.7
102.1110.9110. 097.299.5
100.193.199.099.4
101.0103. 6101. 2105.899.1
102. 293.791.2
100.4102. 299.793 9
136. 6100. 6
107.5101. 0105.6111. 1101.2
99.693.4
93.091 494.1
100.3
94.8100.5101 5
101 199.5
100.7101 499.9
95.588.0
102.988 6
100 9107 0108 0105 394 2
100.7
96.094 594 981 397 2
103 9
99 097 2
101 8121 795.9
98.191 4
104 881.991 9
10^ 1108 477 399 599 9
100 7
102.2110.9110.197.299.3
100.393. 199.199.6
101. 1103. 4101. 3106. 199. 1
102. 293.491. 7
100. 5102. 399.994 0
130. 1100. 6
107. 5101. G105. 6111.8101.1
99.793.4
95.895 196.3
100.5
94.8100.9101.6
101.499.8
100.9101.7100.2
95.189.1
101. 888 0
102.2107 7107.4105 893 2
100.9
96.294 294.988 597.1
103 9
98 897. 7
101 4122 095.6
98.191 2
104 881.991 8
103 4108 480 599 599 299 3
102.3111.2110.497.499.9
100.993. 199.999.9
101.3103. 4101. 3106. 199.5
102. 894. 291. 7
100.7102. 5100. 294.2
126. 1100. 6
107. 5100. 9105. 6111.2101.1
99.593.3
95 793 497 3
100 7
95 1101.0101 8
101 5100 0
100 9101 8100 1
96 296.1
100 387 9
102 5107 3107 9106 491 7
100.9
96.394 °95 090 298 4
104 9
97 998 3
101 3122 393.8
98.191 2
104 881.891 8
103 5108 2
g9 7
99 799 299 3
102. 5111.4110.997.599.9
101.092.899.9
100.2
101.2103. 5101. 4106.199.4
102. 994.291. 7
101.1102. 3101. 394 4
130.5101. 6
107. 5100. 9105. 6110.9101.0
99.393.1
95 091 197 7
100 3
99 6101.1101 4
101 699 2
100 9101 999 9
93 394.8
101 879 9
100 4106 9108 1106 887 7
101.2
96.294 395 085 098 4
105 1
99 398 3
101 3124 896.1
98.091 1
104 781.7
1f\*} o
7A ^
QQ 9
102.6111.9111.297.799 9
101.392.7
100.0101.0
101.3
101. 4ion. i99. 4
93. 891. 4
101.2102. 3101. 594. 6
126. 3102.8
107. 5101. 0105. 0112.2101.1
99.792.9
95 591 598 5
101 0
95 1101.31Q9 1
101 7100 3
101 3101 9100 5
96 395.9
103 984 7
102 5107 0108 0107 291 8
101.3
96.394 395 483 199 4
105 1
99 598.3
101 3124 H96.6
98.491 5
105 081.590 9
102.7108 376.199 599.099.2
102.5112.1111.896.999.8
101.792.0
100. 2101.4
101. 1103. 5101. 2106. 199.8
103. 193.791.3
101. 210°. 3101.394.7
121. 6103. 2
107. 6101.0105. (5112.6100. 9
99.092.9
94 488 998 5
100 5
94 0101.2101 6
101 899 5
101 1102 1100 0
94 597.9
102 082 8
100 9107 4107 5107 488 9
101.2
96.494 295 383 2
100 2104 fi
99 098 1
101 3126 895.3
98.591 8
105 081.590 9
102 5108 274 099 799 9
100 3
102.5112.5111.896.999 8
101.891.8
100.2101.7
101.2103.8101.0108.699.9
103. 193.691.3
101.2102.3101.295 1
116.8103. 3
107.1101.0105. 6110.9100.9
99.592.9
94 387 998 9
100 4
94 3100.9101 5
102 099 2
100 9102 299 6
95 2104.999 i83 8
100 5106 8107 31 07 ^
88 7
101.1
96.5Q4 A.AC 9
inn 9
97 097 199 4
123 292.9
98.591 7
105 081.5
102 5108 275 799 g
101 0101 4
102.7112.6112.097.099 9
102. 092.1
100.2102.8
101.1103.9100. 7108. 699.3
103.593.991.3
101. 2102. 3101.195 5
116.6103.3
107.1100. 7105. 6109.8101.1
99.692.9
96 388 2
102 4100 3
94 2100.9101 3
102 298 9
100 9102 499 4
94 4105.9103 382 4
100 4107 8107 1107 388 3
101.1
96.694 495 487 3
100 2104 8
96 195 0
101 3120 491.1
98.691 6
105 281.591 2
104 5108 388 1
102 0101 8102 0
102.9112.7112.297.799.9
102.292.1
100.2104.0
101.3104.5100.6108.699.1
103.693.189.2
101.1102. 3100.595 5
116.4103. 2
107.1100.7105. 6109.5100.5
99.792.8
95.387 9
100 9100 1
93 5100.6101 3
102 498 4
100 8102 699 0
93 7107.4103.281 2
99 4107 5106 6106 386 9
101.1
96.794 595 588 6
100 2104 8
96 495 1
101 3116 692.2
98.691 6
105 381.591 2
104 7108 385 7
104 5101 8102.2
103.3112.7112.397.7
101.2
102.192 0
100.3103.9
101.3104.5100.6108.698.7
103.792.688.0
101.2102. 799.696 0
116.4102. 8
107.3100. 7105. 6107.2100.5
99.992.8
95 287 0
101 4r 100 0
99 4' 100. 3r 101 7
r 109 398 4
100 8r 1Q9 4
99 1
93 2113.189 882 3
100 2107 9
r 107 1106 190 2
r 100. 9
96.594 394 693 2
100 2103 9
96 3r95 3100 9
r H6 0
92.3
98.5r 91 9
105 381.591 2
r 104. 81C8 390.3
103 3101.4101.8
r 103. 0112.7112.3r96. 5101.1
102. 3'92.4100.4
r \ 04. 0
101.4104. 5100.8108.698.7
1C3.791.688.0
101.0102.898.79fi '>
* 11 7.0102.8
107.4100. 6105.6106. 7100. 9
2^100.0292 .6
95 886 8
102 5100 4
93 7100.5102 0
102 398 9
101 1102 599 7
94 1109.185 787 7
101 2108 6107 2105 393 3
101.1
96.694 394 695 6
101 1103 9
96 796.0
100 6119 692.' 5
98.591 3
105 382.090 3
105.3108 492.6
104 7101.2101.5
103.0113.0112.396.5
101.2
102. 592. 0
100.7104.4
101.5104. 5100. 9108. 698.7
103. 791.888.0
101.1103. 298.596 1
117.0102. 6
107.4100.6105. 6107.4101.0
2 99. 6
r Revised i Figures are for the month of June. 2 indexes based on 1947-49=100are as follows: Measured by—wholesale prices, 83.9 (July); 84.2 (June, revised): consumerprices, 75.5 (June).
actual wholesale prices of individual commodities, see respective commodities.O Goods to users, including raw foods and fuels. 9 Includes data not shown separately.
Digitized for FRASER http://fraser.stlouisfed.org/ Federal Reserve Bank of St. Louis

Aususl l.%4 SUEVEY OF CUERENT BUSINESS S-9
Unless otherwise stated, statistics through 1962and descriptive notes are shown in the 1963edition of BUSINESS STATISTICS
1962 1963
Monthlyaverage
1963
June July Aug. Sept. Oct. Nov. Dec.
1964
Jan. Feb. Mar. Apr. May June July
CONSTRUCTION AND REAL ESTATE
CONSTRUCTION PUT IN PLACE f
New construction (unadjusted), total t _ ._mil.$._
Private, total? doResidential (nonfarm) 9 do
New housing units _ doAdditions and alterations do
Nonresidential buildings, except farm andpublic utilities total 9 mil $
Industrial _ _ _ do _Commercial 9 do
Stores restaurants, and garages _ doFarm construction _ doPublic utilities do
Public total doNonresidential buildings doMilitary facilities doHighways doOther types do
New construction (seasonally adjusted at annualrates) totalf - --mil. $ _
Private total 9 - do
Residential (nonfarm) doNonresidential buildings, except farm and
public utilities, total 9 mil. $._Industrial _ . do..Commercial 9 do
Stores, restaurants, and garages doFarm construction. do___Public utilities do
Public total 9 do
Nonresidential buildings _ doMilitary facilities do-Hi gh ways do
CONSTRUCTION CONTRACTS
Construction contracts in 48 States (F. W. DodgeCorp.): A
Valuation, total mil. $Index (mo. data seas, adj.) 1957-59=100..
Public ownership _ _ mil $Private ownership _ _ do .By type of building:
Nonresidential doP>esidential do .Public works doUtilities do
Heavy construction:New advance planning (ENR)§ do
Concrete pavement awards:^Total thous. sq. yds..
Airports do"Roads .__ doStreets and alleys . _ _ doMiscellaneous do
HOUSING STARTS AND PERMITS
New housing units started:Unadjusted:
Total, incl. farm (public and private). ..thous..One-family structures do
Privately owned do
Total nonfarm (public and private) doIn metropolitan areas do
Privately owned do
Seasonally adjusted at annual rates:Total, including farm (private only) doTotal nonfarm (private only) do
New private housing units authorized bv bldg. per-mits (12,000 permit-issuing places):**
Seasonallv adjusted at annual rates:Total..' thous..
One-family structures do
CONSTRUCTION COST INDEXES
Dept. of Commerce composite^ 1957-59=100. _American Appraisal Co., The:
Average, 30 cities. 1913=100...Atlanta ... doNew York _ . doSan Francisco doSt. Louis _. do
Associated General Contractors (building only)1957-59= 100. _ !
4,954
3,4752,0241,5530)
960246413199107360
1,480429102532418
259, 453
41,695
24,292
11,5262,9494,9552,3851,2824,318
17, 758
5,1451,2226,378
3,4423 120
1,1332,309
1,0841,503
659196
1,766
9,483477
6,2172,789
124.483.0
121.9
122.487.7
119.9
2 1,2292756
107
756832836720741
111
5,204
3,6482,1541,6720)
988247433189106374
1, 557460
(J)556430
262,451
43, 772
25, 843
11,8592,9625,2002,2681,2664,494
18, 679
5,5240)
6,670
3,824133
1,2292,594
1,2121,716
683212
2,770
10, 053482
6,4113,160
134,883.8
132.2
132.594.8
130.0
2' 1, 3352r 750
109
780857858761760
114
5,785
3,9742,4951,825(i)
947227417185107395
1,811518141694458
62, 080
43, 175
25, 786
11, 2432, 8254,8282,0301,2674,543
18, 905
5,6491,5006, 732
4,402135
1,3843,019
1,4581,966
812167
2,072
9,793357
5,6493,788
157.3100.4153.4
155. 5109. '2151. 6
1 5711 554
1,363771
109
778852851762754
114
5,780
4,0342 4701,919(i)
1 010234451210117404
1, 746482131652481
62, 265
43, 693
25, 843
11,6102,8965,0442,1951,2674,619
18, 572
5,3581,4896,521
4,125126
1,3192,805
1,2711,934
742178
2,416
13, 661973
7, 5925,097
152. 398.2
150.2
150.7105. 2148. 6
1 5881 573
1,308735
110
782856851770754
115
63, 653
44,305
25, 752
12, 2193,0055,4492,4711,2664,704
19, 348
5,4441,5836,973
4,061132
1,3182,744
1,3221,883
675182
2,976
9,399184
5,6133 603
147.995.8
144.4
145.5100. 4142.0
1 4551 434
1,262726
110
786862867774762
115
63, 530
44, 633
25, 953
12, 5333,0495,6712,6111,2654,540
18, 897
5,6380)
6,600
3,707128
1, 1542,552
1 , 1541,789
662102
2,666
8,142254
4. 9682 920
147.392.9
145.3
144.1103. 7142.1
1 7321 697
1,372771
110
788862869775759
115
64, 966
45, 365
26, 584
12, 4313,0855,5182, 4771,2644,772
19, 601
5,815(i)
7,145
4,313146
1,3212,992
1 3312,028
748206
3,600
13,033189
8 1394 706
166.11C2. 7163. 1
162. 8116.5159.8
1 8471 807
1,412756
110
790863872778765
116
65, 072
45, 488
27, 000
12, 4803,1365,4692,3351,2614,473
19, 584
5,803(0
7,254
3,749144
1 1572,592
1 0821 519
704444
4,484
8,164199
5 1152 850
121.271.9
119.4
118.883.9
117.0
1 5641 533
1,369736
110
791863872778774
116
65, 193
45, 778
26, 896
12, 5923,1585,5152,3331,2614,753
19, 415
6,0750)
6,713
3,413148
1,1552,257
1 1021,325
699356
2,656
10, 389176
8 1772 037
96.850. 595.1
94.575.592.8
1 5641 518
1,426699
111
792863874778776
116
4,579
3,2581 8131,451(i)
1,01526843416898
312
1,321435
(i)397392
64,684
45, 440
26, 907
12, 4763,0605 4992,3301,2584 547
19 244
5 761(i)
6 685
3 346'l47
1 1982 149
1 1581 372| 816
6, 577
10,891256
4 g 4644 2 095
4 76
100.855.399.6
99.56 75. 0
98.3
1 7181 688
1.314710
111
792863884778779
117
4,177
3,0211 6261,316(i)
99326442516395
286
1,156429
(i)266376
65, 528
46, 274
27, 600
12, 5813,0585, 5462,3001,2544,547
19, 254
6,171(i)
6,169
3 201143
1 0412,160
1 0821 427
692
3,986
6,820225
5 1591 197
24Q
101.163.7
100.3
98.573.897.7
1 6571 613
1,405792
111
793870884780779
117
4,643
3,3251,9081,477(i)
98125742416796
317
1,318464
(i)351413
66, 509
46,923
28, 123
12, 7283,0745,6682,3511,2534 518
19 586
5,993(i)
6,796
4 215140
1 3392,876
1 2521 991
972
2,664
9,057836
6 9561 046' 219
133.382.2
130.1
131.596.6
128. 3
I CflO
1 638
1.384772
111
79387O
8847so77Q
117
5,098
3,6382 1881,610(i)
96325141115595
366
1,460525
(i)384454
66, 615
46, 449
27, 538
12, 6613,0765 5612,2931,2524 660
20 166
6 2590)
7 068
4 359138
1 3183,042
1 4202 006
933
3, 165
12, 997611
9 8612 402
124
152.3'90.7148.5
149.5r 102. 5
145.7
1, 2,56704
111
79487H
884.
117
r 5, 483
r 3, 895r2 345' 1, 703
(i)
1 01725444217599
'404
1 588517
(i)481477
'64,983r45 780
r 26, 678
12, 7563,1495 5422,2521, 250
r 4 746
r!9 203
r 6 040(i)
6 410
4 639138
1 5353 104
1 369
9 050
1,227
3,190
10, 831240
7 7142 716
161
157.799.7
154.7
155. 4* 112. 6
152. 4
1,246721
112
798
884.
78R
118
r 6, 152
r 4, 192r 2 553T 1 859
(i)
1 086258480207106
r 411
r 1 96()
r 596
(1)
710532
r66 183
r45 660
>• 26, 389
12, 9003 2045 5622,2681 247
r 4 709
r20 523
r 6 511
(1)6 888
4 504138
1 4913 013
1 4001 996
1,108
3,143
9, 463270
6 4742 481
238
158.0
154.9
155. 1113. 5152 0
1,306727
112
800
884.
119
6 056
4 2'749 598,
1 9530)
1 129266496217115411
1 832550
(i)
O(i)
65 501
45 878
26, 456
13, 0213 2925 5592,2671 2424 716
19 623
6 115(i)m
4, 823
112
806
OQ'i
119r Revised. i Not yet available; estimate included in total. 2 Annual total (also for
breakdown of new construction value). 3 Computed from cumulative valuation total.4 Prior to 1964, "miscellaneous" yardage was included with data for roads and streets.5 Effective Jan. 1964, based on 1963 definitions of metropolitan areas; not strictly comparablewith earlier data.
t Revised series. Revised annual totals back to 1946 appear in Construction Report C30-60;revised monthly data back to 1946 will be shown in a Supplement to be issued later by theBu. of the Census.
9 Includes data not shown separately. AM on thly averages for 1962 are based on annualtotals including revisions not distributed by months.
§ Data for Aug. and Oct. 1963 and Jan., Apr., and July 1964 are for 5 weeks; other months 4weeks. Comparable data prior to 1961 not available.
cTData for July, Oct., and Dec. 1963 and Mar. and June 1964 are for 5 weeks; other months,4 weeks.
* New series (from Bu. of Census reports, Series C-20). The 12,000 permit-issuing placescovered by these data account for a major portion (about 83 percent) of private residentialbuilding in the United States (1959-63 data for 10,000 places are also provided in Series C-20reports).
t Revised to 1957-59 reference base; also reflects revision of basic data.
Digitized for FRASER http://fraser.stlouisfed.org/ Federal Reserve Bank of St. Louis

S-10 SURVEY OF CURRENT BUSINESS August 1064
Unless otherwise stated, statistics through 1962and descriptive notes are shown in the 1963edition of BUSINESS STATISTICS
1962 1963
Monthlyaverage
1963
•Tune July Aug. Sept. Oct. Xov. Dec.
1964
Jan. Feb. Mar. Apr. May1
June | July
CONSTRUCTION AND REAL ESTATE—Continued
CONSTRUCTION COST INDEXES— Con.
E. II. Boeckh and Associates, Inc. :1Average, 20 cities:
All type s combined 1957-59 = 100_ _\partments hotels office buildings doCommercial and factory buildings do_ -Residences do
Engineering News-Record:Building -. 1957-59 = 100.-Constructlon -- -do
Bu. of Public Roads— Highway construction:r^/-vmT->rtoifo fciTrer fnr n f r '\ IQW 5Q — 100
CONSTRUCTION MATERIALS
Output Index:Composite, unadjusted 9 1947-49=100..
Iron and ptoel products, unadjusted doLumber and wood products, unadj doPortland cement unadjucted _do
REAL ESTATE
Mortgage applications for new home construction :Applications for FIT A commitments
th on s. units _ _
Requests for V A appraisals. _ _ doSeasonally adjusted annual rate . rto--..
TTome mortgages insured or guaranteed by—"Fed TIous Adm * Face amount mil $Vet Adm * Face amount^ do
Federal Home Loan Banks, outstanding advances
Now mortgage loan s of all savings and loan associa-tions estimated total mil. $_
By purpose of loan :Home construction doHome purchase doAll other purposes do_ _ -
New nonfarm mortgages recorded ($20,000 andin er; , t . - number
Fire losses (on bldgs., contents, etc.) mil. $__
107.8108.8107.8106.3
110.1114.7
2 98. 6
134. 5
131.6134. 6167.6
18.4
14.3
439. 24221.01
3 3, 479
1,730
498710521
2,8497,204
105. 42
110.2111.3110.2108.5
112.7118.6
2 101. 0
142.9
140.7140.5] 70. 1
15.8
11.6
464. 09253. 76
3 4. 784
2.061
586827648
3,0778,183
117. 13
110.3111.4110.3108.5
112.0118.3
99.6
151.5141.fi
162. 0133.7209. 3
17.5195
11.8100
419.35225. 60
3.270
2, 242
638936668
3,1778,059
106. 68
110.7111.8110.7108.8
113.1119.6
151.1156.9
162. 1128.6220.1
17.1182
11.91 09
511.16265. 14
3, 548
2,341
6191,003
719
3,5158,347
100. 93
110.811°. 0110.8109. 1
114.2120.3
161.7147.0
165. 8149. 2224.0
16.41 72
13.3
507. 7627S. 14
3.758
2, 428
6231,071
734
3,5258,463
113.73
111.2112.3111.2109.6
114. 2120. 3
101.7
152.4146. 2
147.2147.4207. 5
14.8173
11.3i <tn
505.002(37. 35
4,024
2.196
642928626
3.1777.898
98. 35
111.3112.4111.2109.7
114.6120.6
163.8144.7
154.9160. 7219.1
15.0176
11.2
567. 53316.01
4. 226
2. 387
685977725
3,5348,461
109.52
111.4112.5111.4109.8
114.3120.3
135.8142.4
126.0137.6181.7
11.41908.3•t if
444. 50258. 21
4,290
1,856
502757597
2,8807,959
94. 91
111.5112.6111.5109.9
114.4120. 4
103.4
122.2142.3
113.3130.2143. 5
10.31839.1
486. 68255. 35
4,784
2,118
620776722
2.9877,931
113. 12
111. 9113.0111.9110.2
114.6120.8
127. 213t\ 3
118.4142. 6113.2
11.51789.1
543. 00267. 77
4.414
1,716
434696586
2,7588,530
139. 33
111. 9113.1111.9110.3
114.6121.1
129. 8147 9
122.7141.9118.0
14.41939.4
439.85201.31
4,216
1.712
474674564
2,5758,097
118.85
111.9113. 1111.9110.3
115.0121.4
10'> o
149. 8156 0
151.1158.0147.7
19.0190
11.3
4*3. 39208. 70
4.168
2, 071
621784666
2,9358,711
126.45
112.3113.4112.3110.7
115.3121.9
158.8r 155 9
r 168. 7r 158.0
176.4
18.7190
11.1111
483. 07206. 20
4,444
2,081
579831671
124. 93
112.9114. 1112. 9111.1
115.6122. 3
158. 6147 7
164.4154. 6205 9
15.81739.5
99
456. 89192. 02
4,395
r 2. 145
r 597
'881r667
105.98
113. 6114 8113. 6111.8
116.2123.1
qq 3
17.9177
10.8103
570. 30232. 60
4, 769
2, 401
6301, 053
718ii
108. 56
1 116.61 124. 3
15.2169
10. 7ri9
616. 55
DOMESTIC TRADE
ADVERTISINGPrinters' Ink advertising index, seas. arlj.:i
Combined index 1957-59=100..Business papers . do ...Magazines - do...
Newspapers.. .. -- - .-do.. .Outdoor __ _ -do"Radio (network) _ _ _ _ _ _ _ _ _ .-do. .Television (network) ._ do
Television advertising:Network (major national networks):
Gross time costs, total. _ mil. $._Automotive, fnc l . accessories do"Drues and toiletries _ _- . . . .-do. _.Foods, soft drinks, confectionery _-do
Soaps, cleansers, etc doSmokine materials doAll other do
Spot (natl. and regional , cooperating stations):Gross time costs, total . ._ mil. $ _ _
Automotive, incl. accessories. doDrnsjs and toiletries ... - .. - doFoods, soft drinks, confectionery -do
Soaps, cleansers, etc -_ do. _.Smokine materials. doAll other. _. — _ _ d o ...
Magazine advertising (general and natl. farm maga-zines) :
Cost, total mil .$__Apnarel and accessories. doAutomotive, incl. accessories doBuilding materials. _ _doDrues and toiletries _ doFoods, soft drinks, confectionery do
Beer, wine, l iquors. _ __ doHousehold equip., supplies, furnishings. .doIndustrial materials do _ _ .Soap*1, cleansers, etc _ . . doSmoking materials.. _ ._ . ...doAll other . do._ .
113108119
1028875
118
2199.72 13. 1263.3239.5220.9222.2240.8
2 180. 32 5 . 9
236.12 60. 4
221.1
2 7.42 49. 4
73.04.67.92.37.1
10.6
4.54.93.7.8
2.823.8
118112127
968895
144
2 208. 22 14. 62 69.6^39.9
221.92 23. 92 38. 4
2 217. 828.1
242.8
2 22.92 9. 7
77.64.88.52.28.0
10.4
4.75.53.71.03.025.8
118110129
948796
144
207.213.967.838.3
22.023.042.3
223. 19.1
39.072. 4
25.711.265. 6
74.8
7.32.68.7
10.2
5.15.74.01.03.4
24.0
120114132
9888
102143
57. 0.9
4.71.57. 19.0
4.24.23.0
2.819.0
119109127
9781
118147
54. 55 13.81.46.47.8
2 92.83.0
72.7
17.9
124115131
10379
106151
200.813.367.939.1
22.624.233.8
185.37.6
34.960. 2
22.48.6
82.19.16.13.08.08.9
4.25.84.51.03.0
28.4
119113127
95101101142
99. 67. 0
14.82.29.9
12.4
5.58.45.11 43.3
29.6
114113131
908386
125
103.25 7
12.71.8
10 813.6
6.97.75.51 43 9
33.2
124117134
10685
106146
220. 816.372.343.0
21.625.042.6
242.98.4
48.782. 3
20.310.173. 1
77 23 95.91.59 9
11.0
8.84.42 8
43 8
24.8 '
120112126
1027978
151
54.02 07.0.9
6 29.0
1. 72.71.8
72 4
19.7
123108128
1038784
160
73 03 39.11 88 0
10.9
3 33.63 1
93 1
26.0
r 123113133
999183
r 15g
224 115 274 545 3
24 428 036 8
86 76 79.82 39 1
12.8
4 25.63 41 02 g
28^9
125108128
10710476
160
93 37 5
10.63 58 6
n!s4 57.14 99 19 7
30.0
~"
102 76 3
11.53 69 8
12! 9
5 9
9.65 41 93 9
33^2
83 52 o8.93 09 C
11.6
4 0
7, 74 C
3 7
26.3r Revised. i Index as of August 1, 1964: Building, 116.9; construction, 124.7.2 Annual average ba^ed on quarterly data. 3 End of year.^Copyrighted data; see last paragraph of headnote, p. S~l.
9 Includes data for items not shown separately.§ Data include guaranteed direct loans sold; these became sizable after 1962{Revisions for Jan. and Feb. 1963 are available upon request.
Digitized for FRASER http://fraser.stlouisfed.org/ Federal Reserve Bank of St. Louis

August 1964 SURVEY OF CURRENT BUSINESS S-ll
Unless otherwise stated, statistics through 1962and descriptive notes are shown in the 1963edition of BUSINESS STATISTICS
1962 1963
Monthlyaverage
1963
June July Aug. Sept. Oct. Nov. Dec.
1964
Jan. Feb. Mar. Apr. May June July
DOMESTIC TRADE—Continued
ADVERTISING— Continued
Newspaper advertising linage (52 cities):Total mil . lines
Classified do
Display, total doAutomotive doFinancial doGeneral -•- doRetail - - do._
RETAIL TRADE
All retail stores:Fstimated sales (unadj ) total tnll. $
Durable coods stores 9 _ _ doAutomotive group do
Passenger car, other auto, dealers doTiro, battery, accessory dealers do
Furniture and appliance group doFurniture, homefurnishings stores doHousehold appliance, TV, radio do
Lumber, building, hardware group doLumber bldg materials dealersd71 doHardware ^tores do
Nondurable goods stores 9 do _Apparel group _ _ -do_ _.
Men's and boys' wear stores doWomen's apparel, accessory stores.- -doFamily and other apparel stores doShoe stores - - do
Drug and proprietary stores doFating and drinking places _ do_Food group do
Grocery stores _ _ __ do.Gasoline service stations do__
General merchandise group 9 doDepartment stores doMail order houses (dept. store mdse.) .doVariety stores _ _ do__
Linuor stores do
Estimated sales (seas adj ) total J do
Durable goods stores 9 doAutomotive group do
Passenger car other auto dealers doTire battery accessory dealers do
Furniture and appliance group doFurniture, homefurnishings stores doHousehold appliance TV radio do
Lumber, building, hardware group doLumber bldg materials dealerscf doHardware stores do
Nondurable goods stores 9 doApparel group do
M"en's and boys' wear stores doWomen's apparel accessory stores doFamilv and other apparel stores doShoe stores do
Drug and proprietary stores doFjating and drinking places doFood group do
Grocer v stores doGasoline service stations do
General merchandise group 9 doDepartment stores doMail order houses (dept. store mdse.). doVariety stores do
Liquor stores do
Estimated inventories, end of year or month:fBook value (unadjusted), total mil. $...
Durable goods stores 9 __ _ _ _ _ _ _ doAutomotive group doFurniture and appliance group doLumber, building, hardware group. ..do
Nondurable goods stores 9--- doApparel group. ._ doFood group _ _ _ d oGeneral merchandise group do
Department stores* do. - - -
Book value (seas, adj.), total _ doDurable goods stores9 do
Automotive group doFurniture and appliance croup — _ _ do_ __Lumber, building, hardware group- -do
r Revised. 1 Advance estimate. 9 Includesprises lumber yards, building materials dealers, and
{Revised (back to Jan. 1953) to reflect use of ne^for trading day differences. Revisions for period1963 Census report, "Monthly Retail Trade Repor
233.260.5
172. 712.44.8
25.1130. 3
19,613
6, 2453, 5663,344
222
901583318
947728219
13,3671,195
228456301209
6691.4424,8014,3441 , 554
2, 2671.320
163371450
27, 07111,4724,7781, 8612,264
15, 5993, 4053, 3954, 4952,266
27, 93811, 7284, 8611,8992,349
data notpaint, pv seasons not sht, Adjust
238. 062.5
175.612.54.9
23.8134.3
20, 536
6, 6753,8303, 600
230
968622346
964743221
13, 8611.205
232466300207
6811,5064, 9294, 4631,614
2, 3881,390
177385472
27 82611, 7225,1461, 8582,231
16, 1043,4773, 5464, 6292, 395
28, 69111,965
5,2241,8942,314
shownlumbingil factorsown hered Sales
243.167.5
175.614.14.9
25.5131.0
20, 737
7.0444,1263, 865
261
933599334
1,050819231
13, 6931,127
239421265202
6641. 5924, 9574, 4831, 659
2,2661,340
141357450
20, 486
6,6303,8433,607
236
935611324
962750212
13, 8561,179
222471287199
6741, 5114,9234, 4561,584
2,4091,414
174389475
28, 04111, 8965,1471,8522,362
16, 1453. 3963, 6564,7712,392
28, 12411,6144, 8691, 8592,318
separate]and elecand nevse appeal
Supplei
212.563.6
148.911.65.5
19.2112.6
20,540
6, 9764,0033, 746
257
965608357
1,100876224
13, 5641,010
200390241179
6601, 6465. 0034, 5021,712
2, 1081,212
148341474
20, 719
6,7733, 9403, 709
231
979613366
958746212
13, 9461,214
239475298202
6741,4975, 0304,5401,602
2,4151,403
185385481
27, 95711,8375, 1291,8402,322
16, 1203, 3993, 5464.7722, 414
28, 25911, 6734, 9221, 8622,299
y. tf.trical st(T adjustn* in thenent."
231.166.8
164.311.23.7
18.7130.7
21,018
6, 5563, 5293, 288
241
992651341
1.138911227
14,4621,167
209446300212
6801, 0985,3184. 8281,730
2,4441,408
183390489
°0 666
6, 50'>3, 7333,512
221
939611328
992771221
14, 1041,259
247480323209
6851,5194,9964,5271, 612
2, 4751, 452
189387476
27, 57511, 1054, 2811, 8882,313
16, 4703,6293,4864, 9592,518
28, 14811, 6044,8101, 8922,318
2om-jres.oentsJuly
246.765.0
181.712.74.7
26.2138. 1
19, 267
5,9992, 9902,779
211
980647333
1,055842213
13, 2681, 161
203448296214
6471, 5264, 6844, 2381, 599
2,2751,340
172354437
20, 426
6, 6063,7173,495
222
985648337
975761214
13,8201,204
238465303198
6881,4704,8974,4411,605
2,3901,386
181386466
27, 89410, 8804,0981, 9042, 299
17,0143, 8583, 5305, 2552, 704
28, 14711, 6054,8901,8742,322
fReTradelier pe
*Ne
267.765.9
201.816.05.5
28.9151.4
21,528
7, 5994. 3874,148
239
1. 095719376
1.119897222
13,9291. 191
218472304197
6671, 5564, 9104, 4491,649
2,4171,404
197378466
20,716
6,9413,9803,748
232
1,028666362
986764222
13,7751,150
217451286196
6831,5304,9434,4841,618
2, 3031 321
173390478
29, 13411, 4004.4881,9682,273
17, 7344, 0063.6605 6282,953
28, 35711,6644,9591,8962,301
vised serbench m
riods apr.w scries;
258.461.8
196.613.04.7
25.8153.1
21, 494
6, 9853, 9493,712
237
1,077703374
1,002771231
14,5091,308
254509343202
6661,4865, 1534, 6891, 625
2.7281,590
248414510
°() 558
6, 7343,7913, 556
235
986640346
994754240
13, 8241,186
224463294205
6771,5064,9734,5121,638
2,3551, 355
183381473
29, 98911,9104,8461,9992,283
18, 0794, 0443, 7005, 7533, 036
28, 65111, 8565.1011,9042,320
ies. Rark dataear on p]for earlie
260.653.8
206.78.75.3
24.0168.8
25, 104
7,2083, 6903,377
313
1, 333790543
918610308
17, 8962, 172
471834572295
9061, 5335, 1944,6791,713
4.3992,625
307793724
21,019
6,8313,9353,685
250
1,021637384
952716236
14, 1881,250
239482307222
6941,5284,9914,5231,681
2,4741,457
184397483
27, 82611,7225, 1461, 8582,231
16, 1043,4773, 5464,6292, 395
28,69111,9655,2241,8942,314
e vised t(and to i
X 16-19 or periods
210. 659.8
150.810.66.8
18.2115.2
19, 154
6, 0313, 6773,488
189
905584321
712536176
13, 1231, 026
208407234177
6711,4365,0184,5581, 566
1,8721,094
140289433
21,000
6, 8553,9513,711
240
1,019671348
949730219
14, 1451,250
231497302220
6941,5805,0314,5481,638
2,4811,464
181410471
r 28,01812,0185,4391,8242,248
r 16,0003, 4433. 549
«• 4, 602r 2, 400
r 29,03012, 1095,2811,8922,330
) take aeeflect nef the Decback to
210.460.9
149.512.14.2
20.8112.3
18,758
6,1223, 6843, 505
179
920600320
709542167
12,636927176375220156
6561,3864, 8494, 3951,480
1,8751, 069
146313427
21,533
7,2624,1623,925
237
1,073707366
1,007779228
14,2711, 291
246505326214
6661,5934, 9914,5131,641
2, 5921,538
197408482
r 28,69212,3435,7291,8392, 291
' 16,3493, 6093, 639
r 4, 671r 2, 446
r 28,95412,1035,2851, 9022,331
count ofw season. 1963 SuDec. 195
248.066.3
181.712.75.4
25.4138.2
20, 502
6, 7414, 0583,847
211
973638335
798616182
.13.7611,283
206502309266
6801, 4854, 8914, 4061, 585
2,3031,336
178389434
21,223
6, 9393,8943,646
248
1,088711377
936727209
14, 2841,228
233477292226
7021, 5845,1124, 6051,629
2,4891,467
188404491
' 29,49612, 6965, 9191,9032,393
<• 16,8003,7103, 697
r 4, 874>• 2, 556
r 28,96912,236
5. 4301,9162,335
the lateal factorRVEY.6 see p. C
265. 168.6
196.515.75.6
28.8146.4
21,186
7, 3604, 4534, 215
238
1,004603341
938721217
13, 8201.140
204463202211
0051,5474, 8984,4141,617
2, 3101 , 306
1793C1446
21,392
7, 0104,0263,788
238
1,095701394
912707205
14, 3821,272
241504308219
6891,5995,0644,5741,674
2,5141,467
192421486
r 29,84012,7955,9171,9332,440
' 17,0453, 7573, 692
r 5, 012••2,613
r 29,24212, 3405,4791,9202,351
^.t (1962)s beginru
2 of the
275.974.8
201.117.14.8
29.2150.0
r 22, 508r 7, 693«- 4, 551' 4, 289
' 1,043(185
' 358
r 1, 047r 801r 246
r 14.8151 , 282r 240
506r 303»-233r 713
1, 650' 5, 248»• 4, 739r 1, 708
' 2, 479r 1,403
173' 399MSS
T 21,777r7,218r 4, 126^3,880
'246
' 1, 080699
'•SSI
'974' 754'220
' 14,5591,295'250
502r320-•223
••7131, 589
r 5, 034r 4, 540r 1, 670
r 2, 589' 1, 543
190M20M95
' 29,621' 12,768r 5, 850
1,9422,444
r 16,8533, 6673, 674
r 4, 954r 2, 608
r 29,215r 12,320' 5, 407
1,9442, 364
Annualng 1956.
Apr. 1964
247.068.4
178. 616.25.2
25.9131. 3
r 22,141
f 7, 682<• 4, 355
4. 079276
r 1,112725387
1, 119872247
r 14,459* 1,237
254468293222
r 709r 1, 693r 5, 087r 4, 578r 1,740
' 2, 479f 1,470
170398472
* 21,675
<• 6, 9693, 8563, 617
239
1,108725383
983759224
' 14,7061,320
244525328223
7261 , 6055, 1754,6701, 669
2, 6071, 521
200430503
29, 39512, 0825, 8031,9182,441
16, 7133, 5933, 0654, 9052, 553
29, 46512,3875,5111,9322,388
Survey cData
SURVEY
1 22, 1291 7, 463i 4, 185
i 1, 094
i 14,666i 1,103
i 7091,8235, 3754, 8571,818
2,3181,357
i 21,9281 7,118
i 14,810
)f Retailfor ear-
r.
Digitized for FRASER http://fraser.stlouisfed.org/ Federal Reserve Bank of St. Louis

S-12 SURVEY OF CURRENT BUSINESS August 1004
Unless otherwise stated, statistics through 1962and descriptive notes are shown in the 1963edition of BUSINESS STATISTICS
1962 1963
Monthlyaverage
1963
June July Aug. Sept. Oct. Nov. Dec.
1964
Jan. Feb. Mar. Apr. May June July
DOMESTIC TRADE—Continued
RETAIL TRADE— Continued
All retail stores — ContinuedEstimated inventories, end of year or month §—
ContinuedBook value (seas, adj.)— Continued
Nondurable goods stores 9 mil. $Apparel group _ - do. _Food group _ _ _ _ do- -General merchandise group do
Department stores* - - do _
Firms with 4 or more stores'.Estimated sales (unadjusted) total do
Firms with 11 or more stores :Estimated sales (unadj ), total 9 do. ..
Apparel group 9 doMen's and boys' wear stores doWomen's apparel accessory stores-- _ do. __Shoe stores do
Drug and proprietary stores doEating and drinking places _ __ _ do. _ _Furniture homefurnishings stores do
General merchandise group 9 do _Dept stores, excl mail order sales _do_ _.Variety stores do
Grocery stores _ - doLumber vards bldg materials dealers o" doTire battery accessory dealers do
Estimated sales (seas adj ) total9t do
Apparel group 9 doMen's and boys' wear stores doTV^omen's apparel accessory stores doShoe stores do
Drug and proprietary stores doEating and drinking places - doFurniture homefurnishings stores do
General merchandise group 9 doDept stores excl mail order sales doVariety s tores _.do
Grocery store s _ . d o _Lumber yards bldg materials dealerscf doTire battery accessory dealers do
All retail stores, accounts receivable, end of mo.:Total mil $
Durable goods stores doNondurable goods stores do
Charge accounts doInstallment accounts _. do
Department stores:Ratio of collections to accounts receivable:
Charge accounts percentInstallment accounts ..do. _
Sales by type of payment:Cash sales percent of total sales._Charge account sales doInstallment sales do
16,2103, 5693, 4054,8972,466
5,472
4,631
30729
12490
13710040
1,464901284
1,9206290
' 14,2996,2418, 0587,4416,858
4817
434017
16, 7263,6413,5605,0372,603
5,813
4,857
31630
13488
144104
42
1,585985295
1,9746391
115,4846,6268,8587,8267,658
4917
433918
16,5103, 5603,6634,9432,513
5,685
4,767
30730
13087
14110841
1,516965276
1,95073
103
4,848
31128
13683
14410442
1,593990297
1,9646593
13, 7996,3397,4607,1476, 652
4816
433918
16,5863,6163,6044,9232,536
5,518
4,601
26325
11571
13811138
1,415879263
1,91575
102
4,914
32433
14182
14510540
1,604995295
1,9926492
13, 7816,4577,3247,1576,624
4917
433918
16, 5443,6003,5464,9312,531
6,094
5,107
310
13884
14311544
1,6411,015
3012,137
7694
4,983
34133
14790
15010744
1,6461,035
2942,007
6388
14,0166,5597,4577, 2646,752
5017
443917
16,5423,6193,5414,9762,556
5,546
4,611
30925
12893
13510741
1,526961272
1,8957183
4,871
31631
13287
14710542
1,6051,000
2971,970
6389
13,9906,5327, 4587,1786,812
4817
424018
16, 6933,6553,5715,0452,609
5,947
4,915
31130
13183
13810951
1, 6151,000
2921,965
7593
4,809
29829
12584
14610746
1.523932298
1,9936491
14, 2696,5887,6817,3816,888
5018
414118
16, 7953,6863,5785,1082,654
6,411
5,364
34834
15283
14310552
1,8431,137
3212,140
6494
4,922
31027
13583
14410544
1,600993296
2,0156392
14, 3616, 4567,9057,3816,980
5017
433918
16, 7263,6413,5605,0372,603
8,239
6,943
56760
246133
226107
51
2,9951,850
6112,081
50132
5,043
32629
13792
14710642
1,6741, 050
3052,017
6199
15, 4846,6268,8587,8267,658
4918
453817
f 16,9213,7423,655
r 5, 078r 2, 679
5,328
4,478
247269773
14010232
1,262790216
2,0864675
5,089
33631
13994
15211141
1,6981,057
3182,041
6399
14, 6286,2598,3697,4097,219
4917
433720
' 16,8513,7553,679
M.929r<2 622
5,143
4,330
228229566
13810039
1,246763238
1,9824772
5,111
33733
14090
14811047
1,7431,090
3182,018
6798
14, 1236,0838,0407,1266,997
4816
423919
r 16,7333,6923,679
r 4, 901r 2, 564
5,773
4,859
36529
147119
14811145
1,564968304
1,9705282
5, 126
32629
13698
15711246
1,7211, 075
3192,055
6296
14, 3356,1318,2047,2217,114
5018
433918
' 16,9023,7313,666
r 4, 975r 2, 557
5,819
4,858
30426
13286
14111144
1,5921,002
2811,975
6196
5,105
34331
15191
14711246
1,7181,049
3292,030
6196
14,6386,2188,4207,4317,207
4818
424018
r 16,8853,7083,652
r 4, 972r 2, 600
'6,253
5,233
35033
148100
15212047
1,6961,074
3062,125
69106
5 165
34834
14695
15711545
1 7681 110
3201,999
6499
r l5 197r 6, 491r 8, 706'7,718r 7, 479
4817
434017
17,0783,7703,6655, 0752,668
6,100
5,107
33532
14494
15213146
1,6981,075
3041,981
79115
5, 240
34932
15391
15612746
1,7591 087
3242,066
67100
1 5, 0896,5338,5567,6147, 475
5118
443818
EMPLOYMENT AND POPULATION
POPULATIONPopulation, U.S. (incl. Alaska and Hawaii):
Total, incl. armed forces overseas© -.- - - miL
EMPLOYMENTNoninstitutional population, est. number 14 years
of age and over, total, unadj ~ m i l _ _
Total labor force, incl. armed forces thous..Civilian labor force, total _ do
Employed, total doAgricultural emplovmerit doNonagricultural emplovment do
Unemployed (all civilian workers) doLong-term (15 weeks and over) do
Percent of civilian labor forceNot in labor force thous ..
Civilian labor force, seasonally adjt- -- doEmploved, total do
Agricultural emplovment doNonaericultural employment do
Unemployed (all civilian workers) doLong-term (15 weeks and over) do
Rates (percent of those in group):All civilian workersExperienced wage and salary workers
2 186.66
130. 08
74, 68171,85467, 846
5, 19069 657
4,0071,119
5.655, 400
5.5
2189.38
132.12
75,71272. 97568, 8094, 946
63, 863
4. 1661,088
5.756,. 412
5.5
189. 16
132.04
77, 90175, 16570, 319
5,95464,365
4,8461,016
6.454, 135
72, 89168, 767
4 92463, 8434, 1241,080
5.75.6
189. 38
132. 20
77,91775, 17370, 851
5, 96964, 882
4,3229335.7
54. 279
73, 20769, 1C1
5, 00964, 0924, 1061,042
5.65.4
189. 62
132.34
77, 16774,41870, 5615,496
65, 065
3.8579495.2
55, 178
72, 98868, 9414. 872
64 i 0694,0471,083
5.55.4
189. 89
132. 50
75,81173, 00269, 5465. 326
64, 220
3, 5168864.8
56, 686
73. 09169, 0444,877
64, 1674,0471,078
5 55'. 4
190. 14
182. 68
76, 08673, 34469. 891
5. 35064, 541
3, 4539194.7
56, 596
73. 16869. 067
4, 93964^ 128
4, 1011, 114
5 65'. 5
190. 39
132. 85
76. 00073. 26169, 3254,777
64, 548
3,9368645.4
56, 852
73, 57269, 222
4, 90364,' 3194,3501,060
5 95'. 7
190. 61
133. 02
75. 20172. 46168, 6154, 039
64, 576
3,8469285.3
57, 824
73, 22469, 205
4, 89064! 315
4^0191,022
5. 55.3
190. 81
133. 20
74, 51471, 79367, 2283,993
63, 234
4, 5651, 106
6. 458, 685
73, 66769, 5674, 936
64,' 6314, 1001, 105
5 65! 3
191. 01
133. 36
75, 25972, 52768, 0023,931
64, 071
4. 5241,163
6.258, 099
73. 83569, 8324, 797
65,' 0354', 0031,007
5 45^2
191.23
133. 52
75, 55372, 81068, 5174.017
64, 500
4,2931,322
5.957, 965
73, 76069,' 8074 600
60' 2073^ 9531 047
5 45.1
191. 44
133. 68
76, 54473, 79969^ 877
4, 42965, 448
3,9211, 237' 5.3
57, 135
74, 58370, 5594 748
65, 8114,' 024
927
5. 45.'o
191. 64
133. 87
77, 49074, 74271,' 101
5, 00766,' 094
3,6401, 084'4 .9
56, 376
74, 59570 7544' 865
65 8893, 841
934
5 14^8
191.85
134.04
79, 38976 64571,' 953
5, 85366 100
4,6921, 007' 6 1
54, 652
74, 3407o' 387
4 83865* 5493 953l' 070
c q0. o5.3
192. 07
134. 22
78, 95876,21872! 405
5, 81966, 586
3,8138575. 0
55,258
74, 23070 5914 88 r>
65 7003 63^
' 95S
4 Q-t. if4.8
r Revised. 1 End of year. % As of July 1. § See note marked "f" on p. S-ll.9 Includes data not shown separately. * New series; see corresponding note on p. S-ll.cfComprises lumber yards, building materials dealers, and paint, plumbing, and elec-
trical stores. fSee note marked "J" on p. S-ll.
©Revisions for May 1960-Nov. 1962 are available upon request.} Revised monthly data (back to Apr. 1948) appear in the "Monthly Report on the
Labor Force," Jan. 1964, U.S. Dept. of Labor, Wash., D.C., 20210.
Digitized for FRASER http://fraser.stlouisfed.org/ Federal Reserve Bank of St. Louis

August 1004 SURVEY OF CURRENT BUSINESS S-13
Unless otherwise stated, statistics through 1962and descriptive notes are shown in the 1963edition of BUSINESS STATISTICS
1962 | 1963
Monthlyaverage
1963
June July Aug. Sept. Oct. Nov. Dec.
1964
Jan. Feb. Mar. Apr. May June July />
EMPLOYMENT AND POPULATION—Continued
EMPLOYMENT— Continued
Employees on payrolls (nonagricultural estab.):fTotal unadjustedf thous _
Manufacturing establishments doDurable goods industries __ __doNondurable goods industries do
Mining total 9 doMetal mining -- doCoal mining doCrude petroleum and natural gas.. do
Contract construction __ doTransportation and public utilities 9 do
Railroad transportation _ _doLocal and interurban passenger transit. .do
Motor freight trans, and storage do\ir transportation _ _ __ _doTelephone communication doElectric, gas, and sanitary services do
Wholesale and retail trade do"Wholesale trade do
Finance insurance and real estate doServices and miscellaneous -- - doGovernment do
Totn.1 seasonally adju^tedf doManufacturing establishments _do
Durable goods industries doOrdnance and accessories doLumber and wood products do --Furniture and fixtures doStonr* clay and glass products do - -Primarv metal industries do
ATacninerv doElectrical equipment and supplies do
Instruments and related products doMiscellaneous manufacturing ind do
Nondurable goods industries doFood and kindred products doTobacco manufactures doTextile mill products doApparel and related products doPaper and allied products doPrinting, publishing, and allied i n d _ _ d oChemicals and allied products doPetroleum refining and related ind doRubber and misc. plastic products__.doLeather and leather products do
Mining doContract construction doTransportation and public utilities doWholesale, and retail trade _ doFinance insurance and real estate doCervices and miscellaneous doGovernment - do
Production workers on mfg. payrolls, unadjusted:!Total, unad justed t thous__
Soasonaily adjusted. _ doDurable goods Industries, unadjusted, .do
Seasonfillv adjusted doOrdnance and accessories doLumber and wood products _ _ doFurniture and fixtures doStone clay and glass products doPrimary metal industries do
Blastfurnaces steel find rollin01 mills doFabricated metal products doMachinerv- _ _ - _ _ _ _ _ d o _ _Electrical equipment and supplies. _.doTransportation equipment 9 do
Motor vehicles and equipment _ __do _ _Aircraft a n d parts _ _ _ _ _ _ d o
Instruments and related products doMiscellaneous mfg. industries do
Nondurable goods industries, unadj doSeasonally adjusted do
Food and kindred products _ doTobacco manufactures doTextile mill nroducts doApparel and related products doPaper and allied products doPrinting, publishing, and allied ind__doChemicals and allied products doPetroleum refining and related ind do
Petroleum refining doRubber and misc. plastic products___doLeather and leather products do_ ._
55, 841
16, 8599,4937,367
65283
152299
2,9093,903
797271
880200688611
11,5823,0618, 5212,7987,9499,188
155,84116, 8599,493
271589385594
1, 164
1 1281,4901, 579
1 542360391
7, 3671. 760
91903
1, 267614925846195406360
6522,9093, 903
11, 5822,7987,9499,188
12, 494
6,946
120526320479936421864
1, 0361, 0601,061
534351230315
5,548
1, 17679
8121. 125
486594517125101314319
57, 174
17, 0359, 6597,376
63482
139293
3, 0293,913
774273
898210688612
11,8653 1438 7222,8668, 2979, 535
'57 17417, 0359, 659
5«6390608
1,166
1 1531 5201, 582
1 614372393
7 3761.738
89890
1,298621
928866188409350
6343, 0293 913
11,8652 8668, 2979 535
12, 585
7,059
119524324490942424884
1, 0531, 0571,113
572356237316
5, 526
1, 15577
7971, 151
48859052412095
315309
57, 609
17, 1119,7387,373
65084
139300
3,2323,954
789269
912211692619
11,8483.1328 7162, 8858,4239, 506
57, 19417, 0759,685
278559390612
1, 202
1, 1561, 5081, 593
1 623375389
7,3901,732
88889
1, 306620936868187414350
6393,0463,919
11, 8642,8658,2829,504
12, 65212, 6287,1387,086
118523322508984458894
1, 0551,0571,121
581352239316
5, 5145 5421, 146
64802
1, 14049259252712296
319310
57, 422
17, 0509,6667,384
64184
126302
3, 3643,975
790258
920212701626
11,8323 1688 6642,9168, 4749,170
57 34017. 1039, 701
277564392615
1, 208
1 1591 5121, 587
1 61S375394
7 4021, 730
87891
1,317623935870188408353
6403, 0693, 936
11,8842,8708,3499,489
12. 57112, 6507,0567 103
118528321512970453879
1,0411,0401, 099
565350237312
5, 5155 5471,188
63792
1,13348758952512296
307309
57, 651
17, 1999,6097,590
64685
135298
3,4373,976
791258
921212699626
11,8783 1968 6822,9198, 4579, 139
57 34417,0339, 652
'2755783 93616
1, 176
1 16°1 5251,574
1 580375398
7,3811,728
91887
1,302623937870189404350
6353,0833, 941
11,9072, 8738, 3739, 499
12, 70512, 575
6, 9957 051
118547331516946429889
1,0441, 048
984450351240332
5,7105 5941,272
88803
1,183495
59252812396
310316
58, 211
17, 3989,8017,597
64184
134295
3,3783,982
780276
934212693618
11,9423 1998 7432,8878, 4369, 547
57 45317, 0769, 705
275588392610
1, 164
1 1651 5311, 574
1 635"373398
7 3711,723
86886
1, 306622
935869190402352
6323,0713,950
11, 9222,8738,3779, 552
12, 92312,6117,1937 097
119551333510942420909
1, 0551, 0671.125
584356240341
5,7305 5141,285
95803
1, 180495
59752712195
315311
58, 426
17, 3679.8117, 556
63784
136290
3,3333 968
77697C
936212691611
I9 0143 2088 8062 8848' 4729 751
57 64617,1199, 718
277589391611
1,155
1 1641 5451, 571
1 647373395
7, 4011.742
89890
1,312620
934871189402352
6293, 0663,937
11,9352, 8878,4309, 643
12, 89512, 649
7,2047, 110
120543334504929410913
1,0561,0741,149
599361240342
5,6915 5391,248
94804
1,180493
59952612094
317309
58,220
17. 2299,7897,440
63484
136292
3,1763,944
770279
925213685611
12 1663 2088 ()r)82 8788, 4069 787
57 58017.0619. 688
275595392614
1, 155
1 1621*5481, 557
1 619'373398
7, 3731, 733
95889
1, 291622
931870189406347
6303, 0573, 928
11,9412. 8878,4239, 653
12, 75612, 590
7,1807,081
119534332501928408907
1.0591,0651, 157
608363241337
5, 5765 5091, 169
87802
1,161492
59852211894
318309
58, 585
17, 1399,7657,374
63183
137295
2,9253 931
773282
913214685610
12 7743 9389 ^62 8808 3799 926
57 74817, 1279. 737
276598394612
1 166
1 1691 rvn1, 566
1 699375397
7. 3901,741
91888
1, 295624
939871188405348
6303, 0693,915
11,9632,8928,4479, 705
12, 66512, 653
7,1557 129
119522329486941414904
1,0771.0621, 163
612366240313
5, 5105 524l' 128
83795
1, 150491
60252211693
315308
56,909
16, 9359,6667,269
61482
135290
2,6283,876
755284
885215685609
11.9173 9018 7162, 8758,3139, 751
57 85017, 1199, 726
276596394612
1, 169
1 1641 5591, 564
1 691375396
7, 3931,741
88891
1, 299624
940872186407345
6233,0173,923
12, 0722,9048,4749,718
12, 47212, 639
7,0647,120
118502324467945418891
1, 0831,0511,152
605363237294
5,4085 5191,081
76788
1,136484
59251911493
313304
57, 045
16, 9829,6767,306
61183
134287
2,6813 879
753283
888214688608
11 8373 1878 6502' 8858, 3629 808
58 18317,1759, 750
270601395618
1, 177
1 1761,5471, 559
1 631375401
7, 4251,743
89897
1,310627
942872185412348
6243, 1693,934
12, 1432,9118, 5159,712
12, 51812, 697
7,0757,148
114504325471958428892
1,0811,0401,148
598360237305
5,4435 5491,064
74795
1,174483
59452111493
315308
57,388
17, 0519,7347,317
61183
130288
2, 7603 883
754273
889215691609
11 9963 1888 7382 8958 4159 847
58 39717 9429,814
268607399693
1 183
1 1861 5671,563
1 (140377401
7. 4281, 735
90899
1.309627
943876185416348
6253, 1623, 930
12, 1432,9188,5529. 755
12, 58412,7597,1327,207
113506327480966434898
1,1041,0371,153
604357238309
5,4525 5521,057
70798
1, 177485
59852811492
317307
57, 945
17, 1069,8017,305
62485
129289
2, 9773 922
762278
899217699611
11 9873 1958 799
2 9138 5439 873
58 509
17 3019. 868
266599401691
1 909
1 5^51, 570
1 660377403
7,4331, 724
90897
1, 318629
947873185419351
6313,1443, 954
12,2112,9258,5439,793
12, 63412, 813
7,1987, 260
112518330494979444906
1,1121,0361,160
608354237315
5, 4365 5531 063
67799
1, 156488
59953311491
316302
' 58, 500
'17, 186r 9, 844
7,342
63186
128291
r 3, 191' 3, 949
r764279
r913219
••701613
'•I9 1003 9078 8939 9248, 6419 878
r58 WO17, 393
r 9, 853r 262r 592r 401r 693
r I 906
1 1 S91 585
^ 1,571
r ] (J43
370405
r 7, 470r 1, 725
90898
' 1, 336r 630
'953877184422
'355
628r 3, 159r 3, 961' 12, 209r 2, 930' 8, 572r 9, 808
' 12, 710r 12, 824
r 7, 241r 1, 236
109'532' 328* 506'989' 452
9111,116' 1,035
1,158608
'349'236
321
' 5, 4695 588
' 1, 07866
802' 1, 160
490
60053411591
319304
'59,178
'17,396' 9, 942
7, 454
'64788
129301
r 3, 365' 4 001
769272
946221708623
r\0 998
3 9498 9799 9578 7339 851
r58 750'17 300r 9, 886
' 255588
T 4 oftr (y>8
r 1 99 1
r 1 195r \ ^g^'1,571
r I 644'380r 403
' 7, 474r 1,711
90'898
' 1. 348' 632
'955'884
184'419
353
r 636' 3, 172' 3, 965' 12, 244' 2, 936' 8, 587' 9, 850
r 12, 888' 12, 860
' 7, 327' 7, 273
' 106' 553'337'521
' 1, 001462
* 926' 1,125r 1, 047' 1, 147
601'344
239' 326
5, 561r 5 5^7
1, 117' 66
' 809r 1, 181
498
r 604' 534' 117
92'321
312
58 968
17 3269,8777, 449
641
3 4924 994
I9 "0'} 9858 93 r>9 996H' 7739 496
fj8 88817 3809,913
250594411699
1 939
1 609
1,574
1 630380407
7 4671,707
91897
1, 334632
956888184423355
6403, 1863, 984
12, 2732, 9498, 6439,833
12, 81412, 894
7, 2697 314
10455833752!)999
9131,1151, 0461, 118
583338238321
5, 5455 5801 159
06794
1, 150492
60353511792
318310
"•Revised. * Preliminary. 1 Total and components are based on unadjusted data.tBeginning with the Sept. 1963 SURVEY, data for employment, hours, earnings, and
labor turnover reflect adjustments to Mar. 1962 benchmarks. The revision affects seriesback to Mar. 1959 and, for seasonally adjusted data, all series beginning Jan. 1952, with only
minor revisions prior to that time. Revisions not shown are available in the 1963 edition ofBUSINESS STATISTICS and in BLS Bulletin 1312-1, "Employment and Earnings Statistics forthe United States, 1909-62," 6 54 pp., $3.50, GPO, Wash., D.C., 20402.
9 Includes data for industries not shown separately.
Digitized for FRASER http://fraser.stlouisfed.org/ Federal Reserve Bank of St. Louis

S-14 SURVEY OF CUEEENT BUSINESS August 10H4
Unless otherwise stated, statistics through 1962and descriptive notes are shown in the 1963edition of BUSINESS STATISTICS
1962 1963
Monthlyaverage
1963
June July Aug. Sept. Oct. Nov. Dec.
1964 +
Jan. Feb. Mar. Apr, May June July »
EMPLOYMENT AND POPULATION—Continued
EMPLOYMENT— Continued
Miscellaneous employment data:Federal civilian employees (executive branch):
United States thous..Wash., D.C., metropolitan area ...do
Railroad employees (class I railroads) :Total - - - do
Index, seasonally adjusted 1957-59=100--
INDEXES OF WEEKLY PAYROLLS!
Construction (construction workers) t-1957-59= 100..Manufacturing (production workers) f doMining (production workers)t -- do_-
HOURS AND EARNINGS t
Average weekly gross hours per production workeron payrolls of nonagric. estab., unadjusted:!
All manufacturing estab , unadj f hours
Average overtime doDurable goods industries do
Seasonally adjusted doAverage overtime do
Ordnance and accessories do-Lumber and wood products doFurniture and fixture*' doStone clay and plass products doPrimary metal industries do
Blastfurnaces, steel and rolling mills. do
Fabricated metal products _ _ ._ doMachinery _ doFlectrical equipment and supplies do
Transportation equipment 9 - do -_Motor vehicles and equipment doAircraft and parts do
Instruments and related products doMiscellaneous mfg. industries do
Nondurable goods industries, unadj doSeasonally adjusted do
Average overtime doFood and kindred products doTobacco manufactures doTextile mill products do- -Apparel and related products doPaper and allied products. _ do
Printing publishing and allied ind do- -Chemicals and allied products doPetroleum refining and related Ind do
Petroleum refining - - doRubber and misc. plastic products doLeather and leather products do
Nonmanufacturing establishments:!Minin^Q do- --
Metal mining doCoal mining doCrude petroleum and natural ^as do
Contract construction do-- -General building contractors .doHeavy construction doSpecial trade contractors do
Transportation and public utilities:Local and suburban transportation doMotor freight transporation and storage doTelephone communication doElectric, gas, and sanitary services do- --
Wholesale and retail trade 5 doWholesale trade doRetail trade § do
Services and miscellaneous:Hotels, tourist courts, and motels doLaundries, cleaning and dyeing plantscf-do
Average weekly gross earnings per productionworker on payrolls of nonagric. estab. :f
All manufacturing establishments! --dollars--Durable ffoods industries _ do
Ordnance and accessories doLumber and wood products do
Furniture and fixtures - ._ _ doStone, clay, and glass products doPrimary metal industries do
Fabricated metal products _ _ doMachinery doElectrical equipment and supplies do
Transportation equipment doInstruments and related products doMiscellaneous mfg. industries do
2,311230
7202 79. 5
116.4113.790.5
40.4
2.840.9
2.8
41.139.840.740.940.239.0
41.141.740.6
42.042.741.840.939.7
39.6
2.740.938.640.636.242.5
38.341.541.641.241.037.6
41.041.5
«36.642.0
37.035.640.536.3
42.641.539.941.038.740.637.9
39.138.9
96.56104. 70116.3179.20
79.3798.57
119.80
104. 81113.0197.44
122. 2299.8078.21
2,328239
'714277 .1
127.0118.090.6
40.4
2.841.1
2.9
41.140.140.941.341.040.0
41.441.840.4
42.042.841.540.839.6
39.6
2.740.938.640.636.142.7
38.341.541.741.440.837.5
41.641.2
"38.842.1
37.336.041.336.5
42.241.640.041.238.640.637.8
39.039.0
99. 38108. 09119. 6081.80
81.39102. 42124. 64
108. 05116. 2099.38
126. 42101. 5980.39
2,335243
71577.3
138. 9119.995.9
40.840 53.0
41.641.33.2
41.240.940.942.142.241.9
41.742.140.6
42.343.241.440.939.7
39.839.62.8
41.240.341.036.343.0
38.341.742.341.640.737.9
42.741.741.042.3
38.436.642.937.5
43.042.240.041.338.940.738.1
38.539.6
100. 37109. 82118.2482.62
81.39104.41129. 55
108. 84117.0499.88
126. 90101.8480.19
2,344246
71477.5
146.8118.190.2
40.540 4
2.941.141.22.9
40.640.640.841.941.140.5
41.241.740.2
42.042.841.440.739.2
39.839.52.8
41.438.840.436.342.9
38.241.642.441.640.538.0
41.240.8
42.4
38.537.043.237.4
42.641.740.341.239.240.838.5
40.339.1
99. 23108. 09117. 7482.42
81.19104. 33125. 77
107. 53115. 5198.89
125. 58100. 9479.18
2,337244
71478.2
152.2118 293. 1
40.540 32.9
41.041 03.0
41.040.641.641.940.639.4
41.541.640.3
40.840.341.540.739.8
40.039.62.8
41.440.240.736.843.1
38.541.441.640.641.038.3
42.041.038.042.6
38.837.243.537.5
42.542.340.141.339.240.738.5
40. 639.0
98. 42107. 01119.3184.45
83.20104. 33123. 02
108. 32115 2398.74
121. 58101.34
79. 6C
2.312239
70378.2
149.5122. 694.0
40.740 73.1
41.341.33.2
41.340.841.641.840.739.3
41.941.940.7
41.942.141.741.139.9
39.939.73.0
41.639.740.636.343.2
38.641.542.241.741.437.5
42.141.639.242.1
38.336.642.937.2
42.142.040.541.438.640.637.7
39.239.1
100. 53109. 45121.0186.50
84.03104. 50123. 73
110. 20117. 32100.53
127.80102.7580.60
2,314240
69978.5
149.7122 692 8
40.740 63.0
41.441 23.2
41.240.841.642.140 438.7
41.841.840.6
42.743.941.641.140.1
39.939.82.9
41.239.741 336.343.2
38.441.441.741.041.137.8
42.341.339.042.5
38.937.343.637.7
42.042.340.441.438.440.737.5
39.139.0
100. 53109. 71121.1385. 68
84.03105. 67122.41
109. 93117.04100. 28
131. 52102. 7581.40
2,313240
69479.3
131.5121.590.5
40.540 53.0
41.241.13.2
40.839.741.341.540.639.0
41.541.840.4
42.844.341.441.039.8
39.639.52.8
41.038.941.335.842.8
38.241.441.541.541.037.2
41.341.237.842.2
36.435.140.035.7
41.841.340.841.438.340.537.3
38.838.8
100. 85110.00120.3682. 97
83.43103. 75123. 42
109. 56117.88100. (30
132. 68102. 9181.59
i 2, 4521243
69379.5
119.2122 491.4
40.840 53.1
41.641.53.3
41.540.041.940.641.339.5
41.942.540.8
43.044.741.541.039.8
39.939.62.8
41.139.441.335.943.0
38.941.741.441.541.738.9
41.642.139.742.3
35.334.336.735.5
41.941.939.641.538.840.938.0
38.638.9
102. 41111.90123. 2683. 20
85.06101.50126. 38
111.04120. 70102. 41
133.30102.9182.39
2,293239
68073.8
102. 4117.787.8
39.840 12.7
40.640.82.9
40.838.639.439.841.140.0
40.941.840.0
41.542.241.139.838.4
38.739.12.5
40.336.940.033.942.1
37.941.141.341.440.537.4
41.242.339.341.9
34.132.836.634.1
42.040.539.341.538.140.237.1
38.838.0
99.90109. 21121.1879.90
79.5999. 50
125.77
108.79118.71100.40
127.4199.9079.87
2,291240
-•67674.3
109.2119. 486.9
40.340 62.7
41.041.32.8
40.339.640.740.741.140.0
41.242.340.2
41.542.241.040.539.5
39.439.92.6
40.235.340.936.342.5
38.241.341.441.340.638.2
41.442.138.242.3
35.935.138.935.4
41.541.039.641.038.240.337.2
39.138.3
101.15109. 88119.2981.97
82.21101. 75126. 18
109. 18120. 56100. 90
126. 99101.6682.16
2,293241
'67774.9
114.1120.485.9
40.440 72.8
41.041.22.9
40.239.740.740.841.440.5
41.242.440.2
41.441.740.940.439.8
39.539.92.6
40.137.840.736.442.4
38.541.641.441.240.837.7
41.142.036.642.4
30.535.939.136.0
40.941.239.541.038.240.537.1
39.038.6
101. 40110. 29119. 3982.18
82.62102. 00127. 51
10.9. 59121. 26100. 90
126. 68101. 4082.78
2,304241
T 685' 75.7
127. 1122.089.4
40.540 72.9
41.341.43.1
40.439.940.741.641.640.9
41.542.540.3
42.042.941.040.539.6
39.439.82.7
40.339.540.736.142.5
38.541.641.340.940.936.5
41.541.637.642.1
37.136.040.536.4
41.941.539.341.038.240.637.2
38.838.9
102.06111.51119.9984.19
82.62104. 83128.54
111.22121 98101.56
129.36102.0682.76
1
2, 302241
"689P75.4
' 139. 7123 692 5
40 740 73 0
' 41 5r 41 4
'3 1
40 2MO. 5
40 5'42 1
41 841.0
41 8r 42.7
40 4
42 042.940 9
MO. 739.4
39.739 82.8
40.9'39 3
41 1'35.9
42.7
38 541.742.041.3
Ml. 437.6
' 42 0M2. 0'38.7M2. 1
37.9'36.5
42 1' 37. 1
' 42. 6r 41.8'39.8r 41.2r38 3
40 7r37 3
'38.639.3
102. 97'112.47120. 20' 86. 27
81.81' 106. 93
129. 58
112.02'122 98101.81
'129.36'102.56
81. 95
2,313246
p 693P 75.1
148.9r 1°6 1
95 o
40 940 63 2
41 741 43 4
r 40 4
40.741 0
' 42 242 041.1
42 0'42.8MO 5
' 42 5'43.6' 41 3Ml. 0'39.7
39.939 72.9
Ml. 1'39.7' 41 3
36.143.0
' 38 5Ml. 7M2. 1Ml. 2Ml. 6' 38. 6
42 341.939.641.9
38.236.642 437.4
42.742.339.941.338.740 837.8
38.439.1
103. 48113. 01
' 120. 80' 87. 51
83.23r 107. 61'130.62
112.98'123 ?6' 102. 47
' 131. 75r 103. 73' 82. 18
69775.7
194 5
40 740 63 0
41 441 53 2
39 740.740 742 141 7
41 742.340 4
41 742.341 540.739.4
39.83Q 52.8
40.938. 141 036.342.9
38 241.442.341.340.938. 9
102. 97112. 19119. 5088. 32
82. 62107. 36129. 69
111.761?1 40102. 21
128. 44102. 9781.95
r Revised. *> Preliminary. « Average for 11 months.1 Includes Post Office employees hired for the Christmas season; there were about 144.000such employees in the United States in Dec. 1963. 2 Based on unadjusted data.
!See corresponding note, bottom p. S-13. 9 Includes data for industries not shownseparately. §Except eating and drinking places.
o"Beginning Jan. 1964, data relate to nonsupervisory workers and are not comparablewith the production-worker levels for earlier periods.
Digitized for FRASER http://fraser.stlouisfed.org/ Federal Reserve Bank of St. Louis

1!K>4 SUEVEY OF CUEEENT BUSINESS S-15
Unless otherwise stated, statistics through 1962and descriptive notes are shown in the 1963edition of BUSINESS STATISTICS
1962 1963
Monthlyaverage
1963
June July Aug. Sept. Oct. Nov. Dec.
1964
Jan. Feb. Mar. Apr. May June July P
EMPLOYMENT AND POPULATION— ContinuedHOURS AND EARNINGS— Continued
Average weekly gross earnings per productionworker on payrolls of nonagric. estab.f — Con.
All manufacturing estab.f— ContinuedNondurable goods industries dollars
Food and kindred products . do ...Tobacco manufactures doTextile mill products _. do._-Appareland related products _do
Paperand allied products doPrinting, publishing, and allied Ind __ do-_.Chemicals and allied products doPetroleum refining and related Ind doRubber and misc. plastic products doLeather and leather products ~ _ do
Nonmanufacturing establishments:!Mining 9 -do
Metal mining _ _. do _ _Coal mining doCrude petroleum and natural gas. do
Contract construction _ _ . do__.General building contractors -doHeavy construction doSpecial trade contractors do
Transportation and public utilities:Local and suburban transportation doMotor f r ei gh t tran spor ta ti on and storage -doTelephone communication doElectric, gas, and sanitary services - do. _
Wholesale and retail trade§ _doWholesale trade doRetail trade§ do
Finance, insurance, and real estate:Banking _ __ do __Insurance carriers© do. .-
Services and miscellaneous:Hotels, tourist courts, and motels doLaundries, cleaning and dyeing plantsAdo
Average hourly gross earnings per productionworker on payrolls of nonagric. estab.:t
All manufacturing establishments! dollars..Excluding overtimed1 - do
Durable goods Industries doExcluding overtimed1 - do
Ordnance and accessories doLumber and wood products doFurniture and fixtures doStone, clay, and glass products doPrimary metal industries do
Blast furnaces, steel and rolling mills.do
Fabricated metal products doMachinery _ doElectrical equipment and supplies , _ . doTransportation equipment 9 _ _ do
Motor vehicles and equipment doAircraft and parts do
Instruments and related products doMiscellaneous mfg. Industries. . . do_._
Nondurable goods Industries do__.Excluding overtimed1 do
Food and kindred products doTobacco manufactures - doTextile mill products doApparel and related products doPaperand allied products do
Printing, publishing, and allied ind doChemicals and allied products doPetroleum refining and related ind do
Petroleum refining doRubber and misc. plastic products doLeather and leather products do
Non manufacturing establishments : tMining 9 -- - - do
Metal mining doCoal mining doCrude petroleum and natural gas do. -
Contract construction doGeneral building contractors doHeavy construction doSpecial trade contractors do
Transportation and public utilities:Local and suburban transportation . doMotor freight transportation and storage. doTelephone communication doElectric, gas and sanitary services do
Wholesale and retail trade§ doWholesale trade _ _ d oRetail trade§ do »
Services and miscellaneous:Hotels, tourist courts, and motels doLaundries, cleaning and dyeing plants Ado
85. 5491.6271.4168.2161.18
102.00107. 62109. 98126. 88100.0464.67
110. 70117. 45113 09109. 20
122. 47112. 50122. 31128. 50
100. 11113.3098.95
116 85
75.0896.2265.95
71 8093 46
46.1450.57
2.392 312.562 48
2 831 991 952.412.983,29
2.552.712.402.912.992.872.441.97
2 162.092.241 851 681 692.40
2.812.653.053.192.441.72
2.702.83
-3.092.603.313.163.023.54
2.352.732.482.85
1.942.371.74
1.181.30
87.9194.4873.7369.4362.09
105. 90110.30112 88131.77100. 7866.00
114.40118.66119 95111.99
127. 57117.72128. 03133. 59
101. 70117.31102. 40121 13
77.5999.4768.04
74 9796 28
47.5851.87
2.462 372.632 54
2 912 041 992.483.043.36
2 612 782.463 013.102 952.492.03
2 222.152.311 911 711 722.48
2.882.723.163.322.471.76
2.752.88
«3. 122.663.423.273.103.66
2.412.822.562.94
2.012.451.80
1.221.33 '
88 3695.1781.8169.7061.35
106. 21110.69113 42133. 25100. 5366.70
117. 85118 85128 74113.36
129 79118. 58132. 13135. 75
103. 63118.58102. 00121 42
78.19100. 1268.96
74 4096 13
47.3652.67
2.462 372.642 54
2 872 021 992.483.073.39
2 612.782.463.003.072.942.492.02
2 222.142.312 031 701 692.47
2.892.723.153.332.471.76
2.762.853.142.683.383.243.083.62
2.412.812.552.94
2.012.461.81
1.231.33
88.3695.6378.7668.6861.71
106. 82110.02113.98133. 98100. 0466.12
1 12. 06116. 69108 19112. 36
130.90120. 62135. 22136. 14
103. 09118. 85102. 36121. 13
78.7999.5569.30
74 7796.65
47.9652.00
2.452 372.632 54
2 902 031 992.493.063.37
2.612.772.462.993.052.952.482.02
2.222.152.312 031 701 702.49
2.882.743.163.342.471.74
2.722.86
2.653.403.263.133.64
2.422.852.542.94
2.012.441.80
1.191.33
88 4093 9873 5769 1963.30
107. 32111 27113 02130 21100. 8667 41
115 08118 08118 18113.32
13? 70122 02137. 03137 25
103. 28119.71102.26121 42
78 7999 7269.30
74 4096 66
48.3151.48
2.439 352.612 52
2 912 082 oo2.493.033.33
2 612 772.452 983.042 962.492 00
2 212.132.271 831 701 722. 49
2.892.733.133 312.461.76
2.742 883.112.663.423.283.153.66
2.432.832.552.94
2.012.451.80
1.191.32
89.3895.6871.4669.8364.25
108.43112.71114 13134 20102.6767.13
117.04121 06123 48113. 67
13290121.88136.85137.64
102.30120. 12105.30123 37
78.36100 6968.61
75 1496 72
48.2252.00
2.472 382.652 55
2 932 122 022.503.043.35
2 632.802.473.053.142.992.502.02
2 242.162.301 801 721 772.51
2.922.753.183.352.481.79
2.782.913.152.703.473.333.193.70
2.432.862.602.98
2.032.481.82
1.231.33
88.9894.3571.4671.0464.25
108. 43111.74113 85131.77101.9367.66
116.75120 60in 68113.05
134 98124. 58138. 65139. 49
102. 48120.13105. 04122 96
77.95100 9468.25
74 9796 79
48.0951.87
2.472 382.652 55
2 942 102 022.513.033.33
2 632 802 473 083.182 992.502 03
2 °32.162.291 801 7?1 772.51
2.912.753.163 332.481 79
2 762 923.122.663.473.343 183.70
2.442.842.602.97
2.032.481.82
1.231.33
89.1095.9473.1372.2863.01
107. 43110. 78113. 85132. 39102. 9166.59
113.99119. 89117 94113.10
125. 58116. 53124. 00131.38
102. 41117. 29106. 08123.79
77. 75100. 8568. 26
75 3596.86
47.7251.99
2.492 402.672 57
2 952 092 0°2.503.043.33
2 642 822.493.103.213 002.512.05
2 252.172.341 881 751 762.51
2.902.753.193.362.511.79
2.762.913.122.683.453.323.103.68
2.452.842.602.99
2.032.491.83
1.231.34
90. 1796.5974. 8672. 6963.54
108. 36113. 98115 09132 89105. 0869 63
116. 48122 51125 85113. 79
124 96115. 93118.17133. 48
102. 24120. 67103. 36124 92
77.60101. 4368.40
76 1397 67
47.8652.13
2.512 422.692 58
2 972 082 032.503.063.36
2 652 842.513 103.213 012.512.07
2 262.192.351 901 761 772.52
2.932.763.213 372.521.79
2.802.913.172.693.543.383.223.76
2.442.882.613.01
2.002.481.80
1.241.34
87. 8595.9172.6970.4060.00
106. 09110.67113.85132. 16101.2566.95
115.36123. 09124 97112.71
122. 08111.52118. 95129. 24
103. 32116. 24102. 18194 09
78.11100. 1068.26
76 7091 36
47.7253.58
2.512 432.692 60
9 979 072 o?2.503.063.35
2 662 842.513 073.173 012.512 08
2 272.202.381 971 761 772.52
2.922.773.203 352.501 79
2.802 913.182.693.583.403.253.79
2.462.872.602.99
2.052.491.84
1.231.41
89.0495.6868.8471.9864.61
107. 10111.93113 99132. 07101. 0968 76
115. 09122 51121 09112.94
127 09118.29123.31133.81
101.68118.49102. 56123 00
78. 69100 7568.82
77 0892 14
47.7054.00
2.512 422.682 59
2 969 072 022.503.073.37
2 652 852.513 063.143 022.512 08
2 262.192.381 951 761/732.52
2.932.763.193 342.491.80
2.782 913.172.673.543.373.173.78
2.452.892.593.00
2.062.501.85
1.221.41
89. 6795.8475.6071.6364.79
106. 85113. 58114. 40131. 24101. 5968.24
113. 85122. 64115 66112. 78
128. 48120. 98121. 99135. 36
98.98119. 89102. 70123 00
78.69101. 6668.64
76 0991 55
47.9754.81
2.512 432.692 60
2 972 072 032.503.083.37
2 662 862.513 063.143 012.512 08
2 272.202.392 001 761 782.52
2.952.753.173 332.491.81
2.772 923.162.663.523.373.123.76
2.422.912.603.00
2.062.511.85
1.231.42
89.8396.3280.1971.6363.90
107. 53113.58114 40130. 92102. 2566 43
115.37122 30121 45111.57
131 33122 76127. 98137 23
103. 49121.18101 79123 00
79 07102 3169 19
75 9291 63
48. 8955. 63
2.522 442.702 61
2 972 i\2 032.523.093.39
2 682 872 523 083.173 022.522 09
2 282.202.399 (Y-l
1' 77
2.53
2.952.753.173 332.50] 82
2 782 943 232 653.543.413 163.77
2.472.922.593.00
2.072 521.86
1.261.43
90 52' 98. 16'80 17
72 75' 63. 54
108. 46113 96115 51133 14' 104. 74
68 43
' 117 60'193 90' 195 78'111.99
' 133 03' 123 37133. 88' 139 13
' 105. 65' 122. 47r 104 28
' 79 66r 1 09 Q"7
' 69 75
' 76 2692 04
' 49. 0256. 59
2.532 442.712 61
2 QQ2 139 O92.543.103.40
2 68r 2 88
2 52r 3 08
3.183 032.522 08
2 98
2.20'2.40
2.54
2.962.773.173 OA
'2.53i 09
2 802 953 252 663.513.383 183.75
2.482.93
' 2. 623.02
2.08'2 53
1 87
'1.271.44
' 90 97' 98 64' 81 39' 73 10' 63. 54
109. 65'113 58' 116 34' 133 46' 105. 66' 70 64
118 O9
123 61129 89110. 62
133 39
122 98135. 26139 88
105. 90123. 52104 14
80 50
70 (\Q
75 8991 81
48. 0056.30
2.532 442.71
r 2 61
2 QQr 2 15
9 nci' 2. 55'3.11
3.40
2 692 88
r 2 533 103.20
' 3 04'2.53r 9 ny
'2.202.40
1. 77
2.55
2.952.793.17
'2.54
9 792 953 282 643.493.363 193.74
2.482.922.613.02
2.082 521 87
1.251.44
91 1497 3478 1172 Id64. 25
110.25112 69115 92134 51103. 89
70 41
2.532 442.719 «i
2 1 7
2.553.11
9 AS
2 872 533 083.173 r\r
2.532 no
2.212.382. 051. 761. 772.57
2.952.803.18
2.54
'Revised. t> Preliminary. ° Average for 11 months. § Except eating and drinking places.tSee corresponding note, bottom p. S-13. 9 Includes data for Industrie snot shown separately.
©Effective Jan. 1964, data exclude earnings of nonofnce salesmen and are not comparablewith earlier figures.
cfperived by assuming that overtime hours are paid at the rate of time an d one-half. A Ef-fective Jan. 1964, data relate to nonsupervisory workers and are not comparable with theproduction-worker levels for earlier periods.
Digitized for FRASER http://fraser.stlouisfed.org/ Federal Reserve Bank of St. Louis

S-16 SURVEY OF CURRENT BUSINESS August 1904
Unless otherwise stated, statistics through 1962and descriptive notes are shown in the 1963edition of BUSINESS STATISTICS
1962 1 1963
Monthlyaverage
1963
June July Aug. Sept. Oct. Nov. Dec.
1964
Jan. Feb. Mar. Apr. May June July
EMPLOYMENT AND POPULATION—Continued
HOURS AND EARNINGS— Continued
Miscellaneous wages:Construction wages, 20 cities (ENR): §
Common labor $ per hrSkilled labor do
Railroad wages (average class I) doRoad-building com labor (ntrly ) do
LABOR CONDITIONSHelp- wanted advertising seas adj J 1957-59—100Labor turnover in manufacturing estab.: f
Accession rate total mo rate per 100 emploveesSeasonally adjusted do
NTew hires doSeparation rate total do
Seasonally adiusted doQuit doLayoff do
Seasonally adiusted doIndustrial disputes (strikes and lockouts) :
Beginning in month:Work stoppages numberWorkers involved thous
In effect during month:
"Workers involved thousMan-days idle during; month do
EMPLOYMENT SERVICE AND UNEMPLOY-MENT INSURANCE
Von farm placements thousUnemployment insurance programs:
Insured' unemployment, all programs doState programs:
Initial claims doInsured unemnlovment weekly avg do
Percent of covered employment:^Unadjusted9pasonallv adiusted©
Beneficiaries weekly nverp^e thou^Benefits paid mil. $
Federal employees, insured unemploymentthous
Veterans' program (IJCX):Initial claims doInsured unemployment weekly avg doBeneficiaries weekly average doBenefits paid mil $
Railroad program:\pplications thousInsured unemployment, weekly avg . d oBenefits paid mil $
2.9464.348i 1.012.74012.31
110
4.1
2.54.1
1.42.0
301102
1,550
560
31,924
1,3091.783
4.4
1.525223. 0
29
285047
6.6
1762
11.1
3.0824. 5251 1 052.823*2.38
109
3.9
2.43.9
1.41.8
28078
1,340
548
2 1, 939
1,2851, 806
4.3
1, 541231. 2
31
295552
7.6
1347
8.3
3.0724.487
2.785
104
4.83 93.33 43 81.41.41.7
380128
593181
1, 550
577
21,568
9731,468
3.54. 1
1,327188.2
26
224245
6.3
1132
5.6
3 1024.5401 OQ
2 7502.44
109
4.34 02.74 14 01.42.01 9
37294
606183
1,810
5722 1 , 606
1.3511 493
3 64 1
l.°3S195.6
30
314438
5.9
4639
5.9
3 1304 585
2 755
105
4.83.73.24 74 22.11.92 0
31267
545167
1, 350
611
21,531
1.0861.419
3.44 2
1. 290186. 8
29
294542
6.2
1537
6.9
3 1344 591
2 782
107
4.83 93.14 93 92.41.81 8
98781
5001 55985
664
2 1.372
9571 261
3 04 0
1 107163 1
28
284240
5 7
1541
6.4
3.1344.602
992.7482.45
111
3.93.92.64.13.71.51.91.7
34696
574153
1,490
6622 1,445
1,1571.333
4 11,070172.0
29
314338
5.9
1241
7.5
3.1344.602
2 785
112
2.93 61.83 83 71.12 11 8
22380
467159
1,410
4932 1, 667
1,2001 . 542
3.64 1
1,127165. 0
32
294839
5.4
1145
6.7
3.1394.611
2 785
118
2 53 91 43 73 7.8
2.31 8
13227
33682
977
432
22,113
1.8051.972
4 74 3
1,594233. 0
34
396052
7.6
¥>47
8.6
3 1544.6361 14
2 7652 27
116
3.63 72.04 04 0
2.01 8
21060
370100
1,010
4432 2, 559
1,8489 395
5 74 3
1 997319.3
39
397367
10 2
1353
9 9
3 1694.640
2 803
117
3.44.02.03 33 81.11.51 7
22580
375195
1.130
4142 2, 408
1. 1812 'M3
S a4 o
9 015283. 8
40
29
719 6
518.8
3 1694.644
2 764
'118
3.74 02 23 53 81.21.61 7
22065
360100800
2 2, 200
1,1362 050
4 93 8
1 887292. 6
38
286759
8 9
545
8 5
3.1874.6581.14
2.7652.37
120
3.84.02.43.53.91.31.41.6
300122
4fO163
1,100
541
2 1, 886
1, 0861, 755
4.23 8
1,678258. 0
32
275764
9.7
1342
7.4
3.2024.680
118
-3.9r3. 8
2.5-3. 6'4 .0r1.5
1.41.7
410176
570218
2,180
572
21,552
9081,447
3.43 6
1,347201.5
97
204648
7.0
532
5.2
3.2334.728
121
M. 9P3. 9p 3. 5J > 3 . 3P3 .6P 1.4P 1. 2f 1.5
300134
585227
1 . 930
r 2 1,387
1 , 297
3. 13 6
1. 1421X3. 1
-->-
4249
6.6
97
3. 2824. 769
1 13
FINANCE
BANKING)pen market paper outstanding, end of mo.:
Commercial and finance co. paper, total ...doPlaced through dealers doPlaced directly (finance paper) _ _ d o
Agricultural loans and discounts outstanding ofagencies supervised by the Farm Credit Adm.:
Total end of mo mil $Farm mortgage loans:
Federal land banks _ __do _ .Loans to cooperatives doOther loans and discounts. - __do
3ank debits:Unadjusted:
Total (344 centers) bil. $_.New York City do6 other leading centers! _ _ . -do
Seasonally adjusted:Total (344 centers) do
New York City do
"edcral Reserve banks, condition, end of mo.:Assets total 9 - mil. $
Reserve bank credit outstanding, total 9 -doDiscounts and advances do .._U.S. Government securities do
Gold certificate reserves do
Liabilities, total 9 do...
Deposits, total 9 - doMember-bank reserve balances do
Federal Reserve notes in circulation do
Ratio of gold certificate reserves to deposit andFR note liabilities combined percent..
3 2, 6503 6, 0003 2, 08833,912
3 5, 753
3 3, 0523735
3 1 , 966
286.4118.058. 5
3 56, 020333,902
3 3833(),82()315,696
356,0203 18, 722317,454330,643
3 31. 8
8 2, 8903 6, 7473 1, 9283 4, 819
3 6, 4033 3, 310
88403 2, 253
312.9129.764.6
3 58,0283 36,418
8633 33,5933 15,237
3 58,028
3 18,391217,0493 32,877
3 29. 7
2,6977,2392,0495,190
6,326
3,198701
2,427
299.6125. 061.7
297.0121. 561.6
113.9
55,314
33, 80496
32, 02715, 457
55, 314
18, 18816, 96530, 670
31.6
2 719
7,5222,0595,463
6,408
3,218711
2,479
320.7129.966.8
320. 1130.366.9
122.8
55. 594
33, 946338
32, 46815.346
55, 594
18, 04416,97130, 959
31.3
2 6447,8082,0625,746
6,428
3,240706
2,482
300.1119.561.9
310.2127.863 3
119 2
55, 042
34, 134389
32, 39115, 291
55. 042
17 86016, 78231, 178
31.2
9 7097, 1612.0985, 063
6, 430
3. 259735
2, 436
310.4130.363. 1
329.7140.1
67 0122 6
55, 615
34, 302138
32, 56315, 309
55. 615
18 09316, 77231,265
31.0
2 7337,8692 2305,639
6,418
3,280848
2,290
337.2136. 971.3
326. 7133.769 4
123 6
56, 336
34, 587332
32, 75815,310
56, 336
18 18716 92231,472
30.8
2 7448,1702,1725,998
6, 366
3,291858
2,217
296. 6116 763.8
312.7125 467 3
120 0
57, 848
35, 919868
33, 66715. 294
57, 848
18 20016. 95232, 290
30.3
2 8906,7471,9284,819
6,403
3, 310840
2,253
357.1151 074.6
333. 0139 669 7
123 7
58, 028
36,41863
33, 59315, 237
58. 028
18 39117,04932, 877
29.7
2 9387,7652 0425,723
6,460
3,333866
2,261
360.8153 973.5
340.0143 769 6
126 6
56, 389
34, 643364
32, 75215. 231
56, 389
18 12016 98331,988
30.4
3 0-^68,1192, 0796,040
6. 54?
3,364849
2, 330
294. 9121 160.5
316. 1129 465 5
191 1
56 998
35, 274570
33, 16915, 185
56, 928
18 539
17 14631,899
30.1
3 1029' 0385, 699
6 627
3,406815
2,405
342.9145 871.1
331.6138 168 4
125 1
56, 699
35,314130
33, 77015, 190
56, 629
18 95817 06032, 088
30. 2
3 1027,9202,0395, 881
6,727
3,445786
2,496
349. 9148 272.8
350.2146 072 4
131 8
57,101
35, 115116
33.1691 5,1 95
57, 101
17 91316 62932,177
30. 3
3 0498,3261,9736,353
6 813
3,481747
2, 585
329.6135 368 6
327.8135 167 7
195 0
57 158
36, 066926
34, 22915 176
57 158
18 23216 89032,411
30.0
3 1498, 0361 9486 088
6 (*40
3 516757
2 667
353. 8151 °
70 9
334 3140 267 5
126 7
57 742
36, 5897 9
34, 79415 185
57 749
18 25016 97332, 835
29.7
57 XS°
36, 797239
35, 05115 18s
57 889
18 44 ">17 39733.109
29. 5r Revised. v Preliminary. 1 Quarterly average.2 Excludes persons under extended duration provisions (thous.): 1963—-June, 60; July, 45;
AUK., 38; Sept., 36; Oct., 31; Nov., 20; Dec., 9; 1964—Jan., 3; Feb., 2; Mar., 1; Apr., 32; May,54; June, 68. 3 End of year.
f Revised back to 1951 to incorporate adjustments as follows: Enlargement of sample;updated seasonal factors; new weights for component indexes based on labor force in cities
covered; and shift of index base to 1957-59 = 100. Monthly data (1948-62) appear on p. 24 oithe Mar. 1964 S U R V E Y . ©Revisions back to 1959 are available.
f See corresponding note, bottom p. S-13. §"\Vages as of Aue. 1, 1964: Common labor,$3.295; skilled labor, $4.787.
cf Insured unemployment as % of average covered employment in a 12-month period.^Includes Boston, Philadelphia, Chicago, Detroit. San Francisco, and Los Angeles.9 Includes data not shown separately.
Digitized for FRASER http://fraser.stlouisfed.org/ Federal Reserve Bank of St. Louis

August 1904 SURVEY OF CURRENT BUSINESS S-17
Unless otherwise stated, statistics through 1962and descriptive notes are shown in the 1963edition of BUSINESS STATISTICS
1962 1963
End of year
1963
June July Aug. Sept. Oct. Nov. Dec.
1964
Jan. Feb. Mar. Apr. May June July
FINANCE—Continued
BANKING— Continued
All member banks of Federal Reserve System,averages of dally figures :
Reserves held total mil. $Required __do_ __T C x c e s s _ _ d o
Borrowings from Federal Reserve banks. .-doFree reserves - do
Weekly reporting member banks of Fed. Res. System ,condition, Wed. nearest end of yr. or mo.:
Deposits:Demand adiustedo* mil. $_Demand total 9 -- --do
Individuals, partnerships, and corp do — .States and political subdivisions doU S Government doDomestic commercial banks do
Time total 9 doIndividuals, partnerships, and corp.:
Savings __doOther time do _-.
Loans (adjusted) totalcf doCommercial and industrial do __For purchasing or carrying securities doTo nonbank financial institutions _ _ d oReal estate loans d o _ _ _Other loans - do
En vestments, total. . do.. .U.S. Government obligations, total do
Notes and bonds doOther securities do
Commercial bank credit (last Wed. of mo., exceptfor June 30 and Dec. 31 call dates), seas, adjusted :f
Totfll loans and investmentsO bil $LoansO - - ---doTT S Government securities doOther securities do
Money and interest rates: §Bank rates on short-term business loans:
In 19 cities percent--New York Citv _ do7 other northern and eastern cities do11 southern and western cities do. ..
Discount rate, end of year or month (N.Y.F.R.Bank) - percent..
F d 1 1 c\ b lr 1 do
Home mortgage rates (conventional 1st mort-gages):*
Existing home purchase (TJ.S.avg.) doOpen market rates, New York City:
Bankers' acceptances (prime, 90 days) doCommercial paper (prime. 4-6 months) _ . doFinance Co. paper placed directly, 3-6 mo__doStock Exchange call loans, going rate doYield on U.S. Government securities (taxable):
3-month bills (rate on new issue) percent..3-5 year Issues _ do
Savings deposits, balance to credit of depositors:N.Y. State savings banks, end of yr. or mo..mil.$-.U S postal savings ^ do
CONSUMER CREDIT*(Short- and Intermediate- term)
Total outstanding, end of year or month mil.$_.Installment credit total do
Automobile paper doOther consumer goods paper _ _ _ d oRepair and modernization loans doPersonal loans doBy type of holder:
Financial institutions, total doCommercial banks doSales finance companies doCredit unions doConsumer finance companies doOther do
Retail outlets total doDepartment stores doFurniture stores doAutomobile dealers doOther _. . ._ _. . do
N'on installment credit, total doSingle-payment loans, total do
Commercial banks doOther financial institutions _do
120,040119,468
157213041268
65, 843102, 10971, 5315, 1254,749
14, 32150, 386
34, 9209,221
82. 94735,3515,9287, 365
15,51922, 81248, 14732, 36924, 51415, 778
228 3133.965.229. 2
2 5. 002 4 782 5. 012 5 32
3.003 4. 0535. 56
33.013 3. 2633.0734 .50
3 2. 7783 3. 57
23,917539
63 16448, 03419, 54012, 6053,246
12, 643
41, 78219, 00512, 1944,9024,1311,5506, 2523,0131,073
3451,821
15, 1305,4564,690
766
1 20, 7461 20, 210
i 53613271209
67, 844104,33574, 5135, 3384. 556
13,32059, 227
38, 08313,31092, 90138, 793
6, 6218, 595
17, 88023, 80948, 40429, 01823,12719, 386
246.5149. 462.135.0
25.012 4 792 5. 012 5 30
3.503 4. 263 5. 50
35.8435.98
3 3. 363 3. 5533.403 4. 50
33. 15733.72
25, 693452
69 89053, 74522, 19913, 7663,389
14, 391
46, 99221,61013, 5235, 6224, 5901, 6476,7533,4271, 086
3281,912
16, 1455,9595,047
912
19, 72919, 355
374236138
60, 95495, 19865, 7244,9926,879
11,99554, 910
36,51811,23484, 31135, 391
5, 3597, 306
16, 82922, 74347, 99129, 78924, 25318, 202
238.4141.764. 432.3
5 .014 785.015 32
3.004.105.50
5.825.94
3.243.383.214.50
2.9953.67
24, 763484
64 98750, 30721,23612, 4223; 281
13, 368
44, 37320, 60212, 6935,2514,2411,5865,9342 925
997331
1,68114, 6805, 7094,893
816
20, 02019, 537
483322161
63, 28192, 81866, 7954,9684,920
10, 87455, 581
36, 74111,69184, 38436,014
5,3287, 624
17, 03023, 28347, 60129, 09923. 89418,502
238. 0142.662. 632.8
3. 504. 165.50
5.825.93
3.413.493.354.50
3.1433.78
24, 777478
65 49150, 89421, 59312, 4593,316
13, 526
44, 87820, 87412, 8075,3304, 2761, 5916, 0169 999
994343
1, 68014, 5975,6834,874
809
19, 71919, 256
463330133
61, 52888, 01264, 024
4,7153,759
10, 71056, 326
36, 89612, 18184, 50235. 2045,0447,447
17, 26923, 49646, 62427, 68323, 72418,941
239. 2143. 662.033.6
3.504.285.50
5.825.93
3.593.723.574.50
3.3203.81
24, 862472
66 30851,52621,81912, 6073,357
13, 743
45, 37521, 10112, 9065,4124, 3291,6276, 1513,1071, 004
3411,699
14, 782
5.7894,879
910
19, 94519, 533
41232191
61,88595, 23766, 3204,9026, 229
12, 27056, 711
37, 34212,01387, 36636, 145
6, 2297,731
17, 45523, 64747,61828, 36723. 40019, 251
241. 5145. 462. 233.9
5.014 815.015.30
3.504.445.50
5.815.94
3.633. 883.634.50
3. 3793. 88
25, 154466
66 53851,71821, 72512, 7023,377
13, 914
45, 68721, 11513, 0735, 4584,3811,6306, 0313. 0251,009
3211, 670
14, 8205,8444,927
917
20, 00319, 596
40731394
63, 80990, 87567, 3224,7622,304
11, 452
57, 553
37. 53412, 63986, 59836, 296
5, 4077,243
17,65124, 09747. 15627, 99023, 15019, 166
241.2146. 1
34.3
3.50
5.50
5.825.93
3.633.883.724.50
3 . 4533.91
25, 236461
67 08852, 25721,97112, 8453, 400
14, 041
46,16121,39113, 1875, 5294, 4251, 6296, 0963,0771,015
3251, 679
14, 8315, 8304,952
878
20, 11419, 705
40937633
63, 95093, 77169, 0015,0602,714
11,56957,951
37. 69912,79688, 57837, 254
5, 8527,226
17, 84624, 874
46, 72027, 92623, 3281 8. 794
244. 2148.4
34.4
3. 50
5.50
5.825.97
3.713.883.754.50
3.5223.97
25, 368456
67 74652, 69522, 10713,0463,407
14, 135
46, 46221, 48613, 3025, 5694, 4611, 6446,2333,1721, 032
3261,703
15,0515,8944,987
907
20, 74620, 210
536327209
67, 844
104,33574, 5135, 3384. 556
13, 32059, 227
38, 08313, 31092, 90138. 7936, 6218, 595
17,88023, 80948. 40429,01823. 12719, 386
246. 5149. 4
35. 0
5. 004.765.045.29
3.50
5. 50
5.805.98
3.633.963.844.50
3. 5234. 04
25, 693452
69 89053, 74522, 19913, 7663.389
14,391
46, 99221,61013, 5235, 6224, 5901, 6476, 7533,4271, 086
3281,912
16, 1455, 9595,047
912
20, 67520, 248
427256171
64,94090, 22467, 6054,9261, 545
10, 73960 276
38, 13114, 05789, 12237, 1955,9297,339
17, 99124, 60646, 74627, 75922, 36218, 987
246. 7151. 0
34. 9
3.50
5.50
5.835.98
3.703.973.824.50
3. 5294.06
25, 940447
69 9Q3
53, 59722, 18913, 6383.354
14,416
47, 30021. 63013,8405,5844,5921,654
6, 2973, 0631,065
3281,841
15, 606
5,9004, 991
909
20, 14819, 753
39530491
62, 56590, 57565, 4605,1883,755
10, 81060 930
38, 29114, 39089, 87537, 5905,6957,511
18, 16124, 66446, 97227, 59193, 26019,381
248.4151. 861. 235.4
3. 504. 625.50
5.815. 95
3.753.883. 764. 50
3.5324.02
26, 089436
68 78653, 55222, 27113, 4673,335
14,479
47, 45421, 79913, 7885,6074,5951,665
6,0982,9491,047
3301,772
15,2345,9585,036
922
20,21319,856
35725998
62, 532
95,81166, 6595,3495,130
12,19261 446
38, 70414,41892 00238, 308
6,0338, 179
18, 36625, 93946, 37J26, 87092 68019,501
251. 4153. 962. 135.4
4. 994 775.025. 29
3. 504.635.50
5.795.94
3. 754.003. 834.50
3. 5534.15
26,411430
68 91353, 79522,47113,4513,321
14, 552
47, 65321,91913, 8025, 6684,5971,6676,1423,0441,022
3341,742
15,1186,0025,076
926
20, 27319, 898
375213162
63, 95991,23266, 8135,5292,948
10 46462 223
38, 43714, 95092 20838 057
5,9527 881
18 52026, 02946, 47226, 71392 75919 759
251. 8155. 460. 835. 6
3.504. 705.50
5.795.92
3.803.913. 804.50
3.4844.18
26, 421425
69 81654,38222, 83013,4763,328
14, 748
48,19122, 22413,8935,7764,6281,670
6, 1913 1061,013
3401,732
15,4346,0485, 152
896
20 219L9 886
33325578
61, 47291, 47464. 3125, 3004,997
11 21863 100
38 79615, 46893 65838 943
6. 5988 013
18 70626 01046. 13326, 56729 58819 566
253. 5157. 360. 335.9
3.504.735. 50
5. 775.92
3. 753.893. 764.50
3.4824.07
26. 585421
70 94555, 12023, 25513, 5993, 364
14, 902
48, 82422, 55914. 0275, 8894, 6571,6926, 2963 1891,090
3481, 746
15, 8256.2065,230
976
20 55820 170
388270118
62 654
98 71767, 206
5, 4057 286
11 78463 119
39 05315 36096 099
38 7856, 7998 887
18 93696 97546 73826, 62199 49()90 117
255. 1158.959. 936. 3
4.99
5. 03
3. 504 745. 50
5 765. 89
3. 754.003.884.50
3. 4784.03
26, 900415
71 90755,91423, 70213,7303, 395
1 5, 087
49, 54322, 90714,228
6,0144, 7011,6936, 3713 2311 028
3551,757
15,9936 2335,313
990
20 66420 264
400265135
63 67490 75466, 3974,8973 604
10 44163 991
39 16815 943
94 56838 504
6, 3848 064
19 12027 119
45 76425, 70199 104
'>0 003
3. 50
5 765.93
3.753. 963.814. 50
3. 4793. 99
27, 051
r Revised.1 Average for Dec. 2 Quarterly average. 3 Monthly average.d"For demand deposits, the term "adjusted" denotes 'demand deposits other than do-
mes tic commercial interbank and U.S. Government, less cash items in process of collection;for loans, exclusive of loans to domestic commercial banks and after deduction of valuationreserves (individual loan items are shown gross; i.e., before deduction of valuation reserves).
9 Includes data not shown separately. JData have been revised as follows: Com-mercial bunk credit (seas. adj. only), back to 1948; consumer credit—unadj., back to 1962;
seas, adj., back to 1960. Revisions are available as follows: Commercial bank credit,1948-63, in the June 1964 Fed. Res. Bulletin; consumer credit—1962 unadj., in the Nov. 1963Fed. Res. Bulletin; 1960-62 seas, adj., on p. 28 of the June 1964 SURVEY. ©Adjusted toexclude interbank loans. §For bond yields, see p. S-20.
*New series (FHLBB); data prior to Dec. 1962 not available. f Data are as Of en(j o,fconsecutive 4-week periods ending in month indicated, except June figure which is as of June30 (end of fiscal year).
Digitized for FRASER http://fraser.stlouisfed.org/ Federal Reserve Bank of St. Louis

S-18 SURVEY OF CURRENT BUSINESS
Unless otherwise stated, statistics through 1962and descriptive notes are shown in the 1963edition of BUSINESS STATISTICS
1962 1963
Monthlyaverage
1963
June July An?'. Sept. Oct. Nov. Dec.
1964
Jan. Feb. Mar.! ! ]
Apr. May j June ! July
FINANCE—Continued
CONSUMER CREDIT!— Continued
Total outstanding, end of year or month— Con.Noninstallrne.nt credit — Continued
Charge accounts total m i l . $ _ _Department stores do —Other retail outlets do_ _ _Credit cards do
Service credit -do
Installment credit extended and repaid:Unadjusted:
Fxtended total doAutomobile paper _ _ d o . _ -Other consumer goods paper doAll other do
Repaid total do __.Automobile paper doOther consumer goods paper doAll other do
Seasonally adjusted:Fxtended total do
Automobile paper doOther consumer goods paper doAll other do
Repaid total doAutomobile paper do
All other do
FEDERAL GOVERNMENT FINANCE
Net cash transactions with the public :d"Receipts from - -- mil. $ .Payments to -- doExcess of receipts, or payments (— ) doSeasonally adjusted quarterly totals: §
Receipts -doPayments doExcess of receipts, or payments (— ) do
Budget receipts and expenditures:Receipts, total do
Receipts, netj doCustoms doIndividual income taxes doCorporation income taxes doEmployment taxes doOther internal revenue and" receipts do
Expenditures total f - - doInterest on public debt doVeterans' services and benefits doNational defense doAll other expenditures do
Public debt and guaranteed obligations:Gross debt (direct), end of mo., total. nil. $..
Interest bearing total doPublic issues do
Held by U.S. Govt. investment accts. doSpecial issues do
Noninterest bearing - - d o _ _ _Guaranteed obligations not owned by U.S. Treas-
ury end of month - -.bil $ _U.S. savings bonds:
Amount outstanding, end of month. doSales, series E and H doRedemptions do__ -
LIFE INSURANCE
Institute of Life Insurance:Assets, total, all U.S. life insurance companies §
b i l . $ _ _Bonds (book value), domestic and foreign,
total bil $U S Government doState countv municipal (U S ) doPublic utility ( U S ) doRailroad ( U S ) doIndustrial and miscellaneous (U S ) do
Stocks (book value), domestic and foreign, totalbil. $..
Preferred ( U S ) doCommon (U S ) do
IVTortgacre loans total doNonfarm do
Real estate doPolicy loans and premium notes doCash _ doOther assets do
Payments to policyholders and beneficiaries inU.S., total mi l .$__
Death payments doMatured endowments ._. . doDisability payments doAnnuity payments doSurrender values __ . . doPolicy dividends do
5,684927
4, 252505
3,990
4, 5941,6501.3071.6374, 2181.4561. 2451,517
8, 8509, 323-472
8, 9837, 059
1034,3401, 8211, 1081, 6127, 659
796442
4, 4252,052
303. 47
1299.211255.7Si 11.99i 43. 43
1 4. 26
i 47. 87. 36.47
i 133.29
i 63. 7216.1714.03
i 16. 5113.48
i 28. 64
16.3012.1814.03
146.90i 43. 50
14.11i 6. 23i 1. 46i 4. 57
777. 1323.259.511.869.8
147.7165. 0
5,871895
4, 456520
4. 315
5. 0681,8341,4171,8174. 5931.6131,3201,659
9. 3819, 763-382
9, 5237. 293
1054, 5251.8971,3461, 6507,849
852439
4,4142, 189
1309.35
1305.211 261. 56i 14.14i 43. 66
1 4. 13
i .74
i 49. 03.40.42
835.7350.7
67.412.975.1
149.1180.4
4,783'599
3, 689495
4, 188
5,2221, 9671,410i. 8-: 54,3991. 5251 , 2601,614
5, 0541,8201.4081,8264, 5681, 5881,3171, 663
13.9809, 4724, 508
27, 84528, 503-658
13, 99612, 061
955, 3055, 5111,3401,7457,715
865385
4, 6161,886
305. 86
301.95257.15
13. 4044. 803.91
.61
48.47.35.40
136. 70
65.235.763.98
16.523.50
29.77
5.452.273.10
48.4244.834.246.441.215.71
824.9325.065. 912.473.5
147.8200.3
4,760555
3, 682523
4,154
5, 3652, 0551,3931. 9174, 7781. 6981,3561,724
5. 1001,8541,4091, 8374, 5911, 6031,3301,658
4, 69310,045-5, 353
4,8713, 547
1171,676
574537
1,9677, 863
882468
4.1782, 579
304. 84
300. 94257. 21
13. 2043. 723.90
.65
48. 58.41. 4 4
137. 67
65.585.843.95
16. 493.48
30. 07
5.452.283.08
48. 6645.034.266.511.265.94
798.3352. 363. 913.580.3
150. 1138. 2
4,839579
3,713547
4. 154
5, 242i 839, 456,947,610, 6 J 3. 308, 689
, 100, 802,441, 857,619, 607, 326. 686
10, 96011,287-328
9, 9777. 290
1085. 785
3862, 0611 . 6338, 305
85046f>
4. 4692, 572
306. 54
302. 52257. 01
13.2145. 524.01
.67
48. 70.40.39
138.36
65. 725.813.94
16.493.48
30.23
5.502.293.11
48.9645.294.316.551.256.07
780.6343.864.712. 762.3
154.1143.0
4. 833620
3, 667546
4,143
4, 7551,5241,3841,8474, 5631, 6181, 2891, 656
5, 0931, 7301.4251. 9384. 7521,6591,3471.746
11.6529 5192, 102
28, 47230, 395
-1,923
11,722
1045. 3503, 6031 , 0981.5677,815
856438
4, -'152, 334
306. 64
302. 66258. 01
13.4844. 653.97
. 69
48.74.35.42
138. 76
65.795.823.89
16.463.47
30. 33
5.562.303.17
49.2345.524.346.581.345.92
798. 5324. 663.812.671.9
143.7181.9
4,898639
3.743516
4.. 103
5, 4872,0401, 5471,9004,9481,7941,4041, 750
5.3111, 9101, 4571, 9444, 7801.6761,362
4, 42310.740
-6,318
4,3713.400
1231,651
557468
1, 5718, 776' h65463
4,7102, 750
306. 44
302. 46259. 1813. 7643. 283. 93
.71
48. 82.39.42
139. (U
66.085.833.89
16.473.46
30.62
5.562.293.18
49.5445.804.366.621.346.11
860.7368. 1
70.613.176.0
149.4183.5
4.999667
3,817515
4,158
4.9811. 7341,5171,7304,5431,5981.3161.629
4, 9791. 7921.4321,7554. 5961.6381.3241,634
9,6179,812-194
8,9117,131
1065,541
3961,4401,4287,784
863454
4,0812, 386
308. 22
304. 09260. 54
14.0143. 554.12
72
48. 93.33.34
140. 21
66. 365 793.89
16.483.45
30.98
5.582.313.18
49.8146. 064.376. 651.326.11
731.3307.5
67.411.571.9
127.1145.9
5, 871895
4, 456520
4,315
5,9741, 7672.0942,1134.9241, 6751,3741,875
5 272,914,523, 835,812.707,384,721
10. 50310, 069
433
28, 97629, 962-986
10, 3798, 803
1033,5823,7261,1471, 8208, 289
903455
4. 5152, 442
309. 35
305.21261. 56
14. 1443. 664.13
.74
49. 03.36.39
140.90
66. 105.763.88
16. 433.43
30. 94
5.682.343.25
50 5446. 754.356.691.446.10
1, 083. 0369.773.114.874.4
163. 5387. 5
5,339782
4, 014543
4, 367
4,7841,6891, 3801,7154,9321,6991.5081, 725
5. 2761,8881,4931, 8954, 8481, 6841,4411. 723
6, fi289. 848
-3, 219
6, 5805, 853
1013,873
583404
1,6198, 492
925481
4.3482, 819
308. 58
304. 50262. 58
14. 4441. 924.08
.76
49.11.47.53
141.87
66. 635. 783.86
16.443. 41'
31.41
5.742.353.29
50. 8347.01
4.376.731.286.29
885.8400. 378.712. 693. °
151.5149. 5
4, 805655
3, 590560
4,471
4, 5521,6861,2121,6544, 5971, 6041, 3831, 610
5,4211, 9531,5781,8904, 8421.7161,3951.731
11. 5259, 3932,132
12, 2358,047
87
6,975451
2, 8351,8877.521'880450
4, 3651,946
310. 36
306. 13263. 2514.3942. 88
4.22
. 79
49. 21.41. 43
142. 53
66. 795. 803.86
16. 423.42
31.46
5.772.353.32
51. 1347.27
4.386.771.276.43
838.2364. 6
72.112.1
77.4146. 6165. 4
4,634614
3,485535
4,482
5 3'>21,9831,4881,8515,0791,7831,5041,792
5, 4801,9421,6651,8734, 9561,7351.4681,753
12,1689. 3902,778
29, 00830 J91-823
13. 96110, 148
1083, 9916, 6541, 5791,6297,871
907455
4,3782,143
309. 59
305. 40262. 1814.2343.224.18
. 82
49. 26.40.48
143. 07
66. 765.733. 85
16.443.41
31.51
5.852.363.39
51.4447.524.396.821.286.53
938. 0397. 681.313.882.5
167.3195. 5
4,833610
3, 667'556
4,553
5,5782, 1271,4951, 9564, 9911, 7681,4701, 753
5,3711,9611,5441, 8664, 9591, 7591,4531,747
8,33410, 163
-1,829
9, 5596, 609
1095, 895
6841, 1061, 765
7,930895415
4, 5642,071
307. 60
303. 38261. 38
13.9342.004. 22
.80
49.30.38.45
143. 68
66. 915. 693.85
16. 433.41
31.64
5.902.373.43
51. 8147.82
4.406.871.176.61
885.5386. 575.513.779.6
158.5171.7
5.0996'? 6
3.910563
4 590
5.5842, 1371.5471. 9004.8461,7121. 4241.710
5, 5522. 0231, 5891,9405. 0591, 7761. 4831 , 800
10 65°9,5331,119
10. 5256.136
1005. 398
4912, 8641.6727. 511
899449
r 4. 666a, 523
311.53
307. 21262. 18
14. 1645. 03
4. 32
.80
49. 37.37.41
144. 31
67. 115.733.83
16. 473.40
31. 76
5.942.393.44
52. 1248.08
4.426.911.186.64
830. 2356. 9
72.013.775.0
147.8164.8
5, 238fil()
4, 028600
4, 522
5, 9492,2451, 6322. 072
5, 1 551, 79S1 . 5011 . 856
5, 3991, 9621, 5371, 9005, 0291. 7681. 4861, 775
14.2X010,29!)3. 996
28, 43829, 341
—903
"14,438'•12,310
" 117I'* 4, 810P 6, 196" 1,4(10P 1,855
v 9, 513p 948p 500
p 5, 661-" 2, 451
311.71
307. 36260. 73
14.3446. 634. 36
.81
49.44.38.45
311. 18
30(1 ho261. 12
45. 744.33
. N2
49. 50.39. 47
~ ~
IData for net receipts and total expenditures reflect exclusion of certain interfund trans-actions.
Digitized for FRASER http://fraser.stlouisfed.org/ Federal Reserve Bank of St. Louis

SUEVEY OF CURRENT BUSINESS S-19
Unless otherwise stated, statistics through 1962and descriptive notes are shown in the 1963edition of BUSINESS STATISTICS
1962 | 1963
Monthlyaverage Juno July Aug.
1963
Sept. Oct. Xov. Dec. Jan. Feb. Mar.
1964
Apr. May June July
FINANCE—Continued
LIFE INSURANCE— Continued
Life Insurance Agency Management Association:Insurance written (new paid-for Insurance) 't
Value estimated total m i l . $ _ _Ordinary doGroup and wholesale doIndustrial do
Premiums collected:Total life insurance premiums do__
Ordinary doGroup and wholesale doIndustrial - do
MONETARY STATISTICS
Gold and silver:Gold:
Monetary stock, U.S. (end ofyr.ormo.)_mil. $_.Net i-pip^p from earmark^ do"Exports thous $Imports - do
Production world total mil $So nth Africa doCanada doUnited States do
Silver:"Exports thous $Imports _ _ doPrice at New York dol. per fine oz__Production:
Canada tnous fine o/IVTexloo doUnited States . do
Currency in circulation, end of yr. or mo bil $
Money supply and related data (avg. of dally fig.) :|Unadjusted for seas, variation:
Total money supply bil $Currency outside banks doDemand deposits _ _ _ _ d o
Time deposits adjusted^ doU S Government deposits. do
Adjusted for seas, variation:
Currency outside banks doDemand deposits do
Turnover of demand deposits except interbank andU.S. Qovt., annual rates, seas, adjusted:
Total (344 centers) ratio of debits to deposits..New York City do6 other centered" . do337 otber reporting centers do
PROFITS AND DIVIDENDS (QTRLY.)
Manufacturing corps. (Fed. Trade and SEC):Net profit after taxes all industries mil $
Food and kindred products doTextile mill products - doLumber and wood products (except furniture)
mil. $Paper and allied products. . . _ . doChemicals and allied products - d o _ _ _Petroleum re fin in £r _ ._ _ - _ doStone, clay, and glass products doPrimary non ferrous metal _ ... doPrimary iron and steel -doFabricated metal products (except ordnance,
machinery, and transport, equip.) mil $Machinery (except electrical) doElec. machinery, equip., and supplies doTransportation equipment (except motor
vehicles, etc ) mil $Motor vehicles and equipment _ doAll other manufacturing industries do...
Dividends paid (cash), all industries doElectric utilities, profits after taxes (Federal Re-
serve) mil. $Transportation and communications (see pp. S-23
and S-24).
SECURITIES ISSUED
Securities and Exchange Commission: tEstimated gross proceeds, total. mil. $..
By type of security:Bonds and notes, total do
Corporate _ _ _ doCommon stock _ _ _ _ _ _ d oPreferred stock d o _ _
6, 6314, 6801,358
587
1.052778155120
115,978-66
31,74712, 578
r 2 107. 974.412.14.5
1,2626, 208
3 1. 084
2.5563,437
* 3, 029
- 35. 3
5 146. 2530.1
8 116. 15 91.1
55.9
41.577.841.227.7
64,430«342688
6416 157e 5606809814561338180
6152632763056 11065726508
6 2, 320
6513
2,496
2,35274710935
7, 4555, 2841. 574
596
1,125842167116
115, 513-21
16, 9823,701
2 112.580. 011.64.3
3,4805, 9101.279
2,4873, 2863, 843
137.7
5 ir>o. 6s 31. 5
5 119. 05 105. 5
5 5.9
44.384.844.629.0
64,871e 362
6 88
6 626 158°607e 9586 1486 1416234
e 167« 358e 325
6 1116 640c 510
e 2, 467
« 546
2,635
2, 5219068529
7,1995,1921,404
603
1 072811159102
15,733-39
152, 062
SO. I11.6
2, 0186, 8541.277
2, 4083. 1953, 346
35. 5
148.331.4
116.9105. 2
7.5
150. 231.5
118. 6104. 6
42.579.342.728.1
5 21335690
68164674865219149321
179417326
129751503
2,371
498
5,054
4,9421 133
7538
7,1795, 1921,417
570
1,127853160108
15, 633-169
1899,769
81.610.9
2656,0131. 290
>?, 2163, 5873.800
35.7
149. 531.8
117.7106.2
7.8
151.031 0
119, 4105 6
45.885.146.830. 3
2,089
1,9897106535
7,0825, 1491,339
594
1,127847174100
15, 582—44
837, 506
81.711.7
1,0244, 8051 . 288
2, 9083. 3503, 328
35. 8
149. 231.9
117.3107. 5
0.3
151. 231.8
119.5107. 1
44.988.944. 229.5
1,980
1,8806566139
7, 3615, 0991, 662
600
1.000799100100
15, 5820
50. 2801.321
80.9n.5
2. 9450, 7981.293
2. 2853. 2453, 707
35. 9
150. 631.9
118.6108.3
6. 6
151.631.9
119.7108. 1
46.896.946.729.9
4 785417
97
96153606938204129184
202362312
114305607
2,164
529
1, 673
1,58678481
5
8, 4005, 9901.764
640
1. 154870170108
15. 583107
28, 1391,749
82.019 2
5, 7507,1781.293
'' 7072, 5423, 218
36 2
152. 532.1
120. 4109. 5
5.3
152 332 0
120 3109 3
40. 287.248.430. 1
2,977
2,8529929134
7,5375, 5481,388
601
1, 065811150105
15, 582-23
28,4162, 094
81.611.7
11.4394, 0581.293
2,8903, 4893. 682
37.2
154. 832.6
122.1110. 2
4.4
153. 532 3
121.2111 1
43.680.746.029 0
2,117
1, 95873910654
9,2816, 0962, 651
534
1,351929205217
15, 51394
28, 1422,489
78.010.8
3, 7806,4331. 293
2, 2033, 3733, 593
37.7
157. 233.1
124. 1111.0
153. 239 4
120. 711° 3
40. 389.047.529.8
5 461397103
55194636
1,117145100265
171333370
109807570
3, 131
532
2. 312
2,2291 376
5330
6, 9325,0701,350
512
1. 168889173100
15, 51255
50, 2942, 404
78.710.7
5, 2300, 6381.293
r 2. 5503, 3213, 000
30. 2
157. 832.4
125.4113.2
4.2
153.832 6
121. 2113 9
47.192. 147.830 6
2,482
2, 3608639527
7,5635,3361, 609
618
1,152878164110
15, 40215
84, 4382.011
79. 99.8
7,0106, 1891.293
r 1, 9803, 9244, 150
36.3
153. 832.3
121. 5114.6
4.8
153. 832 7
121.1115 1
44.880. 245.429.5
2, 022
1,933621808
8, 5536.1241 , 798
631
1,179897177105
15,401109
28, 3342, 357
84. 910.3
4, 0230.0071. 293
r 9 994
3, 0493, 770
30. 8
152.932.0
120. 3115. 7
0.1
154. 232.9
121. 3115. 7
46.791.646.930.1
5 12134185
61162630
1,02270
174262
1524163'>3
111829
489
2,410
660
2 121
2,031714873
9, 0900,3082.174
608
1, 157879170102
15, 46249
56 3071.813
82. 311.0
11 3103. 0971. 293
3 990
36. 9
155 332 7
122. 6110.7
4 °
154 733 0
121 7116 4
49.195.549.331 6
4, 866
3, 50381 ' }
] 34922
7. 987 8, 9175. 913 6, 1551, 427 2, 140
647 622
1,135 1,174856 883172 190107 100
15,103 05,461 15, 462— 21 —48 ;
28. 1551. 855
10. 7 :
3,883 !7,108 : :1 . 293 1 . 293 1 . 293
37. 2 37. 7
152.4 153.0 155 '?33.0 33.3 33 7
119.4 I 120.3 121.5118. 1 119.2 120 1
0.9 i 7.8 7.0
154 5 ! 155 0 150 733 3 33 4 33 5
121 3 12? 1 p>3 3117 4 l]g 5 n9 4
46.8 I 47.5 :90.9 j 94.5 '47. 6 i 47. 1 _ .30 4 i 30 5
I
i
9 934 i
2. 086Q77
9850
r Revised. i End of year. 2 Estimated; excludes U.S.S.R., other Eastern Europeancountries, China Mainland, and North Korea. 3 Effective Aug. 1902 for silver in com-mercial bar form (priced 1A cent higher than on former basis; f l u cent higher effective Nov. 15,1962). 4 Based on refinery production (U.S. Bu. of Mint data); not comparable withlater figures shown, which are from Amer. Bu. of Metal Statistics. 5 Average of dailyfigures. 6 Quarterly average. c Corrected.
^Revisions will be shown later as follows: Insurance written for Jan.-Apr. 1963 (all series)and 1962 (total and ordinary); securities issued, 1901-62. Revisions back to 1947 for moneysupply and related data are available in the June 1964 Fed. Res. Bulletin; these revisionsresult from adjustments to new benchmarks and from revisions of seasonal factors beginning1955.
§Or increase in earmarked gold (—). t Time deposits at all commercial banks other thanthose due to domestic commercial banks and the U.S. Govt. d*Includes Boston, Phila-delphia, Chicago, Detroit, San Francisco, and Los Angeles.
Digitized for FRASER http://fraser.stlouisfed.org/ Federal Reserve Bank of St. Louis
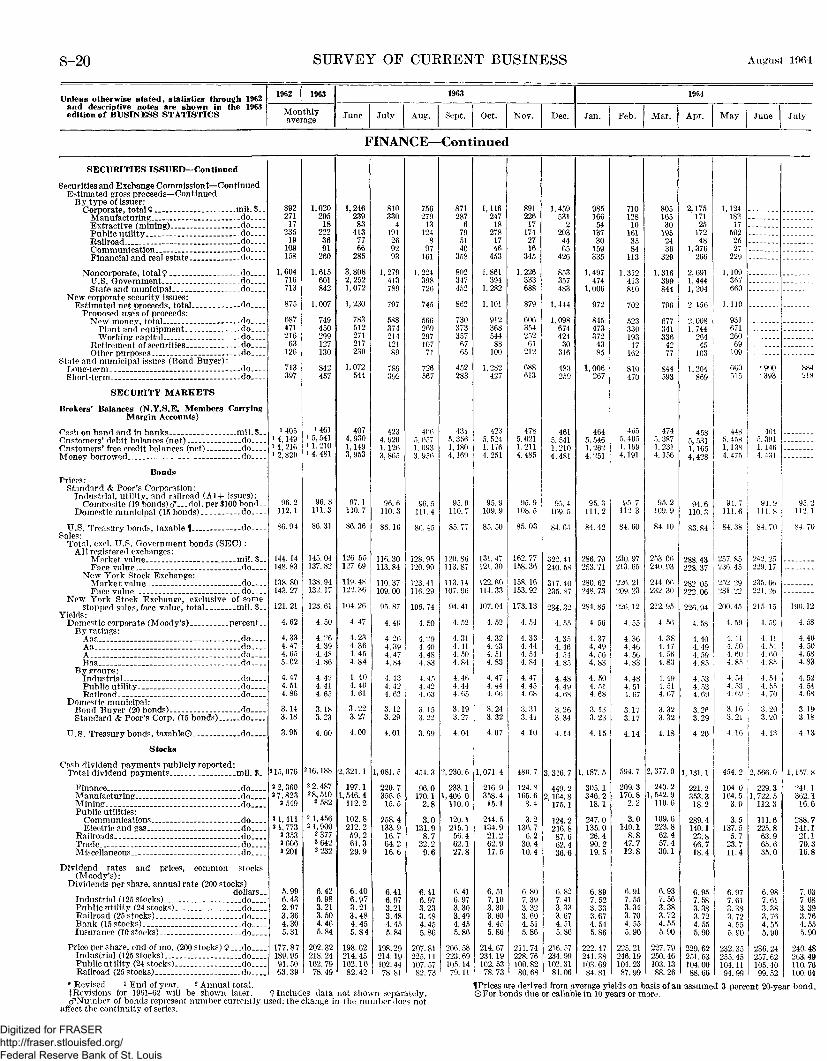
S-20 SUEVEY OF CUEEENT BUSINESS August 10(i4
Unless otherwise stated, statistics through 1962and descriptive notes are shown in the 1963edition of BUSINESS STATISTICS
1962 | 1963
Monthlyaverage
1963
June July Aug. Sept. Oct. Nov. Dec.
1964
Jan. Feb. Mar. Apr. May June July
FINANCE—Continued
SECURITIES ISSUED— Continued
Securities and Exchange Commission!— ContinuedEstimated gross proceeds— Continued
By type of Issuer:Corporate total 9 mil.$
Manufacturing doExtractive (mining) doPublic utility doRailroad doCommunication doFinancial and real estate .-do
Noncorporate, total 9 - -- doTJ S Government doState and municipal do
New corporate security issues:Estimated net proceeds, total --do
Proposed uses of proceeds:
Plant and equipment do^Vorkincr capital do
Retirement of securities doOther purposes do
State and municipal issues (Bond Buyer):Long-term - --do __Short-term . do
SECURITY MARKETS
Brokers' Balances (N.Y.S.E. Members CarryingMargin Accounts)
Cash on hand and in banks mil .$__Customers' debit balances (net) -- _-do__Customers' free credit balances (net) doIVToney borrowed do
BondsPrices:
Standard & Poor's Corporation:Industrial, utility, and railroad (A1+ Issues):
Composite (19 bonds) cf—.dol. per $100 bond..Domestic municipal (15 bonds) do _
U.S Treasury bonds taxable 1 -- doSales:
Total, excl. U.S. Government bonds (SEC) :All registered exchanges:
Market value mil $Face value do
New York Stock Exchange:Market value doFaco value do -
New York Stock Exchange, exclusive of somestopped sales, face value, total mil. $__
Yields:Domestic corporate (Moody's) percent..
By ratings:Aaa _ _ doAa doA do _Baa _ _ _ - _do
By groups:Industrial do _Public utility doRailroad do
Domestic municipal:Bond Buyer (20 bonds) _ do _Standard & Poor's Corp. (15 bonds) do
U.S. Treasury bonds, taxable© do
Stocks
Cash dividend payments publicly reported:Total dividend payments mil. $
Finance doManufacturing. __ do .Mining doPublic utilities:
Communications doElectric and gas do
Railroads doTrade doMiscellaneous _ _ __ do
Dividend rates and prices, common stocks(Moody's) :
Dividends per share, annual rate (200 stocks)dollars..
Industrial (125 stocks) doPublic utility (24 stocks) do— _Railroad (25 stocks) doBank (15 stocks) _ doInsurance (10 stocks) do
Price per share, end of mo. (200 stocks) 9 ...doIndustrial (125 stocks) do .Public utility (24 stocks) doRailroad (25 stocks) do
' Revised 1 End of year. 2 Annual total.^Revisions for 1961-62 will be shown later,cf Number of bonds represent number currently u
affect the continuity of series.
892271
17235
1910.9158
1,604716713
875
687471216
63126
713397
1405i 4, 1491 1, 216i 2, 820
96.2112.1
86.94
144. 14148. 83
138. 80143. 27
121. 21
4.62
4.334.474. 655.02
4.474.514.86
3.143.18
3.95
215,076
2 2, 36027,823
2549
21,4112 1, 773
235326062201
5.996.432.973.364.305.31
177.87189. 9591. 5063.39
9 Includsed; the<
1,02029518
2223691
260
1,615601842
1,007
749450299127130
842457
1 4611 5, 5411 1,210i 4. 481
96.8111.3
86.31
145. 04137. 82
138. 94132. 17
123. 61
4.50
4.264.394.484.86
4.424.414.65
3.183.23
4.00
216,188
2 2, 48728,510
258221,45621,900
237726422232
6.426.983.213.504.465.84
202. 32218. 24102. 7978.49
es data3hange ii
1,24623983
4137766
285
3,8082,2521,072
1,230
783512271217230
1,072544
4074, 9301,1493,953
97.1110.7
86.36
126. 55127. 69
119. 48122. 36
104. 26
4.47
4.234.364.454.84
4. 404.404.61
3.223.27
4.00
2,321.1
197.11, 546. 4
112.2
102.8212, 259.261.329.9
6.406.973.213.484.455.84
198. 62214. 45102.1082.42
not sho\i the nu
810330
4191269293
1,279413789
797
58837421412189
789392
4234,9201, 1263, 865
96.6110.3
86. 16
116.30113. 84
110. 37109. 00
95.87
4. 49
4.2(54.394.474.84
4.434 494 6°
3. 123.29
4.01
1,081.5
220.7355.515.5
258.4133.916.764.216.6
6.416.973.213.484.455.84
198. 29214.19102. 4478.81
-n separrnber dot
756279
13124
897
161
1.224398726
745
56626929710771
726567
4065, 0571,0933. 956
96. 5111.4
86. 45
128 95120.99
123. 41116.29
106. 74
4.50
4.294.404.484.83
4.454.424.63
3.153. 22
3.99
454.3
96.0170.1
2.8
3.0131.9
8.732.29.6
6.416.973.233.484.455.86
207. 81225.11107. 5782.73
itely.s not
871287
6795140
358
802347452
862
730373357
6765
452283
4315,3561,1804,169
95.9110.7
85.77
120.86113.87
113.14107.96
94.41
4. 52
4.314.414. 504.84
4.464.444. 05
3.193.27
4. 04
2, 230. 6
233.11, 406. 0
110.0
120.1215.1
56.462.127.8
6.416.973.303.494.455.86
206. 58223. 69105. 1479.11
1,11624718
2781746
453
1.861394
1,282
1,101
91236854488
100
1,282427
42?5.5241.1764. 251
95.9109.9
85.50
131.47121. 30
122. 60114.33
107. 04
4. 52
4.324.434.514.83
4.474.444. 06
3.243.32
4.07
1,071.4
216.9358.415.1
244.5134.921.262.917.5
6.517.103.303.604.455.86
214. 67231. 19102. 5378.73
^ Prices aOFor bo
891226
171742716
345
1,226333688
879
60635425261
212
688613
4785,6211.2114. 485
95. 9108. 5
85. 03
162. 77158. 36
158. 16153. 92
173. 13
4.54
4.334.444.544.84
4.474.454.68
3. 313.41
4.10
480. 7
124.8165.6
3.4
3.2136.7
6.230.410.4
6.807.393.323.604.515.86
211.74228. 76100. 8280.68
re derivends due
1,459531
2203
4465
426
853357483
1,444
1,098674424
30316
483259
4615.5411.2104,481
95. 4109. 5
84. 64
322. 41240. 58
317. 40235. 87
234. 32
4. 55
4. 354.464. 544.85
4.484.494.68
3.263.34
4.14
3, 316. 7
449.22, 164. 8
175.1
124.2216.887.662.436.6
6.827.413.333.674.515.86
216. 57234. 99102.3184.06
dfrom aor callab
98516654
13730
159335
1,497474
1,006
972
8454733724385
1,006267
4645,5461,2624,251
95.3111.2
84.42
286. 79253. 71
280. 62248. 73
284. 85
4.56
4.374.494. 564.83
4. 504. 514.68
3. 133. 23
4. 15
1, 187. 5
305. 1346.218.1
247.0135.026.490.219.5
6.897.523.333.674.545.86
222. 47241. 38103. 6984.81
verage yiein 10 y
71012810
1613584
113
1,312413810
702
523330193
17162
810470
4655, 4051, 1994,191
95.7112.3
84.60
230. 97213. 65
226. 21209. 23
226. 12
4.55
4.364.464.564.83
4.484.514.67
3.173.17
4.14
594.7
209.3170.8
2. 2
3.0140.1
8.847.712.8
6.917.553.343.704.555.90
225. 21246. 19104. 2387.99
elds on bears or ID
80516530
1952436
329
1.316399844
796
677341336
4277
844593
4745, 3871,2314, 156
95.2109.9
84.10
253. 06240. 93
244. 06232. 30
212. 95
4.56
4.384.474. 564.83
4.494.514.67
3.323.32
4.18
2, 377. 0
240.21,542.9
110.6
109. 6223.862.457.430.1
6.937. 563.383.724.555.90
227. 79250. 46103. 1388.26
asis of atore.
2,17517125
17248
1,376266
2,6911,4441,204
2, 156
2,0081,744
26445
103
1,204869
4585. 5311,1654,428
94.6110.3
83.84
288. 43228. 37
282. 05222. 06
226. 94
4.58
4.404.494. 594.85
4.534.534.69
3.263.29
4.20
1,131.1
221.2353.318.2
289.4140.123.866.718.4
6.957.583.383.724.555.90
229. 62251. 53104. 0088.66
i assume
1,124183
175022527
229
1,109367660
1,110
931671260
69109
660515
4485,4581,1384. 475
94.7111.6
84.38
257. 85236. 45
252. 29''31. 2°
200. 45
4. 59
4.414. 504.604.85
4.544. 534.69
3.J 63.21
4.16
454. 2
104.0164.5
3.9
3.5137.5
5.723.711.4
6.977.613.383.724.555.90
232. 35255. 45104.1194.99
d 3 percc
'900r393
4645, 3911, 1464.431
94.9111.8
84. 70
242. 25229. 17
235. 6690 1 9g
215. 15
4. 59
4.414.514.604.85
4.544. 554.70
3.203.20
4.13
2, 566. 0
229.31, 722. 5
112.3
111.6225.863.965.635.0
6.987.613.383.764.555.90
236. 24257. 62105. 4099.52
mt 20-ye
884218
95, 2112. 1
84. 70
190. 12
4.58
4.404.504.584.83
4.524.544.68
3.193.18
4. 13
1,157.8
241. 1362.116.6
288. 7141. 121.170.316.8
7.037.683.393.764.555.90
240. 48263. 49110.76100.64
ar bond.
Digitized for FRASER http://fraser.stlouisfed.org/ Federal Reserve Bank of St. Louis

Aujrusl I!l(i4 SURVEY OF CUEEENT BUSINESS S-21
Unless otherwise stated, statistics through 1962and descriptive notes are shown in the 1963edition of BUSINESS STATISTICS
1962 1963
Monthlyaverage
1963
June July Aug. Sept. Oct. Nov. Dec.
1964
Jan. Feb. Mar. Apr. May June July
FINANCE—Continued
SECURITY MARKETS— Continued
Stocks— Continued
Dividend yields and earnings, common stocks(Moody's):
Yield (°00 stocks) percent--Industrial (125 stocks) doPublic utility (24 stocks) do _ _Railroad (25 stocks) doBank (15 stocks) do _ _Insurance (10 stocks) - do
Earnings per share (indust., qtrly. at ann. rate;pub. util. and RR., for 12 mo. ending each qtr.):
Industrial (125 stocks) dollarsPublic utility (24 stocks) doRailroad (25 stocks) do
Dividend yields, preferred stocks, 14 high-grade(Standard & Poor's Corp.) percent--
Prices:Dow-Jones averages (65 stocks)
Industrial (30 stocks)Public utility (15 stocks) __ _Railroad (20 stocks) -
Standard & Poor's Corporation:^Industrial, public utilitv, and railroad:
Combined index (500 stocks) 1941-43=10..
Industrial, total (425 stocks) 9 doCapital goods (122 stocks) doConsumers' goods (188 stocks) do
Public utility (50 stocks) doRailroad (25 stocks) do
Banks:New York City (10 stocks) doOutside New York City (16 stocks) do
Fire and casualty insurance (22 stocks)!- -do
Sales (Securities and Exchange Commission):Total on all registered exchanges:
M^arket value mil $Shares sold millions
On New York Stock Exchange:
Shares sold (cleared or settled) millionsExclusive of odd -lot and stopped stock sales
(N.Y. S.E.; sales effected) millions--
Shares listed, N.Y. Stock Exchange, end of mo.:Market value, all listed shares bil. $__Number of shares listed millions.-
3.373.393.255.303.312.48
111.10M.732 5. 73
4.50
221. 07639. 76121.75132.61
62.38
65. 5458.1554.9659.1630.56
33. 7566.1957.43
4, 561139
3,94599
80
339. 297,464
3.173.203.124.463.152.51
1 12. 4324.992 6. 29
4.30
253. 67714. 81138. 36165. 30
69.87
73.3963.3062. 2864.9937.58
36.7574.8163.38
5,359153
4,574113
96
386. 637,906
3.223.253.144.223.222. 55
12.954.875 23
4.29
257. 30719.14139. 86171.89
70. 11
73.6164.0362. 3264.8739.34
37.0175.8562.76
5,036149
4,279107
91
383. 007,923
3.233.253.134.423.122.54
4.34
252. 72700. 75138. 73170. 62
69.07
72.4561.8261.4164.4738.75
36.8775.2962.58
4,533132
3, 82796
76
382. 217,952
3.083.103.004.213.022.48
4.30
257. 69714. 15142. 83172. 93
70.98
74.4363.3063.4566.5739.22
37.7676.8263.61
5,033144
4,215102
92
400. 967,972
3.103.123 144.413 122.57
11 054.916 37
4.30
262. 53738. 52142. 74172. 71
72. 85
76.6364 9666. 4567.0939.00
38.3377.3164.96
6 093170
5,161123
107
396. 248,010
3.033.033.224.573.082.52
4.26
262. 16747. 52138. 68170. 41
73.03
77.0965. 5767.0965.5538.31
37.0476.0563.79
7 049184
5,943136
122
407. 248,029
3 213.233 294.463 252 61
4.28
261. 09743. 24137. 59171.16
72.62
76.6966 4566.4464.8138 60
36 6775 2463.00
6 003149
5 082111
94
401. 608,042
3 153 153 951.373 172.57
14 454 996 29
4.32
266 33759 94137 77176 16
74.17
78 3868 5466.3865.6439 92
36 2975 3763. 73
6 156169
5 154123
99
411. 328,108
3 103 123 214.333 132 52
4.31
272. 31776 62140. 19180. 93
76.45
80 8571 8967.3667.2641 00
37 6077 3965.46
7 649'200
6 149145
117
422. 518,183
3 073 073 204.213 142 48
4.31
276 74793 03140 09184 55
77.39
81 9672 9268.1167 2041 54
37 0675 9066.19
5 317140
4 280102
88
428. 428,214
3 043.023 284.213 022.49
r 13 855 026 81
4.34
282. 93812 18139 25191. 97
78.80
83 6475 4870.1566.7842 88
38 4976 9067.06
6 401'l85
5 325137
114
436. 798,301
3 033.013 254.202 992 46
4.37
286. 09820 94139. 02196. 15
79.94
84.9276 5270.9367.3043 27
39 2077.1767.07
6 982210
5 933156
124
441. 728,378
3 002.983 253.922 942 45
4.41
289. 33823 12140. 86202. 08
80.72
85.7976 5072. 6767. 2944 86
39 8877. 6667. 62
6 072168
5 196125
99
447. 628,480
2. 952.953 213.782.982.45
15 005 136 95
4.41
290. 08817. 63141. 56206. 59
80.24
85.1375 8572.4267. 4646.29
38.9176. 6966. 96
5 683155
4 745114
96
455. 018,841
2.922. 913. 063.742.952.39
4.37
302. 02844 24147. 37218. 78
83.22
88. 1977 7675.4770.3548 93
39 7876.9868.31
103
464. 548,941
FOREIGN TRADE OF THE UNITED STATES
FOREIGN TRADE
Valuet
Exports (mdse.), incl. reexports, totall mil. $_.Excl Dept. of Defense shipments do__
Seasonally adjusted __ __ do
By geographic regions: AAfrica - - doAsia doAustralia and Oceania do
Northern North America doSouthern North America doSouth America -_ do
By leading countries:Africa:
United Arab Republic (Egypt Reg.)..-doRepublic of South Africa do
Asia; Australia and Oceania:Australia, including New Guinea doIndia _ _ _ _ _do._Pakistan - doMalaysia© -- - - - - -do _
Indonesia doPhilippines __ _ __doJapan do
Europe:France _ do_East Germany do _ _ .West Germany do
Italy _ _ doUnion of Soviet Socialist Republics do ..United Kingdom ___ _ do
1, 806. 01, 745. 4
81.8343 739.8
543 5
319.4130.7167 7
19.618 6
34.255.823 7
9 922. 4
117 9
48 9. 1
90 0
64 11.3
89.6
1, 934. 01, 857. 3
82.4398. 143.6
589 0
343.2142. 2159. 6
17.523 0
36.567.032.3
8 826. 9
141 5
56 5.5
92 0
73 41.7
96.8
1, 865. 61, 779. 2
1, 784. 7
77.2347.544.3
553 8
371.0138.0146. 2
19.821 3
38.558.622 0
8 621.6
113 7
59.0(3)
88 1
82 31.8
71.4
1, 818. 01, 713. 6
1, 823. 0
87.4395.241.6
494 7
329. 9136.3141 8
15.122 6
33.570.724 5
6 0
lie' s
38 3
75 8
70 92.8
80.4
1, 903. 21. 810. 7
1, 894. 6
78 6401 7
42 3561 3
328.7140. 2156 2
13.823 9
34.169 137 3
4 g26.2
144 7
52 7(3)
90 9
80 52. 2
87". 1
1, 823. 51 765 5
1 979 6
79 1381 2
40 7544 8
349 1142. 9131 1
16.004 §
32. 260 636 9
10 924.1
139 4
51 1(3)
88 4
68 6.6
104.3
2, 079. 82 023 0
1 946 4
79 3442 4
44 8658 8
405 9154.5149 9
16.294 5
37.772 847 8
7 835.5
159 7
63 51
98 9
79 93.6
130.7
2, 104. 52 028 5
1 944 6
92 6438 0
55 8671 6
359 2152. 6171 9
13.626 4
50.076 525 6
I9 829.9
173 9
64 11 9
103 9
74 41.6
125.6
2, 155. 42 092 3
2 049 4
95 6489 7
59 7678 9
355 4147. 1170 5
17.729 8
45.498 745 5
7 929.3
168 8
64 79 3
103 0
80 91.7
114 5
2,117.52 095 0
2 037 3
86 2449 4
48 6695 1
339 6149.4156 2
13.426 1
37.680 225 56 2
12 830.2
184 6
84 23 2
97 6
70 88.3
199 Q
2, 091. 51 994 5
2 028 7
95 6420 1
702 0
341 6149.7147 3
22 89Q 7
40.870 9
21 35 8
6 7
29.91(\(\ ft
66 03 5
Q7 &
75 229.3
193 9
2 179 32 127 2
2 077 5
no 9dnfi Q
54 0700 9
407 2161.2161 3
21 1
47.6R7 *i
a 1
4 ri
29.3
7-1 A1 8
n o o
TO Q
55.3191 7
2 206. 72 120 4
2 046 0
99 1410 448 7
692 3
426 2167.0161 7
23. 598 9
40.676 120 06 0
2 231.3
1 ro A
(\K n
i^116 6
7d ^
22.21H7 A
2, 256. 62 204 3
2 052 1
115 2450 6
59 0695 5
495 5164. 6186 6
r 29. 6
37 3
49. 797 830 6
6 4
3 9
32.6
71 °.
4 0
m 7
R1 n13.8
111 9
2, 099. 12 031 1
2 004 3
103 9372 3
58 8692 3
417 3179. 4179 5
24.2oo 7
49.855 138 46 1
3 9
30.41 9S °.
fi1 ^1 i
% o
1.81H7 Q
T Revised. » Preliminary. 1 Quarterly average at annual rate. 2 For 12 monthsending Dec. 3 Less than $50,000.
cfNumber of stocks represents number currently used; the change in number does notatl'ect continuity of the series. 9 Includes data not shown separately.
fRevised series; former series covered fire insurance only.
t Revisions for various periods prior to Feb. 1963 will be shown later. ^Includes grant-aid shipments under the Dept. of Defense Military Assistance Program, as well as economicaid shipments under other programs. AExcludes "special category" shipments.
OCountry designation established Jan. 1904.
Digitized for FRASER http://fraser.stlouisfed.org/ Federal Reserve Bank of St. Louis

S-22 SURVEY OF CURRENT BUSINESS August .1 !><>-»
Unless otherwise stated, statistics through 1962and descriptive notes are sh^wn in the 1063edition of BUSINESS STATISTICS
1962 1063
Monthlyaverage June .July Aug.
1963
So pi . Oct. Nov. Dee.
1%-i
Jan. Feb. Mar. 1 Apr. May June July
FOREIGN TRADE OF THE UNITED STATES— Continued
FOREIGN TRADE— Continued
Value— Con tinned tExports (mdse.), inel. reexports — Continued
By leading countries— ContinuedNorth and South America:
Canada mil. $--
Latin American Republics, total 9 do
"Rr-l/ll dO
Chile _ _ . _ _ _ — ~do— -Colombia doCuba _ doMexico do
Exports of US merchandise total do
By economic classes:Crude materials doCrude foodstuffs doManufactured foodstuffs and beverages.— doSemimanufacturescf doFinished manufacturescf —do
By principal commodities:Agricultural products, total? -do
Animal and vegetable oils and fats* do_Cotton unmanufactured doFruits, vegetables, and preparations d o _ - _ *Grains and preparation st - - do _Meat and meat preparations* do _ _Tobacco and manufactures A do
Nonagricultural products total 9 - do
Automobiles parts and accessories doChemicals and related products§ doCoal and related fuels doIron and steel prod (excl adv mfs ) do
Machinery total§9 do
Agricultural -- doTractors, parts, and accessories doElectrical doMetal working§ doOther industrial do
Petroleum and products doTextiles and manufactures do
General imports totalO - doSeasonallv adlustedO do
By geographic regions: 0\frtca doAsia doAustralia and Oceania - doEurope - do
Northern North America - - doSouthern North America doSouth America do
Bv leading countries:©Africa:
United Arab Republic (Egypt Reg.)_..doRepublic of South Africa do
Asia; Australia and Oceania:Australia, including New Guinea doIndia doPakistan - doMalaysia© doIndonesia doPhilippines doJapan _ do
Europe:France _ doEast Germany - - doWest Germanv doItaly doUnion of Soviet Socialist Republics doUnited Kingdom do
\Torth and South America:Canada doLatin American Republics total 9 do
Argentina doBrazil . _do_- _Chile doColombia do __ .Cuba doMexico - doVenezuela _ _do
r Revised. v Preliminary. 1 Less than $.50,0exports of certain fertilizer materials, coal-tar andspecialties, etc.; in 1962, such exports totaled $52.6 m
JSee similar note on p. S-21; for exports, see also9 Includes data not shown separately.cfData for semimanufactures reported as "spec
finished manufactures. *New series. Data priorof Census report?.
319.4
270.3
31.635.414.2
18.91.1
67.139.2
1,783.6
186. 2167. 5113.82,53. 4
1,062.7
419.5
26.144.835.8
171.411.840.9
1,364.1
115.2149.332.050.9
435.1
13.230.3
105.944.5
208.1
36.857.3
1,365.8
62.8246.736.6
385.0
305.2123.1204.2
2.121.4
24.421.33.5
11.226.9
113.2
35.7.3
80.137.71.3
83.8
305. 0
282.2
8.945.115.9
22.9.6
48.281.3
00. 2
svnthetil."note "T
ial categto Sept.
343.2
262. 8
15.731.413. o
20.03.0
68. 942. 3
1. 910. 1
214.7189.4124.8273. 6
1,107.6
465.4
26.648.937.2
191. 712.343.6
1,444.7
125.52161.9
40.257.4
453.4
15.235 9
113.437.0
216. 5
41.057.8
1,428.5
64.8266.141.8
400.8
319.4127.4207.7
1.721.6
26.624.53.8
9.429.7
124.8
35.8.3
83.641.11.7
89.9
319. 1
287. 6
13.746.815.7
20.7(049.578.1
Beginninic resino
on p. S
ory, tvp1962 ma^
371.0
255. 4
15.128.015.4
19.50)70.639.6
I , 840.8
199.1175.6103. 9259.5
1, 102.7
412.9
23.434.539.0
172 211 A39.5
1,427.9
119.1158.342.056.0
461.8
19.238.5
111.934.7
224.0
37.157.6
1,356.51,420.5
54.8252.937.1
362. 3
342.7132.2174.2
3.916.8
24.123.33.6
9.735.0
109.7
36.2.2
75.138.21.2
83.2
342.2
258.4
8.836.318.4
12.70)46.575.3
g Jan.us prodi
-21.
p 1" are• be obta
329. 8
249. 6
15.6
14.2
21.03.7
66. 434. 9
1,797.1
182.6181.0113.2272.3
1,048.0
410.6
26.025.937.6
179.710.635.0
1,386.6
107.1163. 137.061.6
431.0
18.433.0
104.231.2
211.2
42.653.3
1,502.61,457.5
61.4283.353.2
441.8
339.2128.9194.7
1.223.3
28.026.72.9
8.535.8
143.3
44.6.3
92.347.01.5
100.9
338. 6
272.2
14.543.114.5
20.7(039.576.2
1963, excicts, che
includecined froi
328.7
263. 9
14.429.014.522.60)
65. 144.1
1,879.2
9 JO 9
158! 8124.0300.2
1,084.1
408.7
26.436.733.9
156.311.744.7
1,470.5
112.7176. 353.862.6
446.0
16.636.5
111.729.0
212.9
41.557.8
1,458.31,508.3
67. 6306. 448.6
370.9
334.6109.1220.9
.531.4
30.925.63.3
10.544.9
145.6
35.82
75! 146.11.8
89.8
334.3
286. 5
16. 242.619.8
28.80)39.482.2
Ludesmical
withi Bu.
319. 1
241. 1
10.320. 512.6
18.40)70.741.2
1,801.8
222.9166. 7]99 9
270. 51,020.1
433.7
32.141.937.0
162. 313.064.2
1,368.1
115.3162. 153.356.5
411.1
10.631.2
108.934.6
192.4
41.055.2
1,398.51,450.4
58.4267. 652.9
378.7
301.4102.4236. 6
1.117.8
34.221.73.2
8.432. 5
124.9
31.5.2
81.134.74.5
83.8
300.9
293.6
17.256.415.9
34.9(J)37.367.2
tRewith1963.
AN§EOF
tified
405. 9
267. 9
15. 221. 713.0
22. 6C1)'78.146. 5
2, 055.6
279 7
22 I! 4132. 6296. 5
1.132.3
552.6
28.950.950.0
211.216.473.0
1,503.1
146. 1175.050.564.0
462.7
11.741.1
114.038.1
218.0
41.165.0
1,591.31 ,458.8
74.0297.848.1
466. 1
354.2115.7235. 1
5.018.9
36.825.84.0
9.836. 9
139. 8
45.5.3
92.150.21.8
106.0
354.0301.3
17.653.714.631.6
046.473.4
vised to iiata pul
anufactiDeludes 'or certaiby area
359. 1
286.2
17.230.915.121.7
075.348.3
2, 079. 1
281.6227 o135.' 1285. 0
1,149.9
574. 5
20.767.840.0
220.917.360.1
1. ,504. 6
165. 3169. 946.060.6
477.1
11.436.9
124.237.5
228. 4
39.463.2
1,425.11,465.3
59.5265. 231.6
445. 1
312.0114.2197. 5
.517.4
20.722.93.7
9.718.0
134. 7
42.0.2
94.946.41.2
100.6
311.7269.311.062.911.317.50)46.663. 1
n elude Slished in
ices of tospecial ci recent iof origin
355. 4
278. 5
18.829. 314.4
24.60)69. 449.7
2,131.6
284.9232. 6131.9297.1
1,185.1
588.1
25.486.137.4
247.713.855.4
1,543.5
159.7165.437.864.8
491.7
12.739.6
122. 542.2
236.8
41.962.8
1,529.91,477.7
71.0252.143.2
427.6
351.1140.9243.0
1.125.8
29.021.03.7
8.029.9
118.0
37.1.1
92.243.5
.991.6
350. 9
332. 9
20.967.514.0
14.40)55. 688.1
ITC iterthe 196
bacco ar<ategory,nonths,
0C(
339. 6
269.8
15.132.413. ]
20.40)72.543. 6
2, 090. 6
247.4227.4127.7300. 7
1,187.4
542.2
26.679.032.2
234.116.838.0
1. 548. 3
148.2171.133.963.1
486.8
15.839.2
125. 639.1
226.2
37.759.6
1,446.71,421.8
67.6283.035.7
400.9
307.4150.4199.8
1.024.1
27.722.34.3
14.313.432.2
130.6
35.9.3
92.036.31.2
83.5
307. 2
294. 7
11.643.616.6
14.20)63.685.3
ns classif3 BUSINI
} includetype 1'
;he data>untry d
341. 6
261. 7
19.523.1
19.8C1)76. 640.5
2, 063. 0
237. 9209. 7137. 3289. 5
1, 188. 5
525.3
27.874.933.7
226.316.037.0
1,537.6
151. 6172.331.661.8
510.4
20.136.5
132.742.1
238.4
35.161.5
1, 337. 71, 445. 3
71.4203.730.5
394. 6
301.9142.2192. 7
1.020.3
19.218.02.69.9
10.015.1
100.6
35.0.8
78.733.72.0
85.3
301.8
284.5
9.738.0
7.4
22.2f1)59. 189.3
ied as "<:ss STAT
d in the iexports
by regiossignatio
407.1
285. 3
17.3%. 513.0
20.60)78.248.7
2,151.3
215. 5228.3135.8326.4
1.245.3
530. 8
33.164.433.3
238.214.530.0
1,620.5
149.0191.930.567.2
542.7
23.945.5
123.044.4
264.2
38.470.9
1, 592. 31, 522. 9
89.8282.938.3
456. 1
337.4152.0234.9
3.821.1
24.824.03.2
14.815.034.9
133.3
39.5.7
106.140.31.0
90.8
337.3
338. 7
10.860.720.9
23.2(067.287.2
cereals ai[sues an
lonagrici
ns and cn establi
426. 2
292. 8
16. 731.312.6
17.10)91.047.1
2, 170. 3
207. 6232.5134.9323. 4
1.271.8
521. 1
20.951.728.4
245.012.630.5
1, 649. 1
148.7149.434.368.7
521.5
23.849.8
122.639.8
246.1
41.868.2
1,562.31.542.1
86.9276.533.4
449.3
341.4162. 2211.3
2.021.3
18.528.13.9
10.611.719.8
143.5
43.9.5
97.941.2
.994.0
341.3
314.9
10.453.817.3
24.50
71.475.7
id prepad in Sui
iltural p
ountriesshed Jan
425. 5
314. 4
19. 231.616. 7
24.50)81.857. 4
2 925 5
219 1233. 1144.8333.3
1, 295. 2
528. 9
36.149.534.5
238.416.733.5
1, 696. 6
156. 5187.444.984.7
575.2
22.653.7
133.246.4
274.8
35.871.0
1, 457. 91, 548. 1
83.7278.336.1
411. 5
«• 337. 4* 143. 4
166.6
2.519.9
'16.125.73.5
12 2is! 234.6
121.7
41.5.4
87.835. 21.3
91.1
337.2
260. 4
9.423.619.3
17.30
55.91 66.2
rations"IVEY issi
roducts t
exclude. 1964.
417.3
325. 1
IS. 839 514. 2
21.10
103. 355.8
2, 067. 5
217.9182. 1125.9330.9
1,210.6
459.1
32.950.737.8
180.314.941 2
1, 608. 3
144.6183.545.683.4
512.8
19.750.2
H9.939.7
240.3
39.468.2
1, 595. 51, 505. 5
67.5317.245.6
446.7
381.6137.0198.8
1.019.3
32.228.43.7
10.915.831.3
155. 1
42.8.6
99.745.12.4
100.7
381.3
280.7
12.332.517.6
21.1(^50.681.8
, not corles prior
otal.
imports
-- -
n parableto Nov.
uniden-
Digitized for FRASER http://fraser.stlouisfed.org/ Federal Reserve Bank of St. Louis

SURVEY OF CURRENT BUSINESS S-23
Unless otherwise stated, statistics through 1962and descriptive notes are shown in the 1963edition of BUSINESS STATISTICS
1962 1963
Monthlyaverage
19G3
June July Aug. Sept. Oct. Nov. Dec.
1964
Jan. Feb. Mar. Apr. May June July
FOREIGN TRADE OF THE UNITED STATES—Continned
FOREIGN TRADE— Continued
Value — Continued t
Imports for consumption, total mil. $_.By economic classes:
Crude materials doCrude foodstuffs -- -doManufactured foodstuffs and beverages. _doSemimanufflctures - ..do. _Finished manufactures do
By principal commodities:\griculturalproducts total 9 do
Cocoa (cacao) beans, incl. shells doOoffee - -do _.Rubber, crude (incl. latexandguayule)._doSugar (cane or beet) doWool and mohair, unmanufactured do
Nonaccricultural products total 9 do
Furs and manufactures - doIron and steel prod. (excl. adv. mfs.)_--doNonferrous ores, metals, etc.:
Bauvite crude* - -do _Aluminum semimfs. (incl. calcined bauxite>*
mil. $ _ _Copper crude and semimfs * do -Tin including ore -- do
Paper base stocks doNewsprint doPetroleum and products do_ _ _
IndexesExports of U.S. merchandise:
Quantity 1957-59=100-.Value - doUnit value -- do
Imports for consumption:Quantity doValue doUnit value - do
Shipping Weight and ValueWaterborne trade:
Exports (incl. reexports):!Shipping weight thous. sh. tons..Value . mil. $
General imports:Shipping weight _ thous. sh. tonsValue mil. $__
Airborne trade:Exports (incl. reexports) :1
Shipping weight thous. sh. tons..Value - mil. $
General imports:Shinpins! weight thous sh tonsValue - mil. $_.
1,354.3
278.2148.0149. 3282.4496. 3
322. 3
11.082.419.042.017.4
1,031.9
9.747.3
10.1
14.720.89.7
30.058.0
147.1
112115102
12311795
11,2151,165.6
17,552983.6
9.1124.3
59.7
1,417.8
274.0143. 8166.5300.4533. 2
334.8
11.379.716.450.918.8
1,083.1
U0.959.4
9.5
16.9121.6
9.1
30.157.3
i 149. 1
"120^123*>102
Pl27*122"96
13,0101, 232. 7
17, 7061. 033. 2
10.4136.5
67.9
1,327.8
266. 3105. 0174.0293.2489.3
295.6
12.151.512.873.015.7
1,032.3
9.563.7
9.4
21.623.810.7
32.157.1
129.7
116119102
11911496
13. 061L.170. 6
18, 778982.6
9.4127.0
58.0
1,505.3
281 0128. 9184.431 7. 5593. 5
333.6
7.578 413.364 322.1
1,171.7
7.075.3
10.5
24.020.28.5
30.562.5
146.4
113116102
13513096
13. 5731,164. 7
19, 4931,116.0
9.6119.8
66.5
1,479.1
314 3196. 6177.3313.6547. 2
345. 2
8.476 716. 562 517.2
1,133.8
5.771.0
11.7
18.728.311.1
31.957.7
146.5
119121102
13212797
14, 8461, 219. 2
19, 9961, 089. 0
9.9120. 3
57.4
1,375.1
9(50 °140 2183.1985 7505 8
345 4
9.789 313. 559 712.7
1,099 6
1 10 159.1
9.8
17.81 26 1
6.4
28.757.9
i 132. 3
114116101
12311896
14, 3681.164.3
18, 3941,049 0
10.2126. 3
4 367.9
1,578.3
073 3168 7198.2396 4611 8
377 5
9.4100 915.053 416.7
1,900 8
7 970.4
8.8
17.026 19.2
34.666.5
149.0
130132102
14113696
15, 0701. 375. 6
19, 0761,163.9
11.5140.4
5 481.3
1, 427. 8
238 0153 3163.0300 4573 0
319 8
7.288 813.631 811.9
1 108 0
6 165.3
8 2
17.923 38.7
31.158.1
135.9
131134102
12712296
14, 7961, 408. 6
17,0661,032.0
10.9131.5
5 382.8
1,511.6
284 5158 7197. 4315 0556 0
369 4
11.1°0 114.068 822.9
1 142 2
26 354.0
9 4
17.725 18 2
32 068 0
164 9
135137101
13213098
13, 8871, 450. 0
17, 5691 077 2
11.3141. 9
5 389^0
1,464.9
974 3160 8133. 5343 0553 4
33° 7
14.487 419.426 319.7
1 132 2
r n6 160.7
9 6
17.126 19.8
31.756. 8
rl!93 3
*>131^135v 103
v 128v 111*98
11.9150 3
4 370.4
1, 322. 3
246 8161 5105. 5314 1494 5
295 4
12.594 013! 216 520 6
1 026 8
T 13 $54 1
11 2
14 829 57 3
31 152 4
r 154 3
M30v 133P 103
p 116pl!4
•P gg
11.9157 2
4 070.7
1, 567. 3
274 1202 4150. 7339 0601 1
383 1
125 719.437 217! 4
1 184 2
c 15 g59.7
9 5
17.699 810 7
35 458.7
r159 5
v 134v 139TO 103
v 136v 135
P 99
1'>.9150 9
4 779.4
1,555.39 6 7 8199 2142. 6343 1609 7
362 7
8.2131 8
13^339 i18.3
1 1Q9 7
19 Q
62.5
12 2
17 626 1
7 8
31 961 2
r I5f> 7
•p 137P 140v 109
P 134P 134P 100
12. 9153 5
4 676.0
1,433.8
270 4147 4149. 2311 1555 7
329 9
8.184 520. 247 8
r 17.6
1 103 9
q i68 6
8 8
17 823 7
7 6
30 459 6
<• 137 1
v 140P 143p 109
P 195P 123
P 98
1,576.8
09 1 r^140 4103. 0340 l641 8
316 1
10.373 9
13.938 9141
1 260 7
8 177.5
10 0
18.926 6
7 9
35 065 2
144 0
TRANSPORTATION AND COMMUNICATIONS
TRANSPORTATION
Air Carriers
Scheduled domestic trunk carriers:Financial operations (qtrly. avg. or total) :
Operating revenues, total 9 mil. $_.Transport, total 9 do ...
Passenger _ doProperty do. ..U S mail do
Operating expenses (incl. depreciation) doNet income (after taxes) - do
Operating results:Miles flown (revenue) thous_-Express and freight ton-miles flown doMail ton-miles flown do. ..Passengers originated (revenue) doPassenger-miles flown (revenue) mil--
Express OperationsTransportation revenues .mil. $_.Express privilege payments do
Local Transit LinesFares, average cash rate. centsPassengers carried (revenue) .._ mil--Operating revenues (qtrly. avg. or total) ...mil. $_.
Motor Carriers (Intercity)Carriers of property, class I (qtrly. avg. or total):
Number of reporting carriers _ __ ._Operating revenues, total mil. $__Expenses, total .do. .Freight carried (revenue) mil. tons._
570.7566.0509.837.114.4
551.41.9
59, 40945,29613, 5753,9902,667
295.9229.2
20.1594
350.8
39541,3431,286
87
621.9617.1557.040.315 0
585.58.4
63, 82849, 19514, 1674,5483,048
295 9228.6
20 5576
346.5
632.1627.9569.039.114.7
577.620.2
64, 62047,33413, 1644,9663,431
93.527.8
20.4550
357.0
o 1, 017e 1, 326« 1, 304
680
66, 50246, 15113, 0024,6483,251
20.5533
67, 33351, 89413, 6175,1513,588
20.5534
653. 3648.7587.341.014 2
592. 827.6
64,33552, 76613, 043
4,6393,119
96.329.9
20.5560
330.3
66, 67657, 79715,0334,9173,165
20 6630
62, 45551, 39713, 3764,4462,861
20 7563
* 5 634. 44 628. 34 561 9
4 44. 04 16 7
45 596 04 5 1 1
65, 75855, 58119 4014,7323,221
105 431 3
20 7590
366.8
66. 27450, 71014, .5474,8013,245
20 8581
4 62, 8634 50, 212'14 0514 4, 4584 2, 949
20 8552
4 5 646 8640 8579 4
42. ()1 5 5
4 =613 74 5 11 0
467, 481454, 522415 488
45, 00843, 316
96 827 1
20 8585
4 65, 4074 56, 4724 15 091
4 5, 0034 3, 287
91 0600
4 68, 0224 59, 0144 14 823
4 5, 0304 3, 322
91 9
59691 •>
564
r Revised. p Preliminary. c Corrected. d Deficit.i Eft'ective Sept. 1963, data reflect adoption of U.S. Tariff Schedules and are not entirely
comparable with earlier figures also, beginning Jan. 1964, data for furs and nifs. and petroleumand products reflect further changes in USTS. 2 Quarterly average. 3 Number ofcarriers filing complete reports for 1962. 4 Reflects substitution of data for one or two intra-Aluskan carriers. 5 Revisions for 4th qtr. 1962 and 1st qtr. 1963, respectively (mil. $):
Operating revenues—559.7; 568.0; expenses—551.9: 572.1; net income—rf 1.8- d 1~>.S. »• For 1stqtr. 1963.
JSee similar note on p. S-21. 9 Includes data not shown separately. *New series.Data prior to Dec. 1962 may be obtained from Bu. of Census reports. §Excludes "specialcategory" shipments and all commodities exported under foreign-aid programs as Depart-ment of Defense controlled cargo. ^See similar note on p. S-21.
Digitized for FRASER http://fraser.stlouisfed.org/ Federal Reserve Bank of St. Louis

S-24 SURVEY OF CURRENT BUSINESS August UK">4
Unless otherwise stated, statistics through 1962and descriptive notes are shown in the 1963edition of BUSINESS STATISTICS
1962 1963
Monthlyaverage
1963
June July Aug. Sept. Oct. Nov. Dec.
1964
Jan.i
Feb. | Mar. Apr. May June July
TRANSPORTATION AND COMMUNICATIONS—Continued
TRANSPORTATION— Continued
Motor Carriers (Intercity)— Continued
Freight carried, qtrly. index of volume, class I andIT ( \T \) averaee same period 1957-59 — 100
Carriers of passengers, class I (qtrly. avg. or total):Number of reporting carriers -- --
Fxpen^es total doPassengers carried (revenue) mil
Class I RailroadsFreight car-loadings (AAR):
Total cars _ thous._Ooal doCoke doForest products doGrain and grain products do
Livestock _ _ doOre doMerchandise 1 c 1 - - doMiscellaneous - do
Freieht carloadings, seas. adj. indexes (Fed. ~R.):tTotal 1957-59=100..
Coal doCoke -- do_ -.Forest products doGrain and grain products doLivestock - do ._.Ore - - doMerchandise, 1 c.l _ _ d o _ _ _Miscellaneous - -- do -
Financial operations (qtrly. avg. or total):Or>eratin° revenues total 9 -- mil. $
Freight do
Operating expenses doTax accruals and rents d o _ _"N"et railway operating income doWet income (after taxes) _do._
Operating results:Freight carried 1 mile (qtrly ) bil ton-milesRevenue D6r ton-mile (qtrly avg ) centsPassengers carried 1 mile revenue (qtrly ) mil
Waterway Traffic
Clearances, vessels In foreign trade:Total U S ports thous net tons
Foreign vessels - doUnited States vessels do
Panama Canal:Total - thous. Ig. tons .
In Unite<f States vessels do
TravelHotels:
Average sale per occupied room dollars.Rooms occupied % of totalRestaurant soles index _same mo. 1951=100--
Foreign travel:TT g citizens* Arrivals thous
Departures do\lienS' Arrivals do
Departures doPassports issued and renewed do
National parks visits doPullman Co. (qtrly. avg. or total):
i a> L enj-tr nine (, tfve lie; thorn "ft
COMMUNICATIONS
Telephone carriers :Operating revenues Q mil $
Station revenues doTolls message do
Operating expenses (before taxes) doNet operating income doPhones in service end of year or mo mil
Telegraph, cable, and radiotelegraph carriers:Wire-telegraph:
Operating revenues thous. $..Operating expenses incl depreciation doNet operatin0" revenues do
Ocean -cable:Opera tin0" revenues doOperatin^ expenses incl depreciation doNet operatin0" revenues do
Radiotelegraph:Operating revenues doOperatin^ expenses incl depreciation doNef operating revenues do
i 120. 32 140131. 2111.856.8
2, 39443930
158231
1714497
1,277
492908197
10167834994
2, 360. 11, 997. 8
154.81,854.3
324.1181.6143.0
s 151.651.34954,976
14, 91312, 0662,847
5,490855
9.3561
112
195191125103
762,737
72612,076
792.6440.0270.4468.2139.670.8
22,01020, 197
582
3,0132,542
153
4, 6753 676
816
1 126 3
2,40646132
156234
14147
721.289
*93958896
10252843695
2,389.92, 036. 5
147 01,862.9
325.6201 4162.9
5 158 95 1 310« 4, 624
15 69812, 7862 842
5,454780
9.3760
109
218216130110
882,779
62910, 477
845.6465. 4289.7495.7152.373.7
23, 90221, 094
1.680
3. 0652,495
219
5,0773 882
982
195 4140
136 9117.357 1
2,424467
34148221
821168
1,267
9510010793
9949813697
2 473 72 118 9
150 91 883 2
356 1234 4188 8
165 21 3104 695
16 00313 1662 837
5,460821
9.6462
110
230341136126128
5,082
61110, 397
836.3463.8280.5478.2155.572.1
23,51620 795
1,543
3,0092 468
212
4,8623 736
895
2,13730030
135'228
821263
1,161
9410010494
8651833697
17 08713 8753 212
5,924862
8.7554
107
295333155131100
7,504
849.5463.1295.1486.8164.272.3
23, 83421,2641.348
3,2012,575
245
5, 1173 996
974
3 2, 8723 5823 34
3 1893270
3 133260
3 813 1,444
91999093
9751813491
17, 48514, 3313, 154
5, 641837
9.6059
104
391283169140
787,705
861. 4465. 6304.4495.1158.172.5
24, 96421,275
2, 590
3, 0642, 697
99
5,0343 in1, 096
1^4 0
138165 7128 86° 9
2, 30746428
147200
15205
641.185
91978495
10143873492
2 398 00 035 0
157 11 874 1
326 8197 1156 1
158 21 3125 225
16 34113' 4862 855
5 709
1 000
9 5663
107
27120717313465
3 278
59810 065
844.2468.0283.2489.8158.272.9
24, 37820, 700
2.597
2, 9492.330
291
5, 0693. 8°21. 015
2, 518474
27155258
2518365
1,331
93947598
11248813393
16 53113, 4333 098
5,925968
10.2468
109
219186144123
562,331
879.0477.3309.1523. 4156.173.2
25, 45221,5272,983
3,4242, 560
509
5, 5464,0281,333
3 2 , 8593561335
31833303
3253157373
3 1, 523
92947896
10556
1043192
16 68613,6183 068
5, 399722
9 8258
101
17414611810340
1,104
856.8475.2286.3500.5155.473.4
23, 67620, 6032,368
2, 8592, 186
370
5, 5254, 1581,195
127 8
138130 7114.055 3
1,97241729
130197
105553
1,081
94908497
10950913396
2, 446. 62 084 2
138 61 893 5
304 4948 7225 1
103 41 3004 315
15 45412' 5732 881
5 691708
8 9047
107
158161112116
47661
6009 288
881.8480.0308.7539.8150. 173.7
25, 55021, 324
3, 663
2 9502 271
156
5, 6544 3391, 054
2,04541531
136227
105051
1, 125
97918999
111508931
101
15, 20412, 5402,664
5,832613
9.0957
105
1731721128771
686
881.1481.7305.3520.2154.974.0
24, 44922, 213
834
3,1382, 403
361
5, 9014,4481,222
3 2, 6453512341
3 1963267
310375370
3 1, 473
978990
106
104519331
100
14 50312, 0542 449
6,187906
9 2660
109
1791931028881
790
862. 2480.6286.0501.7163.474.2
23, 28321,020
872
2, 8142, 284
98
5, 5054.274
998
128. 6
2, 105393
34154186
106654
1,207
949092
103
9350882898
2, 362. 42, 033. 8
134.71,852.3327.6182.5144.2
14, 96012,3192,641
6,269965
8.8759
108
218206123101121
1,000
60810, 457
892. 1485. 5311. 2530. 9156. 074.5
25, 18121,715
2,075
3, 1069 986
475
5,7524, 3361,192
2,20240735
151177
1011453
1,254
9593
10099
9242
1232897
5,912866
9.8667
116
211214148104147
1,276
898.8489.4313.0532.3165.9
74.9
24, 87621,812
1,697
3,0122 403
245
5, 8314 9511, 345
32,9133 542
3453 1903208
3 123271365
31,581
96100111100
8942
1042999
6,1661,022
9.1862
119
226
161
1352,267
903 1490.0315.7525.0167.475.1
24, 70822, 1811,085
3, 0302 317
328
5,7744 3791,167
j
2, 40347638
154205
722450
1,248
94r 100
11898
9146852796
5,9021,100
9.8364
113
1475,006
2,114293
35147197
8223
481,163
9510012810?
7550872898
112
........
T Revised. i Annual index. 2 Number of carriers filing complete reports for 19G2.3 Data cover 5 weeks; other periods, 4 weeks. 4 Based on unadjusted data. -Quarterly
average.
t Revisions for 1902 are in the Aug. 1963 SURVEY.? Includes data not shown separately.
Digitized for FRASER http://fraser.stlouisfed.org/ Federal Reserve Bank of St. Louis

SURVEY OF CURRENT BUSINESS S-25
Unless otherwise stated statistics through 1962and descriptive notes are shown in the 1%3edition of BUSINESS STATISTICS
1962 1963
Monthlyaverage
1963
Tune July Aug. Sept. Oct. Nov. Doc.i
1964
Jan. Feb. Mar. Apr. May June July
CHEMICALS AND ALLIED PRODUCTS
CHEMICALS
Inorganic chemicals, production:\eetylene ..mil.cu.ftAmmonia, synthetic anhydrous (commercial)
thous sh tonsCarbon dioxide liquid gas and solid doChlorine gas (100% Ch) doHydrochloric acid (100% HC1) doNitric acid (100% HNOs) doOxygen (high purity) mil. cu. f t _ _Phosphoric acid (100%> P2OO thous sh tonsSodium carbonate (soda ash), synthetic (58%
Na2O) thous sh tonsSodium bichromate and chromate doSodium hydroxide (100% NaOH) doSodium silicate (soluble silicate glass), anhydrous
thous sh tonsSodium sulfates (anhydrous, refined; Glauber's
sal t* crude si 1 1 cake) thou^ sh tonsSulfuric acid (100% H.SOO do
Organic chemicals, production: ofAcetic acid (synthetic and natural) mil. lb._Acetic anhvdride do
Creosote oil mil. gal__
"DDT mil IbFthvl acetate (85%) doFthvlene glvcol doFormaldehyde (37% HCTTO) doGlycerin, refined, all grades:
Production - _- _.. doStocks, end of month do —
Methanol:Natural mil. galSynthetic do
Phthalic anhydride mil. IbALCOHOL
Fthyl alcohol and spirits:Production mil tax galStocks end of month dofT9g(:j fof denaturation doTaxable withdrawals do
Denatured alcohol:Production mil wine galConsumption (withdrawal^) doStocks end of month do
FERTILIZERSExports total 9 thous sh tons
Nitrogenous materials doPhosphate materials _ -- doPotash materinls do
Imports, total semimanufactures* 9 _ _ doAmmonium n i t r n l e ._ do _.\mmonium sulfote . _ doPotassium chloride doSodium nitrate _ __ . do
Potash deliveries (KjO) doSuperphosphate and other phosphatic fertilizers
(100% P2O5):Production .. - - _ _ ..thous. sh. tons-Stocks end of month do
MISCELLANEOUS PRODUCTS
Fxplosives (industrial), shipments, quarterly:Black blasting powder.. . thous. IbHigh explosives do
Paints, varnish, and lacquer, factory shipments:Total shipments _ mil $
Trade products doIndustrial finishes do
Sulfur, native (Fraseh) and recovered:Production. _. thous. Ig. tons..Stocks (producers') end ofmonth __ do
PLASTICS AND RESIN MATERIALSProduction:
Cellulose plastic materials mil IbThermosetting resins:
Alkyd resins _ __ doCoumarone-indene and petroleum polymer
resins mil. IbPolyester resins _ doPhenolic and other tar acid resins doUrea and melamine resins _ do
Thermoplastic resins:Styrene-type plastic materials (polystyrene)
mil. lb_.Vinyl resins (resin content basis) __ d o _ _Polyethylene _ _ _ _ _ _ _ _ d o _
1,103
484.185.3
428.687.7
280. 88,661203.9
383.910.6
453.6
46.1
99.51,641 8
82.2103. 5
7.6
13.98.5
119. 5199.8
20.832.7
. 128.035.6
52.4151. 442.45.3
22.923.03.9
60267
44871
16618203936
197
235425
1306!277,199
152. 789.862.9
M904,832
13.2
345.7
3 29. 03 17. 73 57. 53 40. 7
3 106. 23 130. 5168.0
1,148
553 888.7
454 087 3
349. 710, 768241.7
390.110.9
474. 7
46.0
100.51,744 7
87.4105.8
8 9
14.99.2
121.0212.7
24.823.8
.129 339.5
57. 7171. 544.45.3
23.924.03.0
62555
48759
20521207334
227
269419
i 284i 301,665
- 157.5- 93.8- 63.7
3 4864,875
12.7
46.5
25.821.361.042 2
124.3149.3188.2
1 070
562 4101 2453 8
86 0287.8
11.308236 6
400 011.8
473 6
45 7
97 61 668 9
87.2109.7
9.0
15.610.8
114.0203. 8
26.825.4
.127.640.4
50.4170.742.75.5
23.022.93.7
63639
56623
14715132462
49
239377
164315,789
178.8110.568 3
5044,955
13.0
50.0
21.021.460.542.6
128.1149.9187.0
1 123
537 3108 5459 287 2
304 010 685?04 4
399 610 7
476 8
42 6
100 91 597 0
83.1107.0
7.4
17.77.9
118.0190.7
21.520.8
.126.335.6
58.1175. 742.84.8
23.123. 43.3
72040
54776
12719
135813
150
205428
177. 0111.865 2
4904, 931
10.9
46.8
21.219.650.035.0
114.3134.0189.8
1, 145
528 4107 7469 088 4
325 510, 1402°9 5
399 311.0
495 5
36 7
102 61 687 3
84.7103.7
8.8
14.89.6
127.8218.3
25.919.1
.131.737. 1
49.7177.244 05.0
23.824.32.8
66860
51364
232186
7546
290
246456
176. 6112.264 4
4764.880
12.1
47.7
27.021.663. 041.2
126.6153.7189.3
1 126
528 490 5
454 485 5
336.410, 439238 6
375 28.9
472 4
45 3
95 41 666 2
72.6111.6
9.2
14.38.7
121.4216.4
26.815.9
. 128.741. 4
61 7181.740 "5 8
92 092.02 8
69643
55781
2071921
11114
161
247441
423321,379
160 397 163 9
4734,844
12. 8
43.3
25.521 262.842.2
130.1156. 5183.3
1 208
548 593 9
470 9Q9 8
372 710 960
261 7
418 910 9
497 8
51 0
106 51 836 7
95.4104.6
8.6
14 210.0
139 9234.3
30 216.1
131 445.3
73.5180. 347 57 5
25 625. 62 8
67081
48783
2442127qg31
°58
291446
171 1100 270 9
4914 743
14.0
47.2
30.223.969.648.5
136. 5168.3202.4
1,197
586 980 5
469 088 4
405 910.892253 3
400 011.5
487 9
52 6
107 71 788 4
89.5106.1
9 &
8.1
11.47.3
P3. 1226.4
92.620.5
.128. 540.9
58 7169 843 q
5 8
23 624. 52 0
70164
51788
18827115235
162
282462
138. 977.061 9
4844,763
13.8
40.5
24.921.262.041.5
133.2160.5200.0
1 216
607 579 2
482 087 2
414 611 744253 7
388 011.3
497 3
42 5
106 11 853 1
90.9121.0
8 8
9 49 4
123 42^0 4
30 022 2
I30 839 5
58 9177 345 5
4 3
24 593 83 3
69366
52466
90020116539
189
294490
323322 968
117.761 056 7
4954 760
12.1
37.7
25.920.461.738.0
127.8153.0210.1
1 154
614 879 0
466 891 2
402 012,011267 9
381 29.3
490 2
41 4
106 31 868 4
92.3111.8
8.2
11.48.8
121.8207. 0
29.122.3
129.637.4
60 5179. 549 5
4 9
?6 626.43 9
69298
458100
9552014
11732
374
304459
138.875 563 3
5004,780
11.6
44.4
26.022.766.342.8
132.3150.5210.8
1,120
583 876 0
456 094 8
402 612 201273 5
394 510 5
484 2
40 9
103 21 853 7
94.0101.6
7.1
12 810. 8
109 1203.0
26.325.4
129 936.7
56 1183 0
44 04 7
23 723 13 7
66839
53459
25316999330
933
327443
1-12. 580. 661.9
4994,786
13 0
44.0
25.023.964.039.6
136.6158.32C8. 7
1,252
650 782 8
488 6104 1420 5
13,367284 8
419 111.4
514 3
53 1
108 31 983 5
93.4125. 4
8.4
13 39.4
138 8°19. 5
28.527.6
.130.344.9
53 8188 943 9
5 4
23 924.79 9
70468
49594
9921736
19629
369
336383
141262, 470
165.297.168. 1
4994,720
15 2
48 5
27 625.472.643. 1
146. 3173.3210.1
1, 233
636.885.0
480 6104.4375. 1
13,107286. 5
415. 311.7
507. 3
53.7
109. 22 016 2
82.9109.2
9.1
11.37.4
129.3237.7
28.526.5
.133.949.2
54.0189. 346.7
5.7
'25.124.83.1
58455
46833
3761943
15063
424
337249
186.0112.273.8
5134, 686
13 9
r 49 0
29 827.271.5
r 45 9
144.7174.4217.8
1,271
659.794.9
501 1106.0349. 5
13, 402280.3
435. 112.3
534.4
52.3
116.11,980 9
88.5115.2
2 110.6
13.08.0
116.9r225.2
23.727.7
.134.449.9
53.0184.945.35.5
23.823.53.4
68463
52950
17317116522
254
307249
188.5115 073 5
5314, 676
12 4
47 9
26 227 067. 443 3
149.7176. 7226 6
1,204
636.7108. 9469 9100.8306.5
12, 538259.5
419.511.2
503.7
44.5
107.81,859.1
87. 5106.5
9 59.8
12.011.9
138.2229. 6
26. 731.1
.131.148.5
82747
66060
180117
3450
273346
195334 018
197.8119.578 3
r Revised. * Quarterly average. 2 Beginning Jan. 1963, the estimated totals are basedon a new and larger sample and reflect improved estimating methods, which affect compara-bility with data for earlier periods; Oct.-Dec. 1962 estimated totals on the new basis appearon p. S-25 of the Feb. 1964 SURVEY. 3 Based on annual total containing revisions notdistributed by months.
c^Data are reported on the basis of 100% content of the specified material unless otherwiseindicated. 9 Includes data not shown separately.
*New series. Data exclude some materials (chiefly crudes) shown in the former series.Monthly data prior to Jan. 1963 may be obtained from Bu. of Census reports.
Digitized for FRASER http://fraser.stlouisfed.org/ Federal Reserve Bank of St. Louis

S-26 SURVEY OF CURRENT BUSINESS
Unless otherwise stated, statistics through 1962and descriptive notes are shown in the 1963edition of BUSINESS STATISTICS
1962 1963
Monthlyaverage
1963
June July Aug. Sept. Oct. Nov. Dec.
1%-f
Tan. Feb.i j
Mar. ! Apr. May i Turn-
ELECTRIC POWER AND GAS
ELECTRIC POWER
Production (utility and industrial), total Omil. kw.-br_.
Electric utilities, total - doBy fuels doP>y waterpower do
Privately and municipally owned util doOther producers (publicly owned) do
Industrial establishments total doRv fuels do
Sales to ultimate customers total (EEI) doCommercial and industrial:
Small light and power do__ _Large light and power - -do
Railways and railroads - do_ _.Residential or domestic dostreet and highway lighting - doOth^r public authorities do_ _ _Interdepartmental do
Revenue from sales to ultimate customers (EdisonFlectric Institute) mi l .$_ .
GAS
Manufactured and mixed gas (quarterly) re f tCustomers end of quarter total 9 thous
Rp<?idential doIndustrial and commercial do
Bales to consumers total 9 mil thermsResidential doIndustrial and commercial do
Revenue from sales to consumers, total 9mil. $_.
Residential - do _ .Industrial and commercial - do
Natural gas (quarterly) :d" tCustomers end of quarter total 9 thous.-
Residential do _-Industrial and commercial do
Sales to consumers, total9 mil. therms--Residential doIndustrial and commercial do
Revenue from sales to consumers, total9-.mil. $.Residential _ _ -- doIndustrial and commercial - do. __
78. 62471,02657, 00314, 024
57, 72513,301
7,5977,313
284
64, 674
12, 00831, 160
39318. 868
6121.529
104
1,085.4
1 9221.800
122
530370157
67.351.315.7
32, 67430,014
2, 624
25. 0458. 466
15.321
1,541.3847.7651.0
83, 99176, 16762, 37913, 788
62, 09514. 073
7,8247, 555
270
69, 234
13. 38732. 856
38920.141
6461,683
133
1, 141.4
1.5331.432
100
502346153
60.946,114.6
33, 89331,128
9 797
26, 3218.748
16, 263
1,613.2880.3687.5
S3, 66575, 73161 75613. 975
62. 04513. 686
7, 9357 653
281
67, 803
13. 50333, 304
34618 304
5411.647
157
1,191 6
1,8391,724
114
441285153
56. 942.314. 5
33, 33630,628
2, 671
23, 9646,924
15, 982
1, 417. 6733.4648.1
88, 70381.00066 8l)714 173
66, 28714,713
7, 7037 474
229
70, 509
14.93833. 081
35119 75°
5511.673
163
1 167 3
89, 86181 97368 44013 533
67. 16114 812
7 8877 665
909
73,018
15 63933. 871
35890 fi90
5911 707
161
1 ''(10 7
82. 89275.15663 14419 019
61, 76913 387
7 7357 533
9p.o
72. 079
15. 09733. 790
34890 356
6311,706
159
1 187 8
1 1971 114
83
914
100112
26. 616.99.6
33, 98931,286
2 666
19, 5042. 966
15,297
1,002.5401. 7561. 8
84. 84576. 71°64 491
63. 18113. 531
8,1337 917
215
69, 51 6
13,70634, 279
37318 553
6911.776
138
1 136 9
82, 43774, 47461 76912 705
60, 83713, 637
7, 9637 722
241
68, 309
13, 09533, 463
37818 793
7351,719
126
1 119 0
90, 30282, 26067 65314 607
66, 45915,802
8,0427 770
272
71 364
14.09332. 593
45221 630
7731,716
108
1, 161. 7
1 1961 111
84
494
145
47 834. 712 9
34, 79931, 929
2, 832
25, 8668, 097
16, 465
1,596.5848. 6702. 5
90. 64282, 32867 83414 495
67, 02415 304
8 3138 019
294
75, 196
H4, 165132, 993
43994 939
7801,769
118
1 °17 9
84, 61376, 7016° 90613 795
62, 14314 558
7,9127 69l
291
72, 724
114,0611 32, 330
43623 295
7111 , 774
118
1 184 5
87, 98779, 59563 65215 942
64, 59614,999
8, 3928 075
317
72, 692
U4, 121133,330
40922. 301
6931,707
130
1.169.0
84,534 i76, 39260 099
16 301
62. 20414 1«8
8 1427 807
335
71 549
!14 03433 643
3849Q qg°
' 6411 79]
143
1 153 0
87, 22 (i78, 89463 03115 863
64, 15514 739
8 3328 (P7
305
71,065
i 14 327i 34, 459
36819 431
6131,712
156
1 145. 9
90, 58582, 29468 34113 953
67. 96014, 334
8, 2928 045
946
ii
FOOD AND KINDRED PRODUCTS; TOBACCO
ALCOHOLIC BEVERAGESBeer:
Production mil. bbl._Taxable withdrawals doStocks end of month do
Distilled spirits (total):Production -- - mil. tax gal--Consumption, apparent, for beverage purposes
mil. wine gal_.Taxable withdrawals mil. tax gal--Stocks, end of month _ _ doImports mil. proof gal--
Whisky:Production --- .-mil. tax gal--Taxable withdrawals doStocks, end of month doImports _- - mil. proof gal- -
Rectified spirits and wines, production, totalmil. proof gal- -
Whisky do -.Wines and distilling materials:
K (fervescent wines:Production mil. wine galTaxable withdrawals . _ _ _ do _ _Stocks, end of month doImports do
Still wines:Production _ _ _ _ _ _ _ _ _ _ _ d oTaxable withdrawals doStocks, end of month doImports ~~ do
Distilling materials produced at wineries___do
8.077.60
10.46
12.90
21. 1410.27
882. 723.60
9.417.18
859. 133.18
7.205.33
.37
.322.79
09
15. 7812. 52
178. 861.08
31.27
8.397.82
10.76
12. 50
21. 5810. 34
876. 903.82
8.747.08
852. 543.35
7.245.19
40.35
3.0009
16 8513. 11
185. 041.11
39.39
9.678.81
11.77
10.79
20.2410. 76
883. 313.26
7.066.78
859. 772.90
7.375. 23
54.31
3. 3106
1 8412.77
142. 451.00
11. 87
10.8310. 2211.70
6.82
19.989.25
878. 483.49
3. 405. 63
855. 342. 99
6. 234 42
9199
3.2805
9 01
9. 57131 11
1.00
8.38
9.389.26
11.18
8.52
20.1210.02
874. 493.35
5. 066. 46
851. 802 92
6.734 62
3031
3. 2905
3 0412. 84
120. 8497
9. 98
7.427.37
10.72
9.42
19.4611.11
869. 813. 94
5. 808. 02
846. 883.38
7.745 68
3439
3. 2109
45 4312.52
155. 871.07
118.07
7.937.95
10 19
15. 99
24.4514. 57
867. 445.71
10. 1310. 85
843.025.04
10.888 35
4554
3.0718
108 6815. 56
246. 451.92
202. 64
6.856.739 85
13. 39
25. 8911.36
865. 875.37
8 498. 38
840. 034. S3
8.156 24
3757
2. 8614
91 4714.07
249. 051 47
70. 11
7.317.059 67
14. 18
30. 928. 56
870. (X)4.87
9 995. 91
842. 404.19
5.874 15
4459
2.6515
4 7613. 71
229. 081 18
18.48
7 636 74
10 08
13.89
18.499.34
871 773.03
10.386.46
844. 011.57
6.354 33
4334
2.7106
9 7313.57
213. 8979
5.10
7.506.42
10 68
13 51
18.439.53
873 193.07
10 976. 73
854. 141 77
6.274 51
4827
2.8806
9 9713! 76
201. 611 57
8.38
8 957 80
11 30
14 06
21.8410. 51
874 443.62
10 367. 05
846. 103 93
7.245 18
6334
3i 1408
3 4015.96
185.831 10
6. 15
9 638 49
11 82
r 14 51
21. 08r 11. 46874 54
3.84
10 957.50
846.913 49
7. 855 68
5333
3.3108
9 1913' 80
175. 6890
1.79
9 288 73
11 77
13 64
22 2710.91
874 973.71
9 707.05
846. 761 48
7.385 16
3836
3' 3009
1 8112. 86
164, 181 16
1.51
4.16
3 71
09
1 91
r Revised. i Not directly comparable with data through 1963. Comparable figures forJun.-May 1963, respectively (mil. kw.-hr.): Small light and power—12,609; 12,535; 12,617;12,577; 12, 889; large—31,105; 30.442; 31,440; 31,753; 32, 496.
O Revisions for Jari.-Dec. 1962 appear on p. 24 of the Mar. 1964 S U R V E Y .
cfThe averages shown for gas are quarterly averages.JRevised data for 1st and 2<1 qtrs. of 1962 appear in the Sept. 1963 SURVEY.9 Includes data not shown separately.
Digitized for FRASER http://fraser.stlouisfed.org/ Federal Reserve Bank of St. Louis

August T!)(i4 SURVEY OF CURRENT BUSINESS S-27
Unless otherwise stated statistics through 1962and descriptive notes are shown in the 1963
1962 1963
A T ^ T l t V l l - T T
edition of BUSINESS STATISTICS j "average^
1963
June July Aug. Sept. Oct.i
Nov. 1 Hec.1
1961
Jan. Feb. Mar. Apr. May June July
FOOD AND KINDRED PRODUCTS; TOBACCO—Continued
DAIRY PRODUCTS
Butter, creamery:Production (factory) f niil IhStocks eo1 d storage end of month doPrice, wholesale, 92-score (N.Y.) $ per lb._
Cheese:Production (factory) totalj mil. l b _ _
American whole milkj _ _ d o _
Stocks, cold storage, end of month, total doAmerican whole milk do
Imports - do -Price, wholesale, American, single daisies (Chi-
cago) $perlb_.Condensed and evaporated milk:
Production, case goods:tCondensed (sweetened) mil. IbEvaporated (unsweetened) do _
Stocks, manufacturers', case goods, end of mp.:Condensed (sweetened) mil. IbEvaporated (unsweetened) do
Exports:Condensed (sweetened) - doEvaporated (unsweetened) do
Evaporated (unsweetened) $ per case.."Fluid milk:
Production on farms m i l . l b _ _TTtili/ation in mfd dairy productsd" doPrice wholesale U S average $ per 100 lb__
Drv milk:Production:!
Prv whole milk mil. l b _ _Nonfat dry milk (human food) do
Stocks, manufacturers', end of month:F>rv whole milk _ - do__ _Nonfat dry milk (human food) -do
Exports:T)rv whole milk - do_Nonfat drv milk (human food) _ _ do
Price, manufacturers' average selling, nonfat drymilk (human food) - $ per Ib .
GRAIN AND GRAIN PRODUCTSExports (barlev corn oats rve wheat) mil. bu_.
Barlev:
Stocks (domestic) end of Quarter total doOn farms doOff farms do
Exports including malt§ - - do.- -Prices, wholesale (Minneapolis):
No 2 malting - $ p e r b u _ -No 3 straight do. _-
Corn:Production (crop estimate, grain onlv) mil. bii--•Grlndings wet process - _ do
Stocks (domestic), end of quarter, totalmil bu
On farms doOff farms do
Exports, including meal and flour doPrices, wholesale:
No. 3, yellow (Chicago) $ per bu_.Weighted avg., 5 markets, all grades do
Oats:Production (crop estimate) __mi l . hu_
Stocks (domestic), end of quarter, total . do_ _.On farms _ doOff farms - _ _ . _ . _ _ d o
lExports, including oatmeal doPrice, wholesale, No. 2, white (Chicago) t
Iperbu-.
Hice:Production (crop estimate) mil. bags 9 --(California mills:
Receipts, domestic, rough _ mil IbShipments from mills, milled rice doStocks, rough and cleaned (cleaned basis) , end
of month mil. lb_.Southern States mills (Ark., La., Tenn., Tex.):
Receipts, rough, from producers mil. lb_-Shipments from mills, milled rice doStocks, domestic, rough and cleaned (cleaned
basis), end of month mil l b _ _Exports do•Price, wholesale, Nato, No. 2 (N.O.) $ per lb_.
3Rye:Production (crop estimate) _ _ _ mil buStocks (domestic), end of quarter, total doPrice, wholesale, No. 2 (Minneapolis). _ _ $ per bu..
- 128. 1363.4
.594
132.191.1
463. 4420.4
6.5
.400
6.1160 .7
5.0178.4
4.05.5
6.11
10,5025,2164.10
6.6185.5
6.3123. 4
1.125.5
.148
96.9
* 436. 42 284 82 160. 82 124.0
8.3
1.261.20
1 3, 63714.3
2 2 9292 1, 80721,122
35.5
1.111.08
1 1, 0202 6282 553
274
2.5
.71
1 66. ()
12679
97
364255
866193
.094
i 40.82 19. 9
1.22
r 118. 3328.4.590
- 136. 1- 93. 6
385. 0344.9
6.9
.426
6.6- 158. 1
6.6162. 9
5.05.2
6.01
10, 399r 5, 099
4.10
r 7.6' 174. 7
5. 795. 0
2.544.6
.144
103.4
i 399. 9
2 284. 02 165. 02119.0
4.8
1.191.11
r 1 4, 08215.4
2 2. 70521,779
2 92636. 6
1.241.20
i 981
26212 545
276
.9
.73
' 70.1
J2285
132
438270
957220
. 093
1 29. 4215.0
1.30
T 142.6401.4.586
176. 6r 129.9
416. 0373. 9
6.6
.423
7.7- 208. 1
7.8194.2
7.010.7
6.02
11.841r 6, 471
3.72
-7. 6- 239. 7
6.5136. 5
.850.6
.144
100.5
3 146. 8367 .6379.3
5.3
1.241.14
15.5
2, 1151,386
72943.1
1.291.25
32743 232
343
1.0
.72
8353
103
62234
388101
.095
3 0. 9
r 114 1392. 6
.587
150.5111.7
439. 9394. 8
5.7
.427
'9.2- 184. 4
9.0223. 5
5.24.5
6.00
10, 861* 5, 635
3.91
-7 .4r 182. 4
6.5115. 9
1.748.4
.144
98.2
1.7
1.141.05
16.7
35.6
1.321.26
1.6
.68
5952
90
115218
255245
. 095
~"l.~21~
* 95 2367.0.590
139. 899.7
435.2390. 6
3.8
.428
9.6^ 175. 2
10.4243. 1
9.33.3
6. 00
10, 130r 4, 983
4.08
'8.1r 144. 8
5 599.3
4.748.7
.144
84.6
4.2
1.111.02
16.4
26.6
1.321. 25
1.2
.68
6654
78
836231
57097
.090
1.22~
T 85 5328.7
.603
127. 086.6
407. 9363. 9
5.1
.428
6.9r 140. 3
6.2231.8
5.910.0
6.00
9, 558- 4, 183
4.29
'• 7. 6-119.4
4.882. 1
2.639.2
.144
92. 7
426 0262. 6163 4
5. 5
1.181.09
15.3
3 I 3163 5143 80127.8
1.351.26
946«33113
8
.71
6145
75
1. 079332
1.34087
.087
23. 11.42
-91.8284. 5
. 596
122.581.6
378. 2336. 9
7.5
.432
-3.9-129.7
5. 7199.8
7.93.3
6.00
9, 557- 4, 148
4. 43
-7 .1-121.4
5.063. 0
2.041.9
.144
115.6
4.8
1.221.14
16.8
33.5
1.181.19
.6
.71
27162
192
1, 113357
1,235197
.088
•
~"I.~45~
-91.9241.3
.593
115. 773.7
363. 3323. 7
9.7
.432
4.0r 122 2
6.5150.8
.33.8
5.99
9, 205- 3. 900
4.48
- 6. 7- 128.2
5.364.3
1.653. 6
.144
125.6
7. 7
1.211.11
16.7
55. 7
1.151.16
9
.72
8148
200
377264
1,710•'03
.088
1.4~4~
-111 6207. 0
. 593
124. 578.3
340. 7301.6
8.4
.432
- 7.0-133.9
5.8131.7
7.02.9
6. 00
9, 706- 4, 399
4. 42
-6.3r 158.3
f>. 381.5
2.938. 0
.146
130. 7
329 5199. 1130 4
5.8
1.181.09
14.4
4 3533 2171 13654.7
1.191.19
773688
85
2
.74
7084
168
295329
1. 592357
.088
14.81.42
- 128 8187. 1. 587
- 125.9-82.4
318.1279.2
6.6
.430
6 0- 140. 3
5.996.8
3.32.5
6.00
10, 066- 4, 922
4.34
- 7.6- 176. 9
6.180.9
2.127.4
.146
123. 8
5.5
1.181.10
15.9
46.8
1.221.20
.2
.75
90689
232
329379
] . 447314
. 088
"i.~48
-123 5191.2
.587
124.0-81.4
301.6263. 7
4.6
.430
5.6r141.5
6.182.6
3.03.1
5. 98
9. 842-4,917
4.25
6.6- 181.0
5.886. 1
.837.9
.146
112 5
6.7
1.161.09
15.9
33.5
1.191.18
.2
.71
138187
143
192386
1. 197419
.088
~~T38~
-139 4191.0.586
r 145. 896. 5
301.7264. 0
8.5
.422
6 7- 150. 0
7.369. 7
3.42.4
5. 98
11,007- 5, 655
4.12
-7 .3- 206. 7
6 697.6
.888.6
.146
123.4
- 231 0129.2
- 1 01 82.9
1.181.10
17.4
3 9642 2541 01033.5
1.211.21
- 517446
72
1
.68
14189
170
123
931I 3,-^
. 088
"~ i6~8~
1.34
- 142 7195 7.586
- 151.8- 106. 5
323. 1284 0
6.4
.420
10 7- 160. 8
9. 182. 6
5.23.0
5. 96
11,346- 5, 904
3. 94
- 7.8-217.7
7. 5104.6
1. 161. 0
.146
126.6
5.6
1.221.14
16.5
42.4
1.241.24
.3
.68
1631«4
105
148494
7464 00
.088
~~"l .~32~
- 153 5203 5.587
- 176. 4- 128. 3
352. 2309 7
7.0
. 420
10 0- 208 5
10 0147. 6
8.62 7
5.94
12, 330' 6 613
3.82
- 7 4- 250. 2
7. 1130 6
1 3119 4
.146
129 7
12 6
1 ?31 16
17 ?
35 4
1.281.27
7
.66
103109
69
71428
531
. 088
------
142 9- 234 Q
.587
175 3128. 1
-331.8- 339 •>
5.4
.421
2()9 0
9 6208 9
5 43.0
5.93
- 1 1 , 7906 528-3.78
6 6235. 6
0.4r'8 6
(>107 1
. 146
96 6
- 132 7'-' 59 73 73 1
1 191 11
17 0
2 '-M C^
1 479866
9g f)
1 . 2 f >1.24
3 31 ̂3 9r)9
3 f,3
g
. 66
49
74
58372
355
p. 088
"""a" 5." 3"
1.28
240 1.591
4"5. 4359 0
.428
10 824
3 94
" 387 7
1 is1 08
«3 88515 *>
1.221.21
" 910
. 65
a 79 4
a 34.4
. 1.19r Revised. *> Preliminary.1 Crop estimate for the year. * Quarterly average.3 Old crop only; new crop not reported until beginning of new crop year (July for barley,
oats, rye, and wheat; Oct. for corn).^Revisions arc available upon request as follows: Jan. 1961-June 1962 and Jan.-May 1963
for cheese and nonfat dry milk; Jan .-June 1962 and Jan.-May 1963 for butter and condensed,«vaporated. and dry whole milk.
cf Revised series; data reflect inclusion of creamed cottage(formerly excluded). Revisions for 1946 and 1952-58 (formerseries) appear 011 p. 24 of the Mar. 1964 SURVEY.
§ Excludes a small amount of pearl barley.t Revised scries (for No. 2; formerly, for No. 3).9Bags of 100 Ib. "Aug. 1 estimate of 1964 crop.
cheese andseries) and
frozen1958-fi2
products(revised
Digitized for FRASER http://fraser.stlouisfed.org/ Federal Reserve Bank of St. Louis

S-28 SURVEY OF CURRENT BUSINESS ISXiJ
Unless otherwise stated, statistics through 1962and descriptive notes are shown in the 1963edition of BUSINESS STATISTICS
1902 1963
Monthlyaverage
1963
June July Aug. Sept. Oct. Xov. Dec.
19(14
Jan. Eeb. Alar. Apr. May June i July! i
FOOD AND KINDRED PRODUCTS; TOBACCO— Continued
GRAIN AND GRAIN PRODUCTS— Con.
Y V h e f l t :Production (crop estimate) , total mil. bu..
Wi t^ h V — dodistribution fouarterlv total) do
Stocks (domestic), end of quarter, total do....
Off farms *̂
Fxports total including flour d*o
Prices, wholesale: „ xNo 1, dark northern spring (Minneapolis)
$ per bu..Vo.2.hd.anddk.hd.winter(Kans. City) -doWeighted a vg 6 markets all grades do
VTHeat flour:Production: ,, x
Flour .thous. sacks (100 Ib.)..
Offal ' thous. sh tons..Orindin?s of wheat - thous. b u _ _Stocks held by mills, end of quarter
thous sacks (100 Ib )
Prices, wholesale:Spr'ms? standard patent (Minneapolis)
$per 100 lb_.Winter hard Qr>^ patent (T^ans City") do
LIVESTOCK
Cattle and calves:Sin nearer (federally inspected) :
Calves thous animals..C strip ^^
Pppplpf 9 (salable) at 27 public markets do. _.Shipments, feeder, to 8 corn-belt States doPrices, wholesale:
"Reef stoers (Chicago) $ PPF 100 lb_ _Steers, stocker and feeder (Kansas C i t y ) - _ d o _ _ .Calves, vealers (Natl. Stockyards, Til.).- do...
Slaurhter rfederally inspected) ....thous animals.Receipts (salable) at 27 public markets doPrices:
Wholesale, average, all grades (Chicago)$per!001b._
TTo<?-eorn price ratio (bu. of corn equal in valueto 100 Ib live hog) - -
Sheep and lambs:Slaughter (federally inspected). -..thous animals.Receipts (salable) at 27 public markets doShipments feeder to 8 corn -belt States doPrices, wholesale:
T ambs average (Chicago) $ per 100 IbLambs, feeder, good and choice (Omaha).do
MEATS AND LARD
Total meats:Production (carcass weight, leaf lard in), inspected
slaughter - m i l . l bStocks (excluding lard), cold storage, end of
month mil. IbExports (meat and meat preparations) t doImports (meat and meat preparations)! — do
Beef and veal:Production, inspected slaughter . ..do,..Stocks, cold storage, end of month do.. _"Kx ports doImports doPrice, wholesale, beef, fresh, steer carcasses, choice
(600-700 Ibs.) (New York) Sper lb_Lamb and mutton:
Production, inspected slaughter mil. IbStocks, cold storage, end of month . . do
Pork (includinglard), production, inspected slaugh-ter mil Ib
Pork (excluding lard):Production, Inspected slaughter. . _ doStocks, cold storage, end of month ..doFxports _ _ _ _ _ d oImports ... - . - - - - - ...doPrices, wholesale:
Hams, smoked, composite $ perlb..Fresh loins, 8-1 2 Ib. average (New York) .do
Lard :Production, inspected slaughter . . mil.lbStocks, dry and cold storage, end of mo do.Exports _ - _ - _ - do -.Price, wholesale, refined (Chicago") $ per l b _ _
i 1,094i 273i 8212316
2 1, 7132 259
2 1, 453
49.243.0
2.482.192.41
21, 83992.4406
49, 613
a 4, 5842,686
5. 9095.621
4151, 6951,225
595
27.2024.5329.75
5,6481, 650
16.44
16.4
1,224524224
19.455 15. 57
2,151
48142
109
1, 046. 6163. 5
2.379.0
.464
57.914.3
1,046.5
806.0235.9
5.317.0
7.491.475
175.398.935.2.125
i 1, 1381 2331 9052337
21.5632 259
59.753.3
2 422' 202.33
21, 991r 92. 6M07
49, 976T 24, 710
2,808
5.6395. 365
3781. 8051,173
551
23. 7922. 9530. 00
5, 9651, 646
15.03
13.6
1, 163444200
18.69« 17.46
2. 292
59245
122
1,137.4217.2
2.392.0
.417
55. 619.5
1, 099. 0
856. 6279.211.517.6
.464
.443
176.4123.144.8.122
311
3 1, 195395
3 1, 100
49.139.1
2.502.032.18
20, 42193.6377
46, 520
4 3834, 330
5. 0505. 233
2821,752
997294
22. 5422.7428. 00
4,8801,411
16. 30
13.9
972350115
20.0019.74
2,078
62342
105
1,112.8197.3
1.778.0
.402
44.619.8
920.4
708.0322.511.514.5
.458
.470
155.3136. 324.2.115
55.451.4
2.312.012.12
21,68790.4398
49,215
1,702
5. 3884.967
3411 . 8381, 185
342
24. 5023. 1927. 00
4,9951, 405
17.20
14.4
1,201470122
16. 5017.80
2, 150
57938
144
1. 150.0201. 0
1.9110.1
. 420
55. 019.9
944.2
731.4274.0
8.120.0
.478.495
155. 0113.952.4.118
52.147.6
2.262.032.19
22, 88695.3
42551.990
1,937
5.0134.900
3001,9001,107
408
24.4723. 0727. 50
5,1741,393
10.00
13.9
1,204442223
10. 5010.84
2,187
42142
1,187.3208.8
2 71 1?)'. 7
. 422
55. 719.8
943. 5
735. 3220.0
6.514.3
.488.498
151.388.364.8.125
39°
1, 941409
1.533
58. 152.2
2.362.092.29
21, 40997.9400
48, 798r 4 516
2, 570
5. 5505. 283
3951, 8291.2S7
717
23.8022 7128.' 50
5, 8681,573
15.53
12.7
1,236601428
18.7516.84
2,245
52347
144
1, 130. 8228. 2
2.8122. 0
.420
57.418.0
1,050.6
823. 7210. 4
9.714.8
. 405
.478
105. 181.253.2.123
75. 570.4
2.432. 202.37
24. 64998.0
»• 45956, 105
2, 232
5. 7255. 467
4022, 0921.5921,281
23.9722. 3827.50
6,7751,846
15.29
14.1
1,441040457
18.2516. 52
2, 582
54158
132
1,291.2246. 1
3.2105. 7
.417
67.317.8
1, 223. 4
959.3208.9
14.419.1
. 463
.401
191. 375.247.6.131
01.055. 1
2.392.212.34
22 220101. 0
41250, 558
2, 550
5. 7385. 450
3851,7931,2831,133
23.3821. 5330. 50
6, 3801, 726
14. 39
13.9
1,112419213
18.8816.44
2, 360
02302
112
1,117.8279. 5
2. 989.8
.404
52.517.2
1,195.7
939.2250. 2
15.110.2
.472
.427
187.192.435.2.143
329
1, 613309
1,304
68.960. 0
2.372.232.31
21, 39991.8393
48, 599
4 8233,878
5. 5385.233
4001,8081, 205
578
22.1020. 0030. 50
6, 0951,874
13. 70
12.0
1,105400122
19. 38
2,450
05349
121
1,137.9287.6
2.490. 6
. 391
53.218.6
1,259.2
987.4276.716.518.6
.480
.417
198.4119.432.7.125
*70. 566.0
2.372.242.31
23, 51997.5433
53, 494
1,912
5.5385.250
4122,0131,189
525
22. 3821.1731.50
6, 9561,828
14.22
13.2
1,296394146
19. 50
2, 662
72900
119
1, 292. 8297.5
3.589.3
.398
63.918.3
1,305.6
1,017.1332.8
22.916.7
.458
.438
209.4105.762.7.128
71.565.6
2.322.232 27
21. 21896.8390
47, 872
2, 527
5. 5635.300
3421,710
909319
21.1821.5734. 00
5,8981,511
14.37
13.2
980294143
21.12
2, 252
7735073
1,119.3282.1
2.151.9
.381
49.018.4
1, 082. 8
854.4382.3
18. 514.8
.457
.413
173. 0124.9
52. 3.131
r 410
r 1, 205153
r 1, 052
86.681.5
2.252.172.19
21, 95690.0400
49, 640
5 8432, 183
5. 3135. 150
4001,8781,141
384
21.3821.4231.50
6 4201,635
14.22
12.7
1, 035304133
22 ^5
2,447
81053
101
1,220.2284. 5
2.571.4
.378
52. 518.3
1,174.7
914.5411.213.019.7
.452
.409
189.1113. 651.6.126
78.070.7
2.342.262.26
22. 24191.2411
50, 226
3,127
5. 6005.400
3792,0451,139
355
21.0320.9126. 50
6,4811,681
13.89
12.3
1,052319171
22. 25
2,575
8724789
1,314.8276. 3
3.960.4
.379
53.616.3
1, 206. 5
940.9473.610.916.3
.435.401
193.0116.372.8.130
79.572.1
2.352.132.26
21,96194.3
40949, 890
3, 191
«• 5. 478r 5. 250
3212, 0701,0^2
322
20. 2919.24
r 27. 50
5, 4761,460
14. 46
12.3
980289215
24.00
2, 406
8736370
1.319.6
53.' 1
.372
48 210.4
1, 038. 1
798. 4408. 8
13.518.0
.423
. 395
175. 7r 125. 2
51.91 .130
300
3 900s 75
3825
60. 054.8
2.381.531.58
27, 057110. 6
50701,557
5, 3542, 249
p 5. 785p 5. 334
3382, 2071, 257
200
21.3718.92
p 23. 5!)
5, 0381,443
15.22
12.8
1, 050337154
23.75C5)
2, 404r 833
56126
1, 384. 8r 300. 4
5. 099. 6
.384
48. 3' 18. 2
970. 9
743. 6-412.9
12.917. 0
p. 448.461
165.795.291.1
p. 131
« 1,285a 273
* 1,012
1. 701.551.59
~~M~201
23.1518.81
* 1,405
15.88
14,4
* 343
23.38
722
284. 7
. 408
10.9
325. 0
.503
r Revised. *> Preliminary.1 Crop estimate for the year. 2 Quarterly average.8 Old crop only; new grain not reported until beginning of new crop year (July for wheat).* Beginning Jan. 1964, flour included in total is converted to grain equivalent on basis of
2.33 bu. of wheat to 100 Ib. of flour (2.3 bu. formerly used).5 Average based on months for which quotations are available. 6 No quotation.
Cattle, etc., 1,154; hogs, 1,461; sheep, etc., 463
Digitized for FRASER http://fraser.stlouisfed.org/ Federal Reserve Bank of St. Louis

August l!Mi4 SURVEY OF CURRENT BUSINESS S-29... - .
Unless otherwise stated, statistics through 19G2and descriptive notes are shown in t he 1963edition of BUSINESS STATISTICS
19G2 19(53
.Monthlyaverage
19G3
Juno July Aug. Sept. Oct. ! Nov. Dec.
19G4
Jan. Feb. Mar. Apr. May June July
FOOD AND KINDRED PRODUCTS; TOBACCO—Continued
POULTRY AND EGGSPoultry:
Slaughter (commercial production) mil 11")Stocks, cold storage (fro/en), end of month, total
mil.lb-Turkcys do
Price, in Georgia producing area, live broilers$ per l b _ _
5ggs:Production on farms _mil casesO-.Stocks, cold storage, end of month:
Shell thous. casesO-.Frozen mil. l b _ _
Price, wholesale, extras, large (delivered; Chicago)$per do7,_-
MISCELLANEOUS FOOD PRODUCTS
Cocoa (cacao) beans:Imports (incl shells) thous Ig tonsPrice, wholesale, Accra (New York) $ per lb_.
Coffee (green):Inventories (roasters', importers', dealers'), end
of Quarter thous bagscfRoastlngs (green weight), quarterly total do
Import^ total doFrom Bra/il do
Price, wholesale, Santos, No. 4 (New York)$ porlb..
Confectionery manufacturers' sales _ mil. $
Fish:Stocks, cold storage, end of month mil. l b _ _
Sugar :Cuban stocks, raw, end of month
thous. Spanish tons_.United States:
Deliveries and supply (raw basis) :§Production and receipts:
Production thous sh tonsEntries from off-shore, total 9 do
Hawaii and Puerto Rico__ do
Deliveries, total 9— doFor domestic consumption do
Stocks, raw and refined, end of month.do
Exports, raw and refined sh. tons.Imports-
Raw sugar, total 9 thous. sh. tons..From Republic of the Philippines _ _ _ d o
Refined sugar, total do
Prices (New York):Raw, wholesale $ p e r l b _ _Refined:
Retail (incl. N.E. New Jersey) $ per 5 IbWholesale (ex el. excise tax) .$ per l b _ _
Tea imports thous Ib
Baklnsr or frying fats (Incl. shortening):Production. _ ___ _ _ mil. IbStocks (producers' and warehouse), end of month
mil. IbSalad or cooking oils:
Production doStocks (producers' and warehouse), end of month
mil. lb_.Margarine:
Production doStocks (producers' and warehouse), end of month
mil. lb_-Price, wholesale (colored; mfr. to wholesaler or
large retailer; delivered) $ per lb_ .
FATS, OILS, AND RELATED PRODUCTS
Animal and fish fats: ATallow, edible:
Production (quantities rendered) mil. lb_ .Consumption in end products __ doStocks (factory and warehouse), end of month
mil. 11)..Tallow and grease (except wool), inedible:
Production (quantities rendered) doConsumption in end prooucts doStocks (factory and warehouse), end of month
mil. lb_-Fish and marine mamma lolls:
Production^ _ ___ _ doConsumption in end products _.. __ _ _ _ d oStocks (factory and warehouse), end of month
mil.lb-
578
306199
.144
14.5
18682
.334
23.8.208
» 3, 3552 5, 669
2,041758
.344105
180
1,424
273550166
821813
1,599
259
35910225
. 065
. 569
.089
10, 808
224.0
173.5
211.0
245. 0
143.8
39. 0
.256
35.830.7
25.7
287.8150. 6
384.7
21.38.2
144.0
604
295184
.138
1 14. 6
13273
.343
23.5.253
2 3, 9222 5, 704
1, 986772
.345110
206
-947
314540159
836832
1,675
342
3599114
.081
.688
.111
10, 503
211.1
132.3
191.0
248.7
145.4
45.8
.238
41.433.6
41.3
317.2150.7
385.9
15.37.4
6 166. 5
555
17889
.136
14.8
274103
.289
23 4.256
3,4355, 357
1 332520
.34283
186
1,684
j'>404203
595
1.542
145
46513916
.092
.833
.139
7, 155
210.7
132.0
195 7
307.1
125.9
46.2
.238
41.336.5
49.1
312 3149.0
336.1
28.07.6
184.7
641
193101
.137
14.6
236108
.321
14.4.245
1,957790
.33875
219
r 1,158
64451246
807799
1,504
486
419118
8
.077
.803
. 121
9,493
186.7
115. 5
197.2
292. 5
125. 2
40.8
.238
38.735. 9
47.4
309.2127.4
349. 3
•>9. 48.4
165.0
701
256155
. 137
M4.2
206105
.337
16 7. 245
1 888745
.33595
230
550
985161"9
921917
1,273
186
404133
5
. 065
.753
. 108
7,717
211.4
112.0
190.5
258. 2
136. 7
41.7
.238
45.439.5
39.1
330 5157.5
354.6
34 27.0
176. 5
735
363251
. 130
T 13 6
15495
.395
19 3.256
4, 0085, 074
2 167908
.335154
236
465
14623098
960958
1,023
154
383101
3 42
.073
.681
. 099
11.011
214. 5
103.7
183.9
210. 2
148. 6
40.8
.238
39.735.9
33.9
304 5145. 6
333. 6
19 87 0
181.5
833
490361
.134
14.3
13780
.375
19.3.276
2. 486949
.353148
243
275
750424150
968967
1,273
209
3519019
.092
. 675
.114
13,439
258. 1
103. 4
187.5
(4)
161.3
44.1
.238
42.536.5
29.8
350 3167.0
353. 0
14 28 1
159.0
688
426288
.138
14.2
11168
.376
13 8.255
2 1811 026
.380133
249
175
93824194
639637
1,920
1,127
2149
19
.095
. 750
.127
10, 571
228. 8
104.2
177 0
160. 0
147 9
40.8
.238
42.837 7
29. 0
397 3140.1
372. 8
10 07 2
7 197. 1
636
364217
.128
14.7
6755
.372
21 0.261
4,7266,306
2 143982
.380119
244
25
93912456
952950
2,487
352
4239414
.084
.771
.122
8, 851
203. 0
119.3
183 ?
145. 1
163 1
36. 4
.238
38.528 8
35. 6
319 9141.8
386. 2
6 16 5
7 168. 4
552
359215
. 139
14.8
13744
.387
26 7.263
1 977718
.480129
220
130
5951.213
78
(542641
2,579
585
103682
.095
. 7(59
. 125
10, 823
207. 1
114.2
175 6
137.5
181 4
42.7
.238
41.330 2
35.7
363 35 183. 6
387.3
6 5
7 129. 8
459
320188
. 141
14.4
7840
.320
93 9.233
1 970591
. 465120
178
625
305224108
583582
2, 581
785
9211
.082
. 774
. 118
10 6f)7
209. 8
113.4
199 9
124.7
159 4
46.7
.238
46.337 2
36. 4
336 4173.2
421. 5
26 9
110.5
494
273151
.140
16.0
3646
.326
29 4. 236
r 4 366r 6 645
2 4761 006
. 505109
163
1,345
197371•)98
701700
2. 533
571
226891
.073
737. 112
l '> 377
213 0
113 9
''II 4
119. 5
159 8
52.0
.238
41.937 3
37.4
335 3161.8
395. 9
36 9
99.4
541
241123
.135
15.7
8162
.290
16 8.220
2 460843
.500104
156
1,835
120348223
732731
2,341
367
205423
.074
.722
.105
13 982
216 3
116 5
201 0
126.2
150 2
48.6
.238
44.639 2
38.5
366 0173.8
395. 9
3 57 6
95. 5
569
219100
.130
16.0
17186
.276
17 6.227
1 597302
.49089
162
1, 695
66399216
765764
2, 185
407
340127
1
r. 068
. 696
.102
11,552
221.4
122.1
r 207 4
129.0
138 4
50.6
.238
49.642 0
38.7
361 0178.3
331.1
r 29 4r 6 8
r 113. 2
611
r 2 H
'89
.135
15.0
r 201r 1 06
.293
.224
4 2165 016
1 344'399
'. 485
M77
1,370
45723244
919918
1 , 866
396
293
^
. 066
. 66S
. 090
10 409
233 8
131 1
935 i
120.7
134 3
47.2
". 238
45.940 4
37.8
351 3187.1
329. 1
39 66 9
124 0
224101
. 145
14.9
185114
. 326
P 235
" 475
199
1, 380
6282' >4
" 1 , 496
". 062
r Revised. * Preliminary. * Beginning Jan. 1963, includes data for Alaska and Hawaii.2 Quarterly average. 3 Effective Sept. 1963, includes small amounts of refined sugar,
tinctured, colored, or adulterated. 4 Not available. 5 Beginning Jan. 1964, data are notcomparable with those for eailier periods; consumption for feed now based on Tenderers'shipments instead of feed mill reports. e Beginning March 1963, includes General ServicesAdministration stocks no longer required for the strategic stockpile. 7 Includes a sig-nificant amount described as "contaminated."
OCases of 30 dozen. cTBags of 132.276 Ib.Q Includes data not shown separately; see also note "§"
tive revisions for prior periods.A For data on lard, see p. S-28.{Revisions for Jan.-June 1962 appear in the Sept. 1963 SURVEY.
§ Monthly data reflect cumula-
Digitized for FRASER http://fraser.stlouisfed.org/ Federal Reserve Bank of St. Louis

8-30 SURVEY OF CURRENT BUSINESS
-
Unless otherwise stated, statistics through 1962and descriptive notes are shown in the 1963edition of BUSINESS STATISTICS
1962 1963
Monthlyaverage
19G3
June •July Aug. Sept. Oct. Nov. Dec.
1964
-Tan. Fel:. 1 Mar. Apr. Mayi
June July
FOOD AND KTNDRED PRODUCTS; TOBACCO—Continued
FATS, OILS, AND RELATEDPRODUCTS— Continued
Vegetable oils and related products:Coconut oil:
Production:Crude mil. lb-Refined do
Consumption in end products doStocks, crude and refined (factory and ware-
house), end of month -_ -- -_mi l . lb_-Imports do
Cornell:Production:
Crude - - -- doRefined do
Consumption in end products! doStocks, crude and refined (factory and ware-
house) end of month! mll.lb -
Cottonseed cake and meal:Production thous. sh. tons.-Stocks (at oil mills) end of month do
Cottonseed oil:Production:
Crude - - mll. lb -Refined do
Consumption In end products _ doStocks, crude and refined (factory and ware-
house), end of month mil. l b _ _Exports (crude and refined)* doPrice, wholesale (drums; N.Y.) $perlb_.
Linseed oil:Production, crude (raw) _ _ _ _ mil. lb .Consumption In end products . _ _ d o .Stocks, crude and refined (factory and ware-
house), end of month - - _ mi l . lb_Price, wholesale (Minneapolis) $ per lb_ .
Soybean cake and meal:Production thous. sh. tons.-Stocks (at oil mills), end of month 5 _ - d o
Soybean oil:Production:
Crude mil.lb..Refined do
Consumption in end products doStocks, crude and refined (factory and ware-
house), end of month? mil. lb_ .Exports (crude and refined)* doPrice wholesale (refined - N Y ) $ per Ib
TOBACCOLeaf:
Production (crop estimate) mil IbStocks, dealers' and manufacturers' end of quar-
ter total mil IbE xports incl scrap and stems thous IbImports, incl scrap and sterns do
Manufactured:Production (smoking chewing snuff) doConsumption (withdrawals):
Cigarettes (small):Tax-exempt millionsTaxable do ..
Cigars (large), taxable __ . _ . _ do. _ _Manufactured tobacco, taxable thous Ib
Exports, cigarettes millions..
135.844.357. 5
243.422. 1
30.429.326.8
49.1
223.2118.6
161. 5132.4108.8
419.630.9.167
31.831.5
111.8.142
867.886.5
407.4338.9340.7
803. 9101.1.133
< 2.315
5 4, 69339, 07313,951
14,066
3,42241,205
53013, 7702,007
29.046.260.4
227. 431.0
32.530.327.5
58.2
225. 3172.9
158.2131.195. 6
598. 430.4.153
33.332 0
116 7.127
900.1127.3
421.1334 1318.3
3 865. 292.1.133
42.337r* 4, 92942,12413, 985
13, 953
3,42442,466
54713, 7021,968
23.349.962.2
210.920.0
33. 529 024.8
59.8
86.6214. 0
62 980.095.4
561.516.2.154
39.835.5
130.7.127
899.7140. 6
422. 2333. 5307. 8
878.277.7.134
4, 64540,89113. 458
13, 860
3, 26641,562
50913, 0711,929
34. 546 157.0
227.938.7
34.130.123. 3
(53. 1
72.0190.4
51. 252. 383.3
513. 718.0. 160
8.136. 5
99.3.127
878.7115.3
413. 6295. 4302.7
921.282.2. 132
33.21514, 857
12, 576
3. 34742.414
56613.012
1,990
26. 350. 165. 0
215.346.2
34. 826.828.9
61. 6
101. 0156.6
70. 557.488.5
465. 623.7. 150
25.935. 1
92.5.125
901 . 0146.7
426. 9336.1303.9
923. 187.0.124
40, 03314, 233
15, 019
3,86747, 006
60614. 8102,448
31.345.360.7
225. 035.3
31.931. 529. 5
63.1
224. 1159. 8
156.798.992.7
487. 521.5.151
37.432. 6
92.2.123
736.9145.1
345.9340. 0320.5
919.8142.7.133
4,74964, 82711,905
14, 759
3,17342. 399
55514.3821,656
33. 547.167.8
219. 539.4
34.730. 031.6
62.9
346. 3169.8
241.3166.1107. 2
554. 7
.154
41.131.8
103. 9.127
944. 4147.7
442. 1361.5348. 9
(2)99.6.133
76. 54815.802
16, 604
3, 74046, 740
65215. 8382 124
39.444.557.0
209. 37.8
34.632.228. 0
67.4
353. 7195.6
249.4174.298.9
637. 431.0.161
34.928.2
109. 4. 128
918.7165. 1
426.2331. 6317. 3
898. 942. 1.141
59, 29114, 737
13, 017
3, 56141, 272
64812, 8582,047
29.841. 559. 3
195. 90
30.934.2.32.2
64.8
304. 8188.0
212.3171.9101.7
685. 640.8.146
32.126.4
111.8.129
912. 0159. 5
425. 4329. 2316. 1
987. 957.3. 127
5, 24856, 37012, 553
11,947
3,36036, 684
40712,4401,964
30. 041.258. 0
193. 461. 1
32.730.133.3
62.4
326. 5207. 5
231.4158.295.2
739.853.3.143
35. 328.0
124. 4.133
842.0152.4
388. 6351.2336. 6
1,022.470.2.123
36, 90112,438
15, 068
3,34440, 980
59414,8631,843
30.041 658.7
196. 541.6
34.628.634.5
60.5
292.8'Ml. 4
207.4137. 1102 9
803. 748.7.141
33.631.0
132. 0.133
807. 3162. 4
376. 2398. 3330.9
1. 006. 474.7
122
36, 30722, 822
16, 150
3, 23429, 168
62215, 550
1, 702
(-)41 161.9
185. 546.1
37.234.733. 0
60.3
259. 1259.9
185.8146. 7107. 5
801.676.3.145
33. 532. 5
132.9.133
790.7157. 2
368. 9362.7353. 3
991.469.2.122
5, 31023, 52912, 876
16, 937
3, 21637, 854
68216, 2142,107
18 648 466.7
166.034. 8
36.630 031.7
63.9
212. 9295. 7
154. 7151 9103.8
810.238.4.149
31.535.1
131.6.133
819.0139.9
385. 6352. 1344.8
922.3126.0.121
29, 66714, 687
16, 701
3,14443, 686
67016, 0281,862
20. 041.965. 9
158. 227.8
35.997 7
r30. 9
62. 6
165. 1325. 6
119.2137.299.2
769. 254.0.152
39.334.6
137.6.133
855. 2167.6
398.7355. 6
r 342. 3T 873. 3
62 7.123
31,30714,147
14, 647
3, 12641, 714
73114. 231
1 , 890
25.238 057. 7
153. 836. 4
37. 034.333. 0
63.8
116. 7305. 0
86.6117. 2111.9
701.643.1
p . 1 52
40. 836. 4
139.4p. 133
817.7121. 6
380. 0400. 5366. 1
819. 199. 5
p . 121
4 90644,08415,735
2, 046
a 2 16*
LEATHER AND PRODUCTS
HIDES AND SKINSExports:
Value total 9 thous. $Calf and kip skins thous. skins_.Cattle hides thous hides
Imports:Value, total 9 thous. $..
Sheep and lamb skins thous. pieces_.Goat and kid skins do
Prices, wholesale (f.o.b. shipping point):Calfskins, packer, heavv, 9^/15 Ib .-$perlb_.Hides steer, heavv, native, over 53 Ib do
LEATHERProduction:
Calf and whole kip thous. skins..Cattle hide and side kip thous hides and kipsGoat and kid thous skinsSheep and lamb ._ . do
Exports:Glove and garment leather thous. sq. f t _ _Upper and lining leather do
Prices, wholesale:Sole, bends, light, f.o.b. tannery $ per lb_.Upper, chrome calf, B and C grades, f.o.b. tan-
nerv $ per sq. f t_ .
6,909171593
5, 5392,2901,198
p . 623*.152
4981,8771,1842, 527
3,5023,019
v . 711
"1.326
6.215155664
5,2532,1921,231
v . 365p. Ill
4661,8041,1822,864
4,6403,423
p. 678
P 1.151
5, 249139539
4,8871.6081, 127
. 350
.108
4831, 7651,3663,007
4,2362,966
.687
1.173
5.726117622
6, 6923, 7091,275
.350
.113
4241,5881.1412. 367
3. 2722, 573
.687
1.170
6,609147756
4,8091,7231,346
.350
.108
4851,802
8623.234
5,5483,860
.660
1. 140
5,861136661
4,948e 1, 923
1,211
.300
.103
4031,7741,0642,833
4,2522, 955
.657
1.133
7, 124190919
4, 3201.2491,250
.275
.110
5322, 0391.2583,128
5,4934,436
.657
1.097
7, 256206843
3, 905781
1, 000
.300
.110
4531. 7931,1372,906
4, 7633,984
.657
1.103
5, 711203659
4, 2121,3611,150
.325
.090
4711,7981,2122,693
4, 8634,968
.657
1.137
6. 525255787
5, 2237 1, 031
1,360
.325
.083
3861,8441, 3252, 552
5, 2734, 393
. 650
1.143
6, 779233904
7,1223, 2541,113
.325
.078
4141.7901,0472.727
4, 5224, 051
.650
1.137
6, 385245778
8, 4564,3701, 099
.325.083
4841,8351,0592,731
4,9504 486
.647
1.137
7,088213882
8,1113, 3801,323
.400
.113
5251,9931,1712,813
4, 2933, 809
.657
1.133
8 620239
1,072
8, 5193,6151, 650
r .438.098
6011,9891,1323,018
4, 5623 627
. 657
1.138
8 252151987
8, 2422, 7321,134
P431p urn
3,4433 762
p. 657
P 1.138rRevised. p Preliminary. J Average based on reported annual total. 2 Not avail-
able. 3 Average based on months for which data are available. * Crop estimate for theyear. 5 Quarterly average. 6 Effective Sept. 1963, data reflect minor changes in coverageto conform with ''Tariff Schedules of the United States." 7 Effective Jan. 1964, dataexclude items presently reported in Ibs. instead of pieces. ° Aug. 1 estimate of the 1964 crop.
} Revisions for 1962 appear in the Sept. 1963 SURVEY.
*New series. Data prior to Sept. 1962 may be obtained from Bureau of Census reports.§ Monthly averages for 1951-56, published in 1963 edition of BUSINESS STATISTICS,
should read as follows (thous. sh. tons): 1951-56, respectively—95.3; 60.1; 119.1; 1274; 78.7,138.5. Corresponding data in 1961 edition of BUSINESS STATISTICS should read (railIb.): 1951-56, respectively—190.6; 120.3; 238.2; 254.9; 157.3; 276.9.
9 Includes data for items not shown separately.Digitized for FRASER http://fraser.stlouisfed.org/ Federal Reserve Bank of St. Louis

August 1!)(>4 SURVEY OF CURRENT BUSINESS S-31
Unless otherwise stated, statistics through 1962and descriptive notes are shown in the 1963edition of BUSINESS STATISTICS
1962 1963
Monthlyaverage
1963
June July Aug. Sept. Oct. Nov. Dec.
1964
Jan. Feb. Mar. Apr. May June July
LEATHER AND PRODUCTS—Continued
LEATHER MANUFACTURES
Shoes and slippers:Production total t thous pairs
Shoes, sandals, and play shoes, except athleticthous .pairs -
Slippers for housewear do\thletic doOther footwear _ _ do .
Exports ._- - doPrices, wholesale, f.o.b. factory:
Men's and boys' oxfords, dress, elk or sideupper, Goodvear welt 1957-59 = 100.-
Women's oxfords, elk side upper, Goodyearwelt 1957-59 = 100
Women's pumps, low-medium qnalt ty-_.do__-
49,803
42,0330. 003
583584
177
105.6
107. 8111.2
49, 284
42, 1575, 918
502707
170
105.1
106.5110.7
44, 635
37, 9975, 401
558679
145
105. 1
106. 5110.0
44 848
38. 4305. 368
377673
136
105. 1
106.5111.1
55, 670
46, 6867, 526
495963
182
105. 1
106. 5111.3
50. 132
40. 4868,087
4861. 073
190
105.1
106. 5111.1
53 809
42, 7849.212
5001, 313
205
105. 1
106 5111.3
44 671
35. 9927. 357
438884
208
105.1
106 5110.6
45 258
39, 9324, 1 09
412805
132
105.1
106 5110-9
51 556
46. 6893. 882
397588
115
105. 1
106 5111.2
50 033
44, 6344,614
390395
156
105. 1
106 5110.6
52 314
46, 2505, 107
439518
910
105 1
106 5110. 6
49 905
42.2175, 969
443576
174
105. 1
106 5110.8
47 795
40, 3256, 390
354726
194
105. 1
106 5110.9
243
105.1
106 5110.9
LUMBER AND PRODUCTS
LUMBER— ALL TYPES
National Lumber Manufacturers Association:^ OProduction total mil bd ft -
Hardwoods doSoftwoods -- - -- -do
Shipments, total do
Softwoods do
Stocks (CTross) mill, end of month, total _ do ..PTard woods doSoftwoods _- - do
Fxports total sawmill products _ __ do _Imports' total sawmill products do
SOFTWOODSd1©Douglas fir:
Orders new _nill. bd. ft_.Orders unfilled, end of month do
Production - -- doShipments _ _ do _Stocks (gross), mill, end of month do
Exports, total sawmill products doSawed timber __ do _ _Boards, planks, scantlings, etc do
Prices, wholesale:Dimension, construction, dried, 2" x 4", R. L.
$ per M bd. f t_ .Flooring, C and better, F. G., 1" x 4", R. L.
$ per M bd. f t_.Southern pine:
Orders new mil. bd. f t _ _Orders unfilled, end of month .. do
Production.- do _ _ _Shipments __ _ doStocks (gross), mill and concentration yards, end
of month __ _ mil bd ftExports, total sawmill products M bd. ft._
Sawed timber doBoards, planks, scantlings, etc do
Prices, wholesale, (indexes):Boards. No. 2 and better, 1" x 6", R. L.
1957-59=100—Flooring, B and better, F. G., 1" x 4", S. L.
1957-59=100..Western pine1
Orders, new _ mil bd ftOrders, unfilled, end of month do
Production- doShipments _ doStocks (cross), mill, end of month doPrice, wholesale, Ponderosa, boards, No. 3, 1" x
I9" R L (6' and over) $ per M bd ft
HARDWOOD FLOORING
Flooring:Maple, beech, and birch:
Orders, new mil. bd. ft..Orders, unfilled, end of month doProduction _doShipments doStocks (gross), mill, end of month do
Oak:Orders, new__. doOrders, unfilled, end of month. ._ _doProduction doShipments doStocks (gross), mill, end of month do
2, 764530
2,234
2,777525
2, 252
6,3461, 5294,817
63408
680496
665673991
261017
78.65
122. 52
478255
478475
1, 3666,3251,5714, 754
93.1
94.6
800416
789797
1,679
67.43
3.110.52.72 97.9
65.742.865.065.975.2
2,882581
2,301
2, 866564
2, 303
6,5041,8424, 662
73i 445
679538
671676969
311219
79.92
134. 22
491280
484488
1,3806, 414
8325, 583
92.5
95.2
849383
841839
1, 657
67.42
2.910.82.82 76.5
68.345.269.369.143.6
2,835619
2, 216
2. 923564
2, 359
6, 4191 8304, 589
60516
664554
595651974
228
14
80.84
131.74
496312
478493
1.3955, 334
5344,800
92.9
95.3
910417
835894
1, 577
69 06
3.511.42.53 46.2
68 449.670 074.540.2
2,743554
2,189
2.939520
2,419
6, 2431 8664.377
77616
609521
542643882
309
21
86. 00
136.04
541305
511548
1,3585, 926
9874, 939
93.9
95.5
942435
866924
1,519
70 79
2.810.52.73 45.5
7'? 948.172 274.438.0
3, 145588
2. 557
3, 100567
2, 533
6,3121 8874, 425
76576
618450
692689894
311121
85. 90
138. 45
523279
518549
1.3277,174
6756, 499
94.3
95. 7
89'?356
1 006971
1,554
72 16
3.110.23.33 35.4
75 547.575 376.137.2
3 115609
2, 506
2, 90356?
2. 341
6,4541 9144, 540
771 457
719491
700677925
261016
79. 86
136. 72
486269
503496
1,3344.681
3974, 284
94.0
96.0
866347
977875
1, 656
70 56
2.010.02.82 45.8
64 944.969 468. 638.7
3 244617
2,627
3, 054599
2, 462
6 4931 9644, 529
84469
800520
745772878
341520
77.96
137. 67
562279
545552
1 3277 676
8336, 843
92.8
95. 6
1 002384
992837
1.683
65 96
3.210. 63.39 (}
6.6
72 840.479 977.539. 7
2 798600
2 198
2, 707579
2, 128
6 5551 9874 568
89
381
649598
666641923
371423
77.73
139. 77
483964
484498
1 3138 2101 9256,985
93 0
95.6
730352
779
769
1,693
fi4. R9
2.110.42.52 46.6
55 134.768 364.741.2
2 559\501
2 058
2, 579516
2, 063
6 5411 9714 570
84364
665535
638659903
371819
77. 96
141.38
379956
411387
1 3377 9551 3006, 655
92 8
95.6
7CQ
347
7AQ
1,678
i'O K(1
2.210.52.61 Q
7.1
51 036.962 856.446.6
9 701'501
2 200
2. 686514
2,172
6 5941 9574 637
70'281
842671
761706984
281117
78.20
142. 46
447959
475444
1 3686 603
7475, 856
92.7
95. 6
891503
689
7351, 625
63 07
2.610.8
2.69 27.6
75 744.779 764.455. 0
9 817524
2 293
2, 945548
2, 397
6 4721 9304 542
68<391
738721
708688
1 004
271215
81.43
150.02
466270
476455
1 3896 391
9025, 489
92 8
95.4
937501
806QOQ
1,492
63 67
2.811.62.2
7.9
84 263. 665 265. 255.0
3 054493
2 561
3,082547
2. 535
6 4611 8714 590
97455
694637
771778997
381424
* 82. 01
152.42
528289
520509
1 40010 P431 Oil9, 632
92 6
95. 4
876496
930001
1, 541
66 45
3.012.42.3
7.8
74 768. 671 273.252. 5
2 99948?
2,517
3,129537
2, 592
6 3861 8104. 576
72475
731594
798773
1,056
271017
83. 10
151.90
557306
534540
1 3948 694' 788
7. 906
92. 7
95.4
894484
851906
1,485
68 05
3.112.53.0
7.9
09 462. 373 9
72. 353. 4
2 953? 465
2 488
3, 041594
6 3101 7474 563
90445
705558
756741
1 048
411823
r 82. 99
' 153. 45
536294
517548
1 36310 050
8479, 203
93 2
95. 4
007437
OCM
1,494
r AO Q9
2.812.52.7
7.9
54.1
68. 154.4
3 041539
9 502
3, 121535
2, 586
6 2961 759
4 474
77576
735520
770773
1 045
299Q
9
*82. 01
P153.45
550984
595560
1 3289 6921 5218,171
92.7
95.1
914458
875OQO
1,476
3.112 22! 9
7.3
48. 5
70.453.1 - - - - - - - -
' Revised. v Preliminary. c Corrected. l Beginning Sept. 1963, data excludesmall amounts formerly included.
tRe visions by months for 1961-Sept. 1962 are shown in Bu. of Census report M31A(62)-13.
^Revisions by months for 19nl-Oct. 1962 for production, shipments, and orders will beshown later; those for 1951-62 for stocks appear on p. 28 of the Jan. 1964 SURVEY/ O Be-ginning Jan. 1961, data for Alaska included in pertinent items.
Digitized for FRASER http://fraser.stlouisfed.org/ Federal Reserve Bank of St. Louis

S-32 SUKVEY OF CURRENT BUSINESS August I IM'4
Unless otherwise stuted statistics through 1962and descriptive notes are shown in the 1963edition of BUSINESS STATISTICS
19R2 | 19153
Monthlyaverage Juno July A up;.
1903
Sept. Oct. Nov. Dec. Jan. Feb. Mar.
19 i i
Apr. May June Ju ly
METALS AND MANUFACTURES
IRON AND STEELI
Exports: !Steel mill products thous. sh. tons..Scrap doPig iron* do.
Imports:Steel mill products If doScrap t (^°Pig: iron* do —
Iron and Steel ScrapProduction and receipts, total thous. sh. tons..
Purchased scrap received (net) doConsumption, total doStocks, consumers', end of mo. _. __ do iPrices, steel scrap, No. 1 heavy melting:
ComDosite (5 markets) $ per Ig tonPittsburgh district do
Ore
Iron ore (operations in all U.S. districts):MMne production thous Ig tonsShipments from mines doImports doU.S. and foreign ores and ore agglomerates:
Receipts at iron and steel plants . doConsumption at iron and steel plants. .doExports, _ _ _ _- do
At mines doAt furnace vards doAt U S docks do
Manganese (mn. content), general imports^__do
Pig Iron and Iron ProductsPio-iron:
Production (excl. blast furnace production of fer-roalloys) „ thous. sh. tons..
Consumption doStocks (consumers' and suppliers'), end of mo.
thous. sh. tons..Prices:
Composite $ per Ig. ton_.Basic ('furnace) -doFoundry, No. 2, Northern do
Castings, gray iron:Orders, unfilled, for sale, end of mo.
thous. sh. tons..
For sale doCastings, malleable iron:
Orders, unfilled, for sale, end of mo.thous. sh. tons..
Eor 9^10 do
Steel, Crude, Semifinished, and FinishedBteel ingots and steel for castings:
Production thous. sh. tonsIndex 1957-59=100.-
Steel castings:Orders, unfilled, for sale, end of mo.
thous. sh. tons..Shipments, total do
Steel forging's (for sale) :Orders unfilled end of mo doi nip ^, ,
Steel products, net shipments :Total Call grades) _ _ d o _ _ .
Structural shapes (heavy), steel piling doPlates. doRails and accessories do
Bars and tool steel, total doBars" TTot rolled (incl light shapes) do
Reinforcing doCold finished do
Pipe and tubing do"Wire and wire products doTin mill products doSheets and strip (incl. electrical), total do
Sheets* Hot rolled . . d oCold rolled do
Steel mill products, inventories, end of mo.:fConsumers (manufacturers only)._mil. sh. tons...
Receipts during month doConsumption during month do
"Warehouses (service centers) doProducing mills:
In process (ingots semifinished etc ) doFinished (sheets, plates, bars, pipe, etc.) .do
Steel (carbon), finished, composite price_..$ per lb_.r Revised. v Preliminary. 1 Less than 500 to*Ne\v series. Monthly data back to 1953 are aval% Beginning Sept. 1963, imports statistics reflec
these data may not be strictly comparable with fi£
168 i42613
34299
42
5, 4943. 3872,1075,5138 814
28.1229.00
6, 0505. 8592, 786
8, 1218,041
49175, 73714. 65755, 2895, 787
79
5, 4775, 550
3,178
65. 4065. 5066.00
680963527
737242
8, 194101.2
18311993
30811386
5, 87923139552286
916597199112592259505
2,373646
1,126
10.34.44.43.4
7.26.9
. 0698
ns.lable.t adopt i(rures she
182530
6
4541955
6. 1083, 7152, 4536, 2187 977
26. 7827.00
6, 0636,1572, 791
8, 4588. 669
568r 74, 17615, 428' 53, 376
5, 372
84
5, 9936, 057
2,814
62. 8763.0063. 50
7831 . 064
591
817844
9, 105112.5
219125100
30611688
6. 296263443603
92
972631224110587262488
2,587735
1 , 209
10.04.84.73.4
7.47.1
.0705
)n of thewn for i
169589
46728 |94 1
6, 8584. 1682. 6906. 8677.731
26. 2025. 00
9,01910 5883. 725
13, 19910.028
94968, 95219, 00245,0164, 934
105
6, 9406. 990
2, C69
62.9563. 0063. 50
8191.146
646
7844
10,365129.8
201131105
29711887
7, 375316479652111
1,136743256129724302560
3. 094891
1,455
11. 25.94.93.4
7.57.4
. 0704
U.S. Tarior mor
195698
3
5991942
5.958 !3. 7322, 2275, 6818,011
25. 6925. 00
8. 93310. 704
4, 071
13, 0708. 7581,258
71, 53617,22649, 329
4, 981
70
5, 9895, 909
2,782
62. 9563. 0063. 50
8061, 003
578
826837
8, 654104.9
217105
86
3069674
6, 46023745163684
966584279
97699255533
2, 599708
1,213
11.94.94.23.4
7.37.2
.0704
in' Scheths.
178748
9
5471461
5, 5113. 4042. 1075 ,4258.097
26. 5625. 00
8. 86510, 5874.220
13.3757. 5481. 095
r 75, 69915 505
'55,1555. 039
108
5. 2785.' 270
2. 804
62. 7563. 0063. 50
805985608
826840
7 78''94.3
21611995
310105
78
5. 89520645657991
91053626997
631250541
2, 232582995
11.64.14.43.5
7.26.8
.0704
Jules;
i
162640
1
4711389
5, 4943. 3632. 1315 , 5738, 013
26. 8926. 00
8. 5739.7183. 369
12. 5357. 516
711r 79. 63814. 359' 60, 174
5. 105
135
5, 1745 ^'M
2.811
62. 7563. 0063. 50
8051.037
598
??42
7. 85898.4
21912197
29811591
5. 45521241758790
848490260
90569244405
2. 084571898
10.94.04.73.5
1 7.46.8
I . 0704
tEfre oakCensiRe vis
212552
8
54915
111
6. 1863. 6702,5166. 1978,002
26. 00
7.3189.1414, 064
12.3868.010
71581,1941 1 , 39164. 550
5, 253
67
5, 5255, 603
2, 813
62. 7563. 0063. 50
7581,194
673
788750
8, 483102.8
225135107
30612395
5. 927266464614
70
948580258103605263404
2.293655
1,019
10.04.55.43.5
7.36.7
.0714
Fective wulated ofis of Maions bac
207428
5
5161680
5, 8983, 5132, 3855, 9717, 962
27.02''5. 00
3. 8765. 9972.980
8, 9328. 033
4'}880, 030
9, 23765. 450
5. 343
88
5, 5655, 587
2, 827
62. 7563.0063. 50
6921,049
575
807842
8,488106. 3
255126101
31111184
5,617285498608
74
90958422097
468221352
2,272672
1,044
9.54.34.83.5
7.46.9
.0715
ith the Otimatesmfactun< to Oct.
230564
6
4022951
5, 8733, 5352, 3375, 9447 937
27. 2426. 00
3,5431, 8461.940
4,0528,458
34177, 32510, 93461,0445,347
46
5,8975, 949
2, 806
62. 7563.0063. 50
7191, 014
534
887942
8.753106. 1
9()9133107
31211488
5,54025242058892
85357916799
442192323
2.378685
1,149
9.34.64.83.5
7.87.2
.0715
ct. 1963 £based ons); previ1961 apr
226580
4
4819729
212557 :
3
4282636
28.9429. 00
4,0671 , 4061,693
2, 7109,113
25573, 14113,22454, 644
5, 273
71
6, 291
62.7563. 0063. 50
8061.068
546
918449
9. 515115.3
312145117
320139111
6,475281422614109
977080169120504221563
2, 786833
1, 316
9.45.25.13.4
7.87 9
. 071 5
URVEV,the. use
ousiy pueai in t h
28. 6329.00
4.0881.4461.667
3, 2258.867
21169, 93615, 86649, 002
5, 068
54
6,199
62. 7563.0063. 50
7591.095
564
918344
9.474122.8
333141114
32212193
6, 239311405613120
916621172114545226494
2, 608
1,211
9.44.84.83.5
8.0; 7.3: . 0715
data for sof quantblisherl (e Oct. 1<
235744
0)
4742321
28. 8531.00
4,1671,5982.017
3, 4919. 764
19565,81618, 38042, 7294.707
62
6,910
62. 7563. 0063. 50
8161.229
687
948848
10,485127. 1
345157129
^328138107
7. 124394468679141
1,095702262123665276545
2, 860878
1,320
9.45.35.33.4
8.07.6
.0715
teel consii;y coveilata wei63 S'-RV
218 256 !708 i 770
14 34
495 "4416 1729 i }8
30. 3632.00
5, 7314, 1502, 403
7, 3239,801
34764,48619,94740, 250
4,289
105
6,973
62. 7563.0063. 50
8371.264
699
939352
10, 549132. 1
331162132
334137107
7, 359333509737143
1,140722283126759299556
2,884843
1, 327
9.35.35.43.6
7.97.6
. 0715
umers (n•age factce basedEY.
' 30. 6233. 50
8, 9187, 8673, 451
13,43210,558
62168, 16420 99943, 124
4,041
53
7. 435
62. 7563.0063. 50
8591 . 227
678
929554
11,048133.9
324154126
331131101
7. 271344543699129
1, 145734281122721299553
2, 838834
1,311
9.2
:Hr 3 .6
'8.47.6
. 0715
lanufact>rs (demon cost
300679 !39
6043199
"31.90p 34. 50
j "^59
14.02910,019
719
47, 1344,012
110
7,076
62. 75P 63. 00p 63. 50
10,173127.4
7, 065385503679
1,113686295124752297544
2, 663750
1, 208
p 9.1P 5.2p 5. 3p 3.6
p 8.4p 7.7
1 . 0715
urers onl"ed fromcoverage
62. 75
p 10, 100P 122.4
""'0715"
y) reflectthe 195Sfactors .
Digitized for FRASER http://fraser.stlouisfed.org/ Federal Reserve Bank of St. Louis
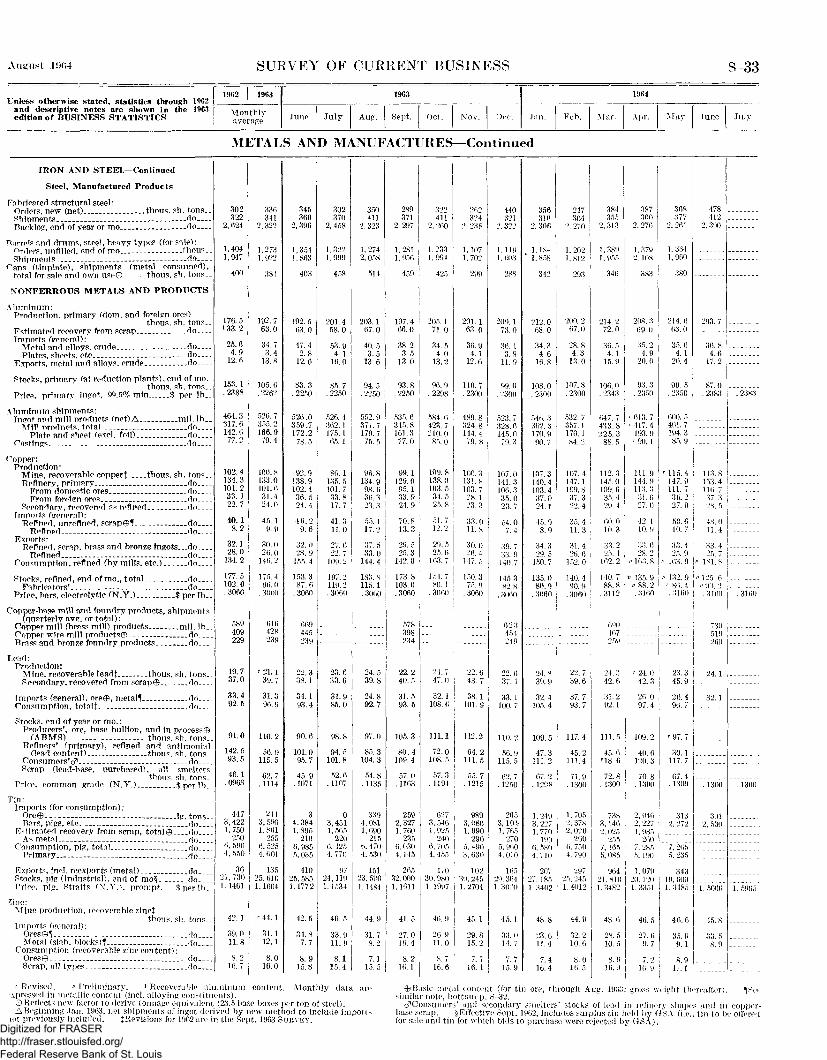
August 11)04 SUEVEY OF CURRENT BUSINESS S 33
Unless otherwise stated, statistics through 1962and descriptive notes are shown in the 1963edition of BUSINESS STATISTICS
1962 | 1963
Monthlyaverage
1963
June July Aug. Sept. Oct. Nov. Dec.
1964
Jan . Feb. Mar. Apr. May June July
METALS AND MANUFACTURES—Continued
IRON AND STEEL— Continued
Steel, Manufactured Products
Fabricated structural steel:Orders new (net) thous. sb. tons..Shipments _- - ..do __Backlog, end of year or mo do
Barrels and drums, steel, heavy types (for sale):Orders, unfilled, end of mo thous..
Cans (tinplate), shipments (metal consumed),total for sale and own useO thous. sh. tons..
NONFERROUS METALS AND PRODUCTS
Aluminum:Production, primary (dom. and foreign ores)
thous. sh. tons__
Imports (general):M^tal and alloys crude doPlates, sheets, etc do
Exports, metal and alloys, crude do
Stocks, primary (at reduction plants), end of mo.thous. sh. tons..
Price, primary ingot, 09.5% min $ per lb__
Aluminum shipments:Tngot and mill products (net) A mil Ib
AT1 11 products total doPlate and sheet fexel foil) do
Castings do
Copper:Production:
Mine, recoverable copperf thous. sh. tons__Refinerv, primarv do
From domestic ores doFrom foreign ores do
Secondary, recovered as refined doImports (general):
Refined, unrefined, scrap©! doRefined - - do
Exports:Refined, scrap, brass and bronze ingots.. _do
Refined _ _ _ floConsumption, refined (by mills, etc.) do
Stocks refined, end of mo., total doFabricators' do
Price, bars, electrolytic (N.Y.) $ per lb_.
Copper-base mill and foundry products, shipments(quarterly avg. or total):
Copper mill (brass mill) products.. mil. l b _ _
Brass and bronze foundry products do
Lead:Production:
Mine, recoverable leadt thous. sh. tons..Secondary, recovered from scrap© do
Imports (general), ore®, metalf doConsumption total} - do
Stocks, end of year or mo.:Producers', ore, base bullion, and in process©
(ABMS) thous sh tonsRefiners' (primary), refined and antimonial
(lead content) thous. sh. tons_.Consumers'c?1 doScrap (lead-base, purchased), all smelters
thous. sh. tons..Price, common grade (N.Y.) $ per Ib
Tin:Imports (for consumption):
Ore© __ lg tonsBars, pigs, etc. do
Estimated recovery from scrap, total© doAs metal.. _ do
Consumption, pig, total doPrimary _ _ _ _ _ _ d o
Exports, incl. reexports (rnetaD, _ _ d oStocks, pig (Industrial), end of mo§ doPrice, pig, Straits (N.Y.). prompt $ per UK
ftnc:Mine production, recoverable zinct
thous. sh. tonsImports (general):
Ores©! doMetal (slab, blocks)! do
Consumption (recoverable zinc content):Qf-pt;0 (-|Q
Scrap, all tvpes _ do-__
302322
2, 624
1,4041,947
400
176.5i 33. 2
25.64.9
12.6
153.1. 2388
464. 3317.6142.677.2
102.4134.3101.233. 122.7
40.18.2
32.128.0
134. 2
177.5102.0. 3060
589409229
19.737.0
33.492.5
91.0
142.593.5
46.1.0963
4473,4221, 750
2506, 5904, 550
3621,7301. 1461
42. 1
39.011.8
8.216.7
336341
2,322
1.2731.922
381
192. 763.0
34.73.4
13.8
105.6. 2262
526. 7355. 2166.9
79.4
100. 8133. 0101.631.424.0
45. 19.9
30. 026.0
146.2
1 75. 496. 0
. 3060
616428239
'21.139.7
31.396.9
110.2
56. 9115.5
62.7. 1114
2113. 5961,861
6, 5254.601
13525,6101. 1664
'44.1
31.112.1
8.016.0
345360
2, 396
1,3541,863
403
192. 563. 0
47.42.8
12.6
83.3. 2250
526 .0359 .7172.2
78.5
92.9138.9102.436.524.4
4 6 . 29.6
32. 028.9
155.4
153.387.6
. 3060
669445239
22. 338.1
34.193. 4
90.6
101.095.7
45.9.1071
34,3841,895
2106, 9855, 035
41025, 5851.1772
42.5
34.87.7
8.915.8
302370
2, 458
1.3221 . 999
458
201.458.0
53. 94.1
16.0
85.7. 2250
526. 4362. 11 75. 165. 1
86.1135. 5101. 733.817. 7
41.311.0
27. 6
109! 2
197. 2119.2.3060
23.633.6
31.985.0
98.8
94.5101.8
52. 6.1107
03, 4511, 565
2206. 4254, 770
9724,1101.1534
40.5
33.911. 9
8.115.4
350411
2. 323
1,2742, 058
514
203.167. 0
40. 53.5
13.6
94.5. 2250
552. 9377.7179. 775. 5
96. 8134. 998.636. 323. 3
55. 117. 2
37. 533. 0
144.4
183. 8115. 1. 3060
24.539.8
24.892.7
97.0
85.3104. 3
54.8.1135
3394.0811,690
2156, 4704. 530
15123, 5901.1484
44.9
31.78.2
15.' 5
289371
2, 297
1,2811,956
459
197. 466.0
38.23.5
13.0
93.8. 2250
535. 6345. 8161.377.0
99. 1129.095.133.924. 9
70.813.3
29. 525.3
142.0
173.8103.0. 3060
578398234
22.240. 5
31.593. 5
105.3
80. 4109.4
57. 0. 1163
2592, 3271. 760
2356. 0304,145
26532, 0001.1011
41.5
27.019.4
8.21(5.1
32f>411
2, 260
1.2331.994
425
205. 171.0
34.54.0
13.2
96 9.2298
584. 6423. 7210.0
85. 0
109. 8138. 0103. 534. 525.8
51 . 712.2
29. 525.6
163.7
15-1.780. 1
. 3060
262324
2, 238
1,1071,702
299
201. 163.0
36.94.1
12.6
110. 7. 2300
489. 8324. 8144.4
79. 8
100. 3131. x103.728.123. 3
33.011.8
30. 026. 4
1 17. 5
150.375.9
. 3060
24. 747. 0
32.1108. 6
111.1
72.0108. 5
57.3. 1194
6973, 5461,925
2406, 7054, 455
17030, 9801. 1997
46. 9
26.911.0
22.643.7
38. 1101. 9
112.2
64.2111.5
55. 7. 1215
9893, 0801, 990
2905. 4903, 630
10230, 2451. 2704
45.1
29.815.2
440321
2, 322
1 .1191 . 003
288
209. 173.0
36. 13.9
11.9
99. 0. 2300
523. 7328. 0145. 0
79. 3
107. 0141.3106. 335.023.7
54.07.4
39. 733. 9
140.7
145.382.8
. 3060
fi'>3454249
22 637.4
33.1100.7
110.2
56. 9115. 5
62. 7. 1250
2653,1011, 765
2705, 9004.0H)
16529. 3041.3020
45. 1
33. 014. 7
16'. 6 16.1 15' 9
356310
2, 306
1, 1S4' 1,858
342
212.008.0
34.34.6
16.8
108.0. 2300
540. 336?. 3170.990.7
107.3140.4103.437.024.1
45.98.9
34.329. 5
150. 7
135.080.9
. 3060
24.839.9
32.4105.4
109.5
47.3111.2
67. 2. 1298
1.2493, 2271.770
1906, 5804,710
20727, 1851. 3402
48.8
23.611.4
16.4
247304
2. 270
1, 2021,812
293
200. 267.0
28.84.3
13.0
107. 8.2300
532. 7357.1170.184.2
107. 4147.1109. 837.322. 4
35. 411.3
31.420. 6
152. 0
140. 490. 9
. 3060
384355
2, 31 3
1, 3891, 955
340
214.272.0
30.54.1
15.9
too. o. 2343
047. 7433.8
387360
2, 270
1, 3792. 108
383
208. 369. 0
35. 24.9
20.0
93. 3. 2350
r 613. 7--417.4
225.3 i 193.988. 5
112.3145. 0109 635. 429.4
00.010.3
33.225. 4
102.2
140.788.8
.3112
( ) < ) ( )407959
22. 739^6
37.793. 7
117.4
45.2111.4
71.9. 1300
1. 7052. 3782,020
2600. 7504. 790
29725. 2451.4012
44.9
39 9
10.0
8.010.5
24.342. 6
31.292.1
111.5
45. 6118. 6
72.8. 1300
7383,1462. 025
•'557, 1655, 085
96421.8101. 3482
48. 6
28.510. 5
8.910. 9
T 90. 1
111.9144.9113.331.6?7 0
42. 110. 9
33. 028.2
p 163. 8
P 135. 9v 88. 2.3100
r 24. 042.3
26. 097.4
109. 2
40.6120. 3
70.8. 1300
2, 0402 2271/J85
2007. 2855. 190
1 , 07920. 1201.3351
46.5
27.69.7
7. 210. 9
308377
2. 201
1 , 3341 900
380
214. 663.0
35. 64.1
20.4
99.5. 2350
600. 5401. 7194. 385.9
r 115.41 47. 9111. 736. 227.0
50. 610. 7
33.425. 9
p 163. 9
p 132. 9r 86. 4.3160
23. 345.9
26.496.7
r 97. 7
30. 1117.7
67.4.1300
313
7, 2655. 235
34319, 6001. 3485
46.6
35.99.1
17.1
478412
2, 300
203. 7
36.84.6
17.2
87.0. 2383
113.8153. 4116.737.328. 5
48.011.4
33.4
" 181.8
' 125. 0'' 9 ). 2.3160
7305199f5()
24.1
32.1
. 1300
3012, 530
1. 5060
45.8
33. 58.9
. 23X3
.3160
. 1300
T5965~
r Revised. » Preliminary. l Recoverable aluminum content. Monthly data arc•xpressed in metallic content (incl. alloying constituents).
Q Reflects new factor to derive tonnage equivalent (23.5 base boxes per ton of steel).A Beginning Jan. 1963, net shipments of ingot derived by new method to include imports
lot previously included. {Revisions for 1962 are in the Sept. 1963 SURVEY.
©Basic metal content (for tin ore, through Aug. 1963; gross weight thereafter). fJScesimilar note, bottom p. 8-32.
cfConsumors' and secondary smelters' stocks of lead in refinery shapes and in copper-base scrap. §EfTectivc Sept. 1962, includes surplus tin held by GSA (i.e., tin to be offeredfor sale and tin for which bids to purchase were rejected by GSA).
Digitized for FRASER http://fraser.stlouisfed.org/ Federal Reserve Bank of St. Louis

S-34 SURVEY OF CURRENT BUSINESS August 10CH
Unless otherwise stated, statistics through 1962and descriptive notes are shown in the 1963edition of BUSINESS STATISTICS
1962 | 1963
Monthlyaverage
1963
June July Aug. Sept. Oct. Nov. Dec.
1964
Jan. Feb. Mar. Apr. May June July
METALS AND MANUFACTURES— ContinuedNONFERROUS METALS AND PROD.— Con.Zinc— Continued
Slab zinc:Production (primary smelter), from domestic
and foreign ores thous sh tons^econuar ir i / » rjo
Exports doStocks, end of year or mo. :
Producers' at smelter (AZI^A do
Price, prime Western (St. Louis) $perlb._
HEATING EQUIPMENT, EXC. ELECTRIC
Radiators and con vectors, shipments:Cast iron mil sq ft radiation. _
Oil burners:shipments thous _
Stoves and ranges, domestic cooking:Shipments total (excl liquid-fuel types) __do
Gas^ _ __do
Stoves domestic heating shipments, total doGas do
Warm-air furnaces (forced-air and gravity air-flow),shipmentss total thous.
G^s do
MACHINERY AND APPARATUS
Fans, blowers, and unit heaters, qtrly. totals:TT ti -u 1 I ' lOvNiTh, r e . -
Foundry equipment (new) , new orders, netmo. avg. shipments, 1957-59 =100__
Furnaces (industrial) and ovens, etc., new orders
~Fl t ' ~ doFuel-fired fexc for hot rolling steel) do
Material handling equipment (industrial) :Orders (new) index seas adj 1957-59=100. .
Industrial trucks (electric), shipments:PTnrid (motori/ed) number
Industrial trucks and tractors (gasoline-powered),shipments number
Machine tools:Metal cutting tools:
Orders, new (net), total mil. $..Domestic do
Shipments total do
Estimated backlog- __months__
Metal forming tools:Orders new (net) total mil $
Shipments total do
Estimated backlog- _ . _ _ _ - _ _ _ months..
Other machinery and equip., qtrly. shipments:Construction machinery (selected tvpes),
total 9 _'__mil. $..Tractors, tracklaving, total do
Tractor shovel loaders (integral units only),
Tractors, wheel (excl. garden and contractors'
Farm machines and equipment (selected types),
ELECTRICAL EQUIPMENT
Household electrical appliances:
Refrigerators and home freezers, output1957 59 ~ 100
Vacuum cleaners sales billed thousWashers, sales (dom and export) doDriers (gas and electric), sales (domestic and
export) _ _ _ t h o u s _ .
Radio sets, production § doTelevision sets (incl. combination), prod.§_._doElectron tubes and semiconductors, factorv sales ©
' mil. $._Insulating materials, sales, Index 1947-49—100Motors and generators:
New orders index qtrly doNew orders'(gross) :
Polyphase induction motors, 1-200 hp mil $B.C. motors and generators, 1-200 hp do
73.34.9
86.03.0
144.780.0
.1162
1.0
39.849.9
166. 7163. 6
157. 094.1
108.987.1
217.7
M0.2U6.2
111.4
7.01.22.8
112.6
500471
2,232
44.8036.7047.8535.15
4.2
14.6011.6512.409.304.6
1 261. 4i 64.2i 19.7
158.9
1 130. 1
1 197. 7
2 540
139.6
119. 2309.3305.5
116. 4
1, 596. 8539. 3
75.9154
i 149
12.42.2
74.94.5
90.12.8
55. 192. 1
.1200
1 0q 9
48 842 2
1 76. 0173.1
161. 9101.5
117.895. 3
200 3
*41 0i 15 7
131. 9
8.21.13.4
128. 7
547581
2, 434
59. 5047. 5049. 9041. 10
5.2
18.1015. 9015. 3012.80
4.7
1 305. 9!78. 51 22 9
i 73 5
1150 9
1213.7
2, 653
155. 8
127. 9353. 9329. 1
133.0
1, 523. 5594.2
73.6148
i 151
12 A2.6
i
69. 64.4
91.14.4
105 .969.5.1150
.99 0
48.765 8
177.3173.9
158. 4103.4
113. 191.4
231. 2
43.716.7
135.1
7 91.51.4
98.2
550589
2, 750
57.1044.4053.5546.50
5.2
14.8013.1518.8517.45
3.9
378. 998.131 6
86 3
166 1
262. 6
1 903
160 8
145 1291.2358.6
91.0
31,653.93665.0
76.8153
155
13.33.0
69.04. 1
85.44.9
80.086.4
. 1202
9 1
41.965 1
155. 3152.6
180.8110 0
116. 494.6
183 5
127.6
5.31.01.6
140.8
579533
2, 307
57.9047.9044. 5538. 65
5.5
15.5513.9014.9512. 70
3.8
2 iqo
140 2
133 8297.1281.2
99.5
990 6384.3
59.5127
11.11.9
72.64.6
92.54.1
64.688.1
. 1250
1.011 6
58 563.8
185. 0181.3
254. 2171.4
140.2110.4184.9
160. 4
9.21.05.7
150.2
433511
2, 567
49. 2038. 5541.2033. 30
5.6
19.8518.1512. 6511.40
4.2
2. 604
156. 4
93 1326. 1379.7
173. 5
1, 252. 9565. 2
77.4142
12.83.3
72.55.4
90.62.0
55.490. 1
. 1250
1.412 4
75 751 8
198.9194. 9
239. 1146. 3
168. 8130.6179. 7
39. 914 6
122.3
9.6.7
2.7
128.1
563490
2. 661
56. 5545.4054. 7542. 85
5.4
22. 3517.6014.7012.10
4.6
309.280.227. 2
71 8
100 6
199. 7
3 186
165 8
149 0423. 0403. 7
200. 3
-2008. 2:i 779. 4
82.5154
154
13.72.9
78.16.0
99.32.4
53.988. 1
. 1250
1 413 9
72.449 5
207. 3902. 5
m 2170.4
170.4134. 5228 1
184.8
7.6.9
•1.6
135.7
602611
2,941
66. 8553. 35
42. 955 . 7
32. 3529. 951 6. 3513.00
5.4
3 673
167 9
127 8416.4367. 4
197. 1
1872. 7630.1
81. 5160
12.72 .5
79.35. 3
88. 51.9
50.287.0
. 1250
1.19 8
55. 943.9
173. 7170. 7
183. 6132. 0
132.4106. 5176.8
127.1
8.59
4.3
136.6
523598
2,738
59. 1049. 6552. 3541. 75
5.6
15. 9515. 2014. 0511. 30
5.6
3 174
159.4
129 0382.6336. 9
180. 3
1, 799. 8621. 4
71.7144
12.12.1
83.84.8
88. 51. 3
55. 192. 1
.1294
1.08 0
32. 842.2
162.2160.2
120.581.6
97.681.6
191.2
42. 018 2
129.6
6.11.03.0
156.2
590630
2,830
77.4064.1569.0056. 30
5.6
21. 2019. 8014. 3012.50
5.8
284.778.618.3
73 6
159 0
150.9
3 622
174 4
128 6349.7273. 5
153. 2
41,772.04690.0
73. 0151
154
13.32.3
76.04.8
91.7.4
48.292.1
. 1 300
.98.1
42.344.1
158. 1156. 0
91.054.3
95.879.2
248.3
235. 8
5.8.8
2.4
146.5
491484
2,543
80.1560. 6050. 3539. 85
6.2
48.8047.4015.0012. 40
7.6
3 146
144 4
131 3324. 7302. 5
142.8
1, 413. 3731.1
52.1154
12.42.6
76.84.9
86.92.4
43.692.5
. 1 300
.98.2
41.744.2
167. 7165. 7
70.838.7
95.979.4
237.1
251.8
9.71.05.7
153. 3
515609
2,518
74.5060.4551. 2539.10
6.3
20. 3018. 8519. 1516. 15
7. 7
1 653
165 8
150 3365.0330.0
135.8
1,367.9751.5
52.6146
13.53.4
86.05.2
95.21.7
46.093. 9
. 1300
1.17. 4
40.247.9
200.0197.4
112.977.5
99.382.9
244.9
43 213 1
272. 9
10.51.36.8
170.8
548578
2.862
77.7061.4063.8048.45
6.4
24.1019 3516.9015. 40
8.0
343. 679.627 3
86 2
189 1
] 394
194 1
150 8490 5372 0
121.1
31 f]39 i3 877. 9
56.9167
159
14.92.8
83.74.7
100.02.6
43.5'89.4. 1332
.87.0
36.649.8
195.4193.5
89.653.4
99.784.3
242.6
7.41.23.8
158.1
581510
3,032
91. 5579. 5564. 8552. 35
6.7
45.8043.3019.8018.25
8.9
237.8
2 72.9
1 602
157 4
151 5383.8299. 2
90.2
1,337.4712.7
52.4163
14.42.8
84.85 3
98 33.6
38.085.9
. 1 350
8 1
38 554 5
173.1171 1
105. 766 0
96.180 4
198 9
244.1
7.41.03.7
127.4
581523
2, 961
r 85. 00-70.10" 70. 75r 57. 50
r 6 . 6
r 32. 55* 30. 35M8.20M6.50
^ 9 . 3
2 40. 4
2 59 5
r \ 591
153 4
150 9337 8300 8
71.6
1 410 7584.2
51.4
15 23.6
2.7
30.4 j
.1400
_ _ .
221.4
1.23.2
653636
3,109
101.0583. 8574. 3562. 65
6.6
59. 9055. 7021.25
, 19. 9510.6
1 816
163 7
163 0335 2345 8
90.531 770 93 835. 5
53.9
25 7
.135(1
» 1078.1p 520. 9
r Revised. i Quarterly average. 2 For month shown. 3 Data cover 5 weeks;other months, 4 weeks. 4 Data cover 6 weeks. 9 Includes data not shown separately.
AProducers' stocks, elsewhere, end of July 1964, 22,900 tons.*Ncw series. Shipments (from The Institute of Boiler and Radiator Manufacturers)
represent the following approximate percentages of total industry shipments: Convectors,90 to 95%; radiators and baseboards, 80 to 85%.
cfIncludes data for built-in gas fired oven-broiler units; shipments of cooking tops, notincluded in figures above, totaled 29,100 units in May 1964.
tAs reported by the Industrial Heating Equip. Assoc. for member companies, includinorders (not shown separately) for indust. ovens, atmosphere generating and combustio:equip., and miscel. items. Monthly data back to 1958 are available. ©Revisions fo1962 appear in the June 1964 SURVEY.
{Revisions for 1962-63 appear on p. S-34 of the Apr. 1964 SURVEY,§ Radio production comprises table, portable battery, auto, and clock models; beginniri
Jan. 1964, television sets include figures for color sets. ® See similar note, p. S-35.Digitized for FRASER http://fraser.stlouisfed.org/ Federal Reserve Bank of St. Louis

August 1964 SUEVEY OF CURRENT BUSINESS S-35
Unless otherwise stated, statistics through 1962and descriptive notes are shown in the 1963edition of BUSINESS STATISTICS
1962 | 1963
Monthlyaverage
1963
June July Aug. Sept. Oct. Nov. Dec.
1964
Jan. Feb. Mar. Apr. May June July
PETROLEUM, COAL, AND PRODUCTS
COALAnthracite:
Production thous. sh. tons..Exports . doPrices:
Retail, stove, composite $ per sh. ton__Wholesale, chestnut, f.o.b. mine do
Bituminous:Production thous. sh. tons__
Industrial consumption and retail deliveries,total 9 thous. sh. tons.,
Electric power utilities doMfg and mining industries, total do
Coke plants (oven and beehive). do. _.
Retail deliveries to other consumers do
Stocks, industrial and retail dealers', end ofmonth, total 9 thous. sh. tons..
Electric power utilities doMTg and mining industries total do
Oven-coke plants- - do
Retail dealers do
Exports doPrices:
Retail, composite $ per sh. ton--Wholesale:
Screenings, Indust. use, f.o.b. mine doDomestic, large sizes, f.o.b. mine do
COKEProduction:
Beehive thous. sh. tons__Oven (byproduct) doPetroleum coke§ do
Stocks, end of month:Oven-coke plants, total do
At furnnce plants doAt merchant plants do
Petroleum coke doExports do
PETROLEUM AND PRODUCTS
Crude petroleum :Oil wells completed numberPrice nt wells (Okla.-Kansas) $ per h n l _ _Runs to stills _ mil bblRefinery operating ratio % of capacitv.
All oils, supply, demand, and stocks: tNew supply, total . mil. bbl
Production:Crude petroleum doNatural-gas liquids, benzol, etc do
Imports:Crude petroleum _ doRefined products do.._
Change in stocks, all oils (decrease, — ) do
Demand, total doExports:
Crude petroleum doRefined products do
Domestic demand, total 9 doGasoline-. doKerosene do
Distillate fuel oil doResidual fuel oil doJet fuel. do
Lubricants do
Liquefied gases do
Stocks, end of month, total doCrude petroleum doNatural-gas liquids doRefined products do
Refined petroleum products :JGasoline (incl. aviation):
Production doExports doStocks, end of month do
Prices (excl. aviation)Wholesale, ref. (Okla., group 3) $ per gal..Retail (regular grade, excl. taxes), 55 cities
(1st of following mo.) $ per gal..
1,40815G
28.6313.050
35,178
32,31415, 90314,0066,188
2, 349
67, 96046,66520, 845
9,044
449
3,201
17.30
i 4. 918* 7. 443
684,2581,312
3,8992,7961,1031.053
33
1,7812.97
255.884
317.4
223.031.1
34.329.11.0
316.4
.15.0
311. 3132.113.7
61.045.59.4
3.69. 5
21.3
820 6248 135.2
537 3
131.9.5
188.6
.113
.204
r 1 , 522279
29.39r 13.361
37,667
34, 10617 49014 6686,474
1 962
65, 69246 13919 1037,373
450
3 923
17.46
2 4. 74827.014
814 4491 344
' 2, 998T 2 298
7001 200
38
3 1, 6912.93
264. 287
327. 6
229.433.4
34.430.4
.1
327. 5
.16.2
321.24 136. 2
4 14. 4
462.3445.1
9.7
3.6
419.54 831 1
246 933.8
4 550 4
4135.7.6
4 192. 8
.109
.201
1,455286
28. 6212. 565
38,862
31,40116,19114,4266,948
703
67,63846, 79920 3818,202
458
4,110
17.04
4. 7536.633
964 7341 390
'2,607r 1, 947
r 660i r?9
63
1,5422.93
263.688
312 9
296 931.9
31 922 319.7
293 2
15 4
287. 6140 7
9 8
39 735 08 7
3.813.814 8
833 49 ̂ o n35. 4
547 Q
136 8
192.6
.125
.208
' 1.124212
28. 8412. 775
27,629
31, 61517 05313, 64P6, 545
841
63,31844, 62518 1996, 386
494
3, 685
17.13
4.7576.813
844 4671 407
2,6181,952
6661, 157
44
1,8602. 93
272.788
333.7
235 133.3
38 227.019.3
314 4
25.9
308.3150.010 9
40.336 210 8
3.716.517.0
852 7250 038.8
563 9
141 55
184.7
.115
.208
r 1.606420
29.0412. 985
41, 650
32, 47017, 64913.5836,112
1 153
67, 00246, 91219, 5556,919
535
5, 325
17.13
4. 7526.886
804 9001,385
2,7302,089
6411, 152
39
1,8092.93
273. 588
333. 1
236 834.0
36.725.512.3
320 8
.26.4
314.3151 112 4
43 036. 111 8
4.016. 217.2
864 9249 141.4
574 5
144 05
178. 3
.108
.208
' 1.574407
29.7913. 510
39,710
31.59616 56613 4056. 039
1, 536
69, 38849, 13819 712
7, 290
538
5, 266
17. 46
4.7527. 061
794 1571 350
2.8012,185
6161 171
33
1, 7252.93
260 287
316 8
995 232.8
34 923 911.0
305 8
17 0
298. 7134 013 3
50 535 610 2
3.414.616 1
875 9948 343.1
584 6
l'^5 7
181.3
.115
. 200
r 1, 822345
30.0013. 510
44,195
33,81417 59314 6126,370
1 511
72, 70851,722°0 4°3
7,912
563
5, 029
17.69
4.7457.231
834 3911.367
2, 8882,304
5841, 195
1,6332.92
266.986
331.8
233 634.1
31 432.711.7
320 1
26.0
313.8142.012 5
49.541 810 9
4.314.217.6
887 6245 5
43^8598 3
138 28
178.3
.110
. 197
r 1.615319
30.5414.420
38,228
34,38817,78314,6156,241
1 905
73, 38352, 38320, 3918,054
609
4.500
17.73
4.7487.257
784 9891 355
2,8992, 379
5901,381
41
1,4802. 92
26l'o87
322 5
926 334.3
34 227.62.9
319 6
16.5
313.0132.915 4
61.543.89 1
3.36.9
20.9
890 5244 442.1
604 0
135 67
181. 3
.090
.201
* 1,535309
30.9514.420
38,491
40,19990 72716 3296 570
3 118
70, 08349 31420 2708, 014
499
3 536
17.83
4.7487. 257
824 5401 457
2,8812 394
4861 297
19
1, 7682 92
269 387
336 7932 835. 6
30 338 0
-54.9
391 6
26 3
385.1134 721 9
102 260 48 8
2.94.1
29 5
835 6907 A
33.7Kf\A C
144 1q
190.9
.105
. 204
1,527248
31. 3514. 490
40, 430
39, 76820 38916 4116 789
2 968
66, 53646 42219 6597,780
455
3 152
17.89
4.7267.276
824 6fii1 440
2,8312 380
4511 284
19
1, 5672.92
273 388
363 1
238 136.4
3Q 649 0
-22.8
385 8
16 7
379. 0130 521 2
96 166 4
Q 7
4.03.3
27 8
D-l 0 0
28.4
142 4Q
203.2
.105
.196
1.311149
31. 4014.490
34, 790
36, 75518 73215, 5256, 540
2 496
64, 4HO44, 96119 1217,900
348
3 065
17.89
4.7317.221
784 4851 343
2, 6722 253
4181 313
23
1,6282.92
256 889
326 0924 534.1
32 235 2
-9.9
335 9
I4 8
331.0121 817 7
81 553 48 4
3.43.3
22 2
o/m' i
27.4
133 04
215. 1
. 100
.199
1, 15586
31.4014. 490
36, 790
36, 43918 46516 0977,014
1 872
63, 04143, 71 719 0708,299
954
3 028
17.89
4.7317.026
874 8911 457
2.X72 141
4961 329
27
1 5642.92
269 987
345 7
240 636.' 0
36 932 26.4
339 4
9
6 0333. 1135 515 2
73 449 79 5
3.84.3
19 9
OAQ 9
29.9
140 18
220.4
.100
.199
1,42784
31.4013.195
r 37, 490
33, 05416 6661.5, 3027,044
1 030
65, 04345 04519 7438,411
255
3, 523
17. 76
4.8076.524
874 8551 366
2,4212 008
4131 359
25
1 5662.92
9 58 4r 84
335 4
93Q 1
34.0
33 i35 28.8
396 6
16 4
320. 1140 6I9 6
59 648 210 3
4.47.1
16 9
34.1
133 94
214.7
.095
.195
1,665151
30.6913.195
'38,270
'32,70216 757
r!5 324r 7, 537
r 518
'68,61947 886
r2() 420r 8, 841
313
4 551
17. 31
»• 4. 832' 6. 482
'90r 5 1Q9
1 409
r 2, 3371 909
r 499
1 37983
i 5572. 92
267 684
334 3
235 834.4
36 028 224.7
309 7
25 7
303. 8144 911 1
46 837 510 4
3.611.915 8
38.9
210.9
. 105
.196
r 1 , 789171
30. 30v 13. 195
40, 21 5
33,21117 99714 5647 346
569
70, 69749 33191 ()()9ft' 372
357
1 617
17.23
P 4. 832p 6 511
78o 036
2, 2831 864
419
40
P 2. 92
p. 103
.207
1,127
30, 350
" Revised. v Preliminary.1 Monthly average based on Apr.-Deo. data.2 Data beginning Jan. 1963 not entirely comparable with those for earlier periods3 Beginning Jan. 1963, data exclude condensate wells formerly included* See note 1 for p. S-36.
9 Includes data not shown separately.§ Includes nonmarketable catalyst coke.t Re vised data for months of 1962 appear on p. 28 of the June 1964 SURVEY.
NOTE FOR ELECTRON TUBES, p, S-34—© Beginning Jan. 1964, excludes salesof receiving tubes; 1963 sales of such tubes averaged $22,800,000 per month.
Digitized for FRASER http://fraser.stlouisfed.org/ Federal Reserve Bank of St. Louis

S-36 SUEVEY OF CURRENT BUSINESS August 19(54
Unless otherwise stated, statistics through 1962and descriptive notes are shown in the 1963edition of BUSINESS STATISTICS
1962 1963
Monthlyaverage
1963
June July Aug. Sept. Oct. Nov. Dee.
1964
Jan. Feb. Mar. Apr. May June July
PETROLEUM, COAL, AND PRODUCTS—Continued
PETROLEUM AND PRODUCTS— Continued
Refined petroleum products — ContinuedAviation gasoline:
Production _ _ m i l . bbl_Fxports ^°
Kerosene:
Stocks end of month -doPrice, wholesale, bulk lots (N.Y. Harbor)
$ per gal -Distillate fuel oil:
Production mil. bbl _Imports - - do __Fxports - -doStocks end of month do_ _ .Price, wholesale (N.Y. Harbor, No. 2 fuel)
$ per ga l_-Residual fuel oil:
Production mil. bblImports - --do __Fxports -_ _ - -- - -doStock^ end of month - doPrice wholesale (Okla No 6) $ per bbl
Jet fuel' (military grade only) :Production mil. bblStocks end of month - do
Lubricants:Production - - do_Fxporfs -do _ _ .Stocks end of month doPrice, 'wholesale, bright stock (midcontinent,
f o b Tulsa) - $ per gaL-Asphalt:
Production _ _ _ . - mil. bbl..Stocks end of month do - ..
Liquefied petroleum gases:Production - -doTransfers from gasoline plantr doStocks (at plants, terminals, underground, and
at refineries) end of mo .mil. bbl .
Asphalt and tar products, shipments:!\snhalt roofin0" total thous. squares
Roll roofin^ and cap sheet f^vShingles all types - (lo
\sphalt sjdin^ floInsulated sidincr doSaturated felts -thous. sh . tons -
10.2.4
10.5
13.130.6
.104
60.01.0
7133. 4
.092
24.622.01.1
46.61.58
8.68.7
5.11.5
12.8
.261
9.116.3
6.414.9
33.6
5, 3671. 9133. 4.r»4
67
82
10.4.4
10.7
1 13 8131.7
.102
163.8.8
1.21 135. 8
099
i 23.122.91.3
148.61.57
8.39.4
5.31.5
13.7
.270
9.316.7
i 4.714.9
i 30. 2
5, 3722. 0093. 303
667082
10 9.5
11 6
11 732.3
.101
60 1.7
1.0r>3 4
0919i 815.31.0
48. 11 55
9 o10 2
5 31.3
13 4
270
12 11Q 8
4.910.6
31.9
6, 3092. 1674,142
588189
11 03
10 4
I9 935.2
101
62 4
1.0145 9
.091
21 718.11.1
50.91 55
9 110 2
5 61.8
13 4
.270
12. 916.8
5.012.7
35. 5
7, OS49, 7464. 938
7893
109
11 2.3
9 5
1? 536.2
101
F,3 3.6
1.11 65. 2
091
?1.816.9
1.45° 51 55
8 99. 6
5.41 5
13.4
°70
13. 214. 5
4 .912. «
38.5
6, 9542 6024. 352
7810095
9 5.5
9 6
12 236.0
.096
63.2
1.4177 2
.086
21.515.7
1. 752. 61.55
8.59.3
5.41.6
13.8
.270
12.412.8
4.412. 1
41.2
6.4192 4503, 969
819383
10 0.5
9 3
14 939.1
096
63 9.9
1. 1191 4
0869i o23.2
1.054.41 55
7 88.6
5.41.5
13.4
.270
11.310.4
4.213.5
41.8
7 1142. 7644, 35D
10210298
9 85
8 8
14 839. 1
099
62 91.01. 3
192 6
089
22 520. 7
1. 852.21 55
8 38.9
5.31.4
14.0
. 270
8. 211.9
4 o16.5
39.4
4 6041.8102. 794
855674
10 86
9 4
16 234.1
104
65 8.8.4
156 7
094
25 031.61.3
47. 51 55
7 88.5
5.01.8
14.3
. 270
6.214.4
5.023 3
30.3
3 1031 2141 88S
5°3760
10 04
9 7
17 330.9
104
67 51.61 2
128 5
094
25 839 7
1.645 41 80
7 88 5
5 21 2
H 3
. 270
4.415 8
5 0
24.3
3 1341 9131 920
433167
10 02
10 8
14 728.5
104
62 81.1.4
110 5
094
22 729.2
1.043.31 65
7 09.0
4.81.4
14.3
.270
5.618.1
4.717.1
22.9
4 5211 6102,911
603688
10 66
10 3
14 328.5
099
61 7.9.6
99 2
.089
22 324.71.7
39.11.50
9 19.9
5.21.4
14.4
.270
7.321.3
5.215.0
M 4
4 7051,7772 928
484478
10 22
10 3
12 529.1
096
57 6.8.3
97 8
086
21 9
98 02.0
38 51 35
8 99 9
5 32 0
13 3
9 70
8.022 3
4 819 3
99 4
5 7192 04°3 677
50
10. 5.4
9.9
11 730. 5
. 094
60.8. 7.3
112.2
084
20. 819.81.4
40.51 35
9. 59.3
5.41.3
13.8
270
11.222 0
5.211 5
34.9
r 6 991r2 389
4 532
r 49
8°
p. 093
p. OS3
P 1.35
v 270
7 5%0 M55 010
55
95
PULP, PAPER, AND PAPER PRODUCTS
PULPWOOD AND WASTE PAPER
Pulpwood:Receipts thous. cords (128 cu. f t . ) --Consumption doStocks, end of month do
Waste paper:Consumption thous. sh. tonsStocks end of month _ _ _ _ _ d o _
WOODPULPProduction:
Total, all grades thous. sh. tons_.Pissolving and special alpha _ do .R til fate - - -doSulfite -- - do
Ground wood do _Defibrated or exploded ._ ._ _ _ d o __Soda, semichem., screenings, etc do
Stocks, end of month:Total, all mills do
Pulp mills -- _. _ ...do . _Paper and board mills do _ -Nonpaper mills - do
Exnorts, all grades, total. . - doDissolving and special alpha _ _ d o . _ _All other do
Imports, all crades, total. do _ .Dissolving and special alpha _ _ _ doAll other do
PAPER AND PAPER PRODUCTS
Paper and board:Production (Bu. of the Census):
All grades, total, seas, adj thous. sh. tons.-All grades, total, unadjusted do
Pa;>er _ _ do ___Panerboard _ _-do.Wet-machine board, __ doConstruction paper and board do
3. 0683, 6735, 225
756498
2, 326106
1,358214
283104261
878297509
72
994059
23223
210
3,1371, 3821,458
14284
3. 8163, 8475,124
729501
2,453114
1,458224
2892 1172 251
3 713263
3 37278
1184475
23199
210
3, 2501, 4361,507
11296
3,5743,8604, 652
742509
2,397122
1,424210
276113251
721279364
79
1083771
25624
231
3,2731,4081,544
13309
3, 6563 5554,819
663529
2,308108
1,361209
274111245
72125638085
1203980
22921
208
3,0141 31 9
1,3879
306
4, 3704 1505, 180
769
515
2, 576121
1, 549229995120262
721959378
90
1304889
249''1
991
3,4561,5081, 605
11333
3,9453,7545,118
737494
2, 390106
1.416211
280124253
706?43381
82
1985573
22016
9Q4
3, 2001 3871, 496
11306
4 3354 1025, 353
797506
2. 631124
1 555°42
310125274
707246384
4176
9582']
3.5141 54()1 690
12343
3 8'M3 9755.116
710-465
2,593r'Q1 551' 930
308r}49617319 64394
73
1063868
199( )(5
3,3141 4811 529
11293
3 4953 6264,' 976
668514
2, 28397
1 357929
280106215
717235408
1424993
23692
214
2. 9731 3751 334
10254
4 0304 0554, 936
741490
2, 605138
1 5282'-H
327124257
739266396
78
1324'i89
235
91H
3, 3951 5351 563
11286
4 1753' 9064,981
748477
2. 530125
1 509924
304127241
74 596639980
1°04978
99421
203
3, 2761 4481 533
11284
4 1574 1964,987
799470
2,667127
1 608949
320129241
759271403
84
1395583
9 t>593
949
3. 4771 5151 639
12318
3 8434' 1194, 690
891476
2. 706106
1 634946
330199260
747965387
94
1 304692
2289 6
202
3, 5531 5471 662
11333
3 9^24' 2134^428
80340«
2,821199
1 729241
335131256
771986394
90
143r. r.
ou
9 2 518
208
3, 5111 5181 648
11333
19740
93°33
T Revised. v Preliminary. 1 Beginning Jan. 1963, data for the indicated items excludecertain oils which have been reclassified as petrochemical feedstocks.
2 Effective Jan. 1963, "screenings, etc." included with "defibrated or exploded."3 Effective Jan. 1963, excludes stocks of "own pulp" at paper and board mills.
± Re vised monthly data for 1962 for petroleum products appear on p. 28 of the June 1964S T R V E Y ; revisions for 1962 and for 1963 (also shown above) for asphalt and tar products appearon p. 32 of the Apr. 1964 S F R V E Y .
Digitized for FRASER http://fraser.stlouisfed.org/ Federal Reserve Bank of St. Louis

August 10C4 SURVEY OF CURRENT BUSINESS S-37
Unless otherwise stated, statistics through 1962and descriptive notes are shown in the 1963edition of BUSINESS STATISTICS
1962 1963
Monthlyaverage
1963
Tune July Aug. Sept. Oct. Nov. Dec.
1964
Jan. Feb. Mar. Apr. May June July
PULP, PAPER, AND PAPER PRODUCTS—Continued
PAPER AND PAPER PRODUCTS— Con.
Paper and hoard— ContinuedNe\v orders (American Paper and Pulp Assoc.):
A l l Grades, paper and hoard thous. sh. tons-_Wbolesale price indexes:
Print ing paper 1957-59 = 100.Book y) a per A gra.de doPaperboard 9 do
Selected types of paper ( APP A) : tFine paper:
Orders new thous sh tonsOrders unfilled end of month do
Production doShipments do
Printing paper:Orders new doOrders unfilled end of month do
Production doShipments do
Coarse paper:Orders new doOrders unfilled, end of month _ do __
Production _ _ _ doShipments do
Newsprint:Canada:
Production doShipp'ents from mills doStocks at mills end of month do
United States:Production doShipments from, mills doStocks at mills, end of month do __
Consumption by puhlishersc? doStocks at and in transit to puhlishers, end of
month cf thous sh tons
Fin ports doPrice, rolls, contract, f.o.b. mill, freight allowed
or delivered $ per sh ton
Paporboard (National Paperhoard Assoc.): §Orders, new (weekly avg.) thous. sh. t o n s _ _Orders, unf i l l ed , end of month ... _ _ d o __Production total (weekly avg ) do
Percent of activity ('based on 6.5-day week)Paper products:
Shipping containers, corrugated and solid fiber,shipments© mil. SQ- ft. surf. area--
Folding paper boxes, shipments, index of physicalvolume - 1947-49=100,
3, 131
101.4107.693.197 2
16688
170168
412370
409409
346154
350343
f,58557249
17918039
465
586
456
134. 40
1 340461
i 34385
10, 182
124.1
3,268
101.4107.494.796.2
17499
177174
454394
445445
355164
353350
553552268
18518437
465
588
451
134.40
i 357518
"All
10,711
126. 1
3, 265
101.4107.494.197.5
17092
178175
454424
445445
334151
328327
539565278
18117740
483
561
448
134. 40
36747237089
10,508
123. 9
3,170
101.4107.494. 197.5
164103
159160
432396
412412
323153
311311
551575255
17318331
421
615
497
134.40
326572319
78
10, 13r>
120. 3
3, 424
101.4107.494.197. 5
179102
185187
457395
471471
369167
372363
586576265
191178
44
4«
632
455
134.40
385574381
91
11,903
135.5
3,308
101.4107.494.197.6
171103
177170
472410
439439
366182
340356
551580235
16417236
490
606
455
134. 40
36361135586
10,848
129.6
3,523
101.4107.496.696.9
192108
190190
484394
478478
383185
373366
630638227
19419337
5^9
588
522
134. 40
385622387
92
12,482
141.7
3,193
101.4107.496.695.1
173100
180179
443378
457456
364180
377370
613611229
19018938
524
559
463
134. 40
357545373
90
10,649
119. 8
2,913
101.4107.496.595.2
15790
169153
414375
426425
329154
339341
535578186
18018434
545
536
134. 40
316494325
75
9, 870
130.8
3,458
101.4107.496. 595.2
18585
187183
499383
481481
370160
370369
564533217
19818943
455
569
444
134.40
363537349
88
10, 833
124.4
3, 298
101. 4107.496. 595.0
18493
183187
449368
446446
360167
362354
549491275
17418632
452
572
409
134. 40
387538386
91
10,460
114.3
r 3, 499
101.4109.096. 593.7
-184-83
r 191-188
497-397
467467
r372-161
-369-373
566540301
19019329
518
550
473
134.40
381532384
92
11,039
123.1
3 554
101. 4109. 996. 593.5
-197-92
-196r 192
-483-391
- 475-475
r 365
-145
-373-372
625664261
19219724
528
541
475
134. 40
387519386
90
1 1 , 520
126.9
101.4109.996. 5
- 94. 4
19992
196197
480396
472472
359143
370364
610594277
20119232
550
511
470
134. 40
39956539190
11,399
*>119 9
101.4109. 996. 594.4
610652240
19419234
496
529
513
"134. 40
39558739090
11, 284
36162435181
11,198
RUBBER AND RUBBER PRODUCTS
RUBBERNatural rubber:
Consumption thous. Ig. tons..Stocks, end of month doImports, inch latex and guayule doPrice, wholesale, smoked sheets (N.Y.)~-$ perlh..
Synthetic rubber:Production thous. Ig. tonsConsumption _ _ _ _ _ _ _ _ d oStocks, end of month doExports do
Reclaimed rubber:Production doConsumption _ - do_ _Stocks, end of month _ . do_
TIRES AND TUBES
Pneumatic casings:Production thous
Shipments, total doOriginal equipment doReplacement equipment doExport do
Stocks, end of month __ doExports (Bu . of Census) do
[nner tubes:Production doShipments doStocks, end of month doExports (Bu. of Census) do
38. 5668. 4735. 13v . 285
131.2010 1.66257. 1525. 31
23. 3821.9529. 77
11, 156
11,0553, 4957, 430
130
27. 08689
3, 4033, 4428, 913
81
38.1072.7031. 63p. 263
134.04108.90281 . 0523. 60
23. 4521. 9730.30
11. 594
11, 5513, 9197, 503
129
29, 97882
3, 3053, 3989, 462
76
36. 2877.7625. 57
.270
132.99103.54281.7220. 04
22 7921.4329. 65
-11, 186
-11,924- 4. 084-7,710
-130
-31,32778
3.183- 2. 926
- 10, 45762 j
32. 9275. 1925. 72. 265
130.7892.34
296. 7624. 00
21.1217.9232. 12
10. 182
12. 6813, 5079. 044
131
28. 83097
3, 0213, 6509,818
90
35. 5573. 0031. 6«
. 253
127.30100.42296. 2127.27
20. 1119. 2731.22
9,368
9, 5581. 6067,819
132
28, 65281
2,7923, 0329. 576
61
36.3168. 8826. 24
. 230
124.59105.70292 2021.33
22.4221.6531.35
10, 540
11,2323. 5627. 552
117
27, 88978
2,8603, 1159,180
82
42. 5964. 3030. 5X
. 255
129.86127.89975 28
22. 5 1
26. 0025.0630.88
13,469
14,0215, 1638,700
158
27, 46986
3,4083, 5069, 155
85
35. 2961.3227. 09
. 258
134.81109. 2<>275. 2822. 90
21.2520. 6529.78
1 1, 502
10, 7464, 3066, 263
117
28, 27282
2, 8272, 9589,088
77
35. 7560. 5828.61. 240
141.05107.54283. 0124.86
22. 1720. 1531.19
11.496
10,4914.4705, 888
134
29. 40773
3. 1382, 7999,529
75
39. 5962.4438.78
. 235
143 59120 74279. 51
24. 00
25.1122. 9931. 47
12, 681
12, 6404,3378,194
110
29, 544
77
3,9145, 4158,201
55
36. 6664.3426. 30
23 6
140. IS111 1 9
283. 2028. 80
21.7520. 7530. 51
11,835
10, 4064, 0676, 209
130
31, 09085
3, 6733, 6138,424
72
39. 8064.9741. 75
. 256
140. 27116.69285. 88
27. 05
21. 032? 5930. 37
12, 503
1 1, 9964,4027,478
116
31,65878
3, 8373, 3819,020
51
40. 6864. 7428. 79
. 259
146.22121.8598f 1 927 8"
24. 5024. 2030. 42
13, 331
14, 1174, 8549,1 HO
133
31,09192
3, 9563, 3929,587
78
39. 3669. 0844. 07
. 254
150.31IIS. 4<)293. 17
24. 66
23. 9693 1029. 76
13,214
13,5764, 5428, 907
126
31,011lot;
3, 5913,117
10, 17264
41.3767. 1431.24
. 251
1 16. 941_>3. 71•'93 02
24.98
22'. 3030. 92
14, 041
14, 5174,6529. 718
146
30, 644105
3, 6993,475
10, 47173
"""."246
"I
- Revised. * Preliminary. 1 Weekly average for year. sumption in 1962 and 74 percent in 1963 and 1964.9 Revisions lor 1961 are available upon request. § Revised to reflect weekly averages for new orders and production, and percent activityt Monthly averages for 1962 for new orders, production, and shipments reflect revisions on basis of 6.5 days per week; comparable data prior to 1962 will be shown later. ©Revision^
;o adjusted annual totals; revisions by months not available. by months for 1962-Feb. 1963 will be shown later.rf As renorte.d bv rmhlishers accounting for nhont 74 R ne.rcent of t.nt.al np.\vsnrint. orm-
Digitized for FRASER http://fraser.stlouisfed.org/ Federal Reserve Bank of St. Louis

S-38 SURVEY OF CURRENT BUSINESS August li>64
Unless otherwise stated, statistics through 1962and descriptive notes are shown in the 19G3edition of BUSINESS STATISTICS
1962 1963
Monthlyaverage
1963
June July Aug. Sept. Oct. Nov. Dec.
1964
Jan. Feb. Mar. Apr. May June July
STONE, CLAY, AND GLASS PRODUCTS
PORTLAND CEMENT
Production, finished cement thous. bb l__Porpont of capacity
Shipments finished cement thous. bb1_Stocks, end of month:
Finished -- doClinker do
CLAY CONSTRUCTION PRODUCTS
Shipments:"Rrick, unglazed (common and face)
mil. standard brick..Structural tile except facing thous. sh. tons..Sewer pipe and fittings vitrified doFacing tile (hollow), glazed and un glazed
mil brick equivalent.Floor and wall tile and accessories, glared and un-
pla/ed mil. sq. f t _ .Price index, brick (common), f.o.b. plant or N.Y.
dock 1957-59 = 100..
GLASS AND GLASS PRODUCTS
Flat glass,mfrs.' shipments (qtrly. average or total)thous $
^heet (window) glas^ shipments doPlate and other flat glass, shipments do...
ninss containers:Production thous. gross-
Shipments, domestic, total - . doGeneral -use food:
Wide-mouth food (incl. packers' tumblers,jelly glasses, and fruit jars) thous. gross..
Peverasre doPeer bottles doLiquor and wine do
Medicinal and toilet ._ ._ _ do._.Chemieal household and industrial doDairy products do
Stocks, end of month _ _ do .
GYPSUM AND PRODUCTS
Crude gypsum, qtrly. avg. or total:Imports thous sh tons
Calcined production qtrlv nvg or total do
Gypsum products sold or used, qtrly. avg. or total:Tin calcined uses thous sh tonsIndustrial uses doBuilding uses:
Plnsters:P>flc:p-P0at C]Q
\11 other (incl Keene's cement) do
I /at l i mil sq ftNVallboard doAll other§ do
28,02775
27, 893
36, 72024,160
576. 135. 2
142. 8
33.6
21.1
104. 9
71,49731,61239, 885
14, 655
14,319
1.582
4,110
1, 1872. 1831,269
3, 066786134
22, 921
1 , 3552 4(;2
2, 205
1,01267
256257
396 21, 657. 9
58.9
29, 44174
29, 354
38, 02923, 072
617.132.0
145. 6
29.7
92 2
106. 1
78, 27435, 37042, 904
15, 166
14, 730
1,602
4, 100
1,3502, 4531,295
3. 061742127
25, 533
1, 372r 2 561
2, 295
' 1, 03570
259250
1, 777. 462.0
34, 99289
35, 431
40. 32227. 332
691.836.3
171.5
32.7
23. 5
106. 4
75. 50132, 97642, 525
16, 214
15, 866
1,396
4,031
2, 1413.2151,319
2. 867789108
26, 086
r 2 750
2, 403
r 1, 25072
283260
401.31,832.2
68. 8
36, 80291
39,145
38, 05723, 884
747 .439.7
176. 1
32. 4
23. 3
106, 4
16.202
15,601
1,863
4. 048
1,9693. 2641.060
2. 5886861°3
26. 401
37, 45293
40.257
35, 20919, 774
745. 335.6
186. 9
33.1
24.5
106. 4
17,095
17,741
2, 290
5, 275
1.4302. 9831,338
3,431Sl'>182
26. 006
34, 68288
36, 547
33, 23617, 400
684.330. 9
171.1
29.7
22. 8
105. 8
80. 85738. 76642, 091
14,P03
14. 805
2 765
4,124
8581 . 9711.337
2. 933679138
25, 151
1.5669 qf)9
2, 518
1,26370
•?84°89
437. 01,994 8
69. 0
36. 62490
41,352
28, 48513, 631
34.1186. 4
35.7
25.3
105. 8
15,677
15. 497
1 838
4, 633
9212, 1571. 643
3. 401765139
25. 564
30. 37777
26, 317
32, 49113. 820
620.426. 2
135. 1
90 9
21.5
105. 9
14.271
13, 283
1, 186
3,847
9592. 1011.323
3, 095648124
26 315
23. 99359
16. 958
39, 55616, 793
431. 123. 494.8
25. 8
19.1
106. 1
89 29X41 31447. 984
12, 712
13. 382
1 204
3. 848
1 , 3822 9^61, 226
2. 704584148
25. 540
1. 3752 425
2 226
94769
232240
365 61 730 1
60 9
18,93146
17 425
41 04721. 741
424. 127.193 4
22 8
21.0
106. 1
14. 424
13, 714
1 331
4, 181
8452. 0541,286
3. 263639115
26 067
19. 72951
17,597
43, 18025. 610
446. 525.1
101.3
21 9
20. 6
107. 1
14, 704
13, 397
1 °94
4,034
9872.1371, 293
2, 956602
94
25, 893
24. 69761
22 722
45,15229, 242
590. 829.6
137. 5
26.4
24. 6
107. 1
r 78. 21132, 610
r 45, 601
15,877
15,377
1 508
4,134
1,4222, 6831, 413
3, 364751102
26, 136
1,3972 377
2 209
82273
237217
365. 71 721 1
51.6
29, 49375
29,178
45, 46230, 667
r679 331.7
151.8
27 8
r 25. 5
107.3
16, 391
16. 514
1 64?
3,911
1,7003, 5421,392
3, 490699138
25, 633
34,41784
35 511
44 36829, 580
739 832 6
166 4
9'^ 9
23 9
107.3
16, 776
15, 283
1 367
4.040
•> 105
1. 379
•' 89059090
26. 948
36, 18592
38 750
41 86027, 184
107.1
80, 64435 '^7245, 372
17, 652
16, 967
1 455
4, 355
2 3953. 5431. 425
3, 089637104
27, 294
1, 2809 733
2, 437
1,20075
''691 954
' 391 81 905 7
73 8
TEXTILE PRODUCTS
WOVEN FABRICS
\Voven fabrics (gray goods), weaving mills: 0Cloth woven, total... _ _ mil. linear yd.
Cotton doStocks., end of year or mo., totaled _ _ _ d o
Cotton cf - loOrders (unfilled), end of year or mo., total V lo
Cotton 1 . _.. lo
COTTON
Cotton (exclusive of linters) :Production:
GinningsA thous .running balesCrop estimate equivalent 500-lb. bales
thous. balesConsumption O _ _ _ _ .. doStocks in the United States, end of mo., total O
thous. bales _Domestic cotton, total O do
On farms and in transit doPublic storage and compresses O doConsuming establishments .. do_._
Foreign cotton, total O do
975.5760 2
1,488.01,192.52, 472. 31,848.9
214,864
214,867726
14, 69614, 5933,3719,5641,658
103
981. 9756 9
1, 509. 31, 176. 72, 491. 51, 800. 8
215, 283
215 327700
17, 74117,6133,492
12, 7621, 359
128
929. 4710 0
1. 518. 01, 165. 02.311.01,672.1
662
11,89311,794
28310,1831.328
99
i 923. 21 71 0 7
11,491.5U,133.612,436.3U,760.3
245
i 685
11,21611,123
2809,6471,196
93
934. 479() 9
1,506.11,158 52. 506 41, 798. 8
' 1,326
667
24. 53124, 39513, 532
9,8071,056
136
939.8719 1
1, 505. 01,104. 02, 546. 11, 848. 8
r 4, 786
663
24, 04623, 89911,23011,688
981147
1 1,179.71 915 3
i l , 475.711,149.912,827.9'2,023.4
'10,055
i 829
23, 36023, 2076,948
15, 2091,050
153
957. 0736 3
1,494.51 168 02. 968. 92. 127. 1
r 12, 820
678
22, 29622, 1464,391
16, 5101,245
149
887. 1684 2
1. 564. 01 235 62, 892. 82, 084. 8
3 14, 070
605
21, 17021,019
2, 35417, 2601,405
151
i 893 8
il 157 1
ii.882~.5~
415, 117
i 814
19, 51219. 3731,218
16, 5571.598
139
741 3
1 131 4
1, 797. 4
683
18,40718, 2771,066
15, 5391,672
130
733 0
1,116 5
I~682~2~
673
16, 95716, 839
45914, 6641,716
118
i ggg 51 1,081 4
i~l.~555~8
1831
15,70015, 594
41113, 5821,601
106
799 i
1 087 1
i,"624.~8
687
14, 68314, 588
38712, 7501,451
95
683
13, 71213, 632
42711,9331 272
80
If5 14 li
T Revised. l Data cover 5 weeks; other months, 4 weeks. 2 Total crop for year.3 Ginnings to Dec. 13. 4 Ginnings to Jan. 16. 5 Aug. 1 estimate of 1964 crop.§ Comprises sheathing, formboard, and laminated board.©Effective Jan. 1964, the manmade fabrics classifications were revised and the survey
expanded to include drapery fabrics; silk and chiefly silk mixtures were omitted from thecanvass. Because of apparent reporting problems in the synthetics, data for total fabrics arebeing withheld; May 1964 figures for wool apparel fabrics (mil. yd.): Woven, 22.6; stocks,34.0.
cf Stocks are those owned by weaving mills and those billed and held for others, excejthat stacks exclude denims stocks billed and held for others, and all bedsheeting stocks.
^Excludes orders for wool apparel fabrics and bedsheeting ATotal ginnings to end <month indicated, except as noted. ©Revisions for Aug.-Dec. 1962 are available; for stoclmonthly averages also reflect cotton released by GSA from the cotton stockpile (beginninJuly 1962).
Digitized for FRASER http://fraser.stlouisfed.org/ Federal Reserve Bank of St. Louis

August 1!)G4 SURVEY OF CUERENT BUSINESS S-39
Unless otherwise stated, statistics through 1962and descriptive notes are shown in the 1963edition of BUSINESS STATISTICS
19G2 1963
Monthlyaverage
1963
June July Aug. Sept.
TEXTILE PRODUCTS
Oct. Nov. Dec.
1964
Jan. Feb. Mar. Apr. May June July
— Continued
COTTON—Continued
Cotton (exclusive of linters)—ContinuedExports thous.bales-Trn ports doPrices (farm), American upland cents per lh_Prices, middling 1", avg., 15 markets do.._
Cotton Hnters:Consumption© thous. bales.Production! do—Stocks, end of mof do
COTTON MANUFACTURESSpindle activity (cotton system spindles):
Active spindles, last working day, total__thous .Consuming 100 percent cotton d o _ _ _
Spindle hours operated, all fibers, total mil.Average per working day d o _ _ _
Consuming 100 percent cotton d o . _ _Cotton yarn, natural stock, on cones or tubes:
Prices, f.o.b. mill:20/2, carded, weaving $ per Ib.36/2, combed, knitting d o _ _ .
Cotton cloth:Cotton broad woven goods over 12" In width:
Product ion, ntrly. avg. or totalt mi l . l in .yd-Orders, un f i l l ed , end of rno., as compared with
aver, weekly production No. weeks' prod-Inventories, end of mo., as compared with avg.
weekly production No. weeks' prod_.Ratio of stocks to unfilled orders (at cotton
mills), end of mo., seasonally adjusted --Exports thous. sq. yd.Imports doMill margins cents per ! b _ .Prices, wholesale:
Denim, mill finished cents per ydPrint cloth, 39 inch, 68 x 72 doSheeting, class H, 40-Inch, 48 x 44-48 d o _ . _
MANMADE FIBERS AND MANUFACTURESFiber production, qtrly. avg, or total© mil. l b _ _
Filament yarn (rayon and acetate) doStaple, incl. tow (rayon) doYoncellulosie (nylon, acrylic, protein, etc.)-doTextile glass fiber do
Exports:Yarns and monofilarnents thous. lb_Staple, tow, and tops do...
Imports:Yarns and monofilarnents doStaple, tow, and tops d o _ ~ _ _
Stocks, producers', end of mo.:Filament yarn (rayon and acetate) mil. l b _ -StapJe. incl. tow (rnyon) doNoneellulosic fiberO do_Textile glass fiber IlllldoIIII
Prices, rayon (viscose):Yarn, filament. 150 denier A $ per IbStaple, 1.5 denier A do
Manmade fiber broadwoven fabrics:Production, qtrly. avg. or total 9 t--.mil. lin. yd
Rayon and acetate (excl. tire fabric) doNylon and chiefly nylon mixtures do_Polyester and chiefly polyester blends._ _~do"~"
Exports, piece goods thous. sq. yd_
SILKImports, raw thous. IbPrice, raw, AA A, 20-22 denier 0 $perlb..Production, fabric, qtrly. avg. or total J
thous. lin. yd..
WOOLWool consumption, mill (clean basis):J
Apparel class mil Ib.Carpet class V.._db..I"
Wool imports, clean yield do_Duty-free (carpetclass)* do ._I~
Wool prices, raw, clean basis, Boston:Good French combing and staple:
Oracled territory, fine $ per lb_.Graded fleece, % blood ~ _ - _ d o _ _ I . .
Australian, 64s, 70s, good topmaking do
WOOL MANUFACTURES
Knitt ing yarn, worsted, 2/20s-50s/56s, Bradfordsystem, wholesale price 1957-59=JOO__
Woolen and worsted woven goods, exc. felts:Production, qtrly. avg. or total J thous. lin. yd.
Apparel fabrics, total doWomen's and children's do
Suiting, price (wholesale), flannel, men's andboys, f.o.b. mill 1957-59=100-
r Revised. * Preliminary. 1 Season average. 2 Season average to Feb. 1, 1964.3 Data cover 5 weeks; other months, 4 weeks. 4 For month shown. 5 Qrtly. average.
9 Includes data not shown separately. © Revisions for 1962 are available.t Production and stocks of linters at oil mills revised to approximate running bales; data
back to Aug. 1958 are available.©Beginning Feb. 1963, price in skeins, AAA grade; comparable Jan. 1963 price, $7.67 per
pound. J Revisions for 1st half of 1962 are available upon request.AEffective Jan. 1964, data not strictly comparable with earlier prices.
32112
131.7i 33. 5
109134628
18,79716,7549,911458
8, 801
.660
.938
2.312
10.8
5.4
.51
34, 69138, 671
25. 24
39, 615.417.0
597. 3181.5125. ()243.247.6
9, 1774,281
8095,463
53. 248.4
5 79.85 27 0
.82
.26
682.8397. 075.9147.8
11,633
5396. 03
5, 951
23.4
23.111.8
1.2471. 0901.155
100.6
77, 46575,31045, 423
94.9
36311
P231. 9* 2 33. 1
111129667
18, 62715,8269, 863456
8, 359
.644
.912
2, 195
10. 6
5.5
.52
30, 94238, 223
25. 20
38. 115. 917.0
659. 2177.4144.8289. 048.0
s, KM;4. 187
6.y,o10,463
56. 835. 5
5113.3
.82
754. 2428. 573.7188. 2
12. 972
532
4, 497
20. 9
23.814.0
1.3261. 1751. 285
105. 4
71,63068, 86443, 372
95.8
2445
32.533.9
11546615
18,6091 5, 7679, 280464
7,833
.640
.911
? 942
9.6
5.4
.56
26, 91832, 832
24. 25
38.315.717.0
640. 7174. 2141.2277.447.9
10.8583, 170
51210 , 294
29^494.928 0
.82
.27
757. 5430. 472 1187.8
13, 676
4927. 70
4, 349
21.4
20. 111.2
1 . 3001.1401. 275
105. 4
78, 16675, 24646,837 !
95.8 ;
1833
31.833.4
3 9936550
18,6381 5, 6923 9, 81 9
3933 8, 162
.640
.911
12.6
6.4
.52
33, 82739. 150
24. 71
38.315.717.0
7,9804,715
72312. 262
58. 532'. 1
.82
.28
10, 492
4276. 80
321.1
29.622.0
1. 3251.1751. 275
104.6
95.8
27479
32.033.2
11463482
18, 68115. 7579. 344467
7,870
.640
.911
10.1
5. 3
.49
27. 54335, 263
25. 27
38. 215. 916. 9
8.1974,679
81310, 063
58. 532. 1
.82
.28
13, 689
5916. 93
20. 0
22. 216.6
1. 3251. 1751. 275
104. 6
95.8 i
3614
32.733.1
106147497
18. 69615,7589, 345467
7, 903
. 645
.911
2 07°
10.5
5.3
.48
27, 54331, 448
25. 80
37.716.016.9
676. 8176.6146.0305. 748.5
8, 3304, 003
83710. 155
57. 333. 9119. 6
.82
. 28
725. 0415.371.8177. 6
13, 439
5366. 48
4, 205
18.213. 616.010.4
1. 3251.1911. 275
104.6
67. 58365, 54445 451
95.8
38424
32.933.1
* 131205566
18, 74215,753
311,78S472
3 9, 903
.645
.911
11. 5
5.1
.41
30, 76433. 606
26. 23
37.716.316.9
8, 0085, 556
88413, 089
53.138.5
.82
.28
13, 684
7676. 16
3 20. 7
20.614.7
1. 3251. 2051.275
104.6
95.8
5015
32.533.1
100201651
18. 66015. 6539, 538477
8.000
. 650
.920
12.3
5.0
.39
31,68122. 672
26. 73
37.717.017.1
8, 6626, 080
48712, 913
50.435.7
.82
.28
13. 283
8066. 42
16.1
13.76.9
1. 3251. 2263.275
107.1
95.8
6281
31.333. 2
99169699
18, 62515.6568, 563428
7. 220
. 655
. 923
r •) •)] ̂
12 8
.42
33, 38935, 266
26 92
37717.017.8
705 8189 3152. 6313.450 5
9, 1604, 309
51015, 462
47.037 9135. 929. 7
.82
.28
795 5454 774 9
2:)(). 314, 693
7926 25
4 540
16.710.625.914.8
1.4251. 2551. 455
107. 9
63, 78361, 02739, 547
95.8
5871
30.133.2
3 129184760
18. 59115, 596
3 11, 579463
3 9, 74 2
. 655
. 923
11.0
5.1
. 47
33, 70449, 685
26.87
37.717. 017.8
7,4422, 499
52915,367
44.740 3
.78
.28
1 4, 06 1
5(15s. 07
3 22. 7'••> 13. 621.611.8
1.4251.2551.455
107. 9
95. 8
5703
29.433. 3
111165783
18,54315,5219,494475
7,978
. 655
. 923
10.1
4.9
.51
•29. 74423. 996
2 >. 85
37. 717.017.5
6, 6915, 544
43712, 357
43. 641 9
.78
.28
13, 788
940V ^ Pitt
19.010. 621.611.5
1.4501. 2551.455
107. 9
95.8
490
30.733.4
108147797
18, 49215, 4409, 294465
7, 798
. 655
.918
2 231
9.7
4.9
38, 63831, 987
26. 87
38.017.017.7
728 1189 6162.2322 453 9
8 8993, 938
51817,415
41.04s 3137.429. 0
. 78
.28
17,318
677
17.89.417.88.9
1.4501 . 2551. 455
107. 9
68, 14566,15942, 075
95.8
4006
31.733.4
3 132119
IS, 4S415, 3S1
3 1 1 , 503460
3 9, 609
.636
. 913
9.1
5.0
. 57
38, 495
26. 37
37. 716. 517.8
4 (]9 (J
4 52. 7
8, 4983, 664
56312, 287
37. 9£9 t.
. 78
. 28
16, 628
595;> 5 G'-'
321.3311.1
18.59.8
1.4151. 2551.439
107.9
95.8
3814
32. 133. 4
10989726
18, 44215,2929, 481474
7, 892
.631r. 895
9 4
5 1
. 56
25. 95
37.715. 817.8
4 59 ft4 44. 0
9, 0053, 1 99
59211, 578
36. 1
7Sv . 28
16, 612
519
19.27.518.511.5
1.3751.2891. 375
107.9
95.8
3872
32.433. 3
11862649
18,3761 5. 2089 422' 471
7, 836
".631p. 897
25. 11
P 37. 0P 15. 7P 16. 7
4 (54 5M4.8
10.1775, 013
88210,453
34. 960 9
" 78". 28
15, S80
498
19.88.613.86.6
L.3751.3001.375
107. 5
95. 8
32.532. 6
25. 35
1 . 3351. 3001. 375
*New series. Data cover wools, not finer than 46s, and camel hair, duty-free, for use inthe manufacture of rugs, carpets and certain specified items. Prior to the Feb. 1964 SURVEY,imports of apparel class wool were shown; however, the calculated difference between totalwool imports and the former apparel class is not comparable with the present carpet class,since the former "apparel" class included certain coarse wools (finer than 40s but not finerthan 46s) duty-free effective July 1958, for use in carpets, etc. Monthly data for 1959-62 areavailable.
Digitized for FRASER http://fraser.stlouisfed.org/ Federal Reserve Bank of St. Louis
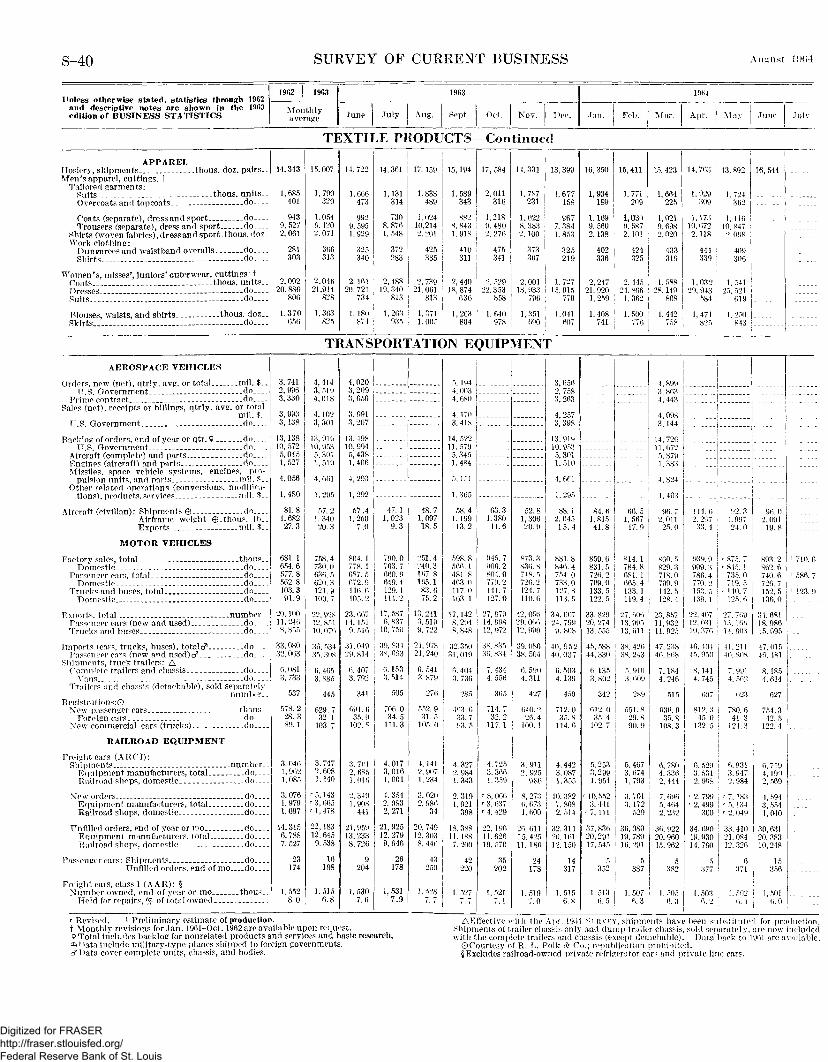
S-40 SUEVEY OF CUERENT BUSINESS August li»('!4
Unless otherwise stated, statistics through 1962and descriptive notes are shown in the 1963edition of BUSINESS STATISTICS
1962 | 1963
Monthlyaverage
1963
June July Aug. Sept. Oct. Nov. Dec.
19fi4
•Tan. Feb. Mar. Apr. May June July
TEXTILE PRODUCTS— Continued
APPARELHosier v, shipments thous. doz. pairs. _Mori's apparel, cuttings: t
Tailored garments:Suits - - thous. units _.Overcoats and topcoats do
Coats (separate) dress and sport doTrousers (separate) dress and sport do-
Shirts (woven fabrics), dress and sport, thous. dozWork clothing:
Dunsrarees and waistband overalls doghirts -- - do
Women's, misses', juniors' outerwear, cuttings: tCoats thous. units, .Dresses doSuits .-do. _
Blouses, waists, and shirts thous. doz._Skirts do
14,343
1,685401
943q 5272, 061
281303
2,00220, 880
806
1,370656
15.007
1,799329
1,0549. 1202.071
366313
2.04621,914
828
1,363825
14,722
1,666473
9929, 5951,929
325340
2, 16120, 721
734
1, 180874
14,361
1,131314
7308, 8761, 548
372283
2,48819, 340
813
1,263935
17, 159
1,838489
1,02410,2142. 201
425335
2,73921. 061
813
1,3711.005
15, 194
1,589343
8828. 8431.918
410311
2, 44018,874
636
1,263804
17, 584
2.011316
1,2189,4802. 276
475341
2, 52922.353
858
1, 640978
14,331
1,787231
1,0228, 3832. 100
373307
2,00118, 933
796
1,351090
13, 399
1,677158
9677. 3841,853
325219
1.72715,915
770
1.041607
16,350
1,934189
1,1699,5602,138
402336
2, 24721, 920
1 . 259
1,408741
15,411
1.771209
1,0309. 5872. 101
424325
2. 44524. 866
1 . 362
1. 500776
15, 423
1,664225
1,0219. 6982. 020
433319
1. 58828. 149
868
1.442758
14, 763
1. 929309
1,17310, 6722.118
444339
1,03229, 943
584
1,471825
13. 892
1.724362
1,11610.847
•2. 098
409306
1. 54125,521
i 619
1.250843
16, 544
TRANSPORTATION EQUIPMENT
AEROSPACE VEHICLES
Orders new (net) Qtrly avg or total mil. $__U S Oovernment do
Prime contract doSales (net), receipts or billings, qtrly. avg. or total
mil $U.S. Government do
Backlog of orders end of year or qtr. 9 doU S Oovernment do
Aircraft (complete") and parts doEnsine^ (aircraft) ind parts doMissiles, spnce vehicle systems, engines, pro-
pulsion units and wr^s mil $Other related operations (conversions, modifiea-
\ircraft (civilian)' Shipments © _ doAirframe weight ®_thous. l b _ _Exports mil $
MOTOR VEHICLES
Factory sales, total thousT)omestic do
Passenger cars, total doDomestic do ..
Trucks and buses total doDomestic _ - - do_
Exports, total number. _Passenger cars (new and used) doTrucks and buses do
Imports (cars, trucks, buses), totalo* doPassenger cars (new and used) of do
Shipments, truck trailers: AComplete trailers and chassis do
Vans doTrailers and chassis (detachable), sold separately
number _ _Registrations:©
New passenger cars thous._Foreign cars do
NTew commercial cars (trucks) __ . do_ __
RAILROAD EQUIPMENT
Freight cars (ARCT):Shipments number
Equipment manufacturers, total doRailroad shops, domestic do
New orders doEquipment manufacturers, total doRailroad shops, domestic -do
Unfilled orders end of year or mo doEquipment manufacturers, total doRailroad shops, domestic - do
Passenger cars: Shipments _doUnfilled orders, end of mo do
Freight cars, class 1 (A AR): §Number owned, end of year or mo thous_
Held for repairs °/c of total owned
3, 7412, 9963, 330
3, 9933, 138
13, 13810 572
5, 0451,527
4,056
1,480
81.81,68227.3
681.1654. 6577. 8562. 8103. 391.9
20, 10011,2468, 855
33, 08032, 063
6, 0813,733
537
578. 228.389. 1
3,0461,9621, 085
3, 0761,9791,097
14,3156,7887,527
174
1.5528.0
4,4143,5194,018
4. 1023, 301
13,91910,9535, 3011 510
4, 661
1 , 295
57 21.340
90. 3
758.4730.0636. 5620.3I9 1.9109. 7
22, 92812] 85110,070
36. 53435. 308
6 4653 885
445
629.732. 1
103.7
3.7472,6081,140
r 5, 143T 3, 665r 1 , 478
22,18312, 6459. 538
16198
1.5156 8
4,0203, 2093, 656
3, 9913, 207
13,49810, 9945, 4381,406
4 293
1, 292
57.41.250
7.0
804. 1778. 1687. 5672. 9116.6105. 2
23, 66714,1519, 516
31,04929,814
6, 4073 792
341
691. (i35. 9
102.8
3,7012, 6851.016
2, 3491 . 908
441
21,95913.2338 726
9204
1,5307.6
47. 11,023
9.3
790. 0763. 7660. 9649. 4129.1114.2
17, 5876, 837
10. 750
39 8343S, 693
6. 1533. 514
505
706. 034.5
111.3
4, 0173, 0161,001
4. 3542. 0832,271
21, 92512.2799, 646
26178
1, 5317.9
48.71,09718.5
251. 4240. 3167. 8165. 183. 675.2
13, 2413. 5199,722
21,97821,240
6. 5413. 879
552. 931. 5
105. 0
4. 1412, 9071, 234
3,0202, 986
34
20, 74912,3038, 446
43250
1 . 528
5. 1944 0034, 680
4,1703, 418
14, 5221 1 . 579
5, 3451,484
5, 151
1 365
58.41.19913.2
598. 8566. 1481.8463.0117.0103. 1
17,1428. 2948.848
32,35031.019
6 4043 736
285
403.633.793. 5
4, 3272,9841,343
2.3191,921
398
18 38811. 188
7. 900
42220
1 . 527
63.31,380
11.6
945. 7906. 2804. 0779. 2141.7127.0
27, 97014, 99812, 972
38, v;3536. 834
7.4344 556
365
714.732.2
117.1
4, 7253. 3661,359
r 8, 066T 3, 637' 4, 429
l>2 1961 1 . 62610,570
35202
1, 5217 i
52 81,30620.9
873 3836. 874 S. 5726. 2I'M. 7110.6
42, 05629. 06612, 990
39. 08638. 504
6 5904 311
427
640. 226.4
100.4
3 9112, 925
986
8 2730, 6731,600
9p, on1 5, 42511 186
94178
1,519" 0
3, 6562 7583, 263
4 2573, 398
13,91910 95:-!5, 3011 510
4 6P1
1 295
88. 12, 04515. 4
881. 8846. 4754. 0733. 0127. 8113.5
34,60724, 7999. 808
40, 95240.037
6 5034 139
459
712.035.8
114.6
4 449
3.0871,355
10,3827, 8682, 514
39 31120.161I9 150
14317
1 . 51 56 8
84 61,81541.8
859. 6831 5726. 2709.0133. 5I99 5
33, 82920. 27413, 555
45, 58844, 330
6 1353 80°
342
612. 035.4
102.7
5,2533,2991 , 954
r 10,5523. 441
r 7, 111
37 83620, 29117 545
5352
1.5136 5
66. 51, 567
17 9
814. 1784 8681. 1665. 4133. 1119.4
27. 601)13.99513,611
38. 42638, 243
5 9103' 609
289
551.829.890. 9
5 4673, 6741.793
3, 7013. 172
529
36 08019, 78916 991
5387
1. 5076 3
4 8993 8634,443
4 0983,144
14 7201 1 6725 8791 383
4 894
1 403
96 72,011
25. 0
860 5829 3718.0700 9142 5128 4
23, 85711,93211,925
47, 23846, 868
7 1844 246
'"636. 935. 8
108 3
6 7804, 3362 444
7, 6965, 4642 232
36 9"20, 96015 962
5382
1 . 5056 3
114 69 99-~33. 4
939 9909 ;•;786. 4770 2153 5139 1
22, 40712.0311 0. 376
46. 10445.950
8 1414 745
607
812.345.0
1 32. 5
6 59<»3,5312 998
1 2, 799r 2, 499
300
34 0^019,93014 760
377
1.5036 9
99 31.997°4 0
r 875 7r 845 1
735. 0719. 5
r 140 7* I9 5. 6
27, 76913, 16ft14,603
41,21140. 808
7 9014' 5fi9
023
780.641.3
124 3
6 9313. 9470 984
r 7. 183' 5, 134r 2 049
33 41021.0841° 396
6371
1 . 5026 1
96 02. 091
19 8
893 2869 6740. 6790 7159 5136 0
34, 68118,9861 5. 695
47.01546. 481
8 1854 614
627
754. 342.5
199 4
6 7*94,1909 509
4, 5943,5541 040
30 63120, 38310 948
15356
1 , 5016 0
1 710 61 586. 7
1 123 9
r Revised. l Preliminary estimate of production.t Monthly revisions for Jan. 1961-Oct. 1962 are available upon request.9 Total includes backlog for nonrelated products and services and basic research.^i>ata include military-type planes shipped to foreign governments.cfData cover complete units, chassis, and bodies.
AKfTective with the Apr . 19.14 S T R V K Y , shipments have been subs t i t u t ed for production.Shipments of trailer chassis only and dump trailer chassis, sold separately, are now includedwith the complete trailers and chassis (except detachable). Data back to 1901 are available.
©Courtesy of R. L. Polk & Co.; republieation prohibited.§ Excludes railroad-owned private refrigerator cars and private line cars.
Digitized for FRASER http://fraser.stlouisfed.org/ Federal Reserve Bank of St. Louis
INDEX TO CURRENT BUSINESS STATISTICS, Pages S1-S40
SECTIONS
General:Business indicators 1-7Commodity prices 7, 8Construction and real estate 9, 10Domestic trade 10-12
Employment and population 12-16Finance 16-21Foreign trade of the United States 21-23Transportation and communications 23, 24
Industry:
Chemicals and allied products 25Electric power and gas 26Food and kindred products; tobacco 26-30Leather and products 30, 31
Lumber and products 31Metals and manufactures 3 2-34Petroleum, coal, and products 35, 36Pulp, paper, and paper products . 36, 37
Rubber and rubber productsStone, clay,, and glass productsTextile productsTransportation equipment _
3738
38-4040
INDIVIDUAL SERIESAdvertising 10, 11,16Aerospace vehicles.._ 40Agricultural loans 16Air carrier operations 23Aircraft and parts 3, 13-15, 40Alcohol, denatured arid ethyl 25Alcoholic beverages 8, 10, 26Aluminum 23, 33Appare! 1, 3, 4, 7, 8, 10-15, 40Asphalt arid tar products 35, 36Automobiles, e t c___ 1, 3-6, 8, 10, 11, 13-15, 19, 22, 40
Balance of international payments 2Banking 16, 17Barley 27Barrels and drums 33Battery shipments 34Beef and veal 28Beverages 4, 8, 10, 26Blast furnaces, steel works, etc 13-15Bonds, outstanding, issued, prices, sales,
yields 18-20Brass and bronze 33Brick 38Broker's balances 20Building and construction materials. 8,10, 31, 36, 38Building costs 9, 19Building permits 9Business incorporations (new), failures 7Business population 2Business sales and inventories 4, 5Butter 27
Cans (tinplate) 33Carloadings 24Cattle and calves 28Cement and concrete products 8-10, 38Cereal and bakery products 8Chain-store sales, firms with 4 or more and 11
or more stores 12Cheese 27Chemicals 4-6, 8, 13-15, 19, 22, 25Cigarettes and cigars 8,30Civilian employees, Federal 14Clay products 8,38Coal 4, 8, 13-15, 22, 24, 35Cocoa 23, 29Coffee 23,29Coke 24, 35Communications 2, 13-15, 20, 24Confectionery, sales 29Construction:
Contracts 9Costs 9, 10Employment, hours, earnings, wages 13-16Highways and roads 9, 10Housing starts 9New construction put in place 1, 2, 9
Consumer credit 17, 18Consumer expenditures 1, 2Consumer goods output, index 3, 4Consumer price index 7Copper 23, 33Corn 27Cost of living (see Consumer price index) 7Cotton, raw and manufactures 7r S, 22, 38, 39Cottonseed cake and meal and oil 30Credit, short - and intermediate-term 17, 18Crops 3, 7, 27, 28, 30, 38Crude oil and natural gas _ 4, 13-15, 35Currency in circulation 19
Dairy products 3, 7, 27Debits, bank 16Debt, U.S. Government 18Department stores 11, 12, 17Deposits, bank 16, 17, 19Disputes, industrial 16Distilled spirits 26Dividend payments, rates, and yields 1, 3, 18-21Drug stores, sales 11,12
Earnings, weekly and hourly 14-16Eating and drinking places 11, 12Eggs and poul t ry___ 3, 7, 29Klectric power 4, 8, 26Electrical machinery and equipment 3,
5,6, 13-15, 19,22,34Employment estimates 12-14Employment Service activities 16Expenditures, U.S. Government 18Explosives 25Exports (see also individual commodities) 1,
2,21-23Express operations 23
Failures, industrial and commercial 7Fans and blowers 34Farm income, marketings, and prices 1, 3, 7Farm wages 16Fats and oils 8, 22, 29, 30Federal Government finance 18Federal Reserve banks, condition of 16Federal Reserve member banks 17Fertilizers 8, 25Fire losses 10Fish oils and fish 29Flooring, hardwood 31Flour, wheat 28Food products.— 4-8, 10, 11, 13-15, 19, 22, 23, 27-30Foreclosuress real estate 10Foreign trade (see also individual commod.) 21-23Foundry equipment 34Freight carloadings 24Freight cars (equipment) 4, 40Fruits and vegetables 7, 8, 22Fuel oil 35, 36Fuels 4, 8, 35, 36Furnaces 34Furniture 3, 4, 8, 11-15, 17Furs 23
Gas, output, prices, sales .revenues 4, 8, 26Gasoline, 1,35,36Glass and products 38Glycerin 25Gold 19Grains and products 7, 8, 22, 24, 27, 28Grocery stores 11, 12Gross national product 1, 2Gross private domestic investment 1, 2Gypsum and products 8, 38
Hardware stores 11Heating equipment 8,34Hides and skins 8, 30Highways and roads 9, 10Hogs 28Home Loan banks, outstanding advances 10Home mortgages 10Hosiery 40Hotels 14, 15, 24Hours of work per week 14Housefurnishings 1, 4, 7, 8, 10-12Household appliances and radios 4, 8, 11, 34Housing starts and permits 9
Imports (see also individual commodities). 1, 2,22, 23Income, personal 2, 3Income and employment tax receipts 18Industrial production indexes:
By industry 3, 4By market grouping 3, 4
Installment credit 12,17, 18Installment sales, department stores 12Instruments and related products 3, 13-15Insulating materials 34Insurance, life 18, 19Interest and money rates 17Inventories, manufacturers' and trade 4-6, 11,12Inventory-sales ratios 5Iron and steel._ 3, 5, 6, 8, 10, 13-15,19, 22, 23, 32, 33
Labor advertising index, disputes, turnover 16Labor force 12Lamb and mutton 28Lard 28Lead 33Leather arid products 3, 8, 13-15, 30, 31Life insurance 18, 19Linseed oil _ _ 30Livestock 3, 7, 8, 24, 28Loans, real estate, agricultural, bank, brokers'
(see also Consumer credit) 10, 16, 17, 20Lubricants 35, 36Lumber and products 3, 8, 10-15, 19, 31
Machine tools 34Machinery 3, 5,6,8, 13-15, 19,22,34Mail order houses, sales 11Manrnade fibers and manufactures 8, 39Manufacturers' sales (or shipments), invento-
ries, orders 4-6Manufacturing employment, production work-
era, payrolls, hours, earnings 13-15Manufacturing production indexes 3, 4Margarine 29Meat animals and meats 3, 7, 8, 22, 28Medical and personal care 7Metals 3-6,8, 13-15,19,22,23,32-34Milk 27Mining and minerals 2-4, 8, 13-15, 19, 20Monetary statistics 19Money supply 19Mortgage applications, loans, rates 10, 16, 17Motor carriers 23, 24Motor vehicles 1, 3-6, 8, 10, 11, 13-15, 19, 22, 40Motors and generators 34
National defense expenditures...... _...._........_... lt 18National income and product-.**,«•-*—«-.¥.
1^- 1,2National parks, visits , _*....„..„._,. *,,*. , 2 4Newsprint „ , < ...-'3J3, 37New York Stock Exchange, selected data .„.•.. 20, 21Nonferrous metals fc 3» 8,10, 23,33,34Noninstallment credit - . '......«....*,«;.. 17»18Oats , *..j. • 27Oil burners . ...i.-.*.....,..*,....',.. • 34Oils and fats „ 8, 22,29,30Orders, new and unfilled, manufacturer!*......., 6Ordnance ......I. -13-15
Paint and paint materials. ........,...-,»' 8, 25Panama Canal traffic ~. ......̂ - 24Paper and products and pulp .< . 3,
Parity ratio , ...... -.„ 7Passports issued .,.„...„.»_..,.. ,24Payrolls, indexes .„.', „. ... 14Personal consumption expenditures.......... „... 1, 2Personal income . .-...-.,„»..... 2,3Petroleum and products.—: «. ,*„.». . 4-*6t
8,11,13-15,19,22. 23,35,36Pig iron k-.*... 32Plant and equipment expenditures.,.-....„..,.... 2, 20Plastics and resin materials..--...,..-......,.... 25Population . ,„.,....,... ' 12Pork . .̂ ., 28Postal savings .........„., «,. ' -17Poultry and eggs , „...„—. --.3, 7,29Prices (see also individual commodities)-„ . 7, 8Printing and publishing .„._.-.*......... 4,13-15Profits, corporate fc ... . 1,19Public utilities 2-4, 7-9,13-15,18-21Pullman Company . ..,.-... ....- 24Pulp and pulpwood - . —... 36Purchasing power of the dollar 8
Radiators and con vectors.. ... '...„..... . 34Radio and television 4, 8,10,11, 34Railroads 2, 13,14,16,18, 20, 21, 24, 40Railways (local) and bus lines 13-15, 23Rayon and acetate . , 39Real estate 10,17,18Receipts, U.S. Government . .* 18Recreation , . 7Refrigerators and home freezers-.-- ....... 34Rent (housing) , , .. 7Retail trade 4, 5, 7,11-15,17,18Rice 27Roofing and siding, asphalt .-—...„ .... 36Rubber and products(incl. plastics) 4-6,
8,13-15,23,37Rye ._.._ . ... 27
Saving, personal . ...... . ....... 2Savings deposits ......... 17Securities issued ............. .— 19, 20Security markets ..... .. .... ._. 20,21Services „.., 1,2, 13-15Sheep and Iambs ..... ................. 28Shoes and other footwear „„... 8,11,12, 31Silk, prices, imports, production.. !.. 8,39Silver ^ 19Soybean cake and meal and oil .a. 30Spindle activity, cotton ... .... 39Steel ingots and steel manufacture*-,.., 32,33Steel scrap . ..I k.. 32Stock prices, earnings, sales, etd . 20, 21Stone, clay, glass products 3-5,8,13-15,19,38Stoves and ranges .... 34Sugar >—. .. 23, 29Sulfur 25Sulfuric acid . 25Superphosphate . . .. 25
Tea imports 29Telephone, telegraph, cable, and radiotele-
graph carriers . ............. 13-15,24Television and radio 4,8; 10,11, 34Textiles and products.. 3, 5, 6, 8,13-15,19, 22,38-40Tin ,. 23,33Tires and inner tubes 8, II, 12, 37Tobacco and manufactures 4-8, 10,13-15i 22, 30Tractors 22,34Trade (retail and wholesale) 4,5,11, 12Transit lines, local . '' 23Transportation 1,2, 7,13-15,23,24Transportation equipment 3HI, 13-15,19,40Travel ,... 23, 24Truck trailers , . , 40Trucks (industrial and other) ... ... . . 34,40
Unemployment and insurance................. 12,16U.S. Government bonds . 16-18, 20U.S. Government finance.......... ! . 18Utilities 2-4, 9,13-15,18-21, 26
Vacuum cleaners .... ..... 34Variety stores .. .. 11,12Vegetable oils . ..... 30Vegetables and fruits. ...... 7,8, 22Vessels cleared in foreign trade ........... 24Veterans'benefits ; „+* 16,18
Wages and salaries ..—.— 1,3,14-16Washers and driers « ...... ..._.„..._ 34Water heaters , ' 34Waterway traffic . ._ 24Wheat and wheat flour 28Wholesale price indexes ... ..... 8Wholesale trade 4, 5, 7,13-15Wood pulp .....—....— 36Wool and wool manufactures . 7,8, 23,39
Zinc _.. -33,34Digitized for FRASER http://fraser.stlouisfed.org/ Federal Reserve Bank of St. Louis

UNITED STATESGOVERNMENT PRINTING OFFICEDIVISION OF PUBLIC DOCUMENTS
WASHINGTON, D.C. 2O4O2
PENALTY FOR PRIVATE USE TO AVOIDPAYMENT OF POSTAGE, $30O
(GPO)
OFFICIAL BUSINESS
First-Class Mail
ASupplement
to theSurvey
ofCurrent
businessTAT
S I N C E 1 9 2 9
* FIRST COMPREHENSIVE ACCOUNT OF THE WIDELY USED STATE INCOME SERIES
* PERSONAL INCOME BY STATE, BY TYPE, AND BY 1NDUSTRY-SINCE 1929
* ANALYSIS OF GEOGRAPHIC INCOME CHANGES - PROCEDURES AND DEFINITION
THIS 1957 VOLUME—229 pages, quarto, illustrated, $1.50—is available from the Superintendent of Documenfs, U.S.Government Printing Office, Washington, D.C., 20402, as well as at all Field Offices of the U.S. Department of Commerce.
Digitized for FRASER http://fraser.stlouisfed.org/ Federal Reserve Bank of St. Louis