+ All Categories
Home > Documents > Scenario-Based Scales Measuring Cultural Orientations of Business Owners

Scenario-Based Scales Measuring Cultural Orientations of Business Owners

Date post: 01-Jan-2016
Category:
Upload: elmo-wyatt
View: 18 times
Download: 0 times
Share this document with a friend
Description:
Scenario-Based Scales Measuring Cultural Orientations of Business Owners Christine Koenig, Holger Steinmetz, Michael Frese, Andreas Rauch University of Giessen, Germany Zhong-Ming Wang University of Zhejiang, China. Introduction. - PowerPoint PPT Presentation
Popular Tags:
21
Scenario-Based Scales Measuring Cultural Orientations of Business Owners Christine Koenig, Holger Steinmetz, Michael Frese, Andreas Rauch University of Giessen, Germany Zhong-Ming Wang University of Zhejiang, China
Transcript

Scenario-Based Scales Measuring Cultural Orientations of Business Owners

Christine Koenig, Holger Steinmetz, Michael Frese, Andreas RauchUniversity of Giessen, Germany

Zhong-Ming WangUniversity of Zhejiang, China

2

Introduction

The scales differ from other scales commonly used in cross-cultural research:

- Instead of measuring culture at the aggregate level, the scales measure cultural orientations at the individual level.

- Instead of being based on Likert items, the scales are based on scenarios.

3

Individual-Level Measurement

Cross-cultural studies on individual business owners should measure cultural orientations rather than culture.

Cultural orientations are manifested in practices and values of individuals.

Among the manifestation of cultural orientations, we consider practices to be more relevant for studying business owners than values.

4

Individual-Level Measurement

We are not aware of any cultural orientation scales measuring practices that are suitable for business owners.

Therefore, we developed cultural orientation scales that measure the practices owners apply in their businesses.

5

Individual-Level Measurement

The scales measure seven cultural orientations:

- uncertainty avoidance- power distance- collectivism- assertiveness- future orientation- humane orientation- performance orientation

6

Scenario-Based Measurement

Cultural orientations should be measured using scales based on scenarios rather than using scales based on Likert items.

Likert items and scenarios differ in the measurement of cultural orientations.

7

Scenario-Based Measurement

Scales based on Likert items tend to hold lower cross-cultural validity than scales based on scenarios:

- Likert items are more likely to be interpreted differently by people from different cultures than scenarios.

- Likert items are more affected by the reference group effect than scenarios.

8

Development

We developed the cultural orientation scales in a team of Chinese and German researchers.

We created scenarios that consist of social situations and behavioral options.

The social situations describe problems owners may encounter in their businesses.

Each of the social situations represents one of the cultural orientations.

9

Development

The behavioral options describe behaviors owners may show to solve the problems.

The first option represents of low score on the cultural orientation, whereas the second option represents a high score.

Between the two behavioral options, there are two mirror-inverted three-point scales.

10

Sample Scenario

11

Participants

Among the 461 owners who completed the scales, were 260 Chinese and 201 German owners.

They were not only owners but also managers of their businesses and had at least one employee.

Their businesses belonged to information technology, hotel and catering, automobile, or construction industry.

12

Cross-Cultural Validation

To ascertain whether the cultural orientation scales hold cross-cultural validity, we tested five forms of invariance:

- configural invariance- metric invariance- scalar invariance- factor variance invariance- error invariance

13

Configural Invariance

The model of configural invariance comprised 23 scenarios that measured the seven cultural orientations.

15

Configural Invariance

The model of configural invariance comprised 23 scenarios that measured the seven cultural orientations.

The model of configural invariance provided adequate fit (Chi2(418) = 603.45; RMSEA = .044; CFI = .94).

16

Metric Invariance

The factor loadings were constrained to be equal across the Chinese and the German samples.

The model of full metric invariance achieved adequate fit (Chi2(434) = 628.26; RMSEA = .044; CFI = .93).

17

Scalar Invariance

The item intercepts were restricted to be equal across the Chinese and the German samples.

The model of partial scalar invariance achieved adequate fit (Chi2(446) = 641.92; RMSEA = .044; CFI = .93).

Given metric and scalar invariance, the means of the seven cultural orientations can be meaningfully compared across both samples (Steenkamp & Baumgartner,1998).

18

Factor Variance Invariance

The factor variances were constrained to be equal across the Chinese and the German samples.

The model of partial factor variance invariance provided adequate fit (Chi2(451) = 646.71; RMSEA = .044; CFI = .93).

Given metric and partial factor variance invariance, different covariances can be interpreted as different correlations for the remaining five cultural orientations (Marsh & Hocevar, 1985).

19

Error Variance Invariance

The error variances were restricted to be equal across the Chinese and the German samples.

The model of partial error variance invariance achieved adequate fit (Chi2(463) = 664.85; RMSEA = .044; CFI = .93).

Given metric and factor variance invariance, this result implies that the Chinese sample showed a lower reliability in half of the scenarios.

20

Conclusion

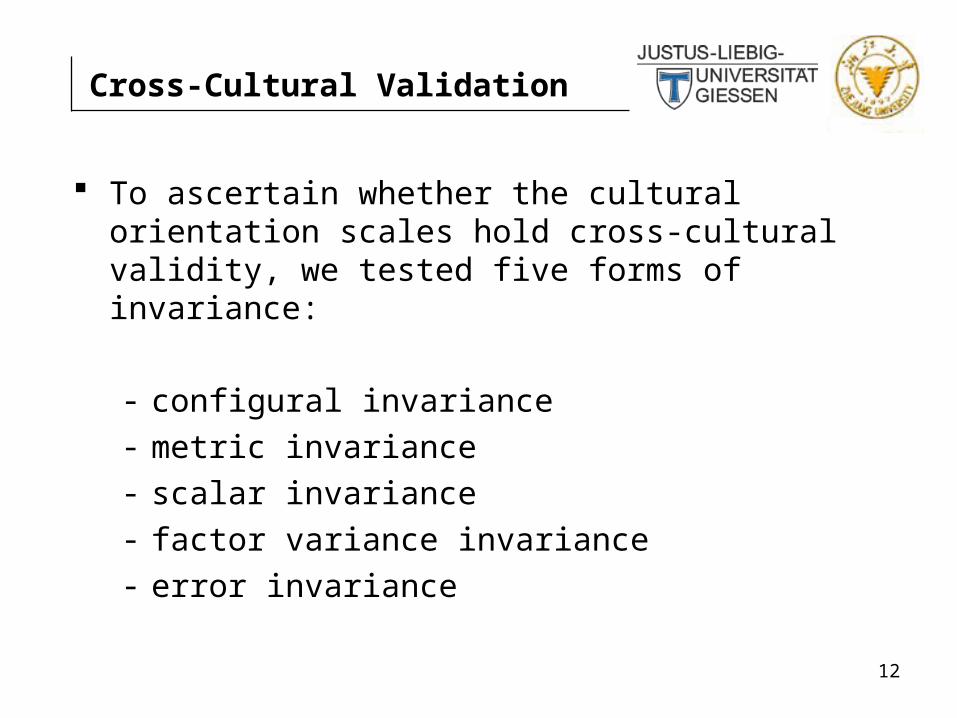
All five forms of invariance were at least partially supported.

Given metric and scalar invariance, the means of the seven cultural orientations can be meaningfully compared across the Chinese and the German samples.

Given metric and factor variance invariance, different covariances can be interpreted as different correlations – except for uncertainty avoidance and assertiveness.

Given metric invariance, regression coefficients can be compared across the Chinese and the German samples.

Thank you very much for your attention.


Recommended