Middle East North Africa Sustainable Electricity Trajectories Energy Pathways for Sustainable Development in the MENA Region Summary of workshop results: Scenario development and multi-criteria analysis for Tunisia’s future electricity system in 2050 Authors Sarra Amroune (Wuppertal Institute) Marina Blohm (Europa-Universität Flensburg) Sönke Bohm (Europa-Universität Flensburg) Shahrazad Far (Bonn International Center for Conversion) Ole Zelt (Wuppertal Institute)
Transcript
Middle East North Africa Sustainable Electricity Trajectories
Energy Pathways for Sustainable Development in the MENA Region
Summary of workshop results:
Scenario development and multi-criteria analysis for Tunisia’s future electricity system in 2050
Authors
Sarra Amroune (Wuppertal Institute) Marina Blohm (Europa-Universität Flensburg) Sönke Bohm (Europa-Universität Flensburg) Shahrazad Far (Bonn International Center for Conversion) Ole Zelt (Wuppertal Institute)
The energy and environmental management (EEM) department at Europa-Universität
Flensburg has two core fields of research activity aiming at a sustainable development of
energy systems: the development of local and regional climate protection schemes and
the analysis and development of energy systems going 100% renewable. EEM is part of
the interdisciplinary cross-university Centre for Sustainable Energy Systems (ZNES).
As an independent, non-profit organization, BICC (Internationales Konversionszentrum Bonn—Bonn International Center for Conversion) deals with a wide range of global topics in the field of peace and conflict research centring on Conversion Studies. Our vision is a more peaceful world. Our mission is to conduct critical, problem-oriented, policy-relevant research in response to the problems posed by organized violence.
The Wuppertal Institute undertakes research and develops models, strategies and
instruments for transitions to a sustainable development at local, national and
international level. Sustainability research at the Wuppertal Institute focuses on the
resources, climate and energy-related challenges and their relation to economy and
society. The division “Future Energy and Mobility Structures” involved in this project is
working on these questions from a technical and systems analytical point of view.
Summary Within the framework of the research project Middle East North Africa Sustainable Electricity Trajectories (MENA SELECT), a two-day workshop was conducted in the Hotel Africa in Tunis, Tunisia on 19 and 20 October 2017. Stakeholder representatives from different national societal groups related to energy issues were invited to discuss and develop future scenarios of Tunisia’s power supply with the help of an advanced spreadsheet model, followed by an evaluation of the developed scenarios. In this Paper, the results of the workshop are summarized.
The objective of the workshop is two-fold. In the first part of the workshop, the participants were introduced to the modelling approach. Central input parameters, procedures and assumptions were presented. This formed the basis for the subsequent development of scenarios for Tunisia’s electricity system in 2050. Using the spreadsheet model, the participants developed four consistent scenarios (Mix; Mix+Solar; 5GW Mix; Solar+Gas), featuring a wide range of renewable energy shares from approximately 27 to 100 per cent of the future national electricity production.
In the second part of the workshop, the participants ranked the developed scenarios according to their preferences. For this purpose, they conducted a multi-criteria analysis, which included quantitative and qualitative criteria for fossil- and renewables-based energy technologies. Representing the position of their respective institutions, the participants weighted the selected criteria against each other and ranked the four electricity scenarios mentioned above in combination with the criteria performance for each technology. The calculated ranking showed that the Tunisian stakeholder representatives much preferred a scenario with a share of 100 per cent renewables in 2050 over any other scenario.
In taking into account technical, economic, environmental and social parameters, the participants of the workshop successfully developed widely accepted options for Tunisia’s future power supply.
3.2 Weighting process and stakeholder group identification ........................................................18
3.3 Discussion and results of the weighting processes ....................................................................19
3.4 Finding a consensus ................................................................................................................................21
3.5 Ranking of the scenarios .......................................................................................................................22
The Middle East and North African (MENA) region is facing a number of challenges such as dependency on fluctuating energy imports, growing energy demand due to population growth, an increase in living standards, as well as impacts of climate change resulting in energy-intensive tasks such as cooling and desalination. Currently, there are several options to satisfy the growing energy demand, namely by using renewable energy sources, further developing fossil fuels including oil, coal and gas but also unconventional sources such as shale oil and by using nuclear power. The large-scale deployment of any of these options will not only lead to a transformation of the current energy systems (what is referred to as ‘energy transition’) but a transformation of the societies in the MENA region. Like in any transition process, different stakeholder groups express different views and perspectives regarding the various options available. Therefore, there is a need for participatory governance of this energy transition to identify compromise solutions among different stakeholder groups. This can be achieved by addressing differences in views, opinions and perceptions.
Several academic and policy-oriented research has tackled the technical and economic factors of energy transitions in general and in the MENA region, including Tunisia, in particular. However, there is little knowledge about societal factors, such as public perception, conflicting opinions or perceptions about costs, benefits and risks of an energy transition, and it is almost non-existent for the MENA region.
And this is exactly the novelty of the MENA SELECT project: It provides a combination of qualitative and quantitative research methods, which include scenario-modelling and multi-criteria decision-making, but also involves stakeholders in the modelling exercises, which goes far beyond the traditional “research dissemination”. The research methods used in this project also include participatory modelling, which allows for a deep and comprehensive stakeholder feedback.
The MENA SELECT project is financed by the German Federal Ministry of Economic Cooperation and Development. The project is carried out by a consortium led by the Bonn International Center for Conversion (BICC) and consisting of the Europa-Universität Flensburg (EUF), Germanwatch, International Institute for Applied Systems Analysis (IIASA) and Wuppertal Institute (WI). The project consists of four work packages (WP), which are led by different partners:
- WP1 (IIASA and EUF) deals with the techno–economic modelling of different electricity pathways up to 2050 based on participatory electricity modelling workshops with national stakeholders,
- WP2 (Germanwatch, IIASA and BICC) deals with social, political, economic and ecological effects of eight of the most widely deployed or deployable technologies (renewables and non-renewables based), as perceived by different stakeholders,
- WP3 (WI) combines results of WP1 and WP2 to evaluate the developed scenarios based on predefined criteria using multi-criteria analysis,
- WP4 includes dissemination efforts conducted by all project partners.
The project further involves several local partners in the MENA region in the countries covered by the project such as MENARES (MENA Renewables and Sustainability Institute) from Morocco, the University of Jordan and ECO-Ser from Tunisia.
1.2 Workshop objectives
The workshop “Shaping Tunisia’s future electricity system” took place on 19 and 20 October 2017 in the Hotel Africa in Tunis, Tunisia. It was organized by the Bonn International Center for Conversion (BICC), the Europa-Universität Flensburg (EUF) and Wuppertal Institute (WI), Germany, as well as by the Tunisian partner, ECO-Ser.
The goal of this workshop was to develop future scenarios for Tunisia’s electricity pathways for the year 2050. The workshop covered research questions of two work packages of the MENA SELECT project, namely the participatory development of consistent scenarios of Tunisia’s future power system (WP1) and a participatory assessment of the acceptability of these scenarios (WP3). In the framework of WP1, on Day One of the workshop, participants developed consistent scenarios of Tunisia’s future energy system. In the framework of WP3, on Day Two of the workshop, participants weighted different criteria tackling social, techno–economic and environmental impacts of the power system. These weightings were then used to rank these scenarios from Day One according to the stakeholders’ preferences.
The workshop facilitated dialogue and exchange of views and information among different stakeholder groups and thereby provided a mutual learning opportunity. Throughout the whole workshop, participants discussed technical, economic, social and environmental aspects of energy scenario settings for Tunisia.
BICC, EUF and WI extend their thanks to Mr Sami Marrouki and Dr Ing Rami El Golli from ECO-Ser not only for organizing the workshop but also for their enthusiasm in moderating it. Without them, the workshops would not have been as successful as they were in attaining the objectives of the research tasks.
1.3 Workshop participants
The goal of the workshop was to provide a platform for the variety of Tunisian stakeholders from different sectors, such as policymakers, academia, the private sector, NGOs and civil society. Altogether, a group of 27 high-level participants joined this event.
The workshop participants were representatives of the following sectors and companies:
Decision-makers and policymakers
Ministère des Affaires Locales et de l’Environnement (MALE)
Agence Nationale de la Maîtrise de l’Energie (ANME)
Tunisian Parliament— Commission on Energy and Mines
Ministère de l’Energie, des Mines et des Energies Renouvelables (MEMER)
Société Tunisienne de l’Électricité et du Gaz (STEG)
Academia
Institut Supérieur de Gestion Industrielle
University of Gafsa
Institut Tunisien de Compétitivité et des Etudes Quantitatives (ITCEQ)
Institut national des sciences appliquées de Tunis (INSAT)
Ecole Nationale d’Ingénieurs de Gabès (ENIG)
Ecole Polytechnique de Tunisie
Private sector
Shams Technology
Enerciel
KfW
NGOs and civil society
Secrétariat du partenariat tuniso-allemand de l’énergie
Association Tunisienne de l’Environnement et de la Nature de Gabès
Association Nouvelle Vision Zarzis
Association de Protection de l’Environnement et du Développement
Durable de Tataouine
Zero Waste Tunisia
Tunisie Recyclage
Réseau Alternatif des Jeunes de Tunisie
Association Tunisienne de la Défense Sociale
Agence Nationale de la Protection de l’Environnement (ANPE)
2 Modelling electricity systems
2.1 Fundamentals of modelling
Modelling scenarios of a country’s future power system are crucial to identifying the available technical options, analyze their interaction and assess their impact on technical requirements and on system cost. While there are various software solutions available for energy-system modelling, the approach of using an open-source model and open-source data is essential to achieving high transparency of modelling inputs and
procedures as well as reproducibility of modelling results, thus credibility. Another advantage of such open-source models is the fact that they are usually free of charge.
The RENPASSG!S model, developed by Europa-Universität Flensburg, Germany, is an open-source energy system simulation model. RENPASSG!S is an acronym for renewable energy pathways simulation system that also uses geographical information, e.g. as processed with a geographical information system (GIS). During the workshop, a simplified spreadsheet version was used due to the complexity of the RENPASSG!S model that would incorporate the model’s main functionalities. Simulations with the full RENPASSG!S model would have required longer computation times, whereas the use of the spreadsheet model allowed the participants to easily adjust input data and instantly generate scenario results including information about system cost, potential power shortages and excess power.
The main elements of the model’s structure are illustrated in Figure 1.
Figure 1
Basic structure of the RENPASSG!S model
Source: Berg et al., 2016
The load curve for the year of analysis (2050) was a key input to the model as the overall goal was to have the load covered by electricity production from power plants in the system in every hour of the year. In the model, the power plants, again, were represented using technical and economic data. Meteorological data such as solar radiation, precipitation and wind speeds in a high temporal and spatial resolution were basic inputs to the simulation of electricity production from renewable energy sources. Technical parameters such as the efficiency and the service life of power plants as well as their fuel consumption were important inputs to the operational simulation of
different types of power plants. Moreover, the transmission grid between defined grid regions was incorporated in the model to analyze transmission requirements and a potentially required grid extension. All technical components were also related to financial input data such as capital and operational expenditures to calculate technology-specific cost as well as total system cost.
In the model, intermittent electricity production from wind and solar energy was subtracted from the load curve, which resulted in the so-called residual load curve. A positive residual load requires additional power generation from other sources while a negative residual load reflects surplus power in the system that needs to be handled, e.g. stored. In case of a positive residual load, dispatchable technologies are required to operate to cover the demand. In the full model, the order of the utilization of the dispatchable power plants is based on their merit order, which means the technology with the lowest marginal costs would operate first. In the spreadsheet model, the order of utilization of dispatchable technologies was pre-defined, based on the technologies’ marginal cost.
Depending on the use of power plants and their cost structures, the model calculated the levelized costs of electricity (LCOE) of the whole system and all its technologies, of a potentially necessary grid expansion and storage for all the scenarios.
Tunisia was regarded as an isolated energy system in the model, i.e. potential transmission links to neighbouring countries were disregarded. This approach reflects the assumption that the domestic power demand in 2050 is covered by domestic energy sources only. This is the toughest test: If working scenarios were found under this condition, any other system setting that would include cross-border transmission would work, too.
2.2 Input and output parameters
As in the country cases of Morocco (cf. Berg et al., 2016) and Jordan (cf. Amroune et al., 2017), consistent scenarios of Tunisia’s power supply in the year 2050 were developed in the first part of the MENA SELECT research project workshop. To have the load covered in every hour of the year of analysis, the installed capacities in Tunisia’s future power system were therefore adjusted in the model during the workshop. Additionally, the workshop participants were able to adjust further input parameters. All inputs, including load data, meteorological data, technical data and economic data as well as the assumed regional breakdown of the country were introduced to the workshop participants. All inputs were based on literature research, expert judgment and insights gained during the workshop.
With the model, hourly-resolved scenarios for Tunisia’s power supply in the year 2050 were calculated. Additionally, the development until 2050 including intermediate targets (ANME, 2012) was considered in the calculations.
As in the other country cases, Tunisia was spatially split into four regions, based on the existing transmission grid infrastructure and the expected energy yield of renewable
energies which again was primarily based on meteorological data. For the calculations, an hourly resolved load curve was derived from data from STEG (2014, 2015). It was normalized, scaled according to the expected load level in 2050 and then again segregated to regional load curves under consideration of region sizes and the population density in the regions. Even though Tunisia’s future power demand will depend on several factors and thus cannot be predicted exactly, research has shown that the country might face an annual power demand of approx. 70 TWh in 2050 (based on Trieb et al., 2015). During the workshop, the workshop participants agreed to work with that value in all calculations. That demand level reflects a comparably strong increase in power demand in relation to today’s level and other research studies on Tunisia’s future power demand (cf. ANME, 2015, Trieb et al., 2015). Its use in the calculations, therefore, corresponds to a rather conservative approach. With the capacities in the developed scenarios, any other scenario with a lower demand level would also work.
As presented, all relevant technologies of the power system were taken into account in the model including renewable and conventional power-generation, storage options and the transmission grid between the defined regions. Additionally, ramping durations and minimum downtimes of dispatchable technologies, efficiencies and fuel inputs were considered in the model.
To model a region-specific production, all installed capacity was allocated to the defined regions in the model. For every region, one meteorological measuring point was selected (cf. NASA, 2017), representing the respective regional wind speed and solar radiation conditions. Data from these measuring points was pre-processed in combination with technical characteristics of wind power, solar PV and CSP to use normalized production curves in the model. In that pre-process, power curves were taken into account for wind power, and the SAM software (cf. NREL, 2017) was used to derive production curves of solar PV and CSP. CSP in the model was regarded to be a partly dispatchable technology, as it would produce electricity based on the solar conditions on the one hand andbe able to respond to the demand in the system on the other.
In the model, economic parameters of all technologies were taken into account. This implied capital expenditures (CAPEX), operational expenditures (OPEX) as well as fuel costs, also in their evolvement over time. Moreover, the expected service life and interest rates (weighted average cost of capital, WACC) of all technologies were included in the model.
All technologies were considered independently from each other due to modelling restrictions in the model. In practice, however, there might be combinations of technologies, e.g. CSP combined with gas-fired power plants, which again would result in different installation figures and cost. This issue was not dealt with in the workshop and should be subject to further research work.
The existing transmission capacity between the defined regions was based on GIZ (2013), Balghouthi et al. (2016) and the authors’ calculations. In the calculations, the residual load in the regions was determined and compared to the existing transfer capacity between the regions. In the model, potential shortage or excess power in the
regions were identified, and potentially necessary transfer capacity was added to the system. In practice, the exact future transmission requirement will depend on the exact location of the installed capacity and the loads.
The workshop participants agreed to take pumped hydro storage into account as the only alternative to domestically stored electrical energy. Battery technologies were therefore not included in the scenario simulations.
Several output parameters from the scenario calculations were fed into the successive multi-criteria analysis (MCA, cf. Chapter 3) during the workshop. This comprised the energy amounts produced by the different technologies in the year of analysis and their respective shares in the installed production capacity. Moreover, the fuel input for the power generation of conventional power plants was calculated and converted into direct CO2 emissions.
For the calculation of the specific costs of the system in 2050, the CAPEX of the installed capacity including storage and potentially necessary grid enhancements until and in the year 2050 were annuitized, supplemented by the OPEX and fuel cost in 2050. The total annual cost was divided by the electricity produced, resulting in levelized cost of electricity (LCOE) of the system.
2.3 Scenarios of Tunisia’s electricity future in 2050
With the spreadsheet model, the workshop participants developed four consistent scenarios of Tunisia’s power supply in the year 2050. During this process, the stakeholders’ preferences stated at the beginning of the workshop were taken into account. A crucial aspect of the accompanying discussion was to consider the creation of such scenarios as an exercise that aimed at obtaining a deeper understanding of available options and their impacts on the overall system.
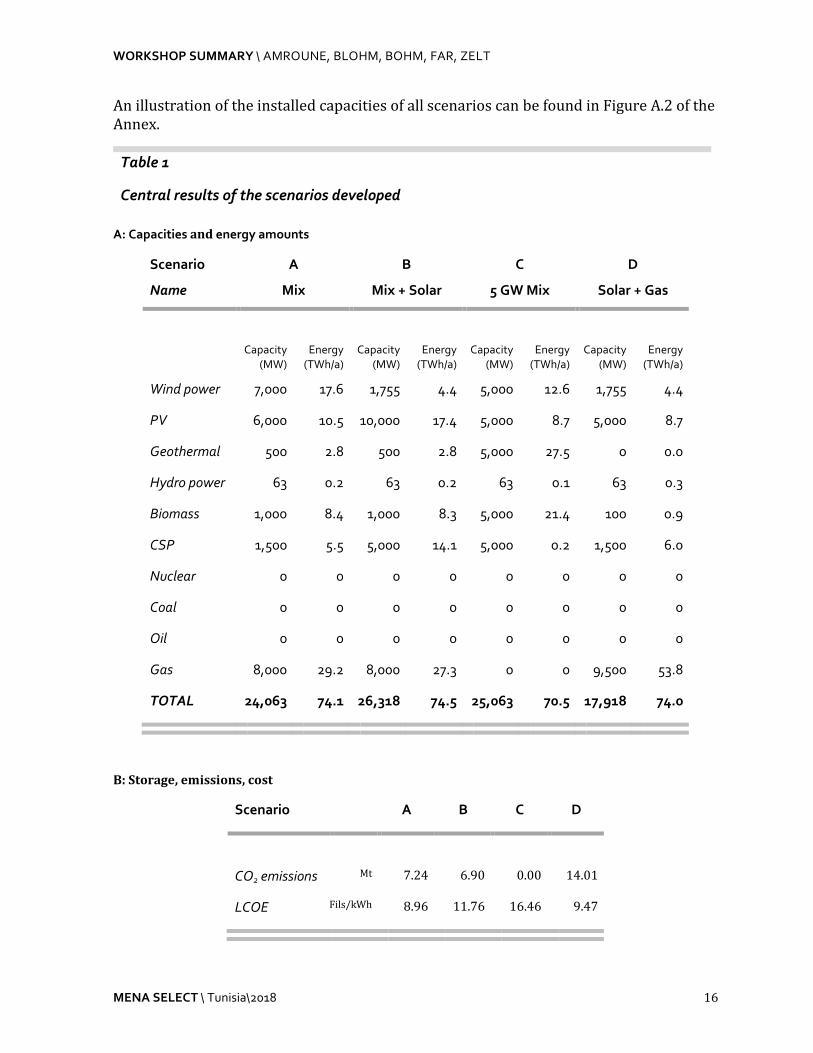
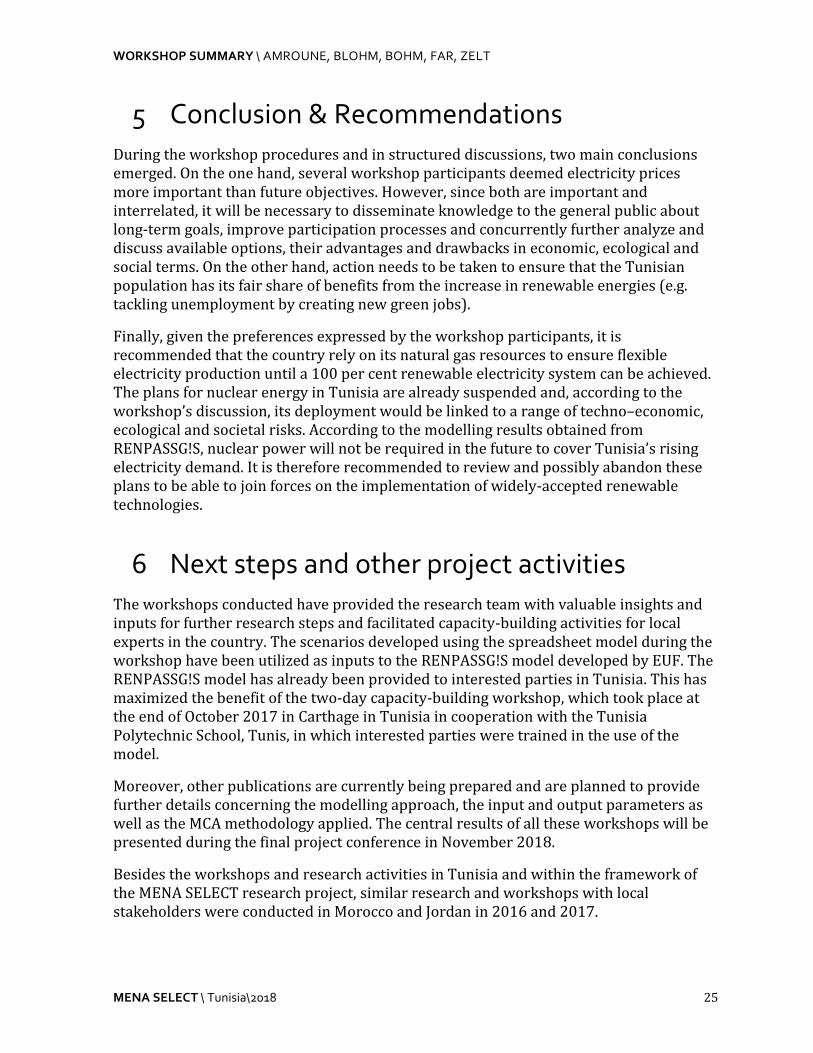
Instead of starting with a blank model sheet, in a first step, participants juxtaposed the intermediate national installation targets and the anticipated power demand in 2050, revealing that the 2030 installation targets would not suffice to cover the national power demand in 2050 at all times during the year. This setting was used for the actual scenario development, i.e. the installed capacity needed to be adjusted to cover the load at all times. The workshop participants then adjusted the data in an iterative manner, approximating system settings in which the load would be covered in every hour of the year 2050, under consideration of the stated preferences of the stakeholders. A system setting, thus scenario, was regarded to be completed when the load was covered in every hour of the year, and the model was reset to start the process again. In Table 1, the developed scenarios are presented. Additionally, the load and the power production in the developed scenarios are illustrated for the first week in 2050 as an example in Figure A.1 of the Annex.
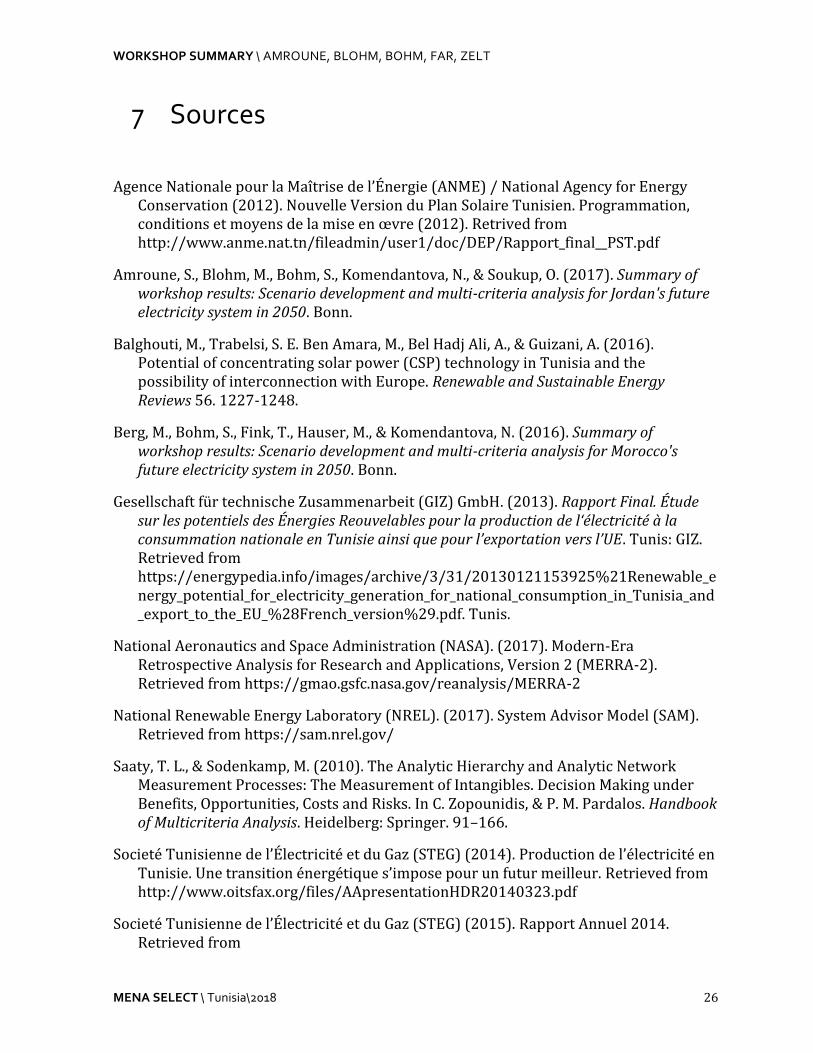
The first scenario (Scenario A) is characterized by a high share of renewable energy sources in a wide mix of technologies. Wind power was increased to 7 GW and solar PV to 6 GWp in 2050. Moreover, a capacity of 1.5 GW of CSP was included in the scenario,
and an installation of 0.5 GW of geothermal power was assumed. Biogas and gas-fired power plants contributed to a capacity of 9.0 GW, functioning mainly as backup capacity for times when the sun is not shining and the wind is not blowing. Additionally, in Scenario A, a capacity of pumped hydro storage (stockage d’énergie par pompage/ turbinage, STEP) of 400 MW with a 10 GWh storage was assumed. With this combination of technologies, intermittent energy technologies provided for approximately 59 per cent of the total installed capacity. The calculations of that scenario resulted in CO2 emissions of 7.2 Mt in 2050. The total LCOE of the system amounted to 0.248 DT/kWh. Due to the variety of technologies involved, Scenario A was named “Mix”.
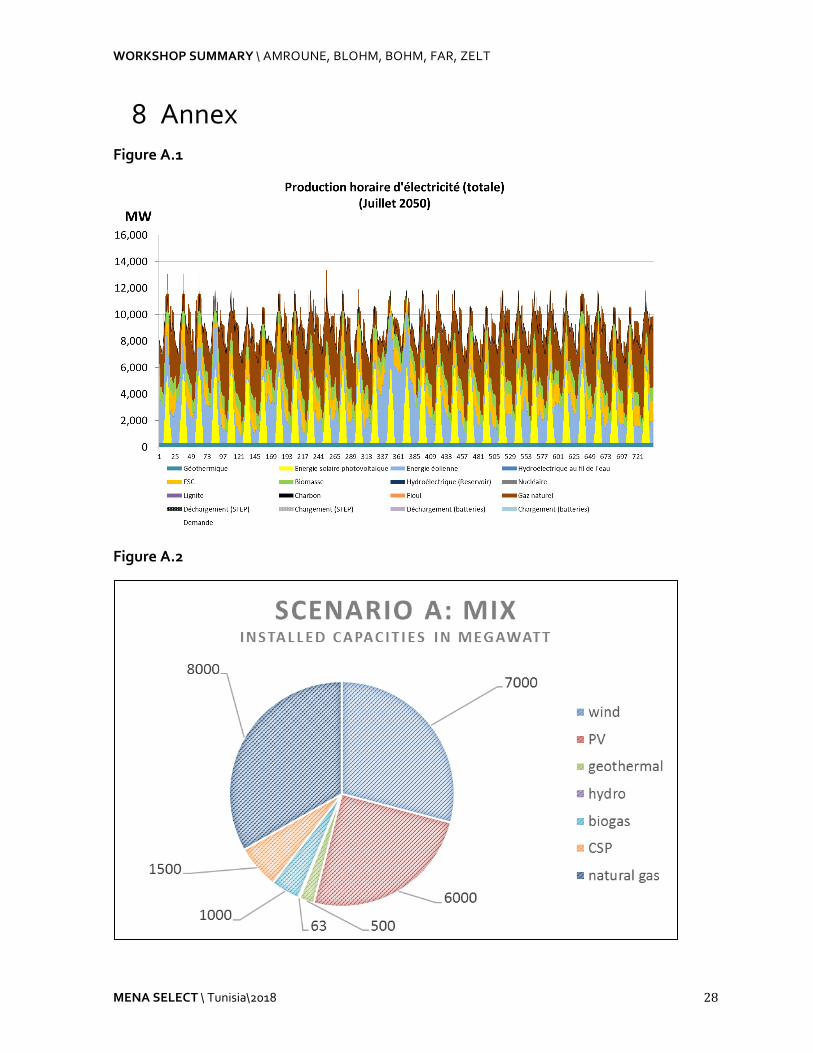
The second scenario (Scenario B) is characterized by a large share of renewable energies, similar to Scenario A, however emphasizing the use of solar PV. Here, a capacity of 1.755 GW of wind power and 10 GWp of solar PV was included as well as 5 GW of CSP. As in Scenario A, biogas and gas-fired power plants amounted to 9 GW, again mainly as a backup to the system. In this setting, approximately 69 per cent of the installed capacity and 63 per cent of the produced electricity would come from renewable energy sources. The direct CO2 emissions in that system were calculated to be 6.9 Mt in 2050. With 0.353 DT/kWh, the total LCOE were found to be higher than in Scenario A. Based on the scenario inputs, the scenario was called “Mix + Solar”.
The third scenario (Scenario C) consisted of a mix of renewable technologies in the system without any conventional power generation. The workshop participants agreed to exercise such a case in which all renewable technologies would be installed with a capacity of 5 GW each. In this scenario, LCOE were 0.456 DT/kWh, i.e. higher than in the other scenarios, with no direct CO2 emissions. Due to the installed capacity, the scenario was called “5 GW Mix”.
The comparably low value of power production from CSP (0.2 TWh) in Scenario C was caused by the model logics and the order of technology utilization in the model: As CSP was regarded to be a partly dispatchable technology, it would produce electricity depending on the solar potential and, in this case even more importantly, on the residual load on the grid. As in this scenario, the load had already been covered by other generation technologies, CSP’s contribution was comparably low, corresponding to losses of thermally stored energy. A different mode of operation or an alternative dispatchable technology might be more suitable, and system cost would be reduced, meaning that the resulting LCOE figures found during the workshop can be regarded as conservative.
The fourth scenario (Scenario D) is characterized by a high share of solar energy accompanied by a huge installation of gas-fired power plants. In comparison to Scenario A, in this scenario, the amount of wind power (1.755 GW) and biomass (0.1 GW) was substantially lower. Solar PV was chosen to be 5 GWp, and CSP was 1.5 GW. To have the demand covered in every hour of the year, a capacity of gas-fired power plants of 9.5 GW needed to be included in the scenario. With this scenario setting, a share of 46 per cent (capacity) and 27 per cent (energy) respectively of renewable energy sources was reached. The LCOE were found to be 0.262 DT/kWh which is in a similar range as Scenario A and lower than in the Scenarios B and C. The Scenario D was named “Solar + Gas”.
Stakeholder participation is essential in developing robust pathways for the sustainable development of a future energy system. Therefore, within the MENA SELECT project, the long-term electricity scenarios for Tunisia described in Section 2 are evaluated in a participatory process. A multi-criteria analysis (MCA) (Zopounidis & Pardalos, 2010) serves to systematically identify and consider the importance assigned by national and local stakeholders to a range of social, techno–economic and environmental implications. The identified stakeholder weightings, in turn, are linked to the characteristics of the scenarios discussed. As a result, this process allows identifying development pathways that are expected to receive broad support from the stakeholders involved.
The above scenario assessment was carried out on the second day of the workshop. As a start, all stakeholders were introduced to the MCA methodology, the criteria deployed as well as the stages of the intended process. The analysis aimed at obtaining a weighting of a set of criteria (Figure 2) that had been compiled from data provided by WP 1 and 2 of the project. The mathematical methodology AHP (analytical hierarchy process) was applied to calculate the weighting based on a pairwise comparison of the criteria (Saaty & Sodenkamp, 2010). The definitions of all criteria taken into account can be found in Table A.2 of the Annex.
3.2 Weighting process and stakeholder group identification
The weighting process consisted of two subsequent steps: An individual weighting by each participant for all criteria at each level of the hierarchy as well as a transfer of the individual weightings of each participant to a group questionnaire with an ensuing discussion process among the stakeholder group to identify a common group weighting for all criteria.
As a first step, the individual weighting process was conducted. For this purpose, an individual questionnaire was handed out on a sheet to each participant representing a stakeholder group. The participants were asked to first fill in their individual questionnaire following the demonstration shown in the PowerPoint presentation used in the workshop in which the criteria categories (techno–economic, environmental, societal) including a short description of the sub-criteria were defined. In this step, the participants were asked to compare the importance of the criteria in question in a silent process (i.e.without any discussion), and to individually check their weighting for inconsistencies. The research team helped during the process to identify inconsistencies and assist in correcting them.
In the second step after the completion of the individual weighting sheets, all stakeholder representatives were asked to join one of the four following groups according to the preferences and values of their institutions:
Techno–economic group: Higher preference for techno–economic criteria;
Environmental group: Higher preference for environmental criteria;
Societal group: Higher preference for societal criteria;
Equal preference group: Equal preferences among the three categories of criteria.
Each group received a group questionnaire sheet. As a starting point for the ensuing discussion, all group members were asked to transfer the result of their individual pairwise comparisons from step 1 to this sheet. Then, the whole group was to decide upon a group weighting that all group members could identify with. To understand the criteria correctly during the group discussion, a sheet with criteria definitions was distributed among the stakeholders.
3.3 Discussion and results of the weighting processes
Upon the completion of the group weightings, results were discussed in a plenary session. Each stakeholder group was asked to select a group representative who would briefly describe the experience of the weighting process within the group to the rest of the participants. The representative also addressed differences between the individual and the group weightings, if any, and named the most discussed criteria.
The feedback presented by the four groups’ representatives demonstrated that the different groups dealt with different degrees of weighting divergences and found different ways of coping with them.
Within the techno-economic group, there was a general accord concerning the criteria categories. However, there were persistent disagreements among the participants according to the institutions they represented concerning the weightings of the techno-economic criteria against each other. In the end, they managed to find a compromise.
The environmental group meanwhile struggled with its focal point. Some participants thought of themselves as rather sensitive to the environment but still hesitated to prioritize environmental aspects over techno–economic ones. Finally, the group decided to weight environmental criteria higher than those of the techno–economic category. The group members disagreed on the weighting of techno–economic criteria, which was resolved by giving each the same importance. The definitions of some societal criteria (i.e. contribution to the local economy, safety and local air pollution) were not entirely clear to all group members and had to be clarified first before a consensus was reached.
The societal group was highly heterogeneous, or as they put it, even “contradictory”. This has led to vivid discussions and made it challenging to agree on the group weightings. Some criteria definitions were misunderstood at the beginning, which made the choice
more difficult. However, having the criteria definition sheet at hand helped to clarify all definitions. Eventually, and in contrast to the group name, the societal group prioritized techno–economic criteria. The group had the least difficulty agreeing on a weighting within the ecological and social criteria (2nd and 3rd level, see Figure 2 above).
The equal preference group differed from the other groups in that they managed to easily find a consensus in all the decisions. They were also the first group to finish the group weighting process. The decision upon environmental criteria provoked some discussion, as well as the societal sub-criteria, for which each group member had a different weighting. The latter was resolved by forming the mathematical average.
The results of the weightings of each group as well as the mathematical average weighting of all groups are displayed in Table 2.
Table 2 Group weightings and the mathematical average weighting across all groups in percentage points
Techno-economic
group
Environmental group
Societal group
Equal preference
group
Mathematical average
System costs 49 2 2 3 8
System flexibility 8 2 8 9 8
Energy independence 20 6 18 21 21
CO2 emissions 2 9 5 4 6
Land use 1 3 2 2 2
Water consumption 5 35 5 8 13
Hazardous waste 10 16 2 18 12
On-site job creation 0 3 2 2 2
Local value chain integration
1 3 5 8 5
Safety 4 3 37 5 10
Air pollution (health) 1 16 15 19 13
Total 100 100 100 100 100
As can be deduced from Table 2, the preferences of the respective groups roughly represent their respective focus, i.e. the techno–economic group weighted criteria from the techno–economic category higher than the others, and the environmental focussed mainly on environmental criteria and so on. The equal preference group displayed rather equilibrated weightings among the three criteria categories. However, energy independence seemed to be also crucial to groups other than the techno–economic
group: The societal and equal preference groups weighted this criterion as rather important. It is also the only outstanding criterion in the mathematical average.
3.4 Finding a consensus
In addition to the group weighting results presented above, the possibility to agree on a compromise weighting among all participants was explored during a plenary discussion. While all four groups were able to agree on a common weighting in the previous step, finding a consensus in an even larger group of heterogeneous stakeholders is a difficult task with the likelihood of failure. Therefore, within the methodology applied, finding a consensus can be regarded as an optional step of the multi-criteria assessment. A consensus weighting—if available—can be integrated into the subsequent ranking stage, but is not required to complete the multi-criteria analysis.
The mathematical average weighting served as a starting point of the attempt to find a consensus. After discussing the average weighting, the stakeholder representatives were given a chance to suggest changes to this weighting in case it did not reflect their judgment.
Three main topics concerning the process and the results of the group weighting were discussed. On the one hand, some stakeholders criticized the methodology applied within the MCA (1). On the other, individual results of the average weighting were not found to reflect current issues in Tunisia (2). Finally, suggestions were made to change the mathematical average results (3).
(1) There was some criticism concerning the methodology, especially the pairwise comparison. Some stakeholder representatives suggested weighting the criteria on a scale from 1 to 10, as it would be easier for them to navigate on a scale rather than to compare pairs. Another stakeholder representative with profound knowledge of statistics suggested applying a statistical methodology rather than the analytical hierarchy process.
(2) In the current Tunisian context, unemployment poses a severe problem, so do electricity prices. Therefore, a representative from the national electricity company asked the group if they would prefer their electricity bill to be lower. Most of the stakeholder representatives agreed and did not find this issue adequately reflected in the average weighting percentages.
(3) The majority of stakeholders could not identify with all aspects of the mathematical average. Therefore, the participants engaged in vivid discussions and suggested alterations of the figures. One suggestion put forth concerned the equilibration of the percentages within the techno–economic category, in which energy independence is the most prominent in the mathematical average weighting. Another suggestion implied lowering the percentage of safety and increasing the weight of on-site job creation instead, with regard to the current Tunisian issue of unemployment. However, the equal preference group did not wish to change the resulting figures, perceiving any changes as an inappropriate adjustment of the applied methodology.
Eventually, the stakeholder representatives followed the moderator’s proposition to adjust the mathematical average with regard to the preceding discussion to see whether this would have an impact on the scenario ranking1. The suggested changes were applied to the scenarios but did not have an impact on the scenario rankings resulting from the mathematical average.
3.5 Ranking of the scenarios
As a final step in the workshop proceedings, the different criteria weightings were applied to the four scenarios developed on the previous workshop day (see Chapter 2.3). This allowed ranking the scenarios according to the stakeholders’ preferences established throughout the weighting process. As presented in Table 3, the different weightings lead to different scenario priorities, except the societal and equal preference groups, who display the same scenario ranking.
Table 3
The ranking of the five scenarios according to the different weightings
Techno–economic
group Environmental
group Societal
group
Equal preference
group
Group average
Mix 1 2 3 3 2
Mix + Solar 3 3 2 2 3
5 GW Mix 4 1 1 1 1
Solar + Gas 2 4 4 4 4
The exact indicator values for each scenario can be found in Table A.1 of the Annex. The techno-economic group ranked scenarios “Mix” and “Solar + Gas” differently than the other groups, thereby prioritizing the least costly scenarios, which certainly stems from the high amounts of gas and relatively little new installation of renewable energies, when compared to the high shares of renewables in scenarios “Mix + Solar” and “5 GW Mix”. Prioritizing the cheapest scenarios over the relatively expensive scenarios “Mix + Solar” and “5 GW Mix” corresponds with the category preference of the techno–economic group, whose weighting resulted in a 49 per cent importance of system costs. Knowing that scenario “5 GW Mix” is the most cost-intensive, displaying a balanced mix of renewable energies and no gas at all, it explains why it ranks lowest for the techno–economic group, but first for the other groups who dedicated more attention to other aspects than cost.
1 The changes affected techno-economic as well as some societal criteria. The following changes were
applied as suggested by the participants: System costs 8 % 13 % ; system flexibility 8 % 11 %; On-site job creation 2 % 5 %; Safety 10 % 4 %. All other criteria weightings remained unchanged.
Given the results of the workshop methodological procedures, the scenario ranking obtained using an MCA turns out to correspond with the stakeholder representatives’ criteria weightings and stakeholder preferences. Nevertheless, there have been significant differences among the four stakeholder groups, especially between the techno–economic on the one hand and the other groups on the other. The mathematical average ranking resulted in Scenario C “5 GW Mix” to comply best with the preferences of the workshop participants. This scenario features a future electricity system relying exclusively on an equilibrated set of renewable energy sources.
4 Results of workshop discussions The discussions that took place in the two-day workshop have provided key insights into several issues concerning the future energy outlook of the country. These issues include four main aspects of the future energy outlook: Renewable energies, conventional energies, future objectives and regulatory framework. Below are elaborations on each of these four aspects.
4.1 Renewable energies
With regard to renewable energies, the workshop participants underscored the great potential of solar resources in Tunisia and called for tapping into it. Other renewables were also included but were accorded less importance. For example, the participants agreed that the potential of hydro energy has already been exploited in Tunisia and there cannot be any further expansion beyond the currently installed capacities.
For tapping into the renewable energy potential, the issue of cost-competitiveness was deemed critical by the workshop participants. For instance, solar PV was preferred over CSP due to its lower cost, while it was pointed out that wind and PV will be nearly cost-competitive with conventional generation in 2050. Yet as far as preference is concerned, workshop participants seemed to prefer solar PV over wind power. Furthermore, it was pointed out that a sound site assessment is vital to identify locations for wind and solar power installations with the highest expected profitability. The workshop participants remarked that CSP would be a good option, especially in the south of Tunisia, but sufficient experience with large CSP plants is still missing, even on a global scale. Workshop participants generally regarded CSP as a comparably expensive technology, at least today. Meanwhile, the potential of geothermal power was regarded to be limited, and the technology was assessed to be expensive. Nonetheless, it was included in some of the scenarios based on the assumption that by 2050, the technology might improve. Other renewable energy potentials were singled out in this context. Workshop participants mentioned the Zero Waste initiative in Tunisia. Even though there is a huge potential as organic waste is concerned, today’s potential for producing electricity from such a source is rather limited due to a lack of national waste management procedures such as the collection, handling and sorting of waste.
Cost competitiveness was not the only critical issue that the participants discussed. Some workshop participants pointed to the technical issues that arise with the installation of renewables energies. Doubts were expressed concerning the ability of intermittent technologies to respond to the requirements of the grid. Other technical issues that were mentioned include the dismantling of plants. For example, even though wind power is the cheapest technology, workshop participants addressed the issue of problems with dismantling wind turbines.
4.2 Conventional energies
Discussions among workshop participants have also generated exciting insights about conventional energies. For instance, concerning the deployment plans of nuclear energy, which was initially postponed from 2022 to 2025 and later put on hold, the workshop participants expressed the view that it is difficult to find a suitable construction site for a technology that poses several challenges. Similarly, studies on coal-fired power plants are ongoing, but appropriate harbour infrastructure remains unavailable, and currently, no specific project is under development. Coal-fired power plants generated the most criticism from the workshop participants because the use of coal would be in contradiction to the Paris Agreement and the national commitments made in Tunisian Nationally Determined Contributions (NDCs) within the United Nations Framework Convention on Climate Change (UNFCCC). However, workshop participants have been in favour of the future expansion of gas-fired power plants for covering peak electricity load. They were also in favour of keeping existing oil-fired power plants.
4.3 Future objectives
Discussions revolved around meeting the objective of having a 20 per cent share of installed capacity from renewable energies (RE) by 2020 according to the 2012 Plan Solaire Tunisien (PST). Workshop participants agreed that this target will not be realistic and discussed the subsequently adjusted goal for 2020 which is 12 per cent RE. They also highlighted the importance of low electricity prices over setting and reaching long-term goals. Most of the workshop participants were not aware of how the long-term goals were set. This calls for underscoring the importance of citizens’ participation in decision-making and their understanding of decision-making mechanisms, resulting in more public support of policies and long-term goals.
4.4 Regulatory framework
The workshop participants have highlighted several issues regarding the regulatory framework in place. One critical issue raised concerned hydroelectricity, which is currently under the mandate of the Ministry of Agriculture and not under STEG and is not integrated into the future objectives. This issue becomes more critical given the plans to build 400 megawatts of pumped-hydro power storage (STEP) which were postponed from 2020 to 2025 but which remain very important for energy systems with high shares of intermittent renewable energies.
5 Conclusion & Recommendations During the workshop procedures and in structured discussions, two main conclusions emerged. On the one hand, several workshop participants deemed electricity prices more important than future objectives. However, since both are important and interrelated, it will be necessary to disseminate knowledge to the general public about long-term goals, improve participation processes and concurrently further analyze and discuss available options, their advantages and drawbacks in economic, ecological and social terms. On the other hand, action needs to be taken to ensure that the Tunisian population has its fair share of benefits from the increase in renewable energies (e.g. tackling unemployment by creating new green jobs).
Finally, given the preferences expressed by the workshop participants, it is recommended that the country rely on its natural gas resources to ensure flexible electricity production until a 100 per cent renewable electricity system can be achieved. The plans for nuclear energy in Tunisia are already suspended and, according to the workshop’s discussion, its deployment would be linked to a range of techno–economic, ecological and societal risks. According to the modelling results obtained from RENPASSG!S, nuclear power will not be required in the future to cover Tunisia’s rising electricity demand. It is therefore recommended to review and possibly abandon these plans to be able to join forces on the implementation of widely-accepted renewable technologies.
6 Next steps and other project activities The workshops conducted have provided the research team with valuable insights and inputs for further research steps and facilitated capacity-building activities for local experts in the country. The scenarios developed using the spreadsheet model during the workshop have been utilized as inputs to the RENPASSG!S model developed by EUF. The RENPASSG!S model has already been provided to interested parties in Tunisia. This has maximized the benefit of the two-day capacity-building workshop, which took place at the end of October 2017 in Carthage in Tunisia in cooperation with the Tunisia Polytechnic School, Tunis, in which interested parties were trained in the use of the model.
Moreover, other publications are currently being prepared and are planned to provide further details concerning the modelling approach, the input and output parameters as well as the MCA methodology applied. The central results of all these workshops will be presented during the final project conference in November 2018.
Besides the workshops and research activities in Tunisia and within the framework of the MENA SELECT research project, similar research and workshops with local stakeholders were conducted in Morocco and Jordan in 2016 and 2017.
Agence Nationale pour la Maîtrise de l’Énergie (ANME) / National Agency for Energy Conservation (2012). Nouvelle Version du Plan Solaire Tunisien. Programmation, conditions et moyens de la mise en œvre (2012). Retrived from http://www.anme.nat.tn/fileadmin/user1/doc/DEP/Rapport_final__PST.pdf
Amroune, S., Blohm, M., Bohm, S., Komendantova, N., & Soukup, O. (2017). Summary of workshop results: Scenario development and multi-criteria analysis for Jordan's future electricity system in 2050. Bonn.
Balghouti, M., Trabelsi, S. E. Ben Amara, M., Bel Hadj Ali, A., & Guizani, A. (2016). Potential of concentrating solar power (CSP) technology in Tunisia and the possibility of interconnection with Europe. Renewable and Sustainable Energy Reviews 56. 1227-1248.
Berg, M., Bohm, S., Fink, T., Hauser, M., & Komendantova, N. (2016). Summary of workshop results: Scenario development and multi-criteria analysis for Morocco's future electricity system in 2050. Bonn.
Gesellschaft für technische Zusammenarbeit (GIZ) GmbH. (2013). Rapport Final. Étude sur les potentiels des Énergies Reouvelables pour la production de l‘électricité à la consummation nationale en Tunisie ainsi que pour l’exportation vers l’UE. Tunis: GIZ. Retrieved from https://energypedia.info/images/archive/3/31/20130121153925%21Renewable_energy_potential_for_electricity_generation_for_national_consumption_in_Tunisia_and_export_to_the_EU_%28French_version%29.pdf. Tunis.
National Aeronautics and Space Administration (NASA). (2017). Modern-Era Retrospective Analysis for Research and Applications, Version 2 (MERRA-2). Retrieved from https://gmao.gsfc.nasa.gov/reanalysis/MERRA-2
National Renewable Energy Laboratory (NREL). (2017). System Advisor Model (SAM). Retrieved from https://sam.nrel.gov/
Saaty, T. L., & Sodenkamp, M. (2010). The Analytic Hierarchy and Analytic Network Measurement Processes: The Measurement of Intangibles. Decision Making under Benefits, Opportunities, Costs and Risks. In C. Zopounidis, & P. M. Pardalos. Handbook of Multicriteria Analysis. Heidelberg: Springer. 91–166.
Societé Tunisienne de l’Électricité et du Gaz (STEG) (2014). Production de l’électricité en Tunisie. Une transition énergétique s’impose pour un futur meilleur. Retrieved from http://www.oitsfax.org/files/AApresentationHDR20140323.pdf
Societé Tunisienne de l’Électricité et du Gaz (STEG) (2015). Rapport Annuel 2014. Retrieved from
Trieb, F., Hess, D., Kern, J., Fichter, T., Moser, M., Pfennig, U., Caldez, N., & Lilliestam, J. (2015). BETTER – Bringing Europe and third countries closer together through renewable energies. WP3: North Africa case study (Final report). Stuttgart: German Aerospace Center (Deutsches Zentrum für Luft- und Raumfahrt, DLR), Intelligent Energy Europe (IEE).
Zopounidis, C., & Pardalos, P. M. (2010). Handbook of Multicriteria Analysis. Heidelberg: Springer
Techno-economic criteria These criteria analyze the technical and economic characteristics of the electricity system. They take electricity production costs, dependency on energy imports and production volatility into consideration.
Environmental criteria These criteria analyze the environmental characteristics of the electricity system. They take water consumption, land use, CO2 emissions and management of hazardous waste into consideration.
Societal criteria These criteria analyze the socio-economic characteristics of the electricity system. They take the system’s effects on public health, the risk of serious incidents and the promotion of local economy into consideration.
System costs The costs of the electricity system include production, grid extension and storage costs.
System flexibility The electricity system’s capacity to react rapidly and flexibly to changes in electricity demand.
Energy independence Future capacity of the scenarios to make use of local resources in order to reduce energy dependency.
CO2 emissions Direct CO2 emissions of all power plants during the observation period.
Land use Soil occupation caused by the operation of all power plants (on-site).
Water consumption Direct freshwater consumption during the operation of all power plants (cooling, steam cycle, cleaning).
Hazardous waste Quantity and quality of hazardous waste produced by all power plants.
Contribution to local economy
The scenarios’ capacity to integrate the local economy into the electricity system.
Safety The number of fatalities as a result of serious accidents during the operation and maintenance of power plants.
Air pollution (health) Air quality deterioration resulting from atmospheric pollutants that can bring about health risks.
On-site job creation The scenarios’ capacity to create on-site jobs during the construction and operation of power plants.
Domestic value chain integration
The scenarios’ capacity to encourage the emergence and/or development of national industries and of indirect jobs during the entire life cycle of power plants.


![MULTI-CRITERIA PROJECT PORTFOLIO OPTIMIZATION UNDER … Multi-criteria... · multi-criteria utility function [18] as a tool of the multi-criteria assessment of the projects under](https://static.documents.pub/doc/80x56/5d58df0b88c9931b1c8bdcb0/multi-criteria-project-portfolio-optimization-under-multi-criteria-multi-criteria.jpg)


