Trafikdage på Aalborg Universitet 2017 ISSN 1603-9696 1 Scenarios for use of biogas for heavy-duty vehicles in Denmark and related GHG emission impacts Steen Solvang Jensen 1 , Morten Winther 1 , Uffe Jørgensen 2 , Henrik B. Møller 3 1 Aarhus University, Department of Environmental Science 2 Aarhus University, Department of Agroecology 3 Aarhus University, Department of Engineering Abstrakt Biogas may be a promising alternative fuel, mainly for heavy-duty vehicles, that can reduce CO2 emissions via substitution of fossil fuels and further reduce methane emissions from agricultural manure handling. However, as methane is a potent climate gas loss of methane from production to use of biogas is of concern. This study has analysed the potential biomass and biogas production from all Danish organic waste sources under different scenario assumptions for future scenario years. The analysis includes energy demand of the road transportation sector by means of transport and fuel types, and potential use of the limited biogas resource taking into account alternative fuel options available for transportation (electricity, hydrogen, biofuels). Further, the total differences in fuel consumption and GHG emissions due to the replacement of diesel-powered heavy-duty vehicles by gas-powered heavy-duty vehicles are estimated in a well-to-wheel perspective taking into account methane losses. 1. Background and objectives The transport sector is almost 100% based on fossil fuels except for a few percent biofuels, and electric vehicles penetrate the car market very slowly in Denmark. Denmark has a large agricultural production that can provide substantial biomass resources for biogas production and a nation-wide natural gas grid where upgraded biogas can be distributed and sold via biogas certificates. However, the few filling stations that presently exists serve very limited numbers of urban and regional buses or garbage trucks and few gas-driven vehicles are at the Danish car market. The government has a long-term objective of becoming a low carbon society in 2050 based on a renewable energy sector and significantly lower Greenhouse Gas (GHG) emissions for other sectors such as transport and agriculture. Compared to other sectors, the transport sector is far behind in fulfilling these long-term objectives. Denmark is also committed to the EU objective that renewable energies must cover at least 10% of the transport sector's energy consumption by 2020. Furthermore, the new EU climate policy stipulates that GHG emissions from the non-ETS (Emissions Trading Scheme) sector (transport, housing and agriculture) Denne artikel er publiceret i det elektroniske tidsskrift Artikler fra Trafikdage på Aalborg Universitet (Proceedings from the Annual Transport Conference at Aalborg University) ISSN 1603-9696 www.trafikdage.dk/artikelarkiv
Transcript
Trafikdage på Aalborg Universitet 2017 ISSN 1603-9696 1
Scenarios for use of biogas for heavy-duty vehicles in Denmark and related GHG emission impacts Steen Solvang Jensen1, Morten Winther1, Uffe Jørgensen2, Henrik B. Møller3 1Aarhus University, Department of Environmental Science 2Aarhus University, Department of Agroecology 3Aarhus University, Department of Engineering
Abstrakt Biogas may be a promising alternative fuel, mainly for heavy-duty vehicles, that can reduce CO2 emissions via substitution of fossil fuels and further reduce methane emissions from agricultural manure handling. However, as methane is a potent climate gas loss of methane from production to use of biogas is of concern. This study has analysed the potential biomass and biogas production from all Danish organic waste sources under different scenario assumptions for future scenario years. The analysis includes energy demand of the road transportation sector by means of transport and fuel types, and potential use of the limited biogas resource taking into account alternative fuel options available for transportation (electricity, hydrogen, biofuels). Further, the total differences in fuel consumption and GHG emissions due to the replacement of diesel-powered heavy-duty vehicles by gas-powered heavy-duty vehicles are estimated in a well-to-wheel perspective taking into account methane losses.
1. Background and objectives The transport sector is almost 100% based on fossil fuels except for a few percent biofuels, and electric vehicles penetrate the car market very slowly in Denmark. Denmark has a large agricultural production that can provide substantial biomass resources for biogas production and a nation-wide natural gas grid where upgraded biogas can be distributed and sold via biogas certificates. However, the few filling stations that presently exists serve very limited numbers of urban and regional buses or garbage trucks and few gas-driven vehicles are at the Danish car market. The government has a long-term objective of becoming a low carbon society in 2050 based on a renewable energy sector and significantly lower Greenhouse Gas (GHG) emissions for other sectors such as transport and agriculture. Compared to other sectors, the transport sector is far behind in fulfilling these long-term objectives. Denmark is also committed to the EU objective that renewable energies must cover at least 10% of the transport sector's energy consumption by 2020. Furthermore, the new EU climate policy stipulates that GHG emissions from the non-ETS (Emissions Trading Scheme) sector (transport, housing and agriculture)
Denne artikel er publiceret i det elektroniske tidsskrift Artikler fra Trafikdage på Aalborg Universitet (Proceedings from the Annual Transport Conference at Aalborg University) ISSN 1603-9696 www.trafikdage.dk/artikelarkiv
Trafikdage på Aalborg Universitet 2017 ISSN 1603-9696 2
must be reduced by 30% in 2030 compared to the 2005-level. In summer 2016 the EU Commission published the proposal for burden sharing among member states, in which the proposal for the Danish reduction target is 39%. The overall objective of the present research project is to analyse the relationship between limited biogas resources and the society's transport energy demand in a future perspective in order to create a qualified basis for prioritisation of biogas resources for transport purposes, and further to carry out an integrated Life-Cycle Analysis (LCA) and welfare economic analysis (CBA) in a well-to-wheel framework of utilizing biogas for transport. This paper focuses on the first part of the study and hence does not report on LCA and CBA. The paper addresses the following research questions: • What are the Danish biomass resources for production of biogas under different scenario
assumptions? • What is the potential for biogas production under different technology scenario assumptions? • What is the energy demand for transport of different vehicle categories in relation to the potential
biogas production? Which vehicle categories are most suitable for using biogas taking into account other renewable substitution alternatives e.g. electricity?
• What are the GHG emission reductions from well-to-wheel accounting for reduction of methane due to handling of biomass in biogas plants and substitution of diesel for transport and counteracting processes of methane losses at biogas plants, operation of vehicles and at filling stations?
2. Methodology 2.1 Overall methodology The study describes a resource flow from biomass resources to potential biogas production and the use of biogas in the transport sector, and related GHG emissions in a well-to-wheel analysis. The potential biomass and biogas production includes all Danish organic sources under different scenario assumptions. The scenario years are 2013 (reference year) and 2020, 2030 and 2035. There are two biomass scenarios based on the “Environmental optimized scenario” of the +10 mio. Tonnes Study (Gylling et al., 2016); a low and high biomass scenario depending on the type and amount of biomass included. There are three biogas technology scenarios: (1) State-of-the-art biogas plant where biogas is upgraded to biomethane by conventional methods (2) Environmental-optimized plant with prolonged retention time (3) Environmental-optimized plant where methanisation of CO2 in biogas is implemented. The scenarios are shown in Table 2.1.
Table 2.1 Biomass and biogas technology scenarios
Biogas technology State of the art Optimized plant Optimized+methanisation
Biomass scenario Low High Low High Low High
Furthermore, GHG emission calculations are made in two scenarios for 2035 using low and high loss CH4 input factors for operation of vehicles derived from the literature. Different assumptions for these input factors were made for engine loss/tank boil off, CH4 leaks at the fuel station and the CH4 emissions from exhaust.
The use of biogas for transport is analysed by comparing the energy demand of the road transportation sector by vehicle and fuel types, and the potential use of the limited biogas resource taking into account alternative fuel options available for transportation (electricity, hydrogen, biofuels). The analysis focuses on use of biogas for commercial light-duty vehicles and heavy-duty vehicles (trucks, coaches and urban buses).
Trafikdage på Aalborg Universitet 2017 ISSN 1603-9696 3
A detailed analysis for trucks was carried out where the total differences in fuel consumption and GHG emissions due to the replacement of diesel fuelled heavy-duty vehicles by methane fuelled heavy-duty vehicles are estimated for the scenario year of 2035. 2.2 Biomass scenarios Environment-optimized scenario The biomass scenarios are based on the preconditions and methodological set-up of the Danish so-called +10 Million Tonnes Study (Gylling et al., 2013). The detailed methodology for the agricultural part of the scenarios is described in an online note (Kristensen & Jørgensen, 2012). In the +10 Million Tonnes Study three scenarios were analyzed for 2020 and compared with the biomass use in 2009:
1. Business-as-usual (no basic changes in cropping systems – the available biomass used to a higher extend)
2. Biomass-optimized (several changes in cropping systems, harvest methods etc. in order to maximize biomass production)
3. Environment-optimized (Several changes like in the Biomass-optimized but modified in order to ensure large environmental benefits as well as biodiversity improvements).
Environmental effects in the agricultural sector of the different scenarios were quantified partly in the +10 Million Tonnes study and in further details in a report by the Danish Centre for Food and Agriculture (DCA) under Aarhus University (Jørgensen et al. 2013). Based on these evaluations it is estimated that the most likely scenario to be implemented is the Environment-optimized which fulfils a number of environmental goals (on nutrient losses, soil carbon, biodiversity and pesticide use) in addition to the increased supply of biomass for energy. We thus base the biogas scenarios on the biomass resources quantified in the environment-optimized scenario supplemented with available waste resources from households and industry (Birkmose et al., 2015). However, the households and industry waste resource with a total of approx. 0.5 million tonnes dry matter is considerably smaller than the agricultural resource of about 11.5 million tonnes dry matter. Biomass available for biogas production The scenarios in Gylling (2013) did not include any choice of energy conversion technology, and thus the scenario results were in tonnes of biomass and not PJ. Thus for this project we have set up a relevant choice of biomass use for biogas. It is quite obvious that manure fits very well to the biogas technology (however, may also be used for HtL (Hydro-thermal Liquefaction – bio-oil production)), and we define two levels of manure use for biogas: 50% and 100% of the estimate of technically available manure in Gylling et al. (2013). For most other biomass types like green biomass (grass cuts, beet roots, catch crops etc.), straw, household and industry biowaste it is very open what will be the optimal use. For example, the green biomass we argue that this fraction should be used for green biorefinery to extract, first of all, proteins for fodder, and if economical, also other high-value components. When this is done, there is a fibre fraction left which may be used as cattle feed, for paper-making, or can be utilized for biogas. It is, however, relevant to expect that some of the green biomass (e.g. the catch crops) may be utilized for biogas and that part of the fibres from the crops biorefined is utilized for biogas as well. We thus set up two levels of biogas use of the green biomass: 20% and 60%.
Trafikdage på Aalborg Universitet 2017 ISSN 1603-9696 4
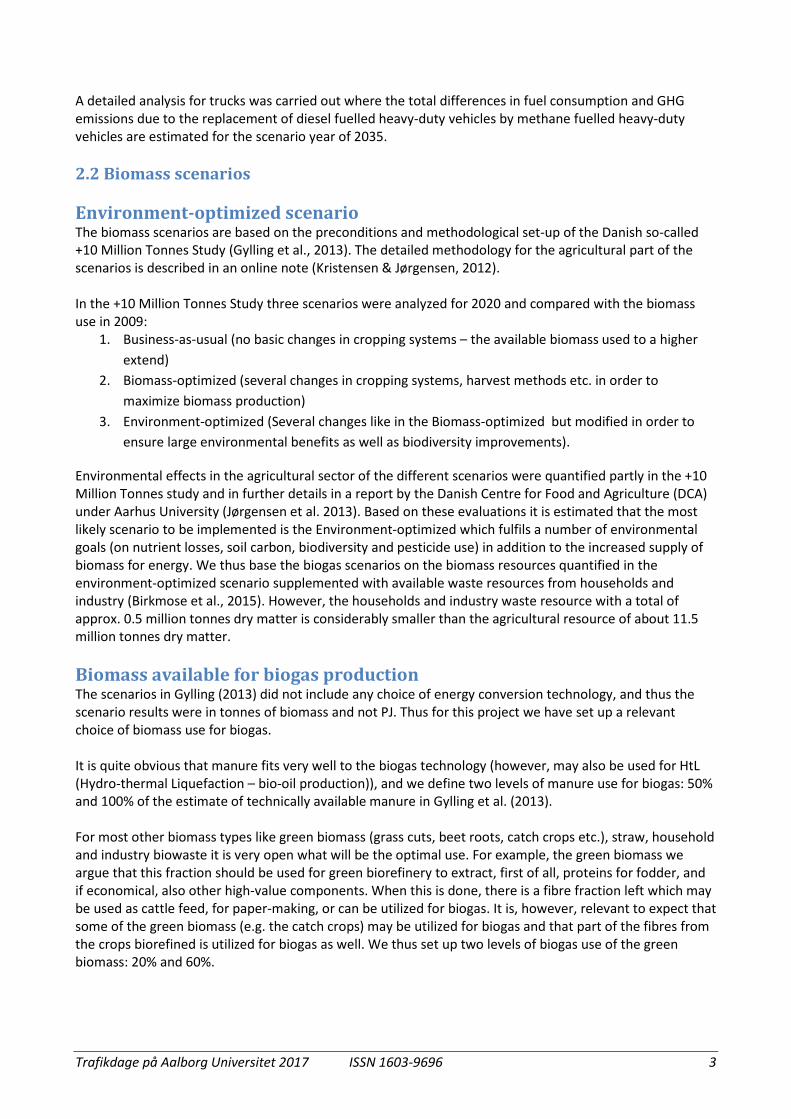
Based on similar considerations for the main biomass fractions, and to reduce complexity, we propose to make two scenarios: a low and a high biomass scenario. Further details are in Jensen et al. (2017). Both scenarios are based on the environment-optimized scenario (Gylling et al., 2013) supplemented with available waste resources from households and industry (Birkmose et al., 2015). The assumptions of the low and high biomass scenarios for utilization of biomass for biogas production are summarized in Table 4.1.
The biomass scenarios after having decided on the specific set-up are given in annual tonnes of dry matter available in specific crop, manure and waste categories for the low and high biomass for biogas scenarios. The biomass inputs estimated for distribution to different biogas technologies and for quantification of total biogas output are shown in Fig. 2.1.
Figure 2.1. Biomass resources allocated to the Low and High biogas scenarios for Denmark (Million tonnes of dry matter).
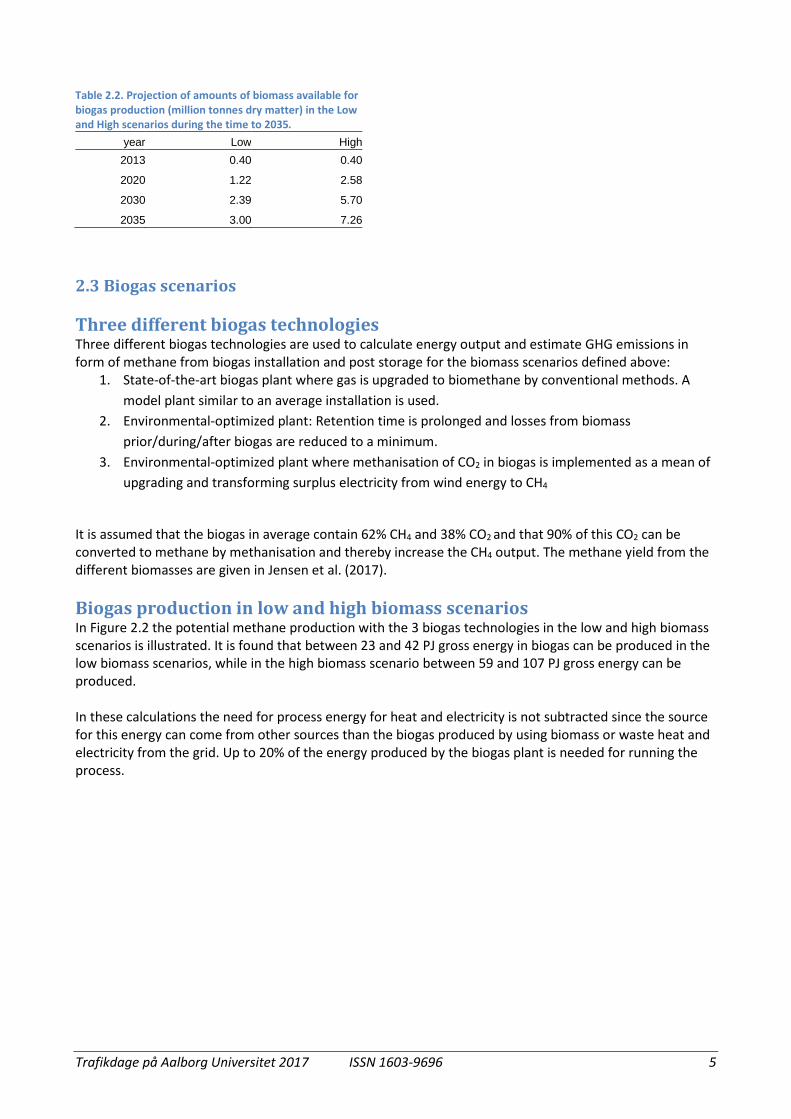
Tonnes given for scenario years 2013, 2020, 2030 and 2035 are based on a simple assumption on linear increase as the study does look into measures and a road map for implementation of the potentials. The scenarios are national data with no distribution to regions and no time distribution within year. The biomass use projection over time is calculated and shown in Table 2.2.
Table 4.1. Assumptions of biomass utilization in the low and high biomass scenarios Characteristics Low High Base scenario Environment-optimized Environment-optimized Technically available manure
50% 100%
Green biomass and straw 20% 60% Household and industry biowaste
50% 100%
Trafikdage på Aalborg Universitet 2017 ISSN 1603-9696 5
2.3 Biogas scenarios Three different biogas technologies Three different biogas technologies are used to calculate energy output and estimate GHG emissions in form of methane from biogas installation and post storage for the biomass scenarios defined above:
1. State-of-the-art biogas plant where gas is upgraded to biomethane by conventional methods. A model plant similar to an average installation is used.
2. Environmental-optimized plant: Retention time is prolonged and losses from biomass prior/during/after biogas are reduced to a minimum.
3. Environmental-optimized plant where methanisation of CO2 in biogas is implemented as a mean of upgrading and transforming surplus electricity from wind energy to CH4
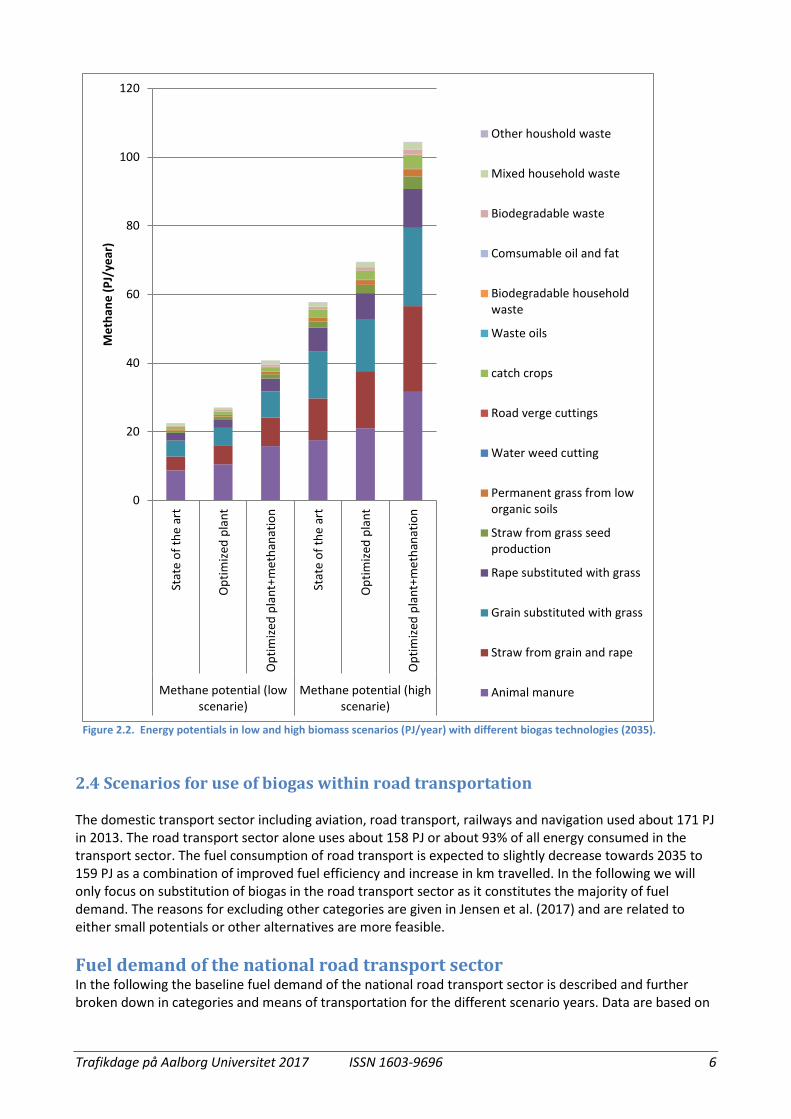
It is assumed that the biogas in average contain 62% CH4 and 38% CO2 and that 90% of this CO2 can be converted to methane by methanisation and thereby increase the CH4 output. The methane yield from the different biomasses are given in Jensen et al. (2017). Biogas production in low and high biomass scenarios In Figure 2.2 the potential methane production with the 3 biogas technologies in the low and high biomass scenarios is illustrated. It is found that between 23 and 42 PJ gross energy in biogas can be produced in the low biomass scenarios, while in the high biomass scenario between 59 and 107 PJ gross energy can be produced. In these calculations the need for process energy for heat and electricity is not subtracted since the source for this energy can come from other sources than the biogas produced by using biomass or waste heat and electricity from the grid. Up to 20% of the energy produced by the biogas plant is needed for running the process.
Table 2.2. Projection of amounts of biomass available for biogas production (million tonnes dry matter) in the Low and High scenarios during the time to 2035.
year Low High 2013 0.40 0.40
2020 1.22 2.58
2030 2.39 5.70
2035 3.00 7.26
Trafikdage på Aalborg Universitet 2017 ISSN 1603-9696 6
Figure 2.2. Energy potentials in low and high biomass scenarios (PJ/year) with different biogas technologies (2035).
2.4 Scenarios for use of biogas within road transportation The domestic transport sector including aviation, road transport, railways and navigation used about 171 PJ in 2013. The road transport sector alone uses about 158 PJ or about 93% of all energy consumed in the transport sector. The fuel consumption of road transport is expected to slightly decrease towards 2035 to 159 PJ as a combination of improved fuel efficiency and increase in km travelled. In the following we will only focus on substitution of biogas in the road transport sector as it constitutes the majority of fuel demand. The reasons for excluding other categories are given in Jensen et al. (2017) and are related to either small potentials or other alternatives are more feasible. Fuel demand of the national road transport sector In the following the baseline fuel demand of the national road transport sector is described and further broken down in categories and means of transportation for the different scenario years. Data are based on
0
20
40
60
80
100
120
Stat
e of
the
art
Opt
imize
d pl
ant
Opt
imize
d pl
ant+
met
hana
tion
Stat
e of
the
art
Opt
imize
d pl
ant
Opt
imize
d pl
ant+
met
hana
tion
Methane potential (lowscenarie)
Methane potential (highscenarie)
Met
hane
(PJ/
year
)
Other houshold waste
Mixed household waste
Biodegradable waste
Comsumable oil and fat
Biodegradable householdwaste
Waste oils
catch crops
Road verge cuttings
Water weed cutting
Permanent grass from loworganic soils
Straw from grass seedproduction
Rape substituted with grass
Grain substituted with grass
Straw from grain and rape
Animal manure
Trafikdage på Aalborg Universitet 2017 ISSN 1603-9696 7
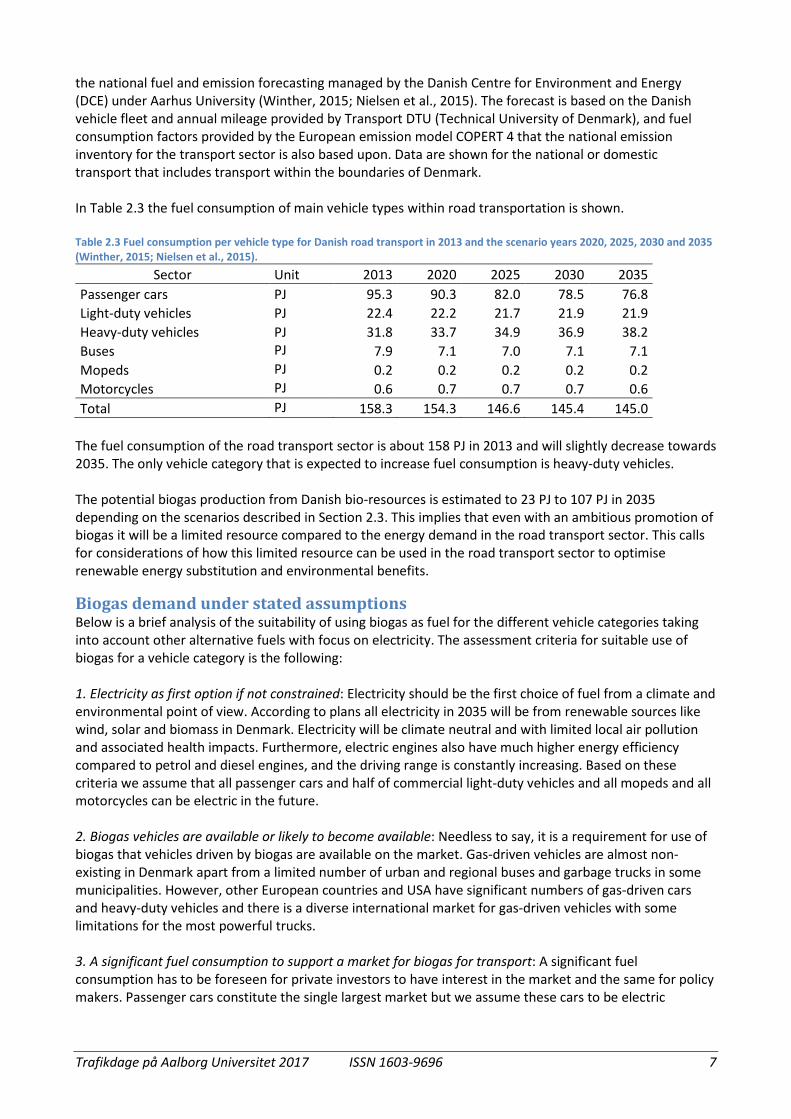
the national fuel and emission forecasting managed by the Danish Centre for Environment and Energy (DCE) under Aarhus University (Winther, 2015; Nielsen et al., 2015). The forecast is based on the Danish vehicle fleet and annual mileage provided by Transport DTU (Technical University of Denmark), and fuel consumption factors provided by the European emission model COPERT 4 that the national emission inventory for the transport sector is also based upon. Data are shown for the national or domestic transport that includes transport within the boundaries of Denmark. In Table 2.3 the fuel consumption of main vehicle types within road transportation is shown. Table 2.3 Fuel consumption per vehicle type for Danish road transport in 2013 and the scenario years 2020, 2025, 2030 and 2035 (Winther, 2015; Nielsen et al., 2015).
The fuel consumption of the road transport sector is about 158 PJ in 2013 and will slightly decrease towards 2035. The only vehicle category that is expected to increase fuel consumption is heavy-duty vehicles. The potential biogas production from Danish bio-resources is estimated to 23 PJ to 107 PJ in 2035 depending on the scenarios described in Section 2.3. This implies that even with an ambitious promotion of biogas it will be a limited resource compared to the energy demand in the road transport sector. This calls for considerations of how this limited resource can be used in the road transport sector to optimise renewable energy substitution and environmental benefits.
Biogas demand under stated assumptions Below is a brief analysis of the suitability of using biogas as fuel for the different vehicle categories taking into account other alternative fuels with focus on electricity. The assessment criteria for suitable use of biogas for a vehicle category is the following: 1. Electricity as first option if not constrained: Electricity should be the first choice of fuel from a climate and environmental point of view. According to plans all electricity in 2035 will be from renewable sources like wind, solar and biomass in Denmark. Electricity will be climate neutral and with limited local air pollution and associated health impacts. Furthermore, electric engines also have much higher energy efficiency compared to petrol and diesel engines, and the driving range is constantly increasing. Based on these criteria we assume that all passenger cars and half of commercial light-duty vehicles and all mopeds and all motorcycles can be electric in the future. 2. Biogas vehicles are available or likely to become available: Needless to say, it is a requirement for use of biogas that vehicles driven by biogas are available on the market. Gas-driven vehicles are almost non-existing in Denmark apart from a limited number of urban and regional buses and garbage trucks in some municipalities. However, other European countries and USA have significant numbers of gas-driven cars and heavy-duty vehicles and there is a diverse international market for gas-driven vehicles with some limitations for the most powerful trucks. 3. A significant fuel consumption to support a market for biogas for transport: A significant fuel consumption has to be foreseen for private investors to have interest in the market and the same for policy makers. Passenger cars constitute the single largest market but we assume these cars to be electric
Trafikdage på Aalborg Universitet 2017 ISSN 1603-9696 8
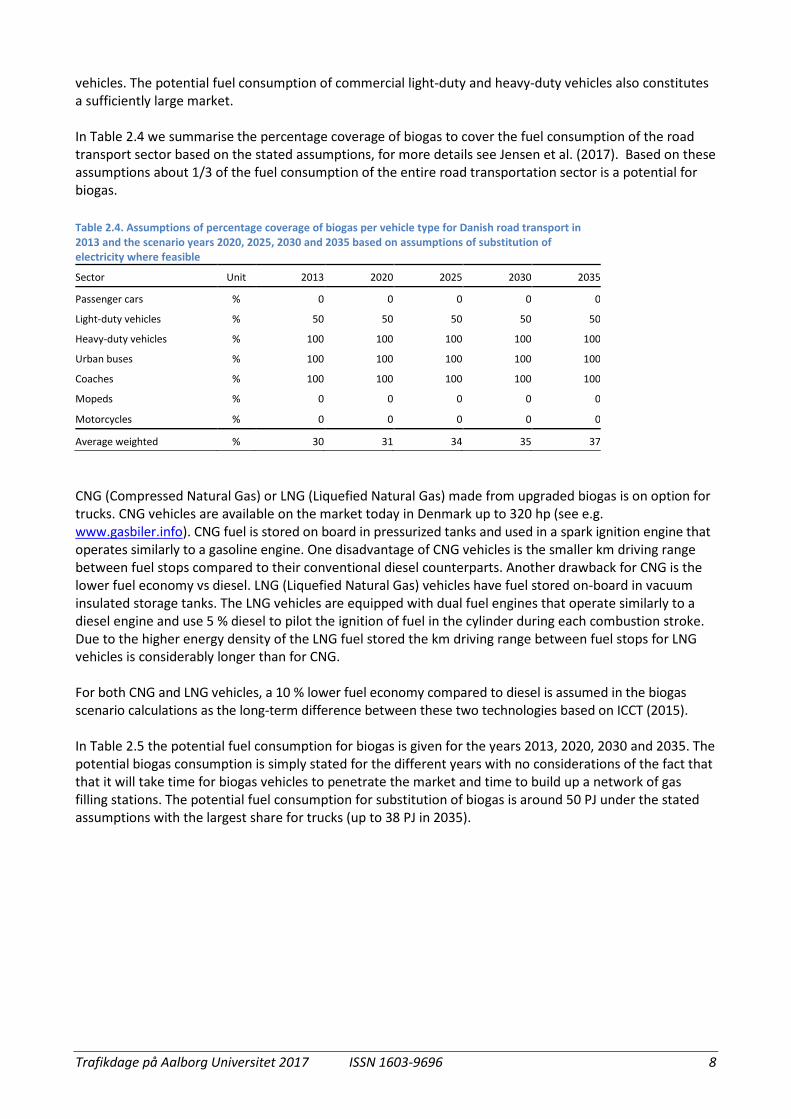
vehicles. The potential fuel consumption of commercial light-duty and heavy-duty vehicles also constitutes a sufficiently large market. In Table 2.4 we summarise the percentage coverage of biogas to cover the fuel consumption of the road transport sector based on the stated assumptions, for more details see Jensen et al. (2017). Based on these assumptions about 1/3 of the fuel consumption of the entire road transportation sector is a potential for biogas.
CNG (Compressed Natural Gas) or LNG (Liquefied Natural Gas) made from upgraded biogas is on option for trucks. CNG vehicles are available on the market today in Denmark up to 320 hp (see e.g. www.gasbiler.info). CNG fuel is stored on board in pressurized tanks and used in a spark ignition engine that operates similarly to a gasoline engine. One disadvantage of CNG vehicles is the smaller km driving range between fuel stops compared to their conventional diesel counterparts. Another drawback for CNG is the lower fuel economy vs diesel. LNG (Liquefied Natural Gas) vehicles have fuel stored on-board in vacuum insulated storage tanks. The LNG vehicles are equipped with dual fuel engines that operate similarly to a diesel engine and use 5 % diesel to pilot the ignition of fuel in the cylinder during each combustion stroke. Due to the higher energy density of the LNG fuel stored the km driving range between fuel stops for LNG vehicles is considerably longer than for CNG. For both CNG and LNG vehicles, a 10 % lower fuel economy compared to diesel is assumed in the biogas scenario calculations as the long-term difference between these two technologies based on ICCT (2015). In Table 2.5 the potential fuel consumption for biogas is given for the years 2013, 2020, 2030 and 2035. The potential biogas consumption is simply stated for the different years with no considerations of the fact that that it will take time for biogas vehicles to penetrate the market and time to build up a network of gas filling stations. The potential fuel consumption for substitution of biogas is around 50 PJ under the stated assumptions with the largest share for trucks (up to 38 PJ in 2035).
Table 2.4. Assumptions of percentage coverage of biogas per vehicle type for Danish road transport in 2013 and the scenario years 2020, 2025, 2030 and 2035 based on assumptions of substitution of electricity where feasible
Trafikdage på Aalborg Universitet 2017 ISSN 1603-9696 9
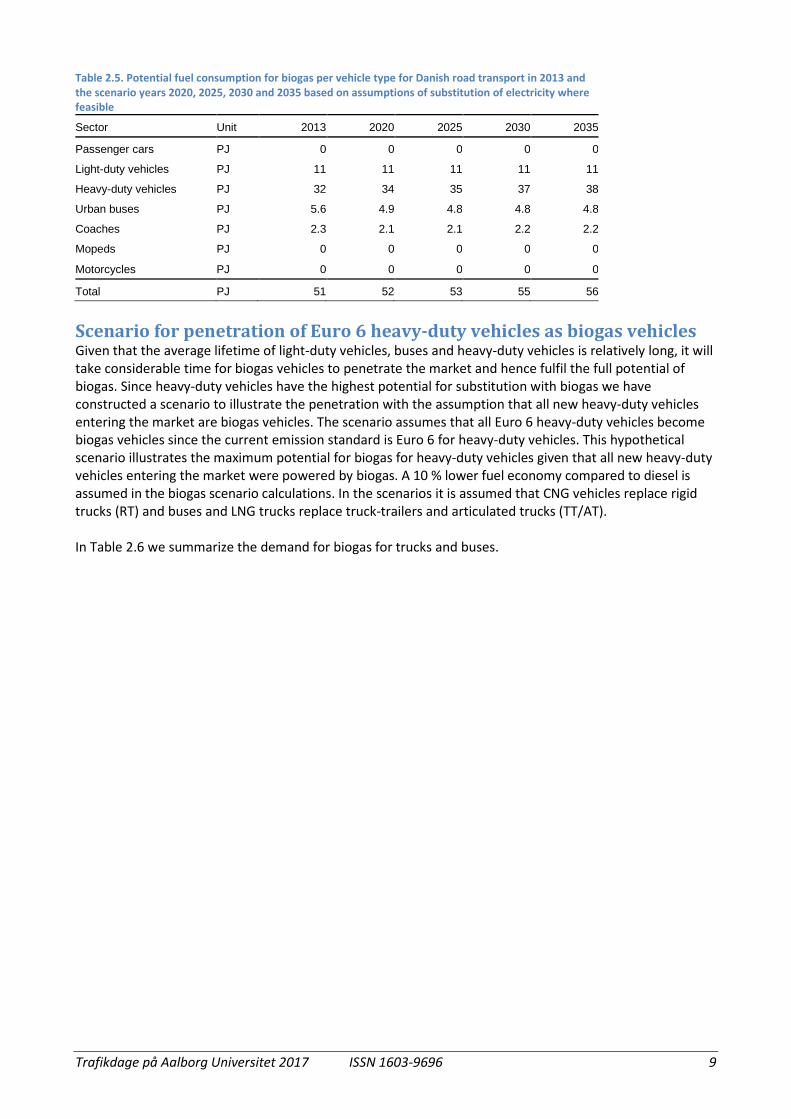
Scenario for penetration of Euro 6 heavy-duty vehicles as biogas vehicles Given that the average lifetime of light-duty vehicles, buses and heavy-duty vehicles is relatively long, it will take considerable time for biogas vehicles to penetrate the market and hence fulfil the full potential of biogas. Since heavy-duty vehicles have the highest potential for substitution with biogas we have constructed a scenario to illustrate the penetration with the assumption that all new heavy-duty vehicles entering the market are biogas vehicles. The scenario assumes that all Euro 6 heavy-duty vehicles become biogas vehicles since the current emission standard is Euro 6 for heavy-duty vehicles. This hypothetical scenario illustrates the maximum potential for biogas for heavy-duty vehicles given that all new heavy-duty vehicles entering the market were powered by biogas. A 10 % lower fuel economy compared to diesel is assumed in the biogas scenario calculations. In the scenarios it is assumed that CNG vehicles replace rigid trucks (RT) and buses and LNG trucks replace truck-trailers and articulated trucks (TT/AT). In Table 2.6 we summarize the demand for biogas for trucks and buses.
Table 2.5. Potential fuel consumption for biogas per vehicle type for Danish road transport in 2013 and the scenario years 2020, 2025, 2030 and 2035 based on assumptions of substitution of electricity where feasible
Sector Unit 2013 2020 2025 2030 2035
Passenger cars PJ 0 0 0 0 0
Light-duty vehicles PJ 11 11 11 11 11
Heavy-duty vehicles PJ 32 34 35 37 38
Urban buses PJ 5.6 4.9 4.8 4.8 4.8
Coaches PJ 2.3 2.1 2.1 2.2 2.2
Mopeds PJ 0 0 0 0 0
Motorcycles PJ 0 0 0 0 0
Total PJ 51 52 53 55 56
Trafikdage på Aalborg Universitet 2017 ISSN 1603-9696 10
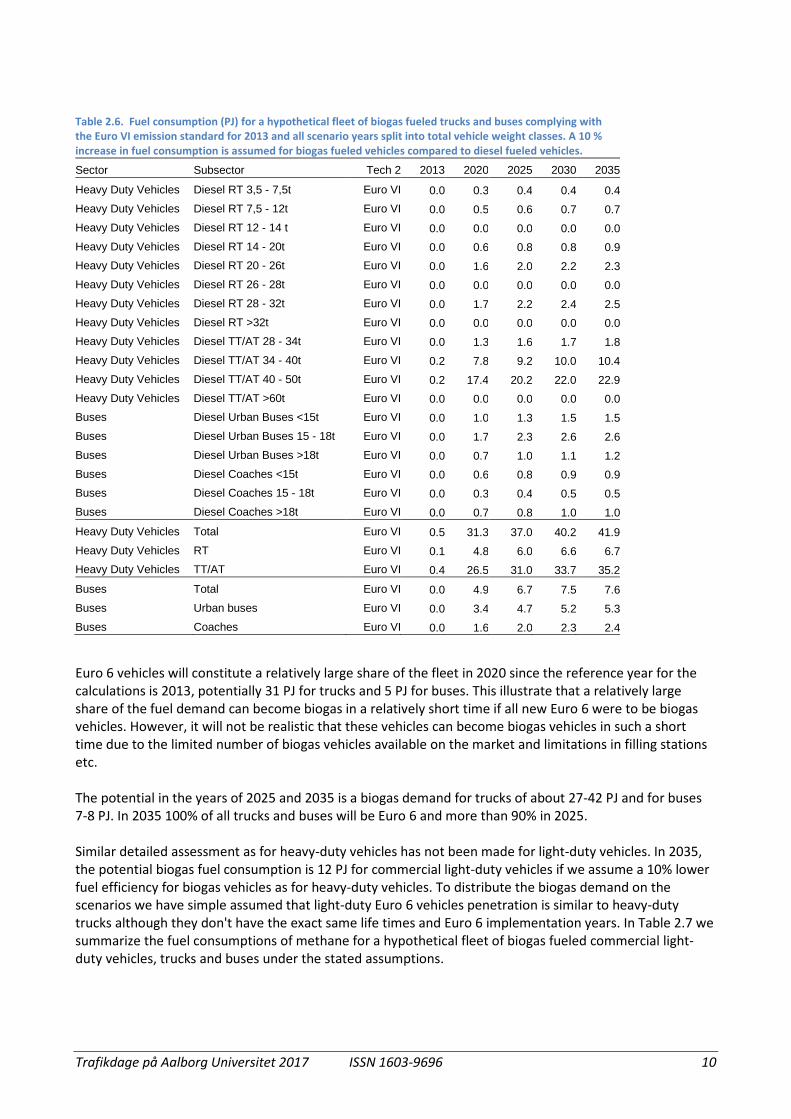
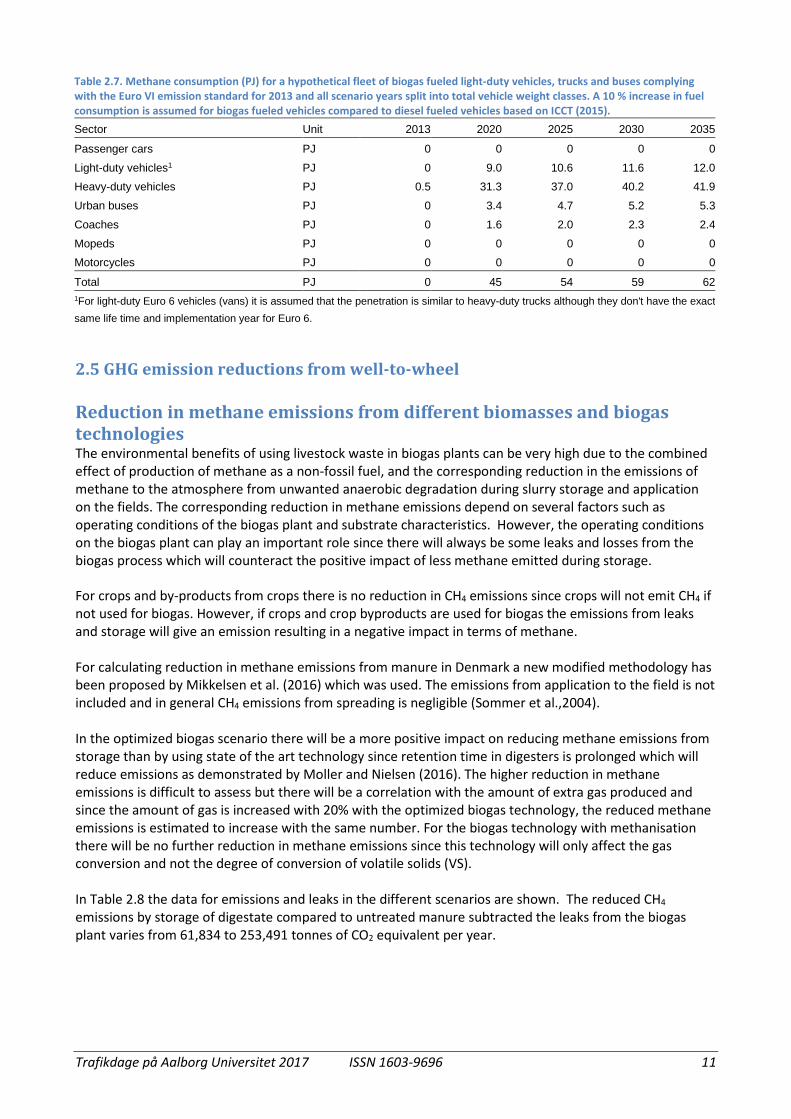
Euro 6 vehicles will constitute a relatively large share of the fleet in 2020 since the reference year for the calculations is 2013, potentially 31 PJ for trucks and 5 PJ for buses. This illustrate that a relatively large share of the fuel demand can become biogas in a relatively short time if all new Euro 6 were to be biogas vehicles. However, it will not be realistic that these vehicles can become biogas vehicles in such a short time due to the limited number of biogas vehicles available on the market and limitations in filling stations etc. The potential in the years of 2025 and 2035 is a biogas demand for trucks of about 27-42 PJ and for buses 7-8 PJ. In 2035 100% of all trucks and buses will be Euro 6 and more than 90% in 2025. Similar detailed assessment as for heavy-duty vehicles has not been made for light-duty vehicles. In 2035, the potential biogas fuel consumption is 12 PJ for commercial light-duty vehicles if we assume a 10% lower fuel efficiency for biogas vehicles as for heavy-duty vehicles. To distribute the biogas demand on the scenarios we have simple assumed that light-duty Euro 6 vehicles penetration is similar to heavy-duty trucks although they don't have the exact same life times and Euro 6 implementation years. In Table 2.7 we summarize the fuel consumptions of methane for a hypothetical fleet of biogas fueled commercial light-duty vehicles, trucks and buses under the stated assumptions.
Table 2.6. Fuel consumption (PJ) for a hypothetical fleet of biogas fueled trucks and buses complying with the Euro VI emission standard for 2013 and all scenario years split into total vehicle weight classes. A 10 % increase in fuel consumption is assumed for biogas fueled vehicles compared to diesel fueled vehicles.
Sector Subsector Tech 2 2013 2020 2025 2030 2035
Heavy Duty Vehicles Diesel RT 3,5 - 7,5t Euro VI 0.0 0.3 0.4 0.4 0.4 Heavy Duty Vehicles Diesel RT 7,5 - 12t Euro VI 0.0 0.5 0.6 0.7 0.7 Heavy Duty Vehicles Diesel RT 12 - 14 t Euro VI 0.0 0.0 0.0 0.0 0.0 Heavy Duty Vehicles Diesel RT 14 - 20t Euro VI 0.0 0.6 0.8 0.8 0.9 Heavy Duty Vehicles Diesel RT 20 - 26t Euro VI 0.0 1.6 2.0 2.2 2.3 Heavy Duty Vehicles Diesel RT 26 - 28t Euro VI 0.0 0.0 0.0 0.0 0.0 Heavy Duty Vehicles Diesel RT 28 - 32t Euro VI 0.0 1.7 2.2 2.4 2.5 Heavy Duty Vehicles Diesel RT >32t Euro VI 0.0 0.0 0.0 0.0 0.0 Heavy Duty Vehicles Diesel TT/AT 28 - 34t Euro VI 0.0 1.3 1.6 1.7 1.8 Heavy Duty Vehicles Diesel TT/AT 34 - 40t Euro VI 0.2 7.8 9.2 10.0 10.4 Heavy Duty Vehicles Diesel TT/AT 40 - 50t Euro VI 0.2 17.4 20.2 22.0 22.9 Heavy Duty Vehicles Diesel TT/AT >60t Euro VI 0.0 0.0 0.0 0.0 0.0 Buses Diesel Urban Buses <15t Euro VI 0.0 1.0 1.3 1.5 1.5 Buses Diesel Urban Buses 15 - 18t Euro VI 0.0 1.7 2.3 2.6 2.6 Buses Diesel Urban Buses >18t Euro VI 0.0 0.7 1.0 1.1 1.2 Buses Diesel Coaches <15t Euro VI 0.0 0.6 0.8 0.9 0.9 Buses Diesel Coaches 15 - 18t Euro VI 0.0 0.3 0.4 0.5 0.5 Buses Diesel Coaches >18t Euro VI 0.0 0.7 0.8 1.0 1.0 Heavy Duty Vehicles Total Euro VI 0.5 31.3 37.0 40.2 41.9 Heavy Duty Vehicles RT Euro VI 0.1 4.8 6.0 6.6 6.7 Heavy Duty Vehicles TT/AT Euro VI 0.4 26.5 31.0 33.7 35.2 Buses Total Euro VI 0.0 4.9 6.7 7.5 7.6 Buses Urban buses Euro VI 0.0 3.4 4.7 5.2 5.3 Buses Coaches Euro VI 0.0 1.6 2.0 2.3 2.4
Trafikdage på Aalborg Universitet 2017 ISSN 1603-9696 11
2.5 GHG emission reductions from well-to-wheel Reduction in methane emissions from different biomasses and biogas technologies The environmental benefits of using livestock waste in biogas plants can be very high due to the combined effect of production of methane as a non-fossil fuel, and the corresponding reduction in the emissions of methane to the atmosphere from unwanted anaerobic degradation during slurry storage and application on the fields. The corresponding reduction in methane emissions depend on several factors such as operating conditions of the biogas plant and substrate characteristics. However, the operating conditions on the biogas plant can play an important role since there will always be some leaks and losses from the biogas process which will counteract the positive impact of less methane emitted during storage.
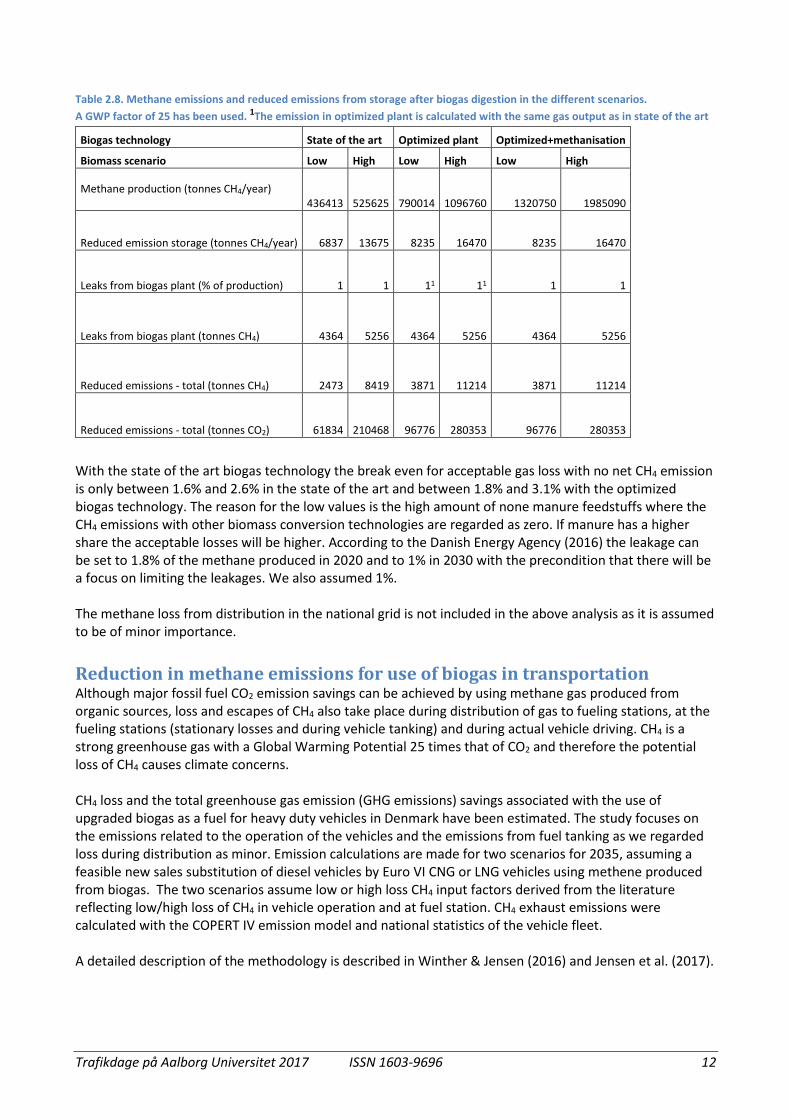
For crops and by-products from crops there is no reduction in CH4 emissions since crops will not emit CH4 if not used for biogas. However, if crops and crop byproducts are used for biogas the emissions from leaks and storage will give an emission resulting in a negative impact in terms of methane. For calculating reduction in methane emissions from manure in Denmark a new modified methodology has been proposed by Mikkelsen et al. (2016) which was used. The emissions from application to the field is not included and in general CH4 emissions from spreading is negligible (Sommer et al.,2004). In the optimized biogas scenario there will be a more positive impact on reducing methane emissions from storage than by using state of the art technology since retention time in digesters is prolonged which will reduce emissions as demonstrated by Moller and Nielsen (2016). The higher reduction in methane emissions is difficult to assess but there will be a correlation with the amount of extra gas produced and since the amount of gas is increased with 20% with the optimized biogas technology, the reduced methane emissions is estimated to increase with the same number. For the biogas technology with methanisation there will be no further reduction in methane emissions since this technology will only affect the gas conversion and not the degree of conversion of volatile solids (VS). In Table 2.8 the data for emissions and leaks in the different scenarios are shown. The reduced CH4 emissions by storage of digestate compared to untreated manure subtracted the leaks from the biogas plant varies from 61,834 to 253,491 tonnes of CO2 equivalent per year.
Table 2.7. Methane consumption (PJ) for a hypothetical fleet of biogas fueled light-duty vehicles, trucks and buses complying with the Euro VI emission standard for 2013 and all scenario years split into total vehicle weight classes. A 10 % increase in fuel consumption is assumed for biogas fueled vehicles compared to diesel fueled vehicles based on ICCT (2015). Sector Unit 2013 2020 2025 2030 2035
Total PJ 0 45 54 59 62 1For light-duty Euro 6 vehicles (vans) it is assumed that the penetration is similar to heavy-duty trucks although they don't have the exact same life time and implementation year for Euro 6.
Trafikdage på Aalborg Universitet 2017 ISSN 1603-9696 12
Table 2.8. Methane emissions and reduced emissions from storage after biogas digestion in the different scenarios. A GWP factor of 25 has been used. 1The emission in optimized plant is calculated with the same gas output as in state of the art
With the state of the art biogas technology the break even for acceptable gas loss with no net CH4 emission is only between 1.6% and 2.6% in the state of the art and between 1.8% and 3.1% with the optimized biogas technology. The reason for the low values is the high amount of none manure feedstuffs where the CH4 emissions with other biomass conversion technologies are regarded as zero. If manure has a higher share the acceptable losses will be higher. According to the Danish Energy Agency (2016) the leakage can be set to 1.8% of the methane produced in 2020 and to 1% in 2030 with the precondition that there will be a focus on limiting the leakages. We also assumed 1%. The methane loss from distribution in the national grid is not included in the above analysis as it is assumed to be of minor importance. Reduction in methane emissions for use of biogas in transportation Although major fossil fuel CO2 emission savings can be achieved by using methane gas produced from organic sources, loss and escapes of CH4 also take place during distribution of gas to fueling stations, at the fueling stations (stationary losses and during vehicle tanking) and during actual vehicle driving. CH4 is a strong greenhouse gas with a Global Warming Potential 25 times that of CO2 and therefore the potential loss of CH4 causes climate concerns. CH4 loss and the total greenhouse gas emission (GHG emissions) savings associated with the use of upgraded biogas as a fuel for heavy duty vehicles in Denmark have been estimated. The study focuses on the emissions related to the operation of the vehicles and the emissions from fuel tanking as we regarded loss during distribution as minor. Emission calculations are made for two scenarios for 2035, assuming a feasible new sales substitution of diesel vehicles by Euro VI CNG or LNG vehicles using methene produced from biogas. The two scenarios assume low or high loss CH4 input factors derived from the literature reflecting low/high loss of CH4 in vehicle operation and at fuel station. CH4 exhaust emissions were calculated with the COPERT IV emission model and national statistics of the vehicle fleet. A detailed description of the methodology is described in Winther & Jensen (2016) and Jensen et al. (2017).
Biogas technology State of the art Optimized plant Optimized+methanisation
Biomass scenario Low High Low High Low High
Methane production (tonnes CH4/year) 436413 525625 790014 1096760 1320750 1985090
Trafikdage på Aalborg Universitet 2017 ISSN 1603-9696 13
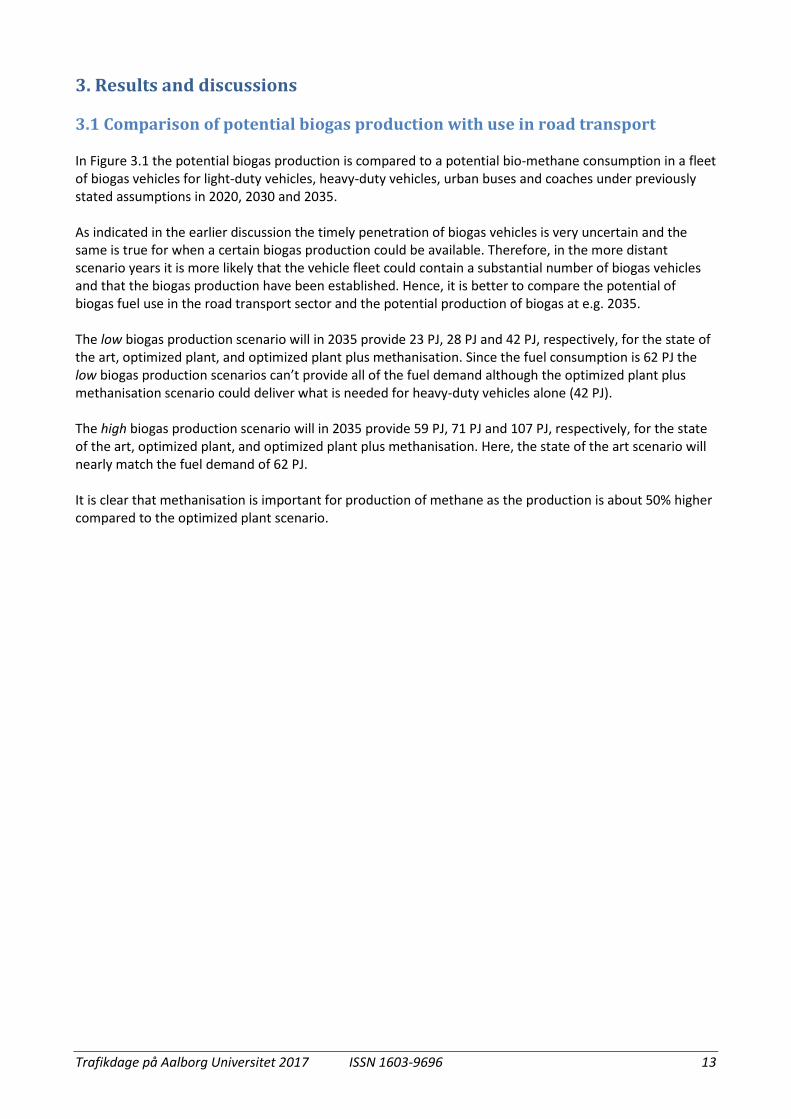
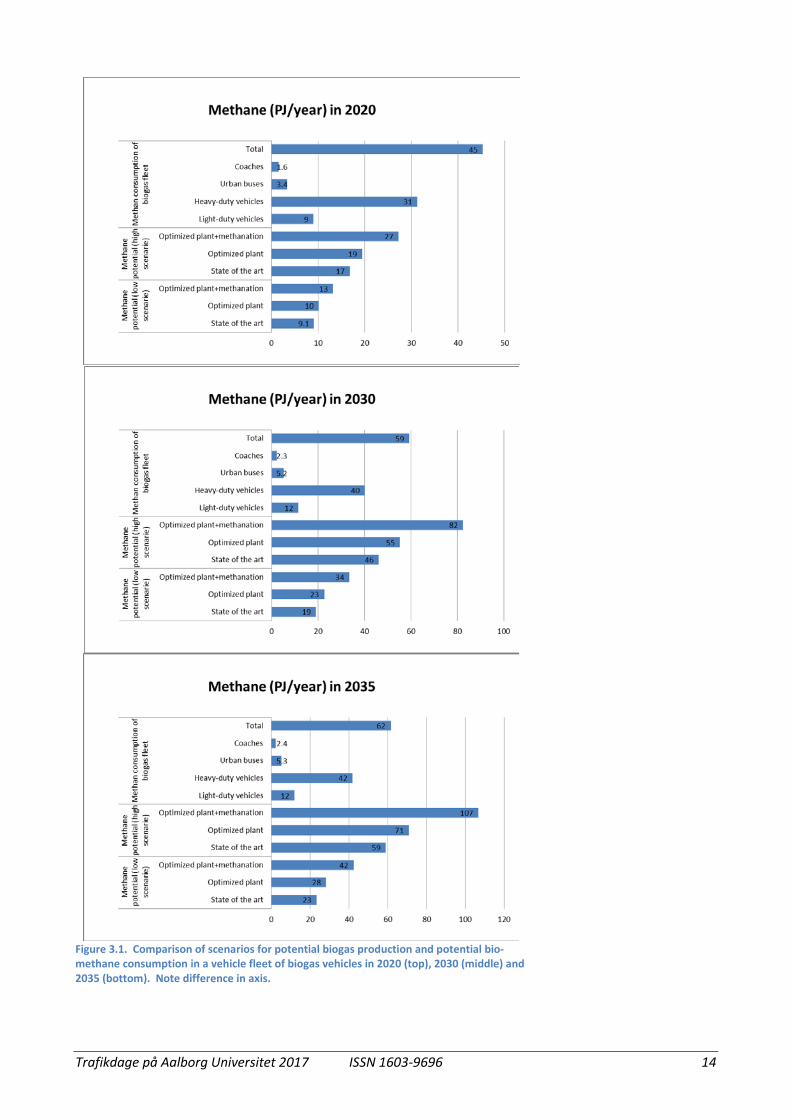
3. Results and discussions 3.1 Comparison of potential biogas production with use in road transport In Figure 3.1 the potential biogas production is compared to a potential bio-methane consumption in a fleet of biogas vehicles for light-duty vehicles, heavy-duty vehicles, urban buses and coaches under previously stated assumptions in 2020, 2030 and 2035. As indicated in the earlier discussion the timely penetration of biogas vehicles is very uncertain and the same is true for when a certain biogas production could be available. Therefore, in the more distant scenario years it is more likely that the vehicle fleet could contain a substantial number of biogas vehicles and that the biogas production have been established. Hence, it is better to compare the potential of biogas fuel use in the road transport sector and the potential production of biogas at e.g. 2035. The low biogas production scenario will in 2035 provide 23 PJ, 28 PJ and 42 PJ, respectively, for the state of the art, optimized plant, and optimized plant plus methanisation. Since the fuel consumption is 62 PJ the low biogas production scenarios can’t provide all of the fuel demand although the optimized plant plus methanisation scenario could deliver what is needed for heavy-duty vehicles alone (42 PJ). The high biogas production scenario will in 2035 provide 59 PJ, 71 PJ and 107 PJ, respectively, for the state of the art, optimized plant, and optimized plant plus methanisation. Here, the state of the art scenario will nearly match the fuel demand of 62 PJ. It is clear that methanisation is important for production of methane as the production is about 50% higher compared to the optimized plant scenario.
Trafikdage på Aalborg Universitet 2017 ISSN 1603-9696 14
Figure 3.1. Comparison of scenarios for potential biogas production and potential bio-methane consumption in a vehicle fleet of biogas vehicles in 2020 (top), 2030 (middle) and 2035 (bottom). Note difference in axis.
Trafikdage på Aalborg Universitet 2017 ISSN 1603-9696 15
3.2 Official projections of production and use of biogas The Danish Energy Agency has estimated a biogas production of about 4 PJ in 2012 and about 10 PJ in 2020 (Danish Energy Agency, 2014a). 10 PJ is very close to our low scenario for state-of-the-art/optimized plant in 2020 that also is around 10 PJ. The Danish Energy Agency has carried out different energy scenarios for the future. In these scenarios 17 PJ of biogas is assumed in 2020 and 42 PJ biogas in 2050 that could be boosted to 65 PJ by methanisation in the so-called wind scenario and hydrogen scenario. The use of biogas is targeted transport, industry and co-generation (Danish Energy Agency 2014a,b,c). For 2020 our scenarios range from 9 PJ to 27 PJ and in 2035 from 23 PJ to 107 PJ and hence illustrate a higher potential than the scenarios of the Danish Energy Agency. For transport the Danish Energy Agency envisions that only about 6 PJ is used for trucks and 1 PJ for buses and about 1 PJ for ships in 2035, increasing to 22 PJ for trucks, 3 PJ for buses and 3 PJ for ships in 2050. In 2035 our scenarios envision 42 PJ for trucks, 8 PJ for buses and also 12 PJ for commercial light-duty vehicles and none for ships. This is substantially higher than the scenarios of the Danish Energy Agency.
3.3 Objective of 10% renewable energy in transport sector in 2020 Denmark is via EU committed to an objective that renewable energies must cover at least 10% of the transport sector's energy consumption by 2020 (Directive 2009/28/EC). The objective includes the road and rail transport sector. In 2015 the Danish Energy Agency carried out at study that analysed the expected degree of fulfilment in 2020 and outline options for compliance in 2020 (Danish Energy Agency, 2015), see Table 3.1.
The 10% objective corresponds to about 15.3 PJ (Danish Energy Agency, 2015). The analysis shows that 2.4% is still missing for compliance in 2020. This is equal to about 3.7 PJ. The Danish Energy Agency has outlined different examples of how compliance could be reached in 2020 based on scenarios for increased blending of biofuels. One of the examples includes biogas for urban buses. Where 340 urban buses in 2020 would use 0.38 PJ corresponding to 0.49 percentage points (includes that biogas is a 2G biofuel that counts double). For 2020 our biogas production scenarios range from 9 PJ to 27 PJ and the biogas fuel use potential for urban buses is 3.4 PJ and trucks 31 PJ. This illustrates a large potential for biogas for heavy-duty vehicles to fulfil the political target of 10% renewables in 2020 but requires quick implementation of initiatives. 3.4 Summary of reduced GHG emissions from production and use of biogas In Table 3.2 the reduced GHG emissions from production of biogas in the defined biomass and biogas technology scenarios are related to the reduced GHG emissions from substitution of diesel with biogas for heavy-duty vehicles in 2035 including the CH4 loss from vehicle operation and fuel stations.
Table 3.1. Expected fulfilment of 10% renewables in the transport sector in 2020 Percentage Objective in 2020 10 5.75 blending of E5 (5% ethanol) and B7 (7% biodiesel) 5.6 Electric vehicles (70% renewable energy) 0.1 Electric trains (70% renewable energy) 1.9 Still missing 2.4
Trafikdage på Aalborg Universitet 2017 ISSN 1603-9696 16
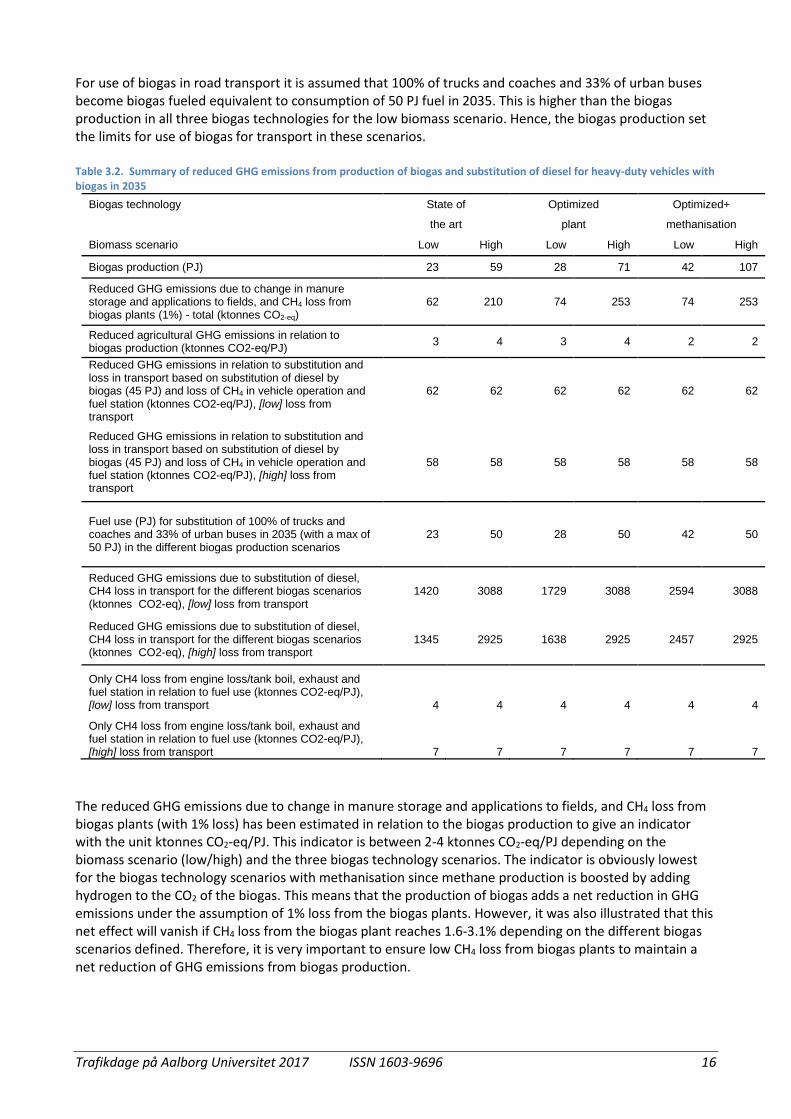
For use of biogas in road transport it is assumed that 100% of trucks and coaches and 33% of urban buses become biogas fueled equivalent to consumption of 50 PJ fuel in 2035. This is higher than the biogas production in all three biogas technologies for the low biomass scenario. Hence, the biogas production set the limits for use of biogas for transport in these scenarios.
Table 3.2. Summary of reduced GHG emissions from production of biogas and substitution of diesel for heavy-duty vehicles with biogas in 2035
Biogas technology State of Optimized Optimized+ the art plant methanisation
Biomass scenario Low High Low High Low High
Biogas production (PJ) 23 59 28 71 42 107
Reduced GHG emissions due to change in manure storage and applications to fields, and CH4 loss from biogas plants (1%) - total (ktonnes CO2-eq)
62 210 74 253 74 253
Reduced agricultural GHG emissions in relation to biogas production (ktonnes CO2-eq/PJ) 3 4 3 4 2 2
Reduced GHG emissions in relation to substitution and loss in transport based on substitution of diesel by biogas (45 PJ) and loss of CH4 in vehicle operation and fuel station (ktonnes CO2-eq/PJ), [low] loss from transport
62 62 62 62 62 62
Reduced GHG emissions in relation to substitution and loss in transport based on substitution of diesel by biogas (45 PJ) and loss of CH4 in vehicle operation and fuel station (ktonnes CO2-eq/PJ), [high] loss from transport
58 58 58 58 58 58
Fuel use (PJ) for substitution of 100% of trucks and coaches and 33% of urban buses in 2035 (with a max of 50 PJ) in the different biogas production scenarios
23 50 28 50 42 50
Reduced GHG emissions due to substitution of diesel, CH4 loss in transport for the different biogas scenarios (ktonnes CO2-eq), [low] loss from transport
1420 3088 1729 3088 2594 3088
Reduced GHG emissions due to substitution of diesel, CH4 loss in transport for the different biogas scenarios (ktonnes CO2-eq), [high] loss from transport
1345 2925 1638 2925 2457 2925
Only CH4 loss from engine loss/tank boil, exhaust and fuel station in relation to fuel use (ktonnes CO2-eq/PJ), [low] loss from transport 4 4 4 4 4 4
Only CH4 loss from engine loss/tank boil, exhaust and fuel station in relation to fuel use (ktonnes CO2-eq/PJ), [high] loss from transport 7 7 7 7 7 7
The reduced GHG emissions due to change in manure storage and applications to fields, and CH4 loss from biogas plants (with 1% loss) has been estimated in relation to the biogas production to give an indicator with the unit ktonnes CO2-eq/PJ. This indicator is between 2-4 ktonnes CO2-eq/PJ depending on the biomass scenario (low/high) and the three biogas technology scenarios. The indicator is obviously lowest for the biogas technology scenarios with methanisation since methane production is boosted by adding hydrogen to the CO2 of the biogas. This means that the production of biogas adds a net reduction in GHG emissions under the assumption of 1% loss from the biogas plants. However, it was also illustrated that this net effect will vanish if CH4 loss from the biogas plant reaches 1.6-3.1% depending on the different biogas scenarios defined. Therefore, it is very important to ensure low CH4 loss from biogas plants to maintain a net reduction of GHG emissions from biogas production.
Trafikdage på Aalborg Universitet 2017 ISSN 1603-9696 17
GHG emissions are reduced due to substitution of diesel when biogas is used to fuel heavy-duty vehicles. However, counteracting this to some degree is the loss of CH4 in vehicle operation and at fuel stations. Similar to the above agricultural GHG emission reduction indicator an indicator has been calculated for transport based on the reduced GHG emissions in relation to diesel substitution and CH4 loss in transport in relation to fuel use to give an indicator with the unit ktonnes CO2-eq/PJ. This transport GHG emission reduction indicator is calculated for the two assumptions low/high of CH4 loss in transport. The reduction is 62 and 58 ktonnes CO2-eq/PJ for the low and high CH4 loss in transport, respectively. This net GHG emission reduction for transport is 15-30 times higher per PJ than the net GHG emission reduction from biogas production since a fossil fuel is substituted and GHG emissions avoided. However, it was also illustrated that the assumptions of the CH4 loss in transport are uncertain and higher losses can jeopardize the net benefits substantially. Therefore, it is very important to ensure low CH4 loss in transport. In a long-term climate perspective no net methane emission could be envision for the transport sector to have a CO2 neutral transport sector based on only renewable fuels. This implies that reductions in methane emissions from using biogas plants should not be counteracted by the methane loss in transport. This means that CO2 savings for substitution of diesel can’t be included as the transport sector has to operate on renewable fuels. The CH4 loss in transport is 4 and 7 ktonnes CO2-eq/PJ for the low and high CH4 loss, respectively. These losses are in most cases equal to or exceed the net benefits from biogas production that showed 2-4 ktonnes CO2-eq/PJ depending on the biomass scenario (low/high) and the three biogas technology scenarios. This illustrate that further reductions of CH4 losses from vehicles and filling stations are important to ensure a CO2 neutral transport sector when running on bio-methane. 3.5 Climate policy objective for 2030 The new EU climate policy stipulates that GHG emissions from the non-ETS sector (mainly transport, housing and agriculture) must be reduced by 30% in 2030 compared to the 2005-level in EU. In 2016 the EU Commission published the proposal for burden sharing, in which the proposed Danish reduction target is 39% (COM, 2016). There are two flexibility options that can be included in fulfilling the reduction target. Up to 4%-points from reductions in the LULUCF sector (Land Use, Land Use Change and Forestry – development of soil carbon content) and up to 2%-points for ETS quotas by cancelling ETS quotas (within energy and industry sectors) (Danish Climate Council, 2016). The most recent national projection of GHG emissions for the agricultural and transport sector covers 1990-2025 (Nielsen et al., 2016). However, to be able to compare with emission projections for 2030 and 2035, the previous national GHG projections are used including the years 2013-2035 (Nielsen et al. (2014)), and the base year of 2005 is taken from Nielsen et al. (2016). The difference between these two datasets for the first shared year of 2013 is within 2% for the transport sector and 0.2% for agriculture. The prediction for 2030 and 2035 in relation to 2005 is shown in Table 7.6.
The predictions for future years include already decided policies that will affect future emissions. It is seen that the difference between 2030 and 2035 is very small, less than 0.5%.
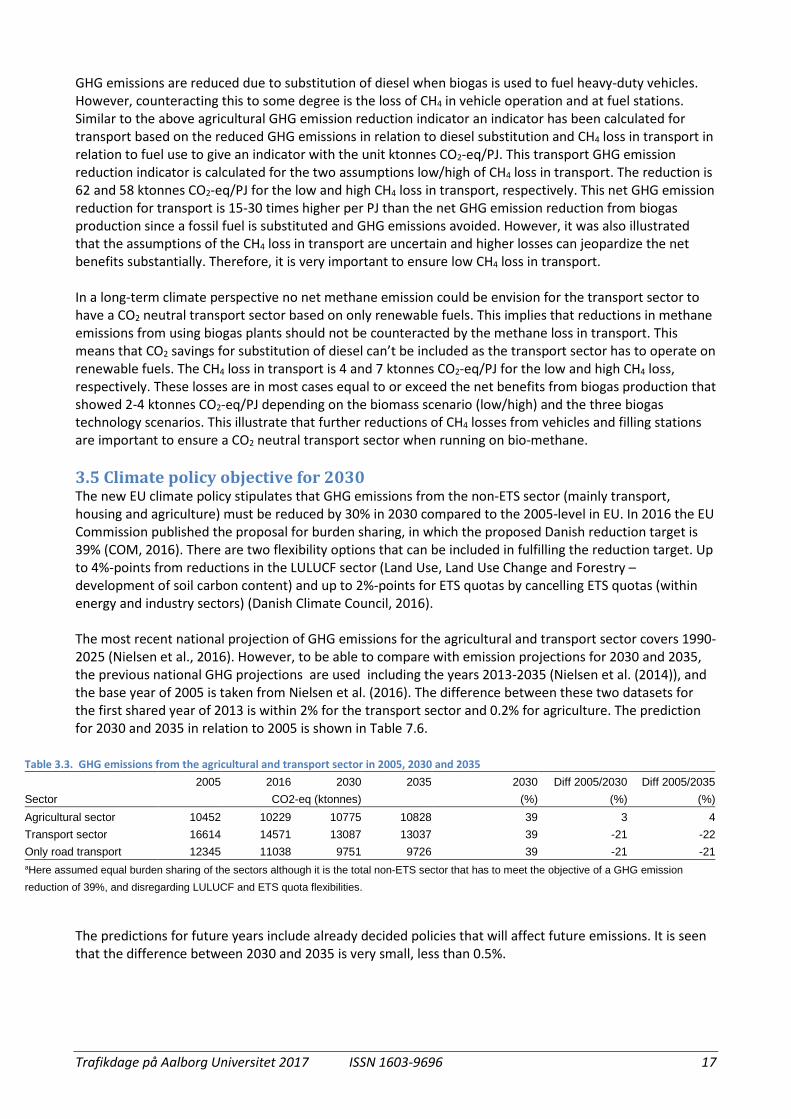
Table 3.3. GHG emissions from the agricultural and transport sector in 2005, 2030 and 2035
2005 2016 2030 2035 2030 Diff 2005/2030 Diff 2005/2035 Sector CO2-eq (ktonnes) (%) (%) (%) Agricultural sector 10452 10229 10775 10828 39 3 4 Transport sector 16614 14571 13087 13037 39 -21 -22 Only road transport 12345 11038 9751 9726 39 -21 -21 aHere assumed equal burden sharing of the sectors although it is the total non-ETS sector that has to meet the objective of a GHG emission reduction of 39%, and disregarding LULUCF and ETS quota flexibilities.
Trafikdage på Aalborg Universitet 2017 ISSN 1603-9696 18
For the transport sector in total and for road transport alone GHG emissions are expected to decrease by around 21-22% towards 2030/2035 whereas GHG emissions of the agricultural sector increase 3-4%. Comparing GHG emissions of 2016 in relation to 2005, transport sector emissions have decreased 12% whereas emissions of the agriculture sector have decreased 2%. As before mentioned, the non-ETS sectors (transport, housing and agriculture) have to reduce GHG emissions by 39% towards 2030 in relation to 2005. If we assume an equal burden sharing of 39% for all sectors then additional policy measures are needed to reduce GHG emissions from the transport sector and even more so for the agricultural sector. The biomass and biogas scenarios reduce agricultural GHG emissions by 62 to 253 ktonnes CO2-eq depending on the scenario. As the scenarios represent maximum potentials under given assumptions it could be assumed to represent 2030. Compared to the objective of a 39% reduction of agricultural GHG emissions (4076 ktonnes CO2-eq) the production of biogas will contribute with reduction of GHG emissions with 0.6 to 2.4%-points depending on scenario. The reduced GHG emissions for using biogas for heavy-duty vehicles in 2035 range from 1345 to 3088 ktonnes CO2-eq depending on scenario and depending on assumptions made about CH4 loss of transport. Compared to the objective of a 39% reduction of transport GHG emissions (6479 ktonnes CO2-eq) a biogas fuel coverage of 100% for trucks and coaches and 33% for urban buses will contribute with 8 to 19%-points. The gap for the transport sector for compliance with the objective of 39% is 17%-points starting from 2016. The scenario with the lowest GHG emission reduction will contribute significantly to meeting the objective in 2030 and the scenario with the highest GHG emission reduction will almost close the gap.
3.6 Long-term objective for 2050 The government has a long-term objective of becoming a low carbon society based on a renewable energy sector and significantly lower GHG emissions for other sectors in 2050 (Danish Climate Law, 2014). In a long-term perspective of 2050 with a fossil-free transport sector preferably no net GHG emissions should arise from transport based on biogas. With the high level scenario of CH4 loss in transport net GHG emissions will be generated and only in the high biomass scenario of the state-of-art and optimized biogas technology scenarios no net GHG emissions occur as gains in agricultural match CH4 losses in transport. From a well-to-wheel climate perspective this illustrates the importance of further reducing CH4 loss in biogas production to increase the GHG emission reductions in agriculture, and further reductions of CH4 loss related to the vehicles in transport in order to minimize the total transport related GHG emissions. 4. Conclusion The potential fuel consumption that could be substituted with biogas is around 56 PJ for road transport with the assumptions that 100% of trucks, coaches, and urban buses and 50% of light-duty vehicles (vans) could run on biogas, and remaining vehicles are assumed to be substituted with mainly electricity. The potential of 56 PJ is about 1/3 of the fuel consumption of the entire road transportation sector. Trucks have the largest potential equal to about 38 PJ. Since gas engines have a 10 % lower energy efficiency compared to diesel the corresponding biogas needed is 42 PJ. Since it takes time for new biogas vehicles to penetrate the vehicle fleet a scenario was constructed to illustrate this. The scenario assumes that all Euro 6 trucks and buses become biogas vehicles since the current emission standard is Euro 6. This scenario showed that the full potential of 42 PJ for trucks is achieved not until 2035. For light-duty Euro 6 vehicles penetration we have simple assumed that light-duty Euro 6 vehicles penetration is similar to heavy-duty vehicles although they don't have the exact same life times and Euro 6 implementation years. The low biomass biogas production scenarios will in 2035 provide 23 PJ, 28 PJ and 42 PJ, respectively, for the state of the art, optimized plant, and optimized plant plus methanisation. The fuel consumption is 62 PJ for the scenario of light-duty and heavy-duty vehicles in 2035, the hence the low biogas production
Trafikdage på Aalborg Universitet 2017 ISSN 1603-9696 19
scenarios cannot provide all of the fuel demanded although optimized plant plus methanisation scenario could deliver what is needed for trucks alone (42 PJ). The high biomass biogas production scenario will in 2035 provide 59 PJ, 71 PJ and 107 PJ, respectively, for the state of the art, optimized plant, and optimized plant plus methanisation. Here, the state of the art scenario will nearly match the fuel demand of 62 PJ. It is clear that methanisation is important for production of methane as the production is about 50% higher compared to the optimized plant scenario. The reduced GHG emissions due to change in manure storage and applications to fields, and CH4 loss from biogas plants show a net reduction in GHG emissions under the assumption of 1% loss from the biogas plants similar to assumption of the Danish Energy Agency. However, it was also shown that this net effect will vanish if CH4 loss from the biogas plant reaches 1.6-3.1% depending on the different biogas scenarios defined. GHG emissions are reduced due to substitution of diesel when biogas is used to fuel heavy-duty vehicles. However, counteracting this to some degree is the loss of CH4 in vehicle operation and at fuel stations. The net GHG emission reduction for transport is 15-30 times higher per PJ than the net GHG emission reduction from biogas production since a fossil fuel is substituted and GHG emissions avoided. However, it was also shown that the assumptions of the CH4 loss in transport are uncertain and higher losses can jeopardize the net benefits substantially. There is a large potential for biogas for heavy-duty vehicles to fulfil the EU target of 10% renewables in 2020 but it requires quick implementation of initiatives. The scenario with the lowest GHG emission reduction will contribute significantly to meeting the objective in 2030 (39% reduction in relation to 2005) and the scenario with the highest GHG emission reduction will almost close the gap. A significant contribution can also be made to become a low carbon society in 2050. However, to have no net GHG emissions from using biogas in road transport in a well-to-wheel perspective is only achieved in the high biomass scenario of the state-of-art and optimized biogas technology scenarios as gains in agricultural match CH4 losses in transport whereas other scenarios require lower CH4 losses. References Birkmose, T., Hjort-Gregersen, K., Hinge, J., Hørfarter, R. 2015. Kortlægning af hensigtsmæssig lokalisering
af nye biogasanlæg i Danmark - Udpegning af områder med særlige muligheder for biogasanlæg. Rapport udarbejdet for Biogasrejseholdet, Erhvervsstyrelsen. In Danish.
Danish Energy Agency (2014a): Danmarks Energi- og Klimafremskrivning 2014 (Danish Energy and Climate Forecasts). Oktober 2014. 76 s. In Danish.
Danish Energy Agency (2014b): Biogas i Danmark– status, barrierer og perspektiver. Februar 2014. 101 s. In Danish.
Danish Energy Agency (2014c): Energiscenarier frem mod 2020, 2035 og 2050. Marts 2014. 103 s. In Danish. Danish Energy Agency (2015): Analyse af alternative muligheder til opfyldelse af 2020 målet for VE til
transport. December 2015. In Danish. Danish Energy Agency (2016): Effekt af biogasproduktion på drivhusgasemissioner. Notat 4. oktober 2016. Danish Council on Climate Change (2016): Danmark og EU’s 2030-klimamål Analyse af Kommissionens
forslag til reduktionsmål uden for kvotesektoren. In Danish. Directive 2009/28/EC: DIRECTIVE 2009/28/EC OF THE EUROPEAN PARLIAMENT AND OF THE COUNCIL of 23
April 2009. On the promotion of the use of energy from renewable sources and amending and subsequently repealing Directives 2001/77/EC and 2003/30/EC.
Gylling, M., Jørgensen, U., Bentsen, N. S., Kristensen, I. T., Dalgaard, T., Felby, C., & Johannsen, V. K. (2013). The +10 Million Tonnes Study: Increasing the sustainable production of biomass for biorefineries. University of Copenhagen, 32p. In Danish.
Trafikdage på Aalborg Universitet 2017 ISSN 1603-9696 20
ICCT (2015): Assessment of heavy-duty natural gas vehicle emissions: Implications and policy recommendations, White Paper, 34 pp., July 2015. The International Council on Clean Transportation (ICCT).
Jensen, S.S., Jørgensen, U., Møller, H.B., Winther, M., Thomsen, M., Cong, R. Brandt, J. (2017): Biogas for transport - resources, environment and welfare economics. Synthesis Report. Aarhus University, DCE – Danish Centre for Environment and Energy, xx pp. Scientific Report from DCE – Danish Centre for Environment and Energy No. xxx http://dce2.au.dk/pub/SRxxx.pdf (under publication).
Jørgensen et al. (2013): Biomasseudnyttelse i Danmark – potentielle ressourcer og bæredygtighed. DCA Rapport nr. 033. http://web.agrsci.dk/djfpublikation/index.asp?action=show&id=1167. In Danish. Kristensen, I.T, Jørgensen, U. (2012): Baggrundsnotat. Forudsætninger for og beregning af biomassescenarier for landbruget. Institut for Agroøkologi, Aarhus Universitet
http://ifro.ku.dk/fotos/media_library/foi/docs/publikationer/rapporter/eksterne_rapporter/ti_mio_tons_plan/bpl6. In Danish.
Mikkelsen Mette Hjorth, Albrektsen Rikke, Gyldenkærne Steen. 2016. Biogasproduktionens konsekvenser for drivhusgasudledning i landbruget. DCE rapport nr. 197.
Møller H.B. and Karl Jørgen Nielsen. 2016. Biogas Taskforce - udvikling og effektivisering af biogasproduktionen i Danmark, DCA rapport, nr. 77, 2016.
Nielsen, O-K, Plejdrup, MS, Winther, M, Hjelgaard, K, Nielsen, M, Fauser, P, Mikkelsen, MH, Albrektsen, R, Gyldenkærne, S & Thomsen, M (2015): Projection of greenhouse gases 2013-2035. Aarhus University, DCE – Danish Centre for Environment and Energy. Scientific Report from DCE - Danish Centre for Environment and Energy, No. 129.
Sommer, S.G., Petersen S.O. & Møller, H.B. (2004). Algorithms for calculating methane and nitrous oxide emissions from manure management. Nutrient Cycling in Agroecosystems 69(2), 143-154.
Winther, M (2015): Danish emission inventories for road transport and other mobile sources: Inventories until the year 2013. Aarhus University, DCE – Danish Centre for Environment and Energy. Scientific Report from DCE - Danish Centre for Environment and Energy, No. 148.Winther, M, Jensen, S.S. (2016): Greenhouse gas emissions from heavy duty vehicles using upgraded biogas as a fuel. 21st International Transport and Air Pollution Conference, Lyon, France. May 24-26, 2016, 8 p.
Acknowledgement The study was funded by Danish Centre for Environment and Energy (DCE) under Aarhus University during 2014-2016.