125


Schedule of Contents
Annual Plan 2011/12, 28 June 2011 Page i
Schedule of Contents
Schedule of Contents ................................................................................................................................................. i
Chapter One: Context .............................................................................................................................................. 1
Chapter Two: Strategic Direction ............................................................................................................................... 7
Chapter Three: Delivering on Priorities & Targets ...................................................................................................... 15
Chapter Four: Forecast Service Performance ............................................................................................................. 42
Chapter Five: Stewardship ...................................................................................................................................... 68
Chapter Six: Service Configuration ........................................................................................................................... 77
Chapter Seven: Production Planning ......................................................................................................................... 78
Chapter Eight: Financial Performance ....................................................................................................................... 80
Chapter Nine: Schedule Appendices ......................................................................................................................... 84
Appendix A: Financial Statements & Capital Expenditure ............................................................................................. 85
Appendix B: Performance Measures .......................................................................................................................... 95
Appendix C: Allied Laundry Services Limited – Financial Statements & Accounting Policy ..............................................106
Appendix D: Schedule of Related Documents ...........................................................................................................110
Appendix E: Statement of Accounting Policies ..........................................................................................................111
Appendix F: Minister of Health’s Letter of Endorsement .............................................................................................118

Chapter One: Context
Annual Plan 2011/12, 28 June 2011 Page 1
Chapter One: Context
1.1 Foreword/Executive Summary
MidCentral DHB is proud to set out its plans for the year ahead.
We have completed a major turnaround of our organisational performance, and are now able to increase local cardiology and cancer capacity, and further enhance elective throughput. This work will occur in 2011/12.
In the early part of the year, the DHB will review its plans for secondary care services and establish an investment plan for other service development and associated capital works/equipment. This investment plan will reflect national, regional and local priorities.
MidCentral DHB has invested significantly in primary health care, and together with local providers and the Central Primary Health Organisation, is leading service development in this area. Implementation of the “better, sooner, more convenient” primary health care will continue, with a focus on establishing integrated family health services throughout the district, urgent community care, elder health, and chronic care.
MidCentral DHB sits within the Central Region of the NZ public health system. Together with the five other DHBs in the region, it will be developing clinical networks and service arrangements so our joint communities can be assured of timely access to sustainable health services, now and in the future.
We will also continue to work with our centralAlliance partner, Whanganui DHB, to progress shared services and back-office functions between our two organisations.
MidCentral DHB‟s strategies for the years ahead will advance the Government‟s health targets and priorities. They recognise New Zealand‟s current economic environment and the pressure on Government funding.
“Quality living – healthy lives”.
Phil Sunderland Chairman
Murray Georgel Chief Executive Officer
Hon Tony Ryall Minister of Health
Chapter One: Context
Annual Plan 2011/12, 28 June 2011 Page 2
1.2 Context
1.2.1 Background
MidCentral is one of 20 District Health Boards (DHBs) in New Zealand, and was established under the New Zealand Public Health and Disability Act 2000. This Act sets out the roles and functions of DHBs.
District Health Boards, as Crown Agents, are also considered Crown Entities, and covered by the Crown Entities Act 2004.
The statutory objectives of DHBs include:
improving, promoting and protecting the health of communities
promoting the integration of health services, especially primary and secondary care services
promoting effective care or support of those in need of personal health services or disability support.
1.2.2 Health Sector Context
Health and disability services in New Zealand are delivered by a complex network of organisations and people. The Minister and Ministry of Health provide leadership and work with District Health Boards, primary health organisations, non-government organisations, Crown entities, health professionals and others across the system to achieve better health for New Zealanders. DHBs are funders, planners and providers of health and disability services.
The Government‟s health policy, “better, sooner, more convenient” sets outs its aspirations for a high-quality, patient centred health system. Its goals are:
New Zealander‟s enjoy a long and healthy life
Patients to have better, sooner, more convenient healthcare
A public health system that continually improves
To meet the public‟s justified expectations.
In 2009, the Minister of Health established a Ministerial Review Group to determine how its goals could be achieved. This resulted in amendments to the New Zealand Public Health & Disability Act 2000 which strengthened the importance of national and regional planning. Entities were established to reduce duplication and bureaucracy with the health sector and free up funds for front-line care. These entities include the National Health Board, the National Health IT Board, Capital Investment Committee, Health Workforce New Zealand, and Health Quality & Safety Commission. Other entities‟ roles were strengthened for the same reason, including Health Benefits Ltd (national procurement), Pharmac and the National Health Committee.
A long term plan for the sector is under development, reflecting the new environment and looking at the models of care and service configurations required to meet New Zealanders‟ future health needs. This plan is entitled, “Strengthening our Health Services” and identifies key facets of a reconfigured health system:
Prevention, self-management and home-based services
Integrated family health centres, partnerships and teams
Hospital clusters and regional services
Planned specialisation and consolidation into a small number of centres
At a regional level, the six DHBs in the central region (MidCentral, Capital & Coast, Hawke‟s Bay, Hutt Valley, Wairarapa and Whanganui) have developed a Regional Service Plan which will achieve the Government‟s goals for their communities. Their aim is: “there will be a regionally co-ordinated system of health service planning and delivery that will lead to ongoing improvements in the sustainability, quality and accessibility of clinical services”.
Within the region, MidCentral DHB works closely with its neighbour, Whanganui DHB for the benefit of their shared population.
Other key strategies which influence health service planning and provision are the New Zealand Health Strategy, the New Zealand Disability Strategy, and the Treaty of Waitangi.

Chapter One: Context
Annual Plan 2011/12, 28 June 2011 Page 3
MidCentral DHB works within the parameters of the Government‟s health policy and legislative framework. It also works in collaboration with national agencies and other DHBs to plan, fund and deliver health and disability services.
1.2.3 Population & Health Profile
Our Geographic Area
The area for which the MidCentral District Health Board has responsibility is based on territorial authority and ward boundaries and includes: Manawatu District, Palmerston North City, Tararua District, Horowhenua District, and Kapiti District (Otaki Ward).
In terms of service provision, the board‟s Provider Division (MidCentral Health) provides regional services, such as the Regional Cancer Treatment Service and Breast Screening Coast to Coast, to a population of 540,000 people, encompassing the Wanganui, Wairarapa, Taranaki, Tairawhiti and Hawke‟s Bay.
The Health Status of our Population
The health status of the people in the MidCentral district continues to improve. MidCentral DHB undertakes regular health needs assessment of its population, with the latest update being carried out in 2009.
Consistent with previous years the five most common causes of mortality are: circulatory diseases, cancer, respiratory diseases, injuries, and endocrine diseases (mostly diabetes).
MidCentral DHB‟s district‟s population is growing but at a slower rate than other DHBs in New Zealand. Palmerston North accounts for most of the population growth. MidCentral‟s population structure is also ageing with the proportion of people aged 65 and older growing. By
comparison, New Zealand‟s proportion of people aged 65 and older has remained very similar. MidCentral district‟s percentage of Maori residents is increasing; this is paralleled by an increase in the district‟s proportion of Pacific and Asian residents.
An ageing population influences health care need, because most diseases and causes of disability are more common in older age groups. However, the proportion of people aged 65 and over is not uniform across MidCentral district. Horowhenua and the MidCentral portion of Kapiti have higher percentages, whereas Palmerston North and Manawatu have lower percentages. MidCentral‟s proportion of people aged 0 to 14 has decreased with New Zealand also showing the same pattern.
Mortality (and therefore health status) is improving for all the territorial authorities.
The most common causes of mortality for each of the territorial authorities are the same as for MidCentral DHB overall: circulatory diseases, cancer, respiratory diseases, injuries, and endocrine diseases (mostly diabetes). Although the gap may have narrowed, Horowhenua is still an area of disadvantaged health status, compared to MidCentral overall. Horowhenua, MidCentral DHB‟s portion of Kapiti Coast (Otaki and surrounding areas), and Tararua have higher proportions of Maori residents than the rest of MidCentral district.
The groups of people who experience health status disadvantage in MidCentral are Maori, Pacific peoples, and people experiencing socio-economic disadvantage. Horowhenua residents are highly representative of people who experience health status disadvantage. While there are signs that health service access is improving for people experiencing health status disadvantage, whenever there is an adverse trend, the effect seems to be greater for those already experiencing poorer health status.
MidCentral‟s discharge rates in relation to cataract surgery, major joint surgery, elective discharges and cardiac intervention are significantly below the expected rate. The DHB will need to focus on this in 2011/12.
The MidCentral Pacific population involves small numbers of people and is prone to random yearly fluctuations.

Chapter One: Context
Annual Plan 2011/12, 28 June 2011 Page 4
What Services Are Purchased ($m)
2009/10 2010/11 2011/12
Actual Budget Budget
Hospital-based Services
61.6 65.1 66.6 Surgical specialties, ICU and anaesthetics
48.3 45.2 46.5 Medical services
34.1 33.3 34.0 Regional cancer treatment service
30.3 27.7 28.2 Elder health and rehabilitation and therapy
28.6 27.6 28.5 Women's and child health
26.9 26.6 26.2 Mental health
12.9 13.4 13.1 Emergency department
7.3 7.7 8.9 Clinical support
6.9 7.0 6.6 Public health
3.3 3.5 3.8 Dental health
1.3 1.6 1.7 Rural health
20.0 17.8 18.3 Other
281.5 276.5 282.4 Total hospital-based services
Community-based Services
46.0 44.5 46.0 Pharmaceuticals
37.5 38.6 40.0 Residential care
25.6 26.3 27.2 Primary practice
9.7 9.9 10.2 Laboratories
10.6 10.9 11.1 Home support
9.1 9.2 9.1 Mental health
4.2 4.3 4.4 Chronic disease management
21.9 25.5 30.2 Other
164.6 169.2 178.2 Total community-based services
20.7 44.7 26.5 Disability services and needs assessment
1.6 1.4 1.6 Primary Health Nursing
45.9 46.4 47.7 Inter-district flows
5.1 5.4 5.9 Governance
519.4 543.6 542.3 Total DHB Expenditure
Who Provides Them ($m)
281.5 276.5 282.4 MidCentral Health
69.9 74.4 80.1 GPs, PHOs, non-govt owned providers
46.0 44.5 46.0 Community pharmacies
45.9 46.4 47.7 Other DHB's
37.5 38.6 40.0 Rest homes
20.7 44.7 26.5 Enable New Zealand
9.7 9.9 10.2 Community laboratories
5.1 5.4 5.9 MidCentral DHB - governance
1.6 1.4 1.6 Primary Health Nursing
1.5 1.9 1.9 Iwi/Maori health providers
519.4 543.6 542.3 Total DHB Expenditure
1.2.4 Operating Environment
1.6.1 Scope of Work
MidCentral DHB is responsible for ensuring the 160,000 people living in its district have access to a wide range of health and disability support services. It is responsible for “improving, promoting and protecting” their health and the health of the communities in which they live. This involves assessing the health status of the district and determining what funds should be directed to preventing illness (via primary and public health services), to detecting and managing illness, to providing intensive assessment and treatment, and to providing rehabilitation and support.
MidCentral DHB ensures these services are made available to its communities by contracting with external providers (such as GPs, rest homes, dentists, pharmacists, and Maori and mental health providers) or providing the services directly, eg public hospital services.
Some of the services provided by MidCentral DHB are for a larger region. This includes cancer and renal services, public health and specialist equipment services. MidCentral DHB provides these services on behalf of the DHBs in those areas.
The planning and funding of health services is carried out by the DHB‟s Funding Division. Service provision is done via its hospital provider arm (MidCentral Health) and Enable New Zealand.
1.6.2 How we are Funded
MidCentral DHB is principally funded from Government‟s Vote:Health budget appropriations each year using a funding formula applied to the population base of MidCentral district via a Crown Funding Agreement with the Minister of Health. Other main income is received from Disability Support Services, National Screening Programmes, (Ministry of Health), ACC, Clinical Training Agency, and other DHBs where services are provided to their populations.
In 2011/12, MidCentral DHB expects to spend $541m on purchasing health and disability services. The funds purchase these services from a range of providers and include hospital based services (MidCentral Health), community based services, disability services, other DHBs and
DHB governance. The table below identifies the services purchased by key category, and by provider type.

Chapter One: Context
Annual Plan 2011/12, 28 June 2011 Page 5
Funding and purchasing of services decisions are underpinned by the Service Coverage Schedule together with the policies, strategies and priorities of Government and the DHB.
1.6.3 Our Operating Environment
The District Health Board is operating in an environment of fiscal constraint.
It is also operating in an environment of collaboration and regionalisation. DHBs are working together to establish services at risk of workforce and other pressures, on a regional basis. Many “back-office” services are being established on a regional or national basis.
This is increased collaboration between primary and secondary care sectors. Within MidCentral DHB‟s district a major project is underway for “better, sooner, more convenient primary health care services”.
Standards of care, particularly nursing care, within aged residential care are inconsistent across the district.
External & Internal Environmental Factors
Potential Impact on DHB
Economy and State Budget
1. Fiscal constraint Increases for health sector will be modest, ie future funding track provisions
Demand on the DHB for salaries, prices, etc will likely exceed available funding
Health Sector Environment
2. Regionalisation and Collaboration
More regional clinical networks will be established
Residents have to travel further for some services
Services sustainability requires a robust regional model
Workforce planning on a regional basis
Joint community with Whanganui DHB
3. Reconfigured primary health care sector
Move to integrated family health centres
Transfer of services from secondary care to primary sector
Community based services integrated into family health centres
4. Period of change New agencies in establishment phase
Transfer of responsibilities from one agency to another
Some delays may be experienced as new agencies pick up role/function.
Issues with Service Providers
5. Aged Residential Care Standards
Increased number of rest homes with workout plans
Rest home closures
Consistency of standards
Internal Factors
6. Fiscal constraint Self-funding of service developments and facility changes
Expenditure targets for all services to ensure expenditure is no more than 90% of revenue to provide cash reserves for investment
Changes to access/threshold levels.
Ongoing strong focus and controls around financial management
Key areas of risk and opportunity
Inter-district flows remain the key area of risk for MidCentral DHB. Tairawhiti DHB has indicated it may look to Waikato DHB for the provision of all cancer treatment services. This will mean a reduction in MDHB‟s regional cancer treatment service. (Tairawhiti DHB‟s residents estimated to be around 10% of MDHB‟s cancer service.)
Regionalisation provides significant opportunities for MidCentral DHB, given its geographic location and the secondary/lower level tertiary nature of its services.
National procurement activities provide opportunities for Enable New Zealand who has specialised expertise in procurement and distribution systems.
MidCentral DHB‟s advances in primary health care are considered to be leading edge, and the “better, sooner, more convenient” business case implementation provides opportunities for further innovation.

Chapter One: Context
Annual Plan 2011/12, 28 June 2011 Page 6
Coverage and Location
The Service Coverage Schedule describes the minimum range of health and disability support services the District Health Board must provide for its population. The Service Coverage Schedule is promulgated by the Ministry of Health (MoH) and is a national standard. It includes: Maori health, mental health, personal health (primary, secondary and limited tertiary), public health and disability support services.
1.2.5. Nature and Scope of Functions
MidCentral DHB:
FUNDS health and disability services through contracts with providers.
PROVIDES hospital and specialist services that cover medical and surgical services, mental health, and older person‟s health.
PROMOTES community health and wellbeing through health promotion, health education and population health programmes.
PLANS the strategic direction for health and disability services within our region, including our district. This is done in consultation with:
key stakeholders. (Iwi, primary health organisations and providers) and our community
other DHBs via regional and national networks.
All planning in done in line with national health strategy and legislation as outlined in Chapter 1. This also includes our Regional Service Plans.
As an owner of Crown assets, MidCentral DHB has responsibility for undertaking a number of functions. These include strong governance
and accountability, risk management, audit, and performance monitoring and reporting.
MidCentral DHB also undertakes formal asset management planning to determine planned future asset replacement and expected financing arrangements. The plan is regularly updated. The purpose and content of each of these plans are defined in the „Guidelines for Capital Investment‟ and the „Business Case Guidelines for Investment in Information Technology‟.
DHBs must revalue property, plant and equipment in accordance with NZ International Accounting Standard 16. MidCentral DHB‟s land and buildings are re-valued every three years. The last revaluation occurred in 2009 and a further valuation was conducted in 2010 on an “Optimised Depreciated Replacement Costs” basis.
In carrying out its objectives and functions, MidCentral DHB should act in compliance with all relevant legislation. DHBs are established under the New Zealand Public Health and Disability Act 2000. As a Crown entity, other key legislation includes the Crown Entities Act, 2004 and the Public Finance Act, 1989.
The NZPHD Act 2000 was amended in November 2010. This amendment has made a number of changes to the principal Act and includes the provision for annual Planning Regulations.
Other legislation may also impact on the DHB‟s operations such as the State Services Commissioner‟s Standards of Integrity and Conduct, which were issued under section 57 of the State Sector Act 1988, and applies to all DHB employees.
v. Ownership interests
MidCentral DHB has a part ownership in Central Region‟s Technical Advisory Service (TAS) and Allied Laundry Services.

Chapter Two: Strategic Direction
Annual Plan 2011/12, 28 June 2011 Page 7
Chapter Two: Strategic Direction
2.1 DHB vision
MidCentral DHB‟s vision is: Quality Living – Healthy Lives.
To the DHB, achievement of this vision means:
people enjoy healthy lifestyles within a healthy environment
the healthy will remain well
health and disability services are accessible and delivered to those most in need
the health and wellbeing of Maori is improved
the quality of life is enhanced for people with diabetes, cancer, respiratory illness, cardiovascular disease and other chronic (long duration) conditions
people experiencing a mental illness receive care that maximises their independence and wellbeing
the needs of specific age-related groups, eg older people, children/youth, are addressed
the wider community and family supports and enables older people and the disabled to participate fully in society and enjoy maximum independence
oral health is improved
people‟s journey through the health system is well managed and informed.
MDHB‟s strategic direction is underpinned by section 38(2d) of the New Zealand Public Health & Disability Act 2001. This plan gives effect to that direction.
2.2 Strategic Outcomes in National, Regional & Local Context
National
With an ageing population, increasing costs of health care, increasing prevalence of long term health conditions, and shortages in key staffing areas within the workforce, robust health planning is of paramount importance.
It requires deliberate long term planning on a national and regional level to ensure models of care are appropriate for both today and the future, and that they are sustainable.
New models of care are required – ones which maximise the use of the health workforce, health funding, and capacity, and which promote prevention, self management, and home-based services.
Some services are so small and specialised that they are to be provided on national basis, managed through the National Health Board. These include paediatric oncology and clinical genetics.
Health Workforce New Zealand is addressing the issues facing the health sector in workforce development on a national basis. The National Health IT Board and the Capital Investment Committee are co-ordinating investment in the public health sector infrastructure. This will ensure consistency of systems and a common framework/platform which DHBs and other providers can utilise.
MidCentral DHB supports the centralisation of vulnerable services and the collaboration of back-off and support functions. Enable New Zealand, a provider division of the DHB, has been identified as the preferred provider of disability equipment (short term loan equipment), and expects to take a lead role in the procurement and distribution of this for the DHB sector.

Chapter Two: Strategic Direction
Annual Plan 2011/12, 28 June 2011 Page 8
Government Priorities and Health Targets
The Government has established six national health targets and identified six priority areas for 2011/12 and beyond. The priority areas are focused on hospital services and achieving value for money. Details of the Government‟s key expectations of DHBs and the national health targets are set below.
Key Expectations from Government National Health Targets
Improving service and reducing waiting times
Increase elective surgical volumes year on year.
Improve emergency department waiting times.
Improve cancer treatment waiting times.
Achievement of health targets.
Shorter stays in Emergency Department
95% percent of patients will be admitted, discharged, or transferred from an Emergency Department within six hours.
Improved access to surgery
The volume of elective surgery will be increased by an average of 4,000 discharges per year.
Services Closer to Home
Refocus resources toward service delivery in community settings, closer to patients.
Shorter waits for cancer treatment
Everyone needing radiation treatment will have this within four weeks.
Clinical Leadership*
Strengthen clinical engagement from bedside to boardroom.
Support clinically-led clinical networks for priority services and integration of services closer to home.
Increased immuni-sation
85 percent of two year olds will be fully immunised by July 2010; 90 percent by July 2011; and 95 percent by July 2012.
Better help for smokers to quit
80 percent of hospitalised smokers will be provided with advice and help to quit by July 2010; 90 percent by July 2011; and 95 percent by July 2012.
Similar target for primary care will be introduced from July 2010 or earlier, through the PHO Performance Programme.
Health of Older People
Reorient services to better meet health and support needs of older people.
Key Expectations from Government National Health Targets
Regional Co-operation
Greater regional collaboration, including regional plans, shared back-office functions, and regional IT services.
Support and advance associated work of NHB and HBL.
Better diabetes and cardio-vascular care
Increased levels of: The eligible adult
population having their CVD risk assessed in the last five years
People with diabetes attending free annual checks
People with diabetes having satisfactory or better diabetes management
Fiscal Respons-ibility
Operate within budget
Regional
The CEOs of the Central Region are committed to ensuring the operationalisation of their Regional Services Plan (RSP). In developing this RSP) and progressing Central Region health services planning, it is clear that the traditional DHB boundaries and patient flows across the Central Region will need to be challenged to ensure that services are configured in a sustainable manner. We recognise that the solution does not lie in the reconfiguration of services alone, but requires a step-change in the way we design and deliver services across the whole of the health system to put consumers at the centre of our services, and meet the changing needs of our population.
The Central Region RSP is aligned with national policy including “Better Sooner More Convenient” and the Workforce New Zealand strategy, and regional strategies such as the Regional Mental Health Strategy and Regional Maori Health Plan.

Chapter Two: Strategic Direction
Annual Plan 2011/12, 28 June 2011 Page 9
The Regional Context:
There are approximately 869,000 people living in the Central Region - around 20 percent of the total New Zealand population. Each of the six DHBs in the Central Region ensures the provision of primary, secondary and community services for their respective populations, and the majority of the health care provided by DHBs in hospitals, and by primary and community service providers is good quality. However, the complex interaction of a number of factors presents the region with the following strategic challenges:
Ensuring our services are sustainable
Ensuring our services meet the changing needs of our population and there is equity of access
Adopting a systematic framework to address changes in workforce, IT and capital investment
Meeting our financial responsibility to manage our budgets including increasing costs, within the revenue available, and achieve combined cost efficiencies of approximately $40 million.
Summary of Regional Priorities and Plans:
The Region‟s response to these challenges is set out in the RSP. The aim is for the six DHBs in the Central Region to build on existing regional collaboration to make better use of available resources, to meet the challenges outlined above. To begin this work, the Central Region has agreed on ten priority areas for action in 2011/12 which are aligned to the Ministers Letter of Expectations. System linkages are reflected in the DHB local plans, and are strengthened by each Chief Executive taking a lead sponsorship role for a regional implementation plan on behalf of the other DHBs. The local DHB plans focus on strengthening the primary and community sector, putting the patient first through service integration between primary and secondary care, and managing the demand for secondary acute care. The result of this alignment will be a regionally coordinated system of health service planning and delivery. The following are the regional priorities for action in 2011/12:
meeting the national health targets: improving services and reducing waiting times through improved access to elective services and shorter waiting times for cancer services,
strengthening vulnerable services: including regional radiology, older adults and rehabilitation,
key regional enablers: strengthening clinical leadership and clinical governance as a fundamental driver of improved patient care, the Central Region Information Systems Plan (CRISP), capital asset management, shared support services (non–clinical), and transport and accommodation,
sub–regional activity: the action plans for sub–regional activity are detailed in Section 3.1.2 for Capital & Coast, Hutt Valley and Wairarapa DHBs*, and the centralAlliance between MidCentral and Whanganui DHBs.
The table below overleaf the actions for the priority areas.
MidCentral DHB will be participating in all Regional Service Plan activities, with the exception of the sub-regional work involving Capital & Coast, Hutt Valley and Wairarapa DHBs. MDHB is the lead for the cancer service work stream.
MidCentral DHB will also be participating in the establishment and roll out of the regional training hub in accordance with HWNZ strategy. This work is being led by Hutt Valley DHB and is clinically led. The hub will take a multi-disciplinary approach and its first initiative will focus on year 1 and 2 post graduate medical students.

Chapter Two: Strategic Direction
Annual Plan 2011/12, 28 June 2011 Page 10
Meeting the Health Targets:
Improved access to elective services: Access to elective services varies across the Central Region with some populations having far better access than other populations. The aim is to ensure the Central Region DHBs have the capacity to deliver the required levels of service. This includes the ability to deliver elective volumes (meeting the Minister‟s expectations), provide equitable access to surgical services, the development and implementation of an integrated Central Region production plan, and capacity and distribution modelling to support future development. Clinical Leadership is seen as the key to ensure the success of this approach. There is a need to make the most of existing surgical services across the Central Region through smarter choices about how, where and when we provide elective surgical services. The Central Region has agreed to implement a common waiting list approach during 2012/13 (across one or two services) as a building block to developing a sub–regional or regional elective booking system as a single point of entry for patients. In 2011/12, there will be a specific focus on achieving cardiac surgical discharges and access to bariatric surgery.
Lead CEO: Kevin Snee, HBDHB
Shorter Waits for Cancer Treatment: All Central Region DHBs have met the target for the first quarter 2010/11. The priority for the region for 2011/12 is ensuring people with cancer have access to radiation treatment, and improve the treatment of priority cancer sites. Aspects of cancer services, such as Medical Oncology, are vulnerable. The emphasis of the plan is to develop sustainable models of service delivery by moving towards a single service, two site model with closer collaboration between the two current providers – Capital and Coast DHB and MidCentral DHB.
Lead CEO: Murray Georgel, MDHB
Strengthening Services:
Radiology Services:
The focus for 2011/12 is on developing a regional radiology service focusing initially on after hour‟s coverage, and then a fully regionalised service, to reduce service vulnerability across the region and enhance timely access to radiology services. This requires an enhanced IT infrastructure for Picture Archiving and Communications (PACS) and Radiology Information Services (RIS), and strong clinical governance through the use of evidence based referral guidelines.
Lead CEO: Graham Dyer, HVDHB
Older Adults and Rehabilitation: The key focus area for 2011.12 is the development of regionally coordinated multidisciplinary models of care for older adults that can be locally implemented. This will support older adults with co – morbidities to remain independent for as long as possible, remain out of hospital and have care provided in a culturally dignified way.
Lead CEO: Julie Patterson, WDHB
Sub-regional activity
Capital and Coast, Hutt Valley and Wairarapa DHBs: The three Greater Wellington Board Chairs agreed a Statement of Commitment to a closer relationship in early 2010. The sub-regional Clinical Leadership Group has projects for ENT services and Child Health underway. There are a range of other initiatives underway involving two or more of the DHBs.
Lead CEOs: Tracey Adamson (WDHB), Mary Bonner (CCDHB) and Graham Dyer (HVDHB)
The centralAlliance: MidCentral and Whanganui DHBs entered into a formal alliance (the centralAlliance) in 2009. The agreement establishes the contractual arrangement as to how the two DHBs will identify and implement collaborative initiatives to improve the efficiency and effectiveness of services. Collaboration now exists across much of the two DHBs activities with the joint appointments to key management and clinical positions, a shared women‟s health service, common purchasing of hospitality services, common financial management system technology and the transfer of the centralAlliance concept into business-as-usual planning and management.
Lead CEOs: Murray Georgel, MDHB and Julie Patterson, WDHB

Chapter Two: Strategic Direction
Annual Plan 2011/12, 28 June 2011 Page 11
Key enabling services:
Clinical Leadership and Clinical Governance: The focus of this plan is to strengthen and align clinical leadership and governance systems across the Central Region DHBs. Early actions will be the establishment of a Regional Clinical Board, greater support to sole practitioners, implementing regional credentialing to one or two services and considering opportunities for joint appointments. This will lead to improved quality and safety of services for patients, and sustainability of services through shared appointment opportunities.
Lead CEO: Mary Bonner, CCDHB
Central Region Information Systems Plan:
The CRISP supports regional delivery of care by building systems that will deliver information to clinicians across the region regardless of their own or their patient‟s location. It also supports the clinical requirements of the Regional Services Plan‟s strengthening hospital services (vulnerable services) projects and the existing Regional Clinical Services Plan (RCSP) Programme. Health professionals across the region will be able to share relevant information about patients so that safe and effective care can be provided. Patients will be able to talk to health professionals when they need to, using a range of communication technologies.
Lead CEO: Tracey Adamson, WDHB
Capital and Asset Management: Future capital and asset management planning will be undertaken within the context of service planning to ensure that expenditure plans will address regional requirements and health needs, coordinate future investments, and maximise the health dollars available to the region.
Lead CEO: Graham Dyer, HVDHB
Shared Support Services (non–clinical): The focus of this plan is to identify the non-clinical support functions where there is un-necessary duplication and cost in the configuration of current support services and where significant benefit will be delivered from shared service arrangements. Benefit may be in the form of cost reduction, improved service, and risk reduction or as a key enabler to service change. This initial plan focuses on HBL national shared services and on three keys projects in 2011/12 - shared laundry, payroll and recruitment processes.
Lead CEO: Mary Bonner, CCDHB
Transport and accommodation: Major transport improvements will be needed so patients and their families/whanau, and health professionals, can get to community health centres and hospitals. Accommodation needs to be available so people and travelling specialist clinicians have somewhere to stay when they are away from home.
These arrangements would be well co-ordinated and made on behalf of patients and their families/whanau. Active participation in national discussions, with a view to determining a regional solution in the context of the national network, is required.
Lead CEO: Tracey Adamson, WDHB
Local
MidCentral DHB has ten priority areas. These are around vulnerable groups of its population, chronic diseases which are the major cause of mortality and morbidity within the region. Investment in these 10 areas will make the greatest impact toward improving the health of the district‟s population:
Cancer – cardiovascular disease, child health – diabetes – health of older people – Maori health - mental health - oral health – respiratory disease – rural health
To advance these areas the DHB will continue with the implementation of its business case for “better, sooner, more convenient health care”, and the child and adolescent oral health initiative. It will also advance its Maori Health Plan and its provider arm‟s Clinical Services Plan.

Chapter Two: Strategic Direction
Annual Plan 2011/12, 28 June 2011 Page 12
Continuum of Health and Wellbeing
Prevention/Promotion
Early Detection & Intervention
Diagnosis & Treatment
Support, Habilitation & Rehabilitation
Palliative Care
Research & Survelliance
Investment in programmes (eg immunisation and cervical
screening) results in benefits for large communities or sections of
the population.
Investment is on episodic basis with individual benefits. Hospital level care is lower volume/higher
cost. Primary care is higher volume/lower cost.
Investment into effectiveness of population and individual
treatment programmes to inform future purchase arrangements.
General
MidCentral DHB is confident it can implement this Annual Plan. It is recognised that new (national and regional) initiatives were still being developed as the Plan was being finalised. These may have some bearing on the DHB‟s, requiring re-prioritisation of resources and timelines.
2.2.4 Key Impacts
2.2.5 Key Measures of Performance
Funds for health services are finite and it is essential they are used to maximum advantage and the DHB achieves value for money and the best outcomes for its communities.
MidCentral DHB‟s objective is achieve “quality living – healthy lives” for its communities.
All planning in done in line with national health strategy and legislation as outlined in Chapter 1. This also includes our Regional Service Plans.
Based on the district‟s health needs assessment (as outlined in Chapter 1), the DHB employs an intervention logic to determine what resources and capability it should invest in and the associated activities and initiatives. It decides the services and programmes it wants provided, and the impact on these.
Our overarching intervention logic is pictured below:
To achieve the DHB‟s vision, objective and the associated 10 outcomes (refer module 1), MidCentral DHB provides, or contracts for health and disability services across the continuum of health and wellbeing. The
continuum includes promotion, disease prevention, early detection of disease and intervention to diagnosis and treatment, rehabilitation and support, through to palliative care, research and surveillance.
By investing across the continuum of health and wellbeing, MidCentral DHB will progressively achieve its vision and long term outcomes. This will be supported by a strong monitoring framework, including identification of key measures and the expected impacts. To assist monitoring, DHB Performance Measures have been developed. These cover the four dimensions of DHB of DHB performance- policy, systems integration, ownership and outputs (refer Chapter 4). The measures include the six national health targets in place for cancer services, emergency department wait times, electives, smoking cessation, diabetes/cardiovascular disease, and immunisation.
Long term, MidCentral DHB aims to:
Improve the life span of its population by reducing its mortality rate
Reduce the district‟s infant mortality rate
Reduce the health status gap between Maori and non-Maori, and also between MidCentral and New Zealand
Progress against these three high level measures is monitored via the health needs assessment, national census, and national health indicator studies. These indicators are long term in nature so measurable progress may take 5 to 10 years to see.
Government Priorities
Minister’s Expectations
Strategic Goals
ActivitiesInitiativesProjects
OutputsServices provided to
others
Output Classes
Prevention Services
Early Detection & Management
Intensive Assessment & Treatment
Rehabilitation & SupportInputs
(resources & capability) DHB Programmes
Products
Actions
Deliverables
Improved Population Health
Reduced Inequalities
DHB Programmes
Products
Actions
Deliverables
We invest in And undertake We then produce Grouped into And achieve And contribute to| | | | |
DHB Intervention Logic

Chapter Two: Strategic Direction
Annual Plan 2011/12, 28 June 2011 Page 13
Mortality and Life Expectancy
Mortality rates of most of MidCentral DHB‟s ethnic groups have been improving. This suggests improving general health status when mortality is used as a general indicator of population health status. As health status improves, mortality rates decrease.
MidCentral and New Zealand All Cause Mortality 2000 to 2007 Age Adjusted
Using WHO Standard Population (Per 100,000 People)
0
200
400
600
800
1000
1200
2000 2001 2002 2003 2004 2005 2006 2007
Year
Ag
e A
dju
ste
d R
ate
/100,0
00 p
eo
ple
MidCentral All Ethnicities
MidCentral Maori
MidCentral Pacific Peoples
MidCentral Other Ethnicities
New Zealand All Ethnicities
New Zealand Maori
New Zealand Pacific
PeoplesNew Zealand Other
Ethnicities
The 2007 life expectancy figures show MidCentral‟s non-Maori life expectancy was the same as for New Zealand non-Maori. MidCentral Maori life expectancy was higher than for New Zealand Maori, but less than non-Maori. Life expectancies are calculated from mortality rate.
MidCentral and New Zealand Life Expectancy for 2007
MidCentral New Zealand Maori 76 73
Non Maori 81 81
Infant Mortality
Infant/early childhood mortality has been better or close to the national average. Rates are calculated from small numbers of deaths, so a small change in numbers can result in a large swing in rates.
Infant & Early Childhood (ages 0 – 4) Mortality Rates (per 1,000 children)
1977 to 1999 2002 to 2004 2005 to 2007
MidCentral
Maori 3.6 3.6 5.7
Non-Maori 3.2 2.4 3.6 New Zealand
Maori 7.4 6.0 6.2
Non Maori 3.5 3.7 3.3

Chapter Two: Strategic Direction
Annual Plan 2011/12, 28 June 2011 Page 14
Quality Living – Healthy LivesVision
High Level Outcomes
Improved health and disability status Improved equity & reduced inequalities in health status
Improved life span for MidCentral’s population Reduced mortality rate (age standardised) Reduced infant mortality Lower gap between Maori & non-Maori, and, MidCentral & NZ
People enjoy healthy lifestyles within healthy environment | the healthy remain well | health & disability services accessible & delivered to those most in need | health & wellbeing of Maori improved | qualify of life enhanced for people with chronic conditions | needs of specific age-related groups addressed (older people, children/youth) | people experiencing mental illness receive care which maximises independence & wellbeing | oral health is improved |
older & disabled people supported by community to participate fully in society & enjoy maximum independence | people’s journey through health system is well managed & informed
High Level Measures
Outcomes
Healthy Environment & Tobacco Control
Healthier population with lower prevalence of smoking-related conditions, and, more smoke-free areas
Drinking water quality
People adopt healthy habits & lifestyles
Healthy Children
Reduced likelihood of acquiring long term conditions later in life
Lower incidence of communicable disease
Healthier teeth & gums
Safer children
Chronic Care
Amelioration of disease symptoms and/or delay in their onset.
Increased likelihood of survival from cancers
Reduced severity of disease symptoms
Better self management of chronic conditions
Mental Disorders
Improved quality of life for both clients & their families.
Acute episodes are minimised, clients achieve greater stability in their condition.
Elective Services
Fewer debilitating conditions.
Delayed onset of long term conditions.
Acute Services
More timely assessment, referral & treatment
Access to safe, effective birthing facilities
Reduced demand for acute services
Healthy Communities
Timely access to health care
Health services provided as close to the community as possible
Good health & independence is protected & promoted
Early detection & intervention of diseases
Support for Older People
Older people maintain maximum functional independence
Proportion of the population who smoke
Proportion of smokers supported to quit in hospital & primary care settings
Drinking water standards
Health promotion programme (Smokefree/Auahi Kore)
Support provided to smokers (in hospital & primary care) to quit
Smoking cessation support training
Promoting smoke-free environments
Statutory/regulatory services (Public Health Service)
Health promotion programmes in schools
Percent of smokers in primary care provided with support to quit
Percent of smokers admitted to hospital provided with support to quit
Compliance with water quality tests
Liquor licensing
Early childhood centre visits
Infant breastfeeding rates
Two-year-olds who are fully immunised.
Five-year-olds who are caries free.
Decayed missing or filled teeth score in Year 8 children
Family violence audit score
Injury assessment tool use
Breastfeeding education & promotion
Immunisation programme
Child & adolescent oral health service
Family violence intervention programme
Breastfeeding rates
Two-year old immunisation coverage rate
Caries free 5-year old children
Decayed, missing & filled teeth, Year 8 children
Screening women and children for family violence
On time diabetes detection
Better diabetes management
Identification of the risk of heart disease
Access rates
Risk assessments in primary care (annual free checks, blood tests, risk profiles)
Laboratory tests
Provision of radiation therapy & chemotherapy
Fitness & nutrition services
Free annual checks for people with diabetes
Laboratory tests on people with diabetes
Cardiovascular disease risk assessment rates
Radiation oncology treatment wait times
Chemotherapy wait times
Access rates for people with mental illness
Support for long term clients
Inpatient mental health services
Community-based mental health services, including crisis intervention
Child, Adolescent & Family mental health services
Alcohol & other drug services
Specialist Maori mental health services
Mental health bed days
Mental health staffing levels
Timely access to assessment and surgical treatment
Lengths of stay
Day of surgery admissions
Elective day care surgery rates
Unplanned returns to theatre
Inpatient & day case admissions
First specialist assessments & pre-admission outpatient appointments
Waiting list management
Intervention rate for elective procedures
Theatre utilisation
Volume of elective surgery discharges
Volume of first specialist assessments
Elective services wait times
Ambulatory sensitive (avoidable) hospital admissions
Level of population enrolled with a Primary Health Organisation
GP consultation rates
Screening coverage rates for cervical and breast cancers
General practice services
Chronic disease services
GP consultations
Screening for breast & cervical cancers
PHO enrolment rates
GP consultation rates for high needs and rural populations
Breast cancer screening rates
Cervical cancer screening rates
Waiting times in Emergency Departments
Access to specialist medical & surgical assessments
Hospital lengths of stay
Acute readmissions to hospital
Waiting times
Low birth weight babies
Home based acute care & recovery
Referral response times for assessment and service co-ordination
Level of acute hospital admissions from residential care
Hospitalisation rates for falls
Quality of aged residential care facilities
Lengths of stay (AT&R)
Emergency Department attendances
Specialist hospital inpatient & outpatient services
Hospital maternity services
Obstetric consultations
Acute care and recovery at home service
Home based support services provided by NGOs
Residential care provided by NGOs
Assessments by MDHB’s NASC service
End-of-life programmes delivered by providers of aged residential care
Emergency Department lengths of stay
Volume of acute hospital discharges
Hospital admissions prevention referrals
Needs Assessment & Service Co-ordination (NASC) referrals
Contracted providers offering aged residential care services
Assessment, treatment & rehabilitation (AT&R) inpatient bed days
AT&R Outpatient attendances
Allied health contacts
Prevention Services Early Detection and Management Intensive Assessment and Treatment Rehabilitation and Support
Output Measures
Health Targets
Outputs
Output Classes
Impact Measures
Main Measures
Impacts (medium term)
FULL INTERVENTION FRAMEWORK(Based on that developed by Northland DHB)

Chapter Three: Delivery on Priorities & Targets
Annual Plan 2011/12, 28 June 2011 Page 15
Chapter Three: Delivering on Priorities & Targets
3.1 Priorities and Targets
The following tables set out our actions over the next three years. MidCentral DHB aims to advance all national health targets and Government priority areas.
It will work with other DHBs within the Central Region to implement the Regional Services Plan, including increasing the capacity of its cancer and cardiology services. The Central Regional Information Systems Plan will also be implemented, and local initiatives include Concerto, followed by replacement of the patient information management system and a new pharmacy information system in outlying years.
The centralAlliance with Whanganui DHB will continue, with more clinical services aligning after-hours arrangements and support systems. The first “one service, one population” based service will be established.
At a local level, the roll-out of the oral health programme for children and adolescents will continue. Quality initiatives around falls prevention and medication will be enacted, and enhancements made to disaster recovery and business management processes. Special focus on Maori and mental health is also targeted.
Concurrent with this work will the ongoing focus on financial sustainability, particularly the need to build up cash reserves to fund our investment plan for service development (and associated capital works). Productivity gains will also be sought.
Increase Local/Regional Capacity & Productivity by:
implementing better, sooner, more convenient
business case
implementing Regional Services Plan
increasing elective throughput
increasing cancer & cardiology capacity
reducing ED & cancer wait times
integrating primary & secondary care
Reduce Costs & Future Demand Growth Rate by:
increasing immunisation rates
increasing smoking cessation rates
centralAlliance
ongoing focus on financial sustainability
implementing child/adolescent oral health model
enhancing chronic care services
implementing regional IT plan
Implementing Maori Health Plan
These initiatives build upon the comprehensive range of services which MDHB secures for its communities. For details of these, refer to the 2011/12 Annual Plan Funding Arrangements Document.

Chapter Three: Delivery on Priorities & Targets
Annual Plan 2011/12, 28 June 2011 Page 16
3.1.1 Government Priorities
i. Health Target: Shorter Stays in Emergency Departments (EDs)
We will undertake these initiatives/activities & actions
These actions will support improved performance in the following ways
To deliver Measured by In support of system outcomes
Each service will implement a plan to improve service response times to patients in the ED
Improve patient flow across care continuum
Appropriate shorter stays in hospital
Result in no unnecessary delays in patients receiving appropriate treatment
Reduce time from decision to admit or transfer to patient being admitted or transferred
Decrease complaints by patients as a result of extended waits in ED
Referrals to Post ED Assessment & Liaison Service (PEDAL)
Referrals to assessment, treatment & rehabilitation service (AT&R) from inpatient
Support needs assessments
Mental health emergency team (MHET) contacts in ED
Discharge plans on admission
Clinical care pathways
Lengths of stay in ED, by service, <6 hours for 95% of patients
Patients delay in planned discharges from ward <2 hours
Time to transfer between acute medical/surgical wards and AT&R ward <48 hours
Improve public confidence in ability to access acute services when they need them
Health target: Shorter lengths of stay in the Emergency Department
Implement Care Capacity Demand Management Project throughout MidCentral Health in conjunction with the Safe Staffing Healthy Workplaces Unit
Demonstrate increased efficiency and flexibility in the deployment of the nursing and midwifery workforce
Improve patient flow and staffing systems to better manage patient demand
Demonstrate improvement in evidence-based measures of safe staffing and healthy workplaces
A nursing and midwifery workload forecasting tool
A data set to measure and monitor care capacity management
Explicit workload, rostering & staff management practices
FTE establishment for nursing and midwifery services
Reduced incidence of “safe staffing” events
<1% variance to budget in Nursing and midwifery FTEs
Reduction in care capacity variance in advance 3-6 months out
Reduction in care capacity variance on the day
Contributing to efficiency and safety of hospital services, ensuring appropriate, safe nursing and midwifery staff levels are planned and available to respond to patient demand
Provide a Hospital Admission Prevention* (HAP) Service
*acute care & recovery at home
An alternative to hospital admission is provided for patients who require specialist nursing expertise
Additional capacity in intermediary care community-based services
Interdisciplinary PHO teams proactively managing the care of patients, thus reducing pressure on hospital services due to unnecessary acute presentations
Strengthen the Urgent Community Care (UCC) programme with St Johns (Horowhenua)
Provide additional support and education to General Practice teams
Streamlined referral pathway to intermediary care services
Improved efficiency in delivering community and home-based nursing services by reducing duplication of effort
Increased utilisation of District Nursing services – specialist nursing
Increased number of referrals to HAP service
Increased number of available DN hours to patients across district
Reduction in avoidable hospitalisations
Reduction in avoidable presentations to Emergency Department
Contributing to acute care workstream for implementing Better, Sooner, More Convenient Primary Health Care services by minimising volume of potentially avoidable ED presentations

Chapter Three: Delivery on Priorities & Targets
Annual Plan 2011/12, 28 June 2011 Page 17
gii. Health Target: Improved Access to Elective Surgery
We will undertake these initiatives/activities & actions
These actions will support improved performance in the following ways
To deliver Measured by In support of system outcomes
Implement patient focused booking system across MCH
Better suit patients‟ needs for specialist appointments and booking times
Improve access to services enabling more patients to receive planned surgery
Patient directed scheduling will help patients better organise and manage their plan of care and home/work life
Improve scheduling and utilisation of outpatient clinic
Decrease the number of occasions of patient rescheduling/repeat bookings for same event
Improve capacity planning and management of ambulatory care, inpatient ward and theatre facilities
MDHB‟s commitment to target of zero people waiting for FSA and elective surgery
Increased patient choice for specialist surgical service outpatient appointment times/dates
Streamlined centralised booking schedules, with supporting policies & protocols
Commitment to deliver appropriate, timely specialist assessments within expected timeframes
Data collection and information system to support booking from first specialist assessment (FSA) to preadmissions, investigations/diagnostics and theatre dates
Compliance throughout year with Elective Service Performance Indicators
5,928 elective discharges (excluding cardiology & dental) achieved by 30.6.12.
0% of people waiting greater than 6 months of referral date for their FSA by 30.6.12
<2.0% of booked elective surgery FSAs cancelled by patient before appointment date
< 7.5% of patient non attendances at booked outpatient clinic appointments
< 2.0% elective surgery waiting list patient cancellations prior to booked admission date
> 85% patients satisfied with their outpatient clinic appointment date and time
Implement patient focused booking system across MCH
Implement proposal to Redesign the Pre-admission/Pre-operative Assessment Process
Improve patient safety through a systematic approach to peri-operative assessment that identifies, quantifies and manages peri-operative risk
Enable post-operative care to be planned for the patient prior to admission
Increase patient commitment to the patient pathway, by providing the opportunity for explanation and discussion
Focus clinician resource where it is most needed
Provide “One stop shop” for patients
Better working relationships
Reduce duplication of documentation
Decrease inappropriate pre-op investigations
Better discharge planning
Fitness for surgery identified at an early stage of the surgical pathway, with appropriate course of action taken
Clean and up-to-date waiting lists
New, agreed protocols
Increased number of attendances
Preadmission clinic appointments
Completed Patient Health questionnaires
Patient information packs
Patients with Discharge plans at preadmission
Training sessions scheduled
Process redesign completed by December 2011
Evaluation completed by 30 June 2012
<7% Preadmission clinic did not attend (DNA) rate
>75% patients‟ elective surgery date is within 21 days of pre-admission clinic date - each specialty
>75% of elective surgery waiting list patients are streamed for pre-admission clinic
< 1% of theatre cancellations after patient admission due to being unfit for surgery
Implement proposal to Redesign the Pre-admission/Pre-operative Assessment Process

Chapter Three: Delivery on Priorities & Targets
Annual Plan 2011/12, 28 June 2011 Page 18
iii. Health Target: Shorter Waits for Cancer Treatment Radiotherapy
We will undertake these initiatives/activities & actions
These actions will support improved performance in the following ways
To deliver Measured by In support of system outcomes
Installation of a 4th permanent linear accelerator
Reduce risk of service disruption due to capacity constraints
Strengthen public confidence in ability of Cancer Service to meet radiation oncology treatment needs
Better able to meet surge in demand
Enable timely access to treatment
Sufficient capacity to meet peak demand
Linac commissioned by April 2012
Project implementation completed within budget
Increased number of radiation oncology attendances
All patients start treatment within 4 weeks of FSA
All D category patients start treatment as timetabled
Sustained linac utilisation to > 95% available capacity
Health target: all patients (excluding Category D) receive radiation oncology treatment within 4 weeks of First Specialist Appointment
Reducing the impact of illness resulting from cancer treatment delays
Optimise increased planning capability
More reliable platform to sustain service delivery
Reduce treatment planning time for patients
Minimise planning turnaround time without compromising plan
Consistent and better use of planned capacity for Linacs
Smoother pathway for patients from planning to treatment
Patient treatment plans All treatment plans approved within 10 days of CT simulation
No delays in treatment planning
Support shorter waiting times for radiation oncology treatment, by streamlining treatment planning process and minimising potential for tailback in access to linacs
Implement upgraded Oncology Information System
Seamless transfer of patients‟ treatments between linacs (if required)
Improve wait list management
Better manage exceptions through improved data collection, reporting and monitoring
Minimise/eliminate barriers for patients through adequate support functions
Software delivered to service specifications
Software matched to optimise linac integration
99% of patients treated on day of unexpected linac breakdown
Reduction in exception coding
Additional 20-25 treatment courses per annum
In support of health target to have all patients needing radiation oncology treatment to have received it within 4 weeks of the first specialist assessment

Chapter Three: Delivery on Priorities & Targets
Annual Plan 2011/12, 28 June 2011 Page 19
iv. Health Target: Better Help for Smokers to Quit
We will undertake these initiatives/activities & actions
These actions will support improved performance in the following ways
To deliver Measured by In support of system outcomes
Implement the ABCD smoking cessation programme
Implement the National STEPS Smokefree ABCD Train the Trainer programme within Secondary and Primary Care providers
Secondary Care:
Increase the ABCD target achievement
Implement individual Service plans Provide increased opportunities for clinical staff training in ABC programme
Promote Nicotine Replacement Therapy (NRT) (lozenges, patches, gum) use by identified adult inpatient smokers
Increase the documentation of the ABCD target
Continue the ABCD training Primary Health Care:
Implement the ABCD smoking cessation programme within PHC and achieve the target by July 2012
Develop a PHC smoking cessation taskforce
Implement ABCD training programme
Seek opportunities to systemise ABCD training
Provide more opportunities for smokers to access smoking cessation services
Increase the number of patients subsequently presenting to hospital who have quit smoking tobacco
More identified hospitalised smokers offered cessation advice
Reduce health complications as a result of smoking tobacco
Ensure ABCD implementation is integrated across clinical practices in all health care providers.
Ongoing Internal support and training for staff
Increase likelihood of successful “quit” attempts
Strengthen capacity of all clinical staff to include smoking status and advice to quit as part of routine assessment and treatment planning
Increase successful quit attempts and reduce the harmful impacts of smoking
Improved clinical processes and systems in secondary and primary care.
An increase of staff being trained in ABCD, and increased no of ABC training sessions
Documented smoking status of adult patients
Advice and support to cease smoking
Increased referrals to smoking cessation programme(s)
Increased availability of and access to e-tool for ABC training
Increased volume of Nicotine Replacement Therapies offered
95% of hospitalised smokers offered advice and help to quit by 30.6.12
100% of secondary care staff are utilising the correct ABCD documentation
40% of all hospitalised smokers are using NRT (lozenges, patches, gum) as part of a patient care plan (annual target) MCH
At least 20 ABCD staff training sessions are delivered per month (primary and secondary)
90% of current smokers enrolled in a PHO are offered with advice and help to quit by 30.6.12
200 staff will have received ABC training by year end
Health target: better help for hospitalised smokers to quit and reduce impact of smoking-related diseases
Consistent smoking cessation promotion in health services.
Sustainability of clinical processes and systems will be imbedded into best practice.
To provide a strong Smokefree training workforce delivering effective, brief ABC training across MDHB and Primary health care

Chapter Three: Delivery on Priorities & Targets
Annual Plan 2011/12, 28 June 2011 Page 20
Review all Tobacco Control contracts and redesign to ensure services meet the needs of smokers
Provide an effective suite of tobacco control services for the district with an emphasis on Maori (42%)
Improved health outcomes for all smokers in the district
Tobacco control review report is completed by September 2011
Improved services for socially disadvantaged
Increased responsiveness and accessibility of smoking cessation services to Maori.
Develop and Implement a Rangatahi Smoking Cessation Pilot within a local Iwi Health Provider
Ensure Rangatahi Maori have services that are designed and delivered specifically for this key audience
Improved health outcomes for Rangatahi Maori
Reducing Smoking Initiation amongst young Maori
Final Pilot Programme Service plan is submitted by 1.6.11
Quarterly service progress reports are submitted to MDHB
Recommendations and final evaluation for the ongoing provision of smoking cessation services for Rangatahi are submitted to MDHB by 30.6.12
Enhanced services for the younger population
Develop and deliver a „It‟s About Whanau‟ quit smoking campaign that is aimed at increasing quit attempts amongst Maori smokers
To deliver a Maori specific marketing campaign for cessation
Reduce the impact of tobacco on Maori Health
Campaign is developed by May 2011
Campaign is delivered by June 2011
Increased numbers of Maori making a quit attempt
Enhanced Tobacco Control

Chapter Three: Delivery on Priorities & Targets
Annual Plan 2011/12, 28 June 2011 Page 21
v. Health Target: Increased Immunisation
We will undertake these initiatives/activities & actions
These actions will support improved performance in the following ways
To deliver Measured by In support of system outcomes
Improve 2 year immunisation coverage rates
Encourage prompt enrolments of babies with Primary Health Organisations
Improve general practice recall and pre-call systems for immunisation
Encourage prompt referrals from primary care to out reach immunisation services
Develop clear criteria to determine true decliners within general practice
Improve the immunisation coverage rages of children from birth to two years of age
95% of two year olds are fully immunised by 30.6.12
Achieve Government Health Target‟s for Immunisation
Improve 4 year immunisation coverage rates
Improve 4 year immunisation coverage rate‟s by:
Work with Primary care to recall at 4 years not 4 years 6 months.
Improve immunisation uptake at the B4SC for those children who are late for their 4 year immunisation.
Pick up overdue 5 year olds at school by implementing a Public Health Nursing mop up service.
Improve the immunisation coverage rates of children entering school at 5 years
4 year immunisation coverage rates will increase to: 80% Sept 2011 85% June 2012. (Rates 30 Nov 2010 = 69%)
Improve the documentation and protocols for babies born to Hep B Antigen Positive mothers
Improve Clinician documentation around Hepatitis B
Up to date protocol and professional development will ensure consistency of Practice across the district
Improved awareness of hepatitis B protocols across the region.
Improved serology uptake at 5 months of babies of Hepatitis B surface antigen positive mothers
National Immunisation Register will reflect improvement
Hep B positive babies will have all Immunisation events and serology documented

Chapter Three: Delivery on Priorities & Targets
Annual Plan 2011/12, 28 June 2011 Page 22
vi. Health Target: Better Diabetes & Cardiovascular Services
We will undertake these initiatives/activities & actions
These actions will support improved performance in the following ways
To deliver Measured by In support of system outcomes
Implement approved recommendations from the Cardiology Landscape Project, including the Recovery Plan and targets to improve access to cardiology and diagnostics:
establish dedicated cardiac angiography suite (CATH lab)
increase interventional cardiology capacity
establish associated clinical pathways/governance
Improve management of patient numbers for cardiac angiography
Reduce clinical risk through improved facilities, systems and processes
Reduce lengths of stay through more effective and efficient service provision
Increase patient satisfaction and improve treatment outcomes
Improve team performance and well being
Increased volume of cardiac angiography procedures delivered at Palmerston North Hospital
Shorter waiting times for FSAs and Community referred tests - cardiology
Standardised intervention rates for cardiac procedures of 6.50 per 10,000 population (for valve and bypass surgery, PCI, diagnostic angiography)
Routine angiography wait list numbers seen within 6 weeks
Increased number of referrals to CCDHB for (elective) cardiac surgery
Contributing toward reducing the impact of cardiovascular illness and disease, and, increasing access to cardiac surgery in a more timely manner
Undertake more cardiovascular risk assessments in the community
Work with diabetes registrants in the community to improve management of the condition
Improve cardiovascular and diabetes performance through provision of services closer to home
Enhance outcomes for people with cardiovascular disease and diabetes
Achieve a 5% increase in the number of cardiovascular risk assessments in the district by 30.6.12
Increase by 5% community cardiology assessments by 30.6.12
By 30.6.12, proportion of eligible population who have had a laboratory blood test to ascertain absolute CVD risk in the last 5 years: 90% all ethnicity groups
Proportion of people with diabetes who have their free annual check: Total - 78.%; Maori – 78.1%; Other 78.1%
Proportion of diabetes registrants who have satisfactory or better diabetes management as at June 2012 HBA1c=8.0% or less): Maori – 75.1%; Other – 81.2%; Total – 80.1%
Successful delivery of improved performance to health delivery target for diabetes and cardiovascular

Chapter Three: Delivery on Priorities & Targets
Annual Plan 2011/12, 28 June 2011 Page 23
viii. Government Priority: Better Services for Health of Older People
We will undertake these initiatives/activities & actions
These actions will support improved performance in the following ways
To deliver Measured by In support of system outcomes
Home Based Support Services – review, re-design and re-procurement of existing agreements
Strengthen Home Based Support Services as the most cost effective means of providing long term care (more than 6 months) for the older population
An effective model of care impacting positively on health and disability outcomes of older people and their families
Review and Redesign of Home Based Support Services
Re-tendering of Home Based Support Services
Effective and cost efficient delivery of Home Based Support Services to people in their homes
Koroua and Kuia (Kaumatua service) – develop a local initiative
Older Maori have access to responsive aged care services
Improved health outcomes for older Maori
Service established.
Increased uptake of older people‟s health services by Maori
Maori access to older peoples services increased
Implement the Older People‟s Health module of the Better Sooner More Convenient business case
Improve models of care for older people
An effective model of care impacting positively on health and disability outcomes of older people and their families
Tararua and Horowhenua integrated model of care for older people evaluated by March 2012
Better Sooner and More Convenient Primary health care
Integrated Model of Care Increase awareness and use of respite care, particularly dementia respite care, beds throughout the district (NB: 4 dedicated dementia respite beds
available, plus 37 facilities offering respite care –
levels 1-3, on planned & crisis basis)
Four gerontology specific clinical pathways established each year for the next three years (12 pathways in total by 30.6.2013)
Satisfaction survey of respite care users and carers is undertaken by 30.9.11
Increase Stage 3 dementia residential care beds through provider rationalisation of surplus stage 2 bed capacity
Dementia residential bed levels increased:
2010/11 2011/12
Palm Nth 49 49
Horowhenua 53 63
Manawatu 37 49
Tararua 8 8
Improved assessment tools for accessing residential care requirements, and providing needs assessment closer to home
Evaluate the InterRAI (International Resident Assessment Instrument) pilot in Tararua and plan district-wide rollout by 31 June 2012

Chapter Three: Delivery on Priorities & Targets
Annual Plan 2011/12, 28 June 2011 Page 24
Implement residential long term care InterRAI module for assessing requirement for residential care, as part of the Ministry of Health‟s national programme, by June 2012.
Increased knowledge and capability 95% of registered nurses working within aged residential care facilities complete MDHB‟s Residential Care Skills & Knowledge Programme by 30.6.12
Residential Care Skills & Knowledge Programme established for care givers by 30.6.12 (NB: courses provided through MDHB’s Health
Development Team)

Chapter Three: Delivery on Priorities & Targets
Annual Plan 2011/12, 28 June 2011 Page 25
viii. Government Priority: Services Closer to Home
(Refer also local initiatives for Maori and Mental Health which include “better, sooner, more convenient” actions.)
We will undertake these initiatives/activities & actions
These actions will support improved performance in the following ways
To deliver Measured by In support of system outcomes
Five Integrated Family Health Centres established across the district covering 57% of the population
Strengthen Primary Care Services
Provide families with better health services - Minister‟s Priority Area
IFHC in Tararua and Horowhenua are providing integrated services
Otaki IFHC established by 31.10.11
Feilding IFHC established by 30.6.2012.
One PN IFHC established by 30.6.2012
Enhanced integration of Primary Health care services
Evaluate and improve Urgent Community Care (UCC)
Improve availability of Urgent Community Care (UCC)
Improved outcomes for people who need Urgent community care
Evaluation of Horowhenua Extended Care Paramedic pilot by February 2012
Evaluation of Enhanced Intermediary Services (extended DN services) service by February 2012
Additional walk-in nurse-triage clinics established in each IFHCs by June 2012
Support transfer of services to GPs through implementation of clinical decision computer system for assessment of anaemia, headaches +/-blackouts and epilepsy by 30.12.13
Enhanced Urgent Care in Communities
Implement a Chronic Care Model in a further 10 general practices by 30 June 2012
Improve chronic care management
An effective model of chronic care impacting positively on health outcomes of population with chronic illness
Chronic Care Model is implemented in a further 10 general practices by 30.6.12
Four collaborative clinical pathways established each year for the next three years for chronic conditions (diabetes, cardiology, respiratory and mental health). (12 pathways in total by 30.6.13) Refer note 1.
Standardised comprehensive health assessment/care plans are well utilised in general practice, PHO and Maori providers by 30.12.12
DHB-wide case management model established by 31.12.11
Centralised clinical-led referral management system for PHO and district nursing services, by 30.10.11
Annual practice profiles undertaken for each general practice team each year
Enhancement of chronic care services

Chapter Three: Delivery on Priorities & Targets
Annual Plan 2011/12, 28 June 2011 Page 26
Establish clinical leadership training and clinical networks
Clinical leadership enhanced Quality clinical services Two transformational clinical leadership programmes undertaken per year for the next three years
Enhanced clinical leadership service quality
Clinical network framework established
Evaluate Child Health and Mental Health clinical network pilots and plan roll-out across other areas by 30.10.11
Shared clinical governance/ service improvement framework established
Visible and shared clinical governance arrangement in place across MidCentral DHB‟s district by 30.12.11
Productive Community Programme is implemented in one IFHC by 30.6.12
Medicines Management committee established to replace MUPT providing an interdisciplinary, cross agency approach to managing pharmaceutical use within the district
Radiology Oversight Committee is reshaped and takes responsibility for managing Community Referred Radiology expenditure by 31.12.11
Extend Interdisciplinary Knowledge and Skills framework
Facilitate shared knowledge Improve Service Quality Acute Care, Mental Health, Practice Manager, Care Assistants and Case Management programmes are added to the Interdisciplinary Knowledge and Skills framework by 31.12.11
Enhanced service quality
Implement Information Management programme
Improved information management, referrals and information available to patients
Support primary/secondary care integration activities through access to data from across the health continuum.
Common referral systems in use throughout central region. (NB: Wairarapa has the electronic referral
system, and it is to be rolled out in Wellington.)
Improved information and outcomes of patients
All patients enrolled in Central PHO have access to their own health record and designated clinicians have access to up-to-date health records through Manage My Health by 31.10.11
Electronic referral system (aligned to CRISP project) by 1.7.12.
Whole of sector information analysis unit in place by 30.6.12
Information Management
Note:
1. Development of the collaborative clinical pathways is being led by the Better, Sooner, More Convenient Acute/Chronic Care Collaborative Group which comprises clinicians from primary and secondary care sectors. It is clinically
led and aims to establish pathways for high priority conditions for which a higher level of primary care involvement will generate gains. For example, the cardiology clinical pathways may be for atrial defibrillation and chest pain –
conditions which commonly present in secondary care and which guidelines can be effectively used to determine cause and treatment.

Chapter Three: Delivery on Priorities & Targets
Annual Plan 2011/12, 28 June 2011 Page 27
ix. Government Priority: Fiscal Responsibility
We will undertake these initiatives/activities & actions
These actions will support improved performance in the following ways
To deliver Measured by In support of system outcomes
Develop and implement an investment plan to support service development and associated capital requirements
Support MDHB‟s and the Central Region‟s annual plans
Improved productivity, capability and capacity
Site redevelopment of Palmerston North Hospital
Investment plan in place by 30.10.11
Cash requirements to enable MDHB to self-fund implementation of the Investment Plan identified by February 2012, and incorporated in 2012/13 Annual Plan
Service development occurs in line with annual/regional plans, and within agreed capital expenditure programme.
MCH‟s Clinical Services Plan reviewed by March 2012, and project plan and structure in place
Improve organisational culture of staff ownership and accountability
Increased business understanding
Each service aware of strategic objectives and operational goals of the organisation
Improved team performance
Shared approach to work principles
Committed people, disciplined thinking and action
Business alignment
Services delivered aligned with strategy
Knowledge sharing
Increased individual accountability
Team key performance indictors (KPIs)
People measures
Staff satisfaction survey
Organisation strength & stability
Organisational cohesion
Organisational targets met
Implemented quality initiatives
Increased patient satisfaction and outcomes
Strengthening of financial management knowledge and skill
Improved financial literacy
Future investment plan buy-in
Improved financial performance
Ability to invest in future services
Financial skills coverage Financial results to budget

Chapter Three: Delivery on Priorities & Targets
Annual Plan 2011/12, 28 June 2011 Page 28
3.1.2 Regional, Sub-Regional Priorities
x. Sub-Regional Priority: implementation of centralAlliance Road Map
We will lead/sponsor the initiatives/activities and actions that form part of our regional services plan
These actions will support improved performance in the following ways
To deliver Measured by In support of system outcomes
Continue the establishment of shared back-office functions, and management/governance processes:
Review and align best fit for delivery of Information Systems across Whanganui and MidCentral DHBs
Consistency and allocation of appropriate resources to ensure capability and capacity to deliver and support implementation plan for the CRISP
Streamlined management of IS service delivery functions across Whanganui and MidCentral DHBs
Provide sufficient skill and expertise to develop, implement and sustain current services and new information system / technology requirements
Options proposal identifying:
Systems and network review Capability assessment Impact and gap analyses Alignment of policies,
operating principles, functions and practices
Business process redesign requirements Benefits and costs of proposal
Investment requirements
Recommendations approved by both Boards by 30.6.12
Total cost of maintaining IS operations‟ service delivery functions reduced across DHBs
Level of sustained support and response times to on-site helpdesk enquiries
Network infrastructure and telecommunications functionality maintained at optimal levels
Successful interconnectivity between the DHBs
Achieve service delivery and financial benefits to the DHBs from establishing shared, common infrastructure and support services as part of centralAlliance
Assess feasibility of single transactional processing unit across Whanganui and MidCentral DHBs for accounts payable and receivable functions
Increased coverage for staff
Potential for improved efficiency
Standardisation of systems and common processes
Feasibility study and options proposal completed by 30.6.12 identifying:
Capability assessment Impact and gap analyses Alignment of policies,
operating principles, functions and practices
Business process redesign requirements Benefits and costs of proposal
Centralised processing Logistics and systems plan Software and technical
change requirements
Volume of invoices processed
Cost reduction
Supplier confidence in on time payments
Time between receipt of requisition to electronic payment systems
Achieve service delivery and financial benefits to the DHBs from establishing shared, common infrastructure and support services as part of centralAlliance
Establish combined asset management planning capability – implement agreed recommendations of
Agreed approach to ensure sustainability and affordability of capital expenditure plan across
Management plan for current assets within CentralAlliance completed
Approved asset management plan by Boards
Consistency with national
Achieve better value for money through collaborative planning and management of

Chapter Three: Delivery on Priorities & Targets
Annual Plan 2011/12, 28 June 2011 Page 29
Sustainability Report centralAlliance
Asset planning and management built into service planning framework
Common capital purchasing and procurement approach
Alignment of asset registers
Timeframes for capital funding aligned to planning priorities.
Capital Assessment guidelines
Consistency with RSP and clinical services‟ planning
assets across the DHBs, aligned to national purchasing and capital programmes
Undertake line by line review of contracts and procurement arrangements between Whanganui and MidCentral DHBs
Standardisation of contract arrangements
Reduced costs
Line by line reviews Review of multi function devises completed by 30.9.11
Review of PCs & laptops completed by 30.9.11
Telecommunication review completed by 30.11.11
Diagnostic price per treatment analysis (eg MRI, catscan) completed by 30.11.11
Joint purchasing plan for major capex
Achieve better value for money through shared procurement arrangements
Explore the opportunity to align organisational risk management systems, structures and processes
Standardisation of systems
Reduced costs
Single systems and processes Proposal established by 30.4.12 Achieve better value for money through shared systems
Develop joint proposals to be a demonstration site for Health Benefits Limited and the Health Quality & Safety Commission activities
Reduced costs Single systems and processes Proposals established as opportunities arise
Achieve better value for money through shared systems
Consider joint positions for all key management and clinical vacancies wherever appropriate
Reduced costs
Shared leadership
Common processes Proposals developed as opportunities arise
Achieve better value for money through shared systems
Build on shared approach to planning health & disability services:
Undertake subregional shared health needs assessment
Make best use of specialist expertise
Allow sub-regional prioritisation and planning based on health need
Joint health needs analysis review
2012/13 Improved & equitable health outcomes for communities
Develop two regionally deployed palliative care medical specialist positions across Whanganui, Taranaki, MidCentral
Improve overall access and equity of access to palliative care medical specialists
Support greater coordination of service planning and delivery between districts and within districts across primary, secondary and Hospice care
Mitigate workforce risks relating to recruitment and retention of medical
Improved options for care for people requiring palliative care
Positions in place by August 2011
Meeting medical supervision requirements of staff
Performance against agreed measures of improved clinical sustainability, access, quality, service integration and efficiency
Development of two regionally deployed palliative care medical specialist positions across Whanganui, Taranaki, MidCentral:
Palliative Care Clinical Director to provide clinical leadership and strategic direction to

Chapter Three: Delivery on Priorities & Targets
Annual Plan 2011/12, 28 June 2011 Page 30
specialists
Strengthen clinical leadership across palliative care
the clinical, education, research and clinical quality improvement aspects of palliative care across DHBs, Hospices and primary care.
Palliative Care Medical Specialist position to provide hands-on medical specialist services primarily to Arohanui Hospice, Hospice Wanganui and Hospice Taranaki.
Using successes to date, continue the development of combined clinical service delivery arrangements, with strong clinical governance:
Move from a “virtual” to a “one service, two-sites” service through implementation of the Subregional Service Model for Women‟s Health
Improve equity of access to the combined population over time
Assist with clinical sustainability
Women‟s Health Service Plan Board approval 2011/12, with implementation to follow
Improved clinical sustainability
Improved & equitable health outcomes for communities
Implement a subregional approach for Renal services
Assist with clinical sustainability
Enable prioritisation based on cost/benefit
Proposed approach Board approval 2011/12, with implementation to follow
Improved clinical sustainability
Improved & equitable health outcomes for communities
Ongoing support for newly established sub-regional services in Urology, and Women‟s Health
Successful sub-regional services which meet the needs of the populations and staff in both DHBs
The right services delivered to the right people at the right time
Establish other appropriate subregional services, eg ophthalmology, ENT, cardiology and sexual health
Services configured for optimal patient journeys
Proposed approach Management approval 2011/12, with implementation to follow
Improved clinical sustainability
Establish a common nursing professional development programme for specialist areas
Consistency of nursing professional development supporting combined service delivery arrangements
Easier access to more relevant & consistent in-house nursing education using modern educational and communication tools.
Common programme in place 2011/12
Improved workforce sustainability
Establish a discipline-specific common Allied Health professional development system
Consistency of allied health professional development supporting combined service delivery arrangements
Alignment of allied health expertise and capacity across the two DHBs under common allied health leadership
Development of consistent discipline specific processes around student placements and new staff (new graduates)
Improved workforce sustainability

Chapter Three: Delivery on Priorities & Targets
Annual Plan 2011/12, 28 June 2011 Page 31
Establish a subregional Clinical Leaders Forum
Shared clinical arrangements Forum for clinical networking and developments
Professional development plans & maintenance of professional standards
Clinical leadership
Ensure shared Clinical Governance features in all of the shared service arrangements
Development of shared clinical programmes to be supported by senior clinical staff
Safer quality systems Measures to be developed by Clinical Board
No of services with shared clinical governance
Clinical leadership
Explore sonographer training opportunities in alliance with Whanganui DHB by 30.12.11
Improved success of development & implementing shared programmes
Consistency of sonography training
Improved workforce sustainability

Chapter Three: Delivery on Priorities & Targets
Annual Plan 2011/12, 28 June 2011 Page 32
3.1.3 Local Priorities
xi. Local Priority: Child and Adolescent Oral Health Services
We will undertake these initiatives/activities & actions
These actions will support improved performance in the following ways
To deliver Measured by In support of system outcomes
Continued phased implementation of the Child and Adolescent Oral Health Service (CAOHS) redevelopment Business Case
Increase availability of oral health services for the 0-18 age group provided by CAOHS
Provide easier access for all children and adolescents to oral health services in the district
Support increased productivity and throughput
Phase in new workforce configuration
Enable the service to achieve a sustainable workforce
Comply with clinical practice requirements and safety of facilities/utilities
Fixed sites built and commissioned
Mobile clinics purchased and commissioned
Increased age range and number of enrolled children
Increased School dental client attendances
Increased utilisation of service by adolescents
Implementation plan in place to meet MoH‟s productivity expectations
Workforce plan implemented
100% of existing school clinics decommissioned
Equipment purchased according to plan and within budget
Increased number of school dental clients
Increased number of Dental Therapists delivering services for 50 weeks of the year
Increased number of under 5 year old children enrolled with dental service
Increased number of adolescents utilising DHB funded oral health services
Improving the oral health status of children and adolescents

Chapter Three: Delivery on Priorities & Targets
Annual Plan 2011/12, 28 June 2011 Page 33
xii. Local Priority: Quality of Service and Patient Safety
We will undertake these initiatives/activities & actions
These actions will support improved performance in the following ways
To deliver Measured by In support of system outcomes
Implement a comprehensive falls strategy targeted at all hospitalised patients over the age of 65 years
Reduce the number of falls resulting in harm to hospitalised patients aged over 65 years of age
Reduce personnel costs in medical, surgical and ATR wards associated with providing constant observation
Minimise likelihood and consequence of elderly patients having a fall whilst in hospital
Reduce injuries and opportunistic complications of care and need for additional interventions resulting from falls
Reduce overall length and cost of inpatient stay for older patients
Established Falls Injury prevention standard
Reduced nurse hours spent on constant observation/”specialling” duties
3 Invisabeams purchased
Enhanced night time lighting in target wards
Standard developed and implemented by March 2012
> 80% of patients aged >65 years have falls risk assessment completed
Occurrence rate of falls/1000 bed days
Reduced number of falls occurring between 2000hrs and 0800hrs
Improving quality of service and safety of patients through reducing the risk of harm to hospitalised patients from adverse events
Increase capacity and capability to provide medication reconciliation coverage across all medical wards and ICU
Reduce overall cost of prescribed pharmaceuticals (community- and hospital-based)
Reduce number of incidents for medication prescribing and administration errors
Reduce complications of care resulting from inadvertent and adverse pharmacotherapy
Enable capability to complete reconciliation and monitoring of prescribed medicines
Increased availability of FTE Clinical Pharmacists
Medication chart reviews
Increased number of hospitalised patients who have Medication Reconciliation process completed
Unintentional prescribing discrepancies detected
Access to data repository of electronic records to match community and hospital dispensed medications over time per patient
% discharged patients with complications of care arising from administration of prescribed drugs during their hospital stay
Occurrence rate of medication errors/1000 beddays
% total prescribed items identified as an unintentional discrepancy
Reduced total expenditure on pharmaceuticals (all medical wards and ICU)

Chapter Three: Delivery on Priorities & Targets
Annual Plan 2011/12, 28 June 2011 Page 34
xiii. Local Priority: Maori Health
(MidCentral DHB has a Maori Health Plan and the following initiatives reflect that Plan’s priorities. The Maori Health Plan can be accessed from www.midcentraldhb.govt.nz)
We will undertake these initiatives/activities & actions
These actions will support improved performance in the following ways
To deliver Measured by In support of system outcomes
Review the Maori Health contracts and design a Whanau ora pathway for the district
Create a whanau ora service pathway with Maori health providers as the core of Whanau ora services in integrated primary / secondary care
Improved health outcomes for Maori and reduction in inequalities
Review report is completed in December 2011
Whanau ora Pathway designed with engagement with providers by June 2012
Better integration of Maori health services
Improved services for Maori
Launch Maori Health Workforce Action framework
Establish Maori health workforce network
Establish promotion
Establish mentoring
Establish career planning resource
Establish self-care resources for Maori health workforce
Launch action oriented workforce development underpinned by leadership and reciprocity
Grow the numbers in the Maori health workforce and develop the current workforce.
Launch Action Framework by July 2011
Establish network by July 2011
Establish mentoring programme by September 2011
Establish self care and career planning resources by June 2012
Improved participation of Maori health workforce
Increased responsiveness of the health system to Maori
Improve Maori Responsiveness in Cancer Services Continuum
Create a clear and responsive service Pathway for Maori with Cancer
Improve the outcomes for Maori with cancer
Identify opportunities for improvement of Maori responsiveness of Cancer services by December 2012
Action recommendations by June 2012
Responsive Cancer Services to Maori
Implement the Whanau ora stream of the Better Sooner More Convenient business case
Improved access and utilisation of health services amongst whanau
Progress toward whanau ora health outcomes
Maori enrolments with PHOs increased by 5% per year for each of the next three years (Baseline: 24,000 enrolments December 2009)
By 30 September 2011 evaluate the Te Ara Whanau Ora assessments pilot for Maori whanau ora who are not enrolled with general practice
100 practitioners receive cultural competence module training by 30 June 2012
Enhancement of health system to Whanau ora

Chapter Three: Delivery on Priorities & Targets
Annual Plan 2011/12, 28 June 2011 Page 35
Review the Maori Health contracts and design and Whanau ora pathway for the district
Create a whanau ora service pathway with Maori health providers as the core of Whanau ora services in integrated primary / secondary care
Improved health outcomes for Maori and reduction in inequalities
Review report is completed in December 2011
Whanau ora Pathway designed with engagement with providers by June 2012
Better integration of Maori health services
Improved services for Maori

Chapter Three: Delivery on Priorities & Targets
Annual Plan 2011/12, 28 June 2011 Page 36
xiv. Local Priority: Mental Health and Addictions
We will undertake these initiatives/activities & actions
These actions will support improved performance in the following ways
To deliver Measured by In support of system outcomes
The description of a Whanau wellbeing centred model that describes the roles and linkages of Maori mental health services across the care continuum
The service model will apply the principles of integration and whanau ora. It will utilise output and outcome measurement systems to document tangata whaiora service progress
Reconfiguration of Maori mental health and addiction services locally to ensure services are the right size, scope and quality to meet demands
Transfer of resources from expensive inpatient services to community and primary health based services where appropriate
Workforce development focused on supporting the model of care greater integration and whanau ora
More appropriate utilisation of local services
Improved outcomes by integrating cultural values within all aspects of the service
Increased accessibility options report for high need populations.
Report completed with needs based and inequalities scrutiny July 2011
Purchasing agreements allow for iwi and other Maori groups to be engaged in the planning, implementation, maintenance and evaluation of the service December 2012
Evaluation tool by December 2012
A more unified and improved Maori mental health and addiction sector
Whanau ora centred mental health and addiction services
Early treatment and support
Intervention and prevention
Establish a suicide intervention coordinator position
Improve the coordination of suicide related services and information to people and their families
Improved outcomes for people particularly a reduction in suicide and suicide attempts by people living in the MidCentral district
Position established by December 2011.
Number of people who have completed suicide self harm intervention training
Number of providers that have adopted assessment tools and processes
A service model that ensures linkages of all services within the care continuum from health, police and education by June 2012
Effective suicide prevention and support services
The consistent use of assessment tools that progress through screening to more comprehensive assessment will result in earlier detection of problems
Reconfigure Mental Health and Disability Support Services to better meet the needs of the mental health ageing population
Develop models of care and pathways for this client group
Clarification of the role of all providers across the continuum of care including regional services
Reconfigure services to meet the new models and care pathways
Improve integrated service delivery to people with both disability and mental health needs
Adoption of the agreed models of care and clinical pathways for disability and mental health clients
Reconfiguration of mental health and disability support services to meet client demand and increase local access
More appropriate utilisation of residential providers and care services
Improved clinical pathways and assessment processes and provision of mental health/disability service
Increased numbers and rates of people receiving services in the community
Improved outcomes for service users and the family
Reduced average length of stay in inpatient mental health beds
Integrated mental health and disability services
Improved clinical sustainability
Improved financial sustainability

Chapter Three: Delivery on Priorities & Targets
Annual Plan 2011/12, 28 June 2011 Page 37
xv. Local Priority: Further maturity of business continuity & disaster recovery capability framework
We will undertake these initiatives/activities & actions
These actions will support improved performance in the following ways
To deliver Measured by In support of system outcomes
Improve business continuity management across the DHB
Confirm business impact analysis for each group
Minimise disruption to patients and community resulting from inability to restore critical information systems
Ensure business continuity is aligned to DHB‟s Health Emergency Plan
DHB Business Continuity Management policy and plan in place by 30.6.12
BCP reviewed and updated annually
Assigned owner of BCP recognised
Sustained levels of access to health services by patients / community throughout the district in the event of civil emergencies
IS disaster recovery plan (DRP) updated to include process for review and update of testing DRP
Sufficient controls in place to minimise the impact of any disaster
Reduced delays in recovering critical business systems and services
Approved DRP test plan in place by 31.8.11
DRP testing undertaken quarterly and annually
Number of test scenarios completed successfully
Increased number of IS staff trained in DRP
Each computer, system or network has adequate manual workarounds in place
Manual back up procedures and timeframes established
Critical functions sustain ongoing delivery of health and disability services in the event of DHB information systems‟ failures

Chapter Three: Delivery on Priorities & Targets
Annual Plan 2011/12, 28 June 2011 Page 38
xvi. Local Priority: Streamlining planning and active management of projects across MDHB
We will undertake these initiatives/activities & actions
These actions will support improved performance in the following ways
To deliver Measured by In support of system outcomes
Develop proposal to establish DHB wide Programme Management Office
Lead to application of best practice processes and competency in supporting the execution of the DHB‟s strategies and priorities
Identify best model to implement effective and efficient change management programme(s)
Define and standardise systems and processes for programme and project management throughout the organisation
Enable better selection, specification, planning, execution and realisation of intended benefits from service developments, change programmes and projects
Identify approach to increase education, training and exposure of staff to project management discipline with adequate support
Reduce waste in resources and duplication of effort applied to implementing service development and change projects
Proposal for EPMO (DHB-wide) completed by 31.1.12
Draft implementation plan
Resource requirements identified
Approval by Executive Management Team
Agreed Programme Management Framework adopted
Improve DHB efficiency and value for money through better management of change projects
Develop Business case for business intelligence solution
Provide better, on time, delivery of relevant information to support decision making
Improve monitoring and management of organisational performance, including activity drivers and cost trends
Retain structured data to maintain history with appropriate data storage
Improve completeness, consistency and reliability of clinical and management information, with one “source of truth”
Reduce reliance on widespread use of feral databases
Business case to implement with preferred solution to improve data management, information and performance reporting to include:
Data warehousing requirements
Delivery tools and mechanisms
Business process redesign requirements
Business case developed by 31.1.12
Approval by EMT and Board by 30.6.12
Execution of implementation plan completed in 2012/13 year
Data warehouse fully operational to meet functional requirements and specifications
Integrated information delivery tools
Supports Government‟s priorities to improve hospital productivity, increasing confidence in information to support planning and decision-making - supports provision of evidence of effective and efficient health care delivery. Also assists with meeting accountability obligations and performance reporting requirements of the Operational Policy Framework.

Chapter Three: Delivery on Priorities & Targets
Annual Plan 2011/12, 28 June 2011 Page 39
Reduce time on maintaining feeder systems to support current data collections (local and national) and data repositories
Enhance capability and skill in use of information and analyses rather than data
Reduce infrastructure, application demands and support requirements on IS personnel
Reduce time in data cleansing and verification processes

Chapter Three: Delivery on Priorities & Targets
Annual Plan 2011/12, 28 June 2011 Page 40
xvii. Local Priority: Further Develop Enable New Zealand as a National Procurement & Distribution Service
We will undertake these initiatives/activities & actions
These actions will support improved performance in the following ways
To deliver Measured by In support of system outcomes
Implement a Purchasing and Procurement Strategy for equipment and other services by June 2010 and review by June 2013
Deliver a cost effective, standardised equipment and housing modification service to people with a disability throughout New Zealand
Procurement of equipment on behalf of two or more entities
Number of entities for whom we are procuring equipment. The volume and value of those purchases and subsequent savings to those entities
More cost effective, centralised procurement
Includes the development of other procurement and supply arrangements, such as direct sourcing and the use of distributors.
Deliver at least 5% savings against trade prices to new entities on whose behalf we are procuring
Continue to deliver existing savings to current funder‟s (ACC and Ministry of Health)
The costs of increased procurement activities are offset against the quantitative and qualitative benefits
Percentage reduction in total costs across the supply chain
Freeing up funds for services (ACC and MoH)
Review the Warehouse and Distribution Strategy by December 2011
The strategy clearly identifies:
a proposed model (at a macro level)
any opportunities to reduce costs and improve services
a risk plan implementation plan
Value of savings on warehousing, freight and distribution costs have been quantified via further development of the revised strategy
More effective and efficient warehousing and distribution model
Investigate and implement the most appropriate entity configuration for Enable New Zealand to facilitate it‟s developing role as a national purchasing and procurement entity
The entity type will support organisational growth and development in the most effective manner possible
Sustainable access to cost effective, centralised services
Investigation of options & preferred entity type completed by September 2011
Implementation of preferred entity type by June 2012
Efficient and flexible infrastructure to support the sector

Chapter Three: Delivery on Priorities & Targets
Annual Plan 2011/12, 28 June 2011 Page 41
3.2 Indicators of DHB Performance
The Ministry of Health monitors DHB performance on behalf of the Minister.
The non financial monitoring framework is a key tool to provide assurance that the DHB systems delivers in terms of Government priorities and legislative requirements (particularly the New Zealand Public Health and Disability Act 2000). This is “to the extent they are reasonably achievable within the funds provided” (NZPHD Act S3(2).
The non financial monitoring framework is part of wider accountability arrangement managed by the Ministry.
The monitoring framework for 2011/12 places more of a focus on activity, outputs and impacts monitoring than in previous years. There is increasing interest in the DHB‟s Provider arm because of the high level of financial investment in this part of the DHB, and its impact on overall health spending. Productivity and value for money is featured more strongly in the monitoring framework as a consequence.
The framework has four dimensions of performance that reflect the DHB‟s functions as owners, funders and providers of health and disability services. These dimensions cover:
Achieving Government‟s priorities and targets
Meeting service coverage requirements and supporting sector interconnectedness
Providing quality services efficiently
Purchasing the right mix and level of services within acceptable financial performance
The aim of the dimensions framework is to highlight key DHB functions that if monitored via performance indicators, alongside financial performance, provide the Minister of Health with confidence that required expectations are being met. It is intended that the structure of the framework assist stakeholders to „see at a glance‟ how well DHBs are performing across the breadth of their activity, but with the balance of measures focused on government priorities.
Each DHB is required to set out the target or expected deliverable for each measure in its Annual Plan. The Annual Plan also describes the key activities that will be undertaken in the year to advance achievement of the national Health Targets and other measures contained in the monitoring framework. Progress towards each target or measure will be assessed by the Ministry of Health (using standard assessment criterion), reported to the Minister of Health and publicly reported on the Ministry‟s website according to the reporting frequency for each measure.
The measures identified in the framework replace the Indicators of DHB performance, additional reports and Hospital Benchmark Information of previous years. The measures, together with their targets where they apply and reporting frequency, are set out in Appendix B

Chapter F
Annual Plan 2011/12, 28 June 2011 Page 42
Chapter Four: Forecast Service Performance
4.1 Statement of Forecast Service Performance
4.1.1 Statement of Forecast Service Performance
MidCentral DHB has developed a Statement of Forecast Service Performance (SFSP) for each of its four output classes. These set out the initiatives/activities the Board will be undertaking and/or funding, the outputs expected, and expected impacts and outcomes. Impact targets are provided for 2011/12. In future years, the DHB seeks to maintain and/or improve on results.
The SFSP covers the majority of the DHB‟s business, accounting for over 80% of the organisation‟s revenue and expenditure (see table on right).
4.1.2 Output Classes
DHB‟s outputs have been categorised into four Output Classes. These are:
Prevention Services
Early Detection and Management
Intensive Assessment and Treatment
Rehabilitation and Support
Revenue and Expenditure by Output Class
Budget Budget Budget Budget Budget Budget
Revenue Expenditure Revenue Expenditure Revenue Expenditure
$000 $000 $000 $000 $000 $000
Prevention Services
MidCentral Health Public Health 6,554 6,565 6,736 6,747 6,918 6,929
Immunisation 1,196 1,196 1,229 1,229 1,262 1,262
Other Services 1,847 1,856 1,898 1,907 1,949 1,958
Total Prevention Services 9,597 9,617 9,863 9,883 10,129 10,149
Early Detection and Management
Pharmaceuticals 46,050 46,050 47,330 47,327 48,610 48,604
Primary Health Organisations 28,567 28,567 29,361 29,359 30,155 30,151
Laboratories 10,250 10,250 10,535 10,534 10,820 10,818
Chronic Disease Management and Education 4,253 4,253 4,371 4,371 4,489 4,489
MidCentral Health Dental Health 3,772 3,801 3,877 3,906 3,982 4,011
Other Services 34,128 34,270 35,077 35,220 36,026 36,170
Total Early Detection and Management 127,020 127,191 130,551 130,717 134,082 134,243
Intensive Assessment and Treatment
Surgical Specialties / ICU / Anaesthetics 69,156 66,091 71,079 67,926 73,002 69,759
Internal Medicine 49,129 46,010 50,494 47,286 51,860 48,562
Regional Cancer Treatment Serv 37,808 33,960 38,859 34,902 39,910 35,844
Women's & Children's Health 30,979 28,461 31,840 29,250 32,701 30,039
Mental Health 28,083 26,244 28,864 26,972 29,645 27,700
Elderly Health 13,663 14,507 14,043 14,909 14,423 15,311
Rehabilitation and Therapy 12,743 13,666 13,097 14,045 13,451 14,424
Emergency 14,230 13,092 14,625 13,455 15,021 13,818
Clinical Support 9,189 8,878 9,444 9,124 9,699 9,370
Other Services 15,574 22,588 16,007 23,214 16,440 23,840
Inter District Flows 41,785 47,674 43,235 49,328 44,735 51,040
Total Intensive Assessment and Treatment 322,339 321,171 331,587 330,411 340,887 339,707
Rehabilitation and Support Services
Residential Care 40,483 40,483 41,608 41,606 42,734 42,729
Disability Services (Enable NZ) 26,642 26,536 27,382 27,272 28,123 28,008
Home Support 10,779 10,779 11,079 11,078 11,379 11,377
Palliative Care 3,026 3,026 3,110 3,110 3,194 3,194
Other Services 3,409 3,494 3,504 3,591 3,599 3,688
Total Rehabilitation and Support Services 84,339 84,318 86,683 86,657 89,029 88,996
Total 543,295 542,297 558,684 557,668 574,127 573,095
2011/12 2012/13 2013/14

Chapter Four: Forecast Service Performance
Annual Plan 2011/12, 28 June 2011 Page 43
Prevention Services
Prevention services are those aimed at improving the health of the population as a whole (as distinct from personal health services which are delivered to individuals). They include health promotion, health protection, family violence programmes, and immunisation. Smoking cessation and breastfeeding programmes are examples of health promotion activities. Health protection includes monitoring of food outlets, alcohol licensed premises, and the communicable disease programme.
Some prevention services are provided by the DHB, particularly through its Public Health Unit. Other organisations, such as Primary Health Organisations, Regional Sports Trust, and local government, are also involved in providing these services.
Fundamental to MidCentral DHB‟s vision of “quality living – healthy lives” is supporting people to take simple steps to improve their health and reduce diseases that are largely preventable. Things like exercising regularly, eating a healthier diet and getting regular health checks. MidCentral DHB‟s key focus in this area continues to be immunisation and smoking cessation. Investment in these areas can have a significant impact on the district‟s health. Immunisation can prevent a number of diseases and is a very cost-effective health intervention. Immunisation provides not only individual protection for some diseases but also population-wide protection by reducing the incidence of diseases and preventing them spreading to vulnerable people.
According to national statistics, smoking kills an estimated 5,000 people in New Zealand every year, and smoking-related diseases are a significant opportunity cost to the health sector. Most smokers want to quit, and there are simple effective interventions that can be routinely provided in both primary and secondary care.
77%
85%92% 95% 95% 95%
0%
10%
20%
30%
40%
50%
60%
70%
80%
90%
100%
2008/09 actual
2009/10 actual
2010/11 forecast
2011/12 target
2012/13 target
2012/14 target
% of Two-Year Olds Fully Immunised
35%
67%
95% 95% 95%
0%
20%
40%
60%
80%
100%
2009/10 actual
2010/11 forecast
2011/12 target
2012/13 target
2013/14 target
% Hospitalised Smokers Offered Advice/Help
to Quit Smoking
Total budgeted revenue for this output class is around $9.6m, with expenditure also $9.6m.

Chapter Four: Forecast Service Performance
Annual Plan 2011/12, 28 June 2011 Page 44
Early Detection & Management
Early detection and management services are largely community based, and are focused around easy access for people so they can have regular health checks or contact a health professional if they are concerned. These services are largely contracted by the DHB and provided by Primary Health Organisations, general practice, pharmacists, community laboratory and radiology providers, Maori health providers, Plunket, and a whole host of others.
MidCentral DHB‟s focus continues to be chronic diseases, including diabetes and cardiovascular disease. It has invested heavily in increasing the capacity and capability of the district‟s primary health service so that local communities can readily access primary health care, including chronic disease services, as close to home as possible. It is these health providers that people see most often. This work has included co-ordination of after-hours arrangements. Easier access is critical, particularly for those of our communities living in rural areas. High needs population groups, such as Maori, are another key area of focus. This work continues and integrated family health centres are being developed. Several services/tests previously provided in a hospital setting, such as cardiovascular risk assessments, are now available in the community and this trend will continue. This enables early diagnosis and intervention, as well as ensuring long term (chronic) conditions are well managed.
73.0% 74.7%80.0% 80.0% 82.0%
85.0%
50.0%60.7%
72.0% 75.0% 78.0% 81.0%
76.0% 77.7%81.0% 81.0% 83.0%
86.0%
0%
10%
20%
30%
40%
50%
60%
70%
80%
90%
100%
2008/09 Actual
2009/10 Actual
2010/11 Forecast
2011/12 Target
2012/13 Target
2013/14 Target
% People with Diabetes with HBA1C <8%
Total
Maori
Other
78.0%
83.9% 84.0%
90.0% 90.0% 90.0%
69.0%75.6% 76.0%
90.0% 90.0% 90.0%
81.1%86.3% 86.0%
90.0% 90.0% 90.0%
0%
10%
20%
30%
40%
50%
60%
70%
80%
90%
100%
2008/09 Actual
2009/10 Actual
2010/11 Forecast
2011/12 Target
2012/13 Target
2013/14 Target
% Eligible Adult Population with CVD Risk
Assessed (laboratory tests) in last 5 Years
Total
Maori
Other
Total budgeted revenue for this output class is $127m with expenditure of $127m.

Chapter Four: Forecast Service Performance
Annual Plan 2011/12, 28 June 2011 Page 45
Intensive Assessment & Treatment
Intensive Assessment & Treatment services are services generally accessed through referral from a community-based health professional, such as a GP. Intensive treatment and assessment services are largely provided by hospital services (secondary care level services) and include inpatient hospital services, outpatient assessments, hospital maternity services, and emergency department and ICU care. MidCentral DHB‟s provider arm, MidCentral Health, is the main provider of these services locally. Other DHBs, including tertiary centres (eg, Capital & Coast DHB, Starship, and Auckland DHB) are also providers.
Early diagnosis and intervention is essential when a person is at risk of illness or injury. A comprehensive, easy to access hospital service is therefore an integral part of the health system and must be capable of responding to demand. MidCentral DHB‟s focus in this area over recent years has been three-fold: to increase elective throughput, and reduce waiting times for radiation therapy cancer services and its emergency department services.
Until recently, the DHB‟s hospital services experienced difficulties with its internal systems which hindered its ability to provide contracted levels of elective work. It had to outsource over 10% of work. Since 2009/10 the DHB has systematically removed blocks in the system, with great results. All elective work is now done in-house – a 19% improvement in 2009/10 on the previous year. It aims to continually increase elective volumes so people receive treatment in a timely manner, and that capacity keeps pace with demand.
Emergency department wait times are a good indicator of a hospital‟s acute treatment services.
MidCentral DHB offers a regional cancer treatment service and has invested significantly in increasing its radiation therapy capacity to meet growing demand. Radiotherapy is of proven effectiveness in reducing the impact of a range of cancer, and timely intervention is important.
5,250
5,717
5,9285,987
6,046
4,800
5,000
5,200
5,400
5,600
5,800
6,000
6,200
2009/10 actual *
2010/11 forecast
2011/12 target
2012/13 target
2013/14 target
Elective Surgery Discharges
Discharges
0%
20%
40%
60%
80%
100%
120%
2008/09 actual
2009/10 actual
2010/11 forecast
2011/12 target
2012/13 target
2013/14 target
% Radiation Oncology Patients Seen within
Target Wait Time*
*Target to 31.12.10 = 6 weeks. Thereafter, 4 weeks
Total budgeted revenue for this output class is $322m with expenditure of $321m.

Chapter Four: Forecast Service Performance
Annual Plan 2011/12, 28 June 2011 Page 46
Rehabilitation & Support
Rehabilitation & Support services are broad ranging, and are usually identified and co-ordinated through the Needs Assessment & Service Co-ordination (NASC) process. They include, but are not limited to, palliative care, home help, aged residential care, and respite care. MidCentral DHB provides the NASC function and contracts with a range of providers, including hospices, rest homes, and home help agencies for other services. A lot of work is being done nationally to review residential care and MDHB will be participating in this.
For people living with a disability or age-related illness, it is important they are supported to maintain independence and quality of life. Over the past 3-5 years, MidCentral DHB focused on introducing a standard approach to palliative care throughout the district. It used the Liverpool Care of the Dying Pathway and has worked to introduce this into community, hospital and hospice care.
It is now focusing on the quality of care provided within aged residential care facilities, and ensuring the needs of older people in the community are assessed as close to home as possible and that care for this age group is co-ordinated and managed through general practice. MidCentral DHB utilises InterRAI as an assessment tool for home support services, and is progressively transferring this assessment process to Integrated Family Health Centres. It is planning to introduce a similar assessment tool for access to residential care.
Increasing the skills and knowledge of aged residential care providers is an essential part of MDHB‟s plans for improving the quality care. It has also increased the level of respite care beds for dementia care, and continues to increase day care programmes, including a green prescription programme for older adults.
New measures have been established to enable us to monitor the effectiveness of care, both community and residential, for this population group. People in aged residential care can have complex health conditions and health issues relating to the ageing process. A means of monitoring the appropriateness of care being provided to them, the level of hospital admissions (via the Emergency Department) is a useful indicator. Admissions for certain conditions are monitored, such as dehydration, nutrition deficiency, anaemia, cellulitis, dermatitis, eczema and gastroenteritis.
The level of falls is commonly used nationally and internationally as an indicator of how well older people are being supported in the community. This includes their overall health status and environment. Older people who have a fall have less favourable outcomes than those who do not.
Target Baseline 2009/10
2011/12 2012/13 2013/14
Proportion of MDHB‟s population aged 75 years and older who are hospitalised for falls
7.5% <7.5% <7.25% <7.25%
Number of hospital admissions from rest homes via Emergency Department that could have been circumvented
106 <100 <95 <90
Total budgeted revenue for this output class is $84m, with expenditure also $84m.

Chapter Four: Forecast Service Performance
Annual Plan 2011/12, 28 June 2011 Page 47
4.1.3 Measures of DHB Performance by Output Class
Prevention Services
Output Class: Prevention Services Output: Health Promotion and Education Services
We will undertake these initiatives/activities
And deliver these outputs
Outputs measured by That will lead to these impacts
Impacts measured by To achieve these outcomes
Improve access to smoking cessation services
Progress health promotion programme (Smokefree / Auahi Kore)
Develop and deliver “it‟s about Whanau” quit smoking campaign that is aimed at increasing quit attempts amongst Maori smokers
Support for pregnant women who smoke to quit
Increase the number of hospital clinical staff who have completed ABC (cessation) training.
Fund PHO and MCH to deliver smoking cessation services
Smoking cessation services
Promoting Smokefree environment
Number of smokers aged 15+ admitted to hospital who are provided with advice and help to quit
Baseline 6 mths to Dec 2010
By 30.6.2012
1,531 4,640
Proportion of smokers aged 15+ admitted to hospital who use Nicotine Replacement Therapy as part of the care plan
Baseline Oct 2010
By 30.6.2012
40% 40%
Number of ABC staff training sessions delivered per month (primary and secondary)
Baseline By 30.6.2012
N/A 20
Reduced proportion of smokers in the population
Reduced proportion of never smoked at Year 10
A reduction in smoking related cancers
Increased proportion of smokers attempting to quit
Percentage of current smokers in the adult population *
Baseline 2006/07
By 30.6.2012
20.8% <21%
* Subject to availability of 2010/11 NZ Health Survey results
Proportion of smokers aged 15+ admitted to hospital who are provided with advice and help to quit
Baseline 6mths to Dec 2010
By 30.6.2012
63% 95%
Proportion of current smokers aged 15 – 75 years enrolled in a PHO provided with advice and help to quit
Baseline By 30.6.2012
N/A 90%
Contributing to the health and disability sector outcome “New Zealanders living longer, healthier and more independent lives” and the primary intermediate outcome of “good health and independence are protected and promoted”
Unified and improved health and disability system by supporting cultural and clinical change so that smoking becomes a vital sign in healthcare settings
Healthier population with lower prevalence of smoking related conditions and more smoke-free areas.

Chapter Four: Forecast Service Performance
Annual Plan 2011/12, 28 June 2011 Page 48
We will undertake these initiatives/activities
And deliver these outputs
Outputs measured by That will lead to these impacts
Impacts measured by To achieve these outcomes
Encourage and ensure local providers are promoting breastfeeding
Baby Friendly Hospital initiatives, including lactation support
Coordinated provision of high quality specialist and community-based breastfeeding support services
Work with sub-populations that have lower breastfeeding rates
Breastfeeding education and promotion services
Number of mothers educated and supported in breastfeeding:
At 6 weeks: >1,090 At 3 months: >1,050 At 6 months: >490
Established breastfeeding at discharge from hospital
Baseline 2009
By 30.6.2012
81% 90%
Improved breastfeeding rates in the district
Breastfeeding rates: six weeks:
Baseline 2010 (Plunket)
By 30.6.2012
61% 67%
Breastfeeding rates: three months:
Baseline 2010 (Plunket)
By 30.6.2012
47% 55%
Breastfeeding rates: six months:
Baseline 2010 (Plunket)
By 30.6.2012
16% 26%
Contributing to the outcome of “good health and independence are protected and promoted”, as breastfeeding benefits the physical and emotional health of mothers and infants

Chapter Four: Forecast Service Performance
Annual Plan 2011/12, 28 June 2011 Page 49
We will undertake these initiatives/activities
And deliver these outputs
Outputs measured by That will lead to these impacts
Impacts measured by To achieve these outcomes
Support service providers to better identify, assess and refer victims of domestic violence and abuse
Identify at-risk families through appropriate and timely screening.
Fund providers to deliver culturally responsive family violence intervention programmes
Consistently complete injury assessment and injury flow chart for children 0-5 years presenting to Emergency Department
Family violence intervention coordination services
Proportion of women screened in designated DHB services
Baseline Feb 2011
2011/12
50% >50%
Number of staff trained in Family Violence identification and intervention (new MoH training package)
Baseline Feb 2011
2011/12
28 200
More women referred for support as a result of screening for domestic violence
Reduced incidence of harm to women from domestic abuse
Increased numbers of referrals to CYF and numbers of children entered on the FV Alerts
Increased awareness of child abuse and neglect
Increased identification of child abuse in the under 5s
Comprehensive safety plans will increase future safety for children
DHB hospital audit scores for responsiveness to child and partner abuse:
Baseline Sep 2009
2011/12
144/200 >140/200
Proportion of children presenting to Emergency Department aged 0 – 5 years with injury assessment tool completed prior to discharge from ED
Baseline 12 months to Jan 2011
2011/12
50.3% >70%
Contributing to the intermediate outcome of “good health and independence are protected and promoted”, and, ensuring the safety and wellbeing women and children
Safer children

Chapter Four: Forecast Service Performance
Annual Plan 2011/12, 28 June 2011 Page 50
Output Class: Prevention Services Output: Health Protection Services
We will undertake these initiatives/activities
And deliver these outputs
Outputs measured by That will lead to these impacts
Impacts measured by To achieve these outcomes
Fund a range of providers to deliver immunisation services
Ensure immunisation providers operate recall systems
Training in immunisation provision, health education for parents, and extend knowledge about vaccine preventable diseases
Immunisation services (through general practice, hospital, outreach, school and other community settings)
Two year olds fully vaccinated:
Baseline 2009
2011/12
1,916 2,188
Year 7 students vaccinated:
Baseline 2009*
2011*
1,660 1,743
*calendar year Immunisation: over 65 year olds flu vaccinated:
Baseline 2009
2011/12
14,837 17,054
Reduced incidence of vaccine preventable and prophylaxis preventable diseases among children and older adults
Reduced hospital admissions of older adults with flu like illness
Proportion of 2 year olds fully vaccinated
Baseline 2009
By 30.6.2012
80% 95%
Proportion of students receiving Year 7 vaccination
Baseline 2009
By 30.6.2012
57% 63%
Proportion of PHO enrolled population aged 65+ years receiving flu vaccination
Baseline 2009
By 30.6.2012
57% 63%
Reduced likelihood of children acquiring disease and long term conditions later in life, contributing to the health and disability sector outcome “New Zealanders living longer, healthier and more independent lives” and the primary intermediate outcome of “good health and independence are protected and promoted”.

Chapter Four: Forecast Service Performance
Annual Plan 2011/12, 28 June 2011 Page 51
We will undertake these initiatives/activities
And deliver these outputs
Outputs measured by That will lead to these impacts
Impacts measured by To achieve these outcomes
Undertake statutory/regulatory compliance water quality, inspections of early childhood centres, controlled purchase operations of tobacco retailers and alcohol licensees
Assist applications from local operators to access national funding (Capital Assistance Programme) to upgrade their local water supply infrastructure
Statutory and regulatory services provided by Public Health Unit
Number of Early Childhood Centre visits
Baseline YTD Feb 2011
2011/12
8 12* * subject to number of new premises and requests from Ministry of Education
Number of controlled purchase operation visits carried (tobacco control – sales to minors)
Baseline YTD Feb 2011
2011/12
66 80
Number of liquor licences processed
Baseline 2011/12 To be established in 2011/12 year
100
Number of vertebrate toxic agent permits audited
Baseline 2011/12 To be established in 2011/12 year
30
At least one successful application for CAP funds to a local drinking water supply operator in 2011/12.
Limited access to tobacco and alcohol products to legal age for purchase
Reduced incidence of young people taking up smoking tobacco Reduced incidence of water-borne diseases
Proportion of licensed premises meeting host responsibility requirements: 100% (Baseline n/a)
Community outbreak cases as a proportion of notified cases of (acute) gastrointestinal disease caused by pathogens in drinking water: No target.
Contributing to the primary intermediate outcome of “good health and independence are protected and promoted”, and people enjoying healthier lifestyles in a safe and healthy environment, including improved drinking water safety

Chapter Four: Forecast Service Performance
Annual Plan 2011/12, 28 June 2011 Page 52
Early Detection and Management Services
Output Class: Early Detection & Management Services Output: Population Based Screening Programmes
We will undertake these initiatives/activities
And deliver these outputs
Outputs measured by That will lead to these impacts
Impacts measured by To achieve these outcomes
Fund independent smear takers
Provide clinics for priority women
Maintain cervical screening register
Undertake regional coordination of Regional Cervical Screening Programme
Implement health promotion initiatives
Improve attendance rates for those referred for colposcopy
National Cervical Screening Programme
Gynaecology - Colposcopy services
Average number of first event screenings, per month
Baseline 2009
By 30.6.2012
112 >110
Number of Colposcopy procedures
Baseline Feb 2011
By 30.6.12
839 1,900
Reduced incidence of new cases for cervical cancer
Cervical screening 3 year coverage rate, for women aged 20 – 69 years
Baseline Mar 2009
By 30.6.2012
72.2% 75%
Contributing to the health and disability sector outcome “New Zealanders living longer, healthier and more independent lives” and the primary intermediate outcome of “good health and independence are protected and promoted”
Increased likelihood of survival for breast and cervical cancer
Focused recruitment and retention of priority women across the region(Maori and Pacific)
Maintain 2 yearly rescreen profile
Regional Breast screening programme across 5 DHBs, including mobile clinics
Number of eligible women, aged 45-69 years, screened (around 8,400 per annum) in MidCentral region
Baseline 2009
By 30.6.2012
15,396 16,990
(over 2 years)
Earlier detection of breast cancer
Breast screening 2 year coverage rate, for women aged 45 – 69 years
Baseline 2009
By 30.6.2012
72.2% 70%

Chapter Four: Forecast Service Performance
Annual Plan 2011/12, 28 June 2011 Page 53
Output Class: Early Detection and Management Services Output: Primary Health Care
We will undertake these initiatives/activities
And deliver these outputs
Outputs measured by That will lead to these impacts
Impacts measured by To achieve these outcomes
Fund Primary Health Organisation to deliver general practice services throughout the district
Implementation of Better Sooner, More Convenient Primary Health care Business Case
General practice services
GP consultations
CarePlus (national programme for management of chronic conditions))
Nurse consultations
Number of MidCentral people enrolled with Central Primary Health Organisation (PHO)
Baseline 1.1.10
By 30.6.2012
150,993 153,000 (Source: PHO Performance Monitoring Report –PHOPMR)
Better self-management of health and wellbeing
Early diagnosis and intervention
Improved access to primary health care services
96.3% of population enrolled with Central PHO (Baseline PHOPMR 30.6.10 95.2%)
GP consultation rates for high needs population >1. (Baseline DHBNZ Perf Mgmt Prog 30.6.10 1.08)
Ambulatory sensitive (avoidable) hospital admissions:
Baseline 12mths to 30.9.10
By 30.6.2012
0-74 Years Maori: 81% <95% Other: 105% <103% 0-4 Years Maori: 82% <95% Other: 98% <96% 45-65 Years Maori: 75% <95% Other: 103% <101%
Shared roster areas are equal to or better than GP:population ratio of 1:2,000 as at end June 2012:
Baseline 30.6.09 Tararua 1:1,959 Horowhenua 1:1,659 Otaki 1:1,259 Manawatu/ Palm North
1:1,549
Contributing to the health and disability sector outcome “New Zealanders living longer, healthier and more independent lives” and the primary intermediate outcome of “good health and independence are protected and promoted”
Services provided closer to home
People enjoy healthy lifestyles within healthy environment

Chapter Four: Forecast Service Performance
Annual Plan 2011/12, 28 June 2011 Page 54
Funding PHO and NGOs to deliver chronic care management programme
Diabetes Cardiovascular disease Respiratory disease Cancer
Chronic care services provided through general practice, hospital, outreach, school and other community settings, including:
chronic care nurses nutrition/dietary fitness assessments podiatry retinal screening ECGs
Number of people with diabetes accessing free annual checks
Baseline 2009/10
By 30.6.2012
4,633 5,401
Number of people accessing five-yearly CVD risk assessments
Baseline 2009/10
By 30.6.2012
11,060 11,613
Number of chronic care team consultations
Baseline 2009/10
By 30.6.2012
28,256 29,668
(Source: PHO Performance Monitoring Report –PHOPMR)
Better self management of chronic conditions
Decreased number of people with chronic conditions progressing to more acute phase of disease
Diabetics receiving annual free checks who have good blood sugar management (HBA1c levels = <8.0%), Baseline 2009/10 in ()
Maori - 75.1% (60.7%) Other - 81.2% (77.7%) Total – 80.1% (74.7)
Proportion of people with diabetes accessing free annual checks. Baseline 2009/10 in ().
Maori – 78.1% (62.7) Other – 78.1% (68%) Total – 78% (66.9%)
5% increase in CVD risk assessments undertaken by 30.6.12 (Baseline 2009/10 11,060)
5% increase in community cardiology assessments by 30.6.12. (Baseline 2009/10 28,256)
Contributing to the health and disability sector outcome “New Zealanders living longer, healthier and more independent lives” and the primary intermediate outcome of “good health and independence are protected and promoted”
Services provided closer to home
People adopt healthy habits and lifestyles
Quality of life for people with chronic conditions if enhanced
Amelioration of disease symptoms and/or delay in their onset
Reduced incidence and prevalence of heart disease
For curable cancers, increased likelihood of survival
For incurable cancers, reduced severity of disease symptoms

Chapter Four: Forecast Service Performance
Annual Plan 2011/12, 28 June 2011 Page 55
Output Class: Early Detection and Management Services Output: Oral Health Services
We will undertake these initiatives/activities
And deliver these outputs
Outputs measured by That will lead to these impacts
Impacts measured by To achieve these outcomes
Fund MidCentral Health and community dentists to deliver child & adolescent oral health services
Oral health services (assessment and treatment) for children and adolescents
Utilisation of adolescents accessing DHB-funded oral health services
Baseline 2009
By 30.6.2012
8,803 9,180
Enrolment rates for under five year old children:
Baseline 2010
By 30.6.2012
4,021 5,000
Examination Rates: Number of children 0-12 years overdue for oral health assessment
Baseline 2010
By 30.6.2012
1,676 1,500
Reduced number of caries, decayed, missing and filled teeth in children
Higher levels of good oral health in the population
Five-year olds who are caries free. Baseline 2010 in ().
Maori 44% (41%) Other 68% (67%) Total 60% (58%)
Average number of decayed, missing or filled teeth in Year 8s. Baseline 2010 in ()
Maori 1.80 (1.96) Other 1.40 (1.65) Total 1.45 (1.76)
Contributing to the health and disability sector outcome “New Zealanders living longer, healthier and more independent lives” and the primary intermediate outcome of “good health and independence are protected and promoted”
Oral health is improved
Healthier teeth & gums, and, better overall health

Chapter Four: Forecast Service Performance
Annual Plan 2011/12, 28 June 2011 Page 56
Output Class: Early Detection and Management Services Output: Community Pharmacy Services
We will undertake these initiatives/activities
And deliver these outputs
Outputs measured by That will lead to these impacts
Impacts measured by To achieve these outcomes
Funding community pharmacies to deliver pharmacy services
Dispensing services
Medicine Utilisation Reviews (MUR)
Community pharmaceutical expenditure
Baseline 2009/10
By 30.6.2012
$43.9m $46m
Number of medicine utilisation reviews completed
Baseline 2009
By 30.6.2012
New measure
990
Number of pharmacies accredited to provide MUR service by 30.6.12
Baseline Dec 10
By 30.6.2012
3 30
Preventing ill health
Better management of chronic conditions
Acute conditions treated in community
Improved self management of medicines
Reduced hospitalisations
Proportion of GP referred pharmaceutical expenditure to total population: <90% (Baseline: 2009/10 92.84%)
Reduction in the number of hospital service contacts for people receiving MUR. (Baseline n/a)
Contributing to the health and disability sector outcome “New Zealanders living longer, healthier and more independent lives” and the primary intermediate outcome of “good health and independence are protected and promoted”
Services provider closer to home
Better quality of health
Reduced hospital admissions
Improved chronic care management

Chapter Four: Forecast Service Performance
Annual Plan 2011/12, 28 June 2011 Page 57
Output Class: Early Detection and Management Services Output: Community Laboratory Services
We will undertake these initiatives/activities
And deliver these outputs
Outputs measured by That will lead to these impacts
Impacts measured by To achieve these outcomes
Fund laboratory providers to deliver community laboratory services
Community tests (microbiology, haematology, histology)
Community laboratory expenditure
Baseline 2009/10
By 30.6.2012
$9.7m $10.3m
Diagnosis and condition management in primary care
Primary care providers have tools to enable them to diagnose and manage health conditions
Central repository for test results accessible to primary and secondary care health professionals
Proportion of GP referred laboratory expenditure to total population: <81.8% (Baseline: 2009/10 81.8%)
Contributing to the health and disability sector outcome “New Zealanders living longer, healthier and more independent lives” and the primary intermediate outcome of “good health and independence are protected and promoted”
Services provided closer to home
Better quality of health
Reduced hospital admissions
Improved chronic care management
People‟s journey through health system is well managed and informed

Chapter Four: Forecast Service Performance
Annual Plan 2011/12, 28 June 2011 Page 58
Intensive Assessment & Treatment Services
Output Class: Intensive Assessment and Treatment Services Output: Emergency Services
We will undertake these initiatives/activities
And deliver these outputs
Outputs measured by That will lead to these impacts
Impacts measured by To achieve these outcomes
Better management of acute demand through implementation of the “Better Sooner More Convenient” Primary Health Care strategy
Implement Hospital Admission Prevention Services through District Nursing Service in conjunction with Central Primary Health Organisation (PHO)
Ensure each hospital service department has a plan in place to improve response times to patients in ED
Ensure timely access to in house diagnostic services for acute presentations
Improved pathways of care enabling appropriate earlier discharge of patients to release hospital capacity
Quality and timely access to emergency care at Palmerston North Hospital
Hospital Admission Prevention (HAP) Service (acute care & recovery at home)
Post Emergency Department Assessment and Liaison (PEDAL) service
Number of Emergency Department (level 5) attendances
Baseline 2009/10
By 30.6.2012
22,693 23,000
Number of Emergency Department (Level 5) admitted attendances
Baseline 2009/10
By 30.6.2012
15,683 14,920
Proportion of patients admitted, transferred from the Emergency Department within 6 hours, by service
Baseline 2009/10
By 30.6.2012
79.3% 95%
Number of HAP referrals that lead to recovery at home
Baseline By 30.6.2012
NA >150
Proportion of referrals to HAP Service with same day response
Baseline By 30.6.2012
NA 95%
People having shorter stays in hospital due to earlier intervention and availability of services in the community to support earlier discharge
Reduced “avoidable” Emergency Department presentations
Decreased “avoidable” hospital admissions
Enhanced access to intermediary care services
Improved hospital productivity
Rate per 1,000 population of individuals attending Emergency Department
Baseline 2009/10
By 30.6.2012
159 <155
Proportion of ED presentations seen within expected timeframes, by triage category 1 – 3
Baseline 2009/10
By 30.6.2012
T1 100% 100% T2 84.4% 80% T3 68.2% 75%
Proportion of HAP referred patients placed in home based recovery, without first contact being via the Emergency Department
Baseline By 30.6.2012
NA > 50%
Proportion of eligible HAP referred patients aged 65+ years admitted to hospital
Baseline 2009/10
By 30.6.2012
NA < 50%
Supports the health and disability sector outcome of “New Zealanders living longer, healthier and more independent lives” and the primary intermediate outcome of “people receive better health and disability services”
Also links to MidCentral‟s outcome of people having confidence in being able to access health and disability services when they need to and that those services are delivered to those most in need

Chapter Four: Forecast Service Performance
Annual Plan 2011/12, 28 June 2011 Page 59
Output Class: Intensive Assessment and Treatment Services Output: Acute Medical, Oncology, Surgical (including gynaecology) and Paediatric Services
We will undertake these initiatives/activities
And deliver these outputs
Outputs measured by That will lead to these impacts
Impacts measured by To achieve these outcomes
Implement Care Capacity Demand Management Project throughout MidCentral Health in conjunction with the Safe Staffing Healthy Workplaces Unit
Streamline assessment and planning processes to support appropriate early discharge
Optimise increased planning capability for radiation oncology service
Install 4th permanent linear accelerator
Specialist medical and surgical hospital inpatient services
Specialist paediatric hospital inpatient services
Specialist oncology services
Number of acute medical discharges (cost weighted discharges) – DHB of Service
Baseline 2009/10
By 30.6.2012
10,332 8,778
Number of acute surgical discharges (cost weighted discharges) – DHB of Service
Baseline 2009/10
By 30.6.2012
5,766 5,790
Number of paediatric medical discharges (cost weighted discharges – DHB of Service
Baseline 2009/10
By 30.6.2012
977 1,006
Number of oncology discharges (cost weighted discharges) – DHB of Service
Baseline 2009/10
By 30.6.2012
1,188 977
Reduced mortality and morbidity resulting from chronic illness
Acute inpatient average length of stay (days) - unstandardised
Baseline 2009/10
By 30.6.2012
4.48 4.15
Proportion of acute, unplanned readmissions to hospital within 28 days - unstandardised
Baseline 2009/10
By 30.6.2012
10.6% <10%
Proportion of patients starting radiation oncology treatment within 4 weeks of their first specialist assessment
Baseline 2009/10
By 30.6.2012
97%* 100% *Waiting time target was within 6 weeks
Supports the health and disability sector outcome of “New Zealanders living longer, healthier and more independent lives” and the primary intermediate outcome of “people receive better health and disability services”
People‟s journey through the health and disability system is well managed and informed
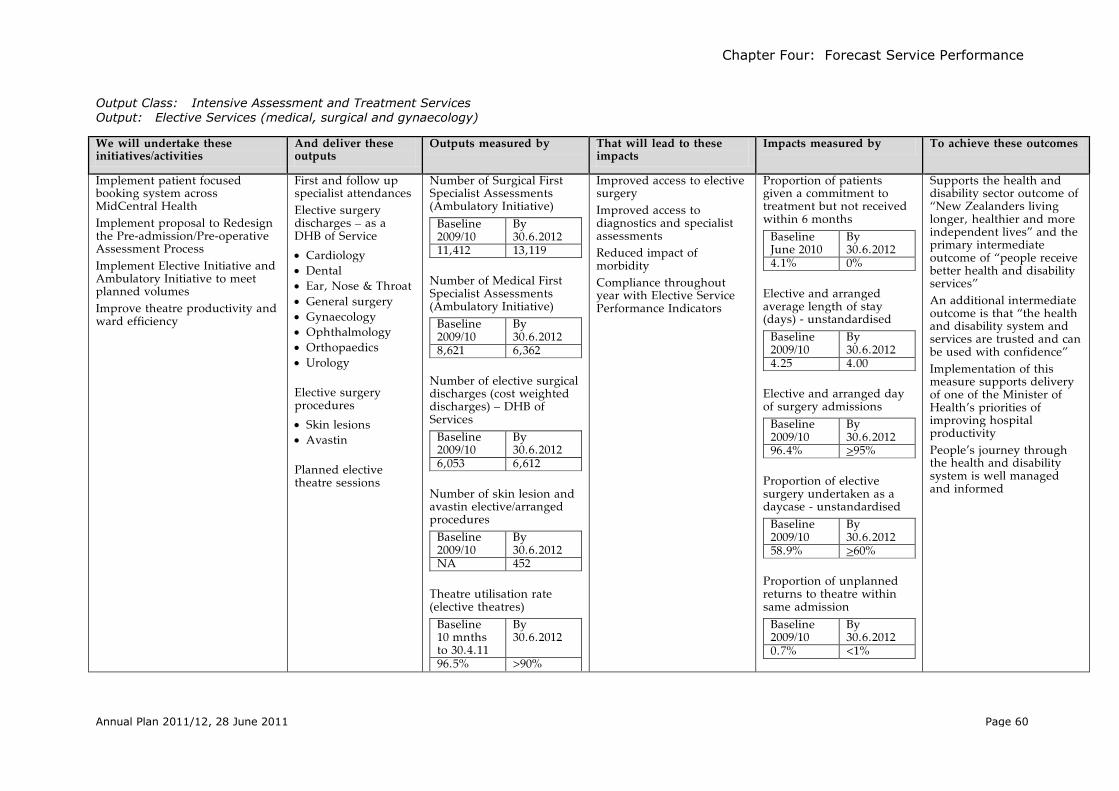
Chapter Four: Forecast Service Performance
Annual Plan 2011/12, 28 June 2011 Page 60
Output Class: Intensive Assessment and Treatment Services Output: Elective Services (medical, surgical and gynaecology)
We will undertake these initiatives/activities
And deliver these outputs
Outputs measured by That will lead to these impacts
Impacts measured by To achieve these outcomes
Implement patient focused booking system across MidCentral Health
Implement proposal to Redesign the Pre-admission/Pre-operative Assessment Process
Implement Elective Initiative and Ambulatory Initiative to meet planned volumes
Improve theatre productivity and ward efficiency
First and follow up specialist attendances
Elective surgery discharges – as a DHB of Service
Cardiology Dental Ear, Nose & Throat General surgery Gynaecology Ophthalmology Orthopaedics Urology
Elective surgery procedures
Skin lesions Avastin
Planned elective theatre sessions
Number of Surgical First Specialist Assessments (Ambulatory Initiative)
Baseline 2009/10
By 30.6.2012
11,412 13,119
Number of Medical First Specialist Assessments (Ambulatory Initiative)
Baseline 2009/10
By 30.6.2012
8,621 6,362
Number of elective surgical discharges (cost weighted discharges) – DHB of Services
Baseline 2009/10
By 30.6.2012
6,053 6,612
Number of skin lesion and avastin elective/arranged procedures
Baseline 2009/10
By 30.6.2012
NA 452
Theatre utilisation rate (elective theatres)
Baseline 10 mnths to 30.4.11
By 30.6.2012
96.5% >90%
Improved access to elective surgery
Improved access to diagnostics and specialist assessments
Reduced impact of morbidity
Compliance throughout year with Elective Service Performance Indicators
Proportion of patients given a commitment to treatment but not received within 6 months
Baseline June 2010
By 30.6.2012
4.1% 0%
Elective and arranged average length of stay (days) - unstandardised
Baseline 2009/10
By 30.6.2012
4.25 4.00
Elective and arranged day of surgery admissions
Baseline 2009/10
By 30.6.2012
96.4% >95%
Proportion of elective surgery undertaken as a daycase - unstandardised
Baseline 2009/10
By 30.6.2012
58.9% >60%
Proportion of unplanned returns to theatre within same admission
Baseline 2009/10
By 30.6.2012
0.7% <1%
Supports the health and disability sector outcome of “New Zealanders living longer, healthier and more independent lives” and the primary intermediate outcome of “people receive better health and disability services”
An additional intermediate outcome is that “the health and disability system and services are trusted and can be used with confidence”
Implementation of this measure supports delivery of one of the Minister of Health‟s priorities of improving hospital productivity
People‟s journey through the health and disability system is well managed and informed

Chapter Four: Forecast Service Performance
Annual Plan 2011/12, 28 June 2011 Page 61
Output Class: Intensive Assessment and Treatment Services Output: Hospital Maternity Services
We will undertake these initiatives/activities
And deliver these outputs
Outputs measured by That will lead to these impacts
Impacts measured by To achieve these outcomes
Fund primary and secondary hospital based maternity services
Support access to secondary facility for authorised lead maternity carers
Support women‟s appropriate postnatal length of stay
Support training and education of midwives
Non specialist antenatal consults
Non specialist postnatal consults
Obstetric consults
Maternity inpatient discharges
Level 2+ neonatal inpatient services
Number of non specialist antenatal consults
Baseline 2009/10
By 30.6.2012
409 480
Number of non specialist postnatal consults
Baseline 2009/10
By 30.6.2012
2058 2,364
Number of First Obstetric consults
Baseline 2009/10
By 30.6.2012
1152 1,092
Number of maternity inpatient discharges (cost weighted discharges)
Baseline 2009/10
By 30.6.2012
2041 1,878
Caesarean section rate (acute)
Baseline 2009
By 30.6.2012
20% <25%
Access to safe, effective birthing facilities
Reduced incidence of low birth weight babies
Rate of low birth weight babies per 1,000 live births (MDHB of service only)
Baseline 2009/10
By 30.6.2012
73.35 <64.4
Proportion of women rating their postnatal stay as “just right”
Baseline 2009/10
By 30.6.2012
95% >95%
Supports the health and disability sector outcome of “New Zealanders living longer, healthier and more independent lives” and the primary intermediate outcome of “people receive better health and disability services”
An additional intermediate outcome is that “the health and disability system and services are trusted and can be used with confidence”

Chapter Four: Forecast Service Performance
Annual Plan 2011/12, 28 June 2011 Page 62
Output Class: Intensive Assessment & Treatment Services Output: Mental Health
We will undertake these initiatives/activities
And deliver these outputs
Outputs measured by That will lead to these impacts
Impacts measured by To achieve these outcomes
Provide acute mental health services
Inpatient mental health services
Emergency mental health services
Community mental health services
Child, adolescent & family mental health services
Alcohol & drug services
Number of available bed days for acute mental health
Baseline 2010/11 PVS
By 30.6.2012
6,770 6,570
Number of available bed days for intensive psychiatric inpatient care
Baseline 2010/11 PVS
By 30.6.2012
1,400 2,109
Number of ftes purchased to provide mental health & addictions services (non programme based)
Baseline 2009/10
By 30.6.2012
131.2 131.5 PVS= price volume schedule
Timely access for people with an mental illness requiring acute care
Reduced relapse rates through use of relapse prevention planning
% of people domiciled in the DHB region, seen per year (average). Baseline 12 months ended Sep 2010 in ():
0-19 yrs total: 2.84% (2.67%)
20-64 years total 3.50% (3.44%)
65+ total: >0.5% (0.52%)
% of long term clients (in contact for 2 yrs or more) with up to date relapse prevention/treatment plans (Maori and Non-Maori). Baseline 12 months ended Sep 2010 in ():
Adult (20+): 95% (93%) Child & Youth: 95%
(89%)
Contributing to the health and disability sector outcome “New Zealanders living longer, healthier and more independent lives” and the primary intermediate outcome of “good health and independence are protected and promoted”
People experiencing mental illness receive care which maximises independence & wellbeing
The risk of harm to those with mental health and addiction issues and others is minimised

Chapter Four: Forecast Service Performance
Annual Plan 2011/12, 28 June 2011 Page 63
Output Class: Intensive Assessment & Treatment Services Output: Assessment, Treatment & Rehabilitation Services
We will undertake these initiatives/activities
And deliver these outputs
Outputs measured by That will lead to these impacts
Impacts measured by To achieve these outcomes
Provide assessment, treatment and rehabilitation services
Inpatient AT&R beds
First specialist AT&R assessments
Follow-up AT&R assessments
Therapy services
Number of AT&R (elder health, 65+ yrs) and rural inpatient beddays
Baseline 2009/10
By 30.6.2012
13,090 12,916 Number of AT&R beddays (DSS rehab AT&R, <65 yrs)
Baseline 2009/10
By 30.6.2012
3,013 2,305 Number of AT&R out-patient clinic attendances (elder health, 65+ yrs)
Baseline 2009/10
By 30.6.2012
4,701 4,554 Number of AT&R out-patient clinic attendances (DSS rehab AT&R, <65 yrs)
Baseline 2009/10
By 30.6.2012
2,045 2,008 Number of occupational therapy contacts
Baseline 2009/10
By 30.6.2012
2,554 2.535 Number of physiotherapy contacts
Baseline 2009/10
By 30.6.2012
12.105 11,500
People supported to achieve maximum functional independence
Average length of stay (elder health AT&R, 65+ yrs).
Baseline 2009/10
By 30.6.2012
18.3 days <17 days
Average length of stay (DSS rehab AT&R, <65 yrs)
Baseline 2009/10
By 30.6.2012
23.0 days <21 days
Contributing to the health and disability sector outcome “New Zealanders living longer, healthier and more independent lives” and the primary intermediate outcome of “good health and independence are protected and promoted”
People enjoy maximum independence
People able to live and participate in community

Chapter Four: Forecast Service Performance
Annual Plan 2011/12, 28 June 2011 Page 64
Rehabilitation and Support Services
Output Class: Rehabilitation and Support Services Output: Services for Older People – Residential Care
We will undertake these initiatives/activities
And deliver these outputs
Outputs measured by That will lead to these impacts
Impacts measured by To achieve these outcomes
Fund a range of rest homes to deliver aged residential care services
Aged residential care services, including rest home, hospital level, dementia, respite care, and psycho-geriatric care
Number of contracted providers offering aged residential care services
Baseline 2009/10
By 30.6.2012
37 37
People supported to maintain functional independence as appropriate
Quality and safe residential care
Reduced level of admissions to Emergency Department for rest home residents
Carers supported through respite care
Number of hospital admissions from rest homes via Emergency Department that could have been circumvented
Baseline 2009/10
By 30.6.2012
106 <100
<5% of aged residential care facilities in MidCentral DHB‟s district are subject to a special (issues-based) audit. (Baseline: 2009/10 – 16%)
Contributing to the health and disability sector outcome “New Zealanders living longer, healthier and more independent lives”
Older people requiring disability support or care receive services appropriate to their needs
People have choice of aged residential care provider
Needs of older population are addressed

Chapter Four: Forecast Service Performance
Annual Plan 2011/12, 28 June 2011 Page 65
Output Class: Rehabilitation and Support Services Output: Services for Older People – Home Based Support & Assessment Services
We will undertake these initiatives/activities
And deliver these outputs
Outputs measured by That will lead to these impacts
Impacts measured by To achieve these outcomes
Fund Supportlinks and integrated family health centres (IFHC) to provide needs assessments and service co-ordination for people over 65
Community based needs assessments delivered through IFHCs.
Needs assessment and service co-ordination delivered through Supportlinks
Number of referrals for people aged 65+ to needs assessments and service co-ordination services:
Baseline 2009/10
By 30.6.2012
3,028 >3,000
Assessments being provided closer to home
People supported to maintain functional independence
Closer integration of personal health and disability support services for older people, ensuring the person‟s GP remains the key provider.
Proportion of MDHB‟s population aged 75 years and older who are hospitalised for falls
Baseline 2009/10
By 30.6.2012
7.5% <7.5%
Proportion of clients whose date of first contact with NASC services is within specified times following referral:
a. Urgent within 5 days
Baseline 2009/10
By 30.6.2012
43% 100%
b. Non-urgent within 30 days
Baseline 2009/10
By 30.6.2012
87% >80%
Contributing to the health and disability sector outcome “New Zealanders living longer, healthier and more independent lives”
Older people requiring disability support or care receive services appropriate to their needs
Services provided closer to home
Needs of older population are addressed
Older people‟s journey through the continuum of care is well managed and informed.

Chapter Four: Forecast Service Performance
Annual Plan 2011/12, 28 June 2011 Page 66
Output Class: Rehabilitation and Support Services Output: Palliative Care
We will undertake these initiatives/activities
And deliver these outputs
Outputs measured by That will lead to these impacts
Impacts measured by To achieve these outcomes
Fund a range of providers to provide palliative care services
Liverpool care of the dying pathway
Hospice services
Primary palliative care partnership
Palliative care clinical pharmacy
Palliative liaison
Palliative care education
Number of palliative care community services (clients):
Baseline 2009/10
By 30.6.2012
510 460
Liverpool Care Pathways used in all palliative care situations by contracted providers of hospital continuing care.
GP continues to be the main provider of medical and other care for palliative care patients.
Number of facilities within the district where Liverpool Care of the Dying Pathway has been implemented:
Baseline Jan 11
By 30.6.2012
33 >33
Contributing to the health and disability sector outcome “New Zealanders living longer, healthier and more independent lives”
Services provided closer to home
People‟s journey through the continuum of care is well managed and informed.
People on a palliative care pathway receive timely & appropriate care and support.

Chapter Four: Forecast Service Performance
Annual Plan 2011/12, 28 June 2011 Page 67
Output Class: Rehabilitation and Support Services Output: Housing and Equipment Modification Services
We will undertake these initiatives/activities
And deliver these outputs
Outputs measured by That will lead to these impacts
Impacts measured by To achieve these outcomes
Administer housing modification funds on behalf of ACC throughout New Zealand
Supply, clean and distribute short and long term loan equipment services throughout New Zealand on behalf of ACC and Ministry of Health
Manage spectacle subsidy for children and hearing aid subsidy on behalf of Ministry of Health
Management of WEKA website
Equipment management service
Housing modification service
Fund management for Ministry of Health & ACC
Processing of hearing aid subsidies
Processing of spectacle subsidy for children
Maintenance of WEKA website
Equipment management applications received:
Baseline 2009/10
By 30.6.2012*
ACC 11,000
ACC 12,949
MoH 50,270
MoH 47,538
Hearing applications received:
Baseline 2009/10
By 30.6.2012*
12,895 14,500
Spectacle subsidy applications received:
Baseline 2009/10
By 30.6.2012*
27,230 30,500
ACC Housing modification referrals received:
Baseline YTD Dec 2010
By 30.6.2012*
461 700
Visitors to WEKA website:
Baseline 2009/10
By 30.6.2012
52,309 >52,300 *Subject to contractual arrangements, including eligibility criteria, remaining the same.
Increased capacity for people with a disability to live independently
Streamlined, cost effective equipment service, through procurement & supply arrangements
Processing times for Ministry of Health common list equipment referrals: within 3 days:
Baseline 2009/10
By 30.6.2012
90% 95% Processing times for ACC urgent referrals: within 1 day:
Baseline 2009/10
By 30.6.2012
90%* 95% *ACC contract requirement Savings delivered to ACC & MoH through management of housing & equipment contracts:
Baseline YTD Dec 2010
By 30.6.2012
$103,000 >$200,000 Level of equipment re-issues:
Baseline 2009/10
By 30.6.2012
MoH 36% 38% ACC 28% 30%
Net dollar savings from equipment re-issues:
Baseline 2009/10
By 30.6.2012
MoH $11m $12.5m ACC $1.6m $1.8m
Contributing to the health and disability sector outcome “New Zealanders living longer, healthier and more independent lives”
Services provided closer to home
People‟s journey through the continuum of care is well managed and informed.
Value for money

Chapter Five: Stewardship
Annual Plan 2011/12, 28 June 2011 Page 68
Chapter Five: Stewardship
5.1 Stewardship
Funder Interests
The DHB‟s planning and funding role is responsible for planning, promoting and undertaking service contracting with organisations including our own hospital services (Horowhenua Health Centre and Palmerston North Hospital). Our DHB also contracts services from other providers, including other DHBs who often provide more specialist services. Some services are funded and contracted directly by the Ministry, for example breast and cervical screening as well as the provision of disability support services for people aged less than 65 years. Our DHB is responsible for monitoring and evaluating service delivery, and includes auditing the full range of funded services.
In purchasing services and contracting with service providers, the Funder is guided by Provider Selection Protocols that set out requirements for the process of choosing a provider and facilities for publicly funded services. These are outlined in the Operational Policy Framework (2011/12).
The main categories of providers are:
Primary health organisations
Pharmacies
Optometrists
Laboratory services
Dentists
Non-government organisations
Aged residential care providers
Maori health providers
Public hospitals
MidCentral DHB uses the Nationwide Service Framework to ensure consistency and clarity of what services are funded or provided. The Nationwide Service Framework has a number of mandatory components, which are also detailed in the Operational Policy Framework (2011/12).
MidCentral DHB‟s planning process aims to achieve maximum health gain for every health dollar spent. Investment is made across the continuum of health and wellbeing so the incidence of chronic disease will reduce long-term; people with a chronic condition are managed so that the impact of the disease is minimised; those requiring treatment can access this in a timely manner; and ongoing research and evaluation is undertaken to see where further investment is required.
The District Health Board uses a prioritisation framework to assess whether the contribution a proposed service would make to health and independence and its affordability. The Funding Division evaluates all proposed funding allocations and contract renewals against the prioritisation framework. Information from the prioritisation process is included in the purchasing recommendation the Funding Division makes to the Board.
The prioritisation framework is reviewed annually and incorporates input from the Health Needs Assessment which has identified a number of issues within the district, particularly the presence of health disparities such as the poorer health status of the Horowhenua community.
All MidCentral DHB contracts require providers to regularly report on their activities. All providers have a nominated Portfolio Manager within the DHB, and these people keep in regular contact with providers.
In addition to routine contact monitoring, MidCentral DHB has a formal audit programme which is managed by the Central Region‟s Technical Advisory Service using a team of auditors who are qualified to carry out service-based, financial or cultural audits. Audits are of two types:

Chapter Five: Stewardship
Annual Plan 2011/12, 28 June 2011 Page 69
routine audits which are expected to occur at least every three years, and special and issue based audits which occur at the request of the DHB, usually in response to an emerging issue. (NB: for aged residential care facilities, routine audits are commissioned by the MoH/DHB programme using designated audit agencies.)
Provider Interests
MidCentral Health – the DHB‟s provider arm – comprises a range of hospital and associated services provided from Palmerston North Hospital and Horowhenua Health Centre (Levin), and outpatient and community services based in Dannevirke, Pahiatua, Feilding, Otaki, Levin and Palmerston North. MidCentral Health is principally funded by the Ministry of Health (via the DHB‟s Funder) and by ACC, based on contracts for service arrangements.
Hospital and community based services include:
Specialist medical and surgical services (including ICU and CCU)
Operating theatre and anaesthetic services
Regional Cancer Treatment Services
Assessment, Treatment and Rehabilitation services
Medical rehabilitation and therapy services
Maternity services
Paediatric medicine and community paediatric services
Emergency department
Radiology and nuclear medicine services (including computerised tomography)
Public health services
Pharmacy services
Specialist and district nursing and allied health services
Mental Health and Addiction services
Hospital, School Dental and Adolescent oral health services
MidCentral Health provides a number of services on a regional basis. These include the regional cancer treatment services, haematology services, breast screening services and public health services.
MidCentral Health contracts out a number of support services such as laboratory services, nutrition and food services (including diatetics), laundry, cleaning, orderly services, vehicle fleet management, facilities management and building and engineering services.
Enable New Zealand is a national provider of disability support and information services. Its funding is received based on contracts with the Ministry of Health and ACC. Enable New Zealand provides housing modification and rehabilitation equipment services, disability services information, manages the hearing aid and children‟s spectacles‟ subsidies on a national basis and the needs assessment and support coordination services for MidCentral district.
Organisational Health
The provision of effective health care across the MidCentral district depends, inter alia, on an appropriately skilled workforce of the right size and in the right place. MidCentral DHB‟s workforce development plan enables it to meet current workforce requirements, while planning ahead for the future.
MidCentral DHB takes it role as a good employer seriously and has a comprehensive range of human resource policies are in place. These are underpinned by a commitment to Equal Employment Opportunities, and ensure:
fair and transparent recruitment and retention of staff to meet current and future needs;
zero-tolerance of all forms of harassment and bullying;
equitable training and development opportunities for all employees, including professional development
safe and healthy work environment
management and disclosure of any serious wrongdoing
The DHB is a member of the ACC Partnership Programme and has been accorded tertiary status – the highest level possible.

Chapter Five: Stewardship
Annual Plan 2011/12, 28 June 2011 Page 70
Our Workforce
Over 2,100 staff (full time equivalents) are employed by MidCentral DHB. Where ethnicity is state, 58% are NZ European, 5.7% are Maori, 0.9% are Pacific Island people, and 16.5% are from other ethnic groups. The majority of staff employed are health professionals as can be seen from the table below. On a headcount basis, MidCentral DHB employs over 2,500 people.
MDHB 2010/11 2011/12
Forecast Budget
Medical 264 283
Nursing & Midwifery 921 919
Allied Health 368 375
Support 44 43
Mgmt/Admin 504 505
TOTAL 2,101 2,125 The majority of staff are employed on multi-employer collective agreements which cover all DHBs, ensuring relativity across the sector. Around 6% of staff are employed on individual employment contracts.
Organisational health is closely monitored. Within the DHB‟s provider arm, MidCentral Health enjoys a relatively stable staffing capability. Thee turnover rate averages approximately 9% per year, and staff stability averages over 99%.
Staff Group Staff Turnover 09/10 Staff Stability 09/10
Medical* 6.02% 99.5%
Nursing & Midwifery 9.69% 99.2%
Allied Health 9.04% 99.34%
Support 10.34% 97.99%
Management/Administration 10.27% 99.04%
Total 9.4% 99.24%
*Excludes junior medical staff. Their national training programmes requires them to move between DHBs to complete their curriculum. Note: Staff stability shows the percentage of staff who have remained with the organisation for over two years since commencement of employment. Excludes casual and temporary staff
MidCentral DHB continues to enhance its internal education and
development programme. This programme, which offers over 850 education sessions a year, covers all professional groups is well used. Each year, total attendances are around 4,000.
A key feature of MidCentral DHB‟s workforce strategy and initiatives is clinical leadership and this continues to be enhanced.
Clinical Leadership
Within MidCentral Health a clinical:management partnership exists, with each major service line being led by a Clinical Director, Operations Director, Director of Nursing, Allied Health Director and Midwifery Director as appropriate to the line. For most specialities within a service line, there is a Medical Head. MidCentral DHB has a strong professional nursing structure. A professional advisory function is in place for medicine, nursing, allied health, and clerical. This includes professional advisor roles and reference groups. Clinical governance within MidCentral Health is led by its Clinical Board.
On a district-wide basis, two key mechanisms have been established to ensure clinical involvement in decision making. One is a Clinical Council for the DHB which covers both primary and secondary health professionals, a lay person, and a Maori representative. A series of clinical networks are being developed, comprising representatives from primary and secondary care, consumers, and providers. These input into service planning and monitoring.
Regionally, clinical networks continue to be established, and, regional planning has strong clinical input through a Leadership Group.
Building Capability
Workforce planning takes a strong future focus. The New Zealand health sector faces significant changes and challenges, with an ageing population, ageing workforce, and rising costs of health care. New models of health care are required.
This work has strong national leadership through Health Workforce New Zealand and the collaborative initiatives between the 20 DHBs. MidCentral DHB will continue to participate fully in this work.
It will also continue to develop, promote and implement regional workforce planning. This is closely aligned to service planning and seeks to ensure sustainability across the region.

Chapter Five: Stewardship
Annual Plan 2011/12, 28 June 2011 Page 71
On a sub-regional basis, MidCentral DHB continues to work closely with Whanganui DHB to support shared service arrangements. Several joint positions have been established, including Regional Manager, Human Resource & Organisational Development. All aspects of HR services are moving to a sub-regional basis.
Locally, MidCentral DHB promotes innovation and new models of care.
Over the past six years, it has invested significantly in the primary health sector, increasing staffing levels by over 40 ftes. These positions are generally in priority disease state areas, such as diabetes, cancer, cardiology and respiratory. Its primary health care development team works with primary care, particularly nurses, to increase the capability of the primary sector workforce. This initiative supports the DHB‟s commitment to providing services “closer to home” wherever possible.
A Transformational Leadership Programme is in place for both primary and secondary care clinical and management staff.
New roles continue to be explored and MidCentral DHB has supported Nurse Practitioners to develop and provide a range of nurse-led services, such as respiratory, pain management, and diabetes. The first nurse-led general practice service became operational in 2010 under the auspices of the Central Primary Health Organisation.
MidCentral DHB has developed a strong partnership with Otago School of Medicine. Through this, it offers trainee interns a full 12 month rotation based at Palmerston North Hospital, including experience within general practice. As another means of increasing capability of local health services, MidCentral DHB has invested and supported computer-based systems which enable primary care practitioners to undertake cardiovascular needs assessments and transient ischaemic attacks (mini strokes).
Innovation within the district is fostered. MidCentral DHB‟s Health Awards showcase these, and promote greatness, success, and unparalleled achievement. Local innovations, such as an on-line warfarin monitoring software system are being used nationally.
Infrastructure and Information Systems
The district‟s public health, primary and secondary care services are supported by a robust infrastructure, including information technology, buildings and equipment. During 2010/11 MDHB‟s capital expenditure
plan was reviewed to enable stronger alliance to future investment planning.
MDHB‟s local infrastructure and IT plans are closely aligned to the Regional Services Plan.
The DHB‟s building stock is in good repair. The main facility, Palmerston North Hospital, is scheduled for reconfiguration over the next three years so that it can meet further growth. The DHB developed a Clinical Services Plan for its hospital services in 2007 which looked at what need to be done to future-proof services in terms of service models, workforce, IT, and building infrastructure.. The first three components are being progressively advanced, particularly through regional work. Financial restrictions limited the DHB‟s ability to advance this component of the Plan and it will now be reviewed to determine what physical changes are required at Palmerston North Hospital to meet both local and regional requirements. This site redevelopment work could have a potential investment of $50m and the DHB anticipates being in a position to free-cash flow this capital investment. Project management work will get underway in 2011/12. The project should be completed, and the financial impact occurring from out year 4 onward.
The DHB has an Assets Register, together with capital and maintenance programmes. This ensures assets are maintained, replaced and/or disposed of in a timely manner. Asset planning is aligned to local and regional planning and supports service delivery. The disposal of surplus assets is managed in accordance with MDHB‟s Capital Policy, the National Operating Policy Framework and appropriate other legislation. Disposal of land is done within the Government‟s land disposal process.”
The Central Regional Information System Plan (CRISP) sets out the blueprint for IT development within the region, with a view to achieving its vision of “One Portal, One Password, One Patient Record through a Regional Information Systems platform that will meet the clinical and administrative needs of health sector providers in the region”. For MidCentral DHB, the implementation of Concerto, a clinical work station, is the major IT initiative in 2011/12, followed by replacement of its patient management information system.
MDHB has invested significantly in IT. This investment has included the primary sector, with funding provided for disease-state decision

Chapter Five: Stewardship
Annual Plan 2011/12, 28 June 2011 Page 72
software. Funding has also been provided for general practices to look at the feasibility of larger, collective primary care practices.
Quality and Safety
MidCentral DHB‟s quality plan is closely aligned to the national Health Safety & Quality Commission‟s priorities. MidCentral DHB has, or is in the process of implementing, the following programmes: incident management system, hand hygiene, care capacity demand programme, releasing time to care, patient focused booking system, and national medications chart. Falls injury prevention and further work around medications is scheduled for 2011/12.
MidCentral DHB participates in the NZ health accreditation programme. This is an independent review of the DHB‟s systems and processes. In addition, it is reviewed by the Ministry of Health to ensure compliance (certification) under the Health & Disability Sector (Safety) Act 2000.
The National Service Framework provides nationally consistent service specifications, quality specifications, purchase units (including purchase unit definitions) and prices. It aligns with the Service Coverage Schedule and Operational Policy Framework documents, which, together, define the baseline services which District Health Boards must make sure are available to their populations. All District Health Boards use the National Service Framework, and it is maintained through the collaborative efforts of the Ministry of Health, District Health Boards‟ New Zealand, and the District Health Boards.
MidCentral District Health Board is committed to participating in the development and maintenance of the National Service Framework and using it to structure the services the District Health Board funds. Providers will be contracted under the National Service Framework wherever there are suitable service specifications and purchase units. All providers are expected to comply with the quality specifications in the Operational Policy Framework.
Many primary health care providers are paid under regulatory arrangements based on national frameworks. These are typically fee for service arrangements. The DHB monitors service performance in these areas through statistical reports, many of which are produced by Central Region‟s Technical Advisory Service (TAS), on behalf of MidCentral DHB. The performance of DHB-owned providers (such as MidCentral Health) is monitored through an internal reporting framework.
Reporting to, and Consultation with, Minister of Health
MidCentral DHB has an obligation to report to the Minister of Health and Director-General of Health, encompassing national health information management and reporting requirements, national collections requirements and requirements relating to ACC and the Mental Health Commission (as specified in the Operational Policy Framework effective from 1 July 2011 and the DHB Monitoring Framework & Reporting Measures 2011/12).
The DHB is required to seek the Minister of Health‟s approval regarding proposed disposal of property. At the time of writing this annual plan, MidCentral DHB expected to be consulting the Minister in 2010/11 regarding the sale and/or lease of surplus land, Clevely Centre. (NB: Clevely Centre‟s future is dependent upon the outcome of a primary care initiative.)
Risk Assessment
MidCentral DHB continuously identifies its risks – both current and emerging – and implements strategies to minimise those risks. Some risks can be completely mitigated (ie controlled) and some are more difficult to mitigate. Many of the risks in the more difficult mitigation category are imposed from an external source, eg national wage settlements. As part of the 2010/11 planning process, the Board has identified the high level risks associated with implementing this Plan and/or likely to be faced during the planning period (three years to 30 June 2013).
Risk 1: Failure to embed a sustainable surplus
Assessed Risk Level: Major
Description of Risk The economic situation has reduced funding for new Government services. Increases for Health (funding for cost growth) will be modest.
DHBs face increased demand, increased supply costs and wage claims in excess of the funding for cost growth allowance.
MidCentral DHB achieved significant financial turnaround in 2010/11. Ongoing work is required to maintain this situation.
Mitigations
Financial Recovery Programme implemented and being maintained. Delegations policy is place.
National procurement and workforce/employee relations strategies in place.

Chapter Five: Stewardship
Annual Plan 2011/12, 28 June 2011 Page 73
Regional services plan in place, introducing new, regionally-based models of care and clinical networks.
Clinical involvement in decision making. Ongoing participation in benchmarking activities. National pricing used, The centralAlliance between MidCentral and Whanganui DHBs will assist in
sharing back-office and support functions. Provision made for risk areas within budget.
Risk 2: MidCentral DHB is unable to maintain the rate of change required
Assessed Risk Rating: Major
Description of Risk There is currently a mis-match between the rate and level of change, and, the ability to undertake change. The health sector is implementing change in line with the Ministerial Review Group‟s report.
The move to regionalisation and other long term solutions requires significant resource and attention. Regionalisation will take time to achieve to ensure sustainable structures are put in place, and that key risks such as a significant reduction in access, are offset. It will also have a cost implication.
Concurrently, the level of change required to enhance business as usual activities (such as financial recovery, quality improvement, and workforce) is increasing. There is a need to address short term issues within hospital services in line with the Government‟s priorities.
Implementation of the “better, sooner, more convenient primary health care business case” requires significant change, not only in terms of the how the services are delivered in primary health (models of care), but the level of services provided. Some services traditionally provided in a hospital setting will transfer to the community. There will be a higher level of collaboration between the primary and secondary care sectors.
The ability of the district, including MDHB, to increase resources to manage the level of change will be tested.
Mitigations
MidCentral DHB employs a project management approach. Regional workload is shared amongst DHBs. Close working relationships with the Ministry of Health, National Health Board,
National IT Board and other stakeholders. A strong network-based implementation structure, with clinical leadership, has
been established to oversee the primary health care business case. National change management processes agreed and in place.
Risk 3: MidCentral Health is unable to maintain elective service volumes in line with foreseeable expectations
Assessed Risk Rating: Major
Description of Risk MidCentral Health, the DHB‟s provider arm, traditionally experienced difficulty in providing the level of elective services required. This situation was turned around in 2009/10, with all elective services being provided in-house. In 2011/12 the DHB is on track to deliver all elective CWD targets.
MidCentral DHB aims to continue to increase the level of elective services provided. There is risk that it will be unable to deliver these in-house due to industrial action, a major staffing shortfall, or pandemic.
The level of cardiology service volumes within MidCentral DHB‟s area is low in comparison to other DHBs. However, health outcomes in this area (as measured by cardiac mortality rates) are in line with the New Zealand average. There is a risk that MDHB‟s intervention rates for cardiology are less than optimum.
Mitigations
Robust elective service process, with a dedicated manager. Referral acceptance levels are kept under regular review. Regular monitoring and review of waiting lists and times.
Elective services plan in place which has the support of clinical staff. Medical Heads sign-off on proposed volumes.
Regional elective service planning. The centralAlliance enables sub-regional elective service planning and delivery. Medical Assessment Unit in place to assist in managing acute demand. PHO‟s “Better, Sooner, More Convenient Primary Health Care” business case
has focus on better management acute demand and reduced avoidable hospitalisations.
Regular monitoring and review of elective service performance at both management and governance levels.
Investment in cardiology services to increase capacity.

Chapter Five: Stewardship
Annual Plan 2011/12, 28 June 2011 Page 74
Risk 4: A shortage of General Practitioners (GPs) impacts on Community and Secondary Services
Assessed Risk Level: Major
Description of Risk The district‟s General Practitioner workforce is operating below optimum levels.
The failure of primary care services will impact severely on patients and will also place a greater reliance on hospital services, including the Emergency Department.
Mitigations
Transformational clinical leadership development programme. Integrated knowledge and skills framework and programmes for primary health
workers. GPs supported to develop Family Health Care Centres. These larger practices
enable expertise, staff and costs to be shared. Nurse-led general practice supported. MidCentral DHB has funded the establishment of chronic care teams and
specialist nursing positions, reducing the reliance/burden on GPs. GP training and support packages available together with a GP trainee
placement scheme. Where services are transferred from the secondary to primary sector, training is provided.
Practice managers supported to undertake professional development. The trainee intern programme managed through Palmerston North Hospital
includes a GP placement. General practices encouraged to achieve cornerstone accreditation. After-hours arrangement for GPs co-ordinated through Healthline. Infrastructural support provided to general practice, including clinical decision-
making software, and clinical leadership.
Risk 5: An ageing population
Assessed Risk Level: Major
Description of Risk MidCentral DHB‟s population is ageing, increasing the demand on health services. Elderly people generally present with higher complexity as they have co-morbidities, take longer to recover/rehabilitate from illness, and require more support.
As people age, the likelihood of developing a major illness or disability increases significantly. Rising rates of dementia, both within the district and the central region, are also expected.
Issues of social isolation also exist.
The elderly population is also vulnerable to downturns in the economy as a higher proportion are on low/fixed incomes. Voluntary support structures can also be adversely impacted by economic downturns.
The impact of the ageing population is beginning to be felt, with increased hospitalisation levels and higher lengths of stay.
This is considered a medium to long term risk, rather than an immediate issue.
Mitigations
Ongoing focus on chronic care, such as cancer, cardiovascular, respiratory and diabetes. The elderly are high users of these services.
Work with aged residential care facilities to enact the Government‟s priority to improve the quality of supervision and nursing in rest homes.
Roll-out of InterRAI locally, with primary component implemented through Integrated Family Health Centres where possible.
The “Better, Sooner, More Convenient Primary Health Care” business case has specific focus on health for older people. Older health model of care developed, together with clinical networks, and gerontology specific clinical pathways. Options for improved Maori-focus disability support are planned, as is up-skilling of the aged care workforce.
Exploring a wider range of community support options with a rehabilitative focus.

Chapter Five: Stewardship
Annual Plan 2011/12, 28 June 2011 Page 75
Risk 6: A Major Disaster/Pandemic impacts MDHB’s ability to deliver Health and Disability Services
Assessed Risk Level: Major
Description of Risk The likelihood of a major pandemic has increased over recent years, eg major earthquake or Avian Bird Flu. If a pandemic or major disaster occurred within MidCentral‟s district there is a risk that local health and disability services will be unable to respond in a timely and effective manner.
In any pandemic situation, the risk of communication breakdowns exist.
Mitigations
Business continuance and pandemic plans in place. Ongoing participation in local, regional and national emergency planning
exercises and conducts a number of internal evaluative exercises. Ongoing work with primary sector to develop Emergency Management Plans. Communication planning forms an integral part of the Pandemic and
Emergency Management Plans. MDHB has links to strong national civil defence and emergency co-ordination
services in place. Risk 7: The DHB’s workforce is not appropriate to meet present and future demand
Assessed Risk Level: Moderate
Description of Risk The delivery of health and disability services in both the primary and secondary care is heavily reliant on having the appropriate sized and skilled workforce.
Nationally and internationally difficulties have been experienced in recruiting and retaining health professionals. However, there has been a improvement as a result of the international economic downturn.
Workforce issues are compounded by the increase in aging population and the associate demand together with increase in age of the current DHB workforce. The average of MidCentral DHB‟s workforce is 45 years.
To provide a long-term solution to workforce and service sustainability issues, the Regional Clinical Services Plan is to be implemented. This aims to create regionally co-ordinated health services. There is a risk implementation may be delayed due to conflicting priorities at a local level.
Mitigations
Workforce development strategy in place covering recruitment, retention, and a safe working environment.
Ongoing participation in regional and national workforce initiatives. ACC accredited employer tertiary status. Palmerston North Hospital a teaching hospital. Also, a site for medical
undergraduate placements (University of Otago‟s Wellington campus). Strong clinical governance and partnership model. MDHB‟s health care development team supports primary care nursing. Healthy staff programme in place. A no-lift policy in place. A regional services plan in place, which will utilise regional resources to address
speciality medical shortages and imbalances between geographical areas. centralAlliance offers opportunity for shared staffing arrangements. Risk Profile:
Definite
Almost Certain
Likely
Unlikely
Highly Unlikely
LIK
EL
IHO
OD
Lo
w
Me
diu
m
Hig
h
Ve
ry H
igh
Ex
tre
me
CONSEQUENCE
1
2
3
4
5
67
Key to Risks:1 = failure to embed a sustainable surplus2 = rate of change3 = elective service delivery4 = GP shortage5 = ageing population6 = pandemic7 = workforce inappropriate (skills & size)

Chapter Five: Stewardship
Annual Plan 2011/12, 28 June 2011 Page 76
Organisations in which we have an Ownership Interest
MidCentral District Health Board has a part ownership in the Central Region‟s Technical Advisory Service (TAS) and Allied Laundry Services.
Central Region’s Technical Advisory Service Limited
The Central Region‟s Technical Advisory Service Limited (TAS) was established with Ministerial approval in 2001 as a limited liability company under the Companies Act 1993 and is jointly and equally owned by the six District Health Boards in the Central region. Each District Health Board participates in its governance through the board structure.
The purpose of TAS is to provide the Central Region‟s District Health Boards with expert advisory services through health information, service planning and external service audit functions to support local District Health Board decision-making. It does not have a mandate to make purchasing decisions. TAS also undertakes audit services for District Health Boards - reviewing and monitoring the contract performance of service providers, with the emphasis on quality and patient/community outcomes.
TAS issues its own Statement of Intent each year.
Allied Laundry Services Limited
MidCentral District Health Board is part owner of Allied Laundry Services Limited, a limited liability company established in 2002 under the Companies Act 1993. The company is equally owned by four participating DHBs, being Taranaki, Whanganui, Hawke‟s Bay and MidCentral Health District Health Boards
The purpose of Allied Laundry Services Limited is to provide laundry services in this region. The regional laundry facility is based on Palmerston North Hospital campus.
Allied Laundry Services Limited‟s key output for 2011/12 is the processing (collection, laundering and delivery) of around 2.7m kgs of laundry to its four shareholding DHBs, and Wairarapa DHB..
Details of this company‟s financial forecasts and accounting statements are contained in this document – refer Appendix C.

Chapter Six: Service Configuration
Annual Plan 2011/12, 28 June 2011 Page 77
Chapter Six: Service Configuration
6.1 Service Coverage
Currently, MidCentral District Health Board is meeting all the requirements of the Service Coverage Schedule.
A summary of the services available in each area (Horowhenua/Otaki, Tararua, Manawatu and Palmerston North) and service type is provided in the “2011/12 Annual Plan Funding Arrangements Document”, and includes details of any cost to the consumer for accessing these services.
Pursuant to Clause 25 of the New Zealand Public Health and Disability Act 2000, MidCentral DHB may enter into service agreements for the provision of services outlined in this Plan.
6.2 Service Change
At this time, MidCentral DHB is not anticipating any service changes as a result of implementing this annual plan.
The implementation of the Regional Service Plan may see the need for people to travel for some specialist services and supporting accommodation and travel strategies will be developed alongside the new service arrangements.
6.3 Service Issues
There are no known service issues.

Chapter Seven: Production Planning
Annual Plan 2011/12, 28 June 2011 Page 78
Summarised Outputs (DHB of Service):
2010/11
Forecast
2011/12
Planned
Case-weighted inpatient discharges
Maternity 2,897 2,845 -1.81% -0.11%
Medical 12,192 11,171 -8.38% -2.19%
Medical electives 342 807 135.75% 1.00%
Medical acute 11,850 10,364 -12.54% -3.18%
Medical other - - 0.00% 0.00%
Surgical 12,444 12,402 -0.34% -0.09%
Surgical electives 6,234 6,612 6.06% 0.81%
Surgical acute 6,210 5,790 -6.76% -0.90%
Surgical other - - 0.00% 0.00%
Total case-weighted inpatient discharges
Total 27,533 26,417 -4.05% -2.39%
Outpatient services (expressed as events)
ED 25,130 23,000 -8.48% -0.35%
Medical first 11,210 10,287 -8.23% -0.21%
Medical follow up 31,455 30,404 -3.34% -0.17%
Oncology 32,030 32,824 2.48% -0.05%
Renal 11,550 11,371 -1.55% -0.10%
Scope 1,493 4,195 180.99% 0.95%
Surgical first 12,798 12,809 0.09% 0.00%
Surgical follow up 26,793 27,779 3.68% 0.10%
Other services (expressed as events)
Maternity 7,370 6,353 -13.80% -0.13%
Medical 12,962 12,805 -1.22% 0.00%
Surgical 5,673 6,350 11.94% 0.00%
Health of Older People 19,347 19,763 2.15% 0.14%
Miscellaneous 203,374 208,232 2.39% 0.33%
All non-inpatient services (expressed as case-weighted outputs)
Total 19,141 19,529 2.03% 0.83%
Total volume growth 46,673 45,946 -1.56% -1.56%
MidCentral
2010/11 Output Plan % growth % growth
weights
Chapter Seven: Production Planning
6.1 Production Planning
6.1.1 Provider Arm
MDHB‟s provider arm has been contracted to continue the current level of activity, as well as increased volumes in priority investment areas and elective services. These services are valued at $252m.
Funding for the provider arm has increased over 2010/11 levels and this largely relates to demographic changes and pricing. For example, the national price per purchase unit has changed therefore this drives in many cases additional funding.
Significant changes to the price volume schedule arrangements this year include:
Final implementation of new Mental Health purchase unit codes (Kaupapa Maori and Opioid Substitution Treatment) which came from a complete re-development of the service specifications – started in 2011 the purchases changes and now completed in 2012
Casemix changes for Avastin, skin lesions and sleep apnoea and local funding change for venesections
Additional funding for renal pre-dialysis support and cystic fibrosis drugs for kids at home
The adjacent table shows volume on a forecast and planned basis. Forecast is based on actual results for 2010/11 year to date, extrapolated for the full year. MDHB consistently delivers more volumes year on year, and has consistently exceeded planned activity in recent years. Acute service areas (Emergency Department, medical, paediatric and obstetric) are “capacity funded”. Indicative volumes are set for the year for these “capacity based” services with the service providing volumes to the limit of its capacity. These are generally in excess of target, depending on the level of demand. Forecast activity in 2010/11 is in excess of plan, and this has been achieved within budget.

Chapter Seven: Production Planning
Annual Plan 2011/12, 28 June 2011 Page 79
6.1.2 Funder Arm
The DHB‟s Funding Division has contracts with a range of providers across primary, secondary, disability support, Maori health and mental health portfolios. These contracts are for services valued at $432m, of which $252m is for hospital services provided by the DHB‟s provider arm (refer section 6.1.1).
Details of all contractual arrangements, by portfolio, are set out in the 2011/12 Annual Plan Funding Arrangements document. This document lists the contract holder (provider), the type of services to be delivered, and the value.
114,755
253,115
40,035
1,932 69,640
Funding Allocation by Portfolio ($'000s)
Primary Care Secondary CareMental Health Maori HealthDisability Support Services
6.1.3 Electives
Elective volumes have increased significantly over last year‟s levels for a number of reasons. These being an increase in the elective base, increase in initiative funding, an increase in health targets, increases required to meet the National average and replacement work required to make up for items no longer counted as CWDs. In total this amounts to 1,313 CWDs of which only 241 are funded by the Ministry, the remaining 1,072 CWDs are to be funded from population based funding. The net funding to be provided by the DHB is approximately $4.9m
6.1.4 Mental Health
Mental health funding (and volumes) are in line with the mental health ringfence.
Nationally, changes have been made to the mental health service specifications and purchase unit codes (as noted in 6.1.1). MidCentral DHB‟s volumes schedules are aligned to the new specifications/codes.

Chapter Eight: Financial Performance
Annual Plan 2011/12, 28 June 2011 Page 80
Chapter Eight: Financial Performance
8.1 Forecast Financial Position
MidCentral DHB is forecasting a small surplus in 2011/12 and out years. It will be funding a number of investments from internal funds, namely increased cardiology and cancer capacity, in the first and second years. During 2011/12 a prioritised list of ongoing investment (service developments) will be established. Each year MidCentral DHB will endeavour to fund such investments from internal resources. The Board believes the current level of planned surplus is insufficient to meet investment plans and the DHB must further improve its operating performance before significant investments are decided.
MidCentral DHB‟s position at the beginning of 2011/12 is much better than previous years. This is due to the early implementation of financial recovery initiatives (completed in one year rather than over two years) and some one-off revenue received in 2010/11 (over $2m). The modest surplus achieved in 2010/11 is not forecast to continue to the same level in 2011/12 as costs associated with new investments, such as cardiology and implementation of the regional information system plan, will take effect. Also, as a result of the financial recovery programme, operating costs are well within revenue. A small portion of this reduction was temporary due to a number of vacancies being held pending review outcomes. These vacancies will be filled with a consequent increase in operating costs..
Actual Forecast Budget Budget Budget
2009/10 2010/11 2011/12 2012/13 2013/14
Operating surplus/(deficit) (9,394) 6,001 998 1,016 1,032
DHBs are operating in a national environment of economic restraint. There is significant pressure on Government funding and this is not expected to ease significantly during the planning period. MidCentral DHB‟s plan reflect this situation and investment is modest and will be self-funded.
8.2 Assumptions
National Assumptions
General Assumptions
MidCentral DHB will live within its budget and will return to a surplus position so it can invest in capital and service development.
Government‟s six national health targets will remain the priority.
The Better Sooner More Convenient services programme will continue to be pursued by the Ministry of Health.
Interest rates are assumed to remain at 2010 levels until early 2011 when they are expected to rise. From that point, an ongoing slow rise in rates is assumed.
Exchange rate fluctuations may materially impact the cost of supplies and will be offset by procurement saving initiatives, and the use of hedging contracts by suppliers.
No change in capital charge rate of 8%.
Proposed changes to the capital charge rules, as set out by the Minister of Finance (December 2010) will come into force as from 1 July 2011.
All changes resulting from the ongoing implementation of the Ministerial Review Group‟s recommendations including any devolution during the term of the plan will be at least cost neutral or better to MidCentral DHB. (NB: services which may be devolved during the planning period include maternity services provided under Section 88 Primary Maternity Services Notice 2007, and the interim funding pool for disabled people less than 65 years.)

Chapter Eight: Financial Performance
Annual Plan 2011/12, 28 June 2011 Page 81
HBL has identified savings of $40m for the sector. MidCentral DHB‟s share of these is approximately $1.6m and has been incorporated into these financial statements although as yet remain unallocated at a line level.
Material compliance costs arising from regulatory and legislative changes are not budgeted.
No material costs have been included for a pandemic.
Personnel
Workforce costs have been budgeted at actual known costs including step increases.
Future increases in workforce costs have been budgeted based on national employment relations strategies.
The size of MidCentral DHB‟s workforce is assumed to remain steady during the planning period, with any increases aligned to demographic growth, planned service developments, and increased volumes.
Policy
The budget is based on current Government policy settings and known Government health service initiatives.
The impact of changes to the national Travel & Accommodation Policy (announced March 2009) will be at least cost neutral to MidCentral DHB.
The implementation of Whanau Ora will be cost neutral to MidCentral DHB.
Regional/Local
General Assumptions
No external deficit funding will be required during the planning period.
Early payment of funding from the Ministry of Health will continue.
MidCentral DHB‟s share of the national population based funding formula will be 4.12%, 4.11%, and 4.10% over the three years covered by the planning period.
Inter-district flows - MidCentral DHB will use its funding envelope as a base.
It is assumed that changes to intervention rates and inter-district flows will be minimal, with no significant impact on net costs.
Inter-district flows for MidCentral Health‟s Regional Cancer Treatment Service have been based on actual as from 1 July 2011. (NB: previously IDF arrangements for this service were based on historic volumes.)
Price Volume Schedule will be accommodated within the application of the service level agreement (SLA) rules with the Funding Division. Any new or additional costs will be offset by equivalent cost reductions elsewhere in MidCentral Health.
No new ownership investments in other businesses are included in this Plan.
Shared Services
Allied Laundry will not require any funding in the 2011/12 year
Central TAS Service Level Agreement will not require any increase in SLA funding in the 2011/12 year.
Enable New Zealand may move to a stand-alone company structure. It is assumed that any such change will be cost neutral to MDHB.
Revenue for operating costs, as detailed in MidCentral DHB‟s business case for Child & Adolescent Oral Health Services will be provided from population based funding. Revenue for capex costs will be provided from national funds.
Regional & Sub-Regional Service Planning
Regional planning requirements for DHBs are increasing.
Any collaborative regional and sub-regional initiatives will be cost-neutral. (NB: services which are expected to move to a regional basis during the planning period include cardiology, radiology and renal services.)

Chapter Eight: Financial Performance
Annual Plan 2011/12, 28 June 2011 Page 82
Revenue for operating costs (including depreciation), as detailed in Central PHO‟s business case for a bowel screening service for MidCentral and Whanganui DHB districts, will be provided from national funds. Initial capital costs will be borne by MidCentral DHB.
MidCentral Health‟s regional cancer treatment service will be a four-linear accelerator operation as from 1 January 2012, and it will continue to service is current catchment area.
Demand for Services and Revenue
Overall acute demand will be similar or less to that of 2010/11, thus allowing planned levels of elective procedures to be undertaken.
Elective throughput will be in accordance with the Elective Services Plan. The Elective Services Plan is aligned to regional and sub-regional Elective Service Plans.
All elective surgical work will be performed in-house, or by a regional partner.
Demand for disability support services (older health) will rise by 3% per annum.
Elective targets, including radiation therapy, will be met.
General practice volumes will be similar to that of 2010/11, and Emergency Department volumes will rise by around 5% per annum.
Contracted Providers: Pricing
For 2011/12 price increases for external providers will be within FFT unless directed by the Minister or Ministry of Health, agreed through a national process or specifically included in a service contract.
There will be no new mental health blueprint funding.
Personnel
Any restructuring costs will be met from budgeted operating costs.
Administration/management numbers will not exceed the established cap of 535 FTEs except by agreement of the Minister of Health.
Asset Management & Capital Expenditure
Total capital expenditure of up to $16 million is planned for 2011/12.
MidCentral DHB‟s land and buildings are re-valued every three years. The last revaluation occurred on 30 June 2009, with the next revaluation scheduled for 30 June 2012. The likely financial impact of this revaluation is yet to be confirmed. It is assumed the capital charge impact will be offset by increased revenue. A small impact on depreciation levels is assumed.
Land-holding costs associated with Kimberley Centre will continue to be met by the Ministry of Health. (NB: this property is being disposed off via the Crown land disposal process.)
Proceeds from property sales will assist the funding of capital expenditure but have not been included in the detailed financial statements due to the unpredictability of timing of sale.
MidCentral DHB‟s share of the Central Regional Information Systems Plan ($8m over three years) can be accommodated within the DHB‟s capital expenditure provision or from surpluses generated. Key items scheduled for purchase during the planning period are the Patient Administration System and e-Pharmacy. These will feature in out-year financials.
Funding for the new linear accelerator (fourth linac) will be funded from cash reserves through surpluses generated within MidCentral Health.
Site redevelopment of the DHB‟s regional base hospital (Palmerston North) is assumed to commence in 2012/13 (planning and design phase). Capital expenditure of $2.5m has been assumed for that year, followed by $16.3m and $30.7m in 2015/16 and 2016/17 respectively.
The ownership and capital costs of Integrated Family Health Centres shall not rest with MidCentral DHB, with the exception of Horowhenua Health Centre.
Implementation of the Transforming Primary Health Care will be met by PHO. Any change initiative that has significant impact on the DHB, and any of its separate divisions, will be subject to detailed business case. It is assumed each business case will be self-financing over a period of time to be agreed.
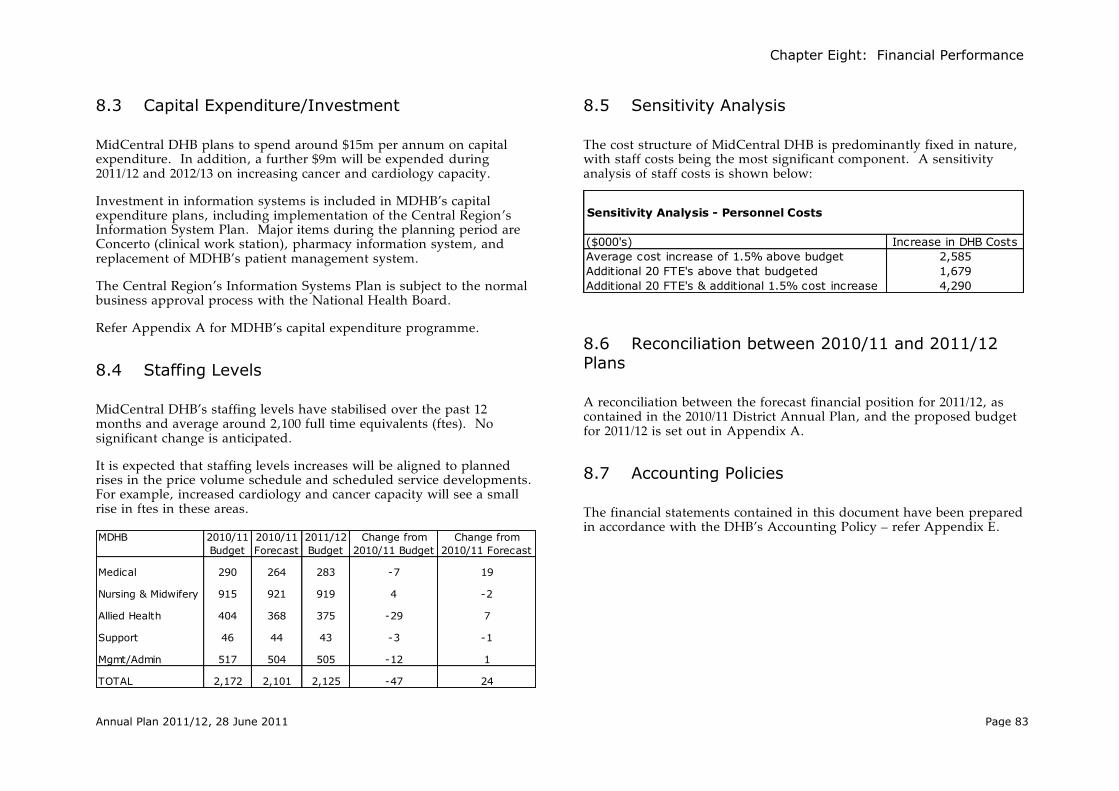
Chapter Eight: Financial Performance
Annual Plan 2011/12, 28 June 2011 Page 83
Sensitivity Analysis - Personnel Costs
($000's) Increase in DHB Costs
Average cost increase of 1.5% above budget 2,585
Additional 20 FTE's above that budgeted 1,679
Additional 20 FTE's & additional 1.5% cost increase 4,290
8.3 Capital Expenditure/Investment
MidCentral DHB plans to spend around $15m per annum on capital expenditure. In addition, a further $9m will be expended during 2011/12 and 2012/13 on increasing cancer and cardiology capacity.
Investment in information systems is included in MDHB‟s capital expenditure plans, including implementation of the Central Region‟s Information System Plan. Major items during the planning period are Concerto (clinical work station), pharmacy information system, and replacement of MDHB‟s patient management system.
The Central Region‟s Information Systems Plan is subject to the normal business approval process with the National Health Board.
Refer Appendix A for MDHB‟s capital expenditure programme.
8.4 Staffing Levels
MidCentral DHB‟s staffing levels have stabilised over the past 12 months and average around 2,100 full time equivalents (ftes). No significant change is anticipated.
It is expected that staffing levels increases will be aligned to planned rises in the price volume schedule and scheduled service developments. For example, increased cardiology and cancer capacity will see a small rise in ftes in these areas.
MDHB 2010/11 2010/11 2011/12 Change from Change from
Budget Forecast Budget 2010/11 Budget 2010/11 Forecast
Medical 290 264 283 -7 19
Nursing & Midwifery 915 921 919 4 -2
Allied Health 404 368 375 -29 7
Support 46 44 43 -3 -1
Mgmt/Admin 517 504 505 -12 1
TOTAL 2,172 2,101 2,125 -47 24
8.5 Sensitivity Analysis
The cost structure of MidCentral DHB is predominantly fixed in nature, with staff costs being the most significant component. A sensitivity analysis of staff costs is shown below:
8.6 Reconciliation between 2010/11 and 2011/12 Plans
A reconciliation between the forecast financial position for 2011/12, as contained in the 2010/11 District Annual Plan, and the proposed budget for 2011/12 is set out in Appendix A.
8.7 Accounting Policies
The financial statements contained in this document have been prepared in accordance with the DHB‟s Accounting Policy – refer Appendix E.

Chapter Nine: Schedule of Appendices
Annual Plan 2011/12, 28 June 2011 Page 84
Chapter Nine: Schedule Appendices
The following information is appended:
Financial Statements & Capital Expenditure
Performance Measures, 2011/12
Allied Laundry Services Limited‟s Financial Statements & Accounting Policy
Scheduled of Related Documents
Accounting Policy
Minister of Health‟s Letter of Endorsement

Appendix A: Financial Statements & Capital Expenditure
Annual Plan 2011/12, 28 June 2011 Page 85
Appendix A: Financial Statements & Capital Expenditure
Consolidated Position
Statement of Financial Performance
MidCentral DHB
Actual Forecast Budget Budget Budget
($'000's) 2009/10 2010/11 2011/12 2012/13 2013/14
Revenue 509,931 525,305 543,295 558,684 574,127
% change 3.01% 3.42% 2.83% 2.76%
less Expenditure
Personnel 171,308 170,525 178,399 183,432 188,550
Outsourced Services 21,322 18,735 17,214 17,507 17,804
Clinical Supplies 45,605 43,565 46,566 48,116 49,569
Infrastructure & Non-Clinical 57,357 58,734 63,935 64,853 66,062
Financing Charges 11,628 10,734 10,302 10,668 10,765
External Provider Payments 166,203 169,443 178,207 183,764 189,305
Inter-District Payments 45,901 47,568 47,674 49,328 51,040
Corporate costs 1 - - - -
519,325 519,304 542,297 557,668 573,095
% change -0.00% 4.43% 2.83% 2.77%
Operating Surplus/(Deficit) (9,394) 6,001 998 1,016 1,032
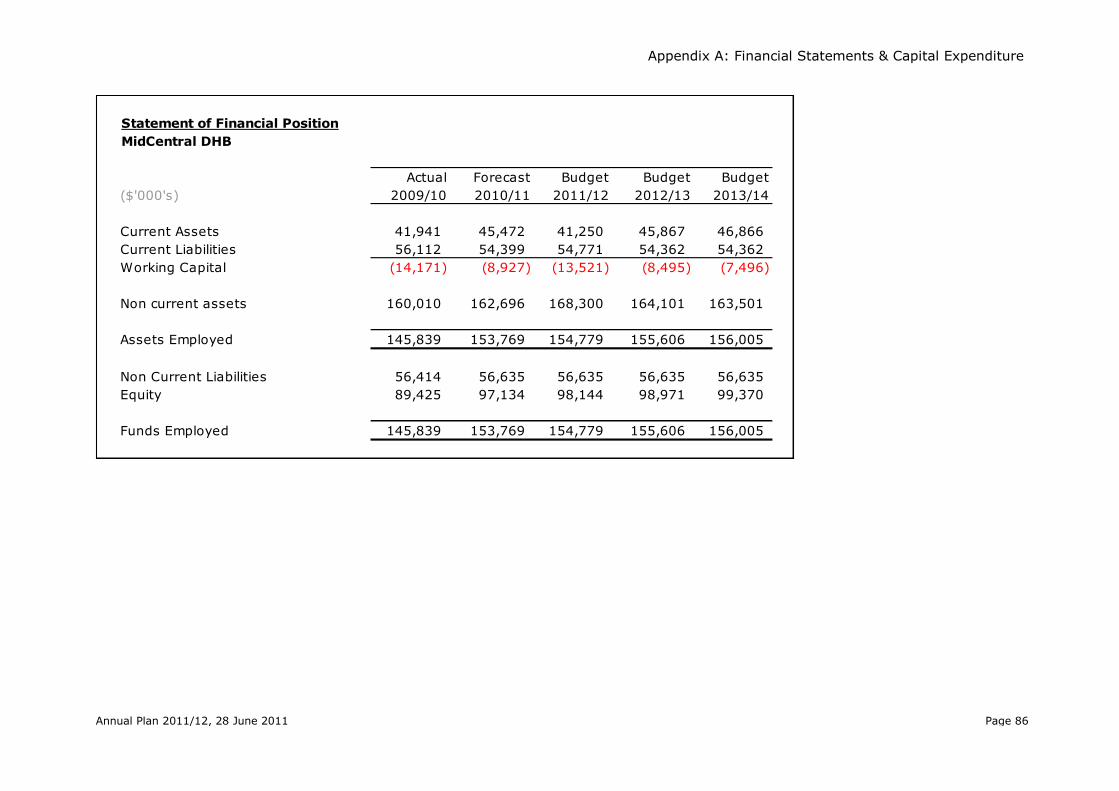
Appendix A: Financial Statements & Capital Expenditure
Annual Plan 2011/12, 28 June 2011 Page 86
Statement of Financial Position
MidCentral DHB
Actual Forecast Budget Budget Budget
($'000's) 2009/10 2010/11 2011/12 2012/13 2013/14
Current Assets 41,941 45,472 41,250 45,867 46,866
Current Liabilities 56,112 54,399 54,771 54,362 54,362
Working Capital (14,171) (8,927) (13,521) (8,495) (7,496)
Non current assets 160,010 162,696 168,300 164,101 163,501
Assets Employed 145,839 153,769 154,779 155,606 156,005
Non Current Liabilities 56,414 56,635 56,635 56,635 56,635
Equity 89,425 97,134 98,144 98,971 99,370
Funds Employed 145,839 153,769 154,779 155,606 156,005

Appendix A: Financial Statements & Capital Expenditure
Annual Plan 2011/12, 28 June 2011 Page 87
Statement of Cashflows
MidCentral DHB
Actual Forecast Budget Budget Budget
($'000's) 2009/10 2010/11 2011/12 2012/13 2013/14
Total Receipts 509,608 523,123 541,294 556,648 572,058
Total Payments (500,946) (500,711) (523,795) (537,579) (552,406)
Operating Cash flow 8,662 22,412 17,499 19,069 19,651
Investing Cashflow (6,468) (14,706) (18,144) (10,675) (14,430)
Financing Cashflow (2,854) (1,660) (3,577) (3,777) (4,222)
Net Capital Cashflow (9,322) (16,366) (21,721) (14,452) (18,652)
Net Cashflow (660) 6,046 (4,222) 4,617 999
Opening Cash 26,124 25,464 31,510 27,288 31,905
Closing Cash 25,464 31,510 27,288 31,905 32,904
Schedule of Lenders
Available Facility ($000) 2009/10 2010/11 2011/12 2012/13 2013/14
Crown Health Financing Agency:
Loan Facility 47,000 47,000 47,000 47,000 47,000
Horowhenua Hospital 9,700 9,700 9,700 9,700 9,700
Bank of New Zealand:
Working Capital Facility 15,000 15,000 15,000 15,000 15,000
Total Facility 71,700 71,700 71,700 71,700 71,700
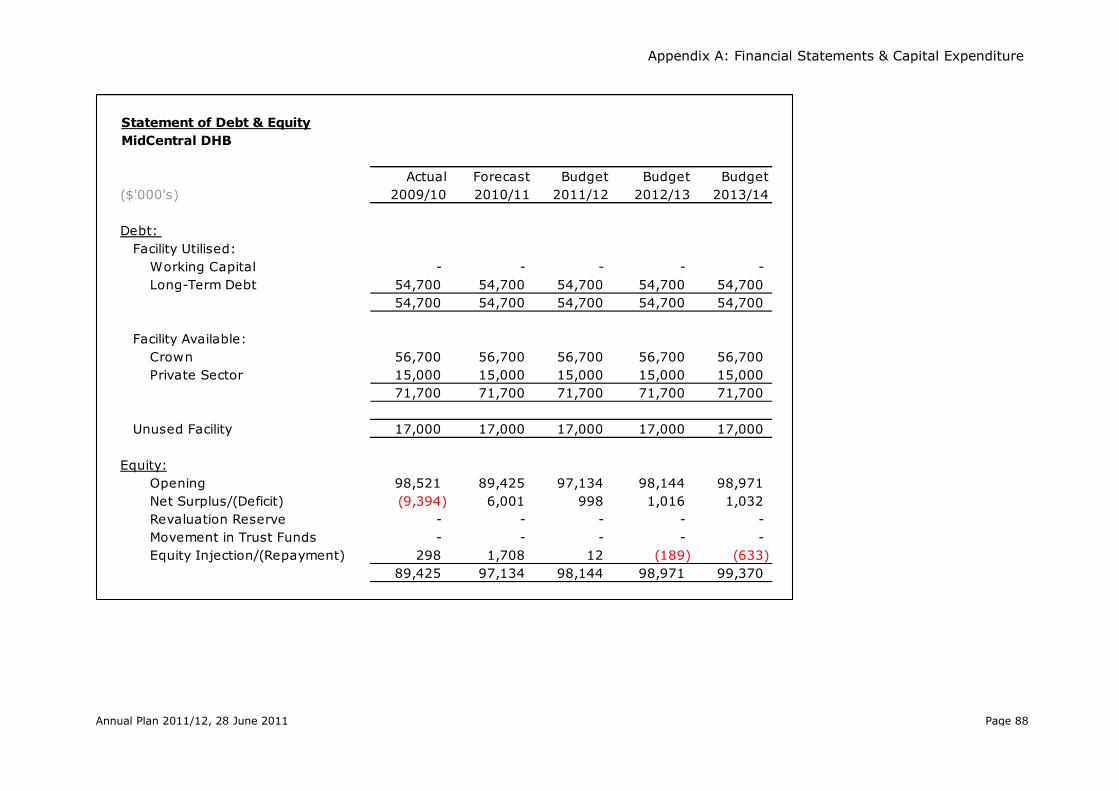
Appendix A: Financial Statements & Capital Expenditure
Annual Plan 2011/12, 28 June 2011 Page 88
Statement of Debt & Equity
MidCentral DHB
Actual Forecast Budget Budget Budget
($'000's) 2009/10 2010/11 2011/12 2012/13 2013/14
Debt:
Facility Utilised:
Working Capital - - - - -
Long-Term Debt 54,700 54,700 54,700 54,700 54,700
54,700 54,700 54,700 54,700 54,700
Facility Available:
Crown 56,700 56,700 56,700 56,700 56,700
Private Sector 15,000 15,000 15,000 15,000 15,000
71,700 71,700 71,700 71,700 71,700
Unused Facility 17,000 17,000 17,000 17,000 17,000
Equity:
Opening 98,521 89,425 97,134 98,144 98,971
Net Surplus/(Deficit) (9,394) 6,001 998 1,016 1,032
Revaluation Reserve - - - - -
Movement in Trust Funds - - - - -
Equity Injection/(Repayment) 298 1,708 12 (189) (633)
89,425 97,134 98,144 98,971 99,370

Appendix A: Financial Statements & Capital Expenditure
Annual Plan 2011/12, 28 June 2011 Page 89
Funder
Statement of Financial Performance
Funder
Actual Forecast Budget Budget Budget
($'000's) 2009/10 2010/11 2011/12 2012/13 2013/14
Revenue 451,490 466,139 481,862 497,013 512,214
% change 3.24% 3.37% 3.14% 3.06%
less Expenditure
Provider and Governance Divisions 240,152 247,805 255,981 263,920 271,869
External Providers 166,203 169,443 178,207 183,764 189,305
Inter-District Outflows 45,901 47,568 47,674 49,328 51,040
452,256 464,816 481,862 497,013 512,213
% change 2.78% 3.67% 3.14% 3.06%
Operating Surplus/(Deficit) (766) 1,323 - 0 0

Appendix A: Financial Statements & Capital Expenditure
Annual Plan 2011/12, 28 June 2011 Page 90
Statement of Financial Performance
Provider
Actual Forecast Budget Budget Budget
($'000's) 2009/10 2010/11 2011/12 2012/13 2013/14
Revenue 294,132 301,176 311,773 319,831 327,903
% change 2.39% 3.52% 2.58% 2.52%
less Expenditure
Personnel 162,716 162,070 170,740 175,643 180,629
Outsourced Services 20,628 17,937 16,395 16,674 16,957
Clinical Supplies 45,558 43,531 46,564 48,114 49,567
Infrastructure & Non-Clinical 53,608 55,183 60,678 61,434 62,478
Financing Charges 9,928 9,314 9,043 9,472 9,633
Corporate costs 9,772 9,163 6,854 6,971 7,089
302,210 297,198 310,274 318,307 326,353
% change -1.66% 4.40% 2.59% 2.53%
Operating Surplus/(Deficit) (8,078) 3,978 1,499 1,525 1,550
Provider

Appendix A: Financial Statements & Capital Expenditure
Annual Plan 2011/12, 28 June 2011 Page 91
Total Provider Division Revenue by Type
($000s)
MidCentral
Health
Primary
Health
Nursing Enable NZ Total
Funding Division 252,033 1,564 - 253,597
Price Volume Schedule 252,033 1,564 253,597
Additional DSS Funding -
Clinical Training Agency 2,350 - - 2,350
Ministry of Health 12,937 - 7,962 20,899
Personal Health 6,143 - 6,143
Mental Health -
Public Health 4,340 4,340
DSS 2,454 7,962 10,416
Other Government 9,444 - 15,740 25,184
Inter Provider Revenue 2,278 - - 2,278
Training Fees and Subsidies 272 - - 272
Accident Insurance 4,422 - 15,740 20,162
Other 2,472 - - 2,472
Patient/Consumer Sourced 884 - - 884
Other Income 5,919 - 2,940 8,859
Total Revenue 283,567 1,564 26,642 311,773
*Note
Output Related 253,597
Non-output Related -
Total Price Volume Schedule 253,597

Appendix A: Financial Statements & Capital Expenditure
Annual Plan 2011/12, 28 June 2011 Page 92
Governance
Statement of Financial Performance
Governance
Actual Forecast Budget Budget Budget
($'000's) 2009/10 2010/11 2011/12 2012/13 2013/14
Revenue 4,461 5,795 5,641 5,760 5,880
% change 29.90% -2.66% 2.11% 2.08%
less Expenditure
Personnel 8,593 8,455 7,659 7,789 7,922
Outsourced Services 694 798 819 833 847
Clinical Supplies 47 34 2 2 2
Infrastructure & Non-Clinical 3,749 3,551 3,257 3,420 3,583
Financing Charges 1,700 1,420 1,259 1,196 1,133
Corporate costs (9,772) (9,163) (6,854) (6,971) (7,089)
5,011 5,095 6,142 6,269 6,398
% change 1.68% 20.55% 2.07% 2.05%
Operating Surplus/(Deficit) (550) 700 (501) (510) (518)

Appendix A: Financial Statements & Capital Expenditure
Annual Plan 2011/12, 28 June 2011 Page 93
Reconciliation between Plans
Budget
($000's) 2011/12
Forecast 2010/11 surplus from
2009/10 DAP (1,046)
Reduction in Revenue (10,525)
Additional Costs
Outsourced Services 291
External Provider Payments 4,133
Inter-District Payments 36
Total Additional Costs 4,460
Reduced Costs
Personnel 565
Clinical Supplies 497
Infrastructure & Non-Clinical 15,679
Financing Charges 288
Total Reduced Costs 17,029
Operating Surplus/(Deficit) 998

Appendix A: Financial Statements & Capital Expenditure
Annual Plan 2011/12, 28 June 2011 Page 94
Mid
Centr
al D
istr
ict H
ealth
Board
Three Y
ear C
apita
l Expenditu
re P
rogram
me
Descrip
tion
Forecast
20
10
/1
1
Budget
20
11
/1
2
Budget
20
12
/1
3
Budget
20
13
/1
4
Item
s g
reate
r than $
250k
IS
SP
Pla
n E
arlie
r-2
00
9/1
052
IS
SP
Pla
n 2
01
0/1
1
Regio
nal P
AC
S A
rchiv
e275
Pharm
acy
610
CRIS
P (O
ther)
3,7
06
3,1
06
1,1
49
Mate
rnity
Syste
m190
Denta
l385
Ste
rile T
rackin
g S
yste
m340
IS
SP
Pla
n O
ute
r Y
ears
Tele
phony U
pgra
de
230
230
Busin
ess In
tellig
ence/D
ata
Ware
house
250
HR P
erfo
rmance
120
Clin
ical R
ecord
s s
cannin
g900
Netw
ork
Infra
stru
ctu
re328
423
Tota
l IS
SP
32
75
,54
95
,26
91
,14
9
MC
H P
rovid
er
Prio
r y
ears in
to 2
01
0/1
1
ICU
Patie
nt M
onito
rs524
LA1 M
LC
264
Lin
ac S
inkin
g F
und
206
360
360
360
Ultra
sound-R
adio
logy
363
Theatre
Ele
ctric
al U
pgra
de
473
CAO
HS- D
enis
try B
usin
ess C
ase
755
Under $
250k
607
Pla
n 2
01
0/1
1
Lin
ac S
inkin
g F
und
360
CAO
HS- D
enis
try B
usin
ess C
ase
1,8
87
645
445
Pla
nnin
g W
ork
sta
tions
450
Em
erg
ency R
oom
s 1
1 &
12 (R
adio
logy)
1,0
00
Car p
ark
ing
860
Tele
metry
Syste
ms (E
D &
MAPU
)800
Dru
g D
istrib
utio
n S
yste
m364
Clin
ical R
ecord
s B
uild
ing (p
art)
374
Pla
n 2
01
1/1
2
Gam
ma C
am
era
1,2
00
ICU
Refu
rbis
hm
ent
300
Boile
r House D
iesel S
tora
ge
Bed R
epla
cem
ent P
rogra
mm
e325
425
Tre
atm
ent P
lannin
g S
yste
m800
Ultra
sound-R
adio
logy
300
DSA U
pgra
de
1,1
00
CT S
imula
tor
2,0
00
Philip
s O
mnid
iagnostic
700
4th
Lin
ac &
Bunker
6,3
00
Card
iolo
gy E
quip
ment &
Facilitie
s2,5
95
Under $
250k
2,5
29
2,9
41
2,3
31
12,2
36
Corporate
Prio
r Y
ears 2
01
0/1
1426
Clin
ical R
ecord
s B
uild
ing
2,0
11
Pla
n 2
01
1/1
2
Under $
250K
1,6
29
1,8
75
1,6
30
2,3
05
Sto
rage A
rea N
etw
ork
500
JDE U
pgra
de
200
Enable
Prio
r Years
2010/1
1 -H
am
ilton S
tore
Relo
catio
n &
AC
C M
odific
atio
ns
229
Capita
l Pla
n (Ite
ms u
nder $
250k)
450
450
450
450
Dem
and fo
r C
apita
l Expenditu
re
16,8
88
23,9
40
15,1
10
16,5
00
Fundin
g S
ources
Net S
urp
lus
6,0
01
998
1,0
15
1,0
32
Depre
cia
tion fu
ndin
g
13,6
26
14,9
13
16,5
00
17,1
00
MO
H F
undin
g E
nhancem
ents
Child
& A
dole
scent O
ral H
ealth
($3,8
96)
2,3
41
645
445
Asset S
ale
s3,2
00
2,4
00
Tota
l Fundin
g21,9
68
19,7
56
20,3
60
18,1
32
Where
there
is a
n e
xcess o
f fundin
g o
ver p
lanned e
xpenditu
re, th
e e
xcess w
ill be re
tain
ed a
nd e
arm
ark
ed fo
r futu
re c
apita
l investm
ent, s
uch a
s th
e p
ropo
sed h
ospita
l redevelo
pm
ent w
hic
h is
estim
ate
d to
co
st a
round
$50m
, and c
ould
co
mm
ence a
round 2
015
.
Capital Expenditure Programme – Three Years

Appendix B: Performance Measures
Annual Plan 2011/12, 28 June 2011 Page 95
Appendix B: Performance Measures
Policy Priorities Dimension
Performance Measure and description 2011/12 Target
National Target Frequency
PP1 Clinical leadership self assessment
The DHB provides a qualitative report identifying progress achieved in fostering clinical leadership and the DHB engagement with it across their region. This will include a summary of the following – how the DHB is: - Contributing to regional clinical leadership through networks - Investing in the development of clinical leaders - Involving the wider health sector ( Including primary and community care) in clinical inputs - Demonstrating clinical influence in service planning - Investing in professional development - Influencing clinical input at board level and all levels throughout the DHB – including across disciplines. - What are the mechanisms for providing input?
No quantitative target qualitative deliverable required.
NA Annual
PP2 Implementation of Better, Sooner, More Convenient primary health care
The DHB is to supply a progress report on the implementation of changes to primary health care services that deliver on the core elements of Better, Sooner, More Convenient primary health care. In particular progress must be described regarding: 1. the shifting of services from secondary care to primary care settings; 2. the development of Integrated Family Health Centres; and 3. any specific reporting requirements that may be identified in the Minister‟s Letter of Expectations (to be confirmed). AND (as applicable) 1. Those DHBs involved in Better, Sooner, More Convenient (BSMC) primary health care business case(s) are required to supply a progress report on the implementation of the business case(s) it is involved in. The BSMC Monitoring Framework includes indicators at three levels: 2. Those DHBs involved in Better, Sooner, More Convenient primary health care business case(s) are required to supply a progress report on the operation and expenditure of the flexible funding pool, including how pool funding has been prioritised to deliver services to meet the four high-level objectives. Where problems are identified, resolution plans are to be described.
No quantitative target qualitative deliverable required.
NA Quarterly

Appendix B: Performance Measures
Annual Plan 2011/12, 28 June 2011 Page 96
PP5 Shorter waits for chemotherapy treatment
Cancer Centre DHBs – wait time template
Completed monthly templates that measure the interval between the patient‟s first specialist assessment and the beginning of chemotherapy treatment along with other related measures, are supplied on time and complete from all DHB where chemotherapy treatment has commenced as detailed in the reporting template.
Provide a report confirming the DHB has reviewed the monthly wait time templates produced by either the relevant Cancer Centre(s) or its own DHB where treatment commenced at that DHB for the quarter . Where the monthly wait time data identifies: • any patients domiciled in the DHB waiting more than four weeks, due to capacity issues, and/or
100% at four weeks
100% at four weeks Quarterly
Performance Measure and description 2011/12 Target
National Target Frequency
P3 Local Iwi/Maori engagement and participation in DHB decision making, development of strategies and plans for Maori health gain
Measure 1 - PHO Maori Health Plans Percentage of PHOs with MHPs that have been agreed to by the DHB. 100% 100%
Six-Monthly
Measure 2 - PHO Maori Health Plans Report on how MHPs are being implemented by the PHOs and monitored by the DHB (include a list of the names of the PHOs with MHPs) OR for newly established PHOs, a report on progress in the development of MHPs (include a list of the names of these PHOs).
No quantitative target qualitative deliverable required.
NA
Measure 3 - DHB – Iwi/Maori relationships Provide a report demonstrating: • Achievements against the Memorandum of Understanding (MoU) between a DHB and its local Iwi/Maori health relationship partner, and describe other initiatives achieved that are an outcome of engagement between the parties during the reporting period. • Provide a copy of the MoU.
Measure 4 - DHB – Iwi/Maori relationships Report on how (mechanisms and frequency of engagement) local Iwi/Maori are supported by the DHB to participate in the development and implementation of the strategic agenda, service delivery planning, development, monitoring, and evaluation (include a section on PHOs).
Measure 5 - DHB Maori Health Plan Provide a report by exception on national level priorities that have not been achieved in the DHB Maori Health Plan. The report will say why the priority has not been achieved, what the DHB will do to rectify it, and by when.
PP4 Improving mainstream effectiveness DHB provider arms pathways of care of Maori
Measure 1 Provide a report describing the reviews of pathways of care that have been undertaken in the last 12 months that focused on improving Health outcomes and reducing health inequalities for Maori. No quantitative
target qualitative deliverable required.
NA Six-Monthly
Measure 2
Report on examples of actions taken to address the issues identified in the reviews. The report should identify:• what issues/ opportunities were brought to your attention as a result of the reviews of pathways of care that you identified in Measure one• the follow up actions you intend to take/ are taking as a result of the issues and opportunities that you identified above.The report should include timeframes for implementing the actions you identify.

Appendix B: Performance Measures
Annual Plan 2011/12, 28 June 2011 Page 97
• wait time standards were not met, for patients in priority categories A and B DHBs must provide a report outlining the resolution path.
PP6 Improving the health status of people with severe mental illness through improved access
The average number of people domiciled in the DHB region, seen per year rolling every three months being reported (the period is lagged by three months) for: • child and youth aged 0-19, specified for each of the three categories Maori, Other, and in total • adults aged 20-64, specified for each of the three categories Maori, Other, and in total • older people aged 65+, specified for each of the three categories Maori, Other, and in total.
Age 0-19
Maori 2.70%
NA Six-Monthly
Other 2.90%
Total 2.84%
Age 20-64
Maori 5.30%
Other 3.15%
Total 3.50%
Age 65+ Total >0.5%
PP7 Improving mental health services using relapse prevention planning
Provide a report on: 1. The number of adults and older people (20 years plus) with enduring serious mental illness who have been in treatment* for two years or more since the first contact with any mental health service (* in treatment = at least one provider arm contact every three months for two years or more.) The subset of alcohol and other drug only clients will be reported for the 20 years plus. 2. The number of Child and Youth who have been in secondary care treatment* for one or more years (* in treatment = at least one provider arm contact every three months for one year or more) who have a treatment plan. 3. The number and percentage of long-term clients with up to date relapse prevention/treatment plans (NMHSS criteria 16.4 or HDSS [2008]1.3.5.4 and 1.3.5.1 [in the case of Child and Youth]). 4. Describe the methodology used to ensure adult long-term clients have up-to-date relapse prevention plans and that appropriate services are provided. DHBs that have fully implemented KPP across their long-term adult population should state KPP as the methodology.
Adult (20+) Maori 95% 95%
Six-Monthly
Non Maori 95% 95%
Child & Youth
Maori 95% 95%
Non Maori 95% 95%
Performance Measure and description 2011/12 Target
National Target Frequency

Appendix B: Performance Measures
Annual Plan 2011/12, 28 June 2011 Page 98
PP8 DHBs report alcohol and drug service waiting times and waiting lists
Waiting times are measured from the time of referral for treatment to the first date the client is admitted to treatment, following assessment in any service whether it be NGO or provider arm. Reporting will be on the longest waiting time in days, plus the number of people on the waiting list for treatment at the end of the month, i.e. volume and time. Whilst assessment and motivational or pre-modality interventions may be therapeutic, they are not considered to be treatment. If a client is engaged in these processes, they are considered to be still waiting for treatment. DHBs will report their longest waiting time, in days, for each service type for one month prior to the reporting period (by Maori and Other ethnicity groups).
A narrative report is also required to:
1. identify the name and location of service(s) with the longest waiting time and waiting list
2. explain variances of more than 10% in waiting times or waiting lists
3. explain/identify targets that the DHB may have for reducing waiting times and/or waiting lists
No quantitative target. Supply of quantitative data required.
Narrative report.
NA Six-Monthly
PP9 Delivery of Te Kokiri: the mental health and addiction action plan
DHBs are to provide a summary report on progress made towards implementation of Te Kokiri: the Mental Health and Addiction Action Plan. A template for this report can be found on the nationwide service framework library web site NSFL homepage: http://nsfl.health.govt.nz.
No quantitative target qualitative deliverable required.
NA Annual
PP10 Oral Health DMFT Score at year 8
Upon the commencement of dental care, at the last dental examination before the child leaves the DHB‟s Community Oral Health Service, the total number of: (i) permanent teeth of children in school Year 8 (12/13-year olds) that are – • Decayed (D), • Missing (due to caries, M), and • Filled (F); and (ii) children who are caries-free (decay-free).
DMFT mean score
Maori 1.80
NA Annual
Other 1.40
Total 1.45
Total
Fluoridated 1.60
Non Fluoridated 1.70
PP11 Children caries free at 5 years of aged
At the first examination after the child has turned five years, but before their sixth birthday, the total number of: (i) children who are caries-free (decay-free); and (ii) primary teeth of children that are – • Decayed (d), • Missing (due to caries, m), and • Filled (f).
Maori 44%
NA Annual
Other 68%
Total 60%
Total
Fluoridated 65.8%
Non-Fluoridated 55.2%
Performance Measure and description 2011/12 Target
National Target Frequency

Appendix B: Performance Measures
Annual Plan 2011/12, 28 June 2011 Page 99
PP12 Utilisation of DHB funded dental services by adolescents
In the year to which the reporting relates, the total number of adolescents accessing DHB-funded adolescent oral health services, defined as: (i) the unique count of adolescent patients‟ completions and non-completions under the Combined Dental Agreement; and (ii) the unique count of additional adolescent examinations with other DHB-funded dental services (e.g. DHB Community Oral Health Services, Maori Oral Health providers and other contracted oral health providers). To reduce duplication of effort, at the end of each quarter in the year to which the reporting relates, the Ministry will organise a data extract from Sector Services for all DHBs for claims made by dentists contracted under the Combined Dental Agreement, and provide this data for DHBs‟ use in determining part (i) of the Numerator.
Total 85%
(n.9,180) 85% Annual
PP13 Improving the number of children enrolled in DHB funded dental services
Measure 1 - In the year to which the reporting relates, the total number of children under five years of age, i.e. aged 0 to 4 years of age inclusive, who are enrolled with DHB-funded oral health services (DHB‟s Community Oral Health Service and other DHB-contracted oral health providers such as Maori oral health providers).
Children Enrolled 0-4 years
5,000
NA Annual
Measure 2 - In the year to which the reporting relates:(i) the total number of pre-school children and primary school children in total and for each school decile who have not been examined according to their planned recall period in DHB-funded dental services (DHB‟s Community Oral Health Service and other DHB-contracted oral health providers such as Maori oral health providers); and(ii) the greatest length of time children has been waiting for their scheduled examination, and the number of children that have been waiting for that period.
Children overdue 0-12 years 1,500
PP14 Family violence prevention
Confirmation report based on audit scores for partner abuse and child abuse and neglect programme components. (Data source: Provided to DHBs by the Auckland University of Technology (AUT) Hospital Responsiveness to Family Violence, Child and Partner Abuse Audit.)
140/200 140/200 Annual
Performance Measure and description 2011/12 Target
National Target Frequency

Appendix B: Performance Measures
Annual Plan 2011/12, 28 June 2011 Page 100
PP15 Improving the safety of elderly: Reducing hospitalisation for falls
The number of people 75 yrs and older hospitalised for falls domiciled in the DHB region, per year.
NA – baseline target to be established in 11/12 year
NA Six-Monthly
PP16 Workforce - Career Planning
The DHB provides quantitative data to demonstrate progress achieved for career planning in their staff. For each of the following categories of staff a measure will be given for Numbers receiving HWNZ funding/ number with career plan for required categories:
Medical staff Nursing Allied technical Maori Health Pacific Pharmacy Clinical rehabilitation Other
No quantitative target. Supply of quantitative data required.
NA Annual
Performance Measure and description 2011/12 Target
National Target Frequency

Appendix B: Performance Measures
Annual Plan 2011/12, 28 June 2011 Page 101
System Integration Dimension
Performance Measure and description 2011/12 Target
National Target Frequency
SI1 Ambulatory sensitive (avoidable) hospital admissions
Each DHB is expected to provide a commentary on their latest 12 month ASH data that‟s available via the nationwide service library. This commentary may include additional district level data that‟s not captured in the national data collection and also information about local initiatives that are intended to reduce ASH admissions. Each DHB should also provide information about how health inequalities are being addressed with respect to this health target, with a particular focus on ASH admissions for Pacific and Maori 45-64 year olds.
Age 0-74 Maori <95%
NA Six-Monthly
Other <103%
Age 0-4
Maori <95%
Other <96%
Age 45-64
Maori <95%
Other <101%
SI2 Regional service planning
A single progress report on behalf of the region agreed by all DHBs within that region. The report should focus on the actions agreed by each region as detailed in its regional implementation plan. For each action the progress report will identify: • the nominated lead DHB/person/position responsible for ensuring the action is delivered • whether actions and milestones are on track to be met or have been met • performance against agreed performance measures and targets • financial performance against budget associated with the action. If actions/milestones/performance measures/financial performance are not tracking to plan, a resolution plan must be provided. The resolution plan should comment on the actions and regional decision-making processes being undertaken to agree to the resolution plan.
No quantitative target qualitative deliverable required.
NA Quarterly
SI3 Service coverage
Report progress achieved during the quarter towards resolution of exceptions to service coverage identified in the DAP, and not approved as long term exceptions, and any other gaps in service coverage identified by the DHB or Ministry through:• analysis of explanatory indicators• media reporting • risk reporting• formal audit outcomes• complaints mechanisms• sector intelligence.
No quantitative target qualitative deliverable required.
NA Six-Monthly

Appendix B: Performance Measures
Annual Plan 2011/12, 28 June 2011 Page 102
Performance Measure and description 2011/12 Target
National Target Frequency
SI4 Elective services standardised intervention rates
For any procedure where the standardised intervention rate in the 2011/12 financial year or 2011 calendar year is significantly below the target level a report demonstrating: 1. what analysis the DHB has done to review the appropriateness of its rate AND 2. whether the DHB considers the rate to be appropriate for its population OR 3. a description of the reasons for its relative under-delivery of that procedure; and 4. the actions being undertaken in the current year (2011/12) that will ensure the target rate is achieved.
Intervention rate 308 per 10,000 308 per 10,000
Major joint replacement procedures 21 per 10,000 21 per 10,000
Hip 10.5 per 10,000 10.5 per 10,000
Knee 10.5 per 10,000 10.5 per 10,000 Six-Monthly
Cataract Procedures 27 per 10,000 27 per 10,000
Cardiac procedures 6.25 per 10,000 6.5 per 10,000
SI5 Expenditure on services provided by Maori Health providers
Measure 1 DHB to report actual expenditure (GST exclusive) on Maori providers by General Ledger (GL) code. No quantitative
target. Supply of quantitative data required.
N/A Annual
Measure 2 DHBs to report actual reported expenditure for Maori providers in comparison to estimated expenditure for Maori providers in their Annual Plan for the same reporting period, with explanation of variances.
SI7 Improving breast-feeding rates
DHBs are expected to set DHB-specific breastfeeding targets with a focus on Maori, Pacific and the total population respectively (see Reducing Inequalities below) to incrementally improve district breastfeeding rates to meet or exceed the National Indicator. DHBs will be expected to maintain and report on appropriate planning and implementation activity to improve the rates of breastfeeding in the district. This includes activity targeted Maori and Pacific communities. The Ministry will provide breastfeeding data sourced from Plunket, and DHBs must provide data from non-Plunket Well Child providers. DHBs are to report providing the local data from non-Plunket Well Child providers.
6 weeks
Maori 62.0%
74%
Annual
Other 70.0%
Total 67.0%
3 Months
Maori 46.0%
57% Other 59.0%
Total 55.0%
6 Months
Maori 18.0%
27%
Other 29.0%
Total 26.0%

Appendix B: Performance Measures
Annual Plan 2011/12, 28 June 2011 Page 103
Ownership Dimension
Performance Measure and description 2011/12 Target
National Target Frequency
OS3 Elective and arranged inpatient length of stay
The standardised ALOS is the ratio of „actual‟ to „expected‟ ALOS, multiplied by the nationwide inpatient ALOS. The DHB‟s „actual‟ ALOS, and the nationwide inpatient ALOS, are both defined as the total bed days for hospital patients discharged during the 12 months to the end of the quarter, divided by the total number of discharges for hospital patients (excluding day patients) during the 12 months to the end of the quarter. The „expected‟ ALOS is derived by taking the nation-wide ALOS for each grouping of patient discharges defined by DRG cluster and co-morbidities, multiplying this by the proportion of total discharges this group represents, and summing the result across all discharge groups.
4.00 days NA Quarterly
OS4 Acute inpatient length of stay
The standardised ALOS is the ratio of „actual‟ to „expected‟ ALOS, multiplied by the nationwide inpatient ALOS. The DHB „actual‟ ALOS, and nationwide inpatient ALOS, are both defined as the total bed days for hospital patients discharged during the 12 months to the end of the quarter, divided by the total number of discharges for hospital patients (excluding day patients) during the 12 months to the end of the quarter. The „expected‟ ALOS is derived by taking the nationwide ALOS for each grouping of patient discharges defined by DRG cluster and co-morbidities, multiplying this by the proportion of total discharges this group represents for the DHB, and summing the result across all discharge groups.
4.15 days NA Quarterly
OS5 Theatre Utilisation
Each quarter, the DHB is required to submit the following data elements, represented as a total of all theatres in each Provider Arm facility. - actual theatre utilisation, - resourced theatre minutes, - actual minutes used as a percentage of resourced utilisation The expectation is that DHBs will supply information on the template quarterly. Baseline performance should be identified as part of the establishment of the target. The goal for 2011/12 will be one of the following: a. For DHBs whose overall utilisation is less than 85%, a target that is a substantial incremental step towards achieving the 85% target is recommended b. For DHBs whose overall utilisation is 85% or better, a target that is a small improvement over current performance is recommended
>90% 85% Quarterly

Appendix B: Performance Measures
Annual Plan 2011/12, 28 June 2011 Page 104
Performance Measure and description 2011/12 Target
National Target Frequency
OS6 Elective and arranged day surgery
The standardised day surgery rate is the ratio of the „actual‟ to „expected‟ day surgery rate, multiplied by the nationwide day surgery rate, expressed as a percentage. The DHBs „actual‟ day surgery rate, and the nationwide day surgery rate, are both defined as the number of day surgery discharges for the 12 months to the end of the quarter (for elective and arranged surgical patients), divided by the total number of surgical discharges in the 12 months to the end of the quarter (for elective and arranged surgical patients). The „expected‟ day surgery rate is derived by taking the nationwide day surgery rate for discharges in each DRG, multiplying this by the proportion of total discharges the DRG represents for the DHB, and summing the result across all DRGs.
>60% 62% Standardised Quarterly
OS7 Elective and arranged day of surgery admissions
The number of DOSA discharges, for elective and arranged surgical patients (excluding day surgical cases) during the 12 months to the end of the quarter, divided by the total number of discharges for elective and arranged surgical patients (excluding day surgical cases) for the 12 months to the end of the quarter, to give the DOSA rate as a percentage.
>95% 90% Standardised Quarterly
OS8 Acute readmissions to hospital
The standardised acute readmission rate is the ratio of the „actual‟ to „expected‟ acute readmission rate, multiplied by the nationwide acute readmission rate, expressed as a percentage. The DHB‟s „actual‟ acute readmission rate, and the nationwide acute readmission rate, are defined as the number of unplanned acute readmissions to hospital within 28 days of a previous inpatient discharge that occurred within the 12 months to the end of the quarter, as a proportion of inpatient discharges in the 12 months to the end of the quarter. The „expected‟ acute readmission rate is derived using regression methods from the DRG cluster and patient population characteristics of the DHB.
<10% NA Quarterly
OS9 30 Day mortality
The measure is for a standardised mortality rate, in order to improve the comparability of the measure across the sector. The standardised mortality rate is the ratio of the „actual‟ to „expected‟ mortality rates, multiplied by the nationwide mortality rate, expressed as a percentage. The DHB‟s „actual‟ mortality rate, and the nationwide mortality rate, are both defined as the number of in-hospital patient deaths within 30 days of admission, as a proportion of all patient discharges, including daycases. The „expected‟ mortality rate is derived using regression methods from the DRG and patient population characteristics of the DHB.
<1.4% NA Annual

Appendix B: Performance Measures
Annual Plan 2011/12, 28 June 2011 Page 105
Performance Measure and description 2011/12 Target
National Target Frequency
OS10 Improving the quality of data provided to national collection systems
Measure 1: National Health Index (NHI) duplications Numerator: Number of NHI duplicates that require merging by Data Management per DHB per quarter. The Numerator excludes pre-allocated NHIs and NHIs allocated to newborns and is cumulative across the quarter. Denominator: Total number of NHI records created per DHB per quarter (excluding pre-allocated NHIs and newborns)
<6% <6%
Quarterly
Measure 2: Ethnicity set to „Not stated‟ or „Response Unidentifiable‟ in the NHI Numerator: Total number of NHI records created with ethnicity of „Not Stated‟ or „Response Unidentifiable‟ per DHB per quarter Denominator: Total number of NHI records created per DHB per quarter
<2% <2%
Measure 3: Standard versus specific diagnosis code descriptors in the National Minimum Data Set (NMDS) Numerator: Number of versions of text descriptor for specific diagnosis codes (M00-M99, S00-T98, U50 to Y98) per DHB Denominator: Total number of specific diagnosis codes (M00-M99, S00-T98, U50 to Y98) per DHB
>55% >55%
Measure 4: Timeliness of NMDS data Numerator: Total number of publicly funded NMDS events loaded into the NMDS more than 21 days post month of discharge. Denominator: Total number of publicly funded NMDS events in the NMDS per DHB per quarter.
<5% <5%
Measure 5: NNPAC Emergency Department admitted events have a matched NMDS event Numerator: Total number of NNPAC Emergency Department admitted events that have a matching NMDS event Denominator: Total number of NNPAC Emergency Department admitted events
>97% >97%
Measure 6: PRIMHD File Success RateNumerator: Number of PRIMHD records successfully submitted by the DHB in the quarterDenominator: Total number of PRIMHD records submitted by the DHB in the quarter
>98% >98%

Appendix C: ALSL Financial Statements
Annual Plan 2011/12, 28 June 2011 Page 106
Appendix C: Allied Laundry Services Limited – Financial Statements & Accounting Policy
Allied Laundry Services Ltd
Actual Forecast Budget
Statement of Financial Performance 2009/10 2010/11 2011/12
$000 $000 $000
Revenue 6,418 6,313 6,318
Expenditure
Processing 4,137 4,098 4,060
Service Items 660 700 731
Delivery 681 689 710
Selling / Administration 242 221 200
Overhead Allocation 238 239 238
Total Linen Supply Expenditure 5,958 5,947 5,939
Linen Supply Surplus 460 366 379
Non-operating Expenditure 256 284 271
Net Surplus / (Deficit) 204 82 108

Appendix C: ALSL Financial Statements
Annual Plan 2011/12, 28 June 2011 Page 107
Allied Laundry Services Ltd
Actual Forecast Budget
Cash Flow 2009/10 2010/11 2011/12
$000 $000 $000
Total Receipts 6,181 6,313 6,318
Total Payments (4,873) (5,066) (5,096)
Operating Cashflow 1,308 1,247 1,222
Investing Cashflow (1,054) (930) (936)
Financing Cashflow (232) 118 (245)
Net Cashflow 22 435 41
Opening Cash (333) (311) 124
Closing Cash (311) 124 165
Allied Laundry Services Ltd
Actual Forecast Budget
Statement of Financial Position 2009/10 2010/11 2011/12
$000 $000 $000
Current Assets 675 925 975
Current Liabilities 1,319 1,257 1,026
Working Capital (644) (332) (51)
Non current assets 4,434 3,999 3,621
Assets Employed 3,790 3,667 3,570
Non Current Liabilities 586 381 176
Equity 3,204 3,286 3,394
Funds Employed 3,790 3,667 3,570
General Accounting Policies
The general accounting policies recognised as appropriate for the measurement and reporting of results, cashflows and financial position, under the historical cost method, have been followed in the preparation of these financial statements.
Differential Reporting
The company qualifies for differential reporting as it is not publicly accountable and there is no separation between the owners and the governing body. The company has taken advantage of all differential reporting exemptions with the exception of FRS-10 Statement of Cash Flows.
Particular Accounting Policies
The following particular accounting policies, which materially affect the measurement of profit and financial position, have been applied.
Revenue
Revenue shown in the Statement of Financial Performance comprise the amounts received and receivable by the business for goods and services supplied to customers in the ordinary course of business.
Depreciation
Depreciation is calculated at the maximum rates approved for taxation purposes. The rates are as follows:

Appendix C: ALSL Financial Statements
Annual Plan 2011/12, 28 June 2011 Page 108
Category Rate Method
Linen 33% Straight line
Plant 10-40% Straight line
Office Equipment 18.6% Straight line
Work in progress is not depreciated. The total cost of a project is transferred to property and/or plant and equipment on its completion and then depreciated.
Taxation
The Company is exempt from income tax under Section 38(2) of the Income Tax Act 2007.
Inventories
Inventory is stated at the lower of cost or market selling value. Cost is determined on a first in, first out basis.
Accounts Receivable
Accounts receivable are stated at estimated realistic value, after due allowance for amounts which are not considered recoverable.
Goods and Services Tax (GST)
All revenue and expense transactions are recorded exclusive of GST. Where applicable, all assets and liabilities have been stated exclusive of GST with the exception of receivables and payables which are stated inclusive of GST.
Property, Plant and Equipment
The cost of purchased assets is the value of consideration given to acquire the assets and the value of other directly attributable costs which have been incurred in bringing the assets to the location and condition necessary for their intended service. Costs include financing costs that are directly attributable to the purchase of those assets.
Impairment
All items of property, plant and equipment are assessed for impairment at each reporting date. Where the carrying amount is assessed to be greater than its recoverable amount, the item is written down. The writedown is recognised in the Statement of Financial Performance.
Provisions
All provisions are recorded at the best estimate of the expenditure required to settle the obligation at balance sheet date. Where the effect is material, the expected expenditure are discounted to their present value using pre-tax discount rates.
Leased Assets
Operating lease payments are representative of the pattern of benefits derived from the leased assets and accordingly are charged to the Statement of Financial Performance in the periods in which they occur.
Leases under which the entity assumes substantially all the risks and rewards incidental to ownership have been classified as finance leases and are capitalised. The asset and corresponding liability are recorded at inception of the lease at the fair value of the leased asset, at amounts equivalent to the discounted present value of the minimum lease payments including residual values.
Finance charges are apportioned over the terms of the respective leases using the rule of 78 method.
Capitalised leased assets are depreciated over their expected lives in accordance with rates established for other similar assets of the entity.
Statement of Cash Flows
The Statement of Cash Flows is prepared exclusive of GST, which is consistent with the method used in the Statement of Financial Performance.
The following are definitions of the terms used in the Statement of Cash Flows:

Appendix C: ALSL Financial Statements
Annual Plan 2011/12, 28 June 2011 Page 109
Cash is considered to be cash on hand, current account in banks, and other highly liquid investments in which the entity invests as part of its day to day cash management. Cash includes borrowings from financial institutions such as bank overdrafts, where such borrowings are at call and are used as part of day to day cash management.
Investing activities are those activities relating to the acquisition, holding and disposal of fixed assets and of investments. Investments can include securities not falling within the definition of cash.
Financing activities are those activities which result in changes in the size and composition of the capital structure of the group. This includes both equity and debt not falling within the definition of cash. Dividends paid in relation to the capital structure are included in financing activities.
Operating activities includes all transactions and other events that are not financing or investing activities.
The reconciliation of the surplus (deficit) after tax with the net cash flow from operating activities is set out in the Statement of Cash Flows.
Comparative Figures
Where necessary, comparative information has been reclassified to achieve consistency in disclosure with the current year.
Changes in Accounting Policies
There has been no material changes in the accounting policies applied during the period covered by these financial statements. All policies have been applied on a basis consistent with the previous year.

Appendix D: Schedule of Related Documents
Annual Plan 2011/12, 28 June 2011 Page 110
Appendix D: Schedule of Related Documents
Document Access
National Documents Business Case Guidelines for Investment in Information Technology www.moh.govt.nz
Crown Entities Act 2004 www.legislation.govt.nz
Crown Funding Agreement www.moh.govt.nz
DHB Reporting Requirements 2011/12 Ministry of Health, PO Box 5013, Wellington 6011
Guidelines for Capital Investment www.moh.govt.nz
Health & Disability Sector (Safety) Act 2000 www.legislation.govt.nz
Minister of Health‟s Letter of Expectations MidCentral DHB, PO box 5013, Palmerston North 4440
Nationwide Service Framework Ministry of Health, PO Box 5013, Wellington 6011
New Zealand Disability Strategy www.moh.govt.nz
New Zealand Health & Disabilities Act 2000 www.legislation.govt.nz
New Zealand Health Strategy www.moh.govt.nz
Operational Policy Framework Ministry of Health, PO Box 5013, Wellington 6011
Service Coverage Schedule Ministry of Health, PO Box 5013, Wellington 6011
State Sector Act 1988 www.legislation.govt.nz
Strengthening our Hospital Services www.moh.govt.nz
Treaty of Waitangi www.waitangi-tribunal.govt.nz
Regional Documents Central Region‟s Information Systems Plan www.midcentraldhb.govt.nz
Regional Maori Health Plan www.centraltas.co.nz
Regional Mental Health Strategy www.centraltas.co.nz
Regional Services Plan www.midcentraldhb.govt.nz
Local Documents Child & Adolescent Oral Health Business Case www.midcentraldhb.govt.nz
2011/12 Annual Plan Funding Arrangements www.midcentraldhb.govt.nz
Better, Sooner, More Convenient Primary Health Care Business Case www.midcentraldhb.govt.nz
Health Needs Assessment www.midcentraldhb.govt.nz
Information Systems Disaster Recovery Plan MidCentral DHB, PO Box 2056, Palmerston North 4410
Maori Health Plan www.midcentraldhb.govt.nz
Maori Health Workforce Action Framework MidCentral DHB, PO Box 5013, Palmerston North 4440
MidCentral Health‟s Clinical Services Plan www.midcentraldhb.govt.nz

Appendix E: Statement of Accounting Policies
Annual Plan 2011/12, 28 June 2011 Page 111
Appendix E: Statement of Accounting Policies
Reporting Entity
MidCentral District Health Board (MidCentral DHB) is a Crown entity in terms of the Crown Entities Act 2004, is owned by the Crown, and is domiciled in New Zealand. MidCentral DHB was created under the New Zealand Public Health and Disability Act 2000, effective 1 January 2001.
The Group consists of MidCentral DHB, associated entity Allied Laundry Services Limited (ALSL) (25.0% owned) and an investment in Central Region‟s Technical Advisory Service Limited (TAS) (16.7% owned). In addition, the group includes wholly owned subsidiary Enable New Zealand Limited, which is non-trading. As of November 2002 all the assets, liabilities and activities of Enable New Zealand Ltd were vested in the MidCentral District Health Board. As a result of this Enable New Zealand Ltd has no balances as at 30 June 2010 (2009: nil). The group numbers are therefore the same as the parent numbers.
The financial statements and group financial statements of MidCentral DHB have been prepared in accordance with the requirements of New Zealand Public Health and Disability Act 2000, the Financial Reporting Act 1993, the Public Finance Act 1989, and the Crown Entities Act, 2004.
MidCentral DHB is a public benefit entity, as defined under NZ IAS 1 - Presentation of Financial Statements.
MidCentral DHB‟s activities involve delivering health and disability services and mental health services in a variety of ways to the community.
Statement of Compliance and Basis of Preparation
The consolidated financial statements have been prepared in accordance with Generally Accepted Accounting Practice in New Zealand (NZ GAAP). They comply with the New Zealand equivalents to International Financial Reporting Standards (NZ IFRS), and other applicable Financial Reporting Standards as appropriate for Public Benefit Entities.
The financial statements are presented in New Zealand Dollars (NZD), rounded to the nearest thousand. The financial statements are prepared on the historical cost basis except that the following assets and liabilities are stated at their fair value: land and buildings, and derivative financial instruments (foreign exchange contract).
The accounting policies set out below have been applied consistently to all periods presented in these consolidated financial statements.
The preparation of financial statements in conformity with NZ IFRS requires management to make judgements, estimates and assumptions that affect the application of policies and reported amounts of assets and liabilities, income and expenses. The estimates and associated assumptions are based on historical experience and various other factors that are believed to be reasonable under the circumstances, the results of which form the basis of making the judgements about carrying values of assets and liabilities that are not readily apparent from other sources. Actual results may differ from these estimates.
The estimates and underlying assumptions are reviewed on an ongoing basis. Revisions to accounting estimates are recognised in the period in which the estimate is revised if the revision affects only that period, or in the period of the revision and future periods if the revision affects both current and future periods.
Judgements made by management in the application of NZ IFRS that have significant effect on the financial statements and estimates with a significant risk of material adjustment in the next year are discussed in Note 27.
Basis for Consolidation
Associates
Associates are those entities in which MidCentral DHB has significant influence, but not control, over the financial and operating policies. ALSL is an associate company of MidCentral DHB.
The consolidated financial statements include MidCentral DHB‟s share of the total recognised gains and losses of associates on an equity accounted basis, from the date that significant influence commences until the date that significant influence ceases. When MidCentral DHB‟s share of losses exceeds its interest in an associate, MidCentral DHB‟s carrying amount is reduced to nil and recognition of further losses is discontinued except to the extent that MidCentral DHB has incurred legal or constructive obligations or made payments on behalf of an associate.
Investments in associates are recorded using the equity method in the parent‟s financial statements.
Transactions Eliminated on Consolidation
Intragroup balances and any unrealised gains and losses or income and expenses arising from intragroup transactions, are eliminated in preparing the consolidated

Appendix E: Statement of Accounting Policies
Annual Plan 2011/12, 28 June 2011 Page 112
financial statements. Unrealised gains arising from transactions with associates and jointly controlled entities are eliminated to the extent of MidCentral DHB‟s interest in the entity. Unrealised losses are eliminated in the same way as unrealised gains, but only to the extent that there is no evidence of impairment.
Foreign Currency Transactions
Transactions in foreign currencies are translated at the foreign exchange rate ruling at the date of the transaction. Monetary assets and liabilities denominated in foreign currencies at the balance sheet date are translated to NZD at the foreign exchange rate ruling at that date. Foreign exchange differences arising on translation are recognised in profit or loss in the Statement of Comprehensive Income. Non-monetary assets and liabilities that are measured in terms of historical cost in a foreign currency are translated using the exchange rate at the date of the transaction. Non-monetary assets and liabilities denominated in foreign currencies that are stated at fair value are translated to NZD at foreign exchange rates ruling at the dates the fair value was determined. The associated foreign exchange gains or losses follow the fair value gains or losses to either profit or loss or directly to equity.
Budget Figures
The budget figures are those approved by the health board in its District Annual Plan and included in the Statement of Intent tabled in Parliament. The budget figures have been prepared in accordance with NZ GAAP. They comply with NZ IFRS and other applicable Financial Reporting Standards as appropriate for public benefit entities. Those standards are consistent with the accounting policies adopted by MidCentral DHB for the preparation of these financial statements.
Property, Plant and Equipment
Classes of Property, Plant & Equipment The major classes of property, plant and equipment are as follows:
freehold land freehold buildings plant, equipment and vehicles work in progress fixtures and fittings.
Owned Assets
Except for land and buildings and the assets vested from the hospital and health service (see below), items of property, plant and equipment are stated at cost, less accumulated depreciation and impairment losses. The cost of self-constructed assets includes the cost of materials, direct labour, the initial estimate, where relevant, of the costs of dismantling and removing the items and restoring the site on which they are located, and an appropriate proportion of direct overheads.
Land and buildings are revalued to fair value as determined by an independent registered valuer every three years. Valuations undertaken in accordance with
generally accepted accounting practice and standards issued by the New Zealand Property Institute are used where available. Otherwise, valuations are conducted in accordance with the Rating Valuation Act 1998, which have been confirmed by an independent valuer. Any increase in value of a class of land and buildings is recognised directly in equity unless it offsets a previous decrease in value recognised in profit or loss. Any decreases in value relating to a class of land and buildings are debited directly to the revaluation reserve, to the extent that they reverse previous surpluses and are otherwise recognised as an expense in the profit or loss.
Additions to property, plant and equipment between valuations are recorded at cost.
Where material parts of an item of property, plant and equipment have different useful lives, they are accounted for as separate components of property, plant and equipment.
Rental property is included in property plant and equipment in accordance with NZ IFRS as the rental property is held for strategic and social purposes rather than for rental income, capital appreciation or both.
Disposal of Property, Plant & Equipment Where an item of plant and equipment is disposed of, the gain or loss recognised in profit or loss is calculated as the difference between the net sales price and the carrying amount of the asset.
Leased Assets Leases where MidCentral DHB assumes substantially all the risks and rewards of ownership are classified as finance leases. The assets acquired by way of finance lease are stated at an amount equal to the lower of their fair value and the present value of the minimum lease payments at inception of the lease, less accumulated depreciation and impairment losses. The capitalised values are depreciated over the period in which the DHB expects to receive benefits from their use. Operating leases, where the lessor substantially retains the risks and rewards of ownership, are recognised in a systematic manner over the term of the lease. Leasehold improvements are capitalised and the cost is depreciated over the lease or the estimated useful life of the improvements, whichever is the shorter.
Subsequent Costs Subsequent costs are added to the carrying amount of an item of property, plant and equipment when that cost is incurred if it is probable that the service potential or future economic benefits embodied within the new item will flow to MidCentral DHB. All other costs are recognised in profit or loss as an expense as incurred.
Depreciation Depreciation is charged to profit or loss using the straight line method. Land and work in progress is not depreciated.

Appendix E: Statement of Accounting Policies
Annual Plan 2011/12, 28 June 2011 Page 113
Depreciation is set at rates that will write off the cost or fair value of the assets, less their estimated residual values, over their useful lives. The estimated useful lives of major classes of assets and resulting rates are as follows:
Class of Asset Estimated Life
Freehold Buildings 1 to 80 years
Plant, Equipment and Motor Vehicles 3 to 20 years
Fixtures and Fittings 3 to 25 years
The residual value of assets are reassessed annually.
Work in progress is not depreciated. The total cost of a project is transferred to the appropriate class of asset on its completion and then depreciated.
Accumulated depreciation at revaluation date is eliminated against the gross carrying amount so that the carrying amount after revaluation equals the revalued amount.
For each property, plant and equipment project, borrowing costs incurred during the period required to complete and prepare the asset for its intended use are expensed.
Intangible Assets
Intangible assets that are acquired by MidCentral DHB are stated at cost less accumulated amortisation and impairment losses.
Subsequent Expenditure Subsequent expenditure on intangible assets is capitalised only when it increases the service potential or future economic benefits embodied in the specific asset to which it relates. All other expenditure is expensed as incurred.
Amortisation Amortisation is charged to profit or loss on a straight-line basis over the estimated useful lives of intangible assets unless such lives are indefinite. Intangible assets with indefinite useful lives are tested for impairment at least annually to determine if there is any indication of impairment. Other intangible assets are amortised from the date they are available for use. The estimated useful lives are as follows:
Type of Asset Estimated Life
Software to 10 years
Realised gains and losses arising from disposal of intangible assets are recognised in profit or loss in the period in which the transaction occurs.
Financial Assets and Liabilities
Financial Assets Financial assets are classified into the following specified categories. Financial assets “at fair value through profit or loss” (FVTPL), “held to maturity” investments, “available for sale” financial assets, and “loans and receivables”. The
classification depends on the nature and purpose of the financial assets and is determined at the time of initial recognition. At balance date MidCentral DHB had “held to maturity investments”, “loans and receivables” and “assets held for trading: financial instruments”.
Effective Interest Method The effective interest method is a method of calculating the amortised cost of a financial asset and of allocating interest income over the relevant period. The effective interest rate is the rate that exactly discounts estimated future cash receipts through the expected life of the financial asset, or where appropriate, a shorter period, to the net carrying amount of the financial asset.
Loans & Receivables
Cash, short term deposits and trade and other receivables with fixed or determinable payments that are not quoted in an active market are classified as loans and receivables. Loans and receivables are initially recognised at fair value and subsequently measured at amortised cost using the effective interest method, less any impairment. Interest income is recognised by applying the effective interest rate method.
Held to Maturity Investments Term deposits with fixed or determinable payments and maturity dates that the group has the positive intent and ability to hold to maturity are classified as held to maturity investments. Held to maturity investments are initially recorded at fair value and subsequently measured at amortised cost using the effective interest method, less any impairment, with revenue recognised on an effective interest method. Investments are classified as “held to maturity” investments.
Financial Assets at FVTPL Financial assets are classified as at FVTPL where the financial asset is either held for trading or it is designated as at FVTPL.
A financial asset is classified as held for trading if:
it has been acquired principally for the purpose of selling in the near future; or on initial recognition it is part of an identified portfolio of financial instruments
that the group manages together and has a recent actual pattern of short-term profit-taking; or
it is a derivative that is not designated and effective as a hedging instrument.
Financial assets at FVTPL are stated at fair value, with any resultant gain or loss recognised in profit or loss. The net gain or loss recognised in profit or loss incorporates any dividend or interest earned on the financial asset. Fair value is determined in the manner described in note 21. Derivative financial assets are considered to be financial assets held for trading and are classified as “other financial assets” in the Statement of Financial Position.

Appendix E: Statement of Accounting Policies
Annual Plan 2011/12, 28 June 2011 Page 114
Impairment of Financial Assets Financial assets other than those at fair value through profit or loss are assessed for indicators of impairment at each balance sheet date. Financial assets are impaired where there is objective evidence that as a result of one or more events that occurred after the initial recognition of the financial asset the estimated future cash flows of the asset have been impacted. For financial assets carried at amortised cost, the amount of impairment is the difference between carrying amount and the present value of the estimated future cash flows, discounted at the original effective interest rate.
The carrying amount of the financial asset is reduced by the impairment loss directly for all financial assets with the exception of trade receivables where the carrying amount is reduced through the use of an allowance account. Subsequent recoveries of amounts previously written off are credited against the allowance account. Changes in the carrying amount of the allowance account are recognised in profit or loss.
If in a subsequent period, the amount of the impairment loss decreases and the decrease can be related objectively to an event occurring after the impairment was recognised, the previously recognised impairment loss is reversed through profit or loss to the extent that the carrying amount of the investment at the date of impairment is reversed does not exceed what the amortised cost would have been had the impairment not been recognised.
Financial Liabilities Financial liabilities are classified as either financial liabilities “at FVTPL” or “other financial liabilities”.
Financial Liabilities at FVTPL Financial liabilities are classified as at FVTPL where the financial liability is either held for trading or it is designated as at FVTPL. A financial liability is classified as held for trading if:
it has been incurred principally for the purpose of repurchasing in the near future; or
it is part of an identified portfolio of financial instruments that the Group manages together and has a recent actual pattern of short-term profit-taking; or
it is a derivative that is not designated and effective as a hedging instrument.
A financial liability other than a financial liability held for trading may be designated as at FVTPL upon initial recognition if:
such designation eliminates or significantly reduces a measurement or recognition inconsistency that would otherwise arise; or
the financial liability forms part of a group of financial assets or financial liabilities or both, which is managed and its performance is evaluated on a fair value basis, in accordance with the Group's documented risk management or
investment strategy, and information about the grouping is provided internally on that basis; or
it forms part of a contract containing one or more embedded derivatives, and NZ IAS 39 Financial Instruments: Recognition and Measurement permits the entire combined contract (asset or liability) to be designated as at FVTPL.
Financial liabilities at FVTPL are stated at fair value, with any resultant gain or loss recognised in profit or loss. The net gain or loss recognised in profit or loss incorporates any interest paid on the financial liability.
Other Financial Liabilities Other financial liabilities, including interest bearing loans and borrowings and other payables, are initially measured at fair value, net of transaction costs.
Other financial liabilities are subsequently measured at amortised cost using the effective interest method, with interest expense recognised on an effective interest basis.
Derecognition of Financial Liabilities MidCentral DHB derecognises financial liabilities when, and only when, the DHB's obligations are discharged, cancelled or they expire.
Derivative Financial Instruments The Group enters into a variety of derivative financial instruments to manage its exposure to foreign exchange rate risk. Further details of derivative financial instruments are disclosed in note 21.
Derivatives are initially recognised at fair value at the date a derivative contract is entered into and are subsequently remeasured to their fair value at each balance sheet date. The resulting gain or loss is recognised in profit or loss immediately unless the derivative is designated and effective as a hedging instrument. MidCentral DHB does not have any derivatives that are designated and effective as hedging instruments.
A derivative is presented as a non-current asset or a non-current liability if the remaining maturity of the instrument is more than 12 months and it is not expected to be realised or settled within 12 months. Other derivatives are presented as current assets or current liabilities.
Inventories Held for Distribution Inventories held for distribution are stated at the lower of cost and current replacement cost.
Cash & Cash Equivalents
Cash and cash equivalents comprises cash balances, call deposits and deposits with a maturity of no more than three months from the date of acquisition. Bank overdrafts that are repayable on demand and form an integral part of MidCentral DHB‟s cash management are included as a component of cash and cash equivalents for the purpose of the Statement of Cash Flows and the Statement of Financial Position.

Appendix E: Statement of Accounting Policies
Annual Plan 2011/12, 28 June 2011 Page 115
Impairment of Other Tangible Assets The carrying amounts of MidCentral DHB‟s assets other than inventories and inventories held for distribution are reviewed at each balance date to determine whether there is any indication of impairment. If any such indication exists, the assets‟ recoverable amounts are estimated.
If the estimated recoverable amount of an asset is less than its carrying amount, the asset is written down to its estimated recoverable amount and an impairment loss is recognised in profit or loss.
For intangible assets that have an indefinite useful life and intangible assets that are not yet available for use, the recoverable amount is estimated at each balance sheet date.
An impairment loss on property, plant and equipment revalued on a class of asset basis is recognised directly against any revaluation reserve in respect of the same class of asset to the extent that the impairment loss does not exceed the amount in the revaluation reserve for the same class of asset.
When a decline in the fair value of an available-for-sale financial asset has been recognised directly in equity and there is objective evidence that the asset is impaired, the cumulative loss that had been recognised directly in equity is recognised in profit or loss even though the financial asset has not been derecognised. The amount of the cumulative loss that is recognised in profit or loss is the difference between the acquisition cost and current fair value, less any impairment loss on that financial asset previously recognised in profit or loss.
The recoverable amount of MidCentral DHB‟s receivables carried at amortised cost is calculated as the present value of estimated future cash flows, discounted at the original effective interest rate (ie the effective interest rate computed at initial recognition of these financial assets). Receivables with a short duration are not discounted.
Impairment losses on an individual basis are determined by an evaluation of the exposures on an instrument by instrument basis. All individual trade receivables that are considered significant are subject to this approach. For trade receivables which are not significant on an individual basis, collective impairment is assessed on a portfolio basis based on numbers of days overdue, and taking into account the historical loss experience in portfolios with a similar amount of days overdue.
Calculation of Recoverable Amount
The estimated recoverable amount of receivables carried at amortised cost is calculated as the present value of estimated future cash flows, discounted at their original effective interest rate. Receivables with a short duration are not discounted.
Estimated recoverable amount of other assets is the greater of their fair value less costs to sell and value in use. Value in use is calculated differently depending on whether an asset generates cash or not. For an asset that does not generate largely independent cash inflows, the recoverable amount is determined for the cash-generating unit to which the asset belongs.
For non-cash generating assets that are not part of a cash generating unit value in use is based on depreciated replacement cost (DRC). For cash generating assets value in use is determined by estimating future cash flows from the use and ultimate disposal of the asset and discounting these to their present value using a pre-tax discount rate that reflects current market rates and the risks specific to the asset.
Impairment gains and losses, for items of property, plant and equipment that are revalued on a class of assets basis, are also recognised on a class basis.
Reversals of Impairment Impairment losses are reversed when there is a change in the estimates used to determine the recoverable amount.
An impairment loss on an equity instrument investment classified as available-for-sale or on items of property, plant and equipment carried at fair value is reversed through the relevant reserve. All other impairment losses are reversed through profit or loss.
An impairment loss is reversed only to the extent that the asset‟s carrying amount does not exceed the carrying amount that would have been determined, net of depreciation or amortisation, if no impairment loss had been recognised.
Borrowing Costs Borrowing costs are recognised in profit or loss in the period in which they are incurred. MidCentral DHB has chosen to defer the application of NZ IAS 23 (revised 2008) and expense borrowing costs in accordance with NZ IAS 23 (2004).
Employee Benefits
Defined Contribution Plans Obligations for contributions to defined contribution plans are recognised as an expense in profit or loss as incurred.
There are a small number of employees that are part of a state defined benefit superannuation plan. The DHB has no legal or constructive obligation to pay future benefits, the Crown guarantees these benefits and as a result the plans are accounted for as a defined contribution plan.
Long Service Leave, Sabbatical Leave and Retirement Gratuities MidCentral DHB‟s net obligation in respect of long service leave, sabbatical leave and retirement gratuities is the amount of future benefit that employees have earned in return for their service in the current and prior periods. The obligation is calculated using the projected unit credit method and is discounted to its present value. The discount rate is the market yield on relevant New Zealand government bonds at the balance sheet date.
Annual Leave, Conference Leave, Sick Leave & Medical Education Leave Annual leave, conference leave, sick leave and medical education leave are short-term obligations and are calculated on an actual basis at the amount MidCentral

Appendix E: Statement of Accounting Policies
Annual Plan 2011/12, 28 June 2011 Page 116
DHB expects to pay. MidCentral DHB accrues the obligation for paid absences when the obligation both relates to employees‟ past services and it accumulates.
Termination Payments
Termination Payments are recognised in profit or loss only where there is a demonstrable commitment to either terminate employment prior to normal retirement date or to provide such benefits as a result of an offer to encourage voluntary redundancy. Termination benefits settled in 12 months are reported as the amount expected to be paid, otherwise they are reported as the present value of the estimated future cash flows.
Provisions
A provision is recognised when MidCentral DHB has a present legal or constructive obligation as a result of a past event, and it is probable that an outflow of economic benefits will be required to settle the obligation. If the effect is material, provisions are determined by discounting the expected future cash flows at a pre-tax rate that reflects current market rates and, where appropriate, the risks specific to the liability.
Restructuring A provision for restructuring is recognised when MidCentral DHB has approved a detailed and formal restructuring plan, and the restructuring has either commenced or has been announced publicly. Future operating costs are not provided for.
Revenue Relating to Service Contracts
MidCentral DHB is required to expend all monies appropriated within certain contracts during the year in which it is appropriated. Should this not be done, the contract may require repayment of the money or MidCentral DHB, with the agreement of the Ministry of Health, may be required to expend it on specific services in subsequent years. The amount unexpended is recognised as a liability where there is sufficient certainty of a specific obligation to repay.
Other Liabilities & Provisions Other liabilities and provisions are recorded at the best estimate of the expenditure required to settle the obligation. Liabilities and provisions to be settled beyond 12 months are recorded at their present value.
Insurance Contracts MidCentral DHB belongs to the ACC Partnership Programme whereby it accepts the management and financial responsibility for employee work related illnesses and accidents. Under the programme MidCentral DHB is liable for all its claims costs for a period of two years up to a specified maximum. At the end of the two year period, MidCentral DHB pays a premium to ACC for the value of residual claims, and from that point the liability for ongoing claims passes to ACC. The liability for the ACC Partnership Programme is measured using actuarial techniques at the present value of expected future payments to be made in respect of the employee injuries and claims up to the reporting date. Consideration is
given to anticipated future wage and salary levels and experience of employee claims and injuries. Expected future payments are discounted using market yields on government bonds at balance date with terms to maturity that match, as closely to possible, the estimated future cash outflows.
Taxation
Income Tax MidCentral DHB is a crown entity under the New Zealand Public Health and Disability Act 2000 and is exempt from income tax under section CW38 of the Income Tax Act 2007.
Goods & Services Tax
All amounts are shown exclusive of Goods and Services Tax (GST), except for receivables and payables that are stated inclusive of GST. Where GST is irrecoverable as an input tax, it is recognised as part of the related asset or expense.
Revenue
Crown Funding The majority of revenue is provided through an appropriation in association with a Crown Funding Agreement. Revenue is recognised monthly in accordance with the Crown Funding Agreement payment schedule, which allocates the appropriation equally throughout the year. Revenue from the supply of goods and services is measured at the fair value of consideration received.
Goods Sold & Services Rendered
Revenue from goods sold is recognised when MidCentral DHB has transferred to the buyer the significant risks and rewards of ownership of the goods and MidCentral DHB does not retain either continuing managerial involvement to the degree usually associated with ownership nor effective control over the goods sold.
Revenue from services is recognised, to the proportion that a transaction is complete, when it is probable that the payment associated with the transaction will flow to MidCentral DHB and that payment can be measured or estimated reliably, and to the extent that any obligations and all conditions have been satisfied by MidCentral DHB.
Rental Income
Rental income from strategic assets/assets held for social benefit is recognised in profit or loss on a straight-line basis over the term of the lease. Lease incentives granted are recognised as an integral part of the total rental income over the lease term on a straight- line basis.
Expenses
Operating Lease Payments Payments made under operating leases are recognised in profit or loss on a straight-line basis over the term of the lease. Lease incentives received are

Appendix E: Statement of Accounting Policies
Annual Plan 2011/12, 28 June 2011 Page 117
recognised in profit or loss over the lease term as an integral part of the total lease expense on a straight line basis.
Finance Lease Payments
Minimum lease payments are apportioned between the finance charge and the reduction of the outstanding liability. The finance charge is allocated to each period during the lease term on an effective interest basis.
Financing Costs Financing costs comprise interest paid and payable on borrowings calculated using the effective interest rate method.
The interest expense component of finance lease payments is recognised in profit or loss using the effective interest rate method.
Non-Current Assets Held For Sale & Discontinued Operations
Immediately before classification as held for sale, the measurement of the assets (and all assets and liabilities in a disposal group) is brought up-to-date in accordance with applicable NZ IFRS. Then, on initial classification as held for sale, a non-current asset and/or a disposal group is recognised at the lower of its carrying amount and its fair value less costs to sell.
Impairment losses on initial classification as held for sale are included in profit or loss, even when the asset was previously revalued. The same applies to gains and losses on subsequent remeasurement.
A discontinued operation is a component of MidCentral DHB‟s business that represents a separate major line of business or geographical area of operations or is a subsidiary acquired exclusively with a view to resale.
Classification as a discontinued operation occurs upon disposal or when the operation meets the criteria to be classified as held for sale, if earlier.
Contingent Assets & Contingent Liabilities Contingent liabilities and contingent assets are recorded in the Statement of Contingent Liabilities and Contingent Assets at the point at which the contingency is evident. Contingent liabilities are disclosed if the possibility that they will crystallise is not remote. Contingent assets are disclosed if it is probable that the benefits will be realised.
Cost of Service (Statement of Service Performance)
The cost of service statements, as reported in the statement of service performance, report the net cost of services for the outputs of MidCentral DHB and are represented by the cost of providing the output less all the revenue that can be allocated to these activities.
Cost Allocation MidCentral DHB has arrived at the net cost of service for each significant activity using the cost allocation system outlined below.
Cost Allocation Policy Direct costs are charged directly to output classes. Indirect costs are charged to output classes based on cost drivers and related activity and usage information.
Criteria for Direct & Indirect Costs Direct costs are those costs directly attributable to an output class.
Indirect costs are those costs that cannot be identified in an economically feasible manner with a specific output class.
Cost Drivers for Allocation of Indirect Costs The cost of internal services not directly charged to outputs is allocated as overheads using appropriate cost drivers such as actual usage, staff numbers and floor area.
Statement of Cash Flows
The statement of cash flows is prepared exclusive of GST, which is consistent with the method used in the Statement of Comprehensive Income.
GST inflows and GST outflows in the Cash Flow Statement have been shown net as the Board does not believe that showing gross cash flows provides more useful information given that GST is paid net each month.
Definitions of the terms used in the statement of cash flows are:
Cash includes coins and notes, demand deposits and other highly liquid investments readily convertible into cash and includes all call borrowings such as bank overdrafts used by the organisation.
Operating activities include all transactions and other events that are not investing or financing activities.
Investing activities are those activities relating to the acquisition and disposal of current and non current investments and any other non-current assets.
Financing activities are those activities relating to changes in the equity and debt capital structure of the organisation and those relating to the cost of servicing the organisation‟s equity capital.
Comparatives
Trade and other payables have been restated to show the derivative asset separately in the Statement of Financial Position. This resulted in an increase in the trade and other payable balance of $57,000 from $32,252,000 to $32,309,000. The amounts disclosed in note 18 and 21 have also been restated to reflect this change.

Appendix F: Minister of Health’s Letter of Endorsement
Annual Plan 2011/12, 28 June 2011 Page 118
Appendix F: Minister of Health’s Letter of Endorsement

Appendix F: Minister of Health’s Letter of Endorsement
Annual Plan 2011/12, 28 June 2011 Page 119

Appendix F: Minister of Health’s Letter of Endorsement
Annual Plan 2011/12, 28 June 2011 Page 120

Appendix F: Minister of Health’s Letter of Endorsement
Annual Plan 2011/12, 28 June 2011 Page 121

www.midcentraldhb.govt.nz


