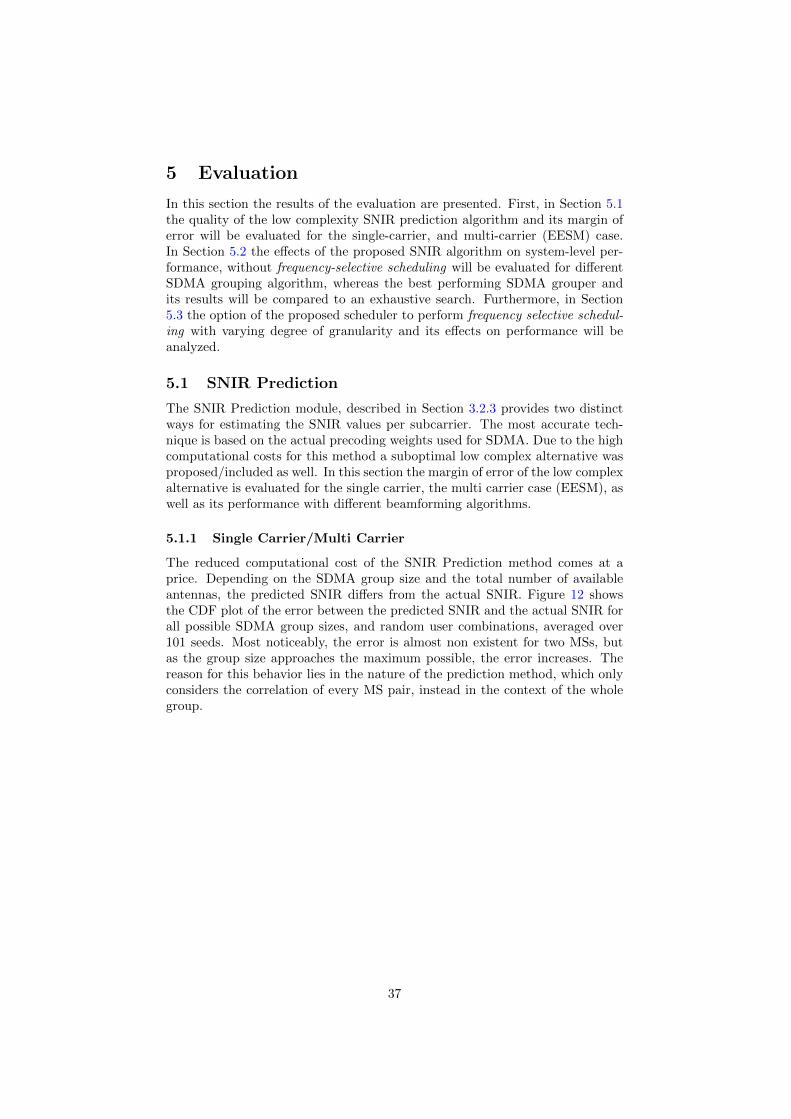
Scheduling Strategies for Frequency Selective Multi-User MIMO-OFDMA Systems Diplomarbeit zur Erlangung des akademischen Grades Diplominformatiker Humboldt-Universit¨ at zu Berlin Mathematisch-Naturwissenschaftliche Fakult¨ at II Institut f¨ ur Informatik eingereicht von: Johannes Marotzke geboren am: 25.10.1984 in: Berlin Gutachter: Prof. Dr. J-P. Redlich Prof. Dr.-Ing. E. Grass Betreuer: Dr. A. Zubow eingereicht am: ...... verteidigt am: ......
Modern wireless networks are faced with an increasing demand forhigher data rates, better quality of service, and higher overall networkcapacities. In order to comply to these demands various limits, like thelimited availability of the frequency spectrum and a complex space-timevarying wireless environment must be overcome. Transmission schemesbased on Multiple Input Multiple Output (MIMO) techniques and Or-thogonal Frequency Division Multiple Access (OFDMA) are promisingtechnologies that increase spectral efficiency, and counter the effects ofthe environment.
In case of MIMO, multiple antennas are used to improve communi-cation performance. The most common MIMO modes either increasediversity to make signals more robust against fading and interference, orperform spatial multiplexing of multiple streams. Multi-User spatial mul-tiplexing is especially promising as it can increases spectral efficiency in alinear manner. The channel access method associated with MIMO’s spa-tial multiplexing mode is commonly called Space-Division-Multiple-Access(SDMA), where multiple Mobile Stations (MS) are spatially separated andallocated to the same time/frequency resources. OFDMA on the otherhand, is a channel access mode where a wideband channel is divided intomultiple orthogonal narrow-band sub-carriers, thus, separating multipleMSs in either frequency, and/or time. Combining SDMA and OFDMA,resources must be allocated in time, frequency, and space dimension to dif-ferent MSs which results in a highly complex three-dimensional resourceallocation problem. For any practical SDMA-OFDMA MAC schedulerthe computational costs for solving the resource allocation problem canbecome a limiting factor and must be considered carefully.
The SDMA grouping problem of finding suitable MSs that are spa-tially orthogonal to each other, has been commonly acknowledged asbeing the main computational intensive problem that affects perfor-mance [YG06], [STKL01]. Suboptimal SDMA grouping algorithms, anddifferent SDMA grouping metrics are often proposed, that sacrifice per-formance for reduction in complexity to different degrees. Furthermore,in combination with OFDMA the question arises if SDMA groups shouldbe allocated per-subcarrier, or larger subsets thereof. Especially sinceOFDM systems are in general frequency-selective any SDMA group con-sidered optimal on some sub-carriers might be far from optimal on others.
This work proposes a generic SDMA-OFDMA MAC scheduling solu-tion that integrates current state-of-the-art suboptimal SDMA groupingstrategies with varying complexity, a low complex Signal-to-Noise-plus-Interference-Ratio (SNIR) predictor for users within an SDMA group,and the option to perform frequency selective scheduling with varying de-gree of granularity. The proposed scheduler is analyzed in a typical urbanmacro-cell scenario by means of system-level packet-based simulations,with detailed MAC and physical layer abstractions based on the WiMAX802.16e standard. In the course of this work, it will be shown that the pro-posed SNIR predictor allows a substantial reduction in SDMA groupingcomplexity with minimal performance loss for varying SDMA groupingalgorithms, and that besides the complexity versus performance trade-off,there exists an additional trade-off between performance and MAC layersignaling overhead that can quickly invalidate the advantages of frequencyselective scheduling in SDMA-OFDMA systems.
Future wireless systems need to address the increasing growth of mobile datatraffic and its resulting demands, which are heavily driven by video and webapplications. The Cisco Visual Networking Index (VNI) Global Mobile DataTraffic Forecast [RRTW11] gives a good indication on these past and futuredemands. In 2010 alone, the global mobile traffic grew 2.6 fold in comparison to2009, tripling the third year in a row with 237 petabytes per month it was overthree times greater than the entire global internet traffic in 2000 (75 petabytesper month). This growth is driven by the increasing amount of available mobiledevices, the success of smart-phones during the last few years, as well as thefact that wireless networks allow coverage of areas without wired infrastructure.The main question that arises is not if a predicted 26-fold increase till 2015 ispossible, or even unavoidable, but how can the capacity of wireless systems beincreased to cope with such demands?
A starting point is given by the theoretical limit of the channel capacity asdefined by the Shannon-Hartley theorem. This equation is a tight upper boundon the channel Capacity in bits per second of a communication channel of aspecified Bandwidth in the presence of noise.
Capacity = Bandwidth · log2(1 + SNR) (1)
As can be seen, any improvement on the Signal-to-Noise-Ratio (SNR) re-sults in logarithmic growth with only minor gains, whereas the bandwidth canincrease the capacity linearly. Accordingly, increasing bandwidth is the mostcommon approach in order to increase capacity. But, the bandwidth itself isnot without limits. For example the coherence bandwidth, a statistical mea-surement over which the channel can be considered flat, gives an indication ofsuch a limit [Gol05]. When the bandwidth is much larger than the coherencebandwidth the symbol rate increases and experiences frequency selective fadingdue to multi-path effects. One solution to this problem is to split the widebandchannel into a set of orthogonal non-interfering narrow-band sub-carriers [TV05]called Orthogonal Frequency Division (OFDM).
Even though this is an effective approach, it does not lead to an unlim-ited capacity, especially since the computational cost increases with increasingbandwidth, as well as the fact that bandwidth itself is a limited resource withpossibly expensive licenses [Dra10].
Another approach that shows a promising potential for increasing capacitiesbeyond the Shannon-Hartley limit is based on using multiple antenna systemson receiver and transmitter side, and is commonly referred to as a Multiple-In-Multiple-Out (MIMO). Equation 2 shows the assumed capacity of a MIMOsystem[PFE08]. This equation is a rough approximation on the capacity ofmultiple antenna systems. It is based on the assumption that MIMO allows upto N spatial streams each equivalent to a Single-In-Single-Out (SISO) channel:
Capacity = N · Bandwidth · log2(1 + SNR), (2)
where N = min(nRX ,mTX) represents the available degrees of freedom givenby the minimum number of antennas of either side used for transmission orreception. This limitation of the “smallest device” is particularly severe formobile devices like handhelds, or smart phones that might not be able to sustain
7
multiple antennas. An extension to MIMO, which overcomes this limitation, isthe so called Multi-User MIMO (MU-MIMO). MU-MIMO combines multiplestreams for multiple Mobile Stations (MS), instead of utilizing multiple streamsfor one MS with multiple antennas.
In conclusion, and to answer the question in how to cope with the increasingfuture demands of wireless networks, the combination of a large bandwidth withOrthogonal Frequency Division Multiple Access (OFDMA) and Multiple InputMultiple Output (MIMO) techniques holds a great promise to do so.
1.1 Thesis
The objective of this work is to develop a feasible Multi-User MIMO-OFDMAcapable downlink (DL) MAC scheduler based on current state-of-the-art solu-tions, and to evaluate its performance on MAC layer through simulation on aper-packet basis1. For this purpose the proposed scheduler is to be analyzed bymeans of system-level simulations with detailed MAC- and physical layer ab-stractions in compliance to an urban macro-cell scenario based on the WiMAXsystem evaluation methodologies.
During the course of this work, the complexity involved in scheduling thespace, time and frequency dimensions available in a Multi-User MIMO-OFDMAsystem, led to the development of a low-complex SNIR prediction method2
for multiple MSs that are to be scheduled simultaneously and separated inthe spatial dimension. This method and its performance as part of this workwill be evaluated in terms of throughput and complexity. Furthermore, thiswork includes the effects of a frequency selective environment and its possibleadvantages for MIMO-OFDMA systems on MAC layer.
1.2 Thesis Structure
This work, and its remainder are structured into five main sections whose con-tents are briefly described here. Section 2 gives a brief introduction into MIMOand OFDM/OFDMA systems, their advantages and how these techniques aresupported by the WiMAX standard as well as a brief overview on related workfocusing on complete SDMA-OFDMA scheduling solutions. Section 3 discussessome issues faced during the course of this work towards a practical MAC sched-uler, and describes the chosen approach and its implementation in detail. Theproposed scheduling algorithm is analyzed by means of simulations. Section 4describes the underlying simulation framework, provides information about thelevel of detail considered in the modeling as well as the configuration parame-ters and settings used within this work. Section 5 focuses on the evaluation ofthe proposed low complexity SNIR prediction method and the complete MACscheduling solution and its variations. The performance of the proposed SNIRprediction method is evaluated in detail in Sub-section 5.1. The system levelperformance of the complete scheduling algorithm and its variations are studiedmore thoroughly in Sub-section 5.2, and the possible gain achievable throughfrequency selective scheduling within an SDMA-OFDMA system is evaluated in
1Parts of this thesis and its results have been published in [ZMDMXC12, ZM12].2Patent: ”Method for operating a wireless network, a wireless network and a device”,
PCT/EP2012/050523, to appear, 2012.
8
Sub-section 5.3. Finally, Section 6 summarizes the main results and concludesthis work.
2 Basics
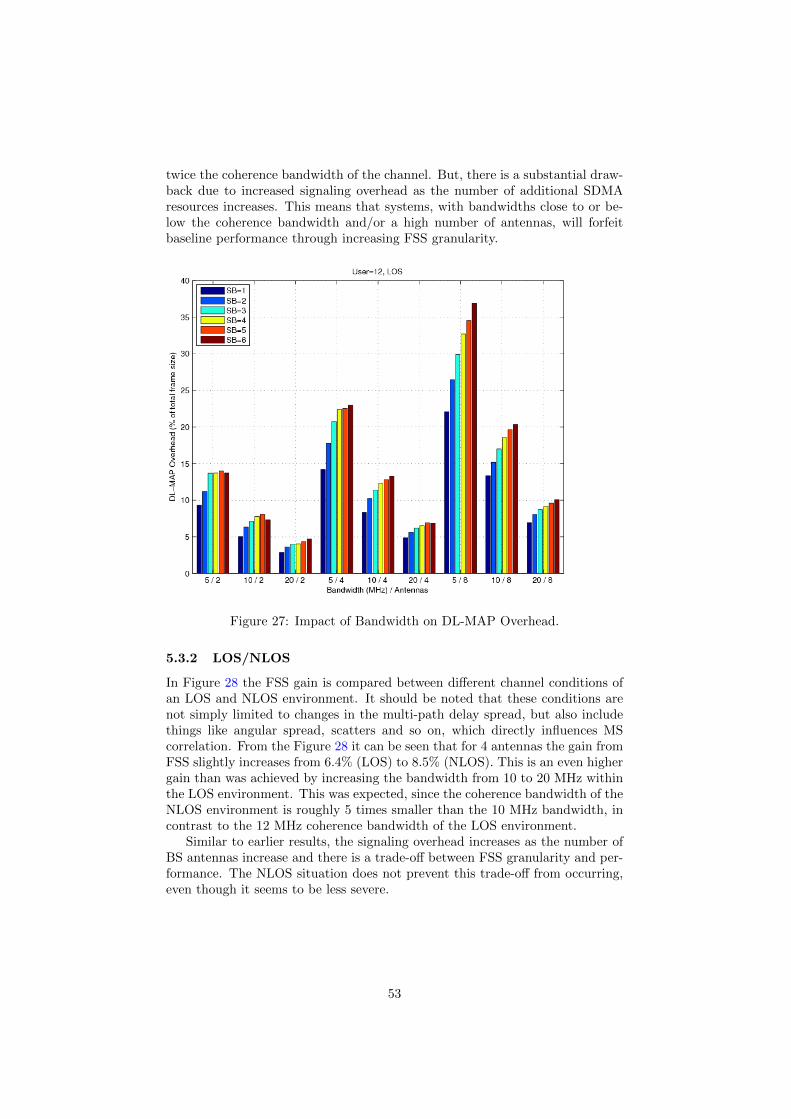
The following sections gives a brief introduction into different state-of-the-artMIMO techniques, the advantages and disadvantages of multi-carrier systemlike OFDM, as well as a short overview of the WiMAX 802.16e PHY layer sup-port of such techniques and current related work on SDMA-OFDMA schedulingproposals.
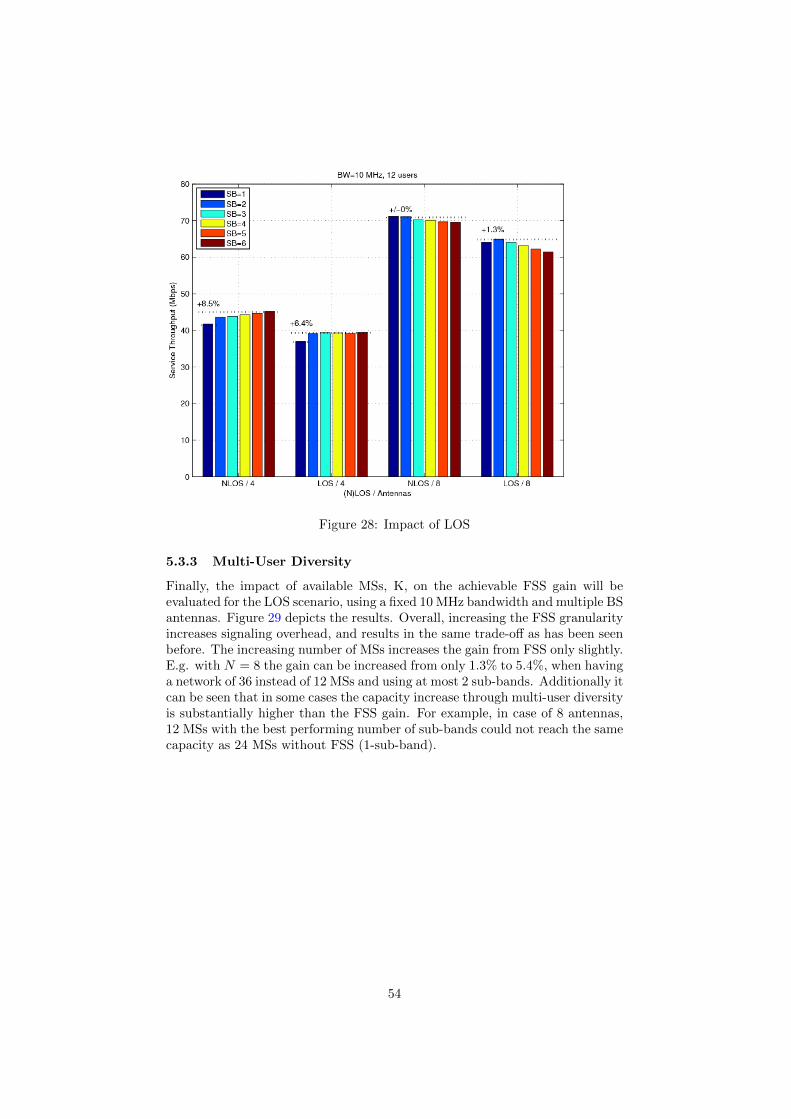
2.1 MIMO and spatial multiplexing
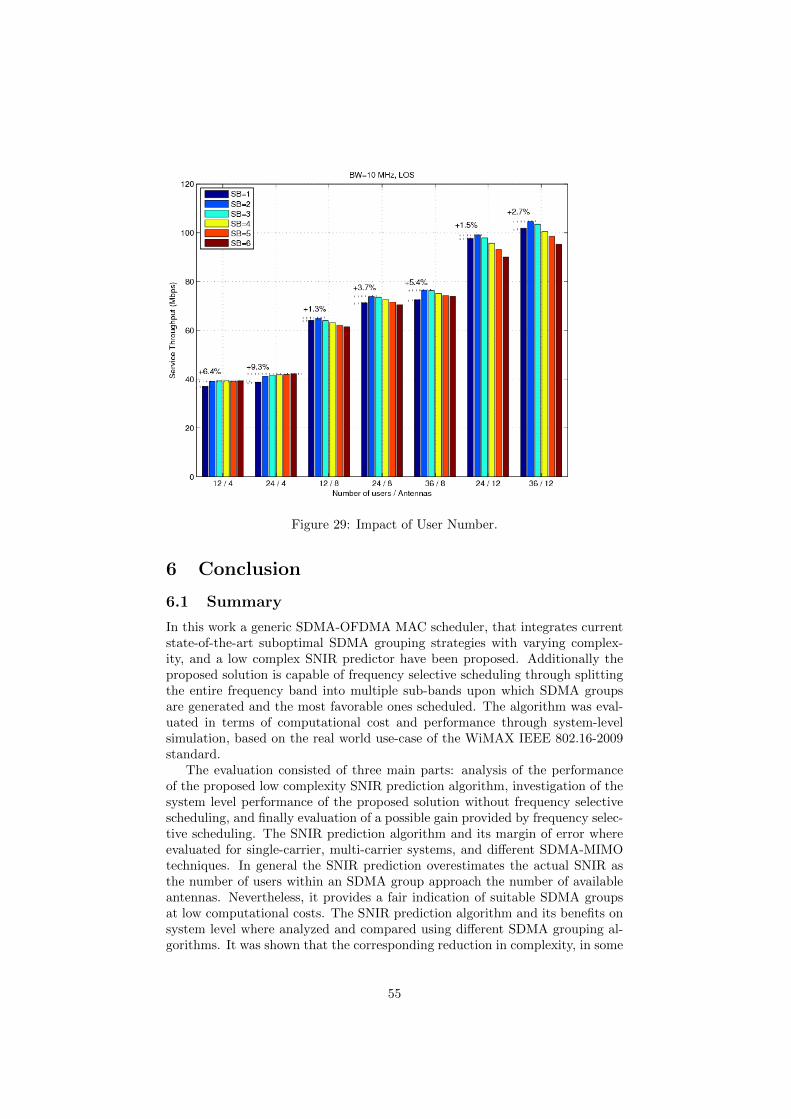
Multiple-Input-Multiple-Output (MIMO) refers to the use of multiple antennasat the transmitter and/or receiver. It provides several advantages compared tosingle antenna system like spatial diversity, multiplexing, or even interferencereduction. Spatial diversity is simply achieved through more than one receiveantenna. Since each antenna encounters different channel effects, the signals re-ceived are different variations of the same signal. Spatial multiplexing combinesthese diversity effects, on receiver and transmitter side in order to multiplexmultiple signals into independent sub-streams. On receiver side each of thesesub-streams has its own spatial signature due to multi-path effects, which canbe used to demultiplex and decode each of these signals. In the same way thesespatial signatures can be used to separate known sources for multiple streams,they can be applied to cancel known interference.
These techniques not only apply for the communication between two in-stances, but can also be adopted for multiple MSs. Instead of utilizing multiplestreams for one MS with multiple antennas, multiple streams are utilized formultiple MSs.
2.1.1 Channel Model
The link of each receiver-transmitter antenna pair can be modeled as a Single-Input-Single-Output (SISO) channel. Whilst all links share the same path-loss,due to the closely spacing, they do not share the same fading statistics.
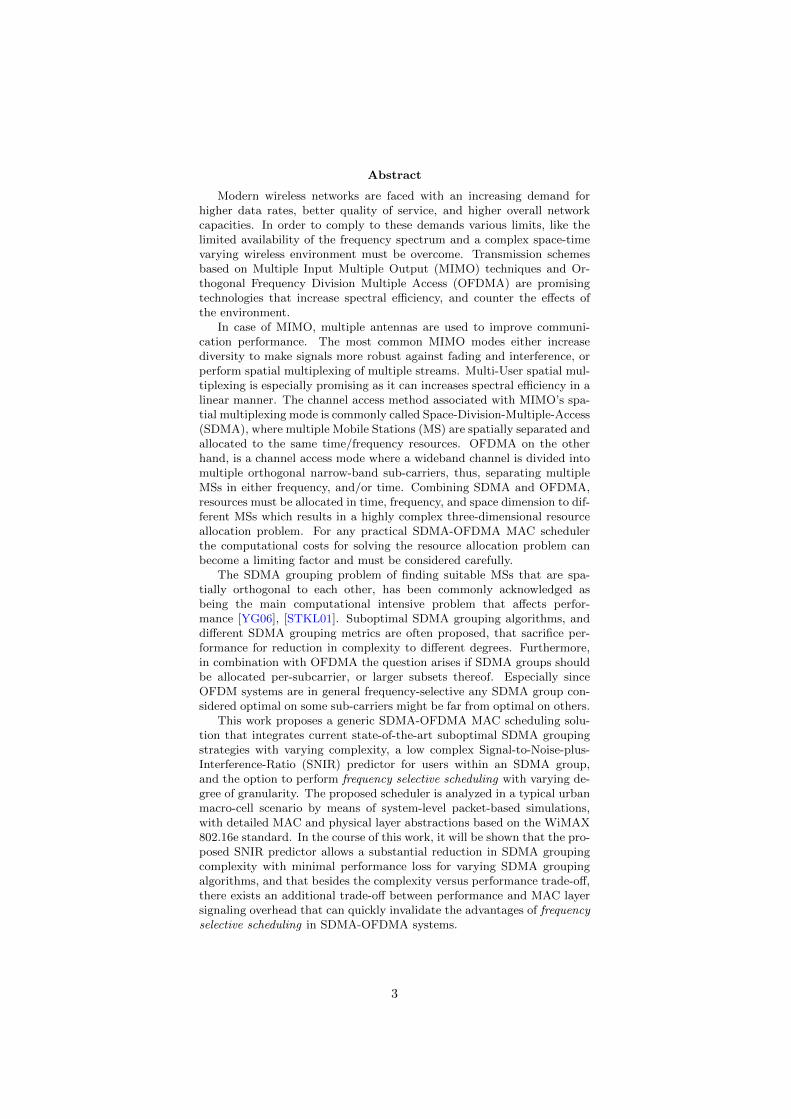
The general MIMO case is depicted in Figure 1. The transmitter side isequipped with an N element antenna array, and the receiver side with M -elements. Each SISO channel between an antenna pair (i, j) can be expressedwith a channel coefficient hi,j . The complete MIMO channel is defined as theN ×M channel matrix H, where hi,j = H(i, j).
Figure 1: General MIMO layout.
9
The signal vector y at the receiver during time t becomes:
y(t) = s(t)H(t) + n(t), (3)
where s is the transmitted signal. The dimensions of the vectors y and s dependon the number of possible spatial streams with at most min(N,M) many.
2.1.2 Open-Loop and Closed-Loop techniques
There are many techniques that take advantage of the MIMO system in differentways. Most commonly they are categorized into two types depending on whetheror not the channel state information (CSI) are available at the transmitter.These categories are known as open-loop and closed-loop MIMO.
Open-loop techniques adjust the signal on transmitter side independent ofthe channel conditions. One particular simple approach for two transmit an-tennas that is capable of exploiting the full transmit diversity, without channelknowledge, is known as Alamouti scheme [Ala98]. This scheme transmits twosymbols simultaneously during two time slots over two antennas, and correctsthe signal to enforce orthogonality. During the first time-slot both symbols aretransmitted on separate antennas, and during the second time slot the antennasare alternated. This creates two copies separated in time and two copies sep-arated in space for each symbol, resulting in a higher diversity at the receiverwhich improves the robustness of the signal. More general techniques of thisspace-time coding principal exist for more than two transmit antennas that acton blocks of data. Some of these techniques are referred to as space-time blockcodes [TJC99], or space-time trellis codes [TSMC98].
Closed-loop techniques adjust the signals on transmitter side according tothe underlying channel. Due to their adaptive nature these techniques can sim-plify encoding compared to space-time coding [Tso06], improve error rate, andincrease spectral efficiency. Essentially, in closed-loop systems any techniquethat can be applied on receiver side using channel state information to decodereceived signals (e.g. Maximum Ratio Combining, Equal Gain Combining, orInterference Reduction), can be used to pre-code signals on transmitter side withsimilar effects. Nevertheless, the greatest advantage of closed-loop techniquesis the possibility of applying pre-coding on transmitter side with full channelknowledge, and additional decoding on receiver side. This enables spatial mul-tiplexing of different data streams to different MSs, which increases spectralefficiency.
In general the increased antenna diversity can be used in two ways, either tomake signals more robust against fading and interference, or for spatial multi-plexing. Techniques like space-time coding increase diversity and therefore ro-bustness, whereas, spatial multiplexing increases spectral efficiency. In terms ofcapacity, improving robustness outperforms spatial multiplexing at low Signal-to-Noise-plus-Interference-Ratio (SNIR), and at high SNIR, at which point asystem becomes bandwidth limited, spatial multiplexing outperforms diversitytechniques [WGSB07].
2.1.3 Channel State Information
The greatest problem faced by closed-loop MIMO communication is acquiringthe channel state information (CSI) at the transmitter side. Perfect channel
10
knowledge would need a continuous feedback link between the receiver and thetransmitter and might not be a feasible solution for a practical system as itwould consume additional capacity. As an alternative there are various meth-ods available that limit the feedback through using only channel statistics orquantized versions of the channel state. Even though a few bits of limited feed-back can provide substantial improvements in performance [LHSH04], they arefar more prone to channel estimation error and channel evolution. Another com-mon approach is based on the reciprocity of the channel. Here, a transmitterderives the channel state information from signals received along the oppositelink [TV05]. Reciprocity does not mean the channels between transmitter andreceiver are identical, it means the channel coefficients are the same. Factorslike interference, noise, or differences in hardware may vary strongly per linkand must be accounted for during calibration of the coefficients [GPK09]. Fur-thermore, reciprocity does not exist in the frequency-domain. This means thattime division duplexing (TDD) systems must be calibrated carefully in the fre-quency domain for reciprocity, and frequency division duplexing (FDD) systemsmust use direct feedback of the receiver.
2.1.4 Multi-User MIMO techniques
In case of MU-MIMO scheme multiple antennas are used to send signals todifferent or multiple MSs at the same time using the same frequency. For thispurpose knowledge of the Channel State Information (CSI) of each MS is re-quired, that can be utilized in different ways.
On one hand, there is Dirty Paper Coding (DPC), which is a techniquethat adapts the signal according to the interference amongst MSs, using it con-structively and completely reducing its effects. Instances of DPC techniquesinclude Costa precoding [Cos83], Tomlinson-Harashima precoding [WC98] andthe vector perturbation technique [PHS05]. However, DPC relies on non-linearprecoding techniques, which is impractical in commercial wireless systems dueto its high complexity.
On the other hand, there are beamforming techniques which allow the sep-aration of multiple MSs through assigning beamforming directions and treatingother MSs as noise. Common techniques either completely reduce the effects ofthe interferer, through nulling (e.g. Zero-Forcing [Mac08]) which is done evenat high costs to the own signal, or through maximizing the SIR (e.g. Mini-mum Variance Distortion-less Response, Maximum SIR, Min Mean Square Er-ror) [Gro05].
Beamforming techniques, as compared to DPC, are suboptimal strategies [YG06]that try to reduce the mutual interference between MSs, whereas, DPC uses theinterference constructively. Nevertheless, due to the high computational cost ofDPC, they are valuable alternatives for any real time system.
2.1.5 SDMA Grouping
Spatial-Division-Multiple-Access (SDMA) is a channel access method that ismore frequently associated with beamforming techniques that rely on the spa-tial separation of different MSs. The spatial correlation determines the effec-tiveness of placing nulls between multiple MSs, as well as being able to optimizetheir signal. It has been shown that in case MSs are orthogonal to each other
11
beamforming can reach the same capacity as DPC [SCA+06]. In scenarios,where more MSs exist than number of antennas a sophisticated SDMA group-ing algorithm that decides which MSs to serve simultaneously with minimalinterference, would overcome the limitations of beamforming techniques andachieve the same capacity as DPC.
This so called SDMA grouping problem is known to be NP-complete [STKL01],with computational cost that increase exponentially as the number of MSs in-creases. In order to organize the SDMA groups efficiently with low complex-ity, suboptimal grouping algorithms are required. Multiple suboptimal SDMAgrouping algorithms have been proposed in literature [Mac08, STKL01].
One of the SDMA grouping algorithms commonly used, which has beenshown to perform well with low complexity is a greedy algorithm called the BestFit Algorithm (BFA) [STKL01]. It constructs an SDMA group through startingwith the MS with the weakest signal, i.e. lowest SNR/SNIR, and sequentiallyextends the group by admitting the MS providing the highest increase for agiven grouping metric. Once the group size reaches a target size, or no moreMSs exist to increase the grouping metric, the SDMA group is fully constructed.Another closely related algorithm with even lower complexity is the First FitAlgorithm (FFA). The only difference, compared to the BFA, is that instead ofadmitting the MS providing the highest increase for the grouping metric it addsthe first MS to the SDMA group that holds the slightest gain [STKL01].
In literature a broad number of SDMA grouping algorithms exist. A com-prehensive overview is given in [Mac08]. Another grouping algorithm relatedto this work, with a higher complexity as the FFA/BFA is called the Cluster-Based-Algorithm [ZMDMXC12].
2.1.6 SDMA Metrics
As previously mentioned, grouping algorithms require a grouping metric in or-der to compare candidate SDMA groups with each other. In general, a groupingmetric makes use of the Channel State Information (CSI) in order to map thecharacteristics of the spatial channels of the MSs to a scalar value [Mac08]. Themost commonly used grouping metrics are the group capacity and the group min-imum SNIR. The former considers the Shannon-Hartley capacity of an SDMAgroup, and the latter returns the lowest SNIR of an MS in a given SDMA group.Both grouping metrics rely on the actual beamforming weights and/or the powerallocation which involves complex vector/matrix operations which comes at theexpense of an increased complexity. In order to decrease complexity, group-ing metrics that are based only on the spatial correlation and on the channelgains of the MSs, involving much simpler vector/matrix operations, have beenproposed [FN96, STKL01, Mac08].
2.2 OFDM/OFDMA
Orthogonal Frequency Division Multiplexing (OFDM) is a frequency divisionmultiplexing scheme (FDM), which divides a wideband channel into multipleorthogonal sub-carrier frequencies. Unlike conventional frequency division mul-tiplexing schemes the orthogonality between the carriers allows a close spacingbetween multiple sub-carriers, without causing interference, leading to a high
12
spectral efficiency. This is possible due to the fact that each sub-carrier fre-quency is orthogonal to its adjacent sub-carriers, meaning, the peak of onesub-carrier coincides with the null of its adjacent neighbor.
One of the greatest advantages of OFDM systems over single-carrier trans-mission schemes in wideband channels is the fact that it turns a wideband single-carrier signal into multiple narrow-band signals. Each sub-carrier is modulatedseparately by multiple lower rate data streams that, as a sum, hold a totaldata rate similar to a conventional single carrier scheme without the need ofcomplex equalization filters. Therefore, OFDM can cope with severe channelconditions like frequency selective fading, which can be considered flat for asingle narrow-band sub-carrier, through using sufficient spacing.
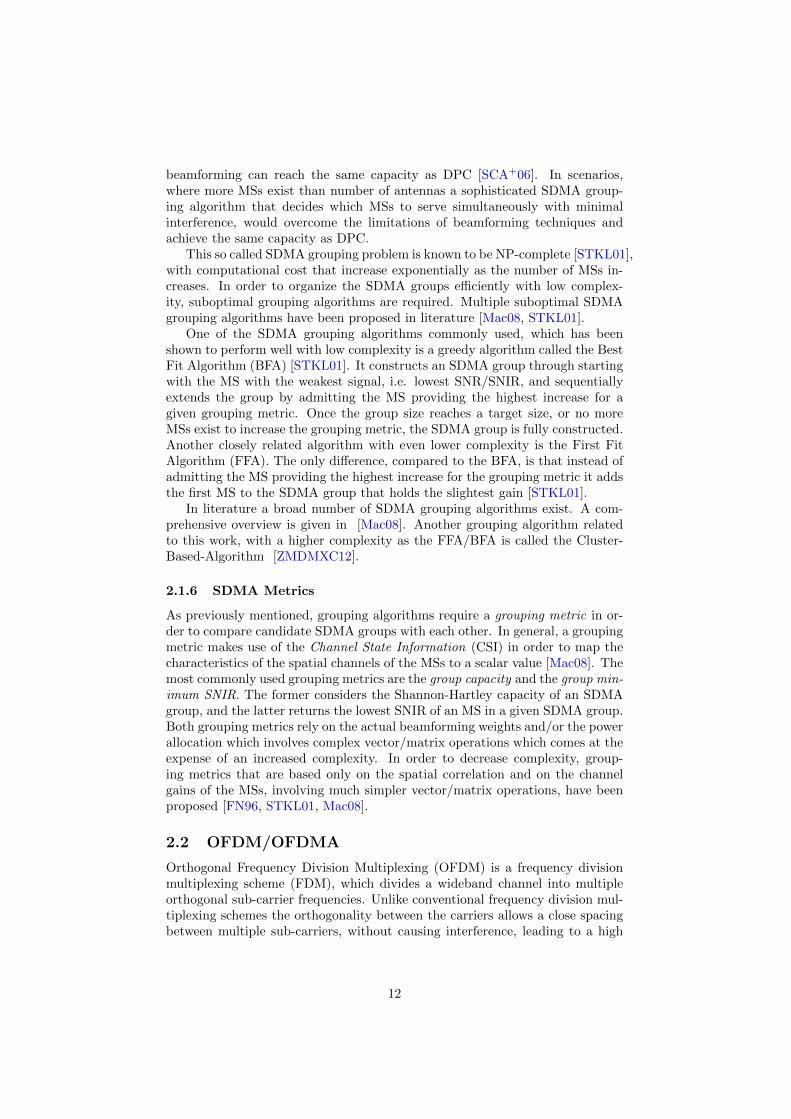
2.2.1 Frequency Diversity
Figure 2 shows the channel gain over a frequency band of 10 MHz split into mul-tiple narrow-band sub-carriers. In a typical wideband system the total band-width can be much larger than the coherence bandwidth of the channel resultingin frequency-selective channel gains per sub-carrier. This diversity in frequencycreates additional advantages for multi-user schemes like OFDMA, which is amulti-user version of OFDM where subsets of sub-carriers can be assigned todifferent MSs. An OFDMA system can benefit from frequency-selectivity in twodistinct ways [Lee07].
Figure 2: Wideband single-carrier frequency spectrum split into multiplenarrow-band sub-carriers.
The first approach allocates each MS a subset of the total available sub-carriers spread across the entire frequency band. The performance gain achievedthis way, is obtained by using multiple sub-carriers whose path gains are inde-pendently faded, rather than using adjacent sub-carries with similar faded pathgains. This approach is commonly referred to as frequency diversity gain (FDG).
The second approach, called frequency-selective scheduling (FSS), is achievedby allocating each MS adjacent sub-carriers located within a sub-band of lim-ited bandwidth having the most favorable channel conditions within the entirefrequency band.
FSS in comparison to FDG, heavily depends on accurate channel state infor-mation. Without channel knowledge FDG reduces the probability of allocatingsub-carriers that lie within the same deep-fade, where FSS would fail. But, withchannel knowledge, FSS selects peaks, avoiding deep-fades all together. This
13
means there is a gray line between the performance of FDG and FSS. For exam-ple in scenarios with high mobility where the channel state is quickly changingFDG has a greater advantage. However, as mobility is reduced and the channelturns more stable there is a turning point where the FSS gain grows beyondFDG.
2.3 SDMA-OFDMA support in WiMAX
This work is based on the real world use-case of the WiMAX IEEE 802.16-2009 standard [80209]. This section provides an overview of possible PHY layerfeatures, the TDD/OFDMA frame structure, and the included channel feedbacksupport of WiMAX for MIMO techniques.
2.3.1 PHY Layer Features
WiMAX 802.16e-2005 defines three different PHY layers: single-carrier trans-missions, OFDM, and OFDMA. The first two are pure time division multiplex-ing access (TDMA) schemes, OFDMA on the other hand, uses both time andfrequency dimensions for resource allocation. The frequency ranges include 2–11GHz and 23.5–43.5 GHz, and supports different bandwidths between 1.25 MHzand 20 MHz. For robustness and reliability WiMAX supports BPSK, QPSKmodulation as well as higher order schemes like 16-QAM and 64-QAM. Theuplink (UL) and downlink (DL) can be duplexed either in time (TDD) or infrequency (FDD). In FDD full-duplex is supported for Mobile Stations (MS)capable of transmitting and receiving simultaneously, and half-duplex for MSswithout such feature. In TDD on the other hand, the uplink and downlink sharethe same frequencies and are separated in time into different sub-frames thatare not necessary divided into equal parts.
2.3.2 OFDM/OFDMA
An OFDM/OFDMA system uses multiple subcarriers for transmission. InWiMAX there are three OFDM subcarrier types called data, pilot, and nullsubcarriers each with its own purpose. The data subcarriers are used for actualdata transmission, whereas a pilot subcarrier can be used for various estima-tion and synchronization purposes, and the null subcarriers are plainly used asguard bands. All available subcarriers are grouped into subsets called subchan-nels. These subchannels are the smallest frequency resource unit. An OFDMframe can be considered as a matrix where rows and columns are subchannelsand OFDM symbols, respectively.
In comparison to OFDM, OFDMA is the multiple access scheme where dif-ferent subchannels can be allocated to different MSs. The mapping of physicalsubcarriers to logical subchannels may be performed through randomly assign-ing subcarriers distributed across the entire frequency spectrum, or throughassigning adjacent subcarriers to each subchannel. The former method calledpartial usage of subcarriers (PUSC), provides frequency diversity. The latter,scheme is called adaptive modulation and coding (AMC) and allows the ex-ploitation of multi-user diversity through frequency selective scheduling. Bothschemes have advantages and disadvantages as mentioned in Section 2.2.1.
14
2.3.3 Channel Feedback
Closed-loop MIMO techniques rely heavily on the availability of the channel’sstate information. In WiMAX there are different ways to acquire CSI, includ-ing the channel coefficients. Either by relying on channel reciprocity by usingthe uplink channel estimation as the downlink channel state, or through usingdirect feedback where the MS transmits the estimated channel state to the basestation. The first method is only applicable for TDD, whereas FDD must use di-rect feedback due to the channel separation in frequency. Since a MS can utilizea different number of receive antennas than transmit antennas, direct feedbackmight also be necessary for TDD. Optionally, the standard includes a signal-ing mechanism where a MS can be requested to transmit a channel soundingwaveform on the uplink for channel estimation in TDD. Also the uplink sound-ing waveform can be transmitted in combination with the channel coefficientsestimated by the MS, thus allowing its use in TDD as well as in FDD.
2.4 Related Work
There exists a substantial amount of literature on SDMA grouping algorithms,grouping metrics and beamforming techniques. A broad overview can be foundin [Mac08], where various solutions have been classified and compared for usewithin an SDMA-OFDMA system. However, only a few proposals evaluatethe performance of SDMA in real OFDMA systems like 802.16e. This sectiondiscusses recent proposals on SDMA-OFDMA scheduling solutions for WiMAX.
Nascimento et al. [NR10] proposed a joint utility packet scheduler and SDMA-based resource allocation architecture for 802.16e. Similar to this work, [NR10]uses the Exponential Effective SIR Mapping (EESM [EES05]) method to cap-ture frequency selective channels and takes advantage of the scalar productas low complex metric to build SDMA groups consisting of uncorrelated MSs.The proposed scheduling solution therein assigns MSs to beams, adding subse-quent MSs by choosing the one with the lowest spatial correlation in a First-Fit kind of manner while testing its compatibility through the actual EESMSNIR whilst steering beams towards the estimated direction of arrival. QoSwas achieved through a prioritized assignment similar to the proportional util-ity, using a sorted priority list to select the next MS to be assigned. In order toreduce complexity, the authors reduced the SDMA capabilities to one third ofthe OFDMA frame leaving the rest for non-SDMA transmissions. Performancewas evaluated under the assumptions of a full queue traffic model. The resultsshowed substantial gains in comparison to non-SDMA.
Similar to the previous work, Yao et al. [HCCW08] evaluated the MAC per-formance of an SDMA-OFDMA system where the OFDMA frame is separatedinto SDMA and non-SDMA capable zones. The scheduling solution provided,prioritizes MSs based on their channel conditions and packet delays. Specifically,MSs are grouped according to their channel conditions, whereas, within a group,MSs are prioritized according to packet deadlines. Depending on the intra-beaminterference amongst MSs, they are assigned to a beam with favorable condi-tions or moved to the regular non-SDMA zone. The improvement achievablethrough using SDMA was evaluated for FTP and VoIP services. It showed thatfor FTP services with large packets and delay tolerance using SDMA improvedperformance significantly.
15
Both of these approaches assume an idealized Line of Sight (LoS) channelthat allows beamstearing based on the estimation of the angle of direction ofan MS. But they neglected the advantage of MIMO systems being able to takeprofit of LoS components as well as possible scattering and multi-path effects.
3 Proposed Scheduling Algorithm
This section is split into two sections. The first section describes and discussesthe resources allocation problem in frequency, time, and space in gernerall terms.Whereas Section 3.2 focuses on the proposed algorithm and its design in detail.
3.1 Resource Allocation Problem
The resource allocation of multiple dimensions provided by a MIMO-OFDMAbased system results in a highly complex problem. Alone the resource allocationof an SDMA/TDMA system comes with an exponentially increasing schedulingcomplexity [STKL01]. In combination with OFDMA, or rather multiple sub-carriers, the complexity further increases. Nevertheless, it is possible to dividethe problem into subproblems which can be solved independently with lowercomplexity, using suboptimal solutions. A common approach to simplify theproblem is based on the assumption of adequate synchronization of the frequencyand time dimensions through which neighboring resources can be guaranteed tobe interference free of one another. The frequency and time resources can,therefore, be allocated independently, whereas the spatial dimension can notguarantee the same in-dependency for which its allocation is solved separately.Section 3.1.1 describes the allocation of the spatial dimension and some aspectsthat need to be considered by a practical solution. Section 3.1.2 focuses onthe joint frequency-time allocation, and briefly formulates the task of assigningresources to the best SDMA groups in terms of a given utility function.
3.1.1 Spatial Dimension
This section briefly describes the allocation of the spatial dimension and its rolein combination with an OFDMA system. Most notably this section elaboratestwo aspects: i) The SDMA grouping problem, its components in theory and inpractice, ii) The practical need of performing SDMA grouping across multiplesubcarriers beyond the coherence bandwidth, and how to achieve it withoutneglecting the frequency selective properties of the channel.
The SDMA grouping problem, as described in Section 2.1.5, refers tothe task of selecting MSs with spatial channels that are close to orthogonal, orat least highly uncorrelated, so that a spatial multiplexing gain can be achieved.The spatial correlation amongst these MSs that where selected to transmit inthe same time-frequency resource unit are crucial to the overall capacity. Theproblem of finding the best SDMA group is known to be NP-complete [STKL01],and is similar to the well known knapsack problem [Cal04]. Since an exhaus-tive search over all possible SDMA group combinations would be infeasible,suboptimal SDMA algorithms are necessary in order to reduce the overall com-putational costs at a tolerable performance loss. The theoretical structure ofan SDMA grouping algorithm consists of two parts: the grouping algorithm
16
and a grouping metric [Mac08]. Both parts allow a reduction in complexity.In a practical system however, there is another issue that must be accommo-dated for. Scheduled MSs must fulfill a minimum requirement, like a minimumSNIR threshold for the lowest Modulation and Coding Scheme (MCS), to en-sure a successful transmission. This minimum requirement can only be assuredthrough estimating the SNIR using the actual precoding. In case a sub-optimallow complex grouping metric is used it must be guaranteed, in a final step, thatthere are no MSs within the SDMA groups that fail the minimum requirement.
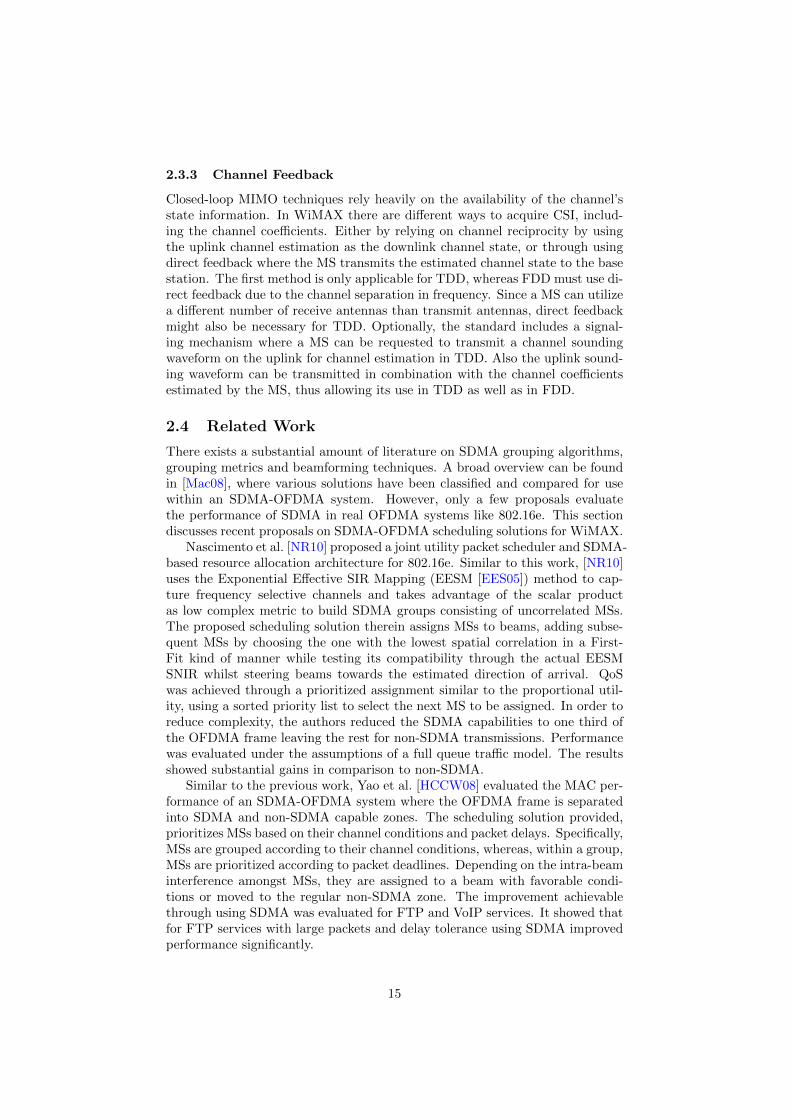
In conclusion to these observations, the allocation of the spatial dimension ina practical systems consists of three parts as depicted in Figure 3. Namely, theSDMA grouping algorithm, the Grouping Metric, and a final step that ensuresthe minimum requirement for all SDMA groups. The task of the final step canreach from simply removing MSs of an SDMA group to collecting all drop-outsof all SDMA groups and returning them to the SDMA grouping algorithm.
Figure 3: The required components of a practical scheme for the allocation ofthe spatial dimension (emphasized in blue). In addition to the theoretical com-ponents of an SDMA grouping algorithm, a practical approach must ensure in afinal step that every MS within an SDMA group fulfills a minimum requirement.
Combining SDMA with OFDMA means combining a narrow-band tech-nique with a wideband channel consisting of multiple narrow-band subcarriers.As was mentioned in Section 2.2, an OFDMA system can cope with severe chan-nel conditions like frequency-selective fading, which can even hold a frequency-selective scheduling gain. To the best of the authors knowledge the question onhow a frequency selective environment effects performance of SDMA in OFDMAbased systems has not been discussed in literature. One could assume that thisis because there is no need for it since most work focuses on performing SDMAgrouping on the smallest block of frequencies for which full CSI can be obtained,
17
and doing so means scheduling the best MSs for each frequency block. In otherwords, combining SDMA with OFDMA implies performing frequency-selectivescheduling. From a theoretical point of view the optimal SDMA-OFDMA re-source allocation strategy in a frequency-selective channel is to perform SDMAgrouping for the smallest possible frequency range. However, from a practicalpoint of view this is not reasonable. Every packed data burst needs to be sig-naled by an entry in the MAC header, i.e DL-MAP in case of WiMAX, resultingin substantial signaling overhead. To the best of the author’s knowledge thereis only one practical proposal that addresses this issue. In [Cal04] it was sug-gested to reduce signaling overhead through allocating the same SDMA groupsfor an integer number of adjacent subcarriers. The more subcarriers are beingallocated to the same SDMA group, the lower the needed signaling overhead.
For practical purposes we will refer to a set of adjacent sub-carriers thatare used for SDMA grouping as sub-band. Figure 4 depicts how the OFDMADL frame can be divided into SB many sub-bands. Depending on the valueSB ≥ 1, SDMA grouping is performed either on one sub-band3 across the com-plete available frequency spectrum, or for each available sub-band separately.Possible frequency-selective properties of the underlying sub-carriers within asub-band can be collapsed into a single scalar value by using techniques like theExponential Effective SIR Mapping (EESM [EES05]). This method maps a setof sub-carrier SNIR measurements into a single effective SNIR measurement,which can be used by the SDMA grouping algorithm.
Figure 4: Proposed partitioning of the OFDMA downlink frame into sub-bands.Gi
j refers to the j-th SDMA group on the i-th sub-band.
In short, scheduling the resources of a spatial layer in a practical systemmeans: i) ensuring a minimum requirement for all scheduled MSs, and ii) beingable to schedule the same SDMA group across multiple sub-carriers in an effort
3A sub-band refers to a set of adjacent subcarriers
18
to minimize MAC layer overhead.
3.1.2 Frequency-Time Allocation
The main objective of a DL SDMA-OFDMA MAC scheduler is to assign re-sources according to a given QoS utility. This section briefly describes how thefrequency and time resources should be scheduled.
The previous section summarized the allocation of the spatial dimensionand introduced the term sub-band. A sub-band refers to a given frequencyrange associated to a set of SDMA groups generated by the SDMA groupingalgorithm. For each sub-band a number of compatible SDMA groups are given,where each MS u within an SDMA group is associated to a packet list Pu, whichis individually tagged with a utility value u to account for QoS (e.g. priorityof a packet). Given a set of SDMA groups per sub-band, the scheduler mustselect a subset of the given SDMA groups to be allocated that maximize thesum utility of the associated packets carried by the frame, as well as allocatingthe needed resources for the DL map whilst minimizing the amount of unusedresources. Furthermore, it is important to select the best SDMA groups acrossfrequencies to ensure an FSS gain.
The main reason why the QoS utility is considered during this part of thescheduling process instead during the SDMA grouping, is due to the fact thatthis work focuses on a packet-switched network. Which means, different packetsof the same MS can be tagged with different utility values. Therefore, theactual priority is based on packets and not on the MS. It would be difficult todistinguish during the SDMA grouping which packets should represent the MSspriority, especially as a small packet that barely consumes resources can hold avery high utility, but takes no advantage of additional spatial resources.
19
3.2 Design
This section describes the greedy DL SDMA-OFDMA MAC scheduler that hasbeen implemented. It employs and combines various state-of-the art techniquesof future OFDMA and SDMA systems into a practical greedy scheduling so-lution. It is a generic solution that is capable of integrating different SDMAgrouping algorithms with varying degrees of complexity. The grouping metricis based on the SNIR values achievable by members of an SDMA group. Mul-tiple SNIR values per carrier are collapsed into a single SNIR equivalent valueusing the ESSM mapping technique. Additionally the total number of adjacentsubcarriers can be grouped into subsets of variable sizes, thus, allowing differentdegrees of granularity upon which the SDMA grouping algorithms can operate.This way SDMA groups can either span the whole frequency spectrum or sub-sets thereof. Since computing an accurate prediction of the achievable SNIRincludes complex calculation of the precoding vectors, an alternative to do so,with low complexity is proposed. Finally, an OFDMA frame construction algo-rithm is introduced that allows the selection of a subset of the possible SDMAgroups in order to maximize the utility within a frame, therefore, achieving aQoS defined by the system operator. The selection is performed across frequen-cies to achieve a frequency selective scheduling gain (FSS). The time dimensionis allocated iteratively by the frame construction algorithm to ensure a gradualallocation of MAP signaling and resources as to minimize possibly unallocatedresources.
3.2.1 Overview
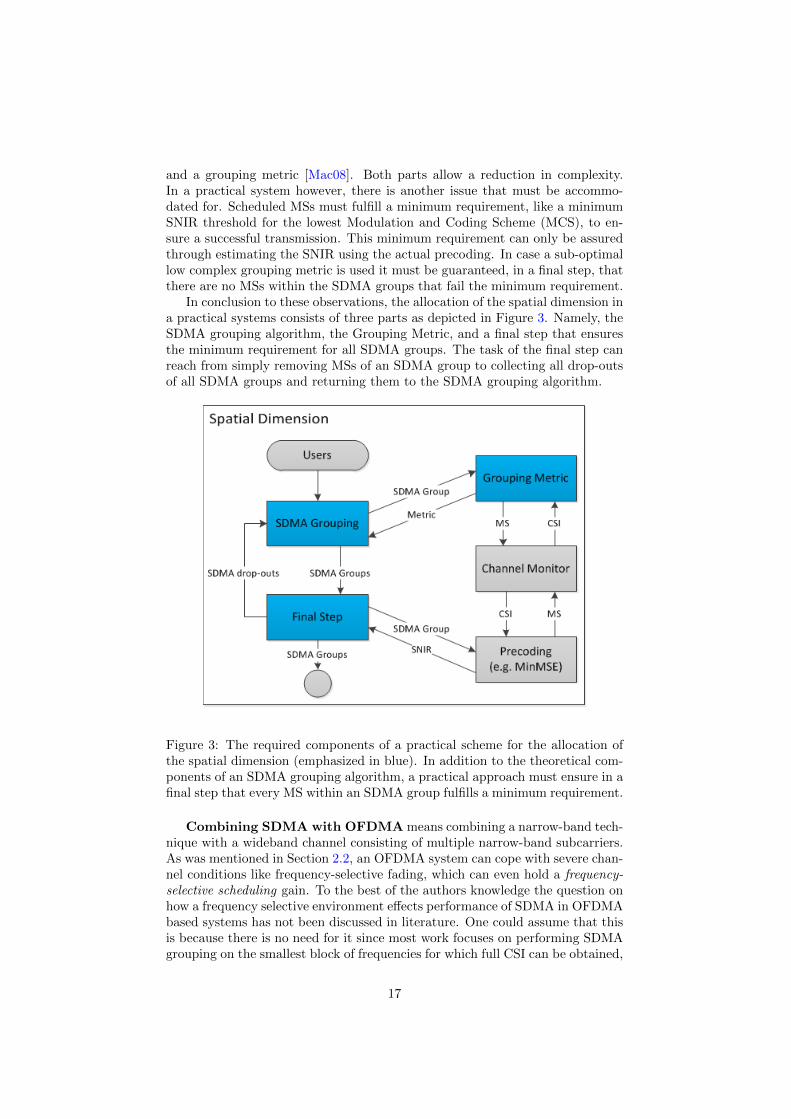
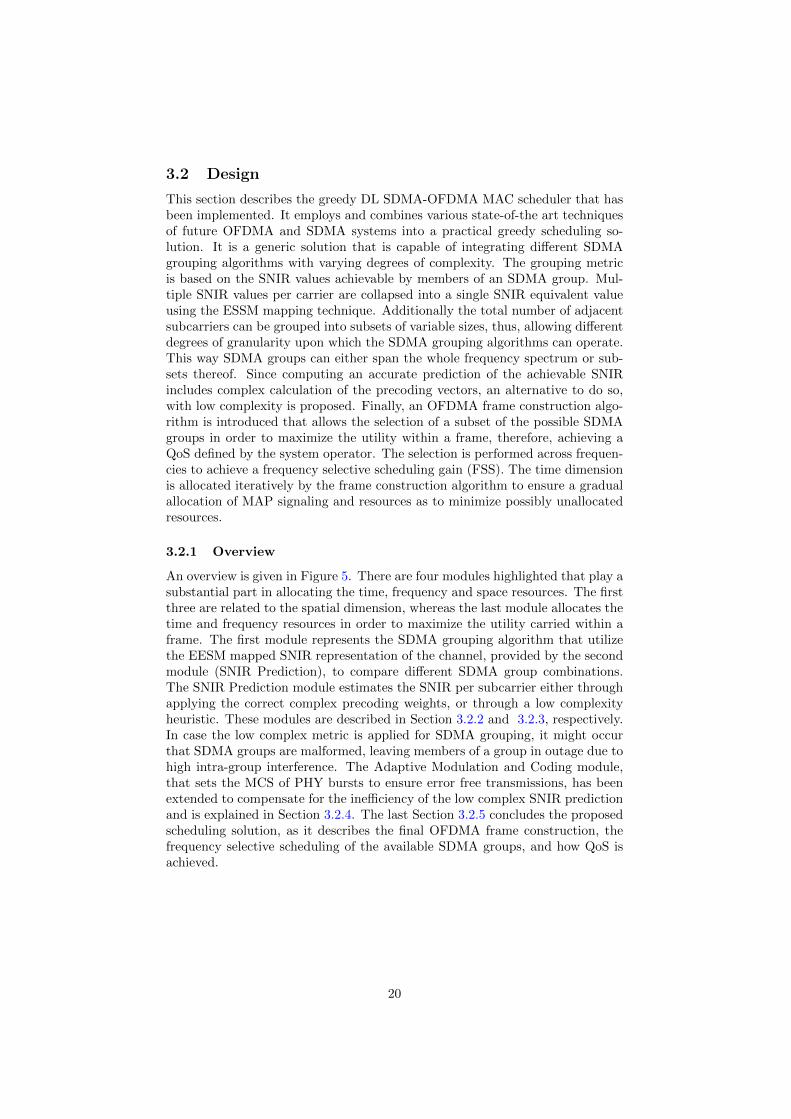
An overview is given in Figure 5. There are four modules highlighted that play asubstantial part in allocating the time, frequency and space resources. The firstthree are related to the spatial dimension, whereas the last module allocates thetime and frequency resources in order to maximize the utility carried within aframe. The first module represents the SDMA grouping algorithm that utilizethe EESM mapped SNIR representation of the channel, provided by the secondmodule (SNIR Prediction), to compare different SDMA group combinations.The SNIR Prediction module estimates the SNIR per subcarrier either throughapplying the correct complex precoding weights, or through a low complexityheuristic. These modules are described in Section 3.2.2 and 3.2.3, respectively.In case the low complex metric is applied for SDMA grouping, it might occurthat SDMA groups are malformed, leaving members of a group in outage due tohigh intra-group interference. The Adaptive Modulation and Coding module,that sets the MCS of PHY bursts to ensure error free transmissions, has beenextended to compensate for the inefficiency of the low complex SNIR predictionand is explained in Section 3.2.4. The last Section 3.2.5 concludes the proposedscheduling solution, as it describes the final OFDMA frame construction, thefrequency selective scheduling of the available SDMA groups, and how QoS isachieved.
20
Figure 5: Overview of the proposed scheduling solution.
3.2.2 SDMA Grouping
This section gives a short description of the implemented state-of-the-art SDMAgrouping algorithms, the SDMA grouping metric, and how these are applied tomultiple sub-carriers. Furthermore, a simple observation is made on how SDMAgrouping over the whole frequency spectrum, in comparison to doing so oversubsets of sub-carriers, effects the complexity.
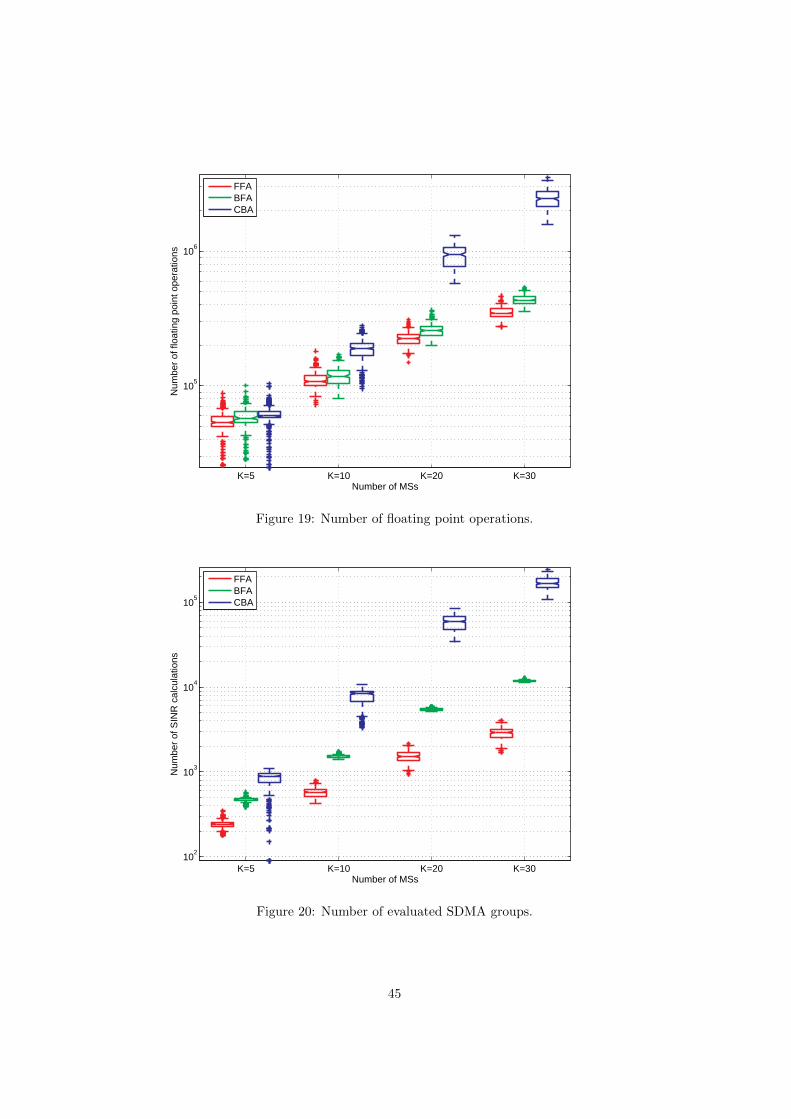
The SDMA group formation problem has a high computational complexity.Thus, the main characteristic that distinguishes SDMA grouping algorithmsfrom one another are the worst case number of comparisons carried out toreach a sufficient performance. The SDMA grouping module includes three suchalgorithms. In ascending order of complexity they are the First Fit (FFA), BestFit (BFA) and the Cluster-based Grouping Algorithm (CBA) [ZMDMXC12].
The FFA has the lowest complexity. It takes a sorted list of MSs accordingto their SNR and starts with the first one to start a group. Then the next MSwithin the list is admitted test-wise to the group, at which point the new groupis checked if it full-fills the minimum SNIR requirement for each MS, if so thenew MS is permanently admitted to the SDMA group. In case a MS is notcompatible the next MS in line is added test-wise. Ones the maximum groupsize is reached, or no MS could be admitted without breaking the minimumSNIR requirement the SDMA group is fully constructed. For each subsequenttime slot, this procedure is repeated until the initial pool of MSs is empty and
21
a list of compatible SDMA groups has been generated.The BFA extends the principle of the FFA, instead of adding the first MS
which does not break the minimum SNIR requirement of the group it addsthe best compatible MS of all available based on a SDMA group performancemetric.
The final, and most complex grouping algorithm included in the groupingmodule is the CBA. In comparison to the FFA/BFA it takes a completely differ-ent approach. Instead of optimizing a single SDMA group it tries to optimize acomplete set of SDMA groups. Initially k MSs are randomly distributed amongd kN e groups, assuming that an N -element antenna array can serve at most N
MSs within a SDMA group. After this step the SDMA group set is iterativelyimproved through exchanging MSs between groups until every MS is above theminimum SNIR requirement. The exchange is performed in two steps, only if itimproves the sum of a given metric. In the first step every MS pair i, j, that liein different SDMA groups, are swapped and tested if this exchange improves thesum of both group metrics. If it does and no MS is below the minimum SNIRrequirement they are reassigned. In the second step a single MS is allowed tojump into another SDMA group in case this increases the metric. In addition, ifat the end of one iteration some MSs are below the minimum SNIR requirementthey are separated into their own SDMA group, which increases the number ofSDMA groups at most by one, upon each iteration. A more detailed descriptionof this algorithm is given in [ZMDMXC12].
These three grouping algorithm have two things in common. They all buildSDMA groups containing MSs that lie above the minimum SNIR requirement,to ensure that every MS can be served at least in the lowest MCS, and they alluse the same SDMA grouping metric, namely the group capacity:
Ccap(G) =∑u∈G
log2(1 + SNIRlin(u)), (4)
where G is the given SDMA group and SNIRlin(u) the function which returnsthe achieved SNIR of MS u in linear units.
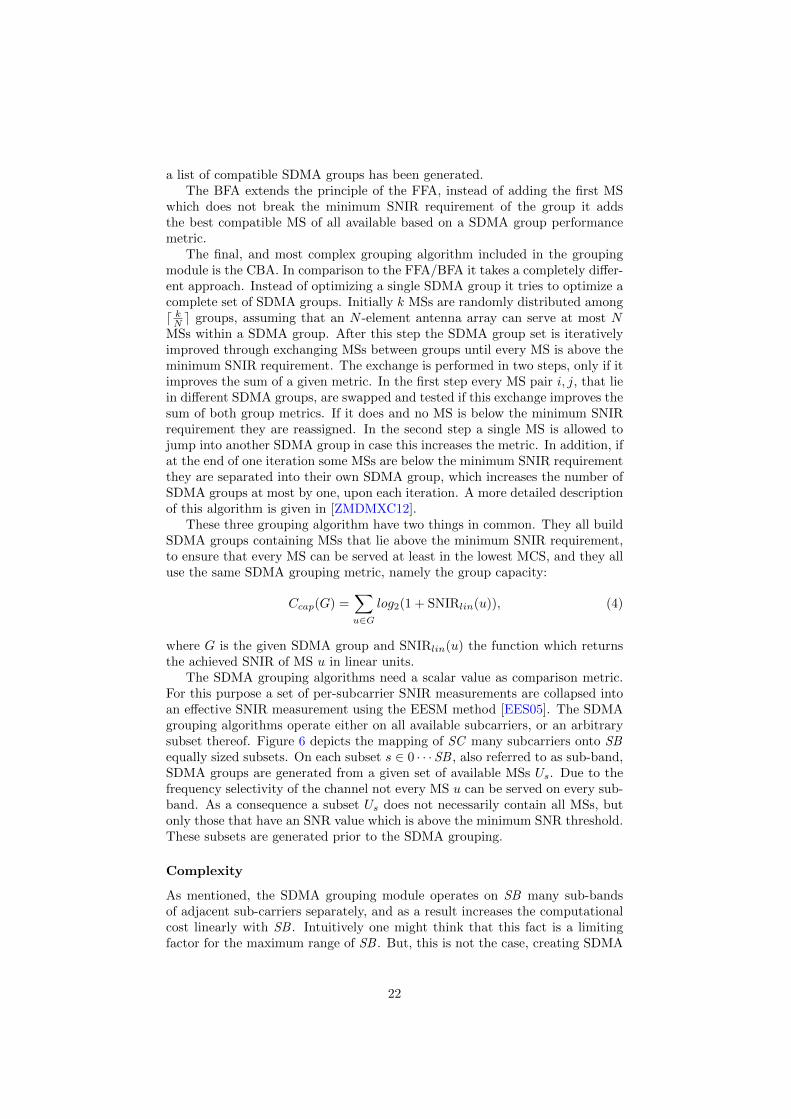
The SDMA grouping algorithms need a scalar value as comparison metric.For this purpose a set of per-subcarrier SNIR measurements are collapsed intoan effective SNIR measurement using the EESM method [EES05]. The SDMAgrouping algorithms operate either on all available subcarriers, or an arbitrarysubset thereof. Figure 6 depicts the mapping of SC many subcarriers onto SBequally sized subsets. On each subset s ∈ 0 · · ·SB , also referred to as sub-band,SDMA groups are generated from a given set of available MSs Us. Due to thefrequency selectivity of the channel not every MS u can be served on every sub-band. As a consequence a subset Us does not necessarily contain all MSs, butonly those that have an SNR value which is above the minimum SNR threshold.These subsets are generated prior to the SDMA grouping.
Complexity
As mentioned, the SDMA grouping module operates on SB many sub-bandsof adjacent sub-carriers separately, and as a result increases the computationalcost linearly with SB . Intuitively one might think that this fact is a limitingfactor for the maximum range of SB . But, this is not the case, creating SDMA
22
groups spanning all sub-carriers, and grouping MSs per sub-carrier is at mostof equal computational cost.
Let us assume an arbitrary grouper performs at most E many evaluations,let the cost for estimating the performance of an SDMA group per subcarrier bea constant C, and may the total number of subcarriers be given by SC . Thus,the total cost of SDMA grouping over all subcarriers would be E × (C × SC ).Now, consider splitting the total numbers of subcarriers into SB many equallysized subsets. Due to the frequency selective channel, the grouping must bedone per subset separately. So there are SB × E evaluations of SDMA groups,but only SC/SB many subcarriers that play a role per evaluation. In total thecost would be SB ×E × (C × SC × 1
SB ), as can be seen these are the same costas grouping over all subcarriers: E × (C × SC ).
Therefore, SB can be chosen as large as SC , meaning there is no complexitypenalty for performing SDMA grouping per subcarrier. In fact, increasing SB ,on one hand increases the number of SDMA group evaluations, and on the otherhand reduces the cost per evaluation with the same magnitude.
Figure 6: All available subcarriers SC are divided into SB many equally largesubsets of subcarriers. The SNIR values within these subsets are collapsed intoa single SNIR representation using the EESM method. Upon these values theSDMA grouping algorithm generate SDMA groups for every sub-band sepa-rately.
3.2.3 SNIR Prediction
As noted in Section 3.2.2 the SDMA groups are evaluated using the group ca-pacity (eq. 4) based on the estimated SNIR of each member of the group. TheSNIR includes the intra-group interference and can be accurately estimated us-ing the applied precoding weights as in Equation 9. As explained earlier, theSDMA grouping collapses multiple subcarrier SNIRs into a scalar value usingthe EESM mapping technique. However, these calculations require complex vec-tor/matrix operations to be performed per subcarrier with high computationalcost. As an alternative this work proposes a SNIR Prediction algorithm that ob-tains an SNIR equivalent representation of each subcarrier without performingexpensive pre-coding computations.
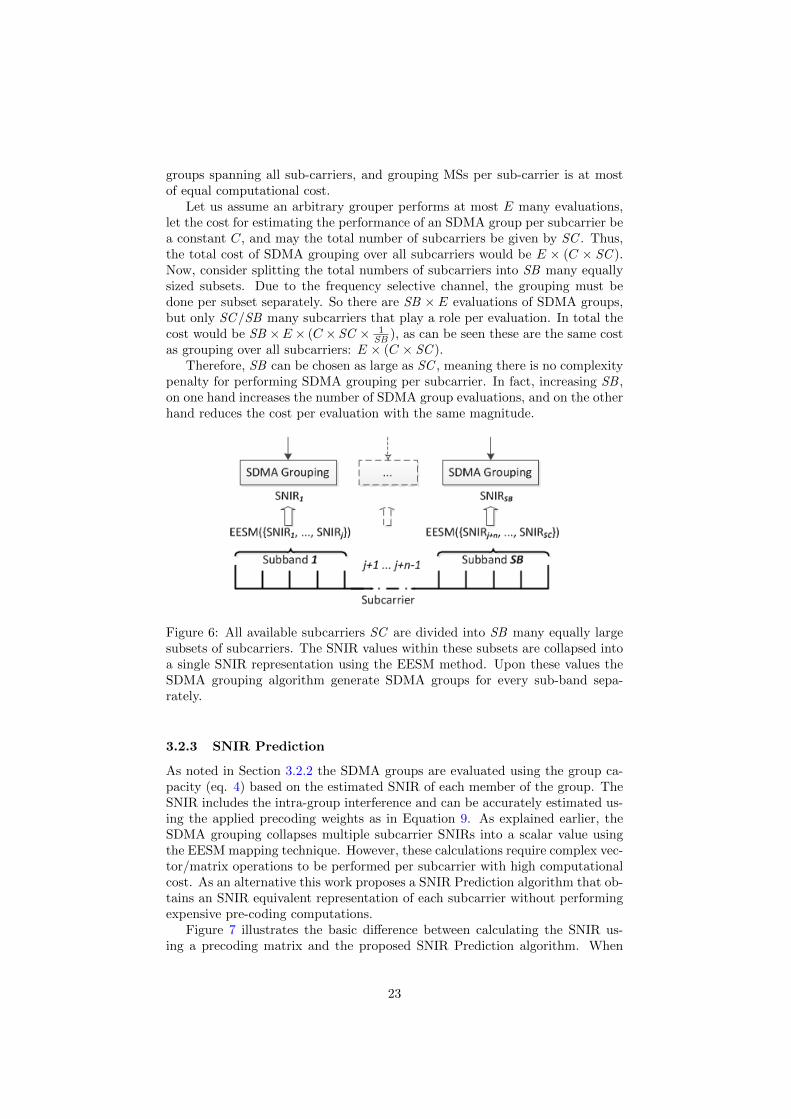
Figure 7 illustrates the basic difference between calculating the SNIR us-ing a precoding matrix and the proposed SNIR Prediction algorithm. When
23
SINR Estimation from
PrecodingSINR Predictor
Considered spatial correlation
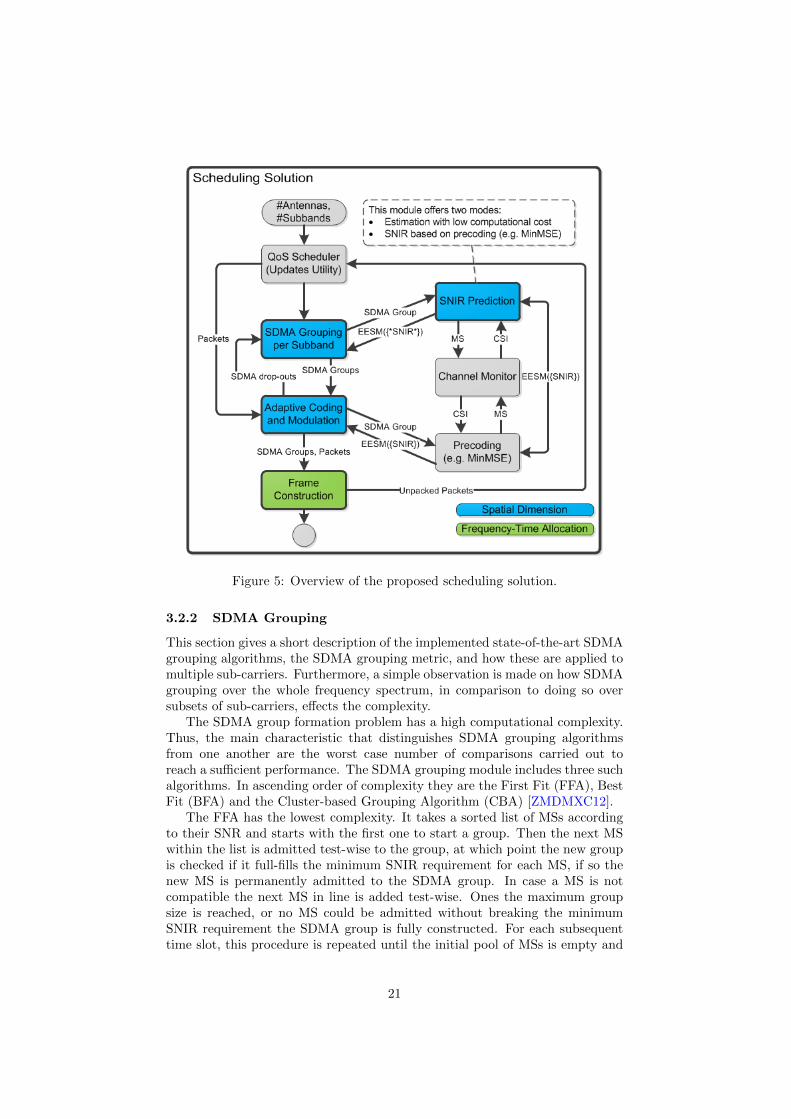
Figure 7: Illustration of two method for calculating the SNIR of a MS: (i) fromthe actual precoding matrix derived by any arbitrary MIMO technique, (ii)using the SNIR prediction algorithm.
calculating the SNIR of an MS (red) within an SDMA group the proposedSNIR Prediction method considers only the spatial correlation between the MSof interest and the other MSs within that group. Hence, unlike the case ofusing a precoding matrix, in the SNIR Predictor case the spatial correlationsbetween the other MSs within that group are not considered. Therefore, theSNIR Predictor has a lower complexity but introduces an estimation error inthe per-subcarrier SNIR.
In particular, the SNIR for any SDMA group G and MS i ∈ G on frequencyresource block b is estimated in the following way:
γb(u,G) = SNRMRC(u) ·
{1− χb
u, if χbu ≤ 1
β, else(5)
where χbu =
∑u′∈G,u′ 6=u τ
bu,u′ , i.e. the sum of the squared spatial correlations
between MS u and the other MSs in group G on frequency resource block b.The idea of the SNIR Predictor is to consider an initial SNIR for a MS u in
an SDMA group G and frequency resource block b that is obtained assuminga non-SDMA transmission (MRC beamforming, refer to Equation 11). Then,this initial SNIR estimation is corrected by the expected intra-SDMA groupinterference caused by the other MSs in the group. In particular, the appliedcorrection factor is either χb
u if χbu ≤ 1, or a constant factor β, which in this case
set to 13.5 dB (0.0443 in linear), if χ > 1. The reason for the constant factoris that numerical simulations showed that for χ > 1, the MS’s SNIR was onaverage 13.5 dB below its SNRMRC value. This applied constant factor thoughcould be tuned in order for the SNIR Predictor method to be applied in otherscenarios.
Notice that considering a minimum threshold for packet reception on thelowest MCS of 5 dB together with a SNR drop of 13.5 dB results in a requiredSNR of 18.5 dB, which is the region for the highest MCS in 802.16e. Therefore,only high SNR MSs are likely to cope with strong interference without drop-
24
ping below the minimum threshold for packet reception; e.g. a MS u having aSNRTxBf(u) < 18.5 and χ > 1 is considered to be in outage.In addition, for a given frequency resource block b, the term τsu,u′ in Equation 5is computed as:
τu,u′ = (pu,u′)2 (6)
where given the channels hu and hu′ of MSs u and u′, respectively, p representsthe spatial correlation between these two MSs on a given frequency resourceblock and is given by the maximum normalized scalar product [Cal04]:
pu,u′ =|hHuhu′ |
||hu||2||hu′ ||2(7)
Complexity
The proposed SNIR prediction algorithm, as simple as it seems, holds the po-tential for being equally complex as any arbitrary precoding technique. Thismeans the most important part of the proposed method is, in fact, the symmet-ric properties of the correlation function which reduces the computational costseverely. Through applying basic caching techniques any redundant operationscan be prevented and each SDMA group evaluation is reduced to a simple sumof scalars.
An arbitrary MIMO beam-former technique that optimizes beamformingweights under a certain criteria does so by solving a system ofN linear equations.Using Gaussian elimination for this purpose results in an arithmetic complexityof O(N3) [Far88], where N is the number of antennas in the BS. The SNIRpredictor proposed can be just as complex as O(N3). However, by using cachingtechniques as well as the nature of iterative groupers the complexity can bereduced to O(N).
The complexity of computing the term τ itself is linear on the number ofantennas in the BS, i.e. O(N). In addition, within the context of an SDMAgroup evaluation, τ must be calculated for each MS to every other interferingMS. This means that for a given group size g there will be a total of g(g −1) evaluations of the term τu,u′ , hence resulting in an overall complexity ofO(M)g(g − 1) = O(M · g2). Obviously, g can be at most N , in which case thecomplexity would be O(N3), at worst.
However, the term τu,u′ can be pre-computed and stored in a lookup table.Pre-generating the values for every MS pair reduces the complexity of evaluatingan SDMA group to g(g − 1) simple lookups, and, given that g ≤ N , the overallworst case complexity would be O(N2). Finally, for any SDMA grouper thatevaluates SDMA groups iteratively through sequentially adding MSs (e.g. BFAor our CBA grouper) the complexity could be reduced even further. The reasonis that every time a new MS is added to a group, every MS within the grouponly needs to add its correlation to the added MS, whereas the newly addedMS sums the correlation to every other MS, hence resulting in (g − 1 + g − 1)lookups and a complexity of O(g), or at worst O(N).
3.2.4 Adaptive Modulation and Coding (AMC) Module
The Adaptive Modulation and Coding (AMC) module is used for adapting thecoding-scheme on a burst-by-burst basis per link, depending on the current
25
channel conditions. In order to do so a set of SDMA groups is given by theSDMA grouping module, each associated to a given sub-band, and an accurateSNIR estimate is used to assign an MCS to each burst for a given target blockerror rate. In case the SDMA grouping was performed using the low complexSNIR prediction algorithm additional measures are undertaken to compensateits error. This section describes the general MCS selection, as well as theseextra measures.
In order to derive the MCS to be assigned, the AMC module computes theactual pre-coding matrices per frequency block within the used sub-band foreach MS in an SDMA group. Once the pre-coding matrices are computed, theAMC module can obtain an accurate SNIR estimate for each MS and frequencyblock by means of Equation 9. Then, the AMC module collapses the set ofper-frequency block SNIR values, {γu,b}, into a single equivalent SNIR value foreach MS making use of the EESM mapping technique. Finally, a single scalarSNIR value is available for each MS and given a target block error rate (1% inthis case), the AMC module selects the proper MCS by doing a simple look upoperation on a pre-computed Block Error Rate-SNR table.
In addition, as mentioned, the AMC module compensates introduced errorsby the low complex SNIR prediction algorithm, in case it has been appliedfor the SDMA group formation. The low complex SNIR prediction, as willbe shown later, tends to be optimistic especially as the number of antennasgrows, which means some groups might have MSs that can not be served andmust be regrouped accordingly. This situation is dealt with in Algorithm 1,where for each SDMA group G having MSs in outage, the worst MS u (largestSNRMRC(u) − γ(u,G)), is removed from the group. Then, a new precodingmatrix is calculated for the remaining MSs left in the group. The removed MSsare collected and handed back to the SDMA grouping module that re-computesSDMA groups for the in-outage MSs (see Figure 5). Also, every time the SDMAgrouping module has to re-group a set of MSs, the maximum SDMA group sizeis reduces by one. This is done out of two reasons: for one, the computationalcost for SNIR prediction used by the grouper reduces as the maximum SDMAsize decreases, and for another the likelihood of outage MSs to be in outageagain decreases as well, since the number of potential interferer in an SDMAgroup is reduced.
Complexity
Given a set of SDMA groups, the number of precoding calculations performedby the AMC module corresponds to the product between the number of groups,|G|, and the number of frequency blocks, B. However, when using the lowcomplex SNIR prediction, additional precoding calculations may be required ifthere are MSs in outage. Assume that in the worst case the SNIR predictionleads to |G| groups; each consisting of N highly correlated MSs that cannot beserved together. In that case, in each iteration of Algorithm 1 each group isreduced until its group size reaches one, resulting in a total of O(|G|N2B) pre-coding calculations. Therefore, if |G| = dK/Ne the worst case time-complexityregarding the number of precoding calculations is O(BNK). In case of multiplesub-bands the number of groups G is increased with equal magnitude as thefrequency blocks per group is reduced, which effects the complexity in the samemanner as the grouping described in Section 3.2.2 and, therefore, is neglectable.
26
Algorithm 1 Required preprocessing step in the AMC module when SNIR predictionalgorithm is used for SDMA grouping.
Require:1: K - Number of MSs; N - Number of BS antennas2: procedure ProcessOutageMSs3: U ← 1 : K . Set of all MSs.4: G∗ ← ∅ . Final grouping configuration.5: for maxGroupSz = N downto 2 do6: G ← SDMAGroupingModule(U,maxGroupSz ) . Using SNIR predictor7: U ← ∅ . MSs to be regrouped8: for Gi ∈ G do9: while O = getOutageMSsAfterPrecoding(Gi) 6= ∅ do
10: u← arg maxu∈O{SNRMRC(u)− γ(u,Gi)} . The MS which suffered most11: Gi ← Gi\u . Remove u from group Gi
12: U ← U ∪ u . Add u to MSs to be regrouped.13: end while14: G∗ ← G∗ ∪Gi . Valid group Gi is added to final grouping15: end for16: if U == ∅ then . No more MSs in outage; terminate17: break18: end if19: end for20: return G . Return grouping21: end procedure
3.2.5 Frame Construction
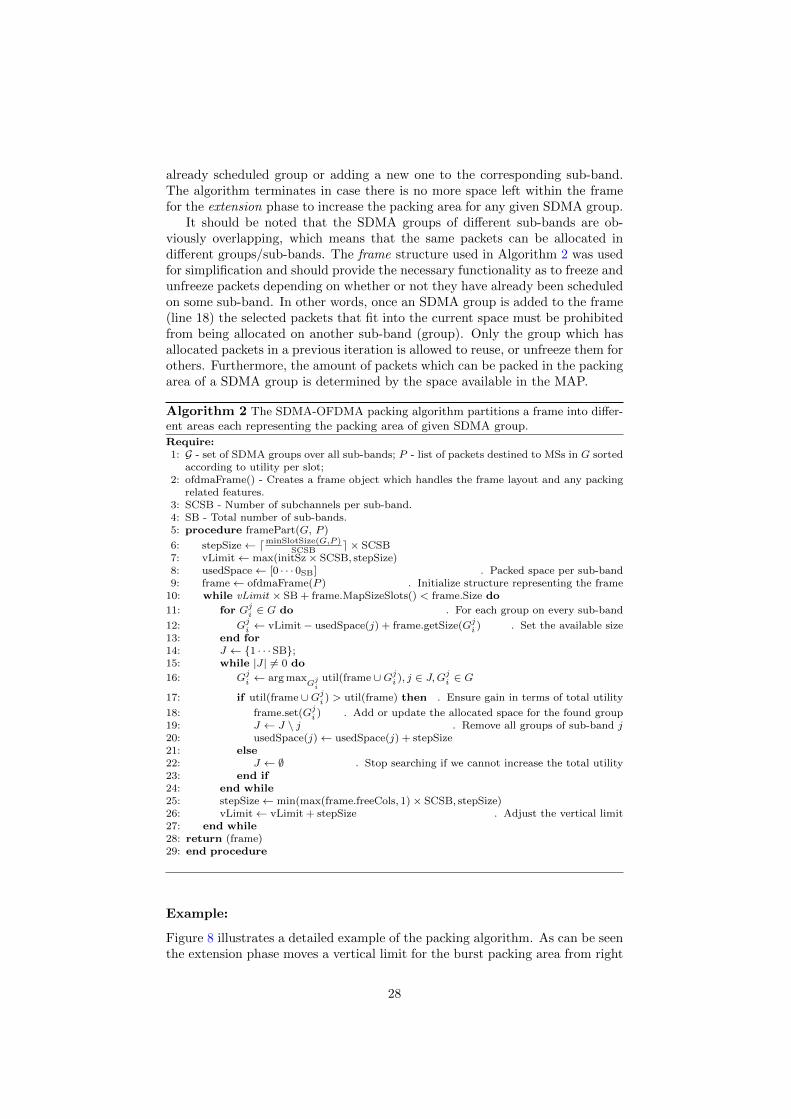
The Frame Construction algorithm constructs an OFDMA frame from multipleper-sub-band available SDMA groups and their packets with the main goalto maximize the total utility carried by an OFDMA frame4. Additionally itsupports a variable number of sub-bands to be used with the goal to achieve aFSS gain. The higher the total number of sub-bands available, the higher theprobability to find a sub-band with favorable channel conditions for an SDMAgroup.
Given a set of SDMA groups per sub-band, the algorithm selects a subsetof these groups to be allocated within the current SDMA-OFDMA frame de-pending on the utility of corresponding packets. In addition the space neededfor signaling the DL-MAP, which varies depending on the selected groups, isallocated as well. Algorithm 2 describes the algorithm consisting of two phases:the extension phase (outer loop) and the selection phase (inner loop). The ex-tension phase allocates the frame in the time dimension in a stepwise fashion,whereas the selection phase chooses the best groups over all sub-bands as toachieve a FSS gain.
In the extension phase a certain area is made available for packing. In theselection phase the best SDMA group over all sub-bands, which maximizes thesum utility of the frame using the available packing area is scheduled with itsgiven size. For each next iteration within the selection phase the best group ofall remaining sub-bands is scheduled. After all sub-bands have been allocatedthe extension phase increases the total packing area in width, int the timedomain, and the selection process is repeated, either increasing the area of an
4The packets within an SDMA layer are greedily allocated through sequentially addingpackets until the available capacity has been reached. This packing algorithm can be replacedby a more efficient solution like the Greedy Scheduling Algorithm from [ZDMXCF10].
27
already scheduled group or adding a new one to the corresponding sub-band.The algorithm terminates in case there is no more space left within the framefor the extension phase to increase the packing area for any given SDMA group.
It should be noted that the SDMA groups of different sub-bands are ob-viously overlapping, which means that the same packets can be allocated indifferent groups/sub-bands. The frame structure used in Algorithm 2 was usedfor simplification and should provide the necessary functionality as to freeze andunfreeze packets depending on whether or not they have already been scheduledon some sub-band. In other words, once an SDMA group is added to the frame(line 18) the selected packets that fit into the current space must be prohibitedfrom being allocated on another sub-band (group). Only the group which hasallocated packets in a previous iteration is allowed to reuse, or unfreeze them forothers. Furthermore, the amount of packets which can be packed in the packingarea of a SDMA group is determined by the space available in the MAP.
Algorithm 2 The SDMA-OFDMA packing algorithm partitions a frame into differ-ent areas each representing the packing area of given SDMA group.
Require:1: G - set of SDMA groups over all sub-bands; P - list of packets destined to MSs in G sorted
according to utility per slot;2: ofdmaFrame() - Creates a frame object which handles the frame layout and any packing
related features.3: SCSB - Number of subchannels per sub-band.4: SB - Total number of sub-bands.5: procedure framePart(G, P )
6: stepSize← dminSlotSize(G,P )SCSB
e × SCSB7: vLimit← max(initSz× SCSB, stepSize)8: usedSpace← [0 · · · 0SB] . Packed space per sub-band9: frame← ofdmaFrame(P ) . Initialize structure representing the frame
10: while vLimit × SB + frame.MapSizeSlots() < frame.Size do
11: for Gji ∈ G do . For each group on every sub-band
12: Gji ← vLimit− usedSpace(j) + frame.getSize(Gj
i ) . Set the available size13: end for14: J ← {1 · · · SB};15: while |J | 6= 0 do
16: Gji ← arg max
Gji
util(frame ∪Gji ), j ∈ J,Gj
i ∈ G
17: if util(frame ∪Gji ) > util(frame) then . Ensure gain in terms of total utility
18: frame.set(Gji ) . Add or update the allocated space for the found group
19: J ← J \ j . Remove all groups of sub-band j20: usedSpace(j)← usedSpace(j) + stepSize21: else22: J ← ∅ . Stop searching if we cannot increase the total utility23: end if24: end while25: stepSize← min(max(frame.freeCols, 1)× SCSB, stepSize)26: vLimit← vLimit + stepSize . Adjust the vertical limit27: end while28: return (frame)29: end procedure
Example:
Figure 8 illustrates a detailed example of the packing algorithm. As can be seenthe extension phase moves a vertical limit for the burst packing area from right
28
Figure 8: SDMA-OFDMA packing example. The selection phase schedulesSDMA groups per sub-band based on the maximum increase of the total utilitycarried by the frame. In case (4) the additional space is not sufficient to packadditional packets, stays therefore unallocated and can be scheduled during thenext extension phase (6). The packing area gradually approaches the MAP areauntil it becomes a limiting factor for the last added SDMA groups.
to left towards a column wise growing MAP growing from left to right. Theinitial vertical limit sets the largest available space for the selection phase, afterwhich it is incremented by a predetermined step size that eventually reduces toone single column until MAP and packed area cover all columns of the wholeframe. In the last step the last scheduled SDMA groups are limited by the lackof available space for the MAP (ref. to group G2
2 in Figure 8).
Additional details:
The vertical limit was a necessary design choice due to the column wise growingMAP. It ensures that the packing area of all sub-bands grow more evenly in theend so that no single sub-band blocks the MAP to early due to favorable channelconditions. The initial vertical limit as well as the step wise incrementation arean essential part of that process. The initial vertical limit should be as largeas possible in favor of the frequency-selective scheduling gain, as well as tominimize the eventually needed steps that are necessary for a gradual approachbetween the MAP and the packed area. The initial vertical limit in full columnsis calculated as follows:
initSz =⌈ (DLsl − 1)× SC/MSB −Map∗sz ×N
SC× SB
⌉, (8)
29
where N is the number of antennas at BS, DLsl the total number of slots (i.e.columns) and SC the total number of subchannels (i.e. rows) in the OFDMAframe. Map∗sz is the predicted MAP size in slots per SDMA layer and SB thenumber of sub-bands used. Map∗sz was estimated based on the total numberof 40 Byte packets that can be merged and signaled into SC many slots onan average MCS. The idea behind this concept is that the initial vertical limitallows the same number of slots for any number of sub-band with MSB beingthe maximum and that the pessimistically estimated large MAP allows the restof the frame to be used for an SDMA group. This value is set in Algorithm 2line 7. The step size should be as small as possible incrementing the packingarea by one column per step. In case the packet queue is filled with very largepackets a small step size might be to small for additional packets, therefore, it isoverridden by the maximum minimum burst size encountered in all MS packetqueues rounded to full columns (line 6). As the incrementation of the packetarea approaches the map area the step size will be limited by the remainingavailable space (line 25).
Complexity:
There are K MSs per sub-band each corresponding to a spatial layer, indepen-dent of SDMA group affiliation. This means the expression line 16 has to esti-mate the utility gain of K × SB many layers. The selection phase is performedSB times and the extension phase at most DLsl . The worst case total numberof utility estimations performed is, therefore, DLsl × SB [K × SB ] = O(SB2).
30
4 System-level Simulations
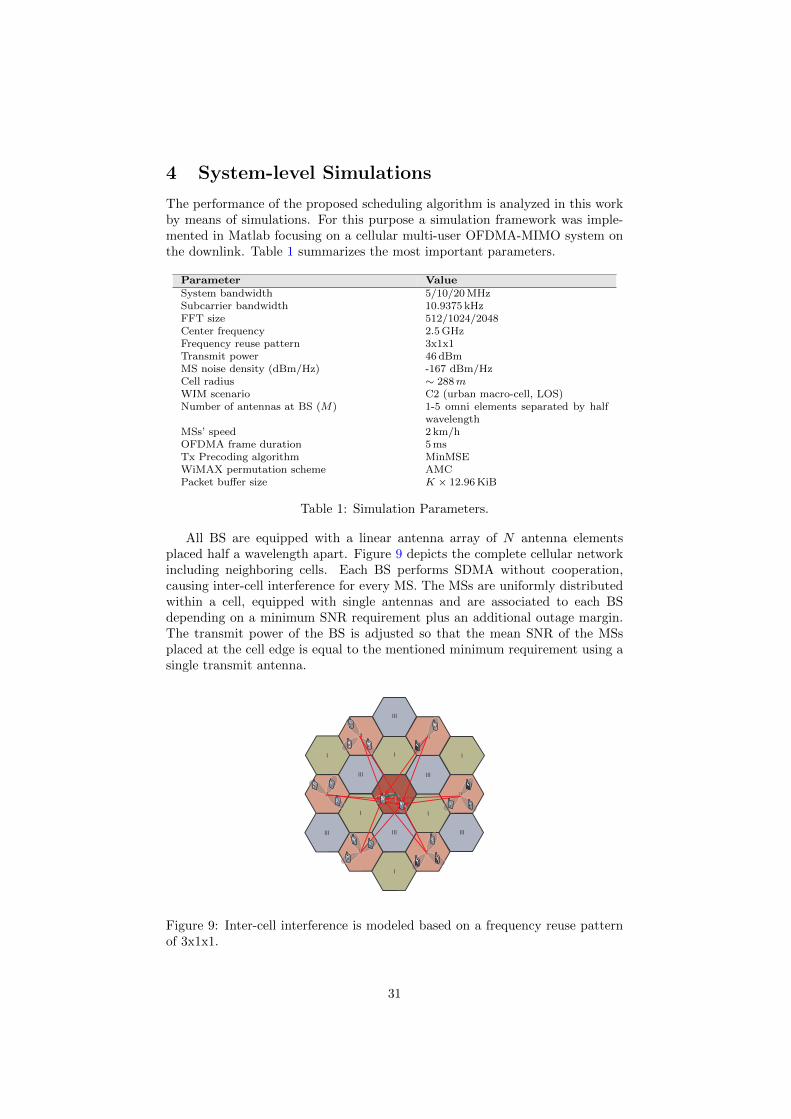
The performance of the proposed scheduling algorithm is analyzed in this workby means of simulations. For this purpose a simulation framework was imple-mented in Matlab focusing on a cellular multi-user OFDMA-MIMO system onthe downlink. Table 1 summarizes the most important parameters.
Parameter ValueSystem bandwidth 5/10/20 MHzSubcarrier bandwidth 10.9375 kHzFFT size 512/1024/2048Center frequency 2.5 GHzFrequency reuse pattern 3x1x1Transmit power 46 dBmMS noise density (dBm/Hz) -167 dBm/HzCell radius ∼ 288mWIM scenario C2 (urban macro-cell, LOS)Number of antennas at BS (M) 1-5 omni elements separated by half
All BS are equipped with a linear antenna array of N antenna elementsplaced half a wavelength apart. Figure 9 depicts the complete cellular networkincluding neighboring cells. Each BS performs SDMA without cooperation,causing inter-cell interference for every MS. The MSs are uniformly distributedwithin a cell, equipped with single antennas and are associated to each BSdepending on a minimum SNR requirement plus an additional outage margin.The transmit power of the BS is adjusted so that the mean SNR of the MSsplaced at the cell edge is equal to the mentioned minimum requirement using asingle transmit antenna.
I
III III
II
III
I I
III III
II
I
II
I
II
II
III
II
I
III
IIIIIIIIIIIIIIIII
IIIIIIIIII
IIIII IIIIII
IIIIII
Figure 9: Inter-cell interference is modeled based on a frequency reuse patternof 3x1x1.
31
In each simulation an 802.16 OFDMA frame is considered having a durationof 5ms, for which the channel response is assumed to be flat. This assumption isbased on low MS mobility and is well within the boundaries of a typical 802.16use-case, where the coherence time for a carrier frequency of 2.5 GHz and amobility speed of 2 km/h is roughly 200 ms [AGM07]. The OFDMA frame isdivided into DL and UL sub-frames with a 35/12 DL/UL ratio. In order toexploit the frequency-selective-channel and multi-user diversity adjacent sub-carriers are grouped into logical subchannels (AMC). An equal transmit powerand the same average noise power is assumed for all sub-carriers.
The resource allocation is delivered in MAP messages at the beginning ofeach frame and is preceded by the Frame Control Header (FCH). FCH providesthe necessary information required to decode the subsequent MAP message, e.g.MAP length and coding. For robustness the MAP is send omni-directionallywith QPSK 1/2. The size of the DL-MAP varies depending on the allocatedresources on a frame by frame basis. Table 2 depicts the different informationelements and their sizes.
Table 2: Parameter used for the calculation of the DL-MAP size.
Channel state information is know at the BS and is acquired through ULsounding, and/or through channel reciprocity. For each MS the BS knows thechannel transfer coefficients of every 28th subcarrier for every antenna element.Depending on the channel bandwidth of 5/10/20 MHz there are a total of N×15,N × 30, or N × 60 coefficients per MS, respectively. Furthermore, the BS hasfull CSI without estimation errors.
4.1 Link Level
The MIMO channel and its coefficients where generated with the WIM simu-lator of the WINNER-Phase II project (Wireless World Initiative New Radio).An implementation based on the WINNER II model, referred to as WIM, hasbeen implemented and is available under GPL license [KMH07b]. This includesa universal system model capable of adapting to a wide range of mobile commu-nication scenarios, including various propagation models for a frequency rangeof 2 to 6 GHz [KMH07a].
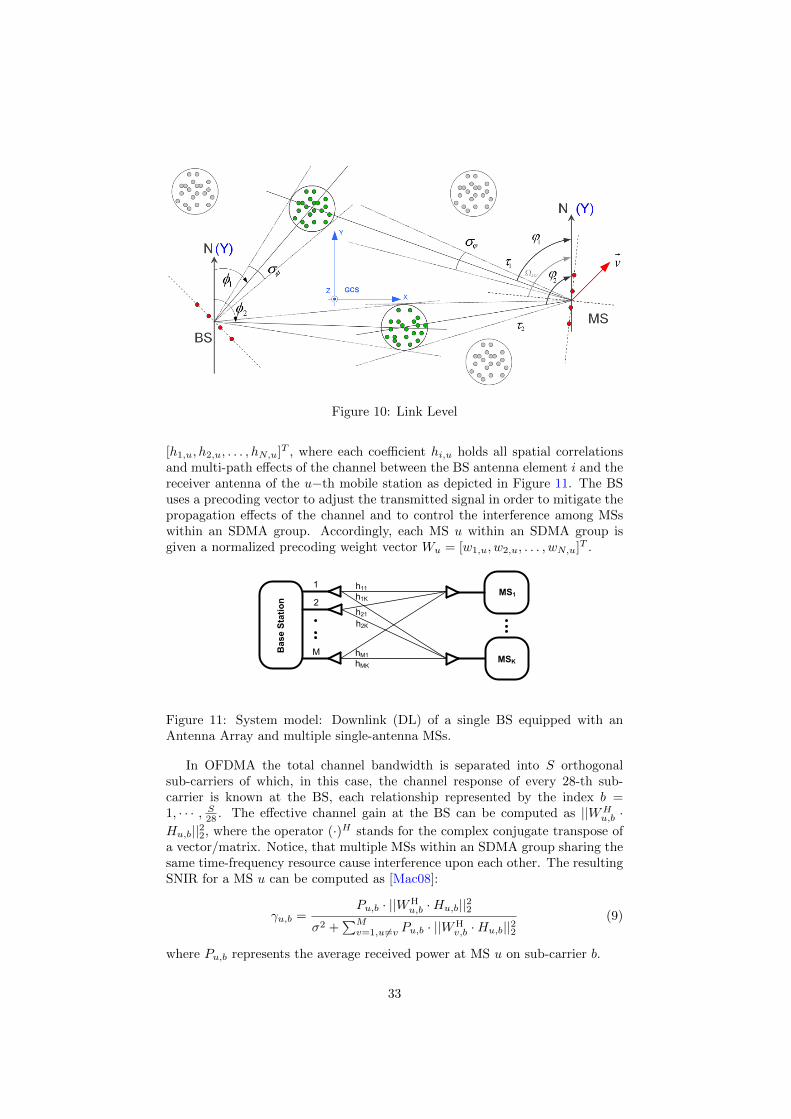
In Figure 10 a single MIMO link is depicted. The spatial characteristics ofthe environment are geometrically modeled through clusters of scatters, and areinfluenced by the antenna fields on receiver and transmitter side. A total of 20scatters results in 20 sub-paths per cluster, independent of the scenario. Thenumber of clusters varies from 8 to 24 and are scenario dependent. The spatialand temporal characteristics of each link between MSs and BS where modeledaccording to the LoS/NLoS C1 Suburban macro-cell scenario.
The BS uses the knowledge of the channel response to serve multiple MSsseparated in space. For each MS u(u = 1, . . . ,K), associated with the BS,the frequency dependent channel response is represented by a vector Hu =
32
Figure 10: Link Level
[h1,u, h2,u, . . . , hN,u]T , where each coefficient hi,u holds all spatial correlationsand multi-path effects of the channel between the BS antenna element i and thereceiver antenna of the u−th mobile station as depicted in Figure 11. The BSuses a precoding vector to adjust the transmitted signal in order to mitigate thepropagation effects of the channel and to control the interference among MSswithin an SDMA group. Accordingly, each MS u within an SDMA group isgiven a normalized precoding weight vector Wu = [w1,u, w2,u, . . . , wN,u]T .
h21
h1K
1
2
MBaseStation
MS1
MSK
h11
h2K
hMK
hM1
Figure 11: System model: Downlink (DL) of a single BS equipped with anAntenna Array and multiple single-antenna MSs.
In OFDMA the total channel bandwidth is separated into S orthogonalsub-carriers of which, in this case, the channel response of every 28-th sub-carrier is known at the BS, each relationship represented by the index b =1, · · · , S
28 . The effective channel gain at the BS can be computed as ||WHu,b ·
Hu,b||22, where the operator (·)H stands for the complex conjugate transpose ofa vector/matrix. Notice, that multiple MSs within an SDMA group sharing thesame time-frequency resource cause interference upon each other. The resultingSNIR for a MS u can be computed as [Mac08]:
γu,b =Pu,b · ||WH
u,b ·Hu,b||22σ2 +
∑Mv=1,u6=v Pu,b · ||WH
v,b ·Hu,b||22(9)
where Pu,b represents the average received power at MS u on sub-carrier b.
33
Based on the prior defined vector representation of the channel, the BS imple-ments two beamforming techniques. In SDMA mode the sub-streams of multipleMSs are separated through weights given by the Minimum Mean Square Errortechnique (MinMSE) [Gro05]. Whereas, in case of a single MS the weights aresimply aligned to the given channel according to the Maximum Ratio Combining(MRC) technique also known as transmit beamforming [OC07].
MinMSE works in the following way. For a given sub-carrier b the matrixHb contains in each u-th column the channel coefficients (Hu,b) of the u-th MS.Let Rss = Hb ·HH
b be the autocorrelation matrix of all MSs within an SDMAgroup, and Rnn the noise correlation matrix. Then, the weight matrix Wb
containing the beamforming weights for every u-th MS, can be computed as:
Wb = (Rss + Rnn)−1 ·Hb, (10)
where the u-th column in Wb contains the weights for the u-th MS for the givenfrequency resource unit b.
For the single MS case the full antenna diversity gain is achieved throughapplying MRC weights, calculated as:
WHu,b =
HHu,b
||Hu,b||22. (11)
The achieved SNR of a single MS u is also given by Equation 9, using theMRC beamforming weights and ignoring the intra-cell interference term. Thedenominator of Equation 11 normalizes the weights to unity so that the averagetotal transmit energy remains the same. The same normalization is performedfor the weights given by the MinMSE technique.
4.2 Error Model
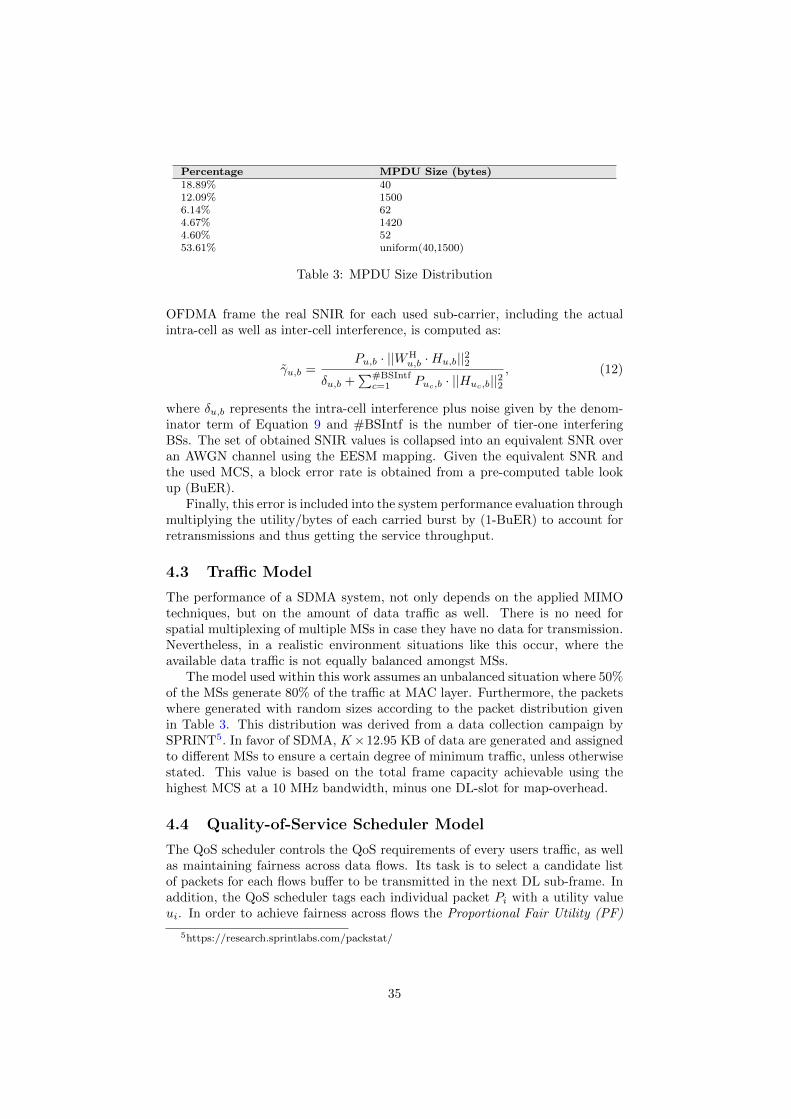
The main focus of this work lies on the performance of the SDMA-OFDMAMAC scheduler in terms of sevice throughput, which depends on the successfullydecoded data on receiver side. A common approach is to predict the decodedPDU error rate given a set of SNIR values for each sub-carrier used by thePDU, and its MCS [For08]. For an SDMA-OFDMA system there are threemain factors that contribute to the actual SNIR. Namely, the accuracy of theestimated channel state (CSI), the interference between spatially multiplexedMSs within the cell (intra-cell), and the interference of neighboring cells (inter-cell).
The accuracy of the estimated CSI heavily depends on the applied technique.Since these techniques lie outside of the scope of this work, as mentioned, per-fect CSI is assumed. As a result, the intra-cell interference of MSs can beaccurately computed by equation 9. This leaves the inter-cell interference asmain contributer to the error between the assumed SNIR at the BS and theactual SNIR.
The effects of the inter-cell interference where modeled as follows. Based ona typical 3x1x1 deployment, as depicted in Figure 9, the tier-one interfering cellswhere simulated, and performed the same SDMA-OFDMA MAC scheduling asthe center cell. Consequently, creating random interference on the target cellunknown prior to transmission. For each burst packed by the center cell in an
OFDMA frame the real SNIR for each used sub-carrier, including the actualintra-cell as well as inter-cell interference, is computed as:
γu,b =Pu,b · ||WH
u,b ·Hu,b||22δu,b +
∑#BSIntfc=1 Puc,b · ||Huc,b||22
, (12)
where δu,b represents the intra-cell interference plus noise given by the denom-inator term of Equation 9 and #BSIntf is the number of tier-one interferingBSs. The set of obtained SNIR values is collapsed into an equivalent SNR overan AWGN channel using the EESM mapping. Given the equivalent SNR andthe used MCS, a block error rate is obtained from a pre-computed table lookup (BuER).
Finally, this error is included into the system performance evaluation throughmultiplying the utility/bytes of each carried burst by (1-BuER) to account forretransmissions and thus getting the service throughput.
4.3 Traffic Model
The performance of a SDMA system, not only depends on the applied MIMOtechniques, but on the amount of data traffic as well. There is no need forspatial multiplexing of multiple MSs in case they have no data for transmission.Nevertheless, in a realistic environment situations like this occur, where theavailable data traffic is not equally balanced amongst MSs.
The model used within this work assumes an unbalanced situation where 50%of the MSs generate 80% of the traffic at MAC layer. Furthermore, the packetswhere generated with random sizes according to the packet distribution givenin Table 3. This distribution was derived from a data collection campaign bySPRINT5. In favor of SDMA, K×12.95 KB of data are generated and assignedto different MSs to ensure a certain degree of minimum traffic, unless otherwisestated. This value is based on the total frame capacity achievable using thehighest MCS at a 10 MHz bandwidth, minus one DL-slot for map-overhead.
4.4 Quality-of-Service Scheduler Model
The QoS scheduler controls the QoS requirements of every users traffic, as wellas maintaining fairness across data flows. Its task is to select a candidate listof packets for each flows buffer to be transmitted in the next DL sub-frame. Inaddition, the QoS scheduler tags each individual packet Pi with a utility valueui. In order to achieve fairness across flows the Proportional Fair Utility (PF)
5https://research.sprintlabs.com/packstat/
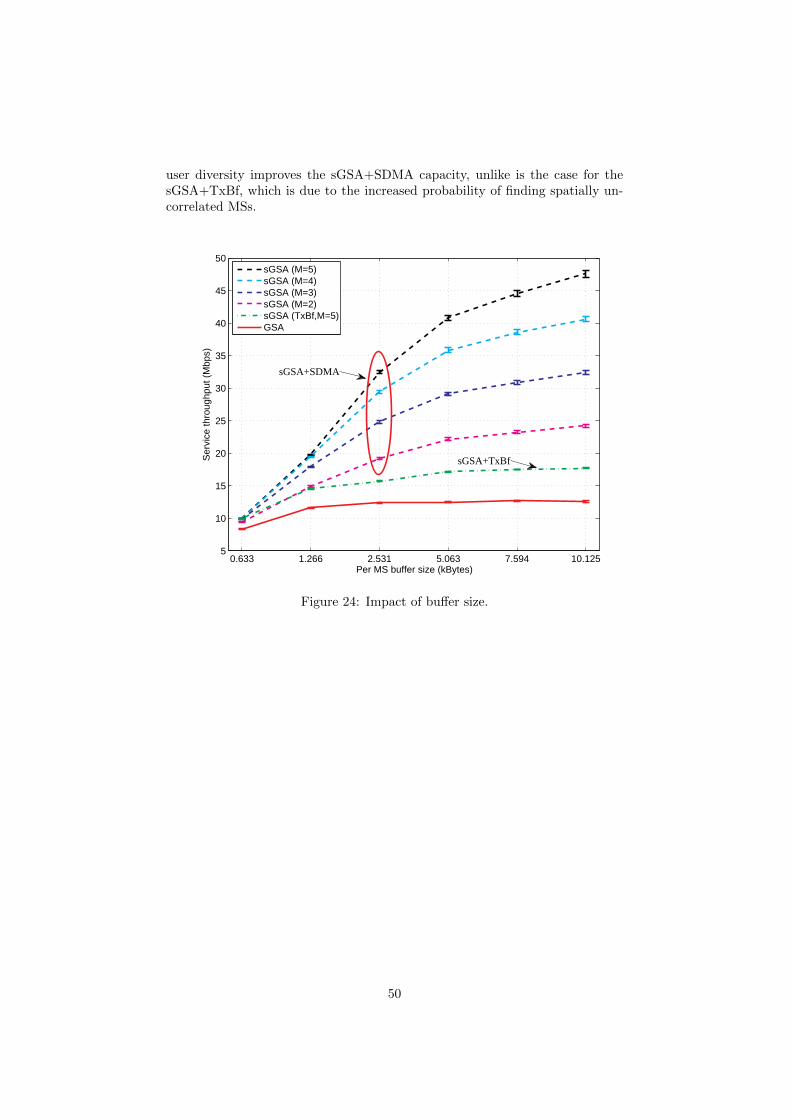
35
function was used to derive the utility value ui for each packet within the bufferfor the next transmission.The Proportional Fair Utility (PF) [LSM08], upf() achieves fairness throughassigning each packet its size in bytes weighted by the average throughput ofprior sessions. This means that, on one hand, efficient packets with a largepayload in bytes attain a high priority, thus, maximizing the throughput, and onthe other hand are reduced in priority in case the associated flow has a historyof high throughput, therefore, allowing less effective packets to be eventuallyprioritized. The utility Upacket assigned to each packet of size B in Bytes iscalculated as Upacket = B/T , where T is an Exponentially Weighted MovingAverage (EWMA) of consumed resources in Bytes that have been scheduled forthe flow of this packet in previous frames. It is defined as T (i) = (1−α) ·T (i−1) + α · N(i − 1), where N(i − 1) is the actual number of Bytes of the flow inframe i− 1, with N(i− 1) = 0 in case no data was send . 6
6The value for α in the EWMA filter is set to 0.2
36
5 Evaluation
In this section the results of the evaluation are presented. First, in Section 5.1the quality of the low complexity SNIR prediction algorithm and its margin oferror will be evaluated for the single-carrier, and multi-carrier (EESM) case.In Section 5.2 the effects of the proposed SNIR algorithm on system-level per-formance, without frequency-selective scheduling will be evaluated for differentSDMA grouping algorithm, whereas the best performing SDMA grouper andits results will be compared to an exhaustive search. Furthermore, in Section5.3 the option of the proposed scheduler to perform frequency selective schedul-ing with varying degree of granularity and its effects on performance will beanalyzed.
5.1 SNIR Prediction
The SNIR Prediction module, described in Section 3.2.3 provides two distinctways for estimating the SNIR values per subcarrier. The most accurate tech-nique is based on the actual precoding weights used for SDMA. Due to the highcomputational costs for this method a suboptimal low complex alternative wasproposed/included as well. In this section the margin of error of the low complexalternative is evaluated for the single carrier, the multi carrier case (EESM), aswell as its performance with different beamforming algorithms.
5.1.1 Single Carrier/Multi Carrier
The reduced computational cost of the SNIR Prediction method comes at aprice. Depending on the SDMA group size and the total number of availableantennas, the predicted SNIR differs from the actual SNIR. Figure 12 showsthe CDF plot of the error between the predicted SNIR and the actual SNIR forall possible SDMA group sizes, and random user combinations, averaged over101 seeds. Most noticeably, the error is almost non existent for two MSs, butas the group size approaches the maximum possible, the error increases. Thereason for this behavior lies in the nature of the prediction method, which onlyconsiders the correlation of every MS pair, instead in the context of the wholegroup.
37
Figure 12: The Cumultative Distribution Function of the error between pre-dicted SNIR and actual SNIR for all possible group sizes for N = 5.
In Figure 13 the mean error of the predictor is depicted for different numberof antennas. Similar to the CDF plot it shows that the error increases as itreaches the maximum possible group size, which seems valid for any number ofantennas. For only two MSs within a group the predictor underestimates theSNIR, but only with one db on average which could be a result of roundingerrors. In general the predictor seldomly underestimates the per subcarrierSNIR, but far more often, overestimates it, especially as the number of antennasgrows. What is also noteworthy is the fact that for all sizes of N the SNIR foreach MS within an SDMA group, containing half the amount of MSs as thereare degrees of freedom (N), can be accurately estimated.
38
Figure 13: Mean SNIR prediction Error per subcarrier, for various number ofantennas and group sizes. The number of users where 20 for 25 antennas, and15, 14 for antennas 8 and 12 respectively.
As described in Section 3.2.2, the SDMA grouping metric collapses multipleSNIR values into a scalar using the EESM compression method. Figure 14depicts the SNIR prediction error for 30 SNIR values spread over a bandwidthof 10 MHz collapsed into one SNIR representation. As can be seen the errorslightly increases by roughly one dB, in cases where the SDMA group size reachesN , in comparison to the single carrier case. Overall, the average error behavesin a similar fashion with multiple subcarriers as with a single carrier.
39
Figure 14: Mean SNIR prediction Error for 30 predicted subcarriers collapsedinto one scalar, various number of antennas and group sizes. The number ofusers where 20 for 25 antennas, and 15, 14 for antennas 8 and 12 respectively.
5.1.2 Influence of Beamforming techniques
The SNIR prediction method proposed is based on the channel correlationamongst MSs. It is based on the assumption that the correlation reflects theamount of interference that needs to be dealt with by any MIMO technique used.In Figure 15 the mean error between the estimated SNIR based on precodingand the predicted SNIR is depicted for common linear MIMO techniques. Theseinclude the Maximum SIR, Minimum Mean Square Error, Minimum VarianceDistortion-less Response [Gro05],and the Zero-Forcer [KBF+er]. The first threetechniques are know to be optimal in the sense that they optimize the SIR.As can be seen they all lead to the same mean error which increases as thegroup size approaches N . Only the Zero-Forcer technique holds a higher meanerror as it sacrifice more in order to enforce the nulls towards each interferer.As the Figure shows, the proposed method is fairly independent of the MIMOtechniques applied and even holds a lower error for techniques considered to beoptimal.
40
Figure 15: Mean SNIR prediction error for various MIMO techniques.
5.2 SDMA System Performance
The greatest problem faced by any practical SDMA-OFDMA scheduling solu-tion is the limiting factor of complexity. As the degrees of freedom increase,with multiple antennas and multiple subcarriers, system performance can befurther enhanced at the expense of exponentially-increasing scheduling com-plexity. This means that the main objective for any scheduler should be tomaximize performance whilst minimizing the involved computational costs.
In Section 5.2.1 the benefits of the proposed low complex SNIR Predictionmethod will be analyzed in terms of performance versus complexity. It will beshown that this method has the capabilities of reducing the computational costsof a highly complex SDMA grouper, like the CBA, to that of the most simplestate-of-the-art SDMA grouper, the FFA. The performance is measured in termsof system throughput, whereas the measurement of complexity was chosen asthe total number of executed floating point operations (FLOP) [Mac08]. Next,the different SDMA grouping algorithms will be evaluated more thoroughly inSection 5.2.2 using the SNIR Prediction method. Finally, in Section 5.2.3 theoverall performance of the low complex SNIR Prediction method combined withthe power of the CBA SDMA grouper will be compared against an exhaustivesearch grouper using the precoding based SNIR estimation under different sys-tem parameters.
41
5.2.1 SDMA Metric
One of the main contributor to the complexity of SDMA grouping is the group-ing metric which is used to compare different SDMA groups. A common metricis the group capacity metric based on the achievable SNIR values per MS.The most accurate SNIR estimation is given by the actual precoding weights.Its computational cost is rather high, therefore, low complex alternatives arepromising techniques to reduce the complexity. In the following the two SNIRestimation methods where compared: i) the SNIR Precoding, and ii) the SNIRPrediction from Section 3.2.3.
Figure 16 illustrates, for a scenario with N = 5 antennas at the BS andK = 20 MSs within the cell, the achieved service throughput for different SDMAgrouping algorithms (CBA, BFA, FFA) and the two methods for calculating theSNIR. Even though the SNIR Prediction holds a certain margin of error (Section5.1), it has only a small impact on performance. The CBA and BFA both suffer anegligible loss in throughput. The FFA is even better with the SNIR Predictionmethod, than with the precoding derived SNIR. A simple explanation wouldbe that since the SNIR Prediction overestimates the SNIR, which results inmalformed but larger SDMA groups, the additional processing step performedby the AMC module creates an unexpected bonus. The FFA is very simple,so the additional logic of the AMC post processing seems to contribute to theperformance.
SINR Precoding SINR Predictor
35
40
45
50
55
60
65
70
75
Ser
vice
thro
ughp
ut (
Mbp
s)
FFABFACBA
Figure 16: Service throughput.
In order to evaluate the reduction in complexity by the SNIR Predictionin comparison to the precoding based method Figure 17 depicts the numberof overall required FLOPs [Mac08]. These values include the initial costs forgenerating the spatial correlations between every MS pair, the number of re-
42
evaluations of SDMA groups, as well as the precoding calculations of the AMCmodule if needed. As clearly observed in the figure, the reduction in the numberof FLOPs achieved by the SNIR Prediction is very significant for all groupingalgorithms. In case of the most complex grouper (CBA) the total number ofFLOPs is reduced by almost two orders of magnitude. Note, that the compu-tational cost for the CBA is even cheaper, using the SNIR Prediction, than thesimple FFA using the precoding based method. Overall a low complex metriclike the SNIR Prediction is able to compensate the additional computationalcosts of a complex grouper, such as the CBA, to a significant degree.
SINR Precoding SINR Predictor
106
107
Num
ber
of fl
oatin
g po
int o
pera
tions
FFABFACBA
Figure 17: Number of floating point operations.
5.2.2 SDMA Grouping Algorithm
As the previous section has shown, the low complex per-MS SNIR computationmethod used to derive the group capacity metric can reduce the complexity ofan SDMA-OFDMA scheduler significantly, for any SDMA grouping algorithm.In this section the performance/complexity trade-off as a result of the appliedSDMA grouping algorithms is investigated further.
Based on the results of the prior section the low complex SNIR Predictionmetric is applied here, as it has proven its usefulness. Therefore, all the SDMAgrouping algorithms use the same low-complex comparison metric, and the onlydifferences in computational costs will be governed by the number of groupcomparisons performed.
The key value for any SDMA grouper and its complexity is the numberof available MSs K. As the BFA has a worst-case complexity of O(K2), theCBA comes with O(K4) [ZMDMXC12]. Only a higher performance wouldsanction such a burden. Figure 18 illustrates the service throughput of thealgorithms under study, again with N = 5 antennas, and different numbers of
43
MSs K = 5, 10, 20, 30. As can be seen the CBA justifies its complexity throughthe achieved performance gain for any number of MSs, followed by the BFAand FFA, respectively. Even at K = 30 the CBA still holds a gain of nearly10% in comparison to the BFA. Overall it can be seen that the gain increasesfor all groupers as the number of MSs increases, where it seems to saturated atK = 30. The CBA not only gains more from more MSs, but also seems to beable to improve its gain better at K = 30 than the BFA/FFA can.
Figure 18: Service throughput.
Similar as in the prior section, the computational complexity of the differ-ent SDMA grouping algorithms were evaluated in terms of FLOPs, depictedin Figure 19. As could be expected the CBA is the most expensive algorithm,followed by the BFA and FFA, with its computational costs increasing as thenumber of MSs increase. The most dominant reason being the number of eval-uated SDMA groups, which is shown in Figure 20. The performance gain ofeach grouping algorithm is a direct consequents of the total number of eval-uated SDMA groups, independent of the used grouping metric. Overall, theBFA/CBA provide a complementary performance versus complexity trade-off,both performing better than the FFA. The CBA would be the best choice whichmaximizes the overall performance, but it comes with the highest computationalcost. The FFA would be the least computational intensive algorithm, with theworst performance, whereas the BFA would be a good mix of both worlds.
44
K=5 K=10 K=20 K=30
105
106
Num
ber
of fl
oatin
g po
int o
pera
tions
Number of MSs
FFABFACBA
Figure 19: Number of floating point operations.
K=5 K=10 K=20 K=3010
2
103
104
105
Num
ber
of S
INR
cal
cula
tions
Number of MSs
FFABFACBA
Figure 20: Number of evaluated SDMA groups.
45
5.2.3 Overall Performance
The last two sections have shown that the SNIR Prediction method grants asubstantial reduction in computational costs, and the CBA offers the highestperformance in throughput. In this section the performance of the combinedstrength of both is compared with three alternative algorithms:
1.) OPT+SDMA: This algorithm solves the same problems, but uses exhaus-tive search for SDMA grouping, and perfect knowledge of the per-MSSNIR used for SDMA group evaluation, as well as brute force to maxi-mize the utility for the OFDMA frame.
2.) sGSA+TxBF: In this case the number of antennas are used purely forbeamforming to boost the signal of each MS in a single time-frequencyregion, without the interference of additional MSs (no SDMA).
3.) GSA: The GSA is an OFDMA scheduling solution [ZDMXCF10] that usesonly the time-frequency dimensions for allocations and is, therefore, onlyapplicable for N = 1.
The combination of the low complex SNIR Prediction method and the CBAalgorithm will be referred to as sGSA. The QoS scheduler uses the ProportionalFair utility to guarantee fairness amongst MSs.
In general, the performance of an SDMA-OFDMA system scales with thenumber of available antennas at the BS. But in particular, it is the amount ofoffered load that effects the performance just as strongly (Section 4.3). Both ofthese aspects will be evaluated next.
Impact of Number of Antennas
The number of antennas at the BS increase the transmit diversity, which trans-lates into a SNR improvement for traditional transmit beamforming, and in-creases the degrees of freedom for SDMA. Figure 21 depicts the achieved cellthroughput in the LOS scenario with K = 10 active MSs for the various al-gorithms, and different N . As could be expected the sGSA+SDMA solutionoutperforms sGSA+TxBf, and comes very close to Opt+SDMA.
The sGSA+TxBf performance improves only slightly with additional anten-nas. This is due to the fact that the cell deployment is adequate for N = 1antennas, therefore, additional antenna diversity quickly reaches the highest,or more efficient MCS. Also, with K = 10 and the PF utility the Multi-UserDiversity gain is already high enough to compensate the effects of unfavorablechannel conditions of those few MSs suffering under it.
Now, in case of sGSA+SDMA the additional antenna diversity leads to amore dramatic gain in system performance. Even in comparison to the op-timal Opt+SDMA solution, the suboptimal sGSA+SDMA performance verywell. Surely, the difference seems marginal and barely increase with additionalantennas, but it would be wrong to assume this is the general case. Since, withK = 10 and a maximum of N = 5 the search space for optimal SDMA groupsis fairly limited. For larger K the computational requirements quickly grows,in which case it should be expected that the difference in performance of thesGSA+SDMA versus the optimal solution increases. But, no matter how largethis difference might become, any other approach would suffer the same fate
46
as the sGSA+SDMA, which still contains a very promising SDMA groupingsolution (ref. 5.2.2).
1 2 3 4 5
10
20
30
40
50
60
70
Ser
vice
thro
ughp
ut (
Mbp
s)
No. of BS antennas
GSAsGSA+TxBfsGSA+SDMAOpt+SDMA
GSA
sGSA+TxBf
sGSA+SDMA
Opt+SDMA
Figure 21: Service throughput.
The results indicate the expected performance on the MAC layer. Since thesimulations included not only the MAC overhead due to signaling (DL-MAP),but also draw-backs due to packing, like additional padding as well as unusedslots in the frame, a deeper insight into the results can be achieved throughconsidering these effects as well.
In order to grasp the impact of packing inefficiencies, and what could begained through more efficient ways the spatial gain was evaluated invariant tothe used MCS. Figure 22 depicts the spatial multiplexing gain which was calcu-lated as follows: all used slots on each spatial layer were summed up and dividedby the total number of slots available in a frame. Note, that a spatial gain ofN is not reachable in practice as long as there are omni-directional transmis-sions for the MAP and MSs that can not be fully separated in space. Overall,the SDMA solutions (sGSA+SDMA, Opt+SDMA) deliver a linear spatial gainslightly below N . For example, the spatial gain of the sGSA+SDMA for N = 5is below ca. 3.2 in 75% of all cases. The Opt+SDMA, which can be assumed tobe optimal in the sense of SDMA grouping, offers 25% of all cases a maximumgain of 3, and up to 3.8 for 75%. As these values are very close to N , it can beconcluded that for small N ≤ 5 there is only little room left to gain by applyinga more pack efficient solution, independent of the SDMA grouping problem.
47
1 2 3 4 5
1
1.5
2
2.5
3
3.5
4
Spa
tial g
ain
No. of BS antennas
GSAsGSA+TxBfsGSA+SDMAOpt+SDMA
GSAsGSA+TxBf
sGSA+SDMA Opt+SDMA
Figure 22: Spatial gain.
Finally, an overview of the needed space for the signaling overhead is given inFigure 23. The algorithms using SDMA, obviously, fabricate a higher signalingoverhead that grows with N . The more spatial resources are available themore MSs can be packed, and must be referenced. Note how the GSA has ahigher overhead than the sGSA+TxBF, this is a result of the heavy use of burstconcatenation for TxBF since the MSs where forced to span the whole frequencyblock more consecutive space per MS was available.
The highest overhead was reached by the sGSA+SDMA, which allocatesup to 7.6% of the total frame space for the DL-MAP when using 5 antennasat the BS. In order to assess the potential gain of a more efficient signalingapproach, let us assume the DL-MAP could be compressed to half its size. Thiswould translate in a throughput increase of 0.3 to 2 Mbps for 1 and 5 antennasrespectively. It can therefore be conclude that the benefit from a more efficientMAP signaling is much higher for a SDMA scheme with a large number ofantennas, but negligible for only a few.
48
1 2 3 4 52
3
4
5
6
7
8
9
10D
L−M
AP
ove
rhea
d (%
)
No. of BS antennas
GSAsGSA+TxBfsGSA+SDMAOpt+SDMA
Opt+SDMA
sGSA+SDMA
GSA
sGSA+TxBf
Figure 23: DL-MAP overhead.
Impact of Offered Load
In order to exploit the additional spatial resources to their full extent the quan-tity of data traffic is crucial, which is effected by the total number of MSs, aswell as the amount of data at hand per-MS. The higher the number of MSs thehigher the probability of finding spatially orthogonal channels, which improvesthe quality of the average SDMA resource. Additionally, the more data trafficis available the more of these resources can be employed.
For this purpose the system throughput was evaluated for a fixed K = 10MSs with different per-MS buffer sizes (Figure 24), and for a fixed buffer sizeof B = 12.66 KB with different numbers of MSs (Figure 25). The algorithmsincluded for evaluation are the GSA with N = 1, sGSA+TxBf with N = 5, andthe sGSA+SDMA for N = 2 to N = 5 antennas at the BS.
As can be seen the performance of all algorithms is effected most by the per-MS buffer size, than by the total number of MSs. Obviously, additional resourcesincrease capacity, but the extent to its potential output can only be achievedby an appropriate input. Most noticeably the capacity improvement throughdiversity techniques like the sGSA+TxBf with N = 5 can be easily achievedthrough spatial multiplexing with only N = 2 (sGSA+SDMA). Looking atFigure 25, it can be seen that increasing the number of MSs in the cell alsoincreases capacity, with the greatest gain already achieved with K twice thenumber of antennas N , which beyond that quickly saturates for any N .
It is also interesting to see how the number of MSs effects the sGSA+TxBfwith N = 5 in comparison to sGSA+SDMA with N = 2. From the availablebuffer size of B = 12.66 KB both algorithms have a well saturated capacityin conclusion to Figure 24. Nevertheless, it can be seen that the additional
49
user diversity improves the sGSA+SDMA capacity, unlike is the case for thesGSA+TxBf, which is due to the increased probability of finding spatially un-correlated MSs.
In this section the impact of a frequency-selective channel will be evaluated, interms of achievable performance through the use of Frequency-Selective Schedul-ing (FSS) performed by the proposed SDMA-OFDMA scheduling solution. Dueto frequency selectivity the channel transfer matrix is different for differentsubcarriers, which directly influences the spatial compatibility of different MSswithin an SDMA group. Therefore, to ensure that the SDMA grouping algo-rithm estimates the underlying channel perfectly the SNIR is estimated usingthe actual precoding. The SDMA grouping is performed on each sub-band bythe BFA. The total number of sub-bands, dictate the granularity of the fre-quency resource.
In the following section the number of sub-bands will be varied from one tosix in the interest of illustrating how an increased granularity in the frequencydomain could improve performance. The range of correlated frequencies overwhich a channel can be considered flat depends on the encountered channelconditions. Therefore, the impact of changes in bandwidth will be evaluated forfixed channel conditions, as well as how a fixed bandwidth is affected by changesin channel conditions (LOS versus NLOS). At the end, a final evaluation is madein how far multi-user diversity complements the performance gain of FSS.
5.3.1 Influence of Bandwidth
Frequency selective, or flat fading is not a property of the channel alone, it is a re-sult of the relationship between the bandwidth BW and the channel’s coherence
51
bandwidth BWC , which is reciprocal to the multi-path delay spread [TV05].The WIM C2 LOS (urban macro-cell) scenario has a delay spread of 41 ns, thattranslates into a coherence bandwidth of roughly 12 MHz.
In Figure 26 the channel bandwidth of 5, 10, and 20 MHz where evaluatedfor different number of BS antennas and a fixed number of MSs K = 12. Itdepicts for each parameter pair (BW, N) the service throughput for an increasingnumber of sub-bands from one to six. As could be expected there is no FSSgain when using a channel bandwidth, e.g 5 MHz, that is substantially smallerthan the coherence bandwidth of 12 MHz. Even worse, increasing the numberof sub-bands can have a negative effect on throughput for large number ofantennas. In case of 8 antennas and 6 sub-bands the throughput decreases byone-fifth compared to the baseline of one sub-band. Similar effects are seen fora bandwidth of 10 MHz, even though there is a small FSS gain of +7.2% using2 antennas, the FSS gain decreases with additional antennas and increasinggranularity until an actual loss of up to −4.1% occurs. Only a bandwidth of 20MHz, which is well beyond the coherence bandwidth of the channel, can achievea very small FSS gain with 8 antennas and 6 sub-bands. This severe loss ofthroughput when increasing the FSS granularity can only be explained by theincreasing MAC layer overhead, i.e. increased MAP signaling overhead.
Figure 26: Impact of Bandwidth on Throughput.
Figure 26 depicts the overall DL-MAP overhead in terms of allocated framespace. The substantial performance loss for a bandwidth of 5 MHz and N =8 antennas and 6 sub-bands seems to be a direct consequence of a two-thirdincrease in signaling overhead.
In conclusion, the highest FSS gain of 16.8% was achieved with a high gran-ularity of 6 sub-bands, only 2 antennas and a bandwidth of 20 MHz at roughly
52
twice the coherence bandwidth of the channel. But, there is a substantial draw-back due to increased signaling overhead as the number of additional SDMAresources increases. This means that systems, with bandwidths close to or be-low the coherence bandwidth and/or a high number of antennas, will forfeitbaseline performance through increasing FSS granularity.
Figure 27: Impact of Bandwidth on DL-MAP Overhead.
5.3.2 LOS/NLOS
In Figure 28 the FSS gain is compared between different channel conditions ofan LOS and NLOS environment. It should be noted that these conditions arenot simply limited to changes in the multi-path delay spread, but also includethings like angular spread, scatters and so on, which directly influences MScorrelation. From the Figure 28 it can be seen that for 4 antennas the gain fromFSS slightly increases from 6.4% (LOS) to 8.5% (NLOS). This is an even highergain than was achieved by increasing the bandwidth from 10 to 20 MHz withinthe LOS environment. This was expected, since the coherence bandwidth of theNLOS environment is roughly 5 times smaller than the 10 MHz bandwidth, incontrast to the 12 MHz coherence bandwidth of the LOS environment.
Similar to earlier results, the signaling overhead increases as the number ofBS antennas increase and there is a trade-off between FSS granularity and per-formance. The NLOS situation does not prevent this trade-off from occurring,even though it seems to be less severe.
53
Figure 28: Impact of LOS
5.3.3 Multi-User Diversity
Finally, the impact of available MSs, K, on the achievable FSS gain will beevaluated for the LOS scenario, using a fixed 10 MHz bandwidth and multiple BSantennas. Figure 29 depicts the results. Overall, increasing the FSS granularityincreases signaling overhead, and results in the same trade-off as has been seenbefore. The increasing number of MSs increases the gain from FSS only slightly.E.g. with N = 8 the gain can be increased from only 1.3% to 5.4%, when havinga network of 36 instead of 12 MSs and using at most 2 sub-bands. Additionally itcan be seen that in some cases the capacity increase through multi-user diversityis substantially higher than the FSS gain. For example, in case of 8 antennas,12 MSs with the best performing number of sub-bands could not reach the samecapacity as 24 MSs without FSS (1-sub-band).
54
Figure 29: Impact of User Number.
6 Conclusion
6.1 Summary
In this work a generic SDMA-OFDMA MAC scheduler, that integrates currentstate-of-the-art suboptimal SDMA grouping strategies with varying complex-ity, and a low complex SNIR predictor have been proposed. Additionally theproposed solution is capable of frequency selective scheduling through splittingthe entire frequency band into multiple sub-bands upon which SDMA groupsare generated and the most favorable ones scheduled. The algorithm was eval-uated in terms of computational cost and performance through system-levelsimulation, based on the real world use-case of the WiMAX IEEE 802.16-2009standard.
The evaluation consisted of three main parts: analysis of the performanceof the proposed low complexity SNIR prediction algorithm, investigation of thesystem level performance of the proposed solution without frequency selectivescheduling, and finally evaluation of a possible gain provided by frequency selec-tive scheduling. The SNIR prediction algorithm and its margin of error whereevaluated for single-carrier, multi-carrier systems, and different SDMA-MIMOtechniques. In general the SNIR prediction overestimates the actual SNIR asthe number of users within an SDMA group approach the number of availableantennas. Nevertheless, it provides a fair indication of suitable SDMA groupsat low computational costs. The SNIR prediction algorithm and its benefits onsystem level where analyzed and compared using different SDMA grouping al-gorithms. It was shown that the corresponding reduction in complexity, in some
55
cases, reached an improvement of two orders of magnitude. It was shown thata complex grouper like the CBA[ZMDMXC12], in combination with the SNIRprediction algorithm, could reduce its computational cost to the same level com-parable to that of the very simple First Fit Algorithm, whilst providing highercapacity gains than the more complex Best Fit Algorithm. Based on these obser-vations the overall performance of the low complex SNIR Prediction algorithmcombined with the power of the CBA SDMA grouper where compared againstan exhaustive search grouper using the precoding based SNIR estimation underdifferent system parameters. The results show that the proposed OFDMA-SDMA MAC scheduler in combination with the CBA grouper and the low com-plex SNIR prediction algorithm, allow the highest gains in capacity comparedto other SDMA grouping algorithms. As the proposed SDMA-OFDMA MACscheduler neglects the frequency dimension in order to turn a complex threedimensional allocation into a two dimensional one, the final evaluation withinthis work focused on the possible gain of frequency-selective scheduling. By ex-plicitly simulating the MAC layer overhead (i.e. DL-MAP), which is required tosignal every packed data burst in the OFDMA frame, it was shown that besidesthe complexity versus performance trade-off dominated by the SDMA groupingproblem, there exists an additional trade-off between performance and signalingoverhead that can invalidate the advantages of frequency-selective scheduling.However, under specific conditions, like reduced antenna diversity, or a largechannel bandwidth, a significant gain of up to 16.8% was achieved from FSS.
6.2 Future Work
There are a number of possibilities for practical application that arise throughthe combination of MIMO and OFDMA techniques that are yet to be explored.The proposed scheduling solution, for example, used a very simple approachfor allocating multiple packets within an SDMA layer. More complex packingalgorithms, that have been proposed for OFDMA, could be applied. As theperformance of simple packing algorithms might be significantly outperformedby more complex ones [Xav08], the combination of a simple SDMA grouper witha complex OFDMA packing algorithm might prove to be an efficient solution.
In case of SDMA techniques, we have seen in this work that a reductionin MAP signaling overhead is a promising direction for further capacity im-provements, especially for a large number of antennas. The impact of channelestimation error on system performance, particularly on the FSS gain should beanalyzed. One could assume that allocating one SDMA group across the wholefrequency spectrum is more robust against estimation errors then performingFSS, if so FSS in SDMA-OFDMA systems could be neglected.
In case of multiple receive antennas, multiple receive antennas at the MS canincrease signal robustness as well as allowing multiple data-streams to the sameMS. Therefore, it could be interesting to evaluate the possiblities of extendingSDMA scheduling techniques to serve not only multiple-users but optionalymultiple-streams as well.
Additionally, multiple receive antennas at the BS could be used for inter-ference reduction amongst cells. A joint scheduling approach shared by allneighboring cells could sacrifice one or more degrees of freedom of each BS forinterference alignment through nulling certain directions. In an interferencelimited system this could prove to hold significant capacity gains.
56
References
[80209] IEEE Standard for Local and Metropolitan Area Networks. Part16: Air Interface for Broadband Wireless Access Systems. IEEE802.16-2009 Standard, May 2009
[AGM07] Andrews, Jeffrey G. ; Ghosh, Arunabha ; Muhamed, Rias:Fundamentals of WiMAX: Understanding Broadband WirelessNetworking. 1. Prentice Hall, 2007. – ISBN 0132225522
[Ala98] Alamouti, Siavash M.: A simple transmit diversity tech-nique for wireless communications. In: IEEE Journal on Se-lected Areas in Communications 16 (1998), S. 1451–1458. http://dx.doi.org/10.1109/49.730453. – DOI 10.1109/49.730453
[Cal04] Calvo, Diego B.: Fairness Analysis of Wireless BeamformingSchedulers, Iniversitat Politecnica de Catalunya (UPC), Diss.,2004
[Cos83] Costa, M.: Writing on dirty paper (Corresp.). In: Informa-tion Theory, IEEE Transactions on 29 (1983), Mai, Nr. 3, 439–441. http://dx.doi.org/10.1109/TIT.1983.1056659. – DOI10.1109/TIT.1983.1056659. – ISSN 0018–9448
[Dra10] DragonWave: Take Microwave Spectral Effi-ciency to a New Level. http://www.wcai.com/
[EES05] CINR measurements using the EESM method. IEEE 802.16Broadband Wireless Access Working Group. http://www.
ieee802.org/16/tge/contrib/C80216e-05_141r3.pdf.Version: March 2005
[Far88] Farebrother, R.W.: Linear Least Squares Computations(Statistics: A Series of Textbooks and Monographs). 1. CRCPress, 1988. – ISBN 0824776615
[FN96] Farsakh, C. ; Nossek, J. A.: A real time downlinkchannel allocation scheme for an SDMA mobile radio sys-tem. In: IEEE International Symposium on Personal, Indoorand Mobile Radio Communications 3 (1996), Oktober, 1216–1220 vol.3. http://dx.doi.org/10.1109/PIMRC.1996.568477.– DOI 10.1109/PIMRC.1996.568477. ISBN 0–7803–3692–5
[For08] Forum, Wimax: WiMAX System Evaluation Methodology. In:Forum American Bar Association (2008), Nr. Version 2.1, S.1–209
[GPK09] Gollakota, Shyamnath ; Perli, Samuel D. ; Katabi,Dina: Interference alignment and cancellation. In: SIG-COMM Comput. Commun. Rev. 39 (2009), August, Nr. 4, 159–170. http://dx.doi.org/10.1145/1594977.1592588. – DOI10.1145/1594977.1592588. – ISSN 0146–4833
[Gro05] Gross, Frank: Smart Antennas for Wireless Communications:With MATLAB (Professional Engineering). 1. McGraw-HillProfessional, 2005. – ISBN 007144789X
[HCCW08] Huang, Ching Y. ; Chang, Chieh-Yao ; Chen, Po-Han ; Wu,Ming-Hsien: Performance Evaluation of SDMA Based Mo-bile WiMAX Systems. In: International Wireless Communica-tions and Mobile Computing Conference (2008), August, 1042–1046. http://dx.doi.org/10.1109/IWCMC.2008.181. – DOI10.1109/IWCMC.2008.181. ISBN 978–1–4244–2201–2
[KBF+er] Kaiser, T. ; Bourdoux, A. ; Fonollosa, J. R. ; Boche, H. ;Andersen, J. B. ; Utschick, W.: Smart Antennas - State ofthe Art. Bd. 3. EURASIP Book Series on Signal Processing andCommunications, Hindawi Publishing Corporation, December.– 1 – 876 S.
[KMH07a] Kyosti, Pekka ; Meinila, Juha ; Hentila, Lassi:WINNER II Channel Models. In: IST-4-027756 WIN-NER II D1.1.2 V1.1 (2007). http://www.ist-winner.org/
WINNER2-Deliverables/D1.1.2v1.1.pdf
[KMH07b] Kyosti, Pekka ; Meinila, Juha ; Hentila, Lassi: WIN-NER Phase II Implementation. 2007. – ”Avaiable: http:
//www.ist-winner.org/phase_2_model.html”
[Lee07] Lee, Seung J.: Trade-Off Between Frequency Diversity Gainand Frequency-Selective Scheduling Gain in OFDMA Systemswith Spatial Diversity. In: IEEE Communications Letters 11(2007), Nr. 6
[LHSH04] Love, David J. ; Heath, Robert W. ; Santipach, Wiroonsak; Honig, Michael L.: What is the value of limited feedback forMIMO channels. In: IEEE Commun. Mag 42 (2004), S. 54–59
[LSM08] Lakkakorpi, J. ; Sayenko, A. ; Moilanen, J.: Com-parison of Different Scheduling Algorithms for WiMAX BaseStation: Deficit Round-Robin vs. Proportional Fair vs.Weighted Deficit Round-Robin. In: IEEE Wireless Com-munications and Networking Conference (2008), Marz, 1991–1996. http://dx.doi.org/10.1109/WCNC.2008.354. – DOI10.1109/WCNC.2008.354. – ISBN 978–1–4244–1997–5
[Mac08] Maciel, Tarcisio F.: Suboptimal Resource Allocation for Multi-User MIMO-OFDMA Systems, Technical University of Darm-stadt, Diss., 2008
[NR10] Nascimento, Alberto ; Rodriguez, Jonathan: A joint util-ity scheduler and SDMA resource allocation for mobile WiMAXnetworks. In: Proceedings of the 5th IEEE international con-ference on Wireless pervasive computing. Piscataway, NJ, USA: IEEE Press, 2010 (ISWPC’10). – ISBN 978–1–4244–6855–3,589–594
[OC07] Oestges, C. ; Clerckx, B.: MIMO wireless communica-tions: from real-world propagation to space-time code design.Academic Press, 2007 (MIMO Wireless Communications: FromReal-world Propagation to Space-time Code Design). – ISBN9780123725356
[PFE08] Perez-Fontan, F. ; Espineira, P.M.: Modeling the wire-less propagation channel: a simulation approach with MAT-LAB. Wiley, 2008 (Wiley series on wireless communicationsand mobile computing). http://books.google.de/books?id=
N-mdDXvs0kAC. – ISBN 9780470727850
[PHS05] Peel, C. B. ; Hochwald, B. M. ; Swindlehurst, A. L.:A vector-perturbation technique for near-capacity multiantennamultiuser communication-part I: channel inversion and regular-ization. In: Communications, IEEE Transactions on 53 (2005),Januar, Nr. 1, 195–202. http://dx.doi.org/10.1109/TCOMM.
2004.840638. – DOI 10.1109/TCOMM.2004.840638. – ISSN0090–6778
[RRTW11] R. Ramjee, S. K. K. ; Thuel, S. ; Wang, X.: CiscoVisual Networking Index: Global Mobile Data Traffic Fore-cast Update, 20102015. CISCO White Paper. ’http:
//www.cisco.com/en/US/solutions/collateral/ns341/
ns525/ns537/ns705/ns827/white_paper_c11-520862.html’.Version: February 2011
[SCA+06] Shen, Zukang ; Chen, Runhua ; Andrews, Jeffrey G. ; Heath,Robert W. ; Evans, Brian L.: Sum capacity of multiuser MIMObroadcast channels with block diagonalization. In: IEEE Trans.Wireless Comm, 2006, S. 886–890
[STKL01] Shad, F. ; Todd, T. D. ; Kezys, V. ; Litva, J.: Dynamic SlotAllocation (DSA) in Indoor SDMA/TDMA Using a Smart An-tenna Basestation. In: IEEE/ACM Transactions on Networking9 (2001)
[TJC99] Tarokh, Vahid ; Jafarkhani, Hamid ; Calderbank, A. R.:Space-time block codes from orthogonal designs. In: IEEETrans. Inform. Theory 45 (1999), S. 1456–1467
[TSMC98] Tarokh, Vahid ; Seshadri, Nambi ; Member, Senior ;Calderbank, A. R.: Space-time codes for high data rate wire-less communication: Performance criterion and code construc-tion. In: IEEE Trans. Inform. Theory 44 (1998), S. 744–765
[Tso06] Tsoulos, G.V.: MIMO system technology for wireless commu-nications. CRC/Taylor & Francis, 2006 (The electrical engineer-ing and applied signal processing series Bd. 0). http://books.
google.de/books?id=bcXOlU77ijAC. – ISBN 9780849341908
[TV05] Tse, D. ; Viswanath, P.: Fundamentals of wireless communica-tion. Cambridge University Press, 2005 http://books.google.
de/books?id=66XBb5tZX6EC. – ISBN 9780521845274
[WC98] Wesel, R. D. ; Cioffi, J. M.: Achievable rates for Tomlinson-Harashima precoding. In: Information Theory, IEEE Trans-actions on 44 (1998), Marz, Nr. 2, 824–831. http://dx.doi.
org/10.1109/18.661530. – DOI 10.1109/18.661530. – ISSN0018–9448
[WGSB07] Wang, Fan ; Ghosh, Amitava ; Sankaran, Chandy ; Benes,S.: WiMAX System Performance with Multiple Transmit andMultiple Receive Antennas. In: VTC Spring, IEEE, 2007, 2807-2811
[Xav08] On the Challenges for the Maximization of Radio Resources Us-age in WiMAX Networks. 2008
[YG06] Yoo, Taesang ; Goldsmith, A.: On the optimality of multi-antenna broadcast scheduling using zero-forcing beamforming.In: Selected Areas in Communications, IEEE Journal on 24(2006), Marz, Nr. 3, 528–541. http://dx.doi.org/10.1109/
JSAC.2005.862421. – DOI 10.1109/JSAC.2005.862421. – ISSN0733–8716
[ZDMXCF10] Zubow, A. ; D.Camps-Mur ; X.Perez-Costa ; Favaro, P.:Greedy Scheduling Algorithm (GSA) - Design and Evaluation ofan Efficient and Flexible WiMAX OFDMA Scheduling Solution.Elsevier Computer Networks Journal, Volume 54, Issue 10, July2010
[ZM12] Zubow, Anatolij ; Marotzke, Johannes: On the Frequency-Selective Scheduling Gain in SDMA-OFDMA Systems. In:CoRR abs/1201.6282 (2012)
[ZMDMXC12] Zubow, A. ; Marotzke, J. ; D.Camps-Mur ; X.Perez-Costa: sGSA: An SDFMA-OFDMA Scheduling Solution /Humboldt University Berlin. 2012. – Forschungsbericht
Ich erklare hiermit, dass ich die vorliegende Arbeit selbstandig verfasst und nurunter Verwendung der angegebenen Quellen und Hilfsmittel angefertigt habe.Weiterhin erklare ich, eine Diplomarbeit in diesem Studiengebiet erstmalig ein-zureichen.
Berlin, den 10. Juli 2012 Johannes Marotzke
Statement of authorship
I declare that I completed this thesis on my own and that information whichhas been directly or indirectly taken from other sources has been noted as such.Neither this nor a similar work has been presented to an examination committee.