92
Biology For exams January 2012 onwards For certification June 2013 onwards GCSE GCSE SCHEMES OF WORK Schemes of Work
BiologyFor exams January 2012 onwardsFor certification June 2013 onwards
GCSE
GC
SE
SC
HE
ME
S O
F W
OR
K
Schemes of Work

Discover a world ofinspiration at sciencelab.org.ukAt AQA, we’ve always believed that real science – and how it relates to the
real world – is the way to inspire students of all abilities. We also believe that
teachers need innovative support to bring GCSE Sciences specifi cations
to life in the classroom.
That’s why we created sciencelab.org.uk. You’ll discover a whole world
of inspiration for your students, plus free, interactive tools for you.
Take Exampro Extra Online, it makes it easy to test progress,
plan lessons and create teaching plans. You’ll also fi nd
our Enhanced Results Analysis (ERA) tool, which
provides an instant breakdown of exam
results at the click of a mouse.
Why not visit today?
Discover more at sciencelab.org.uk
AQA00163_Science_Specifi cation_v6_297x210mm_03AQA00163_Science_Specifi cation_v6_297x210mm_03
AQA00163_Science_Specification_v6_297x210mm_03.indd 1 23/9/10 16:44:52

1
GCSE SciencesSchemes of Work
Biology4401

2
Further copies of this booklet are available from:
AQA Logistics Centre (Manchester)Unit 2Wheel Forge WayAshburton ParkTrafford ParkManchesterM17 1EH
Or, you can download a copy from the AQA website: aqa.org.ukCopyright © 2011 AQA and its licensors. All rights reserved.
COPYRIGHTAQA retains the copyright on all its publications, including the specimen assessment materials. However, registered centres for AQA are permitted to copy material from this booklet for their own internal use, with the following important exception: AQA cannot give permission to centres to photocopy any material that is acknowledged to a third party even for internal use within the centre.
Set and published by the Assessment and Qualifications Alliance.
The Assessment and Qualifications Alliance (AQA) is a company limited by guarantee, registered in England and Wales (company number 3644723) and a registered charity (registered charity number 1073334).
Registered address: AQA, Devas Street, Manchester, M15 6EX
3
PageIntroduction 4Unit Overview 5-9
Unit 1 Biology 1 10
B1.1 Keeping healthy 10B1.2 Nerves and hormones 16B1.3 The use and abuse of drugs 22B1.4 Interdependence and adaptation 25B1.5 Energy and biomass in food chains 28B1.6 Waste materials from plants and animals 29B1.7 Genetic variation and its control 30B1.8 Evolution 34
Unit 2 Biology 2 36
B2.1 Cells and simple cell transport 36B2.2 Tissues, organs and organ systems 40B2.3 Photosynthesis 42B2.4 Organisms and their environment 46B2.5 Proteins – their functions and uses 47B2.6 Aerobic and anaerobic respiration 51B2.7 Cell division and inheritance 54B2.8 Speciation 60
Unit 3 Biology 3 62
B3.1 Movement of molecules in and out of cells 62B3.2 Transport systems in plants and animals 70B3.3 Homeostasis 74B3.4 Humans and their environment 80
Contents
GCSE Biology for teaching from September 2011 onwards ( version 1.0 )

4
IntroductionScience is essential for all of us in our everyday lives and for the future of our planet. For many candidates, it’s a highly inspirational subject, but for others, it poses challenges which need to be addressed.
That’s why, at AQA, we believe that what you teach and how you teach it are vital when it comes to engaging your candidates. Therefore, to help you deliver our GCSE Biology course, we have provided ideas on how this can be done. You can use these suggestions, adapt them to suit your candidates, or use your own schemes of work.
These Schemes of Work provide you with:■■ a summary of specification reference and content■■ suggested activities and homework ideas■■ timing suggestions■■ help with support and resources■■ examination ‘hints and tips’.
Free resourcesOur GCSE Sciences website, The Science Lab, also provides free resources and interactive tools to help you inspire your candidates. Here you can access:
■■ Exampro Extra Online – to create practice papers, get model answers, practical guides and activities
■■ Enhanced Results Analysis (ERA) – provides an instant breakdown of exam results
■■ Assessment Planner – helps you to plan your assessments for the new GCSE Science specifications
■■ Our community blog and forum – engage with other AQA teachers and participate in discussions that matter to you
■■ Details of Nelson Thornes’ AQA GCSE Science Teacher Books and Student Books, exclusively endorsed by AQA.
We want your candidates to be engaged and inspired by real science. We believe that the above resources will help you to achieve this. In addition, we provide a range of GCSE Sciences, so you’ll find that one of our courses will meet your candidates’ needs – whatever their abilities and aspirations.
If you have any queries about GCSE Biology, you can talk directly to the GCSE Science subject team on 08442 090 415 or e-mail [email protected].
GCSE Biology for teaching from September 2011 onwards ( version 1.0 )

5
GC
SE
Bio
log
y for teaching from S
eptember 2011 onw
ards ( version 1.0 )
B1.1.1 Diet and exerciseB1.1.2 How our bodies defend themselves against infectious diseases
B1.2.1 The nervous systemB1.2.2 Control in the human bodyB1.2.3 Control in plants
B1.3.1 Drugs
B1.4.1 AdaptationsB1.4.2 Environmental change
B1.5.1 Energy in biomass
B1.6.1 Decay processesB1.6.2 The carbon cycle
B1.7.1 Why organisms are differentB1.7.2 Reproduction
B1.8.1 Evolution
B1.1
B1.2
B1.3
B1.4
B1.5
B1.6
B1.7
B1.8
Keeping healthy
Nerves and hormones
The use and abuse of drugs
Interdependence and adaptation
Energy and biomass in food chains
Waste materials from plants and animals
Genetic variation and its control
Evolution
Unit 1 – Overview Biology 1
Reference Section Sub-section
6
GC
SE
Bio
log
y for teaching from S
eptember 2011 onw
ards ( version 1.0 )
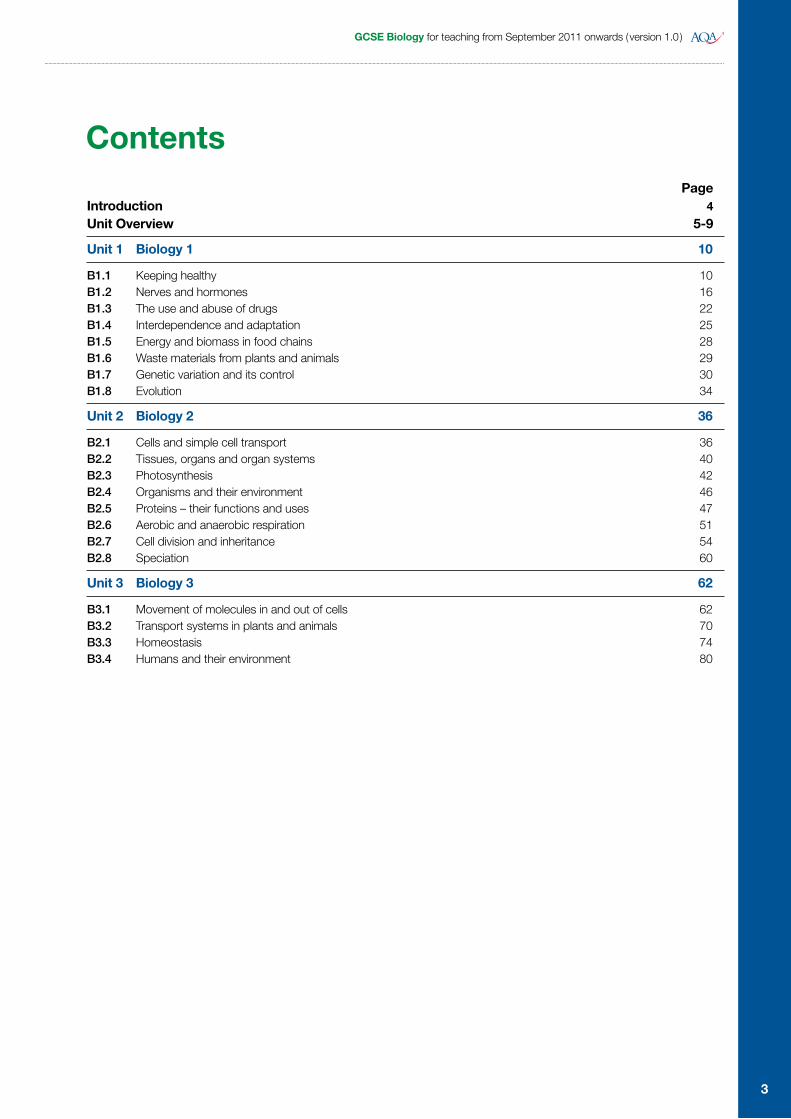
Unit 2 – Overview Biology 2
B2.1.1 Cells and cell structureB2.1.2 Dissolved substances
B2.2.1 Animal organsB2.2.2 Plant organs
B2.3.1 Photosynthesis
B2.4.1 Distribution of organisms
B2.5.1 ProteinsB2.5.2 Enzymes
B2.6.1 Aerobic respirationB2.6.2 Anaerobic respiration
B2.7.1 Cell divisionB2.7.2 Genetic variationB2.7.3 Genetic disorders
B2.8.1 Old and new species
B2.1
B2.2
B2.3
B2.4
B2.5
B2.6
B2.7
B2.8
Cells and simple cell transport
Tissues, organs and organ systems
Photosynthesis
Organisms and their environment
Proteins – their functions and uses
Aerobic and anaerobic respiration
Cell division and inheritance
Speciation
Reference Section Sub-section
7
GC
SE
Bio
log
y for teaching from S
eptember 2011 onw
ards ( version 1.0 )
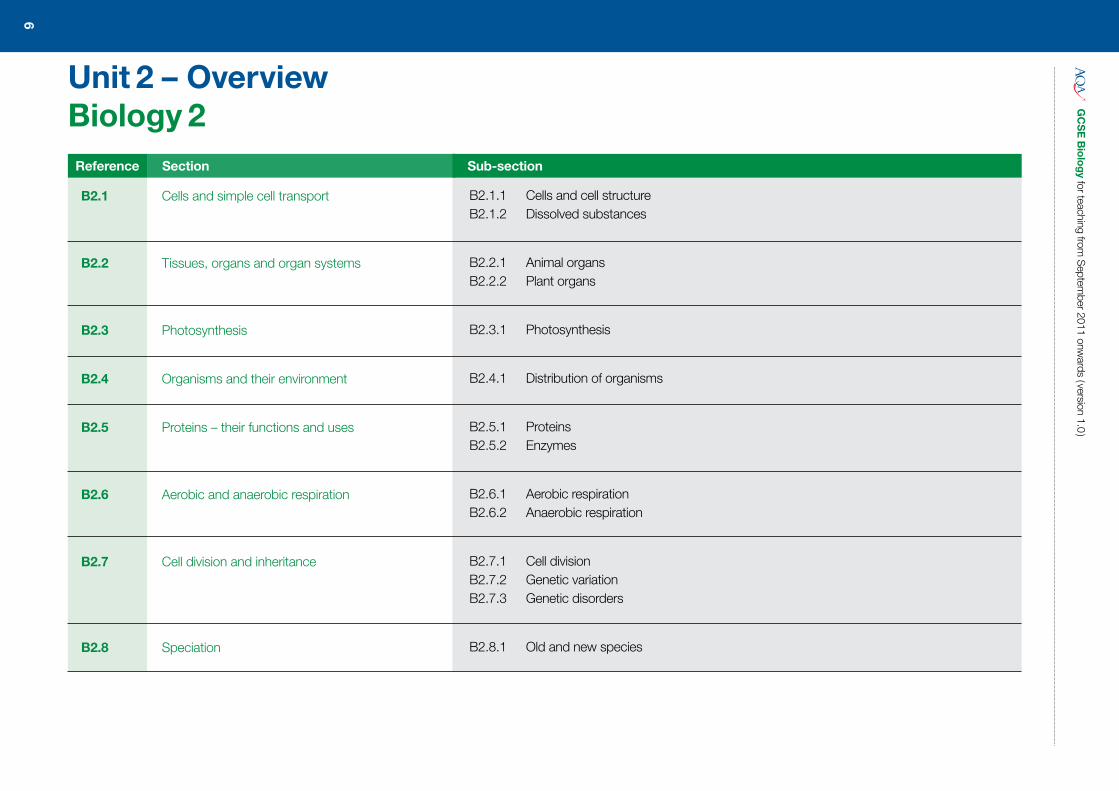
Unit 3 – Overview Biology 3
B3.1.1 Dissolved substancesB3.1.2 Gaseous exchangeB3.1.3 Exchange systems in plants
B3.2.1 The blood systemB3.2.2 The bloodB3.2.3 Transport systems in plants
B3.3.1 Removal of waste and water controlB3.3.2 Temperature controlB3.3.3 Sugar control
B3.4.1 Waste from human activityB3.4.2 Deforestation and the destruction of areas of peatB3.4.3 BiofuelsB3.4.4 Food production
B3.1
B3.2
B3.3
B3.4
Movement of molecules in and out of cells
Transport systems in plants and animals
Homeostasis
Humans and their environment
Reference Section Sub-section
8
GC
SE
Bio
log
y for teaching from S
eptember 2011 onw
ards ( version 1.0 )
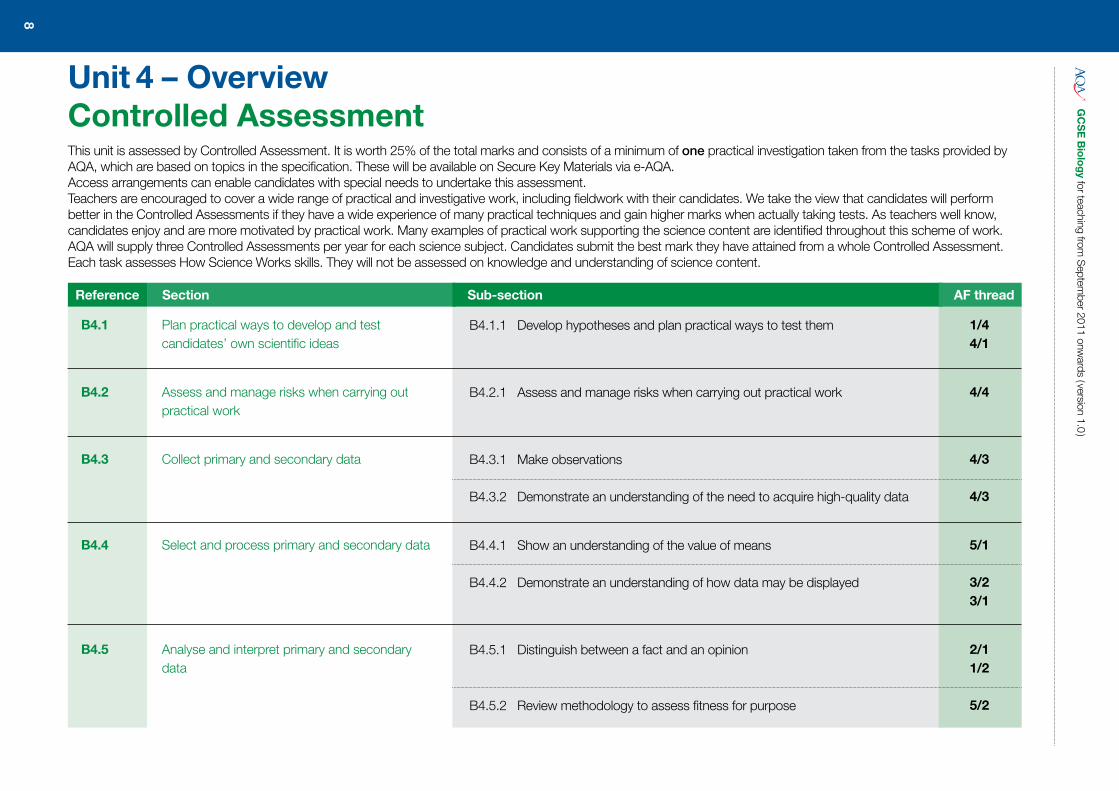
Unit 4 – Overview Controlled Assessment
B4.1.1 Develop hypotheses and plan practical ways to test them
B4.2.1 Assess and manage risks when carrying out practical work
B4.3.1 Make observations
B4.3.2 Demonstrate an understanding of the need to acquire high-quality data
B4.4.1 Show an understanding of the value of means
B4.4.2 Demonstrate an understanding of how data may be displayed
B4.5.1 Distinguish between a fact and an opinion
B4.5.2 Review methodology to assess fitness for purpose
B4.1
B4.2
B4.3
B4.4
B4.5
1/44/1
4/4
4/3
4/3
5/1
3/23/1
2/11/2
5/2
Plan practical ways to develop and test candidates’ own scientific ideas
Assess and manage risks when carrying out practical work
Collect primary and secondary data
Select and process primary and secondary data
Analyse and interpret primary and secondary data
Reference Section Sub-section AF thread
This unit is assessed by Controlled Assessment. It is worth 25% of the total marks and consists of a minimum of one practical investigation taken from the tasks provided by AQA, which are based on topics in the specification. These will be available on Secure Key Materials via e-AQA.Access arrangements can enable candidates with special needs to undertake this assessment.Teachers are encouraged to cover a wide range of practical and investigative work, including fieldwork with their candidates. We take the view that candidates will perform better in the Controlled Assessments if they have a wide experience of many practical techniques and gain higher marks when actually taking tests. As teachers well know, candidates enjoy and are more motivated by practical work. Many examples of practical work supporting the science content are identified throughout this scheme of work.AQA will supply three Controlled Assessments per year for each science subject. Candidates submit the best mark they have attained from a whole Controlled Assessment. Each task assesses How Science Works skills. They will not be assessed on knowledge and understanding of science content.

9
GC
SE
Bio
log
y for teaching from S
eptember 2011 onw
ards ( version 1.0 )
B4.5.3 Identify patterns in data
B4.5.4 Draw conclusions using scientific ideas and evidence
B4.6.1 Review hypotheses in the light of outcomesB4.6
5/3
5/35/4
1/2Use of scientific models and evidence to develop hypotheses, arguments and explanations

Unit 1G
CS
E B
iolo
gy for teaching from
Septem
ber 2011 onwards ( version 1.0 )
10
SpecRef
Summary of Specification Content
Learning Outcomes
What most candidates should be able to do
Possible Teaching and Learning Activities
Homework
Resources Examination Hints and TipsCandidates should:
SuggestedLessons
Unit 1 View
This scheme of work suggests possible teaching and learning activities for each section of the specification. There are far more activities suggested than it would be possible to teach. It is intended that teachers should select activities appropriate to their candidates and the curriculum time available. The first two columns summarise the specification references, whilst the Learning Outcomes indicate what most candidates should be able to achieve after the work is completed. The Resources column indicates resources commonly available to schools, and other references that may be helpful. Higher Tier material is indicated by a bold HT only comment. The timings are only suggested*, as are the Possible Teaching and Learning Activities, which include references to experimental work and How Science Works opportunities. Resources are only given in brief and risk assessments should be carried out. To access classroom activities, practical ideas, progress checks / end of topic assessments and over 265 questions and mark schemes for Biology Unit 1, use Exampro Extra Online, our FREE resource for AQA teachers.
* The suggested timings relate to the learning outcomes rather than to the activities.
2
B1.1 Keeping healthy
B1.1.1 Diet and exercise
a Healthy diet
Know the right balance of the different foods you need and the right amount of energy.
Evaluate information about the effect of food on health.
Explain how carbohydrates, fats and proteins are used by the body to release energy and to build cells.
State that mineral ions and vitamins are needed in small amounts for healthy functioning of the body.
Activity: Look at food labels as a stimulus to list the food groups needed in a balanced diet and discuss their uses. Sort food pictures into groups. Less able candidates could produce a food pyramid using food labels or a wall display showing food groups with examples of foods.
Look at pictures showing deficiency diseases.
How Science Works: Food tests – produce a Venn diagram showing foods which have different combinations of the nutrients tested.
How Science Works: Measure the energy content of foods, eg pea and
Food labels, food group name cards and pictures of foods to sort.
Try the Kellogg’s Nutrition Trail found in the Learning section of www.kelloggs-alarabi.com
Food tests: Chemicals for starch, sugar, protein and fat tests.
Energy in foods: Mounted needles,
Be able to explain the effects (eg underweight, overweight), of Type 2 diabetes and deficiency diseases.
Note: Specific functions of nutrients and the effects of any deficiency in the diet is not required.
Be able to define obesity.
Biology 1
GC
SE
Bio
log
y for teaching from S
eptember 2011 onw
ards ( version 1.0 )
1-2c
d
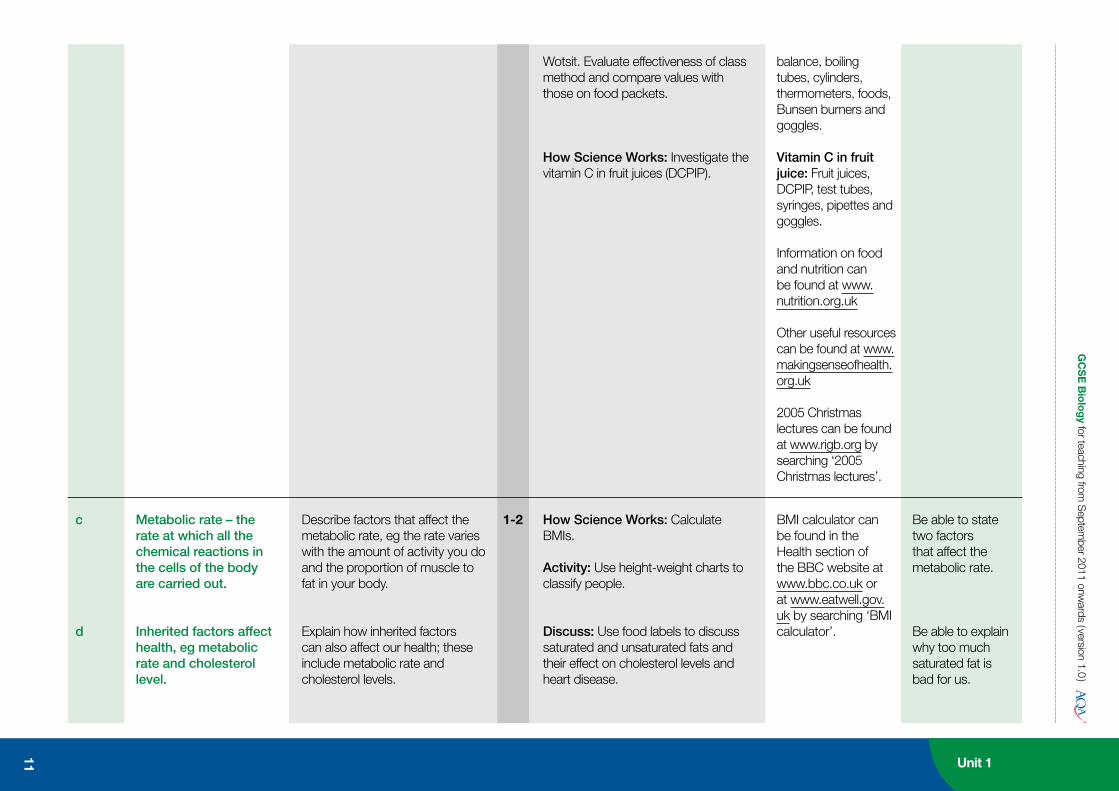
Metabolic rate – the rate at which all the chemical reactions in the cells of the body are carried out.
Inherited factors affect health, eg metabolic rate and cholesterol level.
Describe factors that affect the metabolic rate, eg the rate varies with the amount of activity you do and the proportion of muscle to fat in your body.
Explain how inherited factors can also affect our health; these include metabolic rate and cholesterol levels.
Wotsit. Evaluate effectiveness of class method and compare values with those on food packets.
How Science Works: Investigate the vitamin C in fruit juices (DCPIP).
How Science Works: Calculate BMIs.
Activity: Use height-weight charts to classify people.
Discuss: Use food labels to discuss saturated and unsaturated fats and their effect on cholesterol levels and heart disease.
balance, boiling tubes, cylinders, thermometers, foods, Bunsen burners and goggles.
Vitamin C in fruit juice: Fruit juices, DCPIP, test tubes, syringes, pipettes and goggles.
Information on food and nutrition can be found at www.nutrition.org.uk
Other useful resources can be found at www.makingsenseofhealth.org.uk
2005 Christmas lectures can be found at www.rigb.org by searching ‘2005 Christmas lectures’.
BMI calculator can be found in the Health section of the BBC website at www.bbc.co.uk or at www.eatwell.gov.uk by searching ‘BMI calculator’.
Be able to state two factors that affect the metabolic rate.
Be able to explain why too much saturated fat is bad for us.
11 Unit 1
Unit 1G
CS
E B
iolo
gy for teaching from
Septem
ber 2011 onwards ( version 1.0 )
12
SpecRef
Summary of Specification Content
Learning Outcomes
What most candidates should be able to do
Possible Teaching and Learning Activities
Homework
Resources Examination Hints and TipsCandidates should:
SuggestedLessons
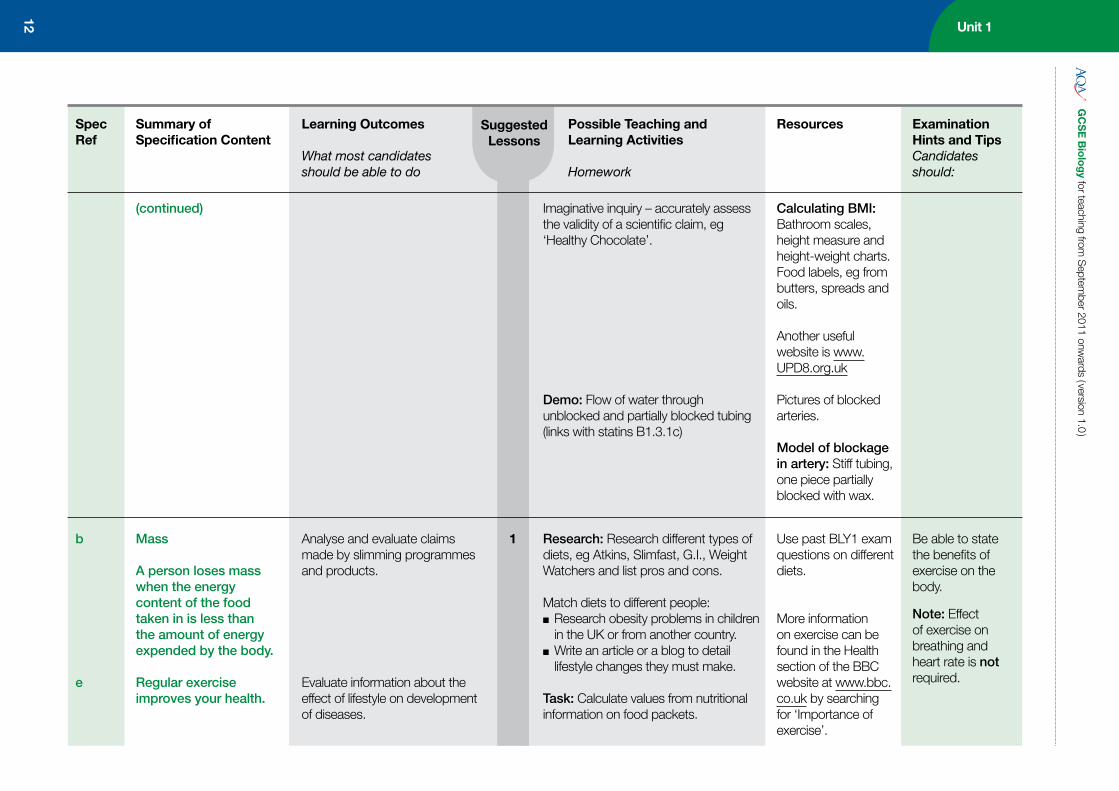
1b
e
(continued)
Mass
A person loses mass when the energy content of the food taken in is less than the amount of energy expended by the body.
Regular exercise improves your health.
Analyse and evaluate claims made by slimming programmes and products.
Evaluate information about the effect of lifestyle on development of diseases.
Imaginative inquiry – accurately assess the validity of a scientific claim, eg ‘Healthy Chocolate’.
Demo: Flow of water through unblocked and partially blocked tubing (links with statins B1.3.1c)
Research: Research different types of diets, eg Atkins, Slimfast, G.I., Weight Watchers and list pros and cons.
Match diets to different people: ■ Research obesity problems in children in the UK or from another country.
■ Write an article or a blog to detail lifestyle changes they must make.
Task: Calculate values from nutritional information on food packets.
Calculating BMI: Bathroom scales, height measure and height-weight charts.Food labels, eg from butters, spreads and oils.
Another useful website is www.UPD8.org.uk
Pictures of blocked arteries.
Model of blockage in artery: Stiff tubing, one piece partially blocked with wax.
Use past BLY1 exam questions on different diets.
More information on exercise can be found in the Health section of the BBC website at www.bbc.co.uk by searching for ‘Importance of exercise’.
Be able to state the benefits of exercise on the body.
Note: Effect of exercise on breathing and heart rate is not required.
GC
SE
Bio
log
y for teaching from S
eptember 2011 onw
ards ( version 1.0 )
13 Unit 1
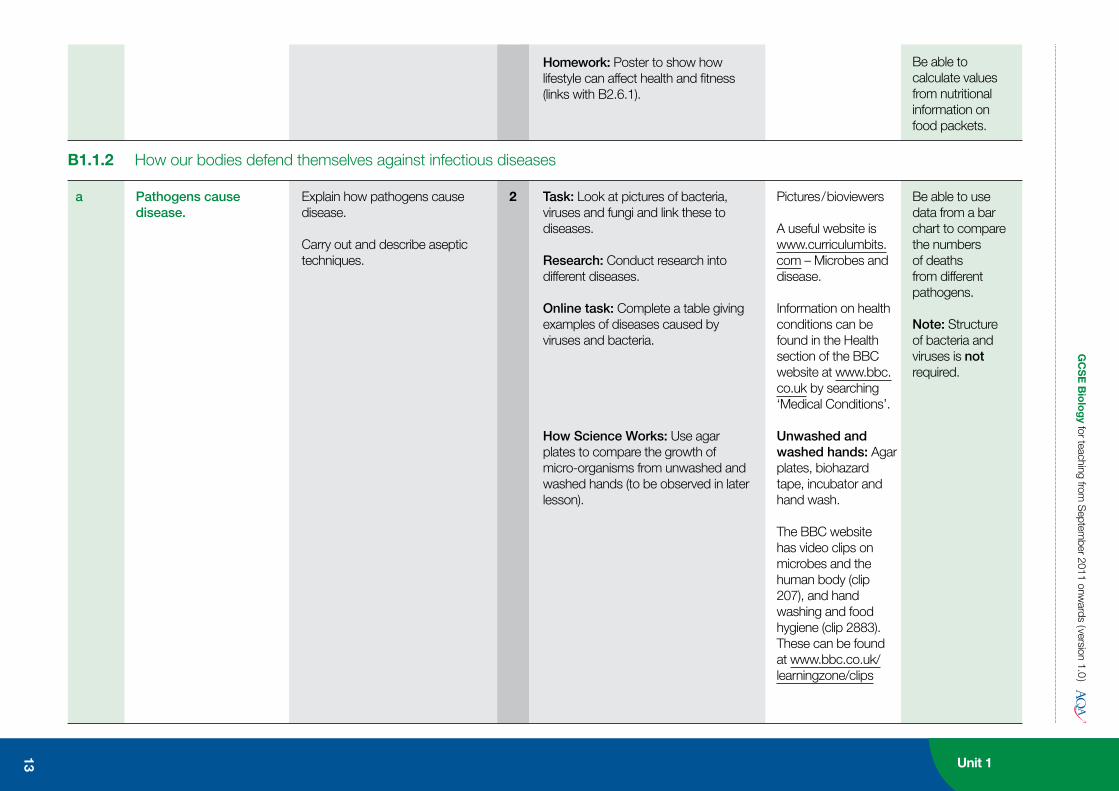
B1.1.2 How our bodies defend themselves against infectious diseases
2a Pathogens cause disease.
Pictures / bioviewers
A useful website is www.curriculumbits.com – Microbes and disease.
Information on health conditions can be found in the Health section of the BBC website at www.bbc.co.uk by searching ‘Medical Conditions’.
Unwashed and washed hands: Agar plates, biohazard tape, incubator and hand wash.
The BBC website has video clips on microbes and the human body (clip 207), and hand washing and food hygiene (clip 2883). These can be found at www.bbc.co.uk/learningzone/clips
Be able to use data from a bar chart to compare the numbers of deaths from different pathogens.
Note: Structure of bacteria and viruses is not required.
Explain how pathogens cause disease.
Carry out and describe aseptic techniques.
Task: Look at pictures of bacteria, viruses and fungi and link these to diseases.
Research: Conduct research into different diseases.
Online task: Complete a table giving examples of diseases caused by viruses and bacteria.
How Science Works: Use agar plates to compare the growth of micro-organisms from unwashed and washed hands (to be observed in later lesson).
Homework: Poster to show how lifestyle can affect health and fitness (links with B2.6.1).
Be able to calculate values from nutritional information on food packets.
Unit 1
14
SpecRef
Summary of Specification Content
Learning Outcomes
What most candidates should be able to do
Possible Teaching and Learning Activities
Homework
Resources Examination Hints and TipsCandidates should:
SuggestedLessons
GC
SE
Bio
log
y for teaching from S
eptember 2011 onw
ards ( version 1.0 )
1
1
1
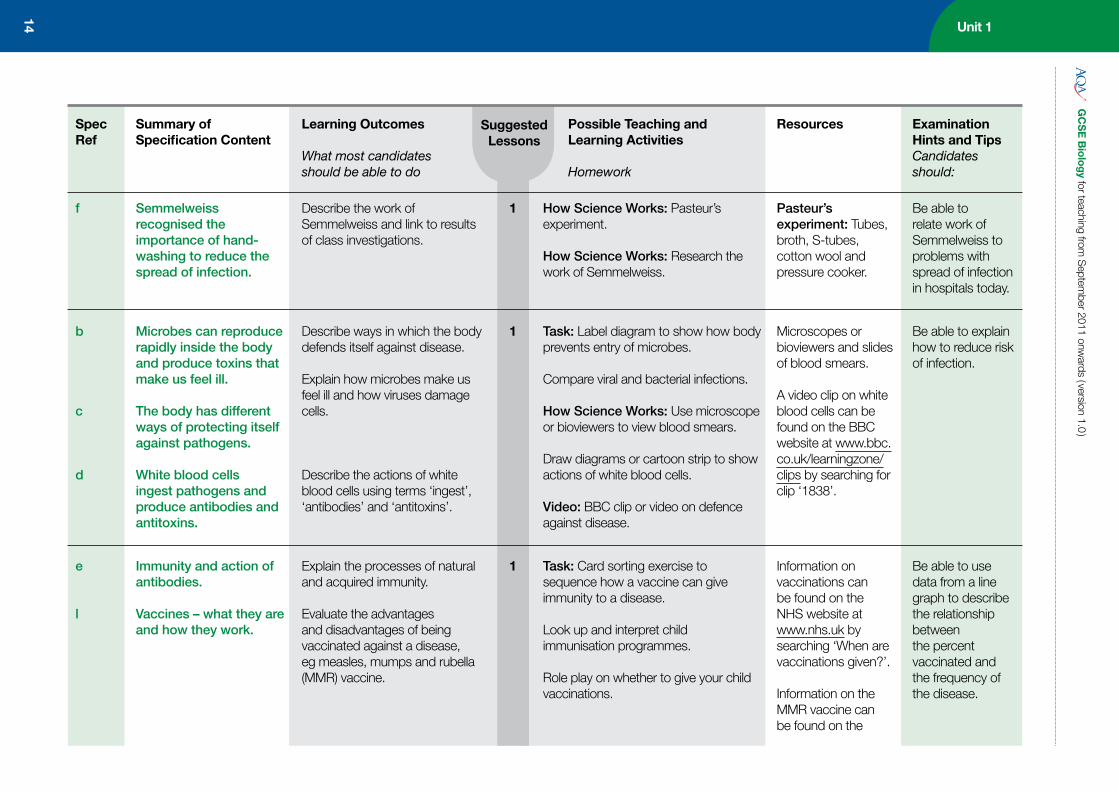
f
b
c
d
e
l
Semmelweiss recognised the importance of hand-washing to reduce the spread of infection.
Microbes can reproduce rapidly inside the body and produce toxins that make us feel ill.
The body has different ways of protecting itself against pathogens.
White blood cells ingest pathogens and produce antibodies and antitoxins.
Immunity and action of antibodies.
Vaccines – what they are and how they work.
Describe the work of Semmelweiss and link to results of class investigations.
Describe ways in which the body defends itself against disease.
Explain how microbes make us feel ill and how viruses damage cells.
Describe the actions of white blood cells using terms ‘ingest’, ‘antibodies’ and ‘antitoxins’.
Explain the processes of natural and acquired immunity.
Evaluate the advantages and disadvantages of being vaccinated against a disease, eg measles, mumps and rubella (MMR) vaccine.
How Science Works: Pasteur’s experiment.
How Science Works: Research the work of Semmelweiss.
Task: Label diagram to show how body prevents entry of microbes.
Compare viral and bacterial infections.
How Science Works: Use microscope or bioviewers to view blood smears.
Draw diagrams or cartoon strip to show actions of white blood cells.
Video: BBC clip or video on defence against disease.
Task: Card sorting exercise to sequence how a vaccine can give immunity to a disease.
Look up and interpret child immunisation programmes.
Role play on whether to give your child vaccinations.
Pasteur’s experiment: Tubes, broth, S-tubes, cotton wool and pressure cooker.
Microscopes or bioviewers and slides of blood smears.
A video clip on white blood cells can be found on the BBC website at www.bbc.co.uk/learningzone/clips by searching for clip ‘1838’.
Information on vaccinations can be found on the NHS website at www.nhs.uk by searching ‘When are vaccinations given?’.
Information on the MMR vaccine can be found on the
Be able to relate work of Semmelweiss to problems with spread of infection in hospitals today.
Be able to explain how to reduce risk of infection.
Be able to use data from a line graph to describe the relationship between the percent vaccinated and the frequency of the disease.
GC
SE
Bio
log
y for teaching from S
eptember 2011 onw
ards ( version 1.0 )
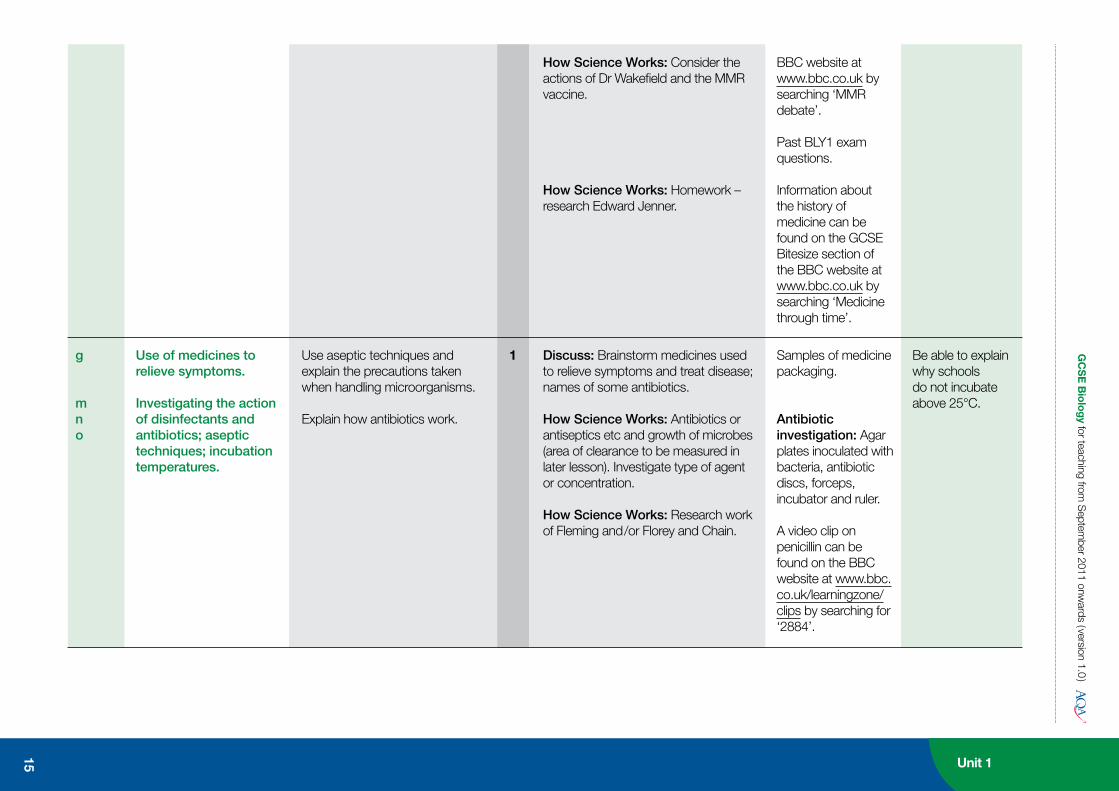
BBC website at www.bbc.co.uk by searching ‘MMR debate’.
Past BLY1 exam questions.
Information about the history of medicine can be found on the GCSE Bitesize section of the BBC website at www.bbc.co.uk by searching ‘Medicine through time’.
1g
mno
Use of medicines to relieve symptoms.
Investigating the action of disinfectants and antibiotics; aseptic techniques; incubation temperatures.
Use aseptic techniques and explain the precautions taken when handling microorganisms.
Explain how antibiotics work.
Discuss: Brainstorm medicines used to relieve symptoms and treat disease; names of some antibiotics.
How Science Works: Antibiotics or antiseptics etc and growth of microbes (area of clearance to be measured in later lesson). Investigate type of agent or concentration.
How Science Works: Research work of Fleming and /or Florey and Chain.
Samples of medicine packaging.
Antibiotic investigation: Agar plates inoculated with bacteria, antibiotic discs, forceps, incubator and ruler.
A video clip on penicillin can be found on the BBC website at www.bbc.co.uk/learningzone/clips by searching for ‘2884’.
Be able to explain why schools do not incubate above 25°C.
15 Unit 1
How Science Works: Consider the actions of Dr Wakefield and the MMR vaccine.
How Science Works: Homework – research Edward Jenner.
Unit 1G
CS
E B
iolo
gy for teaching from
Septem
ber 2011 onwards ( version 1.0 )
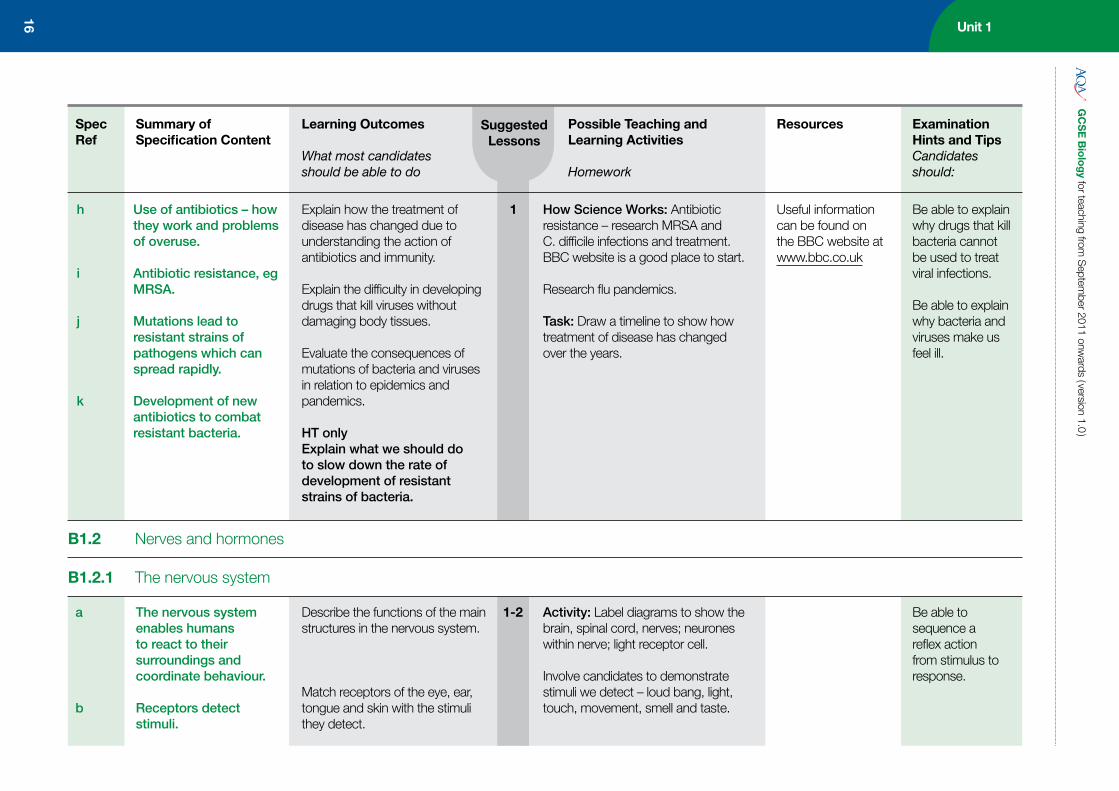
Be able to explain why drugs that kill bacteria cannot be used to treat viral infections.
Be able to explain why bacteria and viruses make us feel ill.
Useful information can be found on the BBC website at www.bbc.co.uk
How Science Works: Antibiotic resistance – research MRSA and C. difficile infections and treatment. BBC website is a good place to start.
Research flu pandemics.
Task: Draw a timeline to show how treatment of disease has changed over the years.
1Explain how the treatment of disease has changed due to understanding the action of antibiotics and immunity.
Explain the difficulty in developing drugs that kill viruses without damaging body tissues.
Evaluate the consequences of mutations of bacteria and viruses in relation to epidemics and pandemics.
HT onlyExplain what we should do to slow down the rate of development of resistant strains of bacteria.
Use of antibiotics – how they work and problems of overuse.
Antibiotic resistance, eg MRSA.
Mutations lead to resistant strains of pathogens which can spread rapidly.
Development of new antibiotics to combat resistant bacteria.
h
i
j
k
1-2a
b
The nervous system enables humans to react to their surroundings and coordinate behaviour.
Receptors detect stimuli.
Describe the functions of the main structures in the nervous system.
Match receptors of the eye, ear, tongue and skin with the stimuli they detect.
Be able to sequence a reflex action from stimulus to response.
Activity: Label diagrams to show the brain, spinal cord, nerves; neurones within nerve; light receptor cell.
Involve candidates to demonstrate stimuli we detect – loud bang, light, touch, movement, smell and taste.
B1.2 Nerves and hormones
B1.2.1 The nervous system
16
SpecRef
Summary of Specification Content
Learning Outcomes
What most candidates should be able to do
Possible Teaching and Learning Activities
Homework
Resources Examination Hints and TipsCandidates should:
SuggestedLessons

GC
SE
Bio
log
y for teaching from S
eptember 2011 onw
ards ( version 1.0 )
17 Unit 1
1
c
de
Basic structure of a light receptor cell.
Pathway of nerve impulses and reflex actions.
Label a light receptor cell with a nucleus, cytoplasm and cell membrane.
Explain the importance of being able to respond to environmental changes.
Explain the importance of reflex actions and be able to give examples.
Describe the pathway of a nerve impulse in a reflex response and explain the roles of the structures involved.
Explain the role of chemicals at synapses.
Describe different ways of measuring reaction time.
Demo: Response to different temperatures.
How Science Works: Detecting different tastes on the tongue – draw results on diagram of tongue.
Discuss: Discuss the senses and complete a table to show name of sense, main organ and stimulus it responds to.
How Science Works: Investigate sensitivity of different areas of the body.
Demo: Knee-jerk and pupil reflexes. Discuss their importance and gather other examples leading into explanation of why they are faster than a voluntary action.
Try the Sheep Dash activity.
How Science Works: Investigate reaction time using different combinations of receptors.
Activity: Use cards to sequence the pathway of a nerve impulse. Arrange candidates holding cards in the sequence and discuss role of each and how impulse passes from one to another.
Match structures in nerve pathway to different reflex actions, eg production of saliva when smelling food; pupil response to light.
Homework: Research diseases of the nervous system.
Response to temperature: Three bowls of water – hot,warm and ice-cold.
Taste receptors: Salt, sugar, coffee and lemon solutions to taste.
Skin sensitivity: Hairpin set with 1cm gap, blindfolds.
Torch
The Sheep Dash activity can be found on the BBC website at www.bbc.co.uk/science/humanbody/sleep/sheep
Reaction time: Metre-rulers and blindfolds or sensors and dataloggers.
Cards
Past BLY1 exam questions.
Be able to match the organ containing receptors to the stimulus detected.
stimulus receptor sensory neurone relay neurone motor neurone effector response
Unit 1G
CS
E B
iolo
gy for teaching from
Septem
ber 2011 onwards ( version 1.0 )
18
SpecRef
Summary of Specification Content
Learning Outcomes
What most candidates should be able to do
Possible Teaching and Learning Activities
Homework
Resources Examination Hints and TipsCandidates should:
SuggestedLessons
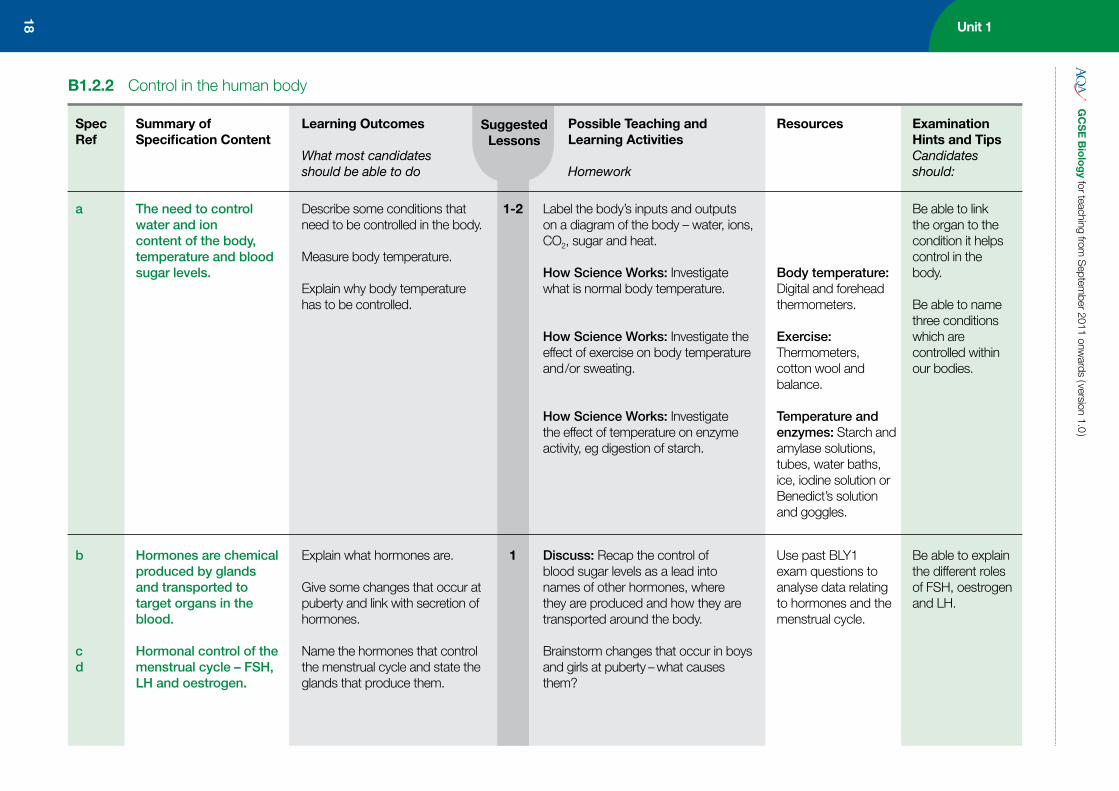
B1.2.2 Control in the human body
1-2
1
a
b
cd
The need to control water and ion content of the body, temperature and blood sugar levels.
Hormones are chemical produced by glands and transported to target organs in the blood.
Hormonal control of the menstrual cycle – FSH, LH and oestrogen.
Describe some conditions that need to be controlled in the body.
Measure body temperature.
Explain why body temperature has to be controlled.
Explain what hormones are.
Give some changes that occur at puberty and link with secretion of hormones.
Name the hormones that control the menstrual cycle and state the glands that produce them.
Label the body’s inputs and outputs on a diagram of the body – water, ions, CO2, sugar and heat.
How Science Works: Investigate what is normal body temperature.
How Science Works: Investigate the effect of exercise on body temperature and /or sweating.
How Science Works: Investigate the effect of temperature on enzyme activity, eg digestion of starch.
Discuss: Recap the control of blood sugar levels as a lead into names of other hormones, where they are produced and how they are transported around the body.
Brainstorm changes that occur in boys and girls at puberty – what causes them?
Body temperature: Digital and forehead thermometers.
Exercise: Thermometers, cotton wool and balance.
Temperature and enzymes: Starch and amylase solutions, tubes, water baths, ice, iodine solution or Benedict’s solution and goggles.
Use past BLY1 exam questions to analyse data relating to hormones and the menstrual cycle.
Be able to link the organ to the condition it helps control in the body.
Be able to name three conditions which are controlled within our bodies.
Be able to explain the different roles of FSH, oestrogen and LH.
1e Uses of hormones in the control of fertility – oral contraception and fertility drugs.
Evaluate the benefits and problems of using hormones to control fertility.
State the hormones that may be present in oral contraceptives.
Link the hormones used in oral contraceptives to their effects on the body.
Produce a flow diagram to explain the process of In Vitro Fertilisation (IVF).
Task: Produce a diagram to show the names, sites of production and effects of FSH, LH and oestrogen in the menstrual cycle.
Activity: Look at oral contraceptive packaging to find out the names of hormones used.
Research: Research why each hormone is used and produce a report on the advantages and disadvantages of different oral contraceptives.
Discuss: Apply different ethical approaches to making a decision about non-vital transplants.
Discuss: Discuss possible causes of infertility in men and women and treatment available.
Research: Research the process of IVF and produce a report.
Invite an outside speaker to discuss contraception, eg women’s health nurse.
Oral contraceptives
Useful information can be found at www.nhsdirect.nhs.uk/en
A good activity can be found at www.UPD8.org.uk by searching for ‘New womb?’.
Useful information on IVF can be found at www.babycentre.co.uk by searching for ‘In Vitro Fertilisation’.
Be able to state how oral contraceptives have been improved over the years.
Be able to describe the main stages involved in IVF treatment. G
CS
E B
iolo
gy for teaching from
Septem
ber 2011 onwards ( version 1.0 )
19 Unit 1

Unit 1G
CS
E B
iolo
gy for teaching from
Septem
ber 2011 onwards ( version 1.0 )
20
SpecRef
Summary of Specification Content
Learning Outcomes
What most candidates should be able to do
Possible Teaching and Learning Activities
Homework
Resources Examination Hints and TipsCandidates should:
SuggestedLessons
B1.2.3 Control in plants
2a
b
c
Plant shoots and roots respond to light, moisture and gravity.
Hormones control and coordinate growth in plants.
Responses to light, gravity and moisture are controlled by the unequal distribution of auxin which causes unequal growth rates in shoots and roots.
Describe how plant shoots and roots respond to light, gravity and moisture.
Draw diagrams to explain the role of auxin in plant responses in terms of unequal distribution in shoots and roots.
Demo: Demonstrate a plant’s sense of touch – Venus fly trap, Mimosa, Honeysuckle or show video clips.
How Science Works: Effect of light on growth of shoots – dark, even light, light box and clinostat in light box.
How Science Works: Compare the ability of different plants to reach light – obstacle course.
How Science Works: Demonstrate positive and negative phototropism.
Useful information on plant growth can be found at www.s-cool.co.uk by searching for ‘plant growth’.
Light experiments: Mustard seedlings in dishes, two light boxes and clinostat in light box.
Obstacle course: Three identical shoe boxes with simple obstacle course inside and hole at one end, dish of mustard seedlings, germinating broad bean and sprouting potato.
Positive and negative phototropism: Broad bean seedling held by pin in jar with light entering through a slit.
Be able to describe the role of auxin.
GC
SE
Bio
log
y for teaching from S
eptember 2011 onw
ards ( version 1.0 )
21 Unit 1
1d Use of plant hormones in agriculture and horticulture.
Explain how plant hormones are used as weed killers and rooting hormones.
How Science Works: Investigate which part of a shoot is sensitive to light.
How Science Works: Effect of gravity on growth of plants.
How Science Works: Interpret Darwin’s experiments.
How Science Works: Interpret experiments using agar blocks and seedlings with shoot tips removed.
How Science Works: Demonstrate response to water.
Task: Draw diagrams to explain plant responses in terms of distribution of auxin.
How Science Works: Investigate the effect of rooting hormones on growth of cuttings.
How Science Works: Investigate the effect of weed killer on an area of lawn.
Light sensitivity: Three pots of oat seedlings in three light boxes – tips removed, tips covered and untreated.
Gravity: Grow broad beans in dark jar in different positions, blotting paper.
Broad bean seedling in clinostat in dark – rotating and still.
Water: Trough of dry soil with clay plant pot full of water at centre, plant broad beans around clay pot.
Past BLY1 exam questions.
Rooting hormone: Rooting powder, jars of water and plant cuttings.
Weed killer: Selective weed killer solution.
Be able to state some commercial uses of plant hormones.

Unit 1G
CS
E B
iolo
gy for teaching from
Septem
ber 2011 onwards ( version 1.0 )
22
SpecRef
Summary of Specification Content
Learning Outcomes
What most candidates should be able to do
Possible Teaching and Learning Activities
Homework
Resources Examination Hints and TipsCandidates should:
SuggestedLessons
B1.3 The use and abuse of drugs
1
1
ab
d
c
e
Testing of new drugs and clinical trials.
Thalidomide
Statins lower the amount of cholesterol in the blood.
Recreational drugs
Define the term ‘drug’.
Give examples of medical drugs.
Explain why drugs need to be tested before they can be prescribed.
Describe the uses and problems associated with thalidomide.
Explain how the drug testing procedure for thalidomide was inappropriate.
Describe the main steps in testing a new drug.
Explain the terms placebo and double-blind trial.
Describe and evaluate the effect of statins in cardiovascular disease.
Name some recreational drugs.
Describe some effects of caffeine on the body.
Discuss: Brainstorm – what is a drug? Names of medicines.
Activity: Use pictures to relate uses and problems associated with thalidomide.
Research: Research and produce a report on thalidomide – original use, use in pregnant women, current uses.
Discuss: Discuss drug safety and how drugs are tested today.
Activity: Cards /cut-outs to sequence stages in drug testing and trialling and purpose of each stage.
Task: Interpret data on statins (links with inherited factors B1.1.1d).
Discuss: Brainstorm on recreational drugs, sort into legal and illegal and discuss why people use them.
Exhibition of medicines.
Useful information on thalidomide can be found at www.thalidomideuk.com
Drug testing cards.
Statin packaging
Past BLY1 exam questions.
Be able to give reasons for the different stages in drug testing.
Be able to explain why a person might become addicted to a recreational drug.
B1.3.1 Drugs

GC
SE
Bio
log
y for teaching from S
eptember 2011 onw
ards ( version 1.0 )
23 Unit 1
e
g
Recreational drugs
Impact of legal drugs on health is greater than illegal drugs as more people use them.
Evaluate the impact of smoking on health.
Evaluate why some people use illegal drugs for recreation.
Evaluate claims made about the effect of prescribed and non-prescribed drugs on health.
1
How Science Works: Investigate the effect of caffeine on heart rate or reaction time (see B1.2.1 ‘reaction time experiment’).
Demo: Smoking machine to show carbon dioxide and tar content of smoke.
Poster to show effects of chemicals in smoke on the body.
Calculate the cost of smoking cigarettes.
Show health warning on packets of cigarettes; video clips of smoking adverts. Why do people smoke?
Caffeine: Coffee / energy drink /coke vs decaf version or water, timer / pulse rate sensor and ruler.
Cigarette, smoking machine, limewater, Univeral Indicator (UI) indicator solution, cotton wool and pump.
Useful information on drugs can be found at www.talktofrank.com
A useful tool about smoking can be found on the NHS website at www.nhs.uk by searching ‘smoking calculator’.
Further information on smoking can be found at www.ash.org.uk
Be able to use data from a line graph to describe the relationship between birth mass of a baby and the number of cigarettes smoked by the mother.
1e
g
Recreational drugs
Impact of legal drugs on health is greater than illegal drugs as more people use them.
Evaluate the impact of alcohol on health.
Evaluate why some people use illegal drugs for recreation.
Evaluate claims made about the effect of prescribed and non-prescribed drugs on health.
Discuss: Discuss effects of alcohol on the body, recommended units for men and women. Calculate number of units of alcohol consumed.
Download alcohol units tracker on NHS site.
Relate smoking and alcohol to NHS costs.
Exhibition of alcoholic drinks with units per measure.
A tool about drinking can be found on the NHS website at www.nhs.uk by searching ‘alcohol tracker’.
Past BLY1 exam questions.
Be able to give three possible effects of the misuse of alcohol.
Unit 1
24
SpecRef
Summary of Specification Content
Learning Outcomes
What most candidates should be able to do
Possible Teaching and Learning Activities
Homework
Resources Examination Hints and TipsCandidates should:
SuggestedLessons
GC
SE
Bio
log
y for teaching from S
eptember 2011 onw
ards ( version 1.0 )
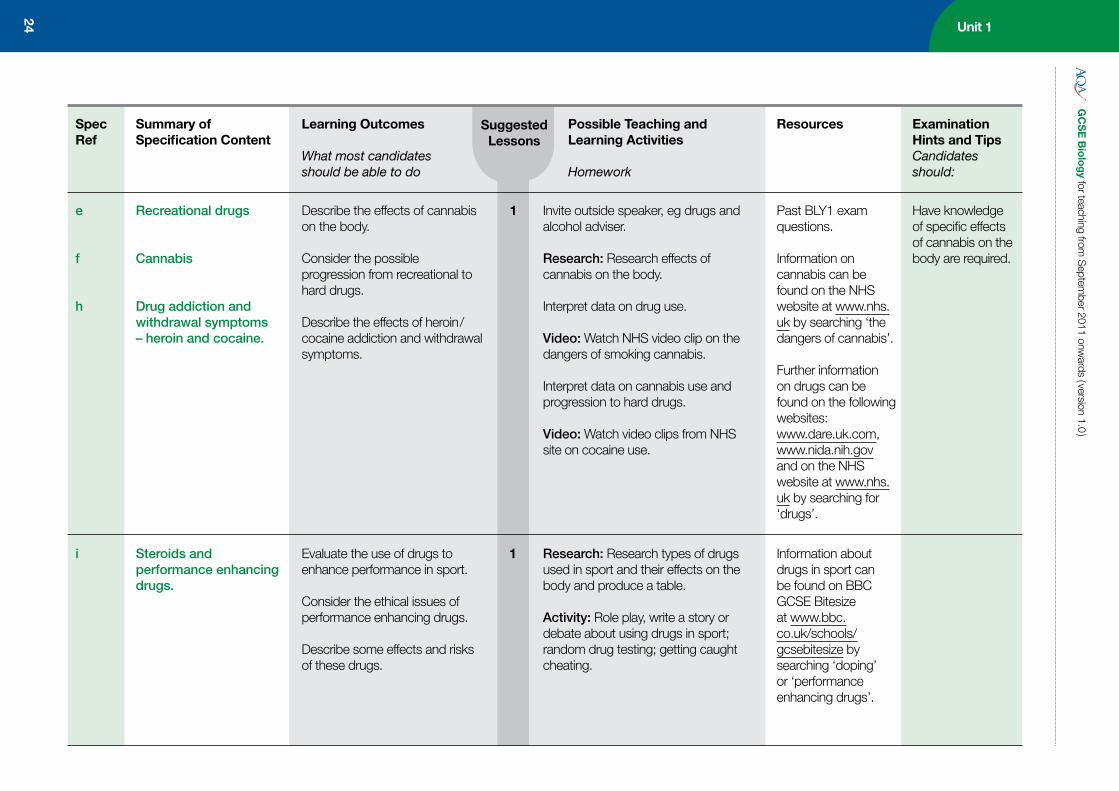
e
f
h
Recreational drugs
Cannabis
Drug addiction and withdrawal symptoms – heroin and cocaine.
Describe the effects of cannabis on the body.
Consider the possible progression from recreational to hard drugs.
Describe the effects of heroin / cocaine addiction and withdrawal symptoms.
1 Invite outside speaker, eg drugs and alcohol adviser.
Research: Research effects of cannabis on the body.
Interpret data on drug use.
Video: Watch NHS video clip on the dangers of smoking cannabis.
Interpret data on cannabis use and progression to hard drugs.
Video: Watch video clips from NHS site on cocaine use.
Past BLY1 exam questions.
Information on cannabis can be found on the NHS website at www.nhs.uk by searching ‘the dangers of cannabis’.
Further information on drugs can be found on the following websites:www.dare.uk.com,www.nida.nih.govand on the NHS website at www.nhs.uk by searching for ‘drugs’.
Have knowledge of specific effects of cannabis on the body are required.
i Steroids and performance enhancing drugs.
Evaluate the use of drugs to enhance performance in sport.
Consider the ethical issues of performance enhancing drugs.
Describe some effects and risks of these drugs.
Research: Research types of drugs used in sport and their effects on the body and produce a table.
Activity: Role play, write a story or debate about using drugs in sport; random drug testing; getting caught cheating.
Information about drugs in sport can be found on BBC GCSE Bitesize at www.bbc.co.uk/schools/gcsebitesize by searching ‘doping’ or ‘performance enhancing drugs’.
1
GC
SE
Bio
log
y for teaching from S
eptember 2011 onw
ards ( version 1.0 )
25 Unit 1
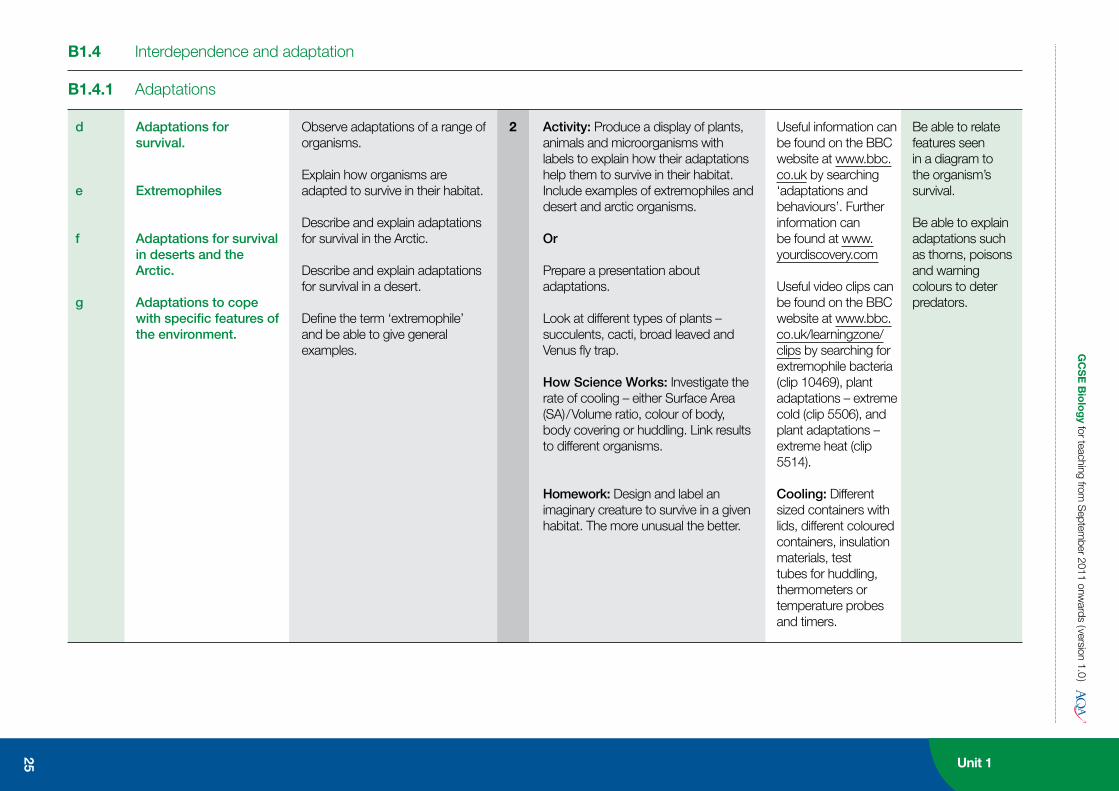
B1.4 Interdependence and adaptation
2d
e
f
g
Adaptations for survival.
Extremophiles
Adaptations for survival in deserts and the Arctic.
Adaptations to cope with specific features of the environment.
Observe adaptations of a range of organisms.
Explain how organisms are adapted to survive in their habitat.
Describe and explain adaptations for survival in the Arctic.
Describe and explain adaptations for survival in a desert.
Define the term ‘extremophile’ and be able to give general examples.
Activity: Produce a display of plants, animals and microorganisms with labels to explain how their adaptations help them to survive in their habitat. Include examples of extremophiles and desert and arctic organisms.
Or
Prepare a presentation about adaptations.
Look at different types of plants – succulents, cacti, broad leaved and Venus fly trap.
How Science Works: Investigate the rate of cooling – either Surface Area (SA) / Volume ratio, colour of body, body covering or huddling. Link results to different organisms.
Homework: Design and label an imaginary creature to survive in a given habitat. The more unusual the better.
Useful information can be found on the BBC website at www.bbc.co.uk by searching ‘adaptations and behaviours’. Further information can be found at www.yourdiscovery.com
Useful video clips can be found on the BBC website at www.bbc.co.uk/learningzone/clips by searching for extremophile bacteria (clip 10469), plant adaptations – extreme cold (clip 5506), and plant adaptations – extreme heat (clip 5514).
Cooling: Different sized containers with lids, different coloured containers, insulation materials, test tubes for huddling, thermometers or temperature probes and timers.
Be able to relate features seen in a diagram to the organism’s survival.
Be able to explain adaptations such as thorns, poisons and warning colours to deter predators.
B1.4.1 Adaptations
Unit 1G
CS
E B
iolo
gy for teaching from
Septem
ber 2011 onwards ( version 1.0 )
26
SpecRef
Summary of Specification Content
Learning Outcomes
What most candidates should be able to do
Possible Teaching and Learning Activities
Homework
Resources Examination Hints and TipsCandidates should:
SuggestedLessons
2-3a
b
c
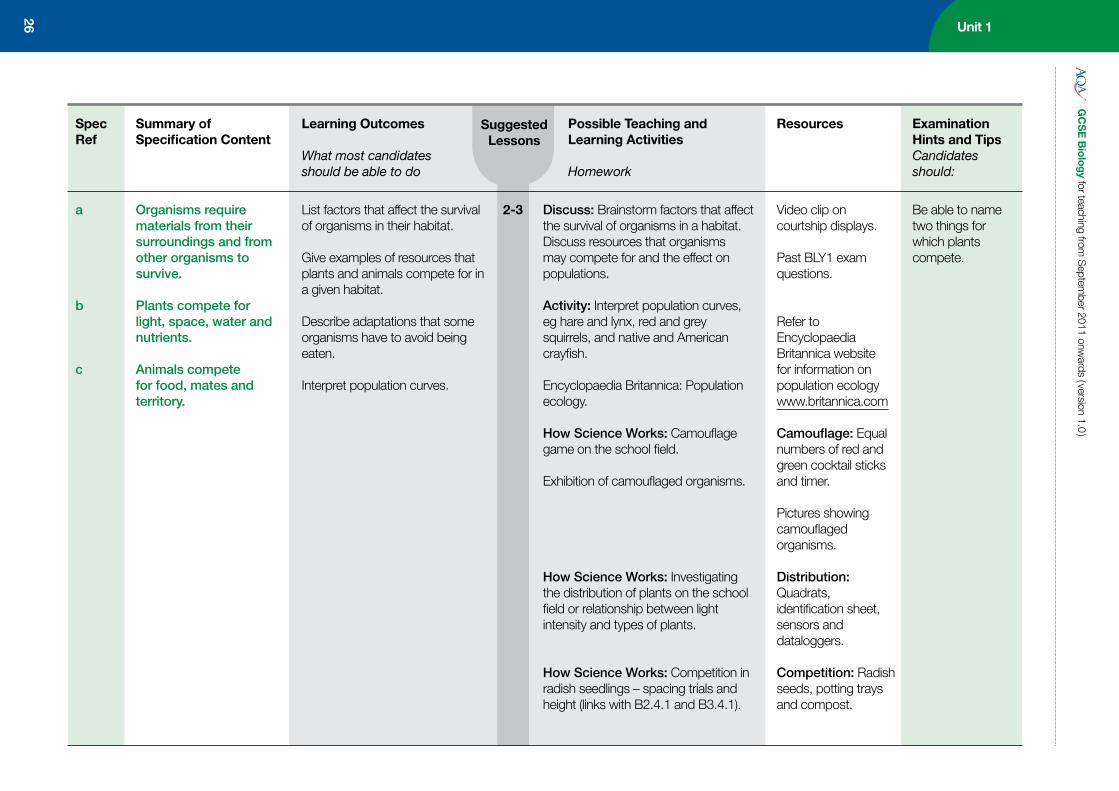
Organisms require materials from their surroundings and from other organisms to survive.
Plants compete for light, space, water and nutrients.
Animals compete for food, mates and territory.
List factors that affect the survival of organisms in their habitat.
Give examples of resources that plants and animals compete for in a given habitat.
Describe adaptations that some organisms have to avoid being eaten.
Interpret population curves.
Discuss: Brainstorm factors that affect the survival of organisms in a habitat. Discuss resources that organisms may compete for and the effect on populations.
Activity: Interpret population curves, eg hare and lynx, red and grey squirrels, and native and American crayfish.
Encyclopaedia Britannica: Population ecology.
How Science Works: Camouflage game on the school field.
Exhibition of camouflaged organisms.
How Science Works: Investigating the distribution of plants on the school field or relationship between light intensity and types of plants.
How Science Works: Competition in radish seedlings – spacing trials and height (links with B2.4.1 and B3.4.1).
Video clip on courtship displays.
Past BLY1 exam questions.
Refer to Encyclopaedia Britannica website for information on population ecologywww.britannica.com
Camouflage: Equal numbers of red and green cocktail sticks and timer.
Pictures showing camouflaged organisms.
Distribution: Quadrats, identification sheet, sensors and dataloggers.
Competition: Radish seeds, potting trays and compost.
Be able to name two things for which plants compete.
27 Unit 1
GC
SE
Bio
log
y for teaching from S
eptember 2011 onw
ards ( version 1.0 )B1.4.2 Environmental change
2-3a
b
c
d
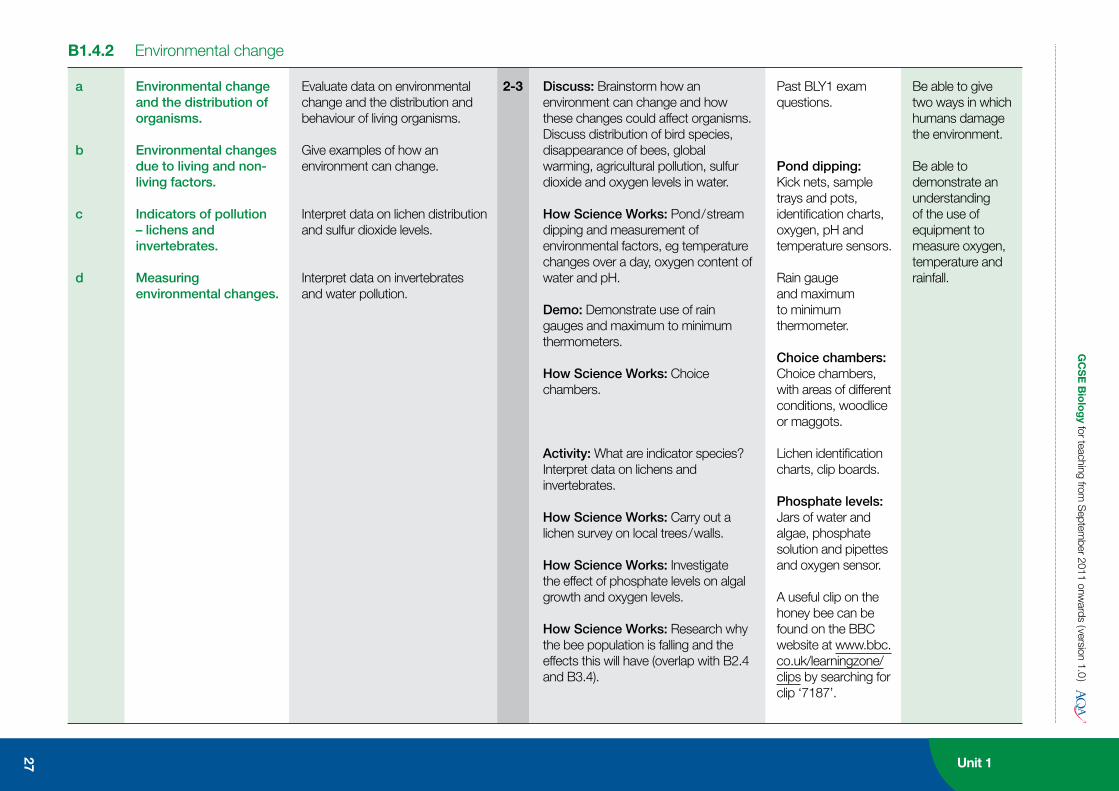
Environmental change and the distribution of organisms.
Environmental changes due to living and non-living factors.
Indicators of pollution – lichens and invertebrates.
Measuring environmental changes.
Evaluate data on environmental change and the distribution and behaviour of living organisms.
Give examples of how an environment can change.
Interpret data on lichen distribution and sulfur dioxide levels.
Interpret data on invertebrates and water pollution.
Discuss: Brainstorm how an environment can change and how these changes could affect organisms. Discuss distribution of bird species, disappearance of bees, global warming, agricultural pollution, sulfur dioxide and oxygen levels in water.
How Science Works: Pond / stream dipping and measurement of environmental factors, eg temperature changes over a day, oxygen content of water and pH.
Demo: Demonstrate use of rain gauges and maximum to minimum thermometers.
How Science Works: Choice chambers.
Activity: What are indicator species? Interpret data on lichens and invertebrates.
How Science Works: Carry out a lichen survey on local trees / walls.
How Science Works: Investigate the effect of phosphate levels on algal growth and oxygen levels.
How Science Works: Research why the bee population is falling and the effects this will have (overlap with B2.4 and B3.4).
Past BLY1 exam questions.
Pond dipping: Kick nets, sample trays and pots, identification charts, oxygen, pH and temperature sensors.
Rain gauge and maximum to minimum thermometer.
Choice chambers: Choice chambers, with areas of different conditions, woodlice or maggots.
Lichen identification charts, clip boards.
Phosphate levels: Jars of water and algae, phosphate solution and pipettes and oxygen sensor.
A useful clip on the honey bee can be found on the BBC website at www.bbc.co.uk/learningzone/clips by searching for clip ‘7187’.
Be able to give two ways in which humans damage the environment.
Be able to demonstrate an understanding of the use of equipment to measure oxygen, temperature and rainfall.
Unit 1G
CS
E B
iolo
gy for teaching from
Septem
ber 2011 onwards ( version 1.0 )
B1.5 Energy and biomass in food chains
B1.5.1 Energy in biomass
1
1
a
b
b
c
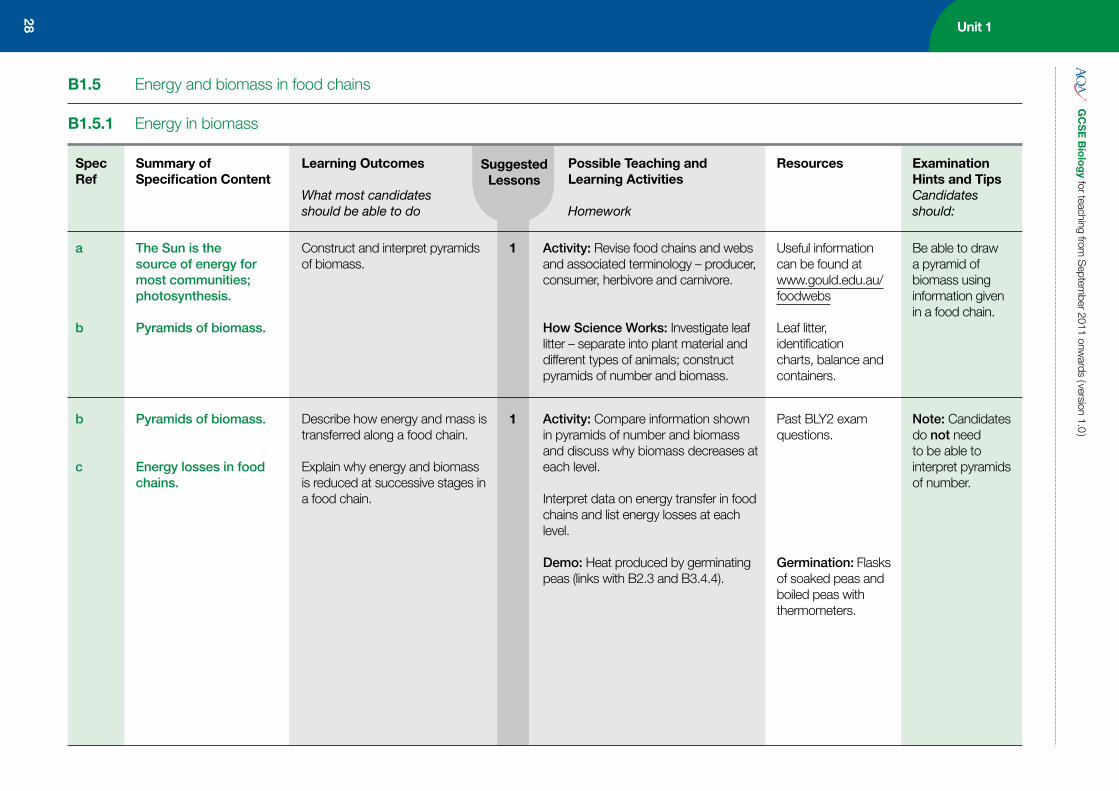
The Sun is the source of energy for most communities; photosynthesis.
Pyramids of biomass.
Pyramids of biomass.
Energy losses in food chains.
Construct and interpret pyramids of biomass.
Describe how energy and mass is transferred along a food chain.
Explain why energy and biomass is reduced at successive stages in a food chain.
Activity: Revise food chains and webs and associated terminology – producer, consumer, herbivore and carnivore.
How Science Works: Investigate leaf litter – separate into plant material and different types of animals; construct pyramids of number and biomass.
Activity: Compare information shown in pyramids of number and biomass and discuss why biomass decreases at each level.
Interpret data on energy transfer in food chains and list energy losses at each level.
Demo: Heat produced by germinating peas (links with B2.3 and B3.4.4).
Useful information can be found at www.gould.edu.au/foodwebs
Leaf litter, identification charts, balance and containers.
Past BLY2 exam questions.
Germination: Flasks of soaked peas and boiled peas with thermometers.
Be able to draw a pyramid of biomass using information given in a food chain.
Note: Candidates do not need to be able to interpret pyramids of number.
28
SpecRef
Summary of Specification Content
Learning Outcomes
What most candidates should be able to do
Possible Teaching and Learning Activities
Homework
Resources Examination Hints and TipsCandidates should:
SuggestedLessons
GC
SE
Bio
log
y for teaching from S
eptember 2011 onw
ards ( version 1.0 )
29 Unit 1
B1.6 Waste materials from plants and animals
B1.6.1 Decay processes
2a
b
c
d
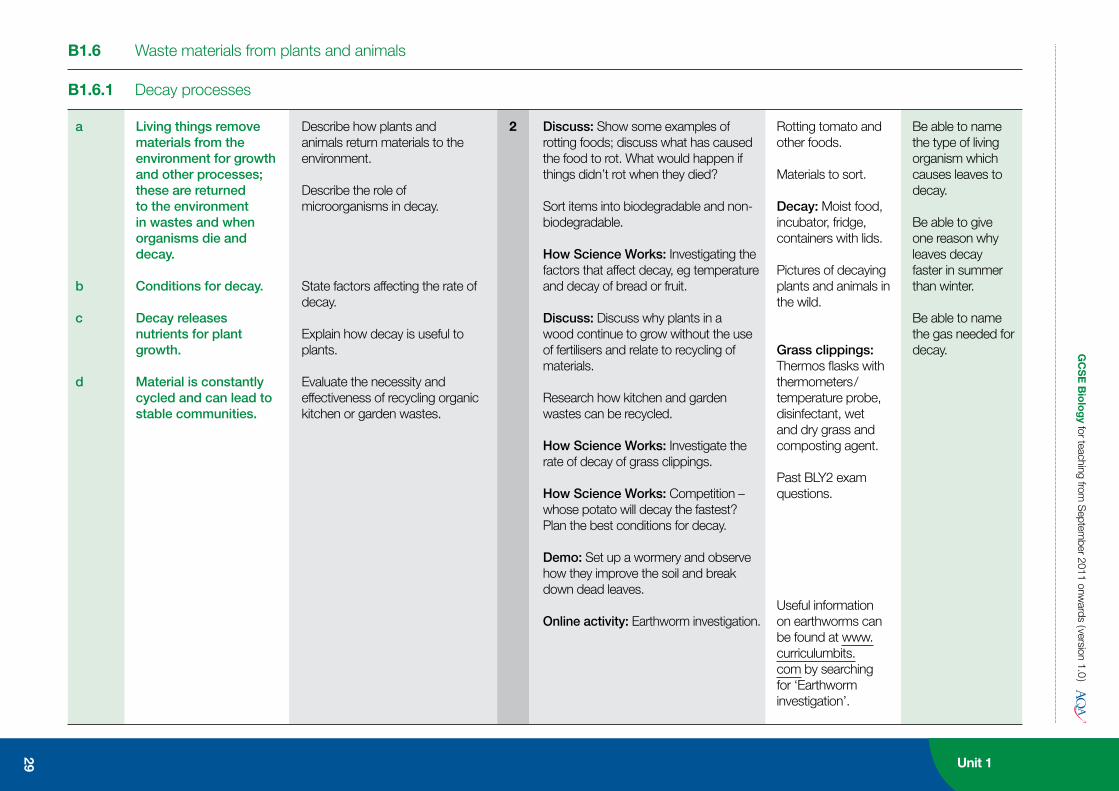
Living things remove materials from the environment for growth and other processes; these are returned to the environment in wastes and when organisms die and decay.
Conditions for decay.
Decay releases nutrients for plant growth.
Material is constantly cycled and can lead to stable communities.
Describe how plants and animals return materials to the environment.
Describe the role of microorganisms in decay.
State factors affecting the rate of decay.
Explain how decay is useful to plants.
Evaluate the necessity and effectiveness of recycling organic kitchen or garden wastes.
Discuss: Show some examples of rotting foods; discuss what has caused the food to rot. What would happen if things didn’t rot when they died?
Sort items into biodegradable and non-biodegradable.
How Science Works: Investigating the factors that affect decay, eg temperature and decay of bread or fruit.
Discuss: Discuss why plants in a wood continue to grow without the use of fertilisers and relate to recycling of materials.
Research how kitchen and garden wastes can be recycled.
How Science Works: Investigate the rate of decay of grass clippings.
How Science Works: Competition – whose potato will decay the fastest? Plan the best conditions for decay.
Demo: Set up a wormery and observe how they improve the soil and break down dead leaves.
Online activity: Earthworm investigation.
Rotting tomato and other foods.
Materials to sort.
Decay: Moist food, incubator, fridge, containers with lids.
Pictures of decaying plants and animals in the wild.
Grass clippings: Thermos flasks with thermometers / temperature probe, disinfectant, wet and dry grass and composting agent.
Past BLY2 exam questions.
Useful information on earthworms can be found at www.curriculumbits.com by searching for ‘Earthworm investigation’.
Be able to name the type of living organism which causes leaves to decay.
Be able to give one reason why leaves decay faster in summer than winter.
Be able to name the gas needed for decay.
Unit 1G
CS
E B
iolo
gy for teaching from
Septem
ber 2011 onwards ( version 1.0 )
30
SpecRef
Summary of Specification Content
Learning Outcomes
What most candidates should be able to do
Possible Teaching and Learning Activities
Homework
Resources Examination Hints and TipsCandidates should:
SuggestedLessons
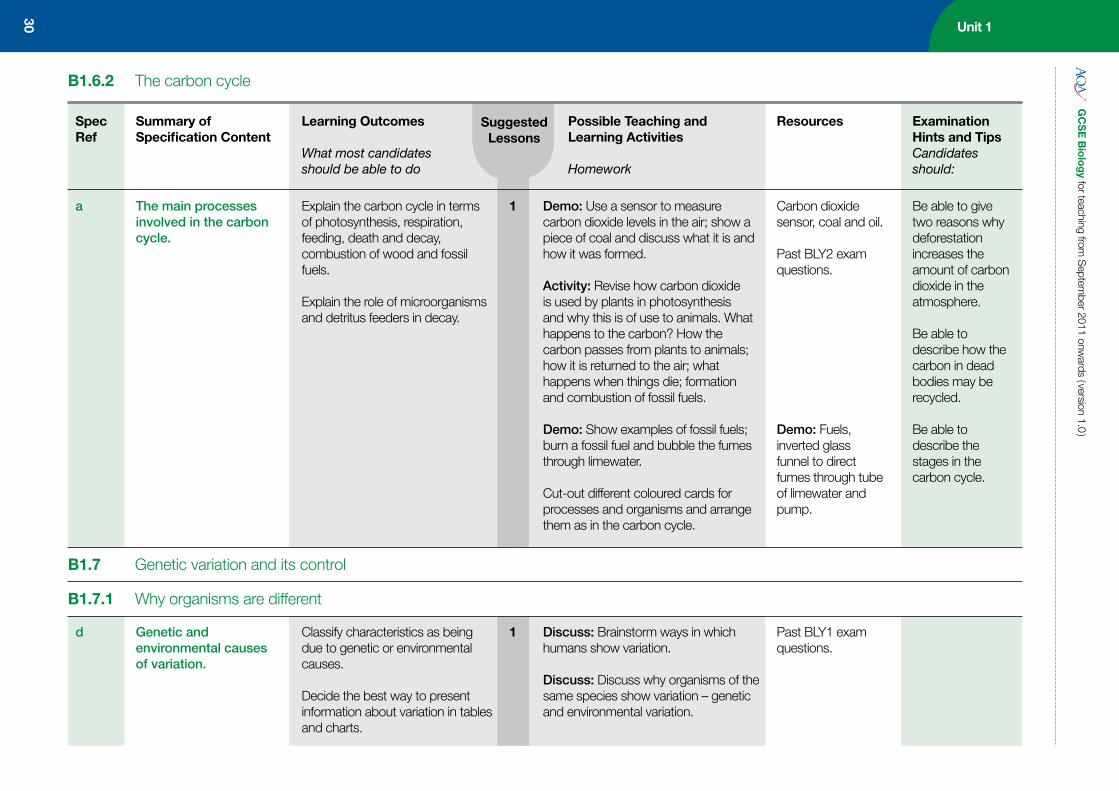
1a The main processes involved in the carbon cycle.
Explain the carbon cycle in terms of photosynthesis, respiration, feeding, death and decay, combustion of wood and fossil fuels.
Explain the role of microorganisms and detritus feeders in decay.
Demo: Use a sensor to measure carbon dioxide levels in the air; show a piece of coal and discuss what it is and how it was formed.
Activity: Revise how carbon dioxide is used by plants in photosynthesis and why this is of use to animals. What happens to the carbon? How the carbon passes from plants to animals; how it is returned to the air; what happens when things die; formation and combustion of fossil fuels.
Demo: Show examples of fossil fuels; burn a fossil fuel and bubble the fumes through limewater.
Cut-out different coloured cards for processes and organisms and arrange them as in the carbon cycle.
Carbon dioxide sensor, coal and oil.
Past BLY2 exam questions.
Demo: Fuels, inverted glass funnel to direct fumes through tube of limewater and pump.
Be able to give two reasons why deforestation increases the amount of carbon dioxide in the atmosphere.
Be able to describe how the carbon in dead bodies may be recycled.
Be able to describe the stages in the carbon cycle.
B1.6.2 The carbon cycle
B1.7 Genetic variation and its control
B1.7.1 Why organisms are different
Discuss: Brainstorm ways in which humans show variation.
Discuss: Discuss why organisms of the same species show variation – genetic and environmental variation.
d Genetic and environmental causes of variation.
1Classify characteristics as being due to genetic or environmental causes.
Decide the best way to present information about variation in tables and charts.
Past BLY1 exam questions.
GC
SE
Bio
log
y for teaching from S
eptember 2011 onw
ards ( version 1.0 )
31 Unit 1
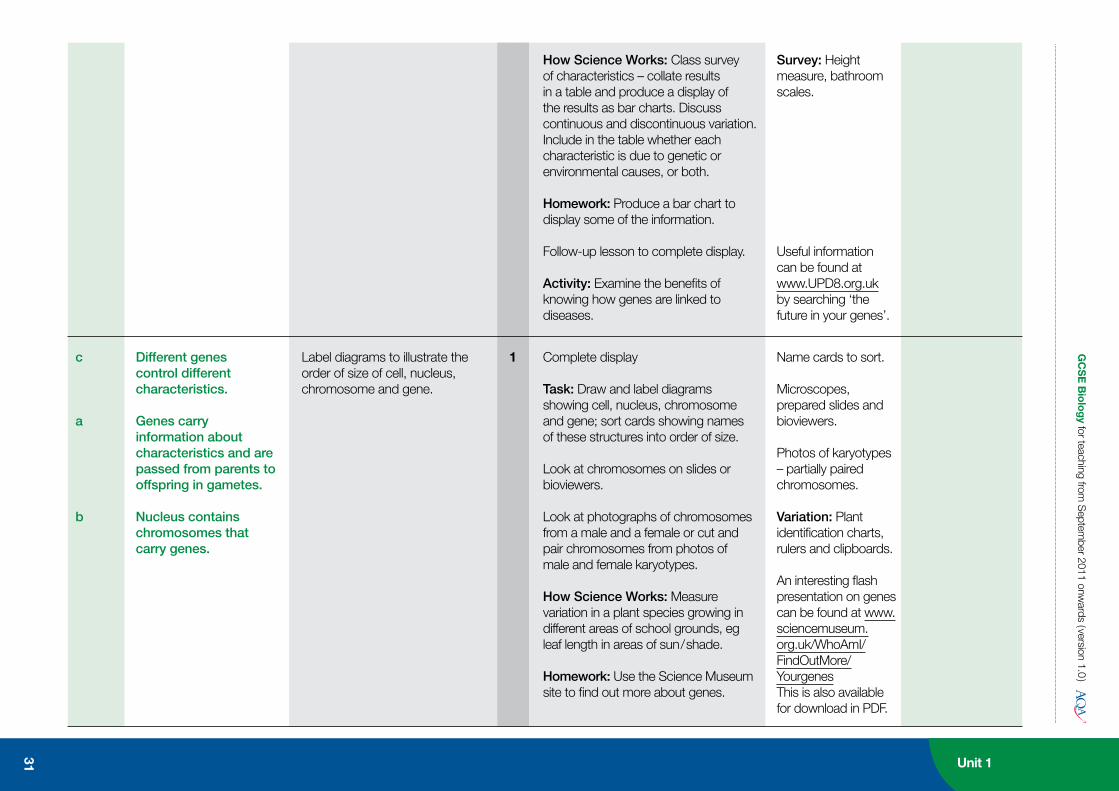
Complete display
Task: Draw and label diagrams showing cell, nucleus, chromosome and gene; sort cards showing names of these structures into order of size.
Look at chromosomes on slides or bioviewers.
Look at photographs of chromosomes from a male and a female or cut and pair chromosomes from photos of male and female karyotypes.
How Science Works: Measure variation in a plant species growing in different areas of school grounds, eg leaf length in areas of sun / shade.
Homework: Use the Science Museum site to find out more about genes.
1c
a
b
Different genes control different characteristics.
Genes carry information about characteristics and are passed from parents to offspring in gametes.
Nucleus contains chromosomes that carry genes.
Label diagrams to illustrate the order of size of cell, nucleus, chromosome and gene.
Name cards to sort.
Microscopes, prepared slides and bioviewers.
Photos of karyotypes – partially paired chromosomes.
Variation: Plant identification charts, rulers and clipboards.
An interesting flash presentation on genes can be found at www.sciencemuseum.org.uk/WhoAmI/FindOutMore/Yourgenes This is also available for download in PDF.
Survey: Height measure, bathroom scales.
Useful information can be found at www.UPD8.org.uk by searching ‘the future in your genes’.
How Science Works: Class survey of characteristics – collate results in a table and produce a display of the results as bar charts. Discuss continuous and discontinuous variation. Include in the table whether each characteristic is due to genetic or environmental causes, or both.
Homework: Produce a bar chart to display some of the information.
Follow-up lesson to complete display.
Activity: Examine the benefits of knowing how genes are linked to diseases.
Unit 1G
CS
E B
iolo
gy for teaching from
Septem
ber 2011 onwards ( version 1.0 )
32
SpecRef
Summary of Specification Content
Learning Outcomes
What most candidates should be able to do
Possible Teaching and Learning Activities
Homework
Resources Examination Hints and TipsCandidates should:
SuggestedLessons
B1.7.2 Reproduction
1
1
a
b
c
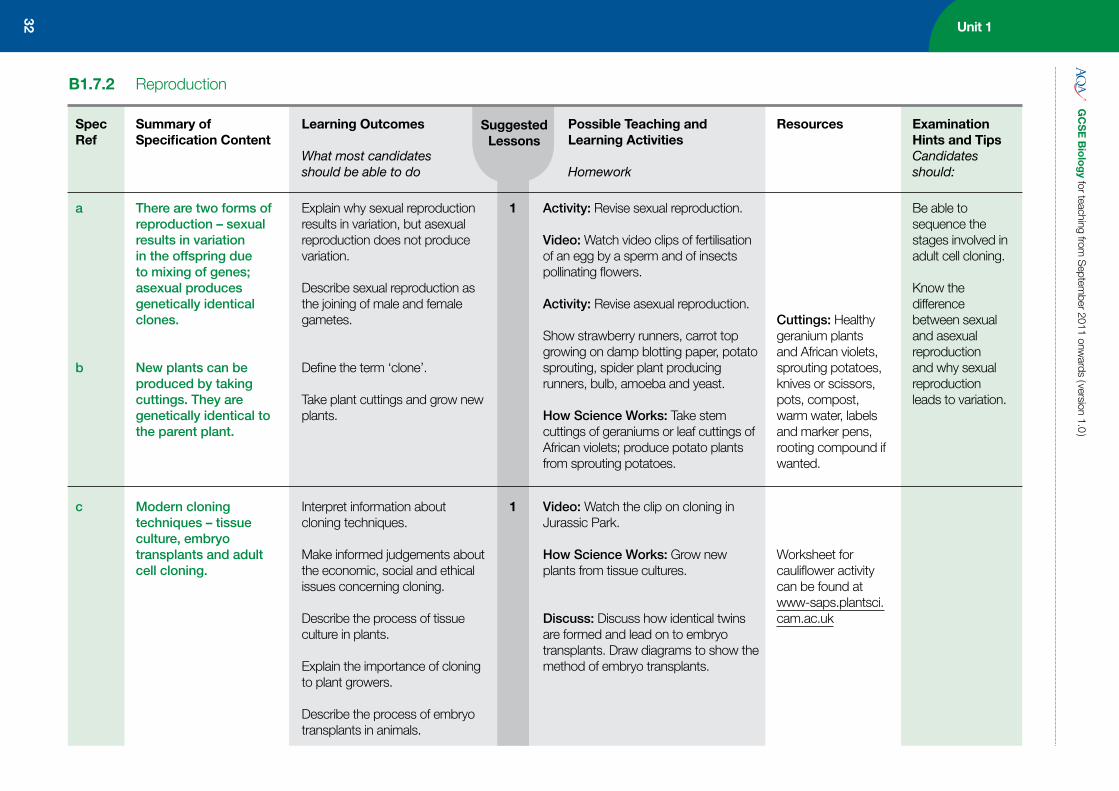
There are two forms of reproduction – sexual results in variation in the offspring due to mixing of genes; asexual produces genetically identical clones.
New plants can be produced by taking cuttings. They are genetically identical to the parent plant.
Modern cloning techniques – tissue culture, embryo transplants and adult cell cloning.
Explain why sexual reproduction results in variation, but asexual reproduction does not produce variation.
Describe sexual reproduction as the joining of male and female gametes.
Define the term ‘clone’.
Take plant cuttings and grow new plants.
Interpret information about cloning techniques.
Make informed judgements about the economic, social and ethical issues concerning cloning.
Describe the process of tissue culture in plants.
Explain the importance of cloning to plant growers.
Describe the process of embryo transplants in animals.
Activity: Revise sexual reproduction.
Video: Watch video clips of fertilisation of an egg by a sperm and of insects pollinating flowers.
Activity: Revise asexual reproduction.
Show strawberry runners, carrot top growing on damp blotting paper, potato sprouting, spider plant producing runners, bulb, amoeba and yeast.
How Science Works: Take stem cuttings of geraniums or leaf cuttings of African violets; produce potato plants from sprouting potatoes.
Video: Watch the clip on cloning in Jurassic Park.
How Science Works: Grow new plants from tissue cultures.
Discuss: Discuss how identical twins are formed and lead on to embryo transplants. Draw diagrams to show the method of embryo transplants.
Cuttings: Healthy geranium plants and African violets, sprouting potatoes, knives or scissors, pots, compost, warm water, labels and marker pens, rooting compound if wanted.
Worksheet for cauliflower activity can be found at www-saps.plantsci.cam.ac.uk
Be able to sequence the stages involved in adult cell cloning.
Know the difference between sexual and asexual reproduction and why sexual reproduction leads to variation.

33 Unit 1
GC
SE
Bio
log
y for teaching from S
eptember 2011 onw
ards ( version 1.0 )
1
1-2
c
d
e
f
Modern cloning techniques – tissue culture, embryo transplants and adult cell cloning.
Genetic engineering techniques.
Examples of genetic engineering.
Concerns about genetically modified (GM) crops.
Describe the process of adult cell cloning in animals.
Explain advantages and disadvantages of cloning techniques.
Define the term ‘genetic engineering’.
Describe the process of genetic engineering to produce bacteria that can produce insulin and crops that have desired characteristics.
Interpret information about genetic engineering techniques.
Make informed judgements about the economic, social and ethical issues concerning genetic engineering.
Explain advantages and disadvantages of genetic engineering.
Video: Watch video clip of adult cell cloning / Dolly the sheep.
Task: Produce a flow diagram to describe the process of adult cell cloning or carry out card sorting activity.
Research: Research and debate the advantages and disadvantages of cloning plants and animals.
How Science Works: Research latest legislation on human cloning and discuss social and ethical issues in regards to human cloning.
Interpret information about cloning techniques.
Discuss: Brainstorm what the terms genetic engineering, genetic modification and gene therapy mean.
List examples of genetic engineering.
Activity: Produce a diagram to explain how human insulin is produced by bacteria and discuss the advantages of this over porcine insulin (links with B3.3.3).
Video: Watch a video clip on genetic engineering.
Research: Research advantages and disadvantages of GM crops; what characteristics may be modified; produce a poster or a table of benefits versus concerns for homework.
Video clips on cloning can be found on the BBC website at www.bbc.co.uk/learningzone/clips by searching for clips ‘4140’ and ‘4139’.
Useful websites are www.bbc.co.uk and www.hfea.gov.uk
Past BLY1 exam questions.
Information on genetically modified food can be found at www.curriculumbits.com
Past BLY1 exam questions.
Be able to present arguments for and against human cloning.
Be able to give two reasons why some farmers are in favour of growing GM crops.
Be able to give two reasons why some people are against growing GM crops.
Unit 1G
CS
E B
iolo
gy for teaching from
Septem
ber 2011 onwards ( version 1.0 )
34
SpecRef
Summary of Specification Content
Learning Outcomes
What most candidates should be able to do
Possible Teaching and Learning Activities
Homework
Resources Examination Hints and TipsCandidates should:
SuggestedLessons
1plusHWK
1
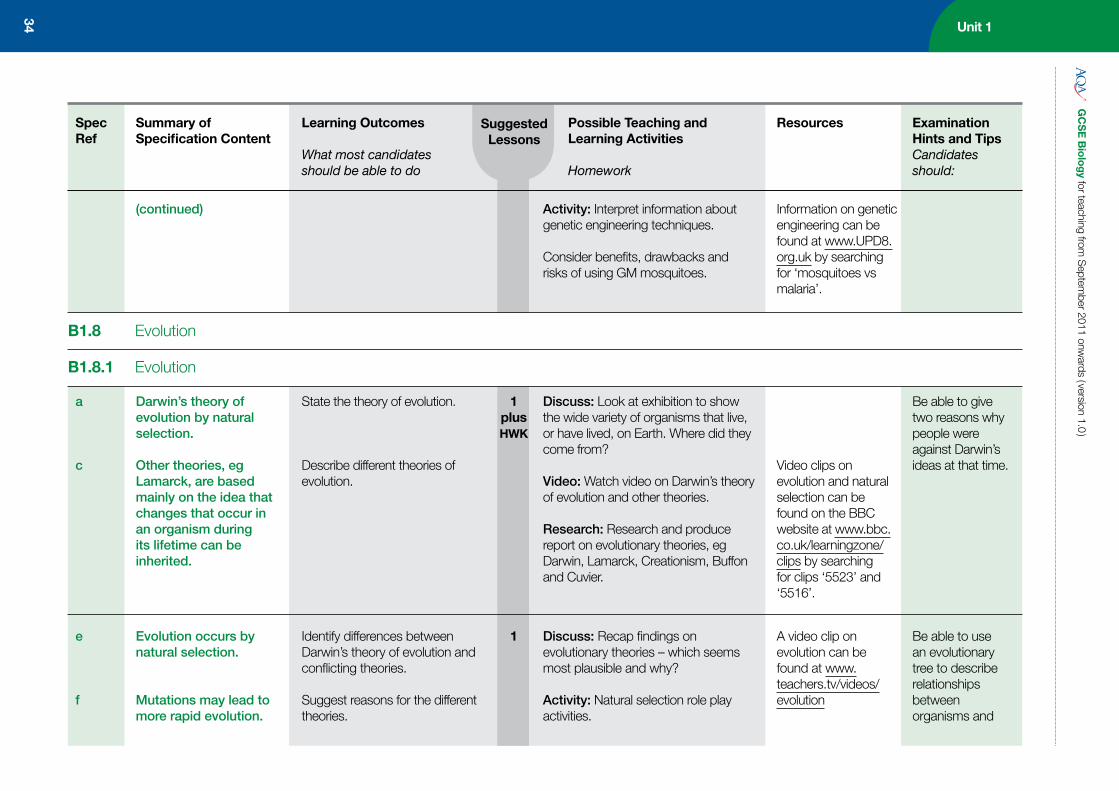
a
c
e
f
Darwin’s theory of evolution by natural selection.
Other theories, eg Lamarck, are based mainly on the idea that changes that occur in an organism during its lifetime can be inherited.
Evolution occurs by natural selection.
Mutations may lead to more rapid evolution.
State the theory of evolution.
Describe different theories of evolution.
Identify differences between Darwin’s theory of evolution and conflicting theories.
Suggest reasons for the different theories.
Discuss: Look at exhibition to show the wide variety of organisms that live, or have lived, on Earth. Where did they come from?
Video: Watch video on Darwin’s theory of evolution and other theories.
Research: Research and produce report on evolutionary theories, eg Darwin, Lamarck, Creationism, Buffon and Cuvier.
Discuss: Recap findings on evolutionary theories – which seems most plausible and why?
Activity: Natural selection role play activities.
Video clips on evolution and natural selection can be found on the BBC website at www.bbc.co.uk/learningzone/clips by searching for clips ‘5523’ and ‘5516’.
A video clip on evolution can be found at www.teachers.tv/videos/evolution
Be able to give two reasons why people were against Darwin’s ideas at that time.
Be able to use an evolutionary tree to describe relationships between organisms and
B1.8 Evolution
B1.8.1 Evolution
(continued) Activity: Interpret information about genetic engineering techniques.
Consider benefits, drawbacks and risks of using GM mosquitoes.
Information on genetic engineering can be found at www.UPD8.org.uk by searching for ‘mosquitoes vs malaria’.

GC
SE
Bio
log
y for teaching from S
eptember 2011 onw
ards ( version 1.0 )
1b
d
The theory of evolution was only gradually accepted.
Studying similarities and differences between organisms allows us to classify them as animals, plants or microorganisms.
Explain the terms ‘inherited’ and ‘acquired’ characteristics.
Describe the stages in natural selection.
Define the term ‘mutation’.
Explain why mutation may lead to more rapid change in a species.
Suggest reasons why Darwin’s theory was only gradually accepted.
Interpret evidence relating to evolutionary theory.
Classify organisms based on their similarities.
Peppered moth game; explain in terms of natural selection.
Produce flow diagram to explain evolution by natural selection.
Look at pictures of Darwin’s finches and match up with the Galapagos Island they lived on based on food available there.
Discuss: Brainstorm why Darwin did not publish his theory straight away and why it was only gradually accepted.
Look at cartoons of Darwin drawn after he published his work.
Task: Interpret evidence relating to evolutionary theory – fossils, pictures of horses, humans, tree of life etc.
Sort pictures of organisms into an evolutionary timeline.
How Science Works: Exhibition of organisms to classify into groups (this could be the first lesson on evolution).
Further online resources for teachers at www.echalk.co.uk
Cartoons of Darwin, picture of his book.
Fossils and pictures.
Past BLY1 exam questions.
Exhibition of organisms or pictures.
the time scales involved in evolution.
35 Unit 1
Unit 2G
CS
E B
iolo
gy for teaching from
Septem
ber 2011 onwards ( version 1.0 )
36
SpecRef
Summary of Specification Content
Learning Outcomes
What most candidates should be able to do
Possible Teaching and Learning Activities
Homework
Resources Examination Hints and TipsCandidates should:
SuggestedLessons
Unit 2 View
2
B2.1 Cells and simple cell transport
B2.1.1 Cells and cell structure
a
b
Most human and animal cells have a nucleus, cytoplasm, membrane, mitochondria and ribosomes.
Plant and algal cells also have a cell wall and often have chloroplasts and a permanent vacuole.
Label diagrams of animal and plant cells.
Use a microscope.
Prepare slides of plant and animal cells.
Match cell organelles to their functions.
Activity: Revise plant and animal cell structure from KS3 using diagrams, then extend to include mitochondria and ribosomes.
Label diagrams of plant and animal cells.
How Science Works: Prepare slides of onion epidermis, rhubarb epidermis, cheek cells, spirogyra, moss etc and observe under a microscope.
Video: Watch video clip on plant and animal structures.
Discuss: Discuss which structures
Cells: Microscopes, slides, coverslips, tiles, forceps, mounted needles, iodine solution, methylene blue, onion, rhubarb, spirogyra and moss.
Puzzles, quizzes and images can be found at www.cellsalive.com
A video clip on plant and animal structures can be found on the BBC website
Be able to label a sperm cell with cell membrane, cytoplasm and nucleus.
Be able to state two parts of a leaf cell which would not be found in a sperm cell.
This scheme of work suggests possible teaching and learning activities for each section of the specification. There are far more activities suggested than it would be possible to teach. It is intended that teachers should select activities appropriate to their candidates and the curriculum time available. The first two columns summarise the specification references, whilst the Learning Outcomes indicate what most candidates should be able to achieve after the work is completed. The Resources column indicates resources commonly available to schools, and other references that may be helpful. Higher Tier material is indicated by a bold HT only comment. The timings are only suggested*, as are the Possible Teaching and Learning Activities, which include references to experimental work and How Science Works opportunities. Resources are only given in brief and risk assessments should be carried out. To access classroom activities, practical ideas, progress checks / end of topic assessments and over 180 questions and mark schemes for Biology Unit 2, use Exampro Extra Online, our FREE resource for AQA teachers.
* The suggested timings relate to the learning outcomes rather than to the activities.
Biology 2
GC
SE
Bio
log
y for teaching from S
eptember 2011 onw
ards ( version 1.0 )
37
1
1
c
d
e
Bacterial cells have cytoplasm and a membrane surrounded by a cell wall; genes are not in a distinct nucleus.
Yeast cells have a nucleus, cytoplasm and a membrane surrounded by a cell wall.
Cells may be specialised to carry out a particular function.
Label diagrams of bacterial and yeast cells.
Identify diagrams of cells as being from an animal, plant, bacterium or yeast.
Observe different types of cells under a microscope.
Relate their structure to their function.
How Science Works: How are bacterial and yeast cells different from plant and animal cells? Observe under microscope. Culture of yeast cells to show budding.
Task: Label diagrams of bacterial and yeast cells.
Activity: Compare with diagrams of plant and animal cells – similarities and differences.
Display images of cells to classify as plant, animal, bacterial or yeast and compare sizes of cells and organelles.
How Science Works: Observe specialised cells under the microscope and EM images; link structure to function.
Diagrams of bacteria and yeast cells.
Cells: Microscopes, slides, coverslips, yeast culture, bacterial cultures and EM images.
Past BLY2 exam questions.
Further information on cells can be found at www.cellsalive.com A useful video clip on cell structure can be found on the BBC website at www.bbc.co.uk/learningzone/clips by searching for clip ‘107’.
Cells: Prepared slides of different plant and animal cells, microscopes, cavity slides, coverslips,
Be able to give two ways in which a root hair cell is different from an animal cell.
Be able to add labels to a yeast cell for cell membrane, cell wall, nucleus and vacuole.
Be able to identify cell adaptations and link them to their function.
Unit 2
could be seen and compare with EM images – find some images using your preferred search engine.
Task: Match organelles with their functions.
Homework: Competition to make a plant or animal cell model and create a display.
at www.bbc.co.uk/learningzone/clips by searching for clip ‘4188’.
Useful information on cell structure can be found at www.biology4kids.com

Unit 2G
CS
E B
iolo
gy for teaching from
Septem
ber 2011 onwards ( version 1.0 )
38
SpecRef
Summary of Specification Content
Learning Outcomes
What most candidates should be able to do
Possible Teaching and Learning Activities
Homework
Resources Examination Hints and TipsCandidates should:
SuggestedLessons
(continued) Explain how specialised cells are adapted for their function.
Video: Watch a video clip of egg and sperm cells.
How Science Works: Use bioviewers to observe specialised cells.
Task: Produce a poster of labelled specialised cells to explain how they are adapted for their function.
Video: Watch a video on cell structure and function.
germinating cress seeds or sprouting mung beans (root hair cells).
A useful video clip on cells and their functions can be found on the BBC website at www.bbc.co.uk/learningzone/clips by searching for ‘1832’.
Be able to state why sperm cells need so many mitochondria.
Be able to explain how a leaf cell is specialised to carry out photosynthesis.
1-2a
b
c
Dissolved substances can move into and out of cells by diffusion.
Definition of diffusion and factors affecting rate.
Oxygen passes through cell membranes by diffusion.
Define the term ‘diffusion’.
Explain that diffusion is faster if there is a bigger concentration difference.
Give examples of substances that diffuse into and out of cells.
Demo: Diffusion of ammonium hydroxide and hydrogen chloride in a glass tube; nitrogen dioxide in gas jars; potassium permanganate in beaker of water; potassium permanganate on agar.
Activity: Time how long it is before candidates can smell a perfume placed in a corner of the room.
Fresh beetroot placed in iced water and warm water – compare and explain the difference in the depth of colour of the water.
How Science Works: Investigate diffusion of different acids and alkalis
Demo: Concentrated NH4OH, concentrated HCl, gloves, mask, forceps, cotton wool, long glass tube with strips of damp litmus along length, two gas jars of NO2, two empty gas jars, beaker of water, potassium permanganate crystals, agar in test tube, strong perfume and beetroot.
Agar: Agar plates impregnated with UI
Be able to name the process by which oxygen passes into a lung cell.
Be able to state two factors which affect the rate of diffusion.
B2.1.2 Dissolved substances

GC
SE
Bio
log
y for teaching from S
eptember 2011 onw
ards ( version 1.0 )
39 Unit 2
through agar.
How Science Works: Investigate rate of diffusion of glucose through cellulose tubing.
Video: Watch a video or computer simulation of diffusion – see McGraw-Hill website.
Activity: Role play of diffusion in gases and liquids at different temperatures and concentrations.
solution, cork borers, solutions of acids and alkalis.
Glucose: Beakers, cellulose tubing, glucose solution, timers, test tubes, Benedict’s solution and water bath or glucose test strips.
Further information can be found on BBC GCSE Bitesize at www.bbc.co.uk/schools/gcsebitesize
HT only Search for ‘interactive biochemistry’ on the internet, then choose ‘Wiley’ to find the related animations.
Past BLY2 exam questions.
A useful video on diffusion can be found on the McGraw-Hill website at http://highered.mcgraw-hill.com/sites/0072495855/student_view0 by selecting ‘Chapter 2’ and the ‘How Diffusion Works’ animation.

Unit 2G
CS
E B
iolo
gy for teaching from
Septem
ber 2011 onwards ( version 1.0 )
40
SpecRef
Summary of Specification Content
Learning Outcomes
What most candidates should be able to do
Possible Teaching and Learning Activities
Homework
Resources Examination Hints and TipsCandidates should:
SuggestedLessons
B2.2 Tissues, organs and organ systems (could be taught before B2.1)
B2.2.1 Animal organs
1d Systems are groups of organs that perform a particular function; structure and function of the digestive system.
Define the term ‘organ system’.
Name the main systems in the human body and state their functions.
Label a diagram of the digestive system.
Describe the functions of the digestive system to digest and absorb food molecules.
Describe the functions of the organs in the system – salivary glands, stomach, small intestine, liver, pancreas and large intestine.
Activity: Revise KS3 – show diagrams of the main organ systems to identify and describe their functions.
Activity: Recap the functions of the digestive system.
Task: Label a diagram of the digestive system and colour areas where digestion, digestion and absorption of food, and absorption of water occur.
Add labels to the diagram to state functions of organs in the system.
Video: Watch a video about the digestive system.
Task: Make a life size model of the digestive system.
Activity: Role play – what happens to food as it moves along the digestive system (opportunity for investigations – see B2.5.2).
Torso, posters of organ systems.
Torso / model of digestive system.
The Digestive System builder can be found at http://science.waltermack.com/flashTeacherTools/biology/digestive SystemBuilder2a.swf
Useful information on the human body can be found at http://kidshealth.org/kid by selecting ‘How the body works’ in the left navigation bar.
You can download a digestive system to label from http://klbict.co.uk/interactive/science/digestion2.htm
Be able to label a diagram of the digestive system.
GC
SE
Bio
log
y for teaching from S
eptember 2011 onw
ards ( version 1.0 )
41 Unit 2
A useful video clip on digestion and absorption can be found on the BBC website at www.bbc.co.uk/learningzone/clips by searching for clip ‘4180’.
1c
b
a
Organs are made of tissues; tissues in stomach.
A tissue is a group of cells with similar structure and function; muscular, glandular and epithelial tissues.
Multicellular organisms develop systems for exchanging materials; during development cells differentiate to perform different functions.
Name the main organs in the human body and state their functions.
Name the tissues in the stomach and explain what they do.
Define the term ‘organ’.
Define the term ‘tissue’.
Explain why large organisms need different systems to survive.
Explain what cell differentiation is.
Describe organisation in large organisms.
Activity: Look at a model of the stomach showing different tissues.
Task: Label a diagram of the stomach with the names of the tissues and their functions. Match tissues with their functions.
Activity: Look at the different types of cells in the stomach and discuss how they were produced – link with lesson on specialised cells.
To summarise, produce a flow diagram showing organisation in large organisms and relate to size.
Torso and posters of organ systems.
Model of stomach.
Be able to appreciate the sizes of cells, tissues, organs and organ systems.
Unit 2G
CS
E B
iolo
gy for teaching from
Septem
ber 2011 onwards ( version 1.0 )
42
SpecRef
Summary of Specification Content
Learning Outcomes
What most candidates should be able to do
Possible Teaching and Learning Activities
Homework
Resources Examination Hints and TipsCandidates should:
SuggestedLessons
B2.2.2 Plant organs
1-2a
b
Plant organs include stems, roots and leaves.
Examples of plant tissues – epidermal, mesophyll, xylem and phloem.
Label the main organs of a plant and describe their functions.
Identify different tissues in a leaf and describe their functions.
Activity: Look at a flowering plant and identify the main organs.
Label a diagram of a plant with names and functions of organs.
How Science Works: Observe prepared slides or bioviewers of leaves, stems and roots, and identify different tissues; hypothesise what they are for.
Label a diagram of a cross section of a leaf.
Demo: Demonstrate transport of coloured dye in celery or a plant – could prepare slides and observe them (links with B2.3, B3.1.3 and B3.2.3).
Plant tissues: Microscopes, prepared slides and bioviewers.
Past BLY2 exam questions.
Be able to label the main tissues in a leaf.
B2.3 Photosynthesis
B2.3.1 Photosynthesis
3a
b
Photosynthesis equation
Light energy is absorbed by chlorophyll in chloroplasts and used to convert carbon dioxide and water into
Write the word equation for photosynthesis.
Carry out experiments to show that light, carbon dioxide and chlorophyll are needed to make glucose.
Discuss: Brainstorm what plants need to survive and how they are useful to other organisms in order to come up with the word equation for photosynthesis.
How Science Works: How is the leaf adapted for photosynthesis?
Lots of ideas and info can be found at www-saps.plantsci.cam.ac.uk/pubphoto.htm and www.s-cool.co.uk
Broad leaved plant and bioviewers.
Be able to describe leaf structure in terms of photosynthesis.
Be able to explain the results from

GC
SE
Bio
log
y for teaching from S
eptember 2011 onw
ards ( version 1.0 )
43 Unit 2
e
glucose; oxygen is a by-product.
Glucose may be converted into starch for storage.
Explain why plants should be destarched before photosynthesis experiments and describe how this is done.
Describe experiments to show that plants produce oxygen in the light.
Explain the steps involved in testing a leaf for starch.
Explain why glucose is converted to starch for storage.
How Science Works: Where are the stomata? Dip privet leaves into hot water and observe nail varnish imprints of leaves (links with B2.2.2 leaf structure, xylem and phloem, B3.1.3 exchange systems in plants and B3.2.3 transport in plants).
How Science Works: Set up experiments to show that light, carbon dioxide and chlorophyll are needed to make starch – follow up with testing a leaf for starch in later lesson.
Demo: Plants produce oxygen in the light.
Demo: Test a leaf for glucose.
How Science Works: Observe starch in an apple and potato.
Activity: Write the word equation for photosynthesis – produce cards for equation and put into correct order.
Stomata: Leaves from privet and spider plants, kettle, beakers, nail varnish, slides, coverslips and microscope.
Photosynthesis: Geraniums, plants with variegated leaves, lamps, black paper and paper clips, bell jars, saturated potassium hydroxide (KOH) solution or soda lime, ethanol, boiling tubes, beakers, glass rods, tiles, iodine solution, heating apparatus and goggles.
Oxygen: Elodea / Cabomba, glass funnel, large beaker, test tube and splints.
Glucose: Plant in light, Benedict’s solution, boiling tube and Bunsen burner.
Starch: Pieces of apple and potato, sharp knives, slides, coverslips, iodine solution and microscopes.
photosynthesis experiments.
Be able to complete a word equation for photosynthesis.
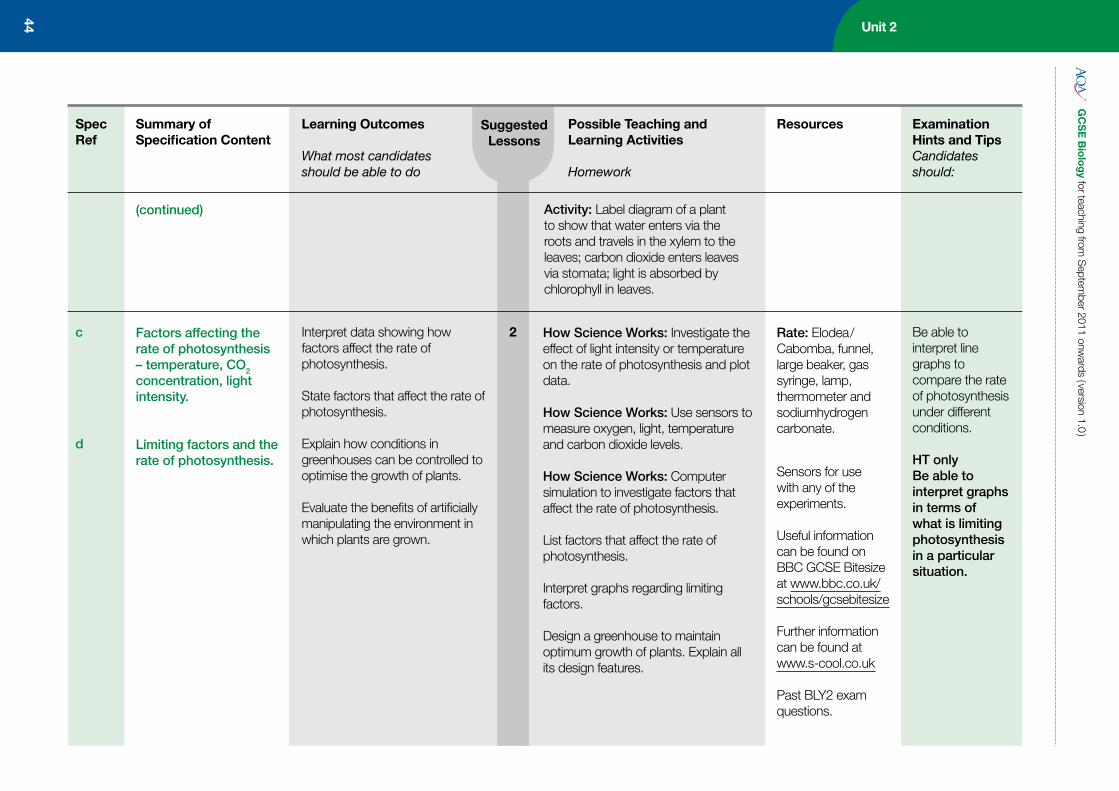
Unit 2G
CS
E B
iolo
gy for teaching from
Septem
ber 2011 onwards ( version 1.0 )
2c
d
(continued)
Factors affecting the rate of photosynthesis – temperature, CO2 concentration, light intensity.
Limiting factors and the rate of photosynthesis.
Interpret data showing how factors affect the rate of photosynthesis.
State factors that affect the rate of photosynthesis.
Explain how conditions in greenhouses can be controlled to optimise the growth of plants.
Evaluate the benefits of artificially manipulating the environment in which plants are grown.
Be able to interpret line graphs to compare the rate of photosynthesis under different conditions.
HT onlyBe able to interpret graphs in terms of what is limiting photosynthesis in a particular situation.
44
SpecRef
Summary of Specification Content
Learning Outcomes
What most candidates should be able to do
Possible Teaching and Learning Activities
Homework
Resources Examination Hints and TipsCandidates should:
SuggestedLessons
How Science Works: Investigate the effect of light intensity or temperature on the rate of photosynthesis and plot data.
How Science Works: Use sensors to measure oxygen, light, temperature and carbon dioxide levels.
How Science Works: Computer simulation to investigate factors that affect the rate of photosynthesis.
List factors that affect the rate of photosynthesis.
Interpret graphs regarding limiting factors.
Design a greenhouse to maintain optimum growth of plants. Explain all its design features.
Rate: Elodea / Cabomba, funnel, large beaker, gas syringe, lamp, thermometer and sodiumhydrogen carbonate.
Sensors for use with any of the experiments.
Useful information can be found on BBC GCSE Bitesize at www.bbc.co.uk/schools/gcsebitesize
Further information can be found at www.s-cool.co.uk
Past BLY2 exam questions.
Activity: Label diagram of a plant to show that water enters via the roots and travels in the xylem to the leaves; carbon dioxide enters leaves via stomata; light is absorbed by chlorophyll in leaves.
GC
SE
Bio
log
y for teaching from S
eptember 2011 onw
ards ( version 1.0 )
45 Unit 2
1-2e
f
g
Glucose can be stored as starch and used in respiration.
Glucose is also used to produce fats and oils for storage, cellulose to strengthen cell walls and proteins.
To produce proteins, plants also use nitrate ions that are absorbed from the soil.
List ways in which glucose is used by a plant.
Describe functions of fats, oils, cellulose, starch and proteins in a plant.
Explain how plants obtain nitrate ions and what they are needed for.
Interpret results of bicarbonate indicator experiment.
How Science Works: Investigate growth of tomatoes in greenhouse, lab and outside.
Discuss: Brainstorm uses of glucose and produce a mind map or poster.
Activity: Produce diagrams to illustrate the flow of carbon dioxide and oxygen in and out of a plant in bright light, dim light and darkness.
Task: Write the equations for photosynthesis and respiration – use cards previously made and rearrange to show respiration.
Demo: Demonstrate effect of acid and alkali on bicarbonate indicator solution; bubble exhaled air through bicarbonate indicator solution.
How Science Works: Effect of plants and invertebrates on bicarbonate indicator solution in light and dark.
How Science Works: Investigate the effect of mineral salts on plant growth.
Homework: Research hydroponics and produce a report or PowerPoint presentation.
Tomato plants, pots, compost, fertiliser, sensors and balance.
Exhibition of plant products – sugar, starchy food, protein rich food, plant oils, paper, cocoa, coffee, cotton, rubber, flour, nuts, drugs etc.
Video clips on photosynthesis and plant growth can be found on the BBC website at www.bbc.co.uk/learningzone/clips by searching for clips ‘212’ and ‘213’.
Indicator: Bicarbonate indicator solution, acid, alkali, straw, boiling tubes, bungs, black paper, Cabomba, small invertebrates, gauze and lamp.
Minerals: Tomato plants, pots, compost. Grow cultures in solutions with and without minerals, eg magnesium and nitrates.
Past BLY2 exam questions.

Unit 2G
CS
E B
iolo
gy for teaching from
Septem
ber 2011 onwards ( version 1.0 )
46
SpecRef
Summary of Specification Content
Learning Outcomes
What most candidates should be able to do
Possible Teaching and Learning Activities
Homework
Resources Examination Hints and TipsCandidates should:
SuggestedLessons
B2.4 Organisms and their environment
B2.4.1 Distribution of organisms
2-3a
b
Physical factors that may affect organisms – temperature, nutrients, light, water, oxygen and carbon dioxide.
Quantitative data can be obtained by sampling with quadrats and along a transect.
Suggest reasons for the distribution of organisms in a habitat.
Evaluate methods used to collect environmental data and consider the validity and reliability as evidence of environmental change.
Name and explain how different factors can affect the distribution of organisms in a habitat.
Measure abiotic factors.
Describe how to carry out random sampling of organisms using a quadrat.
Use a transect.
Calculate mean, median, mode and range.
Discuss: Brainstorm factors that may affect the distribution of organisms.
Activity: Briefly explain how these factors could affect the distribution of organisms.
Review how environmental data can be collected.
How Science Works: Use quadrats to investigate patterns of grass growth under trees and see if it is linked to abiotic factors.
How Science Works: Use quadrats to investigate the distribution of daisies and dandelions on the school field or lichens, moss or Pleurococcus on trees, walls and other surfaces and link to abiotic factors.
How Science Works: Use a transect to investigate the change in organisms growing across a path – effect of trampling or from a tree into open field – light / temperature / humidity.
Using a quadrat can be found at www.skoool.co.uk
Appropriately sized quadrats, clipboards and sensors.
Transect: String, identification charts.
Be able to process data and calculate the mean, median, mode and range for a set of data.
Know that sample size is important in terms of reliability and validity.

GC
SE
Bio
log
y for teaching from S
eptember 2011 onw
ards ( version 1.0 )
47
B2.5 Proteins – their functions and uses
B2.5.1 Proteins
1a
b
Proteins are long chains of amino acids folded to produce a specific shape that accommodates other molecules. Proteins act as structural components, hormones, antibodies and catalysts.
Catalysts increase the rate of chemical reactions. Biological catalysts are called enzymes; these are proteins.
Describe the structure of protein molecules.
List some protein molecules found inside living organisms.
Define the terms ‘catalyst’ and ‘enzyme’.
Video: Watch a computer simulation of protein structure.
Research: Research project to include the structure of proteins and names and functions of some proteins in the body. Produce a poster, PowerPoint presentation or mind map.
Past BLY2 exam questions.
Unit 2
How Science Works: Measure and use environmental data to calculate mean, median, mode and range.
Interpret various types of diagrams that illustrate the distribution of organisms in a habitat (links with B1.4.1, B1.4.2 and B3.4.1).
Environmental data: Sensors, data loggers, thermometers and calculators.
Past BLY1 exam questions.
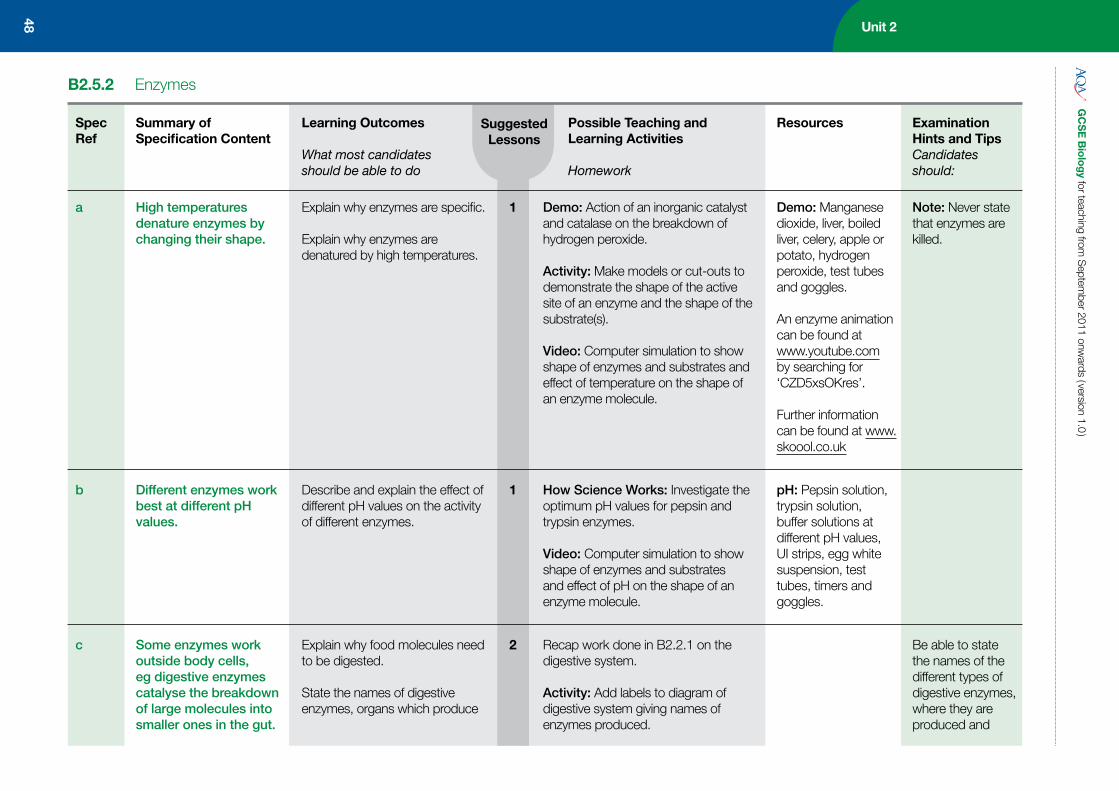
Unit 2G
CS
E B
iolo
gy for teaching from
Septem
ber 2011 onwards ( version 1.0 )
48
SpecRef
Summary of Specification Content
Learning Outcomes
What most candidates should be able to do
Possible Teaching and Learning Activities
Homework
Resources Examination Hints and TipsCandidates should:
SuggestedLessons
B2.5.2 Enzymes
1
1
2
a
b
c
High temperatures denature enzymes by changing their shape.
Different enzymes work best at different pH values.
Some enzymes work outside body cells, eg digestive enzymes catalyse the breakdown of large molecules into smaller ones in the gut.
Explain why enzymes are specific.
Explain why enzymes are denatured by high temperatures.
Describe and explain the effect of different pH values on the activity of different enzymes.
Explain why food molecules need to be digested.
State the names of digestive enzymes, organs which produce
Demo: Action of an inorganic catalyst and catalase on the breakdown of hydrogen peroxide.
Activity: Make models or cut-outs to demonstrate the shape of the active site of an enzyme and the shape of the substrate(s).
Video: Computer simulation to show shape of enzymes and substrates and effect of temperature on the shape of an enzyme molecule.
How Science Works: Investigate the optimum pH values for pepsin and trypsin enzymes.
Video: Computer simulation to show shape of enzymes and substrates and effect of pH on the shape of an enzyme molecule.
Recap work done in B2.2.1 on the digestive system.
Activity: Add labels to diagram of digestive system giving names of enzymes produced.
Demo: Manganese dioxide, liver, boiled liver, celery, apple or potato, hydrogen peroxide, test tubes and goggles.
An enzyme animation can be found at www.youtube.com by searching for ‘CZD5xsOKres’.
Further information can be found at www.skoool.co.uk
pH: Pepsin solution, trypsin solution, buffer solutions at different pH values, UI strips, egg white suspension, test tubes, timers and goggles.
Note: Never state that enzymes are killed.
Be able to state the names of the different types of digestive enzymes, where they are produced and
d
e
f
g
h
Amylase is produced in the salivary glands, pancreas and small intestine. It catalyses the breakdown of starch into sugars.
Protease enzymes are produced by the stomach, pancreas and small intestine. They catalyse the breakdown of proteins into amino acids.
Lipase enzymes are produced by the pancreas and small intestine. They catalyse the breakdown of lipids into fatty acids and glycerol.
The stomach produces hydrochloric acid to provide the right conditions for stomach enzymes to work effectively.
The liver produces bile, which is stored in the gall bladder. Bile neutralises the acid added to food in the stomach and provides alkaline conditions in the small intestine for the enzymes there to work effectively.
Plot a line graph and interpret results of effect of temperature on amylase activity.
Produce table giving names of enzymes, substrates and products.
How Science Works: Investigate the effect of temperature on amylase activity – measure time taken for starch to disappear. Different groups do different temperatures and share results. Could be done using a computer simulation instead. Plot results and find optimum temperature for amylase.
Recap results of trypsin-pepsin experiment – enzymes have an optimum pH.
Research: Research Alexis St Martin story.
Demo: Effect of bile salts on rate of digestion of milk.
Activity: Use computer simulations to model effect of temperature, pH and concentration on enzyme activity (links with B3.1.1).
Amylase: Saliva or amylase solution, starch solution, test tubes, water baths at different temperatures, glass rods, spotting tiles, iodine solution and timers.
Demo: Two tubes, milk, sodium carbonate solution, phelolphthalein solution, lipase solution, + / – washing up liquid and timer.
Further information can be found atwww.skoool.co.uk
the reactions they catalyse.
Be able to interpret graphs showing the effect of temperature and pH on enzyme activity.
Remember that liver produces bile which is stored in the gall bladder.
GC
SE
Bio
log
y for teaching from S
eptember 2011 onw
ards ( version 1.0 )
49 Unit 2
them, substrates they act on and products of digestion.
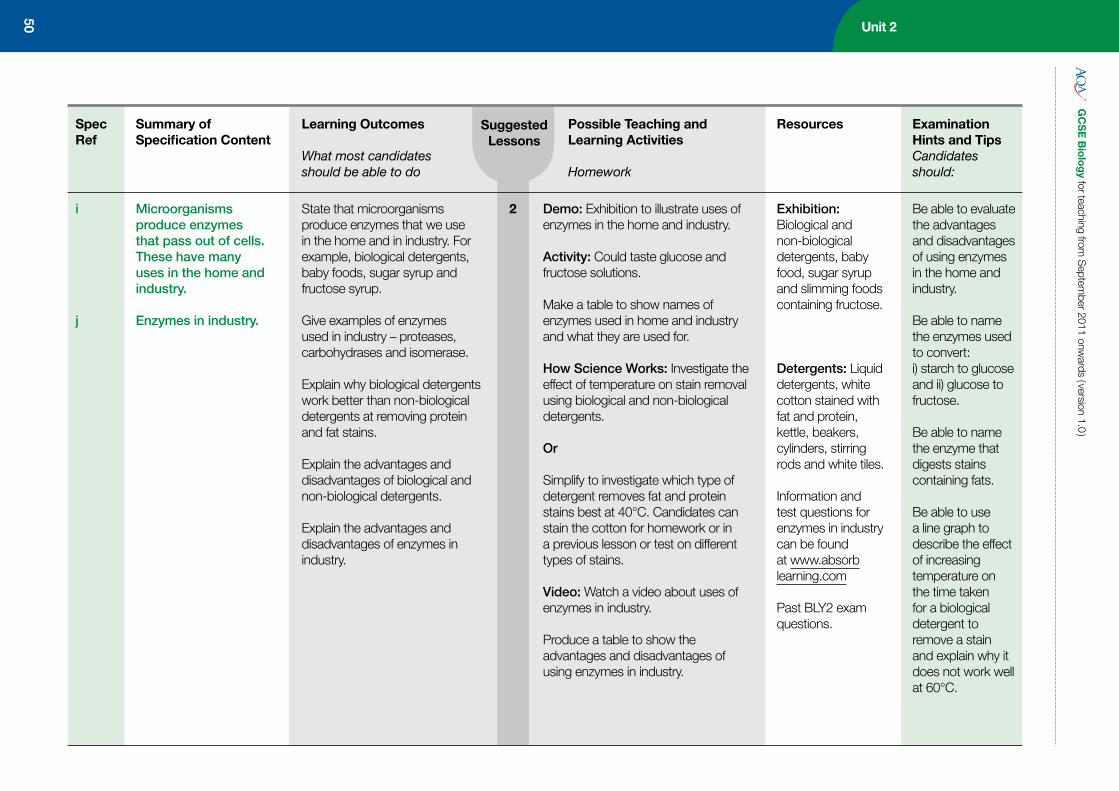
Unit 2G
CS
E B
iolo
gy for teaching from
Septem
ber 2011 onwards ( version 1.0 )
50
SpecRef
Summary of Specification Content
Learning Outcomes
What most candidates should be able to do
Possible Teaching and Learning Activities
Homework
Resources Examination Hints and TipsCandidates should:
SuggestedLessons
2i
j
Microorganisms produce enzymes that pass out of cells. These have many uses in the home and industry.
Enzymes in industry.
State that microorganisms produce enzymes that we use in the home and in industry. For example, biological detergents, baby foods, sugar syrup and fructose syrup.
Give examples of enzymes used in industry – proteases, carbohydrases and isomerase.
Explain why biological detergents work better than non-biological detergents at removing protein and fat stains.
Explain the advantages and disadvantages of biological and non-biological detergents.
Explain the advantages and disadvantages of enzymes in industry.
Demo: Exhibition to illustrate uses of enzymes in the home and industry.
Activity: Could taste glucose and fructose solutions.
Make a table to show names of enzymes used in home and industry and what they are used for.
How Science Works: Investigate the effect of temperature on stain removal using biological and non-biological detergents.
Or
Simplify to investigate which type of detergent removes fat and protein stains best at 40°C. Candidates can stain the cotton for homework or in a previous lesson or test on different types of stains.
Video: Watch a video about uses of enzymes in industry.
Produce a table to show the advantages and disadvantages of using enzymes in industry.
Exhibition: Biological and non-biological detergents, baby food, sugar syrup and slimming foods containing fructose.
Detergents: Liquid detergents, white cotton stained with fat and protein, kettle, beakers, cylinders, stirring rods and white tiles.
Information and test questions for enzymes in industry can be found at www.absorb learning.com
Past BLY2 exam questions.
Be able to evaluate the advantages and disadvantages of using enzymes in the home and industry.
Be able to name the enzymes used to convert:i) starch to glucose and ii) glucose to fructose.
Be able to name the enzyme that digests stains containing fats.
Be able to use a line graph to describe the effect of increasing temperature on the time taken for a biological detergent to remove a stain and explain why it does not work well at 60°C.
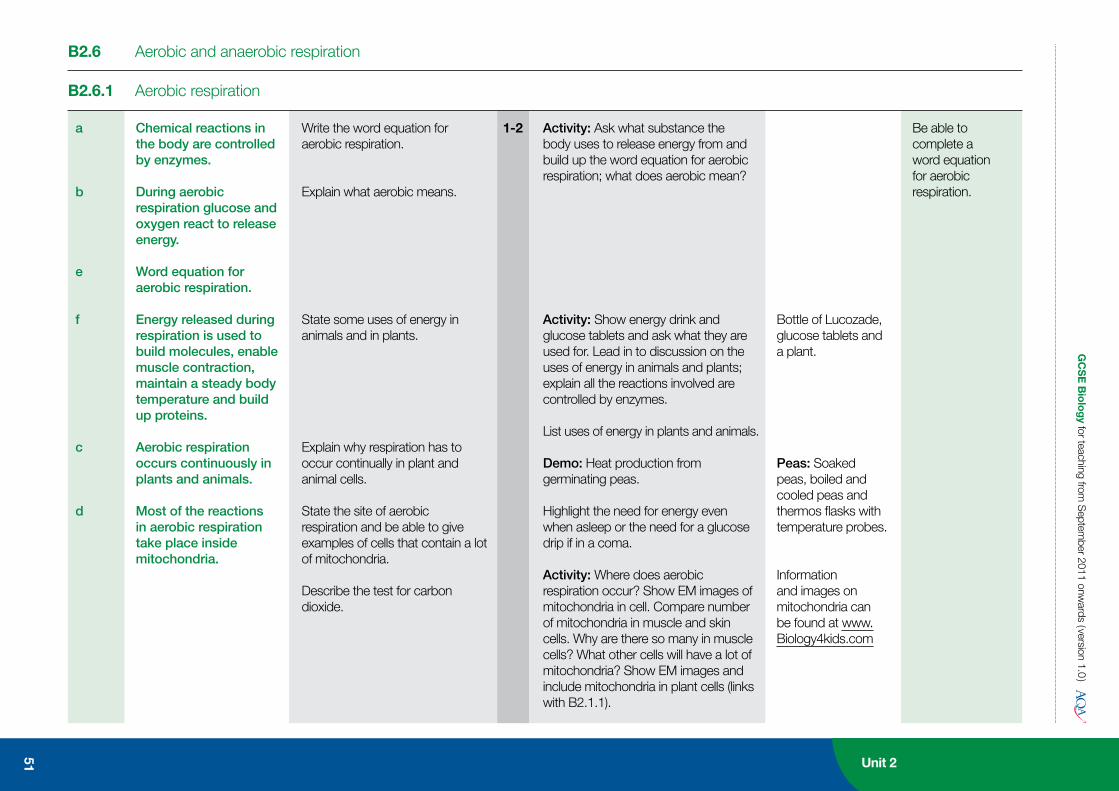
GC
SE
Bio
log
y for teaching from S
eptember 2011 onw
ards ( version 1.0 )
51
B2.6 Aerobic and anaerobic respiration
B2.6.1 Aerobic respiration
1-2a
b
e
f
c
d
Chemical reactions in the body are controlled by enzymes.
During aerobic respiration glucose and oxygen react to release energy.
Word equation for aerobic respiration.
Energy released during respiration is used to build molecules, enable muscle contraction, maintain a steady body temperature and build up proteins.
Aerobic respiration occurs continuously in plants and animals.
Most of the reactions in aerobic respiration take place inside mitochondria.
Write the word equation for aerobic respiration.
Explain what aerobic means.
State some uses of energy in animals and in plants.
Explain why respiration has to occur continually in plant and animal cells.
State the site of aerobic respiration and be able to give examples of cells that contain a lot of mitochondria.
Describe the test for carbon dioxide.
Activity: Ask what substance the body uses to release energy from and build up the word equation for aerobic respiration; what does aerobic mean?
Activity: Show energy drink and glucose tablets and ask what they are used for. Lead in to discussion on the uses of energy in animals and plants; explain all the reactions involved are controlled by enzymes.
List uses of energy in plants and animals.
Demo: Heat production from germinating peas.
Highlight the need for energy even when asleep or the need for a glucose drip if in a coma.
Activity: Where does aerobic respiration occur? Show EM images of mitochondria in cell. Compare number of mitochondria in muscle and skin cells. Why are there so many in muscle cells? What other cells will have a lot of mitochondria? Show EM images and include mitochondria in plant cells (links with B2.1.1).
Bottle of Lucozade, glucose tablets and a plant.
Peas: Soaked peas, boiled and cooled peas and thermos flasks with temperature probes.
Information and images on mitochondria can be found at www.Biology4kids.com
Be able to complete a word equation for aerobic respiration.
Unit 2

Unit 2G
CS
E B
iolo
gy for teaching from
Septem
ber 2011 onwards ( version 1.0 )
52
SpecRef
Summary of Specification Content
Learning Outcomes
What most candidates should be able to do
Possible Teaching and Learning Activities
Homework
Resources Examination Hints and TipsCandidates should:
SuggestedLessons
1
1-2
e
g
h
(continued)
Word equation for aerobic respiration.
During exercise the heart rate, breathing rate and depth of breathing increase.
These changes increase blood flow to muscles and so increase the supply of sugar and
State that all animals and plants produce carbon dioxide all the time as a by product of aerobic respiration.
Describe the test for carbon dioxide.
Design an investigation to find out the effect of exercise on heart and breathing rates.
Plot the results in a graph.
Explain why heart rate and breathing rate increase during exercise.
How Science Works: Investigate exhaled air.
Homework: Research composition of inhaled and exhaled air and display as pie charts or bar charts.
Activity: Interpret results from germinating pea demo.
Demo: Animal in a bell jar experiment to show it produces carbon dioxide.
Demo: Plant in a bell jar (no light) – results following lesson.
Discuss: Discuss the set up of the apparatus – soda lime, limewater in both containers (links with B2.3.1).
How Science Works: Investigate the effect of exercise on heart rate, breathing rate and depth of breathing.
Video: Effect of exercise on the body.
Video: Use of spirometer.
Exhaled air: Carbon dioxide in inhaled and exhaled air apparatus, limewater, mirrors, cobalt chloride paper and thermometers.
Demo: Two bell jars connected to two containers oflimewater that air is passing through via tubes, first container fitted with thistle funnel containing soda lime, pump to draw air through system, small animal, plant and black paper.
Timer, pulse sensor and spirometer if available.
Be able to interpret line graphs and spirometer tracings to compare rate of breathing before, during and after exercise.
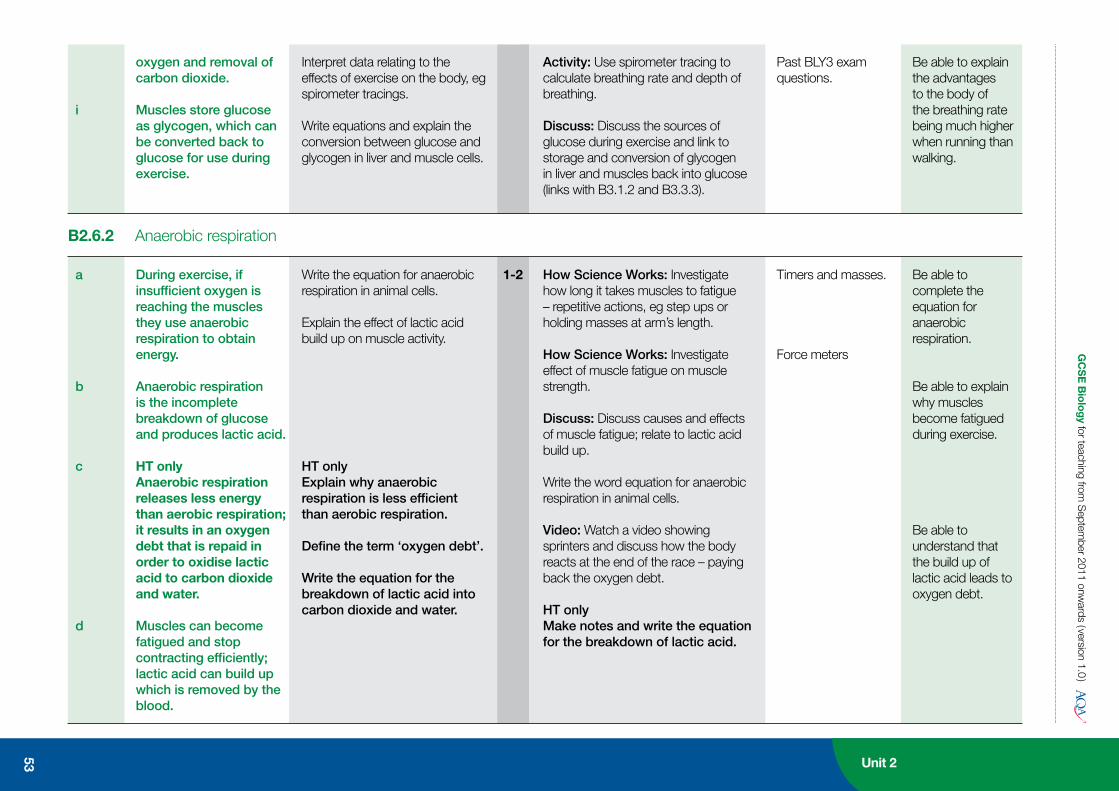
i
oxygen and removal of carbon dioxide.
Muscles store glucose as glycogen, which can be converted back to glucose for use during exercise.
Interpret data relating to the effects of exercise on the body, eg spirometer tracings.
Write equations and explain the conversion between glucose and glycogen in liver and muscle cells.
Activity: Use spirometer tracing to calculate breathing rate and depth of breathing.
Discuss: Discuss the sources of glucose during exercise and link to storage and conversion of glycogen in liver and muscles back into glucose (links with B3.1.2 and B3.3.3).
Past BLY3 exam questions.
Be able to explain the advantages to the body of the breathing rate being much higher when running than walking.
GC
SE
Bio
log
y for teaching from S
eptember 2011 onw
ards ( version 1.0 )
53
B2.6.2 Anaerobic respiration
1-2a
b
c
d
During exercise, if insufficient oxygen is reaching the muscles they use anaerobic respiration to obtain energy.
Anaerobic respiration is the incomplete breakdown of glucose and produces lactic acid.
HT onlyAnaerobic respiration releases less energy than aerobic respiration; it results in an oxygen debt that is repaid in order to oxidise lactic acid to carbon dioxide and water.
Muscles can become fatigued and stop contracting efficiently; lactic acid can build up which is removed by the blood.
Write the equation for anaerobic respiration in animal cells.
Explain the effect of lactic acid build up on muscle activity.
HT onlyExplain why anaerobic respiration is less efficient than aerobic respiration.
Define the term ‘oxygen debt’.
Write the equation for the breakdown of lactic acid into carbon dioxide and water.
How Science Works: Investigate how long it takes muscles to fatigue – repetitive actions, eg step ups or holding masses at arm’s length.
How Science Works: Investigate effect of muscle fatigue on muscle strength.
Discuss: Discuss causes and effects of muscle fatigue; relate to lactic acid build up.
Write the word equation for anaerobic respiration in animal cells.
Video: Watch a video showing sprinters and discuss how the body reacts at the end of the race – paying back the oxygen debt.
HT onlyMake notes and write the equation for the breakdown of lactic acid.
Timers and masses.
Force meters
Be able to complete the equation for anaerobic respiration.
Be able to explain why muscles become fatigued during exercise.
Be able to understand that the build up of lactic acid leads to oxygen debt.
Unit 2

Unit 2G
CS
E B
iolo
gy for teaching from
Septem
ber 2011 onwards ( version 1.0 )
54
SpecRef
Summary of Specification Content
Learning Outcomes
What most candidates should be able to do
Possible Teaching and Learning Activities
Homework
Resources Examination Hints and TipsCandidates should:
SuggestedLessons
B2.7 Cell division and inheritance
B2.7.1 Cell division
1a
b
c
d
n
Chromosomes are found in pairs in body cells; body cells divide by mitosis.
Chromosomes contain the genetic information.
During mitosis, copies of the genetic material are made, then the cell divides once to form two genetically identical body cells.
Mitosis occurs during growth or to produce replacement cells.
Cells of the offspring produced by asexual reproduction are produced by mitosis from the parental cells. They contain the same alleles as the parents.
Recognise from photos of karyotypes that chromosomes are found in pairs in body cells.
State that the genetic information is carried as genes on chromosomes.
State that body cells divide by mitosis.
Draw simple diagrams to describe mitosis.
State that offspring produced by asexual reproduction are produced by mitosis so contain all the same alleles as the parent cell.
Activity: Recap work covered in B1.7.1 – genes, chromosomes, nuclei, cells; look at photos of male and female karyotpes.
Discuss: Discuss how organisms grow and relate this to cell division.
Use bioviewers, root tip squashes or a video clip to show chromosomes and mitosis.
Activity: Produce notes with simple diagrams to explain mitosis in terms of copies of genetic information being made and cell division to produce two identical daughter cells.
Use Science and Plants for Schools (SAPS) and Scottish Schools Equipment Research Centre (SSERC) sites for images, activities etc.
Photos of karyotypes.
Bioviewers, microscopes, slides, coverslips and germinating pea seeds.
Useful information can be found at www.science3-18.org by searching ‘investigating cell division’.
A useful animation on mitosis can be found at www.cellsalive.com by searching ‘mitosis’.
A video clip on cell division by mitosis can be found on the BBC website at www.bbc.co.uk/learningzone/clips by searching for clip ‘4189’.
Be able to interpret genetic diagrams.
Be able to complete a simple diagram to show cell division producing two daughter cells.
Note: Knowledge and understanding of the stages in mitosis are not required.
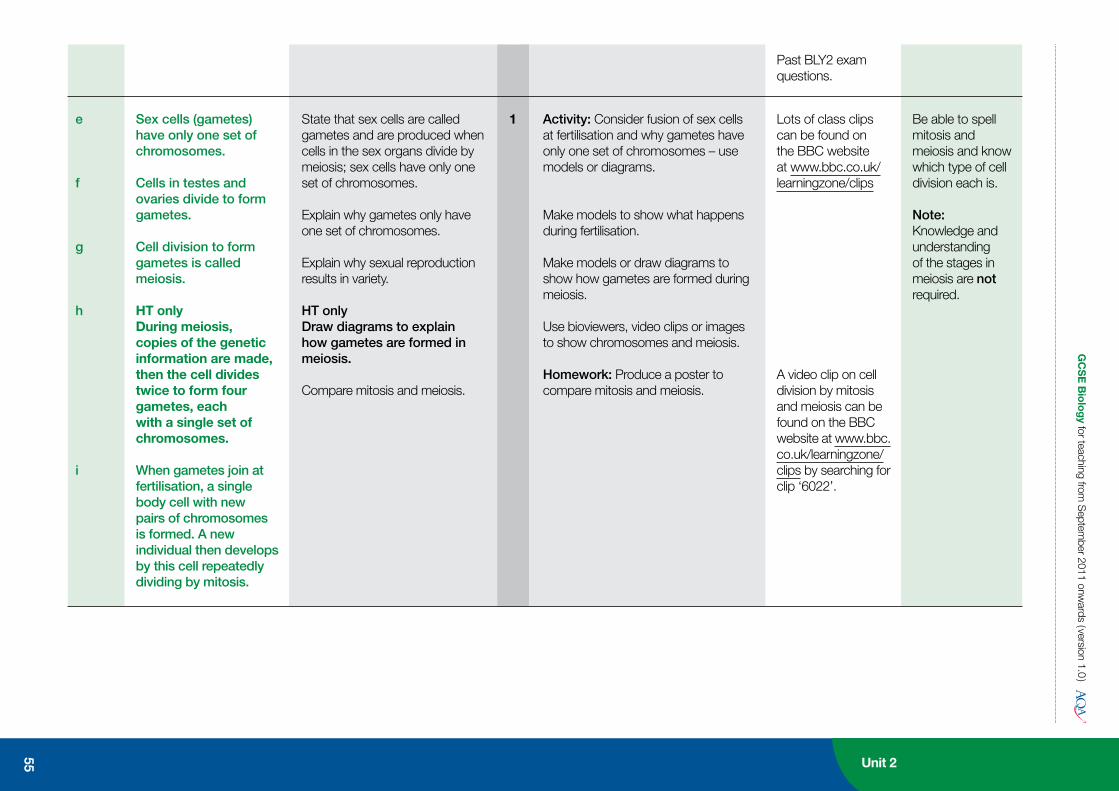
GC
SE
Bio
log
y for teaching from S
eptember 2011 onw
ards ( version 1.0 )
1e
f
g
h
i
Sex cells (gametes) have only one set of chromosomes.
Cells in testes and ovaries divide to form gametes.
Cell division to form gametes is called meiosis.
HT onlyDuring meiosis, copies of the genetic information are made,then the cell divides twice to form four gametes, each with a single set of chromosomes.
When gametes join at fertilisation, a single body cell with new pairs of chromosomes is formed. A new individual then develops by this cell repeatedly dividing by mitosis.
State that sex cells are called gametes and are produced when cells in the sex organs divide by meiosis; sex cells have only one set of chromosomes.
Explain why gametes only have one set of chromosomes.
Explain why sexual reproduction results in variety.
HT onlyDraw diagrams to explain how gametes are formed in meiosis.
Compare mitosis and meiosis.
Activity: Consider fusion of sex cells at fertilisation and why gametes have only one set of chromosomes – use models or diagrams.
Make models to show what happens during fertilisation.
Make models or draw diagrams to show how gametes are formed during meiosis.
Use bioviewers, video clips or images to show chromosomes and meiosis.
Homework: Produce a poster to compare mitosis and meiosis.
Past BLY2 exam questions.
Lots of class clips can be found on the BBC website at www.bbc.co.uk/learningzone/clips
A video clip on cell division by mitosis and meiosis can be found on the BBC website at www.bbc.co.uk/learningzone/clips by searching for clip ‘6022’.
Be able to spell mitosis and meiosis and know which type of cell division each is.
Note: Knowledge and understanding of the stages in meiosis are not required.
55 Unit 2
Unit 2G
CS
E B
iolo
gy for teaching from
Septem
ber 2011 onwards ( version 1.0 )
56
SpecRef
Summary of Specification Content
Learning Outcomes
What most candidates should be able to do
Possible Teaching and Learning Activities
Homework
Resources Examination Hints and TipsCandidates should:
SuggestedLessons
2j
k
l
m
Most animal cells differentiate at an early stage whereas many plant cells retain the ability to differentiate throughout life. In mature animals, cell division is mainly restricted to repair and replacement.
Stem cells from human embryos and adult bone marrow can be made to differentiate into many types of cells.
Human stem cells can develop into any type of human cell.
Treatment with stem cells may be able to help conditions such as paralysis.
Name the sources of stem cells in humans.
Describe cell differentiation in plants and animals.
Explain the function of stem cells.
Explain how stem cells could be used to help treat some medical conditions.
Make informed judgements about the social and ethical issues concerning the use of stem cells from embryos in medical research and treatments.
Video: Watch video clips showing cell differentiation in plants and animals.
Video: Watch the stem cell story at Euro Stem Cell site.
Activity: Provide candidates with a help sheet to direct them in researching stem cells – where they are produced in humans; their uses; how they could be used to treat some medical conditions; pros and cons of stem cell research.
Use research to produce a poster, carry out role play or a debate about stem cell research (links with B3.3).
Information on stem cells can be found at www.eurostemcell.org and http://stemcells.nih.gov
Video clips on embryo stem cells and stem cell research can be found on the BBC website at www.bbc.co.uk/learningzone/clips by searching for clips ‘6581’ and ‘6013’.
Useful information can be found at www.christopherreeve.org and www.ukscf.org
Be able to give one use of stem cells.
Be able to give one reason why some people might object to using stem cells from embryos.
Note: Stem cell techniques are not required.
B2.7.2 Genetic variation
1f Chromosomes are made up of large molecules of DNA which has a double helix structure.
Describe the structure of chromosomes and DNA.
Video: Watch a video about Watson and Crick – discovery of the structure of DNA.
Task: Make a model of DNA.
Further information on Watson and Crick can be found at www.bbc.co.uk by searching ‘historic
Note: The names of the four bases are not required.
GC
SE
Bio
log
y for teaching from S
eptember 2011 onw
ards ( version 1.0 )
57
1
g
h
a
b
A gene is a small section of DNA.
HT onlyEach gene codes for a particular combination of amino acids which makes a specific protein.
Sexual reproduction gives rise to variation because one of each pair of alleles comes from each parent.
In human body cells one of the 23 pairs of chromosomes carries the genes that determine sex; the sex chromosomes in females are XX and in males are XY.
State that a gene is a small section of DNA.
HT onlyState that each gene codes for a particular sequence of amino acids to make a specific protein.
Explain using a Punnett square and genetic diagram how sex is determined in humans.
Activity: Extract DNA from fruits such as kiwi fruit or strawberry.
Activity: Look at male and female karyotypes and identify the number of pairs of chromosomes and each pair of sex chromosomes.
Use a Punnett square and a genetic cross diagram to illustrate the inheritance of sex; work out the chance of producing a male or female.
Use a computer simulation or make a model to show the separation andmixing of chromosomes in gamete formation and fertilisation. Link tovariation caused by sexual reproduction (links with B1.7.1).
figures Watson and Crick’.
How to extract DNA from fruits can be found at www.funsci.com/fun3_en/dna/dna.htm
A video clip on DNA and the Human Genome Project can be found on the BBC website at www.bbc.co.uk/learningzone/clips by searching for clip ‘6015’. Useful information on the DNA timeline can be found at www.timelineindex.com by searching ‘DNA’.
Past BLY2 exam questions.
A video clip on dominant and recessive characteristics can be found on the BBC website at www.bbc.co.uk/learningzone/clips by searching for clip ‘4197’.
Be able to use a Punnett square to show the inheritance of sex.
Unit 2
Unit 2G
CS
E B
iolo
gy for teaching from
Septem
ber 2011 onwards ( version 1.0 )
58
SpecRef
Summary of Specification Content
Learning Outcomes
What most candidates should be able to do
Possible Teaching and Learning Activities
Homework
Resources Examination Hints and TipsCandidates should:
SuggestedLessons
2
1
c
d
e
i
Some characteristics are controlled by a single gene; each gene may have different forms called alleles.
A dominant allele controls the development of a characteristic when present on only one of the chromosomes.
A recessive allele controls the development of a characteristic only if the dominant allele is not present.
Each person, apart from identical twins, has unique DNA. This can be used to identify individuals using DNA fingerprinting.
Describe some of the experiments carried out by Mendel using pea plants.
Explain why Mendel proposed the idea of separately inherited factors and why the importance of this discovery was not recognised until after his death.
Predict and explain the outcome of crosses using genetic diagrams based on Mendel’s experiments and using unfamiliar information.
HT onlyDefine the terms ‘homozygous’, ‘heterozygous’, ‘phenotype’ and ‘genotype’.
Define the term ‘DNA fingerprinting’.
Identify individuals from their DNA fingerprints.
Video: Watch a video or computer simulation of Mendel’s experiments.
HT onlyActivity: Draw and label genetic diagrams to explain Mendel’s experiments.
Interpret genetic diagrams of Mendel’s experiments.
Use past exam questions to draw and interpret genetic diagrams.
Video: Watch a video clip using DNA fingerprinting to help solve a crime.
Activity: Use DNA fingerprints to find the person who committed the crime; match DNA fingerprints to people; identify the twins.
A video clip on dominant and recessive characteristics can be found on the BBC website at www.bbc.co.uk/learningzone/clips by searching for clip ‘4197’.
Variety of pea seed, plants and pods or diagrams of them.
Past BLY2 exam questions.
A video clip on DNA finger printing can be found at www.engineering.com by searching ‘DNA fingerprinting’.
Crime scene, DNA fingerprints and DNA profile from crime scene.
Be able to draw and interpret genetic diagrams.
Note: Knowledge and understanding of genetic fingerprint techniques is not needed.
GC
SE
Bio
log
y for teaching from S
eptember 2011 onw
ards ( version 1.0 )B2.7.3 Genetic disorders
1
1
a
b
c
d
Some disorders are inherited.
Polydactyly, having extra fingers or toes, is caused by a dominant allele.
Cystic fibrosis, a disorder of cell membranes, is caused by a recessive allele.
Embryos can be screened for the alleles that cause genetic disorders.
Explain what polydactyly is.
Draw / interpret genetic diagrams to show how polydactyly is inherited.
Explain what cystic fibrosis is and why it can be inherited from two healthy parents.
Draw / interpret genetic diagrams to show how cystic fibrosis is inherited.
Make informed judgements about the economic, social and ethical issues concerning embryo screening.
Show images or video clips to show polydactyly.
Video: Watch a video to explain what cystic fibrosis is, how it is inherited and to illustrate the severity of the disorder.
Activity: Produce notes and draw genetic diagrams to explain how polydactyly and cystic fibrosis are inherited.
Interpret genetic diagrams relating to these disorders.
Activity: Role play – choices for parents of a cystic fibrosis sufferer who would like another child. To involve experts explaining cystic fibrosis and the screening procedure; the child with the disorder; parents to discuss what they would do if the foetus had the disorder.
Or
Watch a video of the process and write a list of issues to be considered regarding embryo screening.
A video clip on gene therapy and cystic fibrosis can be found on the BBC website at www.bbc.co.uk/learningzone/clips by searching for clip ‘6014’.
Past BLY2 exam questions.
Be able to use a family tree to explain why only some offspring inherit cystic fibrosis from a parent sufferer.
Be able to suggest one reason why people support and one reason why people are against the screening of embryos for the cystic fibrosis allele.
59 Unit 2

Unit 2G
CS
E B
iolo
gy for teaching from
Septem
ber 2011 onwards ( version 1.0 )
60
SpecRef
Summary of Specification Content
Learning Outcomes
What most candidates should be able to do
Possible Teaching and Learning Activities
Homework
Resources Examination Hints and TipsCandidates should:
SuggestedLessons
B2.8 Speciation
B2.8.1 Old and new species
1-2
1
a
b
c
d
e
Evidence for early forms of life comes from fossils.
Fossils are the ‘remains’ of organisms from many years ago which are found in rocks. They can be formed in various ways.
Many early forms of life were soft-bodied so left few traces behind; these traces have been mainly destroyed by geological activity.
We can learn from fossils how much or how little organisms have changed as life developed on Earth.
Causes of extinction – changes to the environment over geological time, new predators,
State what a fossil is.
Describe ways in which fossils are formed – from hard parts that do not decay easily; when conditions for decay are absent; when parts are replaced by other materials as they decay; as preserved imprints.
Explain why fossils are useful to us today – to provide evidence of how life has developed; to help us understand evolutionary relationships.
Suggest reasons why scientists cannot be certain how life began on Earth.
Define the term ‘extinction’.
Explain how extinction may be caused.
Observe an exhibition of fossils or fossil pictures and guess how they were formed and what they are fossils of.
Research: Research different ways in which fossils are formed and produce a report with illustrations – complete for homework.
Video: Formation of fossils.
Make imprints of leaves, shells, bones etc.
Discuss: Brainstorm how life on earth might have begun and discuss why we cannot be certain how life began (links with B1.8.1).
UPD8 activity: Candidates look at fossil evidence to explain how living things once lived.
Exhibition of pictures of organisms that have become extinct.
Or
Past BLY1 exam questions.
Objects to make imprints of sand, plasticine or plaster of Paris.
A video clip on DNA and prehistoric animals can be found on the BBC website at www.bbc.co.uk/learningzone/clips by searching for clip ‘5890’.
Interesting information on a huge fossilized skull found in Argentina can be found at www.UPD8.org.uk by searching ‘Godzilla is real’.
Past BLY1 exam questions.
Understand that the fossil record is incomplete because many fossils have been destroyed by geological activity.
Be able to explain what is meant by extinct.

GC
SE
Bio
log
y for teaching from S
eptember 2011 onw
ards ( version 1.0 )
61 Unit 2
f
new diseases, new competitors, a catastrophic event, through the cyclical nature of speciation.
New species arise as a result of isolation (HT only – genetic variation, natural selection and speciation).
Give a list of extinct organisms and ask candidates to print off images; suggest reasons why they died out.
Produce a poster of pictures of extinct organisms; discuss the evidence we have that they looked like this.
Research: Research causes of extinction and write a report / PowerPoint presentation.
Recap what a species is and write a definition.
Candidates require knowledge and an understanding of isolation.
Discuss: Brainstorm organisms that are only found in Australia and ask why this is; support with projected images or video clips.
Activity: Produce a flow diagram or cut-out to illustrate how new species arise (links with B1.8.1).
Be able to give two reasons why some organisms are in danger of extinction. Be able to give one reason why it is important to prevent species from becoming extinct.
Understand that organisms become extinct because something changes and the species cannot adapt quickly enough to the new circumstances.
Understand that it takes millions of years for a new species to form.
Define the term ‘species’.
Explain how new species arise using the term ‘isolation’.
HT only Include, explain and use the terms ‘genetic variation’, ‘natural selection’ and ‘speciation’.
1

Unit 3G
CS
E B
iolo
gy for teaching from
Septem
ber 2011 onwards ( version 1.0 )
62
SpecRef
Summary of Specification Content
Learning Outcomes
What most candidates should be able to do
Possible Teaching and Learning Activities
Homework
Resources Examination Hints and TipsCandidates should:
SuggestedLessons
Unit 3 View
B3.1 Movement of molecules in and out of cells
B3.1.1 Dissolved substances
2a
b
c
Dissolved substances move by diffusion and active transport.
Water moves across boundaries by osmosis; from a dilute to a more concentrated solution through a partially permeable membrane.
Differences in concentrations inside and outside a cell cause water to move into or out of the cell by osmosis.
Define the term ‘diffusion’.
Define the term ‘osmosis’ and explain what a partially permeable membrane is.
Plot and interpret a graph of change in mass vs concentration of solution.
Make predictions about osmosis experiments.
Recap definition of diffusion and associated experiments covered in B2.1.2 – could show computer simulation.
Introduce movement of water molecules as a special type of diffusion through a partially permeable membrane.
Demo: Set up a simple osmometer at the start of the lesson and measure how far the liquid in the capillary tube rises during the lesson.
Demo: Fill cellulose tubing ‘sausages’ with concentrated sugar solution or water and place in beakers of concentrated sugar solution or water.
Demo: Cellulose tubing filled with concentrated sugar solution attached to capillary tube held in clamp in a beaker of water.
Demo: Four beakers (two of water and two of sugar solution); four cellulose sausages (two of water and two of sugar solution).
Be able to explain the difference between diffusion and osmosis.
Note: Use of the terms ‘turgor’ and ‘plasmolysis’ is not required.
This scheme of work suggests possible teaching and learning activities for each section of the specification. There are far more activities suggested than it would be possible to teach. It is intended that teachers should select activities appropriate to their candidates and the curriculum time available. The first two columns summarise the specification references, whilst the Learning Outcomes indicate what most candidates should be able to achieve after the work is completed. The Resources column indicates resources commonly available to schools, and other references that may be helpful. Higher Tier material is indicated by a bold HT only comment. The timings are only suggested*, as are the Possible Teaching and Learning Activities, which include references to experimental work and How Science Works opportunities. Resources are only given in brief and risk assessments should be carried out. To access classroom activities, practical ideas, progress checks / end of topic assessments and over 200 questions and mark schemes for Biology Unit 3, use Exampro Extra Online, our FREE resource for AQA teachers.
* The suggested timings relate to the learning outcomes rather than to the activities.
Biology 3

GC
SE
Bio
log
y for teaching from S
eptember 2011 onw
ards ( version 1.0 )
63 Unit 3
How Science Works: Investigate the effect of different concentrations of solution on potato cylinders – mass and size.
Or
Find the concentration of salt or sucrose inside potato cells.
Demo: Model to show osmosis or get candidates to make a model.
Video: Watch a computer simulation of osmosis or video on osmosis in living cells – see interactive concepts in biochemistry and cellular transport.
How Science Works: Investigate the effect of different concentrations of solution on beetroot or rhubarb cells.
Video: Watch a video clip of osmosis in blood cells.
Demo: Investigate the effect of different concentrations of solution on shelled eggs.
Interpret data about osmosis experiments.
Potato experiment: Potatoes, cork borers, knives, rulers, balance, test tubes and a range of different concentrations of salt or sucrose solutions.
Clear plastic box, plasticine for membrane and different sized balls for water and solute.
Refer to McGraw-Hill website at http://highered.mcgraw-hill.com/sites/0072495855/student_view0 – select ‘Chapter 2’ and ‘How Osmosis works’.
Living cells: Beetroot slices or rhubarb epidermis, slides, coverslips, pipettes, water, concentrate solution and blotting paper.
Useful information on osmosis in chicken eggs can be found at http://practicalbiology.org by searching for ‘Investigating osmosis in chickens’ eggs’.
Past BLY3 exam questions.

Unit 3
1
1
d
e
f
g
Most soft drinks contain water, sugar and ions.
Sports drinks contain sugar to replace that used in energy release, and water and ions to replace those lost in sweat.
If water and ions are not replaced, cells do not work as efficiently.
Active transport – substances are sometimes absorbed against a concentration gradient. This uses energy.
Evaluate the claims of manufacturers about sports drinks.
Compare sports drinks and display as a bar chart.
Explain why sports drinks contain sugar, water and ions.
Describe some effects on the body if water and ions are not replaced.
Define the term ‘active transport’.
Label diagrams to show where active transport occurs in humans and plants and what is transported.
Explain why active transport requires energy.
Relate active transport to oxygen supply and numbers of mitochondria in cells.
Activity: Compare the ingredients in sports drinks and other soft drinks. Draw a bar chart and draw conclusions. Look at claims made for the sports drinks and decide if they are valid.
Make notes to explain why sports drinks contain sugar, salts and water.
Use past exam questions on sports drinks (links with B1.2.2).
Recap diffusion and osmosis.
Introduce active transport as absorption against the concentration gradient – why might this be useful?
Research: Research where active transport occurs in plants and humans and label these on diagrams with notes.
Discuss: Discuss in terms of energy used and show images of kidney and root hair cells with mitochondria. Why must soil and hydroponics solutions be kept aerated?
Show computer simulation of active transport.
Sports drinks and soft drinks with labels.
Past BLY1 exam questions.
Useful information can be found on BBC GCSE Bitesize at www.bbc.co.uk/schools/gcsebitesize/science by searching for ‘active transport’.
For interactive animations, search for ‘interactive biochemistry’ in your chosen search engine, then choose the Wiley website.
Be able to explain why a long distance runner should choose an isotonic drink rather than cola.
Remember active transport requires energy. Osmosis and diffusion do not require energy from the organism.
GC
SE
Bio
log
y for teaching from S
eptember 2011 onw
ards ( version 1.0 )
64
SpecRef
Summary of Specification Content
Learning Outcomes
What most candidates should be able to do
Possible Teaching and Learning Activities
Homework
Resources Examination Hints and TipsCandidates should:
SuggestedLessons

1-2j
i
h
k
l
The size and complexity of an organism increases the difficulty in exchanging materials.
Exchange surfaces in organisms are adapted to maximise effectiveness.
Many organ systems are specialised to exchange materials, eg by having a large surface area, being thin, having an efficient blood supply and being well ventilated.
In humans, surface area is increased by alveoli in the lungs and villi in the small intestine.
Villi have a large surface area and a good blood supply to absorb the products of digestion by diffusion and active transport.
Explain why the size and complexity of an organism increases the difficulty in exchanging materials.
Describe and explain the features of a good exchange surface.
Label a diagram of an alveolus and list how it is adapted for gas exchange.
Explain why foods have to be digested.
Explain why some food molecules are absorbed by diffusion and others by active transport.
Label a diagram of a villus and list how it is adapted for absorption of food molecules.
Activity: Look at image of unicellular organism, eg Amoeba and discuss how it obtains food and oxygen and removes wastes; why do larger organisms need specialised systems?
Show image of root hair cell and ask how it is adapted to absorb lots of water (could be covered with B3.1.3).
Observe prepared slides showing alveoli.
Label a diagram of an alveolus showing exchange of gases and list how it is adapted for its function (probably best covered with B3.1.2).
Recap digestion of foods – names of molecules; why food has to be digested; where digestion happens.
Discuss: Discuss where absorption of food occurs and show images of villi.
Observe slides of villi.
Activity: Label a diagram of a villus and list adaptations of the small intestine and a villus for absorption of food.
Activity: Make a model of the lining of the small intestine, use pipe cleaners highly folded to show increase in exchange surface area (could be covered with B2.2.1).
Useful information on the unicellular organism, Amoeba, can be found at www.biology-resources.com by searching for ‘biological drawing amoeba feeding’.
Bioviewers or microscopes, cavity slides and amoeba.
Microscopes, prepared slides of alveoli and villi.
Past BLY3 exam questions.
Be able to describe two factors of the villi which help the small intestine to function.
GC
SE
Bio
log
y for teaching from S
eptember 2011 onw
ards ( version 1.0 )
65 Unit 3

Unit 3
1
1
a
b
c
The breathing system – lungs, thorax, ribcage, diaphragm and abdomen.
The breathing system takes air into the body so oxygen and carbon dioxide can be exchanged between the air and the bloodstream.
Mechanism of ventilation of the lungs.
Label a diagram of the breathing system.
State the function of the breathing system.
Explain the changes that occur to bring about ventilation of the lungs in terms of relaxation and contraction of muscles, movement of the ribcage and diaphragm, changes in volume and pressure in the thorax.
Calculate mean, median, mode and range of lung volumes.
Interpret spirometer traces.
Activity: Identify the main organs of the breathing system and discuss its function.
Lung dissection
Task: Label a diagram showing the position of the lungs, ribcage, rib muscles, diaphragm, abdomen, thorax, trachea, bronchi, bronchioles and alveoli (could cover B3.1.1 h, i and k here).
Video: Watch video clip showing structure of the breathing system.
Think about the changes that occur when you breathe in and out. Try to explain what is moving.
Demo: Model lungs – relate the model to the structure of the breathing system. Evaluate how good a model it is.
Computer simulation to show the changes that occur during breathing in and out.
Torso or model of the breathing system.
Dissection: Lungs with heart and trachea, board, tube, foot pump, large plastic bag and knife.
A video clip on anatomy and physiology of the lungs can be found on the BBC website at www.bbc.co.uk/learningzone/clips by searching for clip ‘5373’.
Model lungs – balloons in bell jar with moveable rubber sheet.
See human lungs article at http://science.nationalgeographic.
Be able to identify the main parts of the breathing system on a diagram. For example add labels to a diagram for alveolus, diaphragm, rib and trachea.
Note: Consider all members of the class before carrying out the lung dissection.
Remember that breathing is a result of pressure changes in the thorax.
GC
SE
Bio
log
y for teaching from S
eptember 2011 onw
ards ( version 1.0 )
66
SpecRef
Summary of Specification Content
Learning Outcomes
What most candidates should be able to do
Possible Teaching and Learning Activities
Homework
Resources Examination Hints and TipsCandidates should:
SuggestedLessons
B3.1.2 Gaseous exchange
1Evaluate the development and use of artificial aids for breathing, including the use of artificial ventilators.
Task: Write down what happens to the diaphragm, ribcage and thorax during breathing in and breathing out. Describe the associated changes in volume and pressure. Complete a table of differences.
How Science Works: Investigate the variation of each candidate’s lung volume.
Interpret spirometer traces from practical measurement from past exam papers (see B2.6.1).
Discuss: Brainstorm situations that would require the use of artificial aids to breathing.
Discuss: Discuss what machines have been used to aid breathing – show pictures or actual aids and work out how they work.
Produce a poster or PowerPoint presentation on the development of artificial aids for breathing.
com/science/health-and-human-body/human-body/lungs-article.html or search ‘lungs article National Geographic’ in your search engine.
Lung volume: 5 litre plastic bottle marked every 0.5 ltrs, tube, large trough with water, mouth pieces or Dettol solution or spirometer.
Past BLY3 exam questions.
GC
SE
Bio
log
y for teaching from S
eptember 2011 onw
ards ( version 1.0 )
67 Unit 3
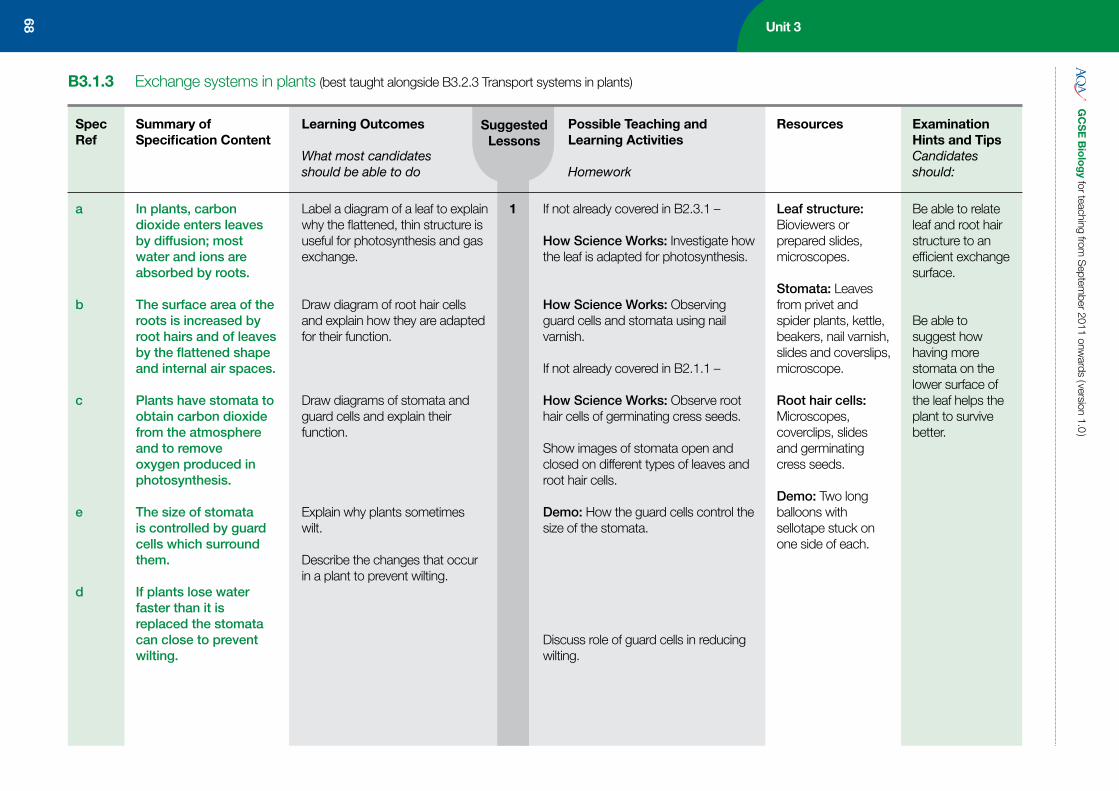
Unit 3G
CS
E B
iolo
gy for teaching from
Septem
ber 2011 onwards ( version 1.0 )
68
SpecRef
Summary of Specification Content
Learning Outcomes
What most candidates should be able to do
Possible Teaching and Learning Activities
Homework
Resources Examination Hints and TipsCandidates should:
SuggestedLessons
B3.1.3 Exchange systems in plants (best taught alongside B3.2.3 Transport systems in plants)
1a
b
c
e
d
In plants, carbon dioxide enters leaves by diffusion; most water and ions are absorbed by roots.
The surface area of the roots is increased by root hairs and of leaves by the flattened shape and internal air spaces.
Plants have stomata to obtain carbon dioxide from the atmosphere and to remove oxygen produced in photosynthesis.
The size of stomata is controlled by guard cells which surround them.
If plants lose water faster than it is replaced the stomata can close to prevent wilting.
Label a diagram of a leaf to explain why the flattened, thin structure is useful for photosynthesis and gas exchange.
Draw diagram of root hair cells and explain how they are adapted for their function.
Draw diagrams of stomata and guard cells and explain their function.
Explain why plants sometimes wilt.
Describe the changes that occur in a plant to prevent wilting.
If not already covered in B2.3.1 –
How Science Works: Investigate how the leaf is adapted for photosynthesis.
How Science Works: Observing guard cells and stomata using nail varnish.
If not already covered in B2.1.1 –
How Science Works: Observe root hair cells of germinating cress seeds.
Show images of stomata open and closed on different types of leaves and root hair cells.
Demo: How the guard cells control the size of the stomata.
Discuss role of guard cells in reducing wilting.
Leaf structure: Bioviewers or prepared slides, microscopes.
Stomata: Leaves from privet and spider plants, kettle, beakers, nail varnish, slides and coverslips, microscope.
Root hair cells: Microscopes, coverclips, slides and germinating cress seeds.
Demo: Two long balloons with sellotape stuck on one side of each.
Be able to relate leaf and root hair structure to an efficient exchange surface.
Be able to suggest how having more stomata on the lower surface of the leaf helps the plant to survive better.
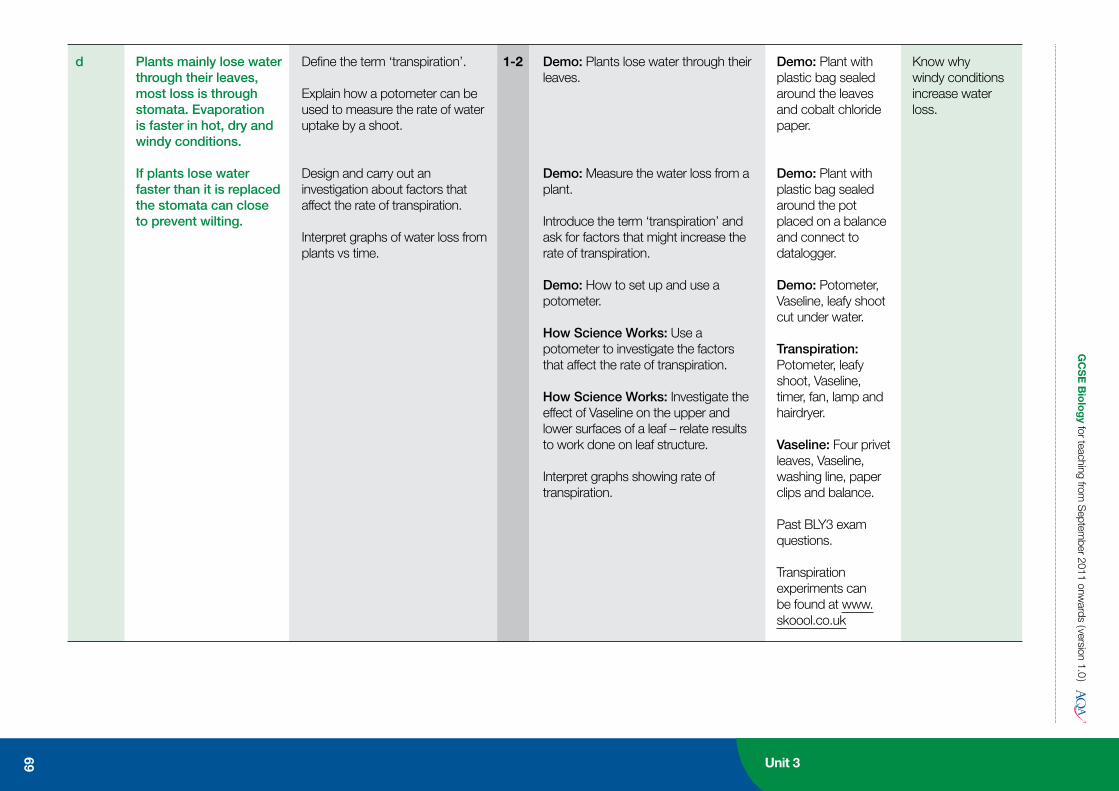
GC
SE
Bio
log
y for teaching from S
eptember 2011 onw
ards ( version 1.0 )
69
1-2d Plants mainly lose water through their leaves, most loss is through stomata. Evaporation is faster in hot, dry and windy conditions.
If plants lose water faster than it is replaced the stomata can close to prevent wilting.
Define the term ‘transpiration’.
Explain how a potometer can be used to measure the rate of water uptake by a shoot.
Design and carry out an investigation about factors that affect the rate of transpiration.
Interpret graphs of water loss from plants vs time.
Demo: Plants lose water through their leaves.
Demo: Measure the water loss from a plant.
Introduce the term ‘transpiration’ and ask for factors that might increase the rate of transpiration.
Demo: How to set up and use a potometer.
How Science Works: Use a potometer to investigate the factors that affect the rate of transpiration.
How Science Works: Investigate the effect of Vaseline on the upper and lower surfaces of a leaf – relate results to work done on leaf structure.
Interpret graphs showing rate of transpiration.
Demo: Plant with plastic bag sealed around the leaves and cobalt chloride paper.
Demo: Plant with plastic bag sealed around the pot placed on a balance and connect to datalogger.
Demo: Potometer, Vaseline, leafy shoot cut under water.
Transpiration: Potometer, leafy shoot, Vaseline, timer, fan, lamp and hairdryer.
Vaseline: Four privet leaves, Vaseline, washing line, paper clips and balance.
Past BLY3 exam questions.
Transpiration experiments can be found at www.skoool.co.uk
Know why windy conditions increase water loss.
Unit 3
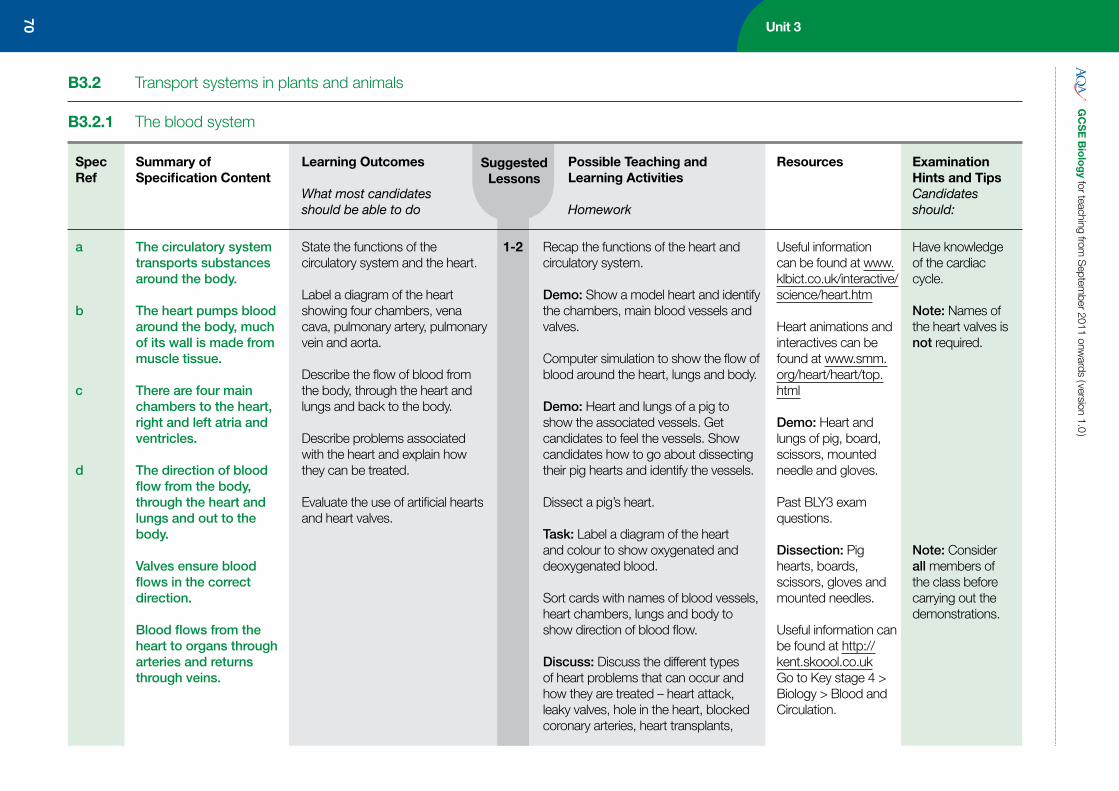
Unit 3G
CS
E B
iolo
gy for teaching from
Septem
ber 2011 onwards ( version 1.0 )
B3.2 Transport systems in plants and animals
B3.2.1 The blood system
SuggestedLessons
SpecRef
Summary of Specification Content
Learning Outcomes
What most candidates should be able to do
Possible Teaching and Learning Activities
Homework
Resources Examination Hints and TipsCandidates should:
1-2a
b
c
d
The circulatory system transports substances around the body.
The heart pumps blood around the body, much of its wall is made from muscle tissue.
There are four main chambers to the heart, right and left atria and ventricles.
The direction of blood flow from the body, through the heart and lungs and out to the body.
Valves ensure blood flows in the correct direction.
Blood flows from the heart to organs through arteries and returns through veins.
State the functions of the circulatory system and the heart.
Label a diagram of the heart showing four chambers, vena cava, pulmonary artery, pulmonary vein and aorta.
Describe the flow of blood from the body, through the heart and lungs and back to the body.
Describe problems associated with the heart and explain how they can be treated.
Evaluate the use of artificial hearts and heart valves.
Recap the functions of the heart and circulatory system.
Demo: Show a model heart and identify the chambers, main blood vessels and valves.
Computer simulation to show the flow of blood around the heart, lungs and body.
Demo: Heart and lungs of a pig to show the associated vessels. Get candidates to feel the vessels. Show candidates how to go about dissecting their pig hearts and identify the vessels.
Dissect a pig’s heart.
Task: Label a diagram of the heart and colour to show oxygenated and deoxygenated blood.
Sort cards with names of blood vessels, heart chambers, lungs and body to show direction of blood flow.
Discuss: Discuss the different types of heart problems that can occur and how they are treated – heart attack, leaky valves, hole in the heart, blocked coronary arteries, heart transplants,
Useful information can be found at www.klbict.co.uk/interactive/science/heart.htm
Heart animations and interactives can be found at www.smm.org/heart/heart/top.html
Demo: Heart and lungs of pig, board, scissors, mounted needle and gloves.
Past BLY3 exam questions.
Dissection: Pig hearts, boards, scissors, gloves and mounted needles.
Useful information can be found at http://kent.skoool.co.uk Go to Key stage 4 > Biology > Blood and Circulation.
Have knowledge of the cardiac cycle.
Note: Names of the heart valves is not required.
Note: Consider all members of the class before carrying out the demonstrations.
70
GC
SE
Bio
log
y for teaching from S
eptember 2011 onw
ards ( version 1.0 )
71
1-2e
f
g
There are two separate circulation systems – to the lungs and to the other organs of the body.
Structure of arteries and veins.
Use of stents to keep arteries open.
Structure and function of capillaries.
Draw and label diagrams of arteries, veins and capillaries.
Compare the structure and function of arteries, veins and capillaries.
Measure someone’s pulse rate and blood pressure and describe factors that affect them.
Describe what a stent is and what it is used for.
Evaluate the use of stents.
artificial hearts and replacement valves. Illustrate with pictures. Produce a report or PowerPoint presentation – to complete for homework.
Find out about the first heart transplant.
Video: Watch a computer simulation or video clip showing the three types of blood vessels and comparing their functions.
Task: Draw and label diagrams of the three types of vessels.
Produce a table to compare the structure of the vessels and relate to their function.
How Science Works: Look at prepared slides showing the three types of blood vessels to compare their structure.
Demo: Valves in veins prevent backflow of blood using someone with prominent veins.
How Science Works: Measure pulse rate and blood pressure – lying down, sitting and standing.
Video: Watch a video clip showing the use of a stent.
Task: Write a short report to explain what stents are, why they are used and explain how they save lives.
Homework: Research the work of Galen and William Harvey and produce a report.
Video clips on the heart can be found on the BBC website at www.bbc.co.uk/learningzone/clips by searching for clips ‘5367’ and ‘2270’.
Useful information on blood vessels and the vascular system can be found at www.ivy-rose.co.uk by searching ‘Blood Vessels – Vascular System’.
Blood vessels: Bioviewers or microscopes, prepared slides.
Pulse rate: Timers or pulse rate sensor, blood pressure monitor.
Be able to recognise veins and arteries from diagrams of blood vessels.
Unit 3
1a
b
c
d
e
Blood is a tissue consisting of plasma, white blood cells, red blood cells and platelets.
Plasma transports carbon dioxide to the lungs, soluble products of digestion from the small intestine and urea from the liver to the kidneys.
Function and structure of red blood cells; oxygen attaches to haemoglobin.
Function and structure of white blood cells.
Function and structure of platelets.
Describe the constituents of blood.
Draw diagrams of red blood cells, white blood cells and platelets.
Explain the structure and function of red blood cells, white blood cells and platelets.
State some substances transported in the blood plasma.
Explain why the reversible reaction between oxygen and haemoglobin is important.
Explain what artificial blood is.
Describe differences between real and artificial blood.
Evaluate data on the production and use of artificial blood products.
How Science Works: Observe blood smears.
Video: Watch a video about the composition of blood and the structure and function of its constituents.
Task: Draw and label diagrams of red blood cells, white blood cells and platelets.
Write notes to explain the composition of blood and describe the functions of plasma, red blood cells, white blood cells and platelets.
Write a word equation for the reaction of oxygen with haemoglobin.
Activity: Make plasticine models of red blood cells and use them to illustrate what happens when they pass through capillaries.
Discuss / Research: The need for blood and who can /can’t give blood; why is artificial blood useful?
Video: See the National Blood Service site and video clip on ‘YouTube’ about Hemopure showing good animation of flow of red blood cells through capillaries.
Blood smears: Microscopes, prepared slides or bioviewers.
Useful information can be found at http://kent.skoool.co.uk Go to Key stage 4 > Biology > Blood and Circulation.
Useful information can be found at www.blood.co.uk
A magazine style video report about the use of artificial blood can be found on
Be able to name the blood part which carries most oxygen.
Unit 3G
CS
E B
iolo
gy for teaching from
Septem
ber 2011 onwards ( version 1.0 )
72
SpecRef
Summary of Specification Content
Learning Outcomes
What most candidates should be able to do
Possible Teaching and Learning Activities
Homework
Resources Examination Hints and TipsCandidates should:
SuggestedLessons
B3.2.2 The blood
1
GC
SE
Bio
log
y for teaching from S
eptember 2011 onw
ards ( version 1.0 )
73
Research: Research products other than whole blood used in transfusions and produce a report evaluating them. List the differences between real and artificial blood and give the advantages and disadvantages of each.
www.youtube.com by searching ‘Medicine on the Bleeding Edge’.
Information on artificial blood can be found at www.pharmainfo.net by searching for ‘artificial blood’.
Unit 3
1a Flowering plants have separate transport systems:
■ xylem transports water and mineral ions from roots to stem and leaves
■ movement of water from roots to leaves is the transpiration stream
■ phloem carries dissolved sugars from leaves to the rest of the plant.
Explain the function of xylem and phloem.
Describe what the transpiration stream is.
Label diagrams showing the position of xylem and phloem in roots, stem and leaves.
Measure the flow rate in xylem.
Interpret results of ringing experiments and radioactive isotopes.
Demo 1: Flow of water in xylem using celery stalks with leaves and cut sections to observe position of xylem vessels.
Demo 2: Position of veins in leaves.
How Science Works: Calculate the flow rate through a celery stalk.
How Science Works: Observe prepared slides showing xylem and phloem in roots, stem and leaves.
Task: Label diagrams showing the position of xylem and phloem in roots, stem and leaves.
Video: Watch a computer simulation or video clip showing ringing experiments, use of radioisotopes and aphid experiment to show transport of sugars in phloem. Ask candidates to interpret the results.
Observe tree rings and work out the age of a tree trunk (also see B3.1.3 for transpiration investigations).
Demo 1: Celery stalk with leaves, beaker of dyed water, microscopes, slides, coverslips, scalpels and tiles.
Demo 2: Leaves, bright light.
Flow rate: Celery stalks with leaves, dyed water, beaker, ruler and timer.
Slides: Microscopes, prepared slides or bioviewers.
See lesson on plant transport at www.skoool.co.uk
Past BLY3 exam questions.
Be able to name the process by which water vapour is lost from a leaf.
B3.2.3 Transport systems in plants
Unit 3
1
1
a
b
Waste products that have to be removed from the body include:
■ carbon dioxide which is produced by respiration and removed via the lungs when we breathe out
■ urea, produced in the liver by breaking down amino acids and removed by the kidneys in urine which is stored in the bladder.
If the water or ion content of the body is wrong, too much water may move into or out of cells; water and ions enter the body when we eat and drink.
Define the term ‘homeostasis’.
Give examples of waste products that have to be removed and explain where they are excreted from the body.
Explain why waste products have to be excreted from the body.
Label a diagram of the excretory system and state the functions of the kidneys and bladder.
Produce a flow diagram to explain how urine is made.
Demo: Acid and alkali, pipettes, tubes of hydrogen carbonate indicator solution and straw.
Model of human body torso.
Dissection: Kidneys, boards, scalpels and gloves.
Remember that urea is produced by the liver and excreted by the kidneys.
Be able to name the organ which stores urine.
Be able to name two substances which will pass through the filter
Recap inputs and outputs of the body covered in B1.2.2.
Introduce the term ‘homeostasis’ and produce a list of conditions that have to be controlled in the body.
Discuss: Discuss how urea and carbon dioxide are produced in the body and why they must be excreted from the body.
Demo: Demonstrate effect of acid, alkali and exhaled air on hydrogen carbonate indicator.
Activity: Use an outline of the body with lungs, liver, kidney and skin labelled. Cut out labels to stick on showing substances produced / excreted by these organs.
Activity: Locate the positions of the liver, kidneys and bladder in the human body after seeing them in a torso. Discuss the need to excrete urea.
Video: Watch a video clip or computer simulation to show how urine is produced by the kidney.
GC
SE
Bio
log
y for teaching from S
eptember 2011 onw
ards ( version 1.0 )
74
SpecRef
Summary of Specification Content
Learning Outcomes
What most candidates should be able to do
Possible Teaching and Learning Activities
Homework
Resources Examination Hints and TipsCandidates should:
SuggestedLessons
B3.3 Homeostasis
B3.3.1 Removal of waste and water control
GC
SE
Bio
log
y for teaching from S
eptember 2011 onw
ards ( version 1.0 )
75 Unit 3
1-2
1
c
d
e
f
g
h
A healthy kidney produces urine by filtering the blood, reabsorbing all the sugar and dissolved ions needed by the body and as much water as the body needs. Urea, excess ions and water are excreted in urine.
Kidney failure can be treated by a using a dialysis machine or having a healthy kidney transplant.
Treatment by dialysis restores substances in the blood to normal levels and has to be carried out at regular intervals.
How a dialysis machine works.
Kidneys transplants and precautions to avoid rejection.
The recipients antibodies may attack antigens on the donor organ.
Interpret data relating to the composition of blood, kidney fluid and urine.
Explain how a kidney machine works in terms of the partially permeable membrane and composition of the dialysis fluid.
Explain why dialysis fluid contains sugar and ions at the same concentration as normal blood, but no urea.
State the advantages and disadvantages of kidney transplants.
Describe what antigens and antibodies are and explain how they interact.
Dissect a pig’s kidney.
Activity: Use cards to sequence how urine is made and produce a flow diagram.
Interpret data about concentration of water, ions, glucose etc in blood, kidneys and urine (link active transport of sugar and ions to B3.1.1).
Video: Watch a video clip showing dialysis treatment.
Discuss: Discuss the advantages and disadvantages of dialysis treatment.
How Science Works: Investigate how a dialysis machine works.
Label a diagram of a kidney dialysis machine and add notes to explain the constituents of the fluid and how the machine restores the concentration of dissolved substances in the blood to normal.
Video: Watch a video clip explaining the process of kidney transplants.
Discuss: Discuss the advantages and disadvantages of kidney transplants.
Watch a computer simulation showing antibodies attacking antigens on a transplanted kidney.
Past BLY3 exam questions.
Dialysis: Cellulose tubing, pipettes, fake urine, boiling tubes, test tubes, Benedict’s solution or glucose test sticks, biuret reagent or albustix, nitric acid and silver nitrate solution, dialysis fluid, water and goggles.
A video clip on human kidney transplants can be found on the BBC website at www.bbc.co.uk/learningzone/clips by searching for clip ‘4186’.
from blood plasma into the filtrate.
Be able to explain why protein is not found in the urine of a healthy person.
Be able to give two advantages of a kidney transplant rather than dialysis treatment.
Be able to give one disadvantage of having a kidney transplant.

Unit 3G
CS
E B
iolo
gy for teaching from
Septem
ber 2011 onwards ( version 1.0 )
76
SpecRef
Summary of Specification Content
Learning Outcomes
What most candidates should be able to do
Possible Teaching and Learning Activities
Homework
Resources Examination Hints and TipsCandidates should:
SuggestedLessons
1
i To prevent rejection the donor kidney has a similar ‘tissue-type’ and immunosuppressant drugs are given.
Explain why a donor kidney may be rejected and describe the precautions taken to prevent rejection.
State that there is a shortage of kidneys for transplant.
Produce arguments for or against compulsory organ donation.
Describe the economic, ethical and medical considerations regarding treatment of kidney failure.
Activity: Draw labelled diagrams to explain tissue rejection.
Research: Research the process of kidney transplants including tissue typing and use of immunosuppressant drugs.
Produce a leaflet to give to patients awaiting a kidney transplant to explain the process.
Discuss: Debate current discussions about organ donation – opt in or opt out cards. Show a donor card.
Homework: Design a poster to encourage people to carry organ donor cards.
Discuss: Moral dilemma – research cost of dialysis and transplants. Discuss considerations in terms of cost as to how kidney patients should be treated – lifetime dialysis, transplant, shortage of kidneys, buying kidneys from healthy people and prioritising lists for surgery. Produce arguments for and against the options or carry out a debate.
Note: Knowledge of ABO blood grouping and compatibility is not required.
GC
SE
Bio
log
y for teaching from S
eptember 2011 onw
ards ( version 1.0 )
77 Unit 3
Use observations and tests to identify samples of urine from different people.
1 After teaching B3.3.3 carry out an experiment to identify urine samples from a diabetic, someone with kidney disease, normal urine, healthy person who had drunk one and a half litres of water half an hour earlier and urine from healthy person produced on a hot day.
Urine: Artificial urine samples made with tea – sugar added, protein added, normal colour, dilute, concentrated, biuret reagent or albustix, Benedict’s solution or glucose test sticks, test tubes, water bath and goggles.
1b
c
a
Body temperature is monitored and controlled by the thermoregulatory centre in the brain. It has receptors sensitive to the temperature of the blood.
Temperature receptors in the skin send impulses to the thermoregulatory centre.
Sweating cools the body; water balance in hot weather.
State that normal body temperature is around 37°C.
Describe different methods to measure body temperature.
Calculate a mean and state the range of body temperatures for the class.
Compare the changes that occur when body temperature is too high or too low.
State that body temperature is monitored and controlled by the thermoregulatory centre in the brain, using information about blood and skin temperature.
Explain why we drink more fluid during hot weather.
How Science Works: Investigate the range of normal body temperature in the class and calculate the mean.
How Science Works: Monitor skin temperature in different conditions using surface temperature sensors.
Discuss: Brainstorm changes that occur when body temperature is too high and too low and write notes in the form of a table or a flow chart.
Discuss: Discuss how the body detects and controls core body temperature.
Video: Watch a video clip or computer animation showing changes that occur when body temperature is too high or too low and make notes.
Show a model of the structure of the skin.
Body temperature: Clinical thermometers, forehead thermometers.
Skin temperature sensors and dataloggers.
Past BLY2 exam questions.
Be able to use data from tables to calculate the volume of urine lost by the body / the proportion of water gained by the body from food eaten.
Note: The name of the hypothalamus is not required.
B3.3.2 Temperature control

Unit 3G
CS
E B
iolo
gy for teaching from
Septem
ber 2011 onwards ( version 1.0 )
78
SpecRef
Summary of Specification Content
Learning Outcomes
What most candidates should be able to do
Possible Teaching and Learning Activities
Homework
Resources Examination Hints and TipsCandidates should:
SuggestedLessons
1d
e
(continued)
Changes in terms of blood flow to the skin and sweating if core body temperature is too high.
Changes in terms of blood flow to the skin and shivering if core body temperature is too low.
Explain why the skin looks red when you are hot and pale when you are cold.
HT onlyExplain how sweating cools the body as it evaporates.
Explain the changes in blood vessels supplying skin capillaries when the body is too hot or too cold.
Explain how shivering helps to warm the body by releasing more energy from respiration.
Plot cooling curves.
Discuss: Discuss the effects of sweating on urine formation and why we drink more fluids in hot weather (links with B1.2.2 and B3.3.1).
HT onlyTask: Draw diagrams to explain the changes in blood vessels supplying skin capillaries when the body temperature is too high or too low. Demo: Demonstrate the effect of cooling by ethanol on the skin. Discuss the effect of evaporation – relate to kinetic theory.
How Science Works: Investigate the effect of sweating on the rate of cooling using tubes of hot water wrapped in wet and dry paper towels. Plot cooling curves and make conclusions.
HT onlyRecap respiration and energy release to explain the effect of shivering (links with B2.6.1).
Sweating: Boiling tubes, paper towels, elastic bands, thermometers or temperature sensors, pipettes and timers.
Be able to apply ideas in new contexts. For example, the kangaroo rat does not sweat. Explain why this could be dangerous for the animal.
Note: Never say that blood capillaries near the surface of the skin dilate.

GC
SE
Bio
log
y for teaching from S
eptember 2011 onw
ards ( version 1.0 )
79 Unit 3
1-2a
b
c
d
Blood glucose concentration is monitored and controlled by the pancreas by producing insulin, which allows glucose from the blood to enter cells.
HT onlyGlucagon is also produced by the pancreas to convert stored glycogen back into glucose when blood glucose levels fall.
In Type 1 diabetes glucose levels may rise too high because the pancreas does not produce enough insulin.
Type 1 diabetes can be controlled by diet, exercise and injecting insulin.
State that insulin is produced by the pancreas and explain its effect on blood glucose levels.
HT onlyState that glucagon is also produced by the pancreas and explain its effect on blood glucose levels.
Explain the cause, effects, treatment and problems associated with the disease.
Interpret glucose tolerance test.
Evaluate modern methods of treating diabetes.
Ask if anyone knows someone who has diabetes and if anyone knows what it is.
Demo: Demonstrate how doctors used to diagnose diabetes by tasting fake urine, then test with Benedict’s solution and glucose test strips. Which gives the most accurate results?
Show the position of the pancreas in the body.
If possible get someone who has Type 1 diabetes to explain the initial symptoms, how they were diagnosed, what they have to do to control the disease – blood testing, injections, diet, exercise, demonstrate blood testing and show the vials of insulin and pens used today.
Question and answer session.
Ask if anyone can explain why one of the first symptoms is extreme thirst (links with B3.1.1).
Video: Watch a video about Type 1 diabetes.
Research: Research and produce a report to explain the cause, effects, treatment and problems associated with the disease.
Interpret data on glucose tolerance tests in healthy people and diabetics.
Research: Research the work of Banting and Best.
Demo: Weak tea samples with and without glucose, glucose test strips, Benedict’s solution and water bath.
Model of torso.
Blood testing meters and test strips.
Video clips on blood sugar levels and diabetes can be found on the BBC website at www.bbc.co.uk/learningzone/clips by searching for clips ‘7314’ and ‘5371’.
Further information on diabetes can be found at www.diabetes.org.uk
Be able to give one way other than using insulin of treating diabetes.
Be able to state which organ controls blood glucose concentration.
Be able to describe how insulin reduces the concentration of glucose in the blood.
B3.3.3 Sugar control

Unit 3
1-2a
c
b
Rapid growth in the human population means more waste, which could lead to more pollution.
Humans reduce the amount of land available for other plants and animals by building, quarrying, farming and dumping waste.
Waste may pollute water with sewage, fertilisers or toxic chemicals.
List the problems associated with an increasing human population.
Interpret graphs showing human population growth.
Describe how water can be polluted with sewage, fertiliser or toxic chemicals.
Analyse and interpret data about water pollution.
Show how fast the world human population is increasing using the counter on the Worldometers website.
Interpret graphs showing human population growth and extrapolate.
Discuss: Brainstorm the effects of an increasing population and write a list.
Discuss: Discuss what water may become polluted with. Show images of sewage, industries, eutrophication and effects on water life.
Demo: Set up an experiment to investigate the effect of fertiliser on growth of duckweed and oxygen levels to be monitored and results explained later.
Interpret data about water pollutants.
Current world population can be found on the Worldometers website at www.worldometers.info/population
Websites or past exam questions.
Demo: Beakers containing different concentrations of fertiliser, duckweed plants, oxygen sensors and dataloggers.
Past BLY1 exam questions.
Note: Details of eutrophication are not required.
GC
SE
Bio
log
y for teaching from S
eptember 2011 onw
ards ( version 1.0 )
80
SpecRef
Summary of Specification Content
Learning Outcomes
What most candidates should be able to do
Possible Teaching and Learning Activities
Homework
Resources Examination Hints and TipsCandidates should:
SuggestedLessons
Past BLY2 exam questions.
Research: Research how treatment of diabetes has developed including use of human insulin produced by bacteria, current research into pancreas cell transplants and stem cell research (links with B1.7.2).
(continued)
B3.4 Humans and their environment
B3.4.1 Waste from human activity
b
b
Waste may pollute air with smoke and gases such as sulfur dioxide, which contributes to acid rain.
Waste may pollute land with toxic chemical such as pesticides and herbicides, which may be washed from the land into waterways.
Give examples of air pollutants and where they come from.
Describe the effects of smoke on buildings, humans and plant photosynthesis.
Explain how carbon dioxide contributes to global warming.
Describe how acid rain is formed.
Describe the effects of acid rain on living organisms.
Carry out an experiment to investigate the effect of sulfur dioxide on seed germination.
Analyse and interpret data about air pollution.
Make conclusions about the effect of fertiliser on plant growth and oxygen levels.
Describe what herbicides and pesticides are used for.
Describe the uses of DichloroDiphenylTrichloroethane (DDT) and why it was banned.
Discuss: Discuss what air may be polluted with and where the pollutants come from.
Show images illustrating the effects of acid rain on buildings, trees, lakes and images of smog.
Discuss: Discuss the Clean Air Act of 1956, 1963 and 1993.
How Science Works: Investigate the effect of sulfur dioxide on the germination of cress seeds.
Measure the pH of rain water samples.
Activity: Produce poster(s) or diagrams to describe the causes and effects of sulfur dioxide, carbon dioxide and smoke pollution to complete for homework.
Interpret data about air pollution (links with B3.4.3).
Look at the results from the demo to investigate the effect of fertiliser on growth of duckweed and oxygen levels and make conclusions.
Activity: Show images of how land is used or damaged by man and the effects of pollution – make a list.
Discuss: Discuss the sources and effects of toxic chemicals; what pesticides and herbicides are used for.How might these affect life in rivers and streams?
Sulfur dioxide: Petri dishes, cotton wool, water, small pots of sodium metabisulfite solution, cress seeds, plastic bags with ties and goggles.
Past BLY1 exam questions.
Examples of toxic chemicals with hazard symbols and some pesticides and herbicides.
1-2
1
GC
SE
Bio
log
y for teaching from S
eptember 2011 onw
ards ( version 1.0 )
81 Unit 3
Unit 3
Video: Watch a video of DDT uses.
Research: Research the use of DDT and why it was banned – produce a report or presentation.
Discuss: Discuss the recent increase in bed bugs and discuss the advantages and disadvantages of using pesticides to kill them.
(continued)
Large scale deforestation has increased the release of carbon dioxide and reduced the rate at which carbon dioxide is removed from the atmosphere and ‘locked up’ in wood.
Deforestation leads to reduction in biodiversity.
Deforestation has occurred so biofuel crops can be grown and more land can be
Video clips on rainforest destruction and changing ecosystems can be found on the BBC website at www.bbc.co.uk/learningzone/clips by searching for clips ‘3096’ and ‘3234’.
Past BLY1 exam questions.
Define the term ‘deforestation’.
Explain why vast tropical areas have been cleared of trees.
Explain how deforestation increases the amount of carbon dioxide in the atmosphere and leads to a reduction in biodiversity.
Explain how deforestation could lead to an increase in methane in the atmosphere.
Show images or video clips of deforestation taking place – clearing, burning, rotting and destruction of habitats.
Discuss: Discuss what effects this has on the environment – carbon dioxide, methane and reduction in biodiversity.
Discuss: Discuss why areas of tropical rain forest are being cleared with images or video clips – timber, land for biofuel crops, cattle and rice – and how this can lead to global warming.
Activity: Show a block of peat and peat compost. Ask what it is and what it is used for. Why is destruction of peat bogs harmful to the environment?
Be able to explain why peat free composts are of increasing importance.
Be able to give two reasons why deforestation increases the amount of carbon dioxide in the atmosphere.
a
b
c
1-2
GC
SE
Bio
log
y for teaching from S
eptember 2011 onw
ards ( version 1.0 )
82
SpecRef
Summary of Specification Content
Learning Outcomes
What most candidates should be able to do
Possible Teaching and Learning Activities
Homework
Resources Examination Hints and TipsCandidates should:
B3.4.2 Deforestation and the destruction of areas of peat
SuggestedLessons
GC
SE
Bio
log
y for teaching from S
eptember 2011 onw
ards ( version 1.0 )
83 Unit 3
d
used to rear cattle and grow crops for food. Cattle and rice fields release methane.
The destruction of peat bogs releases carbon dioxide into the atmosphere.
Explain what peat is and why we should not destroy areas of peat.
Activity: Produce a worksheet to help candidates research and prepare a PowerPoint presentation, with images, explaining all the main points listed above. Candidates could work in groups to divide up the areas of research and give a joint presentation. Complete for homework.
How Science Works: Investigate the growth of plants in ‘peat-free’ and peat based composts (links with B3.4.3).
Composts: ‘Peat free’ compost, peat based compost, plant pots and seedlings.
1a Levels of carbon dioxide and methane in the atmosphere are increasing and contribute to ‘global warming’.
An increase of only a few degrees Celsius may cause changes in the Earth’s climate, a rise in sea level, a reduction in biodiversity, changes in migration patterns and result in changes in the distribution of species.
Explain the terms ‘greenhouse effect’ and ‘global warming’.
Explain with the aid of a diagram how levels of carbon dioxide and methane contribute to global warming.
List the possible effects of global warming.
Video: Watch a video about the causes and effects of global warming.
If not already done in B3.4.1, produce a poster to explain the greenhouse effect including sources of carbon dioxide and methane.
List the possible effects of global warming.
Demo: Show a computer simulation of the greenhouse effect.
Measure the temperature inside and outside a greenhouse over 24 hours.
A useful PowerPoint presentation can be found at www.schoolscience.co.uk by searching ‘powerpoint presentations’ and selecting ‘Practical Action Climate Change Powerpoint Presentations’.
Video: ‘The truth about climate change’ with David Attenborough.
Video: ‘An Inconvenient Truth’ with Al Gore.
Be able to give some effects of global warming.
Be able to explain the greenhouse effect using the words or phrases “absorb” and “re-radiate heat”.
Be able to explain the link between carbon dioxide emissions and the greenhouse effect.
Be able to give one possible outcome of the greenhouse effect on the environment.
B3.4.3 Biofuels
Unit 3G
CS
E B
iolo
gy for teaching from
Septem
ber 2011 onwards ( version 1.0 )
8484
SpecRef
Summary of Specification Content
Learning Outcomes
What most candidates should be able to do
Possible Teaching and Learning Activities
Homework
Resources Examination Hints and TipsCandidates should:
SuggestedLessons
1b
(continued)
Carbon dioxide can be sequestered in oceans, lakes and ponds and this is important in removing carbon dioxide from the atmosphere.
State that much carbon dioxide is stored in oceans.
Evaluate methods used to collect environmental data and consider their validity and reliability as evidence for environmental change.
Demo: Demonstrate how a black object absorbs and re-radiates heat using sensors or hold near the skin.
Interpret data on carbon dioxide and methane levels in the atmosphere and temperature.
Discuss: Discuss how the data was collected – is it valid and reliable?
Find out about the recent ‘climategate’ – alleged distortion of facts by scientists.
Research: Research new ideas about tackling climate change, and produce a report, or plan a campaign to get people to take action to combat climate change.
Exhibition of different fuels and discuss where they come from.
What is a biofuel?
Demo: Demonstrate production of ethanol from yeast and burn the fuel.
Greenhouse: Temperature sensors and dataloggers.
Demo: Black object, infrared lamp, temperature sensors.
Past BLY1 exam questions.
Useful information on climate change can be found at www.wwf.org.uk by searching ‘tackling climate change’ or at www.UPD8.org.uk by searching ‘climate change – what will you do?’.
1c Biofuels can be made from natural products by fermentation.
Define the term ‘biofuel’.
Write the equation for the production of ethanol using yeast.
Explain the advantages and disadvantages of growing crops for biofuels.
A video clip on biofuels can be found on the BBC website at www.bbc.co.uk/learningzone/clips by searching for clip ‘476’.
Be able to understand that to grow crops for biofuels, forests are often cut down and how this is counter-productive.
1-2c Biogas can be produced by anaerobic fermentation of plant products or waste materials containing carbohydrates.
Define the term ‘biogas’.
State that biogas is produced by anaerobic respiration of plant products or animal wastes.
Evaluate the use of biogas generators.
Past BLY3 exam questions.
Be able to explain how the output from a biogas generator is affected by climatic conditions. Be able to use data from a table to calculate the yearly profit from a biogas generator.
Be able to state the main useful gas in biogas.
GC
SE
Bio
log
y for teaching from S
eptember 2011 onw
ards ( version 1.0 )
85 Unit 3
Show image of sugar cane and get candidates to produce a flow diagram to explain how it can be used to produce ethanol.
Show images of ‘Gasohol’ used in Brazil to power cars.
Show images of other crops used for fuels.
Video: Watch a video clip about biofuel crops and environmental and ethical issues.
Draw a table showing the advantages and disadvantages of growing crops for biofuels.
Demo: Burning methane using a Bunsen burner.
Explain how methane can be produced from plant materials and animal wastes containing carbohydrates.
Video: Watch a video showing different biogas generators.
Discuss: Discuss the advantages and disadvantages of each design.
Produce a poster or report showing pictures of different biogas generators giving the advantages and disadvantages of each.
Homework: Design and build a simple gas generator. Evaluate the designs and select the best and demonstrate how the methane can be burned as a fuel.

Unit 3
1-2a
b
Energy and biomass losses in food chains; shorter food chains are more efficient for food production.
Efficiency of food production can be improved by restricting energy losses from food animals.
Explain how energy is lost at each level in a food chain and calculate percentage energy losses.
Explain why shorter food chains are more efficient for food production.
State how energy losses from food animals can be reduced.
Evaluate the positive and negative effects of managing food production.
Explain why people buy foods that have travelled a long way and the effect of this on the environment.
Recognise that practical solutions for human needs may require compromise between competing priorities.
Recap food chains and pyramids of biomass covered in B1.5.1.
Interpret data on energy transfer in food chains and list energy losses at each level.
Task: Calculate the percentage of energy transferred at each stage.
Activity: Ask candidates what they had for lunch and write food chains for them. Consider different food chains relating to food production and evaluate how efficient each is in terms of energy produced for consumption per unit of land.
Video: Watch video clips showing battery hens, animals reared indoors and free range animals.
Discuss: Discuss how energy losses are reduced when animals are reared indoors.
Activity: Carry out a survey to find out what sort of eggs people buy and why.
List the advantages and disadvantages of factory farming animals.
Past BLY2 exam questions.
Useful information on farming can be found at www.thisisdairyfarming.com and www.small-farm-permaculture-and-sustainable-living.com
Be able to use data provided to calculate the percentage energy lost in urine and faeces.
Be able to suggest one reason why calves raised indoors grow faster than those raised outdoors.
Be able to suggest one reason why some people prefer to buy meat from animals that have been kept outdoors.
GC
SE
Bio
log
y for teaching from S
eptember 2011 onw
ards ( version 1.0 )
86
SpecRef
Summary of Specification Content
Learning Outcomes
What most candidates should be able to do
Possible Teaching and Learning Activities
Homework
Resources Examination Hints and TipsCandidates should:
SuggestedLessons
B3.4.4 Food production
GC
SE
Bio
log
y for teaching from S
eptember 2011 onw
ards ( version 1.0 )
87 Unit 3
1c Fish stocks are declining and need to be maintained at levels where breeding continues or some species may disappear. Net size and fishing quotas play an important role in conservation of fish stocks.
Explain why some fish stocks are declining and why this is a problem.
Describe ways that fish stocks can be conserved.
Give an example of sustainable food production.
Homework: Survey where food in the fridge at home has come from and calculate the air miles.
Consider the pros and cons of eating foods that have travelled a long way.
Activity: Who can catch the most fish? Play a game catching fish of different sizes when candidates are given nets with different mesh sizes. The person who wins will have a lot of small fish.
Discuss: Discuss the problems of catching both large and small fish and relate to the fishing industry. How can we maintain fish stocks?
Research: Research fishing quotas for different types of fish and display the information.
Research: Research what has happened to Blue Fin Tuna and what we could do to increase fish stocks.
Fishing: Different sized nets, different sized fish or objects to represent fish.
Be able to give examples of sustainable food production.
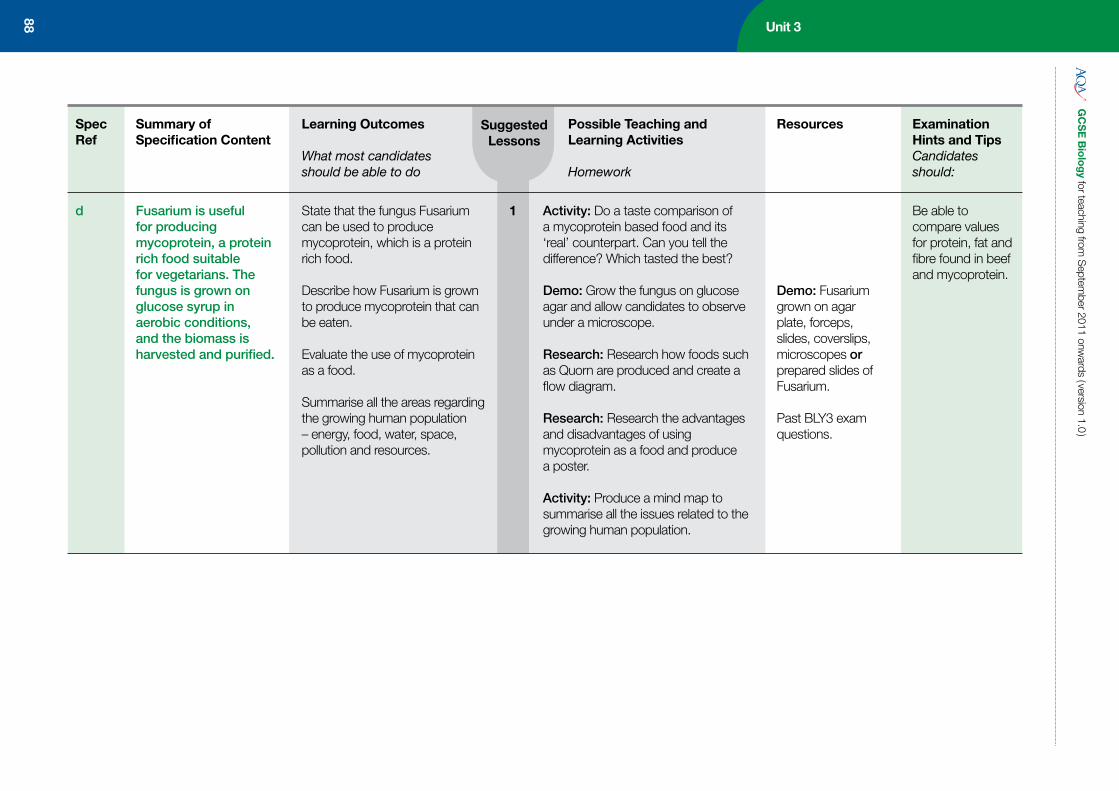
Unit 3G
CS
E B
iolo
gy for teaching from
Septem
ber 2011 onwards ( version 1.0 )
88
SpecRef
Summary of Specification Content
Learning Outcomes
What most candidates should be able to do
Possible Teaching and Learning Activities
Homework
Resources Examination Hints and TipsCandidates should:
SuggestedLessons
1d Fusarium is useful for producing mycoprotein, a protein rich food suitable for vegetarians. The fungus is grown on glucose syrup in aerobic conditions, and the biomass is harvested and purified.
State that the fungus Fusarium can be used to produce mycoprotein, which is a protein rich food.
Describe how Fusarium is grown to produce mycoprotein that can be eaten.
Evaluate the use of mycoprotein as a food.
Summarise all the areas regarding the growing human population – energy, food, water, space, pollution and resources.
Activity: Do a taste comparison of a mycoprotein based food and its ‘real’ counterpart. Can you tell the difference? Which tasted the best?
Demo: Grow the fungus on glucose agar and allow candidates to observe under a microscope.
Research: Research how foods such as Quorn are produced and create a flow diagram.
Research: Research the advantages and disadvantages of using mycoprotein as a food and produce a poster.
Activity: Produce a mind map to summarise all the issues related to the growing human population.
Demo: Fusarium grown on agar plate, forceps, slides, coverslips, microscopes or prepared slides of Fusarium.
Past BLY3 exam questions.
Be able to compare values for protein, fat and fibre found in beef and mycoprotein.

Ask AQAWe provide 24-hour access to useful information and answers to the most commonly asked questions at aqa.org.uk/askaqa. If the answer to your question is not available, you can submit a query through Ask AQA and we will respond within two working days.
e-AQAe-AQA gives teachers access to useful resources such as Exampro Extra Online and Enhanced Results Analysis (ERA). To find out more about Exampro Extra Online, visit sciencelab.org.uk/subjects and register for ERA at aqa.org.uk/eAQA-register
The Science LabThe Science Lab is constantly being updated with new ways to inspire your students. It’s the place to visit for innovative support and resources. See for yourself at sciencelab.org.uk
Teacher Support meetingsDetails of the full range of our Teacher Support meetings are available on our website at aqa.org.uk/support-teachers. You also have access to our fast and convenient online booking system at events.aqa.org.uk/ebooking
Speak to your subject teamYou can talk directly to the GCSE Sciences subject team about all our GCSE Sciences specifications on 08442 090 415 or e-mail [email protected]
For the latest informationFind out more, including the latest news, support and downloadable resources, at aqa.org.uk
Free services
Additional services
Nelson Thornes resourcesAccess to a range of textbooks, revision guides, online teaching, as well as learning and assessment materials is available at nelsonthornes.com/aqagcse/science-2011.html
Or contact Nelson Thornes – e-mail [email protected] or call 01242 267 287
Helpful websites and contact information

To obtain specification updates, access our searchable bank of frequently asked questions, or to ask us a question, register with Ask AQA: aqa.org.uk/ask-aqa/register
You can also download a copy of the specification and support materials from our website: sciencelab.org.uk/subjects
GCSE Biology Schemes of WorkFor exams January 2012 onwardsFor certification June 2013 onwards
MSD1153.10Version 1.0
Copyright © 2011 AQA and its licensors. All rights reserved.
The Assessment and Qualifications Alliance (AQA) is a company limited by guarantee registered in England and Wales (company number 3644723) and a registered charity (registered charity number 1073334).
Registered address: AQA, Devas Street, Manchester M15 6EX.


