SCHIZOPHRENIA IN KWAZULU NATAL: A study of certified patients, accessibility to mental health services and risk By Andrea Enslin A dissertation submitted as part requirement for the degree of Masters of Social Science (Clinical Psychology) At University of Natal (pietermaritzburg) 2002
Transcript
SCHIZOPHRENIA IN KWAZULU NATAL:A study of certified patients,
accessibility to mental health services and risk
By Andrea Enslin
A dissertation submitted as part requirement for the degree ofMasters of Social Science
(Clinical Psychology)
At University ofNatal (pietermaritzburg)2002
ABSTRACT
Schizophrenia is a debilitating mental illness. The prevalence of schizophrenia is of
concern and highlights the chronicity of the illness (Kaplan & Sadock, 1998; Warner
& de Girolamo, 1995).
It is therefore important that greater understanding ofthe variables affecting and
potentially contributing to schizophrenia is sought. This study deals with three
separate areas:
1. Creating a database and describing the socio-demographic profile of 615
certified patients diagnosed with schizophrenia between the years 1995 and
1996, hospitalised at Fort Napier.
2. Exploring whether a meaningful geographical model of socio-demographic
variables of schizophrenia can be built, and whether it can determine areas of
high schizophrenia sensitivity. Such a perspective of schizophrenia (exploring
the combined effect of all the variables connected to schizophrenia) has not
been previously researched rather each variable has been studied
independently. The model utilised in the Geographical Information Systems
(GIS) offers an opportunity to graphically overlay these individual variables
and then examine the potential effect. It was only possible to explore socio
demographic variables within this Masters research project.
3. Determining the geographical accessibility of the public provincial hospitals
offering psychiatric services to the population, (particularly to persons with
schizophrenia). This is relevant to the provision of maintenance programmes
and early intervention as encouraged by recent research (Hodges, Byme, Grant
& Johnstone, 1999; Yung et aI, 1998).
The socio-demographic profile of the certified patients at FNH correlated with most
of the international findings. The presentation of schizophrenia remained constant in
South Afiica in comparison to international countries and cultures (Warner & de
Girolamo, 1995). Overall, the pattern produced by the schizophrenia sensitivity model
was unclear other than high and low schizophrenia sensitivity ranges being evenly
spread throughout KZN. The model has yet to be further refined to increase its
sensitivity to schizophrenia risk. Although statistical significance was not established,
the accessibility model suggested that large parts ofKZN fall within the range of easy
11
accessibility in relation to the 19 provincial hospitals that provide a psychiatric
service. The potential of the schizophrenia sensitivity model and accessibility model,
in spite of the crude and incomplete variables utilised was evident. The GIS was a
powerful tool and utilised in this study to collect (from surveys and other databases),
store (retrieval and query), manipulate (transforming data, analysis and modelling)
and produce data output (data reporting, such as maps and reports) (Foote & Lynch,
1995). The GIS has been a very effective tool in working with epidemiological
information and it would be ofgreat use in service planning. It is strongly
recommended that there be greater collaboration between mental health services and
the GIS Unit, Department ofHealth.
III
ACKNOWLEDGEMENTS
There are numerous people I would like to thank for their assistance in the completion
of this thesis.
• My supervisor, Prof Anthony Pillay for his quiet constructive direction.
• Shannon Rushworth, the GIS manager of the GIS unit, Health Department, for
her high standards of professionalism, patience and perseverance.
• The Health Department for their policy on interdepartmental co-operation.
• Fort Napier Hospital for granting of permission for this study to be conducted
and allowing access to data.
• The 'dream team' who never let the torch go out - Mrs A, Sooz, Mary, Carla
and Uncle John, Joan, Margaret and Marc.
• My parents for their continued support, encouragement and love.
Declaration of Originality
The author hereby declares that this whole thesis, unless specifically indicated to the contrary in the
text. is her own original work.
IV
1.
2.
3.
4.
5.
6.
SHORT CONTENTS
TITLE PAGE
ABSTRACT
ACKNOWLEDGEMENTS
DECLARATION OF ORIGINALITY
SHORT CONTENTS
LONG CONTENTS
LIST OF DIAGRAMS, TABLES AND MAPS
LIST OF APPENDICES
INTRODUCTION
LITERATURE REVIEW
METHODOLOGY
RESULTS
DISCUSSION
CONCLUSION
REFERENCES
APPENDIX
11
IV
IV
V
VI
Xll
XlV
1
3
23
39
74
97
111
V
1.
2.
LONG CONTENTS
TITLE PAGE
ABSTRACT
ACKNOWLEDGEMENTS
DECLARATION OF ORIGINALITY
SHORT CONTENTS
LONG CONTENTS
LIST OF DIAGRAMS, TABLES AND MAPS
LIST OF APPENDICES
INTRODUCTION
LITERATURE REVIEW
11
IV
IV
V
VI
Xll
XlV
1
3
2.1 THEORETICAL FRAMEWORKS UNDERLYING THE STUDY
3
2.1.1 MEDICAL GEOGRAPHY 3
2.1.2
2.1.3
DEMOGRAPHY
EPIDEMIOLOGY
2.1.3.1 Epidemiological Tenns
3
4
4
2.2 SCHIZOPHRENIA
2.2.1 CONCEPT
6
6
VI
2.2.2 sCmzOPHRENIA COSTS 8
2.2.3 DEMOGRAPIDC CHARACTERISTICS 9
2.2.3.1 Age 9
2.2.3.2 Gender 9
2.2.3.3 Marital status 9
2.2.3.4 Location 10
2.2.3.5 Population Density 10
2.2.3.6 Seasonality of birth 11
2.2.3.7 Culture 11
2.2.3.8 Socio-economic status 12
2.2.3.9 Occupation 13
2.2.3.10 Migration 14
2.3 ACCESS TO MENTAL HEALTH CARE
2.4 GEOGRAPIDCAL INFORMATION SYSTEMS
2.4.1 INTRODUCTION
2.4.2 DEFINITION
2.4.3 APPLICATIONS
Schizophrenia Sensitivity Model
Geographical Accessibility Model
14
16
16
16
19
20
21
2.4.4 HEALTH GIS UNIT, KZN, DEPARTMENT OF HEALTH
22
2.4.5 POTENTIAL ERRORS IN USING THE GIS 22
vu
3. METHODOLOGY 23
3.1 INTRODUCTION 23
3.2 AIMS AND HYPOTHESES 24
3.3 METHODOLOGY 25
3.3.1 Sample 25
3.3.2 Instruments 25
3.3.3 Validity and Reliability 26
3.4 THE PROCEDURE 26
3.4.1 Database of certified patients with schizophrenia 27
4.4.1.1
3.4.1.23.4.1.3
Creating a Database of Certified Patients with
Schizophrenia 27
Ethical Considerations 27Describing the Database of Certified Patientswith Schizophrenia 28
3.4.2 GIS model of schizophrenia sensitivity 29
3.4.2.1 Demographic details ofKZN province and
population 29
3.4.2.2 The model of schizophrenia sensitivity 29
3.2.2.3 Working with the model's output 36
3.4.3 Geographical accessibility 37
3.4.3.1 Accessibility model 37
3.4.3.2 Application of the Accessibility model 38
4. RESULTS 39
4.1 DESCRIPTION OF KWAZULU NATAL 39
Vlll
4.2 DESCRIPTION OF PATIENT SAMPLE 40
4.2.1 Gender and cultural composition 40
4.2.2 Age 40
4.2.3 Marital Status 40
4.2.4 Seasonality ofBirth 41
4.2.5 Employment 42
4.2.6 Occupation 42
4.2.7 Religion 44
4.2.8 Previous Admissions 44
4.2.9 Month Admitted 45
4.2.10 Length of Stay 46
4.2.11 Diagnosis 47
4.2.12 Location 48
4.2.13 Summary 53
4.3 DESCRIPTION OF SCHIZOPHRENIA SENSITIVITY MODEL
54
4.3.1 Is there evidence of a geographical pattern? 54
4.3.2 Percentage ofKZN population falling into the varying ranges
of schizophrenia risk
4.3.3 Description of the relationship between the schizophrenia
sensitivity ranges and certified patients
4.3.4 Summary
56
57
62
4.4 DESCRIPTION OF ACCESSffiILITY MODEL 63
4.4.1 Access and the KZN population 63
4.4.2 Access and the certified patient population with
schizophrenia seen at Fort Napier Hospital 66
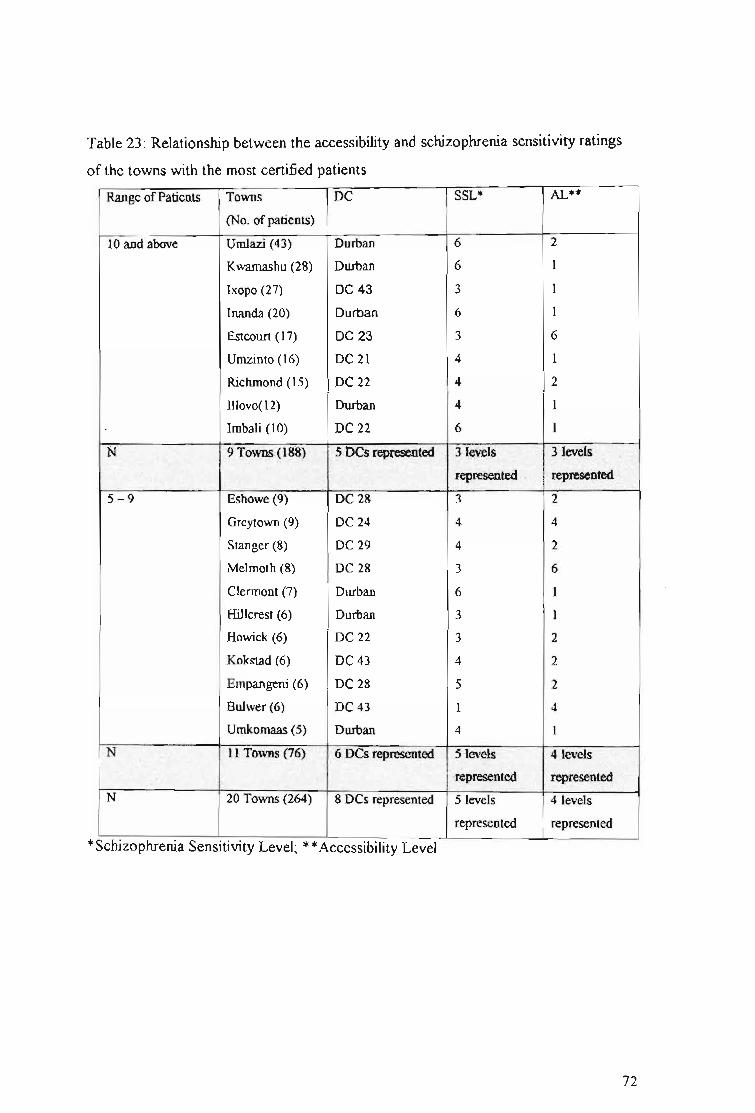
4.4.3 Relationship between the accessibility rating and
schizophrenia sensitivity ratings 71
4.4.4 Summary 73
IX
5. DISCUSSION 74
5.1 DISCUSSION OF KWAZULU NATAL 74
5.2 DISCUSSION OF PATIENT SAMPLE 74
5.2.1 Gender and cultural composition 74
5.2.2 Age 74
5.2.3 Marital Status 75
5.2.4 Seasonality ofBirth 75
5.2.5 Employment 76
5.2.6 Occupation 76
5.2.7 Religion 77
5.2.8 Previous Admissions 78
5.2.9 Month Admitted 79
5.2.10 Length of Stay 79
5.2.11 Diagnosis 81
5.2.12 Location 83
5.3 DISCUSSION OF SCHIZOPHRENIA SENSITIVITY MODEL
87
5.3.1 Is there evidence ofa geographical pattern? 87
5.3.2 Percentage ofKZN population falling into the varying ranges
of schizophrenia risk 88
5.3.3 Description of the relationship between the schizophrenia
sensitivity ranges and certified patients 88
5.3.4 Summary 89
5.4 DISCUSSION OF ACCESSffiILITY MODEL 90
5.4. 1 Access and the KZN population 90
5.4.2 Access and the certified patient population with
schizophrenia seen at Fort Napier Hospital 91
x
6.
5.4.3
5.4.4
CONCLUSION
REFERENCES
APPENDIX
Relationship between the accessibility rating and
schizophrenia sensitivity ratings
Summary
92
93
94
97
111
Xl
LIST OF DIAGRAMS, TABLES AND MAPS
Diagrams
Diagram 1: Overlaying ofvarious thematic maps of one area
Diagram 2: GIS focusing on one area
Diagram 3: Combining and transforming of data
Diagram 4: An example of an effort map
18
18
21
21
Tables
Table 1: A summary of the definitions used for the socio-demographic variables
included in the study 35
Table 2: A summary of the variables used for the GIS accessibility model 38
Table 3: Age Distribution 40
Table 4: Marital status 41
Table 5: Seasonality ofBirth !Month ofBirth 42
Table 6: Employment 42
Table 7: Occupation 43
Table 8: Religion 44
Table 9: Previous Admissions 45
Table 9.1: Previous Admission by Age 45
Table 10: Month Admitted 46
Table 11: Length of Stay 46
Table 12: Diagnosis 47
Table 12.1: Diagnosis and Average Length of Stay 47
highlighted an area often not included in the cost estimate of schizophrenia, that of
not fully considering the magnitude of the illness. Schizophrenia often begins between
the ages of 17 and 25 years, and only about one quarter completely recover. Torrey
(1988) saw the cost of schizophrenia as three-fold:
1) the cost to raise and educate these individuals
2) the loss of productivity: many being unable to contribute to society
economically
3) most of these individuals require costly services from society for the rest of
their lives.
Schizophrenia is the most under-researched disease in the western world (Suleman et
al., 1997). In the United States, a calculation was made that if research discoveries
could reduce the cost of schizophrenia by only 10 % by 1998, the savings accrued
over the following decade would total at least $180 billion (Torrey, 1988).
8
2.2.3
2.2.3.1
DEMOGRAPHIC CHARACTERISTICS
Age
The onset of schizophrenia is usually between the ages between 15 and 25 years. It is
extremely rare to have an onset of schizophrenia prior to the age of 10 years and after
the age of 50. Approximately 90 % of the patients in treatment are between the ages
of 15 and 55 years old (Kaplan and Sadock, 1998).
2.2.3.2 Gender
The prevalence ofgender is equal in schizophrenia. However, the presentation in
onset and course varies. Males tend to present with earlier onset of schizophrenia,
with at least halfbeing hospitalised prior to the age of25 years. Males are more likely
to present with negative symptoms and hence be more severely impaired. Their
outcome is considered worse in comparison to females. Females tend to present with
schizophrenia at a later age, only about a third are hospitalised prior to the age of25,
and are more likely to function more adaptively (American Psychiatric Association,
1994). It is well established that females experience a milder course and better
outcome (Barbato, 1998). The gender difference in the age of onset is a robust
phenomenon and is found to be consistent in all cultures (Gureje, 1991). However, in
one study, Fennig, Putnam, Bromet & Galambos (1995) did not find a strong
correlation between gender and negative symptoms or premorbid functioning. This
highlights how little is understood about schizophrenia.
2.2.3.3 Marital status
Warner and de Girolamo (1995) found marital status to be associated with risk of
schizophrenia in several studies. Lower rates of most mental disorders are found
among married people than those unmarried (never married or were presently
separated, divorced or widowed) (WHO International Consortium in Psychiatric
9
Epidemiology (ICPE), 2000; Andrews et al, 2001; Sethi et al, 1974). Women tend to
marry earlier than men and to have a later onset of schizophrenia. Marriage is
considered to be a protective factor for those with schizophrenia. It is uncertain,
however, whether marrying early protects the individual from early onset of
schizophrenia, or whether the early onset of schizophrenia prevents the individual
from marrying. It can be said that if the individual has married, it is considered to be a
positive factor indicating the possibility of a better prognosis. It has been suggested
that marriage exerts a protective effect that delays the onset of illness in women.
Alternatively, the illness in its early stages may act as a barrier to marriage (Warner &
de Girolamo, 1995).
2.2.3.4 Location
There is a direct correlation between schizophrenia and urbanisation (Torrey and
Bowler, 1990). Pederson and Mortensen (2001) found a correlation of urbanisation of
place of birth with the risk of developing schizophrenia. Greater numbers of people
with schizophrenia are found within urban areas (American Psychiatric Association,
1994). Warner & de Girolamo (1995) emphasize that the high urban rates may well
be due to rural dwellers being less likely to seek treatment or because people with
schizophrenia and prodromal features may gravitate towards urban areas. It is
presumed that rural areas are different in density (people per square unit ofground)
compared to urban areas. For example, in KwaZulu Natal, the Durban District
Council (DC) and DC 22 are at least twice more densely populated then to the other
DCs (See chapter: Results).
2.2.3.5 Population Density
The epidemiology of schizophrenia has been correlated with population density. A
strong correlation was found within cities that had a population of one million people
and more; a weaker correlation with cities of 100 000 to 500 000 people. No
correlation was found in cities with less than 10 000 people (Kaplan & Sadock, 1998).
10
This effect of population density is consistent with the observation that the incidence
of schizophrenia in children with one or two parents with schizophrenia is twice as
high in cities than in rural communities. This observation also suggests that social
stressors found in urban settings may affect the development of schizophrenia in
people at risk (Kaplan & Sadock, 1998).
2.2.3.6 Seasonality of birth
People with schizophrenia are most likely to be born in winter and early spring, and
least likely to be born in late spring and summer. In the Southern Hemisphere, they
are more likely to be born between July and September (Kaplan & Sadock, 1998).
Eaton, Day & Kramer (1988) reported the excess of births among treated people with
schizophrenia at this time ofyear, to be approximately 10 % higher than at any other
time of the year. Adams & Kendell (1999) suggested that the significant year-to-year
variation in the birth rate of people subsequently developing schizophrenia provides a
potential clue to the nature of environmental determinants of schizophrenia. Various
hypotheses have been put forward as possible explanations. One proposes that a
season-specific risk factor may be operative, another suggests 'people with a genetic
disposition for schizophrenia have an increased biological advantage to survive
season-specific insults' (Kaplan & Sadock, 1998, p458), whereas another investigates
the interactions with specifically the human leukocyte antigen (HLA) and the
population at risk (Narita et al., 2000). The season of birth is considered to be a
valuable area of research. It is expected that eventually a relevant risk factor in a
significant proportion of cases in schizophrenia will be uncovered (Warner & de
Girolamo, 1995).
2.2.3.7 Culture
Schizophrenia is prevalent in all cultures with the core symptoms of schizophrenia
universally identifiable (Kaplan & Sadock, 1998). Mowry et al. (1994) found that the
prevalence rates of symptoms of schizophrenia appeared to vary across different
11
ethnic groups. Even though no racial prevalence difference is noted in schizophrenia,
it is still a pertinent variable to examine in South Africa due to the legacy of
apartheid. Much discrimination was directed at South African people ofcolour
resulting in them dominating the lower socio-economic ranks. Extreme inequality in
the distribution of income exists among racial groups and households. 'The poorest 40
% of households in South Africa earn less than 6 % of total national income, whilst
the richest 10 % earn more than half of the national income' (White Paper on Social
Welfare, 1997). Although 'poverty is not confined to anyone race group, it is
concentrated among blacks, particularly Africans: 61 % of Africans and 38 % of
coloureds are poor, compared with 5 % ofIndians and 1 % ofwhites' (poverty and
Inequality in South Africa, 1998). This factor may play an important role in the
ep~demiologyof schizophrenia.
Lilienfeld & Lilienfeld (1980) described religion to be an interesting population
characteristic as it usually related to the living habits of that population. This is of
particular relevance to South Africa as it may affect whether medical professionals or
traditional healers (including faith healers) are the first choice for treatment. After all,
it is estimated that there are some 150 000 traditional healers in South Africa
(including faith healers) (Karlsson & Moloantoa, 1984). Many of the problems that
they deal with are mental health related (Freeman, 1991). It is believed that as many
as 80 % of the South African population consults traditional healers (Hopa, Simbayi
& du Toit, 1998).
2.2.3.8 Socio-economic status
An excess of people with schizophrenia is found in the lower social classes (Freeman
and Alpert, 1986). Socio-economic status is a theoretical concept and still awaiting a
clear definition. Many variables encompass the concept such as, occupation, family
income, living conditions, and social prestige. Each variable measures a different
component of this complex subject, and its association can be expected to vary
according to the variable used (MacMohon & Pugh, 1970). Traditional measures of
social class (education, occupations and income) have been inversely related to the
12
prevalence of psychiatric disorders (Andrews et al, 2001; Jablensky et al, 2000; WHO
International Consortium in Psychiatric Epidemiology, 2000; Muntaner, Eaten, Diala,
Kessler & Sorlie, 1998; Torrey and Bowler, 1990). The majority ofepidemiological
studies have concluded that the lower the social class position the greater the risk of
psychiatric disorder (Timms, 1998; Kawachi & Kennedy, 1997). In spite of the strong
association between schizophrenia and a low social-class position, it has not been
established that this is an aetiological relationship (Timms, 1998).
2.2.3.9 Occupation
About 75 % of people with severe schizophrenia are unable to work and are
unemployed (Kaplan & Sadock, 1998). Those in employment had the lower rates of
all mental disorders (Andrews et aI, 2001; Jablensky et al, 2000; Timms, 1998; Sethi,
Gupta, Mahendru & Kumari, 1974). Among men in the workforce, a regular increase
in mental illness was found as the work status decreased (Timms, 1998; Odegaard,
1956). The relative risk of males in unskilled working class occupations being
hospitalised with a psychotic illness was twelve times more than those classified as
being upper middle class (Timms, 1998). Similarities of chronic schizophrenia and
the psychological effects oflong-term unemployment have been highlighted (Warner,
1985). These findings are of particular significance to South Africa as South Africa is
characterised by large-scale unemployment in the formal sector of the economy
resulting in great poverty exists alongside extreme wealth (White Paper on Social
Welfare, 1997). Unemployment among people with disabilities is high and 1.6 % of
the total South African population receives a disability grant (White Paper on Social
Welfare, 1997). It is an historic fact that unfortunately a large proportion ofthe South
African population has been exposed to the psychological effects oflong-term
unemployment, minimal educational opportunities, job discrimination and racial and
political conflicts.
13
2.2.3.10 Migration
Inconsistent findings have emerged to whether migration represents a risk factor in
schizophrenia as some migrant groups continue to show very high rates ofhospital
admission for schizophrenia, while other studies fail to show excess (Warner, 1985).
A possible explanation is that the nature ofmigration has changed and the process of
self-selection that operated before is no longer a prominent factor. However, there is
some evidence in relating the difference in variance rates to whether the migrant
enters the new culture at a high or low social status. Those who encounter poverty and
stress are routinely found to experience greater rates of psychotic1 illness whereas
those who enter a new culture with a high status studies have revealed lower rates of
hQspitalisation for schizophrenia. This variable is pertinent to South Africa because of
the wide spread poverty (White Paper on Social Welfare, 1997) and the expected
migration of Africans from rural areas to informal settlements closer to the centres of
metropolitan areas (Dor, 1994).
2.3 ACCESS TO MENTAL HEALTH CARE
After more than 40 years of apartheid, the new government came to power in 1994
and inherited a legacy ofgreat inequity in the South African health care systems
(Jinabhai & Campbell, 1995). Departments were fragmented and bureaucratic
resulting in discriminatory service delivery and inequities taking on many forms.
(Ntsaluba & Pillay, 1998). Much of South Africa is geographically impassable, hence
making the rendering and access to health care difficult leading to significant
geographical related inequities. The impact of these difficulties is aggravated in areas
characterised by widespread poverty and poorly developed infrastructure. Forty
percent ofall South Africans live in poverty, ofwhich 75 % live in rural areas and are
chiefly ofAfrican descent (South African Yearbook 2000101: Health, 2001).
I Psychosis is the 'inability to distinguish reality from fantasy; impaired reality testing with thecreation ofa new reality' (Kaplan and Sadock, 1998, p281) ,
14
Personnel and resources are found to be concentrated in the urban and metropolitan
areas (van Rensburg & Fourie, 1994).
The Bill ofRights does not guarantee individuals a right to health, but rather the right
of access to health care services (Constitution, 1996). This is reiterated in the National
Patients Rights Charter finalised in 1999 (South African Yearbook 2000/01: Health,
2001).
The Department ofHealth stated their objective was to ensure all South Africans have
access to health resources by adopting the district-based primary health care (PHC)
model. The major emphasis is the move from the curative hospital-based health car~
to integrated community based care (South African Yearbook 2000/01: Health, 2001).
Health care is provided at 3 levels. The Primary Care Level is the point of entry into
the system and embraces all general health services. The Secondary Care Level
comprises more specialized services to which patients are referred by the Primary
Care Services. Psychiatric institutions, offering long-term care, are found at this level.
The Tertiary Care Level includes highly specialized services not normally found at
the secondary level (Chetty, 1990).
South Africa has a well-developed network of public hospitals in urban areas. In
practice, an ineffective system of referral between primary care facilities and hospitals
has been found (Bloom & Mclntyre, 1998).
The essential message - stemming originally from the World Health Organisation's
Alma Ata Conference - is that health care must be provided at the site closest to
where people live and work, and at a point where they are able to exert maximum
control over their lives (van Rensburg, & Fourie, 1994). Utilization of facilities
declines when geographical accessibility declines (Ayeni, Rushton, & McNulty,
1987). A recent survey found that more than 35 % of African residents travelled more
than an hour to reach a provider ofhealth services and 73 % had to wait between 1
and 5 hours to see a health worker once they arrived at a facility (Hirschowitz and
Orkin, 1995, in Bloom & McIntyre, 1998).
The focus of this study is to examine the potential geographical accessibility of the 19
provincial hospitals. The existing public sector health services are found to be least
accessible to the most vulnerable of populations. This is particularly pertinent in
15
mental health as the services are found to be still concentrated in the psychiatric
hospitals and not in the health care clinics (Harvey, 2000). As 75 % of South Africans
do not have medical aid insurance there is a great reliance on the public health
services (policy on Quality in Health Care for South Africa, 2000).
2.4 GEOGRAPHICAL INFORMATION SYSTEMS
2.4.1 INTRODUCTION
'Fhe computer based Geographical Information Systems (GIS) were first available in
the late 1970's (Foote & Lynch, 1995). Since then the GIS have expanded rapidly,
maturing into general-purpose information technology that is capable ofaddressing
diverse problems in a geographical context (Longley, Goodchild, Maguire & Rhind,
1999). GIS are now used extensively in government, business, and research (Lynch,
1994). Applications are found in land resources (Foote & Lynch, 1995), fields of
census mapping and socio-economic modelling, and in geodemographic applications
such as marketing, health, transport and planning (Martin, 1999). Government
agencies are addressing public health issues, for example capturing AIDS data into
GIS databases for monitoring and modeling purposes (Chou, 1997). Two local studies
used the GIS to determine potential access of health care resources (Bhana & Pillay,
1998; Zwarenstien, Krige & Wolff, 1991).
2.4.2 DEFINITION
Foote & Lynch (1995) provide a generic definition for computer based GIS: 'GIS is a
special-purpose digital database in which a common spatial coordinate system is the
primary means of reference'.
16
There are four standard operations required by a comprehensive GIS:
1. Data input: from maps, aerial photos, satellites, surveys, and other sources
2. Data storage: retrieval, and query
3. Data manipulation: data transformation, analysis, and modelling, including
spatial statistics
4. Data output: data reporting, such as maps, reports, and plans (Foote & Lynch,
1995; Longley et aI, 1999).
Data input:
The GIS utilises digital data to represent time and space (Longley et aI, 1999). A
digital representation is a model of the real world (Burrough, 1986). The relationship
between the 'real' world and the representation at each stage depends not only on the
accuracy of the co-ordinates and attributes, but also on the researcher's decision
regarding what to include, how to measure / classify and symbolise those
representations (Martin, 1999).
Data storage
The GIS database is designed to represent, model, store, and access information about
spatial relationships based upon location (Foote & Lynch, 1995). The GTS database is
differentiated from other database applications by the fact that all the information in
the GIS is linked to a spatial reference. This refers specifically to geo-references
(latitude and longitude), which are the primary means in which data / information is
stored and accessed, as opposed to only location information (such as, street
addresses, postal codes) (Foote & Huebner, 1996). The GIS plays an important role in
integrating technology. A comprehensive GIS contains very powerful technologies
within a single database, allowing mapping, modelling, queries and analysing of large
quantities of data (Foote & Lynch, 1995). The GIS extends beyond merely software
or hardware. It is a process. It has the potential to play a crucial role in comprehensive
decision-making. The manner in which the information is captured, stored and
analysed must mirror the way it is to be used in the specific research or decision
making task (Foote & Lynch, 1995). Various kinds ofGIS exist and each has a
different purpose with different types ofdecision-making processes and unique
functions and roles (Foote & Lynch, 1995).
17
Data manipulation
A model is a simplified digital representation ofreality (Longley et al, 1999). The
model is used to simulate a process, obtain further understanding ofa situation,
predict an outcome and/or analyse a problem (Association for Geographic
Information, 1999).
The schematic diagram (Diagram 1) demonstrates the powerful tools provided by the
GIS. It has arranged information about a certain location (a given region or city) as a
set ofmaps. Each map displays information about one characteristic of the region. In
this example, the information is useful in planning urban transportation. Each ofthese
separate thematic maps is referred to as a coverage or layer. Each tier is carefully
la~ered over each other ensuring that the location is precisely corresponding to the
locations on all the other maps. The bottom layer of the diagram is the most
important. It represents the grid of the locational reference system (such as longitude
and latitude) to which all the maps have been precisely registered. Once overlaid, the
information displayed on the different layers may be compared and analysed in
combination (Foote & Lynch, 1995).
Census Tracts
Roads
Bus ROUMS
Shopptngcenters
Industrial Sites
GIS: An IntegraIing Technology
Diagram 1: Overlaying ofvarious
thematic maps of one area (Diagram
from Foote & Lynch, 1995).
The GIS also provides for exploring spatial patterns and processes in one location or
the entire region. Diagram 2 illustrates 'how single locations or areas can be separated
from surrounding locations ... by simply cutting all the layers of the desired location
from the larger map (Foote & Lynch, 1995, p3)'.
Diagram 2: GIS focusing on one area
(Foote & Lynch, 1995).
18
Data output:
An important purpose of the GIS is to function as a decision support system. Maps are
important tools in this process. Maps are ideally suited for spatial data as they assist
understanding and revealing spatial relations and patterns (see map 1), and are
integral parts of the spatial handling process. Complex multidimensional aspects of
spatial data are effectively captured, quickly grasped and digested when displayed via
the graphic methods characteristic of the GIS (Beard and Buttenfield, 1999).
Iliwba J ,..1
Map 1: Illustration of the spread of positive cholera cases (the
darkest areas) in the month ofMarch 2002 (Geographical
Information Systems Unit, 2002).
Maps also play an important role in the visual decision support as they provide a
direct and interactive interface to GIS data. It is important for the user to adhere to
proper map strategy to perform this important GIS aspect of interpreting and
analysing them (Kraak, 1999).
2.4.3 APPLICATIONS
This study utilises the GIS process to address two questions:
1) would a geographical pattern emerge if socio-demographical variables associated
with schizophrenia, were overlaid in KZN?
2) are the public hospitals offering psychiatric services in KZN, geographically
accessible to specified populations?
These two specific aspects are discussed further below.
19
Schizophrenia sensitivity model
The GIS can be used to problem solve in a particular application area (e.g. mental
health) by drawing inferences from a knowledge base attained by human expertise.
These knowledge based systems, or more commonly, expert systems have formed the
basis of automated map generalisations (Association for Geographic Information,
1999). The mental health knowledge base would be tapped into by approaching a
number of 'experts' (professionals who have worked in the field of schizophrenia for
a few years) to contribute in the process of selecting and ranking variables that
increase the risk of schizophrenia (See section 3.4.2.2: Consulting the "experts").
Weighting is a scaling factor that indicates the importance of a variable in a particular
op.eration. Weighting determines the influence that a particular layer will have on the
final result (Association for Geographic Information, 1999). In this study each
variable, and then, separately, each sub-definition within each variable was ranked
according to importance in the modeling process. GIS practitioners tap into the
knowledge base of'experts' in the specific field of interest, to assist in identifying
what information is important and to what degree (pers comm. Shannon Rushworth,
2001).
Not all analyses use all map layers simultaneously, for example, schizophrenia
sensitivity model. Some researchers use the information selectively to take the
relationships between specific layers into consideration. Diagram 3 illustrates one
example, in which two or more layers are combined and transferred into a new layer
for use in subsequent layers. These then are overlaid, forming a unique combination
of overlapping socio-demographic data associated to schizophrenia. This ability of the
GIS to separate information into layers and then combine some with other layers of
information highlights its great potential as a research and decision-making tool.
Sometimes, the process ofcombining and transforming information from different
layers is called map 'algebra' as it involves adding and subtracting information (Foote
& Lynch, 1995).
20
Diagram 3: Combining and
transfonning ofdata (Foote &
Lynch, 1995).
Selecting and TransformingGIS Data by Layer
Geographical accessibility model
Accessibility is the aggregate measurement to determine how reachable specific
l~cations are from a given location (see diagram 4). It is commonly measured in
distance or by cost (Association for Geographic Information, 1999). The measure of
accessibility is generated easily and can play a useful role in policy and service
analysis, for example, in determining the gaps in service provision and location of
new facilities (Martin, 1999). In this research, the geographical accessibility of public
hospitals offering psychiatric services is explored. The gravity model is the
foundation ofassessing geographical accessibility. The gravity model (spatial
interaction model) aims at analysing movement of people or goods or services
between origins and destination in terms ofaccessibility. This is usually based on
distance and demand (Association for Geographic Information, 1999).
....By using a GIS's modelling techniques,
variables can be combined to create a
map, which illustrates the effort it
takes to move from a point to a health
facility.
Diagram 4: An example ofan effort map (Geographicallnformation Systems Unit, 2002).
Effort or cost can be described in terms of time, distance decay, impedance or other
user-defined factors (Association for Geographic Information, 1999). Distance decay
is a mathematical representation in spatial interaction on the accessibility and number
of interactions between locations. It reflects a reduction in demand as distance
increases (from the source of some supply) due, normally, to increasing travel costs
(Association for Geographic Information, 1999). The following variables were used to
21
define accessibility in this geographical accessibility model: distance from place of
residence/ referral to hospital, road access, physical obstacles in between such as
major river/nature reserve, financial cost, and, walking distance to the service.
2.4.4 HEALTH GIS UNIT, KZN, DEPARTMENT OF
HEALTH
There is a GIS Unit within the Department ofHealth, KZN (see website
http://www.kznhealth.gov.za/gisinfo.htm).Itsaimsaretogather.maintain. assess and
report on spatial data and information, with the intention offacilitating understanding
in these areas relating to the health of the population ofKwaZulu-Natal. It aims to
make the information gathered and stored, available to individuals and organisations
(internal and external) and be utilized in making recommendations and decisions on
the maintenance, management and use ofhealth resources in the Province. Shannon
Rushworth (BSc Honours specializing in Geographic information Systems, University
ofNatal- Pietermaritzburg) is the GIS manager. Mrs Rushworth has been the
intermediary between the present research project and the GIS.
2.4.5 POTENTIAL ERRORS IN USING THE GIS
There are three main groups offactors governing the errors associated with
geographical information processing:
I Obvious sources of error
II Errors resulting from natural variations or from original measurements
III Errors arising through processing (Burrough, 1986).
22
3.1
CHAPTER THREE: METHODOLOGY
INTRODUCTION
The theoretical framework of medical geography underpins this study providing the
opportunity for a spatial analysis ofhuman problems. Epidemiological knowledge
(pyle, 1979) and basic demographic information (Mc Glashan, 1972) are essential to
its study. Increasingly in South Africa, epidemiology has been utilized to provide
global pictures of the possible causes and geographic locations of the concentration of
illnesses in an attempt to develop a research basis that could inform policies to
transform health care (Katzenellenbogen, Joubert & Yach, 1997). This research study,
a pilot project, created a database of certified patients diagnosed with schizophrenia
during a 2 year time period, at Fort Napier Hospital in Pietermaritzburg, Kwazulu
Natal. Tt attempts to explore the distribution of the socio-demographic variables of
schizophrenia in KZN assessing the geographical accessibility to the public hospitals
with psychiatric facilities within KZN.
Physical diseases such as cholera and tuberculosis tend to have clear cause-effect
relationships. Mapping these diseases is simpler in comparison to a complex mental
illness such as schizophrenia. There are countless aspects of schizophrenia that are
unclear, and numerous associated variables whose relationships with the actual
disorder, and each other, are still not fully understood. To complicate matters further,
there are a profuse number of theories trying to explain these relationships, which
often contradict one another. One example is the variable ofmarriage. Some argue
that it is a protective factor. Hence married women tend to develop schizophrenia at a
later stage. In contrast, others propose that it is simply because men experience earlier
onset of schizophrenia they are less likely to get married. Regardless ofwhether the
variables are precipitating factors or consequences of the disease, these variables are
consistently experienced as core components in the make up of schizophrenia. Despite
many ambiguous areas being evident, it is still relevant to investigate whether a
geographical pattern might emerge if pertinent variables associated with
schizophrenia were found clustered together within a particular location.
23
The 1995 Census database (Central Statistical Services, 1995) fonns a powerful
current resource, yet much needed and basic infonnation in the health sphere area is
not available. The richness of data found in the files of certified patients at Fort
Napier Psychiatric Hospital highlights the possibility and wealth ofinfonnation that
can be drawn on in the psychiatric hospitals, were they only computerized and
combined with a regional! national database. This would be ofgreat benefit for mental
health, and with regard to policies, more effective, infonned decision-making.
3.2 AIMS AND HYPOTHESES
1. To gain a greater understanding of the variables affecting and possibly contributing
to schizophrenia, by firstly, describing the demographic trends and deviations from
international findings, and secondly, using the Geographical Infonnation Systems
(GIS) model, to overlay these individual socio-demographic variables in order to
examine a potential combined effect.
2. To explore the geography of schizophrenia in tenns ofaccessibility of the mental
health services to individuals diagnosed with schizophrenia.
The following questions are proposed:
1. What is the socio-demographic profile of certified patients in KZN diagnosed with
schizophrenia between the years 1995 and 1996?
2. Can a meaningful geographical model of socio-demographic variables of
schizophrenia, be constructed?
1. If the many factors associated with schizophrenia (such as age, gender and
marital status), that can be mapped, are co-ordinated, will a distinct pattern
become obvious? Are certain populations I variables such as gender more
evident in the occurrence of schizophrenia?
24
2. What percentage of the population in KZN is located within the areas of
greater schizophrenia sensitivity?
3. Would the above model withstand statistical testing? What number of certified
patients diagnosed with schizophrenia would fall into the greater areas of
schizophrenia sensitivity?
3. How geographically accessible are the public psychiatric hospitals to the
population? Firstly, the entire population, secondly, the population falling within the
distinct patterns identified in the schizophrenia sensitivity model, and thirdly, the
certified patient population with a diagnosis of schizophrenia from Fort Napier
Hospital, in KwaZulu Natal (KZN)?
3.3
3.3.1
METHODOLOGY
Sample
Two samples were studied. The first entailed all those certified patients diagnosed
with schizophrenia, hospitalized at Fort Napier Hospital (FNH) during the years 1995
and 1996.
The second involved orJy the population of the province ofKZN, as defined by the
National Census Data (Central Statistical Services, 1995).
3.3.2 Instruments
Microsoft Access (2000) was utilized to capture and create the database for the
records of the certified patients.
IDRISI Geographic Information System (GIS) software was used in order to:
• Visually display the KZN district and public psychiatric hospitals
• Create and display a geographical model of socio-demographical variables
associated with schizophrenia
• Display the accessibility of public psychiatric hospitals to the population in
KZN (Chou, 1997; Martin, 1999).
25
3.3.3 Validity and Reliability
To ensure adequate validity in this study it is important to recognize the limitations
and specific aims adopted in this study. Rosnow & Rosenthal (1996, p136) describe
construct validity as being 'concerned with the psychological qualities constituting
what has been characterized as the theoretical scaffolding between X and Y'. It is
important to note that this project is not dealing with causation of different variables
related to schizophrenia and accessibility, but rather it is an attempt to describe them.
Schizophrenia is consistently associated with many variables, yet not one has been
proven to be pathogenic. Very specific variables have been selected for this study.
Rather than trying to comprehensively cover the entire spectrum ofvariables affecting
schizophrenia, the variables chosen were "map-able" and accessible to electronic data
capture.
It is important to note that the aim was neither to explore possible explanations /
causes of schizophrenia, nor investigate the relationships with the variables used, but
essentially a pilot study to explore whether a distinct geographical pattern in the
province would emerge from the selected variables. It was also hoped that the study
would encourage additional questions, leading to further valuable research in this
area. It is evident that further research would be required in which a full range of
variables be included.
3.4 THE PROCEDURE
The research procedure dealt with three major areas: 1) creating a database of
certified patients with schizophrenia at Fort Napier Hospital; 2) establishing and
working with the geographical pattern of socio-demographic variables; and 3)
assessing geographical accessibility to the public hospitals in KZN.
26
3.4.1
3.4.1.1
DATABASE OF CERTIFIED PATIENTS WITH
SCHIZOPHRENIA
Creating a Database of Certified Patients with
Schizophrenia
The collection of the data involved accessing the files at the Fort Napier Hospital
(FNH) registry. The demographic data of the relevant patients were captured directly
into the researcher's database and coded for data analysis. The demographic data
included: age, diagnosis, ethnic group, gender, marital status, religion, season of
admission, first admission/readmission to the hospital, length of stay (date, admission
and discharge dates), and place of residence / certification.
Permission to conduct the study was obtained from the Chief Medical Superintendent
of the Midlands Hospital Complex.
The following criteria were used to select the patients' files:
1. admission to FNH was between January 1995 and December 1996
2. the primary diagnosis was schizophrenia, schizophreniform,
schizoaffective, schizophrenia with substance abuse, schizophrenia with
alcohol abuse, schizophrenia with personality disorder, schizophreniform
with substance abuse, or, schizoaffective with substance abuse
3. the patient's place of residence or place of certification referral had to be
known
4. place of residence or certification was within the province ofKZN.
3.4.1.2 Ethical Considerations
Anonymity
By recording only the patient's file numbers and not their names, the anonymity of
the patients' records was ensured.
Confidentiality
Confidentiality of the contents of the files was secured by the researcher consciously
27
focusing only on the relevant data in the files pertinent to the research. The researcher
was also bound by the rules of confidentiality as laid out by the codes of the Health
Professions Council of South Africa for Intern Psychologists and Psychology
researchers. Only people involved in the research methodology had access to the raw
data.
Responsible Research
The file numbers were included in the event that additional information was required
at a later stage. This was a necessary step to ensure responsible research, as one of the
research objectives was to initiate a mental health database. If further variables were
identified to be researched in the future, then this original database could be utilized
by the files being re-accessed in order to include the additional variables rather than
having to repeat the entire data capture process.
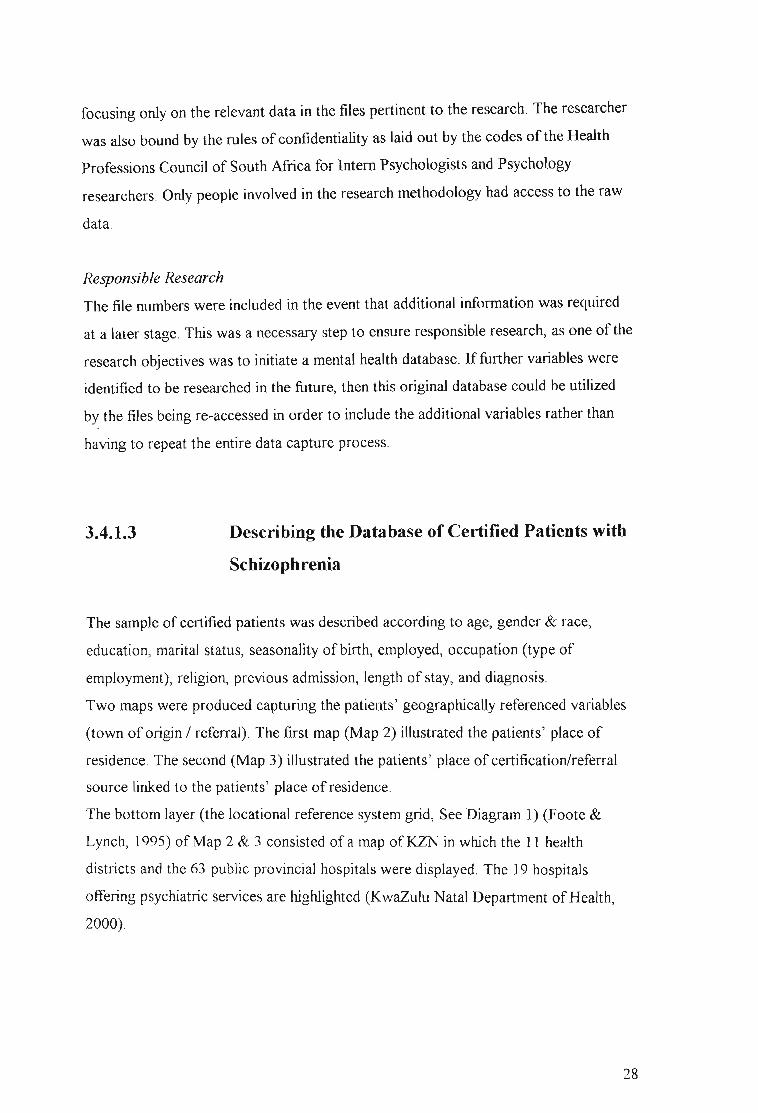
3.4.1.3 Describing the Database of Certified Patients with
Schizophrenia
The sample of certified patients was described according to age, gender & race,
education, marital status, seasonality of birth, employed, occupation (type of
employment), religion, previous admission, length of stay, and diagnosis.
Two maps were produced capturing the patients' geographically referenced variables
(town of origin / referral). The first map (Map 2) illustrated the patients' place of
residence. The second (Map 3) illustrated the patients' place of certification/referral
source linked to the patients' place of residence.
The bottom layer (the locational reference system grid, See Diagram 1) (Foote &
Lynch, 1995) ofMap 2 & 3 consisted ofa map ofKZN in which the 11 health
districts and the 63 public provincial hospitals were displayed. The 19 hospitals
offering psychiatric services are higWighted (KwaZulu Natal Department ofHealth,
2000).
28
3.4.2 GIS MODEL OF SCHIZOPHRENIA SENSITIVITY
This section was made up of three main sub-sections: describing the socio
demographic variables ofKZN; collecting the data required for the model; and,
working with the model's output.
3.4.2.1 Demographic details of KZN province and population
For the purpose of describing the demographic details ofKZN province and
population, the Census data (Central Statistical Services, 1995; calculated based on
Statistics SA amended average growth rate for KwaZulu-Natal from 1996 to 2001
(period 4.7592 Years) of 1.5834 % per annum) was cleaned by rounding the figures
off to a whole number or in some instances to the first or second decimal (See
Appendix 2). The relevant categories and subsections were extracted and grouped by
District Councils (DCs). The population ofKZN was described according to various
status, occupation, socio-economic status, disabilities, urban/rural location, and
population density.
3.4.2.2 The model of schizophrenia sensitivity
The following steps were used to create the model investigating the geographical
pattern of socio-demographic variables of schizophrenia:
1. Consulting the "experts"
• Select a number of"experts" (professionals who have worked
in the field of schizophrenia for a few years) to decide on
variables that increase the risk of schizophrenia
• Each "experts" to independently rank these variables (1-10
where 1 is the most important variable / variable ofgreatest risk
for the individual); combine and average each of the variables'
rankings
29
2. Selecting, defining and weighting ofvariables
• Variables utilised in the study
• Establish a map-able definition for each variable
• Weighting within the variables
3. Data Manipulation
• Mapping the variables
• Layer each variable over KZN
• HigWight the areas where several of these variables overlap and
thereby visually displaying the geographical pattern of these
variables concentrated together (Association for Geographic
Information, 1999).
Consulting the "experts"
Certain professionals currently working in KZN with patients diagnosed with
schizophrenia were approached to provide information and to gain consensus on
which variables it would be useful to include in the study, the ranking of these
variables1, and to collaborate on the definitions used. The clinicians approached
requested anonymity.
A questionnaire (see appendix) was drawn up to submit to the various "experts". The
questionnaire listed thirteen variables identified from the literature review as variables
linked to schizophrenia. In section one, the "experts" were requested to identify
further relevant variables. In section two, they were asked to rank the variables
according to their perception of the importance of the variables, based on their work
experience in the field of schizophrenia2. In section three, a list of the variable
definitions was provided. The "experts" were requested to add to these definitions and
provide further comments. The questionnaire was faxed to two clinicians. TIllS
I This was omitted in the making of the model of schizophrenia sensitivity. All the variables used wereequally weighted and considered to be totally independent of the others. Some variables were brokendown into several subdivisions. These subdivisions within that particular variable were then weightedin relation to each other.2 See footnote I
30
approach, however, rendered poor information. It seems that the lack of discussion
and achieving some form ofconsensus, the complexity ofthe issue of schizophrenia,
and possibly an unclear questionnaire rendered unhelpful results.
Subsequently, the researcher met with another clinician and discussed and debated the
purpose of the research project and questionnaire in detail, after which the "expert"
completed the questionnaire independently. These results were more coherent,
thorough, and in line with the study's purpose. It was therefore decided that only the
input of this "expert" would be applied in the selection of the variables utilised in
corroboration to the literature review (See section 2.2.1). This represents a great
limitation as the knowledge base system (Association for Geographic Information,
1.999) being made use offor this study is restricted to one person as opposed to
collaboration ofseveral "experts", hence weakening the reliability ofthe variables
chosen. However, it could be argued that the literature review provides adequate
support in itself for the variables selected for the study and that the 'experts' most
valuable input required was to rank the variables. Eventually this ranking of the
variables was not implemented, as the literature could not provide guidance in this
area. Seemingly variables have been studied independently but not collectively to
examine the potential combined effect of the variables as proposed by this study. The
impact of ranking the variables could be explored in future studies. Hence, the
limitations of the 'experts' may be argued to have minimal impact on the study.
The variables utilised in the study
The variables listed by the "expert" fell into three categories: socio-demographic (age,
gender, marital status, seasonality of birth, occupation, socio-economic status, internal
migration, rural/urban location, population density), past history variables (family
history ofmental disorder, family history of schizophrenia, maternal health, birth
and personal habits: substance use. This study focused only on the socio-demographic
variables, as these were map-able and accessible (in terms of the database) to study.
The remaining variables not included in this study highlight the need for these areas to
be further studied.
31
Definitions ofthe variables used
A map-able definition was then made ofeach identified variable being used in the
study. The definitions used for the socio-demographic variables included in the study
are detailed below. Table 1 provides a summary of the definitions used.
Age:
The highest ranking within the age variable was for the age group: 15 - 25 years, in
which onset of schizophrenia occurs most commonly, followed by the age group: 25
55: This type ofage grouping is corroborated by Kaplan and Sadock (1998).
Gender:
Males tend to present with schizophrenia earlier (15-25 years). Females tend to
present with schizophrenia at a later age (25-35 years). As the prevalence of
schizophrenia is equal across gender, the rankings within the gender variable were
also kept the same (American Psychiatric Association, 1994).
Marital status:
Warner and de Girolamo (1995) found marital status to be associated with risk of
schizophrenia in several studies. The highest internal ranking will be for those single,
and then for those divorced, widowed/separated.
Location:
A strong correlation of schizophrenia and urbanisation has been found to exist (Torrey
and Bowler, 1990). High rates of schizophrenia are found in urban centres in
comparison to rural areas (Warner & de Girolamo, 1995). Demarcating precise
32
boundaries for areas considered 'urban' or rural is an ongoing problem for
demographers, and the boundaries always seem arbitrary (Yaukey, 1985). Defining
urban is therefore a matter ofdegree. 'Urban' features appear to correlate with
population size and distribution characteristics. Hence an urban centre would be
described as having a relatively large population, settled, and compacted in within an
area surrounded by an area with less dense population. Urban places with big
populations are 'more urban' than those with small populations. The most difficult
and arbitrary task is to decide the cut-off point for the smallest urban place. The
national census bureaus are relied upon to choose these cut-off points. This introduces
a problematic lack of standardisation into international comparisons, which explains
why there tends to be a greater level of confidence in the comparability of statements
a~out cities with larger population sizes, such as 100 000 and above, or 1 million and
above, as these are considered undoubtedly to be cities (Yaukey, 1985).
Population Density:
A strong correlation was found within cities that had a population of one million or
more; a weaker correlation with cities of 100000 to 500000 people. No correlation
was found in cities with less than 10 000 people (Kaplan & Sadock, 1998). As the
density of the population in KZN increased so the weighting of that variable would
Increase.
Seasonality ofbirth:
In the Southern Hemisphere, people with schizophrenia are more likely born between
July and September (Kaplan & Sadock, 1998). However, this variable will not be
included in the map of socio-demographic variables, as the census data (Central
Statistical Services, 1995) does not render the date of births of the SA population. It
will be discussed under the section dealing with the data on certified patients with
schizophrenia at FNH.
33
Socio-economic status:
The current international poverty line stands at an average per capita consumption of
US$ 1.00 per day (in 1985 dollars) (Gwatkin, 2000~ Poverty and Inequality in South
Africa, 1998). That would be an equivalent of about RJOO per month in South Africa.
The first internal variable ranking is allocated to that proportion of population
receiving no income, then those receiving between RI - R200 per month, and thirdly,
those receiving between R201 - R500 per month.
Occupation:
About 75 % of people with severe schizophrenia are unable to work and are
unemployed (Kaplan & Sadock, 1998). Those in employment had the lower rates of
all mental disorders (Andrews et aI, 2001). Among men in the workforce, a regular
increase in mental illness was found as the work status decreased (Timms, 1998;
Odegaard, 1956). The lowest occupation scale given by Census Data (Central
Statistical Services, 1995) is that of 'elementary occupations'.
Internal migration:
Despite inconsistent findings regarding migration and schizophrenia (Warner, 1985),
it is still considered an important factor in this study. It is pertinent to South Africa
because of the long history of migration labour laws forcing African men to migrate
from their homes to places of employment. Only those who have moved to KZN in
the period 1991-1996 will be considered.
Weighting within the variables
In this model, each variable was considered to be totally independent of each other.
All the variables were allocated the value of one with the exception of those variables
with more than one definition (see table 1). Two examples are given to explain the
34
weighting process. With regards to the variable of age, the literature (2.2.3.1) found
the 15-25 age group ofgreatest risk for schizophrenia followed by the 26-55 age
group. The 15-25 age group was therefore given twice (2) the amount ofweighting in
relation to the 26-55 age group (1). The variable ofmonthly income consisted of three
components. The highest risk was for those people receiving no income, and hence
the value of 3 was given to it. Those receiving Rl-200 per month were allocated the
value 2, and those receiving between R201-500 per month were given the value of 1.
Those receiving more than R500 per month were excluded and thereby given the
value ofO. Table one provides a summary of the definitions ofeach variable used and
the reciprocal weighting used.
Table 1: A summary of the definitions used for the socio-demographic variables
included in the study
VARIABLES DEFINITION WEIGHTING APPLIED
ASSOCIATED WITH WITHIN
SCHIZOPHRENIA VARIABLES
Age 15 - 25 2
26-55 1
Gender Male: 15-25 years 1
Female: 25 - 35 years 1
Seasonality ofbirth Born in Winter (between July and September) 0
Socio-econornic status No income 3
(Monthly Income) Between RI-200 per month 2
Between R201 - 500 per month 1
Rural / urban location Urban 1
Internal Migration Relocated in KZN between 1991 -1996 1
Marital status Single 2
Divorced! widowed/separated 1
Occupation Elementary occupations 1
Population density City of 1 million people or more Weighting increased with
500 000 - 100 000 people increased density
10 000 -500 000
Vanables of greater Importance were aSSIgned a higher Importance weIghtIng.
35
Mapping the variables
The IDRISI GIS software was utilized to layer each variable over KZN. The
accessibility model was based on the continuous data of the 1995 Census database
(Central Statistical Services, 1995) resulting in every pixel on the KZN map being
represented.
The nature of the GIS model used in this study did not allow for individual variables
or populations to be examined separately as it was in the combining of the variables
that best reflected the likelihood of suffering schizophrenia. The geographical patterns
of the individual variables would have to been examined prior to the modeling (This
fell out of the scope of the present study). Hence it was not possible to determine
~hich individual variable might have been more evident in the pattern of
schizophrenia.
The model's output (See map 4) visually displayed the geographical pattern of these
variables concentrated together. The darker areas on the map indicated the greater
number of variables overlapping. The greater the amount of overlap demonstrates a
greater proposed schizophrenia sensitivity of the population in that area. The model
output (Map 4) is relative of nature. The 6 levels of schizophrenia sensitivity evident
in the map indicate the natural breaks occurring within data ofthe model.
3.4.2.3 Working with the model's output
Percentage ofPopulation Overlap
The percentage of the population in KZN that fell into each range of schizophrenia
sensitivity was identified (See section 4.3.2).
Degree ofCorrelation
The correlation of overlap between the data of certified patients with schizophrenia
and the patterns identified by the geographical model for schizophrenia sensitivity
was determined (See section 4.3.3).
36
3.4.3 GEOGRAPHICAL ACCESSIBILITY
Ascertaining the geographical accessibility of the public hospitals to the KZN
population involved deciding on the variables to be utilised in the study, mapping the
variables and, working with the model's output.
3.4.3.1 Accessibility model
Defining and weighting the variables l
The following variables were used to define accessibility on the map:
1. distance of hospital from place ofresidence
2. road access
3. physical obstacles in between such as major river/nature reserve
4. financial cost (e.g. to pay for transport)
5. walking distance to the service.
Variables that posed more of a barrier in terms of hindering the accessibility to a
psychiatric health facility have been given a higher friction weighting (See 2.4.3:
Geographical accessibility model). These variables were overlaid to create the
accessibility model (See table 2). The friction costs were determined radially from the
health facilities currently offering psychiatric services. The accessibility model
provided only a relative indication of the difficulty in accessing the services provided
(Rushworth, 2002).
1 The GIS Unit obtained the river data from the Department of Water affairs; the Digital ElevationModel from The Department ofTraditional and Local Government Affairs; Game reserves informationfrom KZN Wildlife Services; Road input from the KZN Department of Transport; Population data wasobtained from 1996 census; and the actual co-ordinates of the Health facilities were collected usinghand held Geostationary Positioning Satelites (GPS).
37
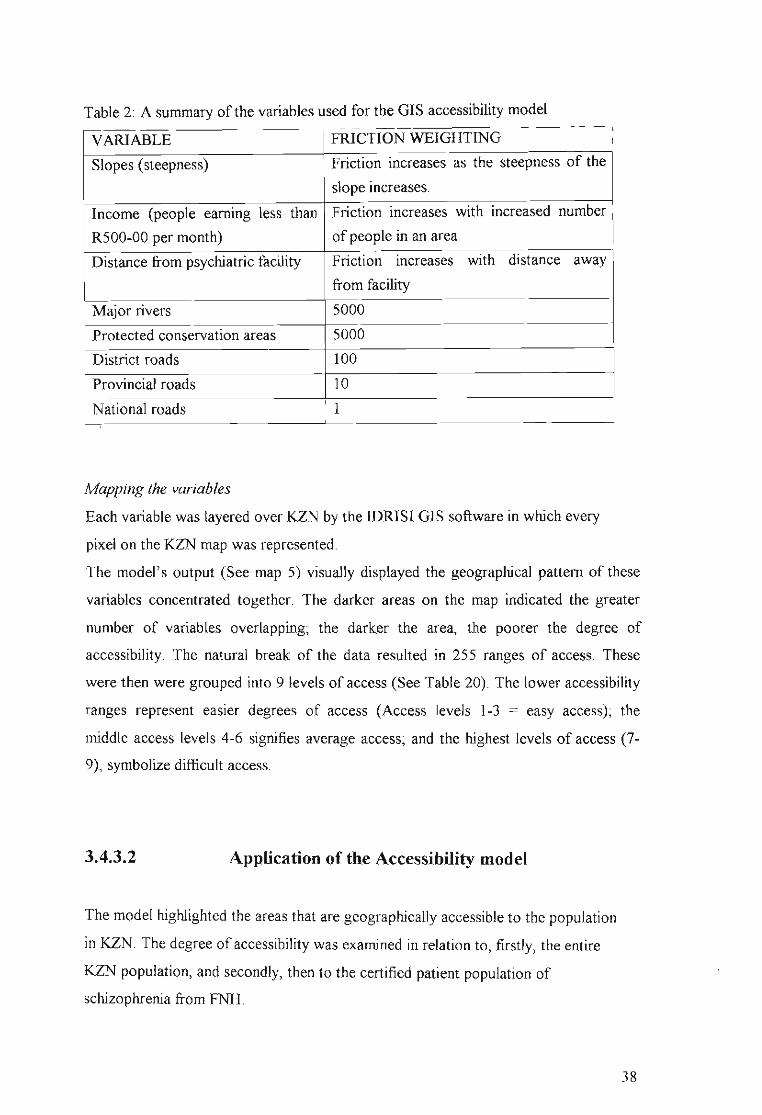
Table 2: A summary of the variables used for the GIS accessibility model
VARIABLE FRICTION WEIGHTING
Slopes (steepness) Friction increases as the steepness of the
slope increases.
Income (people earning less than Friction increases with increased number
R500-00 per month) of people in an area
Distance from psychiatric facility Friction increases with distance away
from facility
Major rivers 5000
Protected conservation areas 5000
District roads 100
Provincial roads 10
National roads 1
Mapping the variables
Each variable was layered over KZN by the IDRISI GIS software in which every
pixel on the KZN map was represented.
The model's output (See map 5) visually displayed the geographical pattern of these
variables concentrated together. The darker areas on the map indicated the greater
number of variables overlapping~ the darker the area, the poorer the degree of
accessibility. The natural break of the data resulted in 255 ranges of access. These
were then were grouped into 9 levels of access (See Table 20). The lower accessibility
ranges represent easier degrees of access (Access levels 1-3 = easy access)~ the
middle access levels 4-6 signifies average access; and the highest levels of access (7
9), symbolize difficult access.
3.4.3.2 Application of the Accessibility model
The model highlighted the areas that are geographically accessible to the population
in KZN. The degree ofaccessibility was examined in relation to, firstly, the entire
KZN population, and secondly, then to the certified patient population of
schizophrenia from FNH.
38
4.1
CHAPTER FOUR: RESULTS
DESCRIPTION OF KWAZULU NATAL (KZN)
KwaZulu Natal (KZN) is the largest of the nine provinces that constitute the Republic
of South Africa. It has a population of approximately 8.5 million people and covers
an area of 92 435 square kilometres. The province consists of 11 district councils
DC43. Each DC, except for the Durban DC, is made up of several local councils (See
Appendix, table 1). The district councils represent the health districts in the Public
Health system. The 1995 Census Data has been used and adapted to describe the
socio-demographic variables ofKZN. The KZN Health Department's GIS Unit
created the maps that were generated by this study.
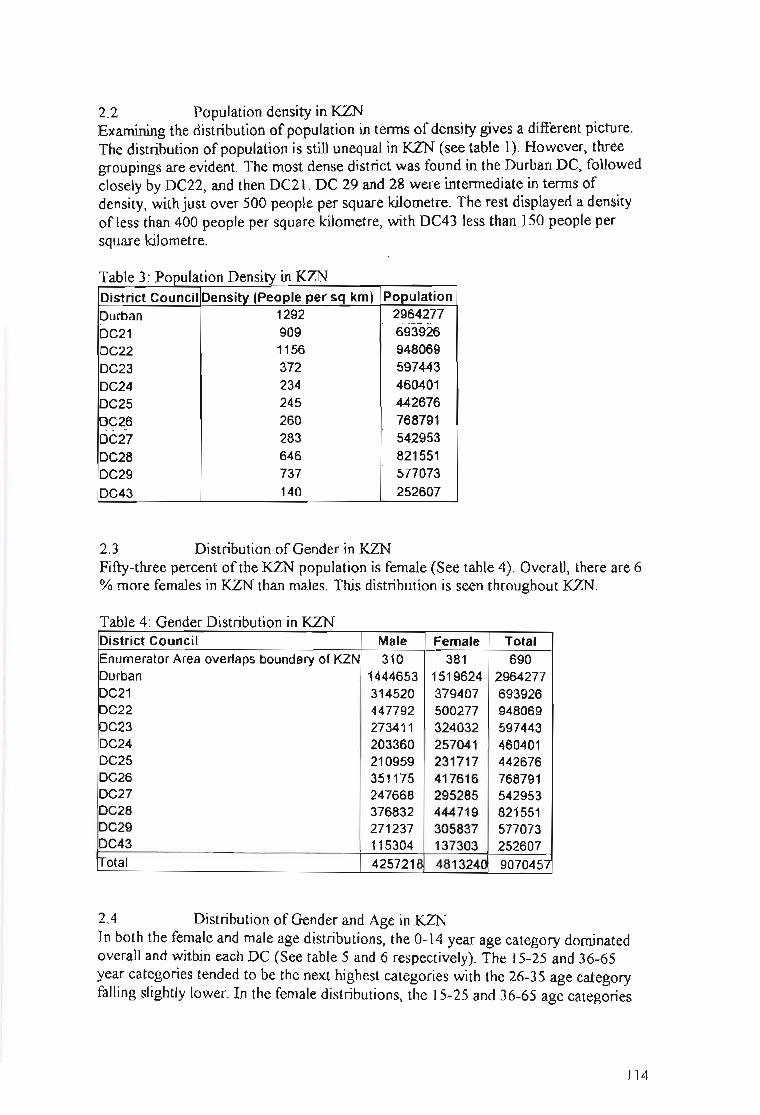
One-third of the KZN population resides within the Durban District, and fifty-three
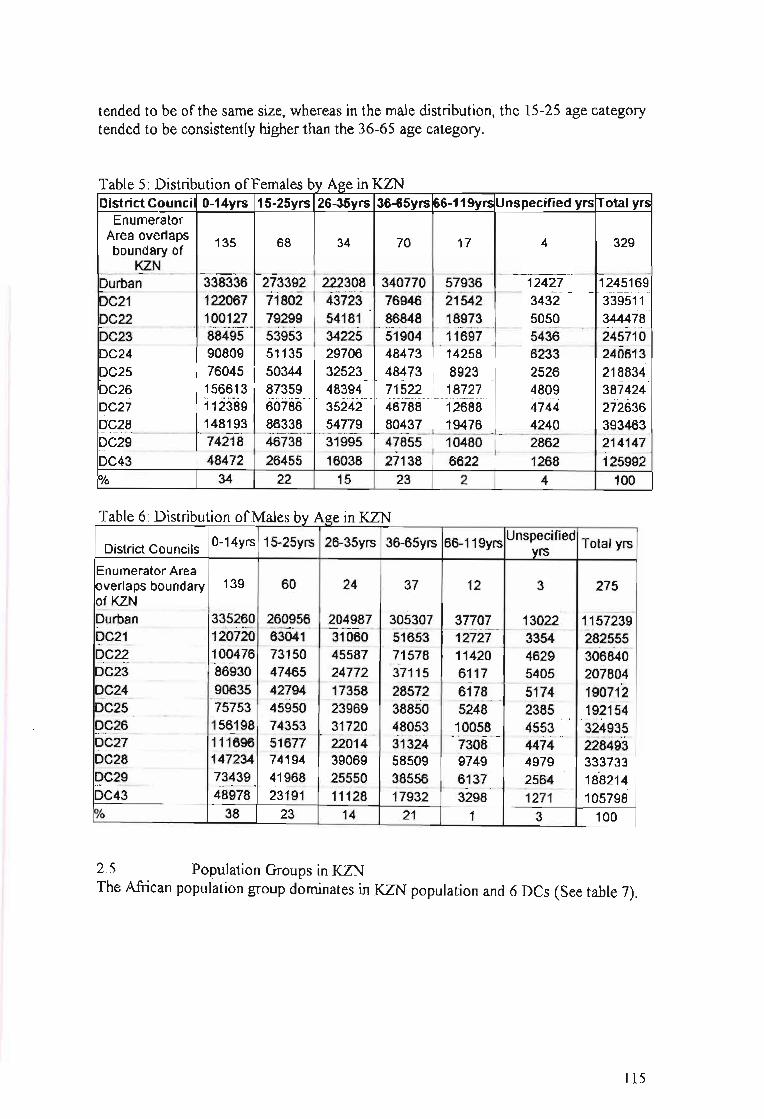
percent of this population is female. In both the female and male age distributions, the
0-14 year age category dominates. The 15-25 and 36-65 year age categories tended to
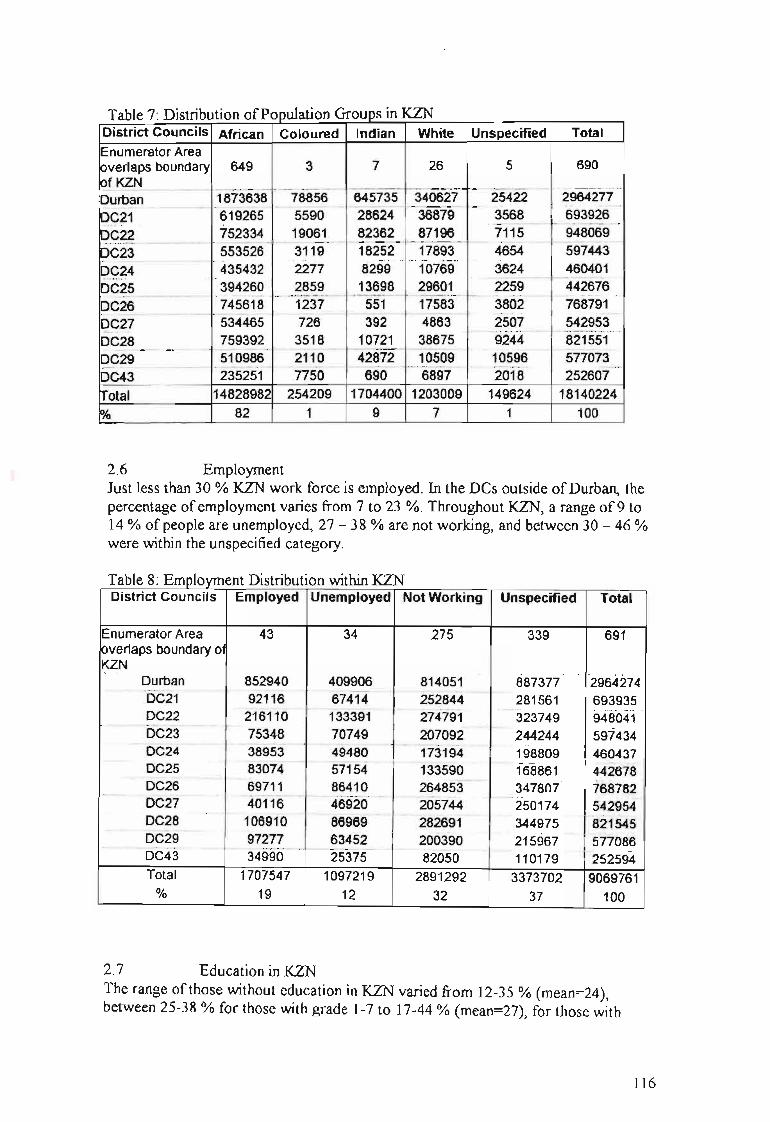
be the next highest groups. The African population group forms 82% of population. A
large percentage (21 %) of the population have no formal education. Twenty-nine
percent of those who have attended school have attained between grades 1 - 7
educational levels, 32 % have between grades 8-12, and only 3% have tertiary
education. Unemployment is high; with only one-quarter of the potential work force
employed. Thirty percent of the working population practice elementary occupations.
Sixty-three percent of the population receive no income, and 15 % receive between
RI - 1000. Six percent ofthe population have disabilities, with 0.5% being mental
disabilities although this figure may be under-reported. Seventy percent of the
population have never married while 25% are classified as married or living together.
Seventy-seven percent of the population reported never to have moved from each
respective DC.
39
4.2 DESCRIPTION OF PATIENT SAMPLE
The sample in this study consisted ofthe hospital records ofmale patients certified at
Fort Napier Hospital (FNH) in Pietermaritzburg, having received a primary diagnosis
of schizophrenia between 1 January 1995 and 31 December 1996. A total of61 5
records fulfilled these criteria. The records were accessed with the permission of the
ChiefMedical Superintendent of the Midlands Hospital Complex and data were
treated as confidential. The distribution of the patient population is described below.
4.2.1 Gender and cultural composition
The sample consisted of African1 male patients.
4.2.2 ~e
The majority of patients were between the age of 15 and 65 years (See table 3). The
most prevalent age cluster was 26-35 years, followed by the age cluster 15-25 years.
Table 3: Age Distribution
Age Groups 0-14yrs 15-25yrs 26-35yrs 36-65yrs 66-119yrs Unknown TOTAL
N 0 248 259 103 1 4 615
% 0 40 42 17 0.3 0.7 100
4.2.3 Marital Status
Seventy-two percent of the sample was not married (see table 4). Seventeen percent
were unknown while ten percent were married. A cultural marriage referred to having
more than one wife.
I Th~ group outlined in this study is not intended to perpetuate any racial stereotypes, but rather to takecogmsance of the prevalence of schizophrenia in the identified cultural group, as patients werepreviously treated in segregated facilities.
40
Table 4: Marital status
Marital Cultural
Status Unknown Single Separated Married Divorced Widowed Marriage TOTAL
N 105 441 2 64 1 1 1 615
% 17 72 0.3 10.4 0.1 0.1 0.1 100
4.2.4 Seasonality of Birth
Fifteen percent (93 cases) of the records contained dates of birth. Twenty-seven cases
(4%) had the first of January with varying years given as their birth dates, whenever
the actual birth date was unknown. It is common practise to allocate the first of
Januaty to people whose date ofbirth is unknown. The year used would give an
indication of the estimated age of the person. This data was therefore regarded as
unreliable and unsuitable for entry. Only 66 cases (eleven percent) of the data were
used.
There were fewer people (18%) born in autumn compared to the other seasons (See
Table 5). However, on closer examination discrepancies were found within each
season. Both in summer and winter, the first two months (December & January; June
& July, respectively) had almost twice the number ofpeople in relation to the last
month of that season, whereas there was a steady increase in the number ofpeople
born in the advancing spring months. In autumn the first month (March) contained 4
times more people than the next two autumn months. These figures are however too
small for statistical analysis or substantial interpretation.
41
Table 5: Seasonality ofBirth /Month ofBirth
Seasons of the Year in
Southern Hemisphere Month
December
TOTAL
n
7
7
4
5
6
8
%
11
11
5
12
3
3
l$U4···11
11
6
8
9
12
100
4.2.5 Employment
Fifty three percent of the sample was not employed, whereas thirteen percent were
employed (see table 6).
Table 6: Employment
Employment Yes No Unknown TOTAL
N 80 324 211 615% 13 53 34 100
4.2.6 Occupation
The occupational data was divided into the same categories used by the National
Census Data. The categories are: legislators, senior officials and managers;
42
professionals; technicians and associate professionals; clerks; service workers, shop
and market sales workers; skilled agricultural and fishery workers; craft and related
trades workers; plant and machine operators and assemblers; and elementary
occupations.
There were 205 entries filled in the occupation section of the files. Ninety-eight
entries were categorised according to the Census Data categories (see table 7). Of
those 98 entries, 67% worked in elementary occupations, 9 % did craft and related
trade work, 12% were plant and machine operators and assemblers, 5 % were either
service workers, shop and market sales workers or professionals and 1% were clerks.
Table 7: Occupation
Elementary Plant and Craft and Service Clerks Professionals
Occupations machine related ta'ade workers,
operators and workers shop and
assemblers market sales
workers
Subtype N Subtype n Subtype n Subtype n Subtype n Subtype n
Note: Italics highlights provincial hospitals; shaded areas indicate crossing of DCs betweenplace of referral and place of residence; Chc is abbreviation for Community Health Centre
51
Ma~ 3: Referral Patterns for PS'lchiatric Patients
Zwarenstien, M., Krige, D., & Wolff, B. (1991). The use ofa geographical
information system for hospital catchment area research in Natal/KwaZulu.
South African Medical Journal, 80, 497-500
110
APPENDIX 1: QUESTIONAIRE GIVEN TO THE 'EXPERTS'
NAME (OPTIONAL): _
MODELLING A COST MAP OF SENSITIVE POPULATIONS FORSCHIZOPHRENIA IN KZN
A.1. Identifying ten of the most important variables of risk in developingschizophrenia.The variables below have been listed randomly. These variables are to be seen astotally independent of each other. Please feel free to discuss and debate this sectionwith others.- age- gender-' education- marital status- seasonality of birth- occupation- socio-economic status- internal migration (e.g. have they moved in last year)- rural/urban location- population density: cities of 1million/ 100 000/ 10 aaa/less
A.2. Ranking the variables:Each person needs to rank these variables independently Le. without discussion.Where 1 is the most important variable in terms of developing schizophrenia; 10 isthe least.VARIABLE RANKINGAgeGenderEducationMarital statusSeasonality of birthOccupationSocio-economicstatusInternal MigrationRural/ urbanlocationPopulation density
111
A.3. Defining the variables:These definitions will then be put into map format.Please feel free to add further definitions and to make comments. Remember that many
b" erterms used are subiective and need to be defined to make them more 0 )Ie Ive.VARIABLE of RISK DEFINITIONAge 15 - 25 ++
26- 55 +Gender Male: 15-25 years
Female: 25 - 35 yearsEducation No education +++
Elementary education (Grade I to 7) ++Marital status Single and divorcedSeasonality of birth Born between July and SeptemberOccupation Unemployed / unskilledSocio-economic LowstatusInternal Migration Relocated to another area rural - urban +++
Relocated to another area rural- rural/ urban-urban ++Rural/ urban UrbanlocationPopulation density City of 1 million people +++
500 000 - 100 000 people ++10000+
MODELLING A COST FRICTION SERVICE MAP IN KZN
B.1. Accessibility: Cost Friction Service Map:In order to create the above map which aims to investigate the potential access for allof KZN people to clinics and hospital, per district; the term 'access' needs to defined.These definitions will then be put into map format.The variables that have been included are directed at the general public, could youcould think of any more that may be more specifically related to psychiatricpopulation (especially people with schizophrenia.
• distance to hospital• number of hospital and clinics• road access• physical obstacles in between s.a. major river/nature reserve• financial cost (travelling costs; hospital costs)• define effort (points allocated to above); decide cut off point where effort too
much•••
Thank you kindly for your time, assistance and co-operation.
Andrea Enslin18-11-01
112
APPENDIX 2: TABLES OF KZN CENSUS DATA
1. DESCRIPTION OF KWAZULU NATAL (KZN)
The province consists of 11 district councils (DC): Durban, DC21, DC22, DC23,DC24, DC25, DC26, DC27, DC28, DC29, and DC43. Except for Durban DC, eachDC is made up of several local councils (See table 1).
Table l' Local Councils within each District Council ofKZNDistrict Local CouncilsCouncilDurban -DC2l ~211,~212,~213,~214,~215,~216
DC22 ~221,~222,~223,~224,~225,~226,~227,~~2
DC23 ~232,~233,~234,~235,~236,~~3
DC24 ~241,~242,~244,~245
DC25 ~252,~253,~254
DC26 ~261,~262,~263,~265,~266
DC27 ~271,~272,~273,~274,~275,~~7
DC28 ~281,~282,~283,~284,~285,~286
DC29 ~291,~292,~293,~294
DC43 ~5al,~5a2,~5a3,~5a4,~5a5,~~43
2 DISTRIBUTION OF THE KZN SOCIO-DEMOGRAPIDCVARIABLES
2.1 Population distribution in KZNThirty three percent of the population were from Durban DC and 10 % from DC21.Each of the remaining DCs had less than 10% population (See table 2). This meansthat a third ofthe KZN population resided within the Durban DC.
T bl 2 PI' D" "b' "KZNa e opu atlon Istn utlOn In
District Council PopulationEnumerator Area overlaps boundary of KZN 691--_...__...._---_..__._----_._.._--_.._._._--_.._-....----_...__.---- --------_._----Durban 2964276DC21 693926DC22 948069DC23 597443DC24 460401DC25 442676DC26 768791DC27 542953DC28 821551DC29 577073DC43 252607Total 9070457
113
2.2 Population density in KZNExamining the distribution of population in terms of density gives a different picture.The distribution of population is still unequal in KZN (see table 1). However, threegroupings are evident. The most dense district was found in the Durban DC, followedclosely by DC22, and then DC21. DC 29 and 28 were intermediate in terms ofdensity, with just over 500 people per square kilometre. The rest displayed a densityof less than 400 people per square kilometre, with DC43 less than 150 people persquare kilometre.
Table 3' Population Density in KZNDistrict Council Density (People per sq km) Population
2.3 Distribution of Gender in KZNFifty-three percent of the KZN population is female (See table 4). Overall, there are 6% more females in KZN than males. This distribution is seen throughout KZN.
Table 4: Gender Distribution in KZNDistrict Council Male Female TotalEnumerator Area overlaps boundary of KZN 310 381 690Durban 1444653 1519624 2964277IDC21 314520 379407 693926DC22 447792 500277 948069DC23 273411 324032 597443DC24 203360 257041 460401DC25 210959 231717 442676DC26 351175 417616 768791DC27 247668 295285 542953DC28 376832 444719 821551DC29 271237 305837 577073DC43 115304 137303 252607~otal 425721S 4813240 9070457
2.4 Distribution of Gender and Age in KZNIn both the female and male age distributions, the 0-14 year age category dominatedoverall and within each DC (See table 5 and 6 respectively). The 15-25 and 36-65year categories tended to be the next highest categories with the 26-35 age categoryfalling slightly lower. In the female distributions, the 15-25 and 36-65 age categories
114
tended to be of the same size, whereas in the male distribution, the 15-25 age categorytended to be consistently higher than the 36-65 age category.
Table 5: Distribution ofFemales by Age in KZNDistrict Council 0-14yrs 15-25yrs 26-35yrs 36-65yrs 66-119yrs Unspecified yrs Total yrs
EnumeratorArea overlaps 135 68 34 70 17 4 329boundary of
2.6 EmploymentJust less than 30 % KZN work force is employed. In the Des outside ofDurban, thepercentage ofemployment varies from 7 to 23 %. Throughout KZN, a range of 9 to14 % of people are unemployed, 27 - 38 % are not working, and between 30 - 46 %were within the unspecified category.
Table 8: Employment Distribution within KZNDistrict Councils Employed Unemployed Not Working Unspecified Total
2.7 Education in KZNThe range ofthose without education in KZN varied from 12-35 % (mean=24),between 25-38 % for those with grade 1-7 to 17-44 % (mean=27), for those with
116
grade 8-12, and 1-5 % (mean=2) for those with post-matric qualifications (See table
9).
Table 9· Breakdown ofEducation in KZNDistrict No Gr 1-7 Gr 8-12 Post- Other Unspecif Less Total
Councils Schooling matric Qualifica ied than 5tions years old
2.8 Occupational Categories in KZNElementary occupations (30 %) is the dominant occupational category within KZN(See table 10).T bI 10 0 f I C t . KZNa e ccupalona a egones m
.: -g IIIIII Ill.!!.!! Q. III CIl 'C
~~iii 0-'" iii~ c_.!! cC'llC'll CIl.c~~ 'C i III 'CCIlC'll
.socu;U c·~TL§ 'C~CIll!! C'lIO
u·- 0 ~ u cn ...... c ...... li.5 l!!.- u :!~-;;~ ~iiii
"'c ~·2~ gi... .- • as 0 as- CIlCIl .- III III ~l!!E~ .i-t: _.c 0 -1ii:::l .- CIl·- c <3 c III III :liiGIi='"