Scho The V ool Committ Vision of the Ensur Servi Creat Conti impro tee Special E e Special Edu ring equitab cing student ting Special inuing to ass ovements as Education Su ucation Dep le resources ts in the Lea Education p sess the effe s needed ummary artment inc s and suppor st Restrictiv rogram stra ectiveness of ludes… rts in all scho e Environme nds that can f special edu S ools ent (LRE) n be located ucation prog Submitted By in one scho gramming an y: Laura Spe Ildefonso March 15 ol, reducing nd supportin ear Arellano , 2017 g transitions ng
Transcript
Scho
The V
ool Committ
Vision of the
Ensur
Servi
Creat
Conti
impro
tee Special E
e Special Edu
ring equitab
cing student
ting Special
inuing to ass
ovements as
Education Su
ucation Dep
le resources
ts in the Lea
Education p
sess the effe
s needed
ummary
artment inc
s and suppor
st Restrictiv
rogram stra
ectiveness of
ludes…
rts in all scho
e Environme
nds that can
f special edu
S
ools
ent (LRE)
n be located
ucation prog
Submitted By
in one scho
gramming an
y: Laura SpeIldefonso
March 15
ol, reducing
nd supportin
ear Arellano
, 2017
g transitions
ng
Special Ed
Out of District Coordinators
Lisa Michalak
Penny Smith
ducation Dep
Team EvaluatiCoordinators
Kate DeLisi (FH
Amy Karidoyan(Cameron & Bar
2‐way)
Barbara Maglio(Walsh & Potte
Natalia Kierul (FuBrophy)
Nancy Shor (McCarthy)
Ronnie Kessle(Stapleton & Wil
Mary Ann Gibb(Hemenway, Bar
& King)
Cristina Micha(BLOCKS)
partment Or
Laura Spear
Director
Ildefonso Arellano
Assistant Director
on s
HS)
nes bieri
one er)
ller &
er lson)
ons rbieri
ud
DepaHeads/Coord
Corinne F
Andrew(Phoenix
at
Susan StoDun
Patt
(DH at
rganizationa
artment /Program dinators
Nye (DH at FHS)
w Benedetti Coordinator FHS)
otzky (DH at nning)
ti Aiello
t BLOCKS)
Sp
Ph
Ed
Be
Vis
al Overview
Related Service Providers
peech and Language Pathologists (28)
Occupational Therapists (8)
hysical Therapist (1)
Adaptive Physical ducation Teacher (1)
BCBA/ABA Team
(Board Certified ehavior Analysts) (9)
Teacher of the sually Impaired (TVI)
(1)
Special E
Aeo
Bas
O
Education St
As of March 8ducation sernly financial
elow is a cos of March 8
Our percenta
o Marcho Marcho March
udent Summ
8, 2017, therrvices and 25lly responsib
mparison of8, 2017.
age has sligh
h, 2015‐ 23.7h, 2016‐ 23%h, 2017‐ 22.6
mary
re are 2038 52 of those ble for 245 o
f the special
tly decrease
7% % 6%
students (22students areof those stud
education n
ed over the p
2.6%) in Frame in out‐of‐ddents).
numbers at t
past 3 years.
mingham redistrict place
the beginnin
.
ceiving specments (we a
ng of the sch
cial are currently
ool year and
y
d
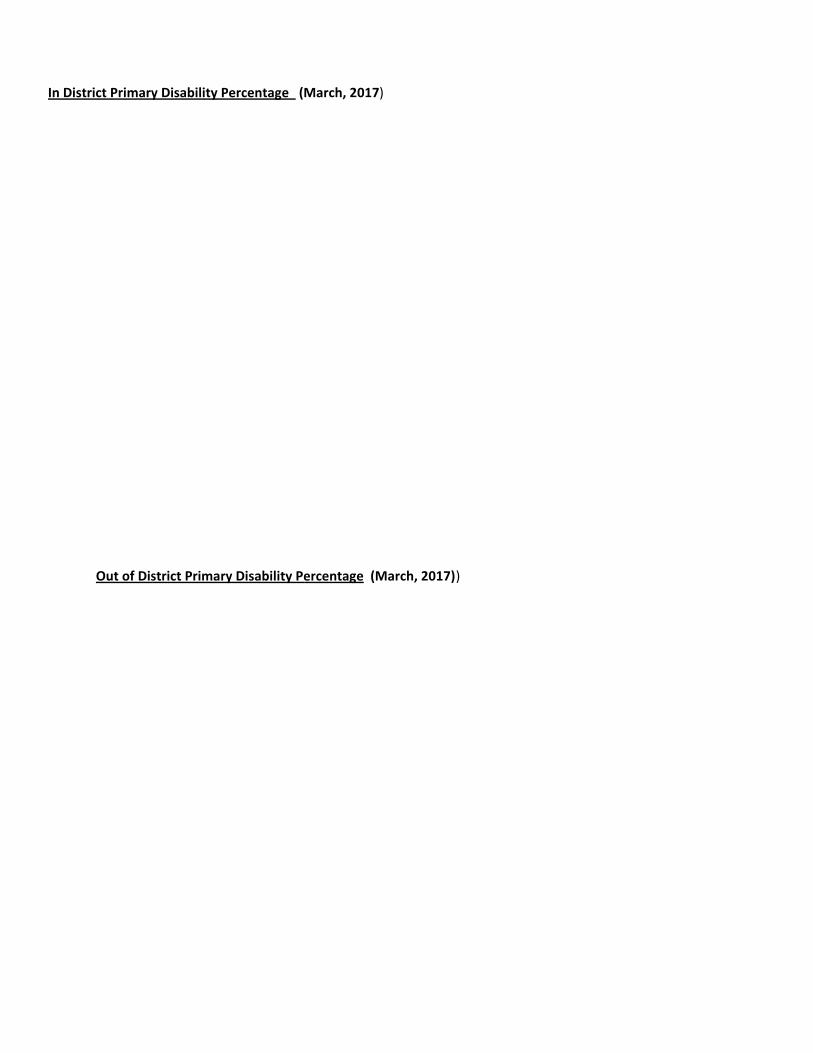
In Di
strict Primary
Out of Dis
Em
Co
E
y Disability P
strict Primary
Comm2
motional6.5%
Ph0
Multiple D1.0%
ommunication3.8%
Emotional31.8%
Physic0.0%
Multiple Dis2.9%
ercentage (
y Disability Pe
munication24.2%
ysical.1%
Disab.%
n
al
sab. H2
Spe
March, 2017)
ercentage (M
Health8.6%
S
Dev. D2.1%
Health2.9%
ecific Learnin0.8%
)
March, 2017))
Dev. De12.8%
Specific Learni12.2%
Delay%
gVision0.8%
)
elay%
ngSensory/Dea
0.1%
Intellectual10.0%
SensoryHea
8.4
Autism8.4%
N
Visio0.2
Intellectua2.3%
af Blind
Senso
Au23
Ne
y/Hard of aring4%
m%
Neurological23.2%
on%
l
ory/Hard of Hea0.4%
utism3.0%
eurological11.3%
Sensory D2.1
aring
Deaf/Blind%
Referral Data
Comparison Referral Data The data below reflects special education referrals during the first 4 months of the school year for the last three years. Special education referrals may include a related service evaluation (e.g., PT, OT, Speech, etc.), pyscho‐educational testing, or a combination of both.
2017‐2018 Specialized Program Locations
Over the past four years, great strides have been made in reducing the transitions for our specialized
programs and creating stands that can be housed in one school location from K‐5.
Multiple Disabilities Program Barbieri K‐5
Language and Learning Disabilities (LLD) Program McCarthy K‐5
Emotional Disability (ED) Program Stapleton K‐5
Autism (ASD) Program Dunning K‐5
Developmental Delay (DD) Program Hemenway K‐2 Barbieri 3‐5
Collapsing of The NECC Partnership Classroom at Dunning for the 2017‐2018 School Year
Framingham started the NECC Partnership Classroom in August, 2011. At the time, it was mutually beneficial for us programmatically and financially.
Circuit Breaker funding was very low and it was a cost savings to bring the NECC Partnership classroom to Framingham so that the students could remain in the least restrictive environment.
At the time, we had a full classroom of seven and at its’ peak two years ago, we had nine students in the classroom.
After looking at the cost projections for next year, along with having a reduced cohort of students now since some are going to be sixth graders, the NECC Partnership Classroom is no longer benefiting us from a financial standpoint.
The NECC Partnership Classroom has had a lasting positive impact on the internal Autism classrooms that we have at Dunning. The collaboration has only enhanced our own programming.
0
2
4
6
8
10
12
14
Percentage of Initial Special Education Referrals
December 2014
December 2015
December 2016
Program Review and Professional Development‐ Grant Funded
For the first time this year, we were instructed to use a small portion (2%) of the 240 Federal Special
Education Grant to improve student outcomes for special education students at Level 3 schools. Our
focus this year has been at Fuller where a consultant has been working with a team at Fuller to review
our Inclusion Program, assess the effectiveness of the program and ultimately create an action plan,
including professional development that can begin implementation next year.
The 274 Special Education Professional Development Grant has a continued focus on Social Emotional
Learning. This year, the grant is supporting the following:
o The Phoenix Program at the high school is in the third year of having focused professional development and coaching from Dr. Ross Greene’s group on the Collaborative and Proactive Solutions (CPS) model, formally known as Collaborative Problem Solving.
o The Emotional Disabilities (ED) programs at Stapleton and Cameron are participating in CPS
professional development for both special education and non‐special education staff.
o The remaining funds from this grant are supporting initiatives from the Department of Health
and Wellness, under Judy Styer’s direction, including professional development on Restorative
Justice and Social Emotional Learning (SEL).
Program Development for the 2017‐2018 School Year
We are excited to announce that we will be starting a middle school Multiple Disabilities Program at Cameron Middle School. (This program development was delayed one year due to us not having a large enough cohort of students to quantify starting a classroom.)
o Currently we only have a multiple disabilities program for students at BLOCKS and at Barbieri, Grades 1‐5.
o The program will start with three 6th grade students next year who will be coming from the Barbieri classroom.
o The average tuition cost per student at an out of district placement, including wheel chair transportation is $100,000.
o The District would be paying $300,000 per year for these 3 students. Over the course of their middle school years (3 years) the district would be paying a total of $900,000, minus circuit breaker funding that we are reimbursed from the state.
o By creating a program with some upfront costs for supplies, equipment and staffing, we will have a financial savings ensuring that the students remain in the least restrictive environment within their school communities.
Unit
T and Futur
There areadditionaintervent
After colout to all
We recenpreferred
re Professio
e approximaal 90 staff wtionist aides
laboration wl Unit T mem
ntly met to rd topics to th
nal Develop
ately 175 speho are a par, interventio
with Diane Mmbers in Janu
review the she staff next
pment
ecial educatirt of the Unitonist teache
Modest and Fuary.
urvey resultt year.
ion paraproft T group, inrs and librar
FTA represen
s and will be
fessionals (ancluding langry assistants
ntatives, a s
e determinin
assistant teaguage aides,.
hort survey
ng the next s
chers and ai classroom a
was develop
steps in brin
ides) and anaides,
ped and sen
ging the
t
MAP Growth Data Measures of Academic Progress (MAP) is an online assessment that is aligned to the Common Core standards. MAP assessments are used to measure each student’s progress or growth in school for Reading and Mathematics. All Middle Schools administered MAP for 6th and 7th grades. Only Fuller Middle School administered MAP for eighth grade. While our middle school special ed. students had observable growth at all grade levels, 6th and 7th grade special education students did not make the projected growth for the Winter 2017. Eighth grade special education students exceeded their growth projections during the Winter assessment from 2.0 to 4.9.
The tables below show the percentage of general education and special education students who met their growth projections during the Fall and Winter assessments.
190
200
210
220
Grade 6 Grade 7 Grade 8
Middle School MAP Data Special Education Student Growth Summary
Fall 2016
Winter 2017
0%
5%
10%
15%
20%
25%
30%
35%
40%
45%
50%
General Education Special Education General Education Special Education
6th Grade MAP Percentage of Student Growth Met
Fall to Fall Growth
Fall to Winter Growth
MATH READING
*Only Fuller Middle School administered MAP for eighth grade.
0%
10%
20%
30%
40%
50%
60%
70%
GeneralEducation
Special Education GeneralEducation
Special Education
7th Grade MAPPercentage of Student Growth Met
Fall to Fall Growth
Fall to Winter Growth
MATH READING
0%
10%
20%
30%
40%
50%
60%
70%
GeneralEducation
Special Education GeneralEducation
Special Education
8th Grade MAPPecentage of Student Growth Met
Fall to Fall Growth
Fall to Winter Growth
MATH READING
Coordinated Program Review (CPR)‐ Mid Cylcle 2017‐2018
The Special Education Department is audited every six years with a Coordinated Program Review (CPR).
The DESE was in Framingham for the student record review on November 24‐25, 2014.
We received the Final CPR report on May 8, 2015, met with the DESE liaison on May 28, 2015 and had our final Corrective Action Plan (CAP) due to the DESE no later than June 12, 2015.
Our Corrective Action Plan was approved in March, 2016.
The Mid Cycle Review (MCR) will be occurring during the 2017‐2018 school year. The Department will send staff for two days to our offices to review records, speak with some staff and ask for any additional documents necessary to conduct the review. They will focus the MCR on the following areas:
Adhering to timelines IEP Development Fine tuning the process when students turn 18 Documenting in detail why a student needs to receive instruction outside of the general
education classroom. Translating documents for parents Looking at instructional group size and ensuring that we are in compliance with
teacher/staff ratios. Reviewing the manifestation determination process Ensuring and documenting the special education training that occurs annually at each
building.
Challenges and their Impact on the Budget While the total percentage of special education students has slightly decreased this year, the complex social and emotional needs of our students continue to increase. Specifically, building leaders are seeing students at a much younger age, including as young as preschool age, exhibiting significant emotional disabilities. Last spring we were financially responsible for 236 out‐of‐district students. This year we have 246 students in out‐of‐district schools. The increase of 10 students can yield additional costs between $700,000‐1,000,000 for both tuition and transportation costs. Out of the 246 students placed in out‐of‐district schools, 24% are under the age of 12, including pre‐school age students. Just four years ago in June, 2013, 18% or our out‐of‐district students were under the age of 12. This notable spike supports the increased social and emotional need that principals are reporting. Unfortunately, FPS and the town will continue to feel the financial impact of the out‐of‐district tuitions.
Every year we experience cost increases that are beyond our control. Some of these increases include private school reconstruction costs and private school cost of living adjustment (COLA) increases. Currently the SY18 Reconstruction increases total $85,000 and the SY18 COLA increase is estimated at $275,000. These are two examples of unpredictable costs that significantly impact the budget each year. Since July, 2016, we have also experienced a $500,000 increase in tuition costs due to students moving into Framingham. Another important piece of data to look at regarding out‐of‐district placements is the range of tuition cost. Last year at this time, 28 students were in placements that were more than $100,000 and 2 students were in placements that were more than $200,000. One year later, we have 39 students in programs that cost more than $100,000 and 4 students who are in programs that cost more than $200,000.
In an effort to mitigate the increasing costs of out‐of‐district placements, we continue to develop internal programs to support our students. Next year, we are starting a middle school classroom for students with multiple disabilities. Typically the students would be placed in out‐of‐district schools after 5th grade. We are excited that the students will continue to be a part of our school community.
The $100
Auti
information0,000. Currently The tuitio Therefor
sm In‐Distri There are Of the 21 The high
intensive We have
lower tha The Spec
programwith Aut
below prov
y our 246 ouon for thesee the other
ct and Out‐oe 210 studen10 students,lighted tuitioe level of ser an additionan $100,000cial Educatioming from pism are rece
vides a break
ut‐of‐district 39 placeme207 student
of‐District Cnts in Framin55 require aons listed bervice. nal 26 studen0. n Departmepre‐school theiving suppo