SCHOOL ACCOUNTABILITY REPORT CARD Reported for 2011-12 School Year - Published in 2012-13 SAN MARCOS HIGH SCHOOL 1615 San Marcos Blvd., San Marcos, CA 92078-4020 (760) 290-2200 • FAX (760) 736-8275 Julie Mottershaw, Principal E-mail Address: [email protected]CDS Code: 37737913737632 Board of Trustees Beckie Garrett Sharon Jenkins Janet McClean Jay Petrek Randy Walton Administration Kevin D. Holt, Ed.D. Superintendent Gina Bishop Assistant Superintendent Instructional Services Brad Lichtman Assistant Superintendent Human Resources Gary Hamels Assistant Superintendent Business Services Contents About This Report Card About This School Major Achievements Focus For Improvement Climate For Learning Support Staff School Facilities Instructional Planning & Scheduling Teachers Instructional Materials Specialized Services School Finance Student Performance Accountability School Completion & Postsecondary Preparation Phone: 760.752.1299 FAX: 760.471.4928 www.smusd.org San Marcos Unified School District 255 Pico Avenue, Suite 250 San Marcos, CA 92069
Transcript
SCHOOL ACCOUNTABILITY REPORT CARD Reported for 2011-12 School Year - Published in 2012-13
SAN MARCOS HIGH SCHOOL 1615 San Marcos Blvd., San Marcos, CA 92078-4020
Every school in California is required by state law to publish a School Accountability Report Card (SARC), by February 1st of each
year. The SARC contains information about the condition and performance of each California public school.
For more information about SARC requirements, see the California Department of Education (CDE) SARC Web page at http://
www.cde.ca.gov/ta/ac/sa.
For additional information about the school, parents, and community members please contact the school principal or the
district office.
Data and Access:
Ed-Data Partnership Web Site:
Ed-Data is a partnership of the CDE, EdSource, and the Fiscal Crisis and Management Assistance Team (FCMAT) that provides
extensive financial, demographic, and performance information about California’s public kindergarten through grade twelve school
districts and schools. Ed-Data can be located online at http://www.ed-data.k12.ca.us.
DataQuest Web Site: DataQuest is an online data tool located at http://dq.cde.ca.gov/dataquest/ that contains additional information about this school and comparisons of the school to the district, the county, and the state. Specifically, DataQuest is a dynamic system that provides reports for accountability (e.g., state Academic Performance Index [API], Adequate Yearly Progress [AYP], test data, enrollment, high school graduates, dropouts, course enrollments, staffing, and data regarding English learners.
Internet Access: Internet access is available at public libraries and other locations that are publicly accessible (e.g., the California State Library). Access to the Internet at libraries and public locations is generally provided on a first-come, first-served basis. Other use restrictions include the hours of operation, the length of time that a workstation may be used (depending on availability), the types of software programs available on a workstation, and the ability to print documents.
Mission Statement San Marcos High School, a partnership of students, staff, parents, and community, is committed to developing the academic, social, emotional, and physical well-being of students through an engaging and rigorous learning environment.
Principal’s Message San Marcos High School adheres to a vision of high academic rigor and personal growth for ALL students. We are a professional, collaborative, community of learners providing a quality education on a safe and orderly campus. We have an outstanding record based upon a philosophy of continuous improvement, an academic belief that all of our students can learn, a professional teaching staff committed to helping our students master the curriculum, and a student body dedicated to academic excellence. Our student body is diverse and multicultural, very similar to that of the state of California as a whole. We are proud of our cultural diversity and believe it enriches the environment in which our students learn. We are honored to serve the needs of all our students in a culture of Knight Pride where we are committed to leading...now, tomorrow, and forever.
Parental Involvement Name of contact person: Cathy Tarquini Phone number of contact: (760) 290-2200 Parents are welcome at SMHS and play an important part in our success. They participate in School Site Council, English Language Advisory Committee (ELAC), Parent orientation, registration, Eighth Grade Parent Night, Parent Forums, Pre AP Parent Night, A Day With A Knight, Valley of Discovery Educational Foundation, and WASC accreditation.
Our Parent-Teacher Organization (PTO) is a strong supporter and partner with the school and projects during the school year. They assist with staff morale, graduation night, campus beautification, online grading program, phone notification system, classroom supplies, teacher wish lists, and the parent newsletter.
ABOUT THIS SCHOOL
ABOUT THIS REPORT CARD
SCHOOL ACCOUNTABILITY REPORT CARD PAGE 2
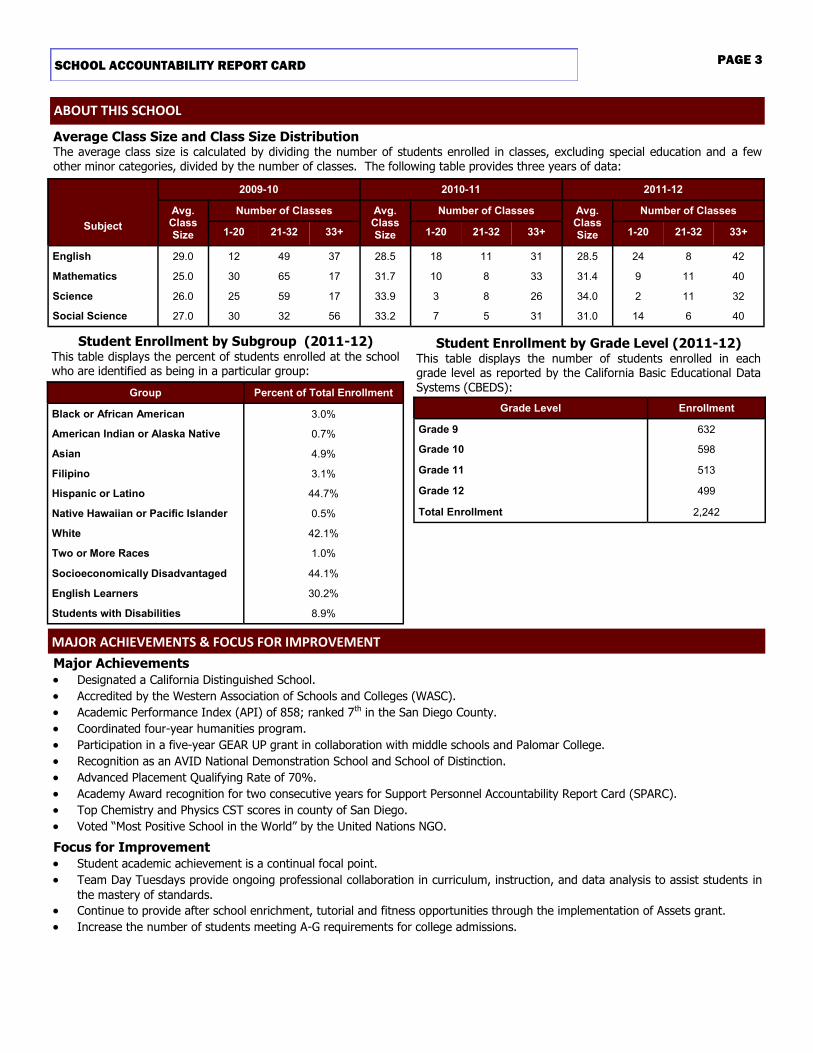
Average Class Size and Class Size Distribution The average class size is calculated by dividing the number of students enrolled in classes, excluding special education and a few other minor categories, divided by the number of classes. The following table provides three years of data:
Major Achievements
Designated a California Distinguished School.
Accredited by the Western Association of Schools and Colleges (WASC).
Academic Performance Index (API) of 858; ranked 7th in the San Diego County.
Coordinated four-year humanities program.
Participation in a five-year GEAR UP grant in collaboration with middle schools and Palomar College.
Recognition as an AVID National Demonstration School and School of Distinction.
Advanced Placement Qualifying Rate of 70%.
Academy Award recognition for two consecutive years for Support Personnel Accountability Report Card (SPARC).
Top Chemistry and Physics CST scores in county of San Diego.
Voted “Most Positive School in the World” by the United Nations NGO.
Focus for Improvement Student academic achievement is a continual focal point.
Team Day Tuesdays provide ongoing professional collaboration in curriculum, instruction, and data analysis to assist students in
the mastery of standards.
Continue to provide after school enrichment, tutorial and fitness opportunities through the implementation of Assets grant.
Increase the number of students meeting A-G requirements for college admissions.
SCHOOL ACCOUNTABILITY REPORT CARD PAGE 3
Student Enrollment by Subgroup (2011-12) This table displays the percent of students enrolled at the school who are identified as being in a particular group:
Student Enrollment by Grade Level (2011-12) This table displays the number of students enrolled in each grade level as reported by the California Basic Educational Data Systems (CBEDS):
Grade Level Enrollment
Grade 9 632
Grade 10 598
Grade 11 513
Grade 12 499
Total Enrollment 2,242
ABOUT THIS SCHOOL
MAJOR ACHIEVEMENTS & FOCUS FOR IMPROVEMENT
School Safety SB187 Safety Plan Date the plan was last updated: September 20, 2012 Date the plan was last reviewed with staff: October 17, 2012 The Comprehensive Safe School Plan includes data regarding crime, safe school procedures and compliance with laws including: (1) child abuse reporting, (2) disaster response, (3) suspension and expulsion policies, (4) notification of teachers of dangerous pupils, (5) sexual harassment, (6) schoolwide dress codes prohibiting gang-related apparel, (7) procedures for safe ingress and egress from school, (8) procedures to ensure a safe and orderly environment conducive to learning, and (9) rules and procedures on school discipline adopted pursuant to Ed Code Sections 35291 and 35291.5. A copy of the plan is available for inspection by the public at each school.
To maintain a safe environment, we have a closed campus, and all visitors must register with security. Seniors who maintain a 3.0 grade point average or above and have parental and administrative permission may walk off campus for lunch. We hold fire, earthquake, disaster, and armed intruder lockdown drills throughout the school year.
We provide a safe and secure learning environment and consistently monitor student behavior. We work with the city and sheriff’s department to minimize traffic and parking problems.
Discipline San Marcos High School has a three-pronged approach to discipline: classroom, counseling, and administration. All teachers set classroom guidelines at the beginning of the school year, with consequences and rewards clearly delineated. Classroom teachers work closely with parents to address initial behavior problems. If needed, counseling intervention is sought, and as a last resort students are referred to the administration.
We believe that students need to be held responsible for their behavior and disruptive students can impede learning. We also believe that it is often not fruitful to suspend students and bar them from attending school; our progressive discipline policy meets most situations. In extreme cases, of suspension or expulsion, parents must meet with an administrator. We have a “zero tolerance” policy for weapons, drugs, and threats. We also have a clear behavior code with specific consequences.
Suspensions and Expulsions This table displays the rate of suspensions and expulsions (the total number of incidents divided by the total enrollment) at the school and district levels for the most recent three-year period.
Attendance The attendance rate of teachers and students is one indicator of how connected they are to our school and how committed they are to teaching and learning. The truancy rate for students is defined by the State of California as any student with 3 or more unexcused absences. The truancy rate for San Marcos High School for 2011-12 was 29%.
Specialized Resource Staff The following table lists the number of full-time equivalent qualified support personnel who provide counseling and other pupil support services in our school. These specialists often work part-time at our school and some may work at more than one school in our district.
* One Full-Time Equivalent (FTE) equals one staff member working full-time; one FTE could also represent two staff members who each work 50 percent of full-time.
Rate
School District
2009-10 2010-11 2011-12 2009-10 2010-11 2011-12
Suspensions 12.8% 7.7% 9.5% 6.7% 4.6% 4.7%
Expulsions 0.6% 0.6% 0.6% 0.5% 0.4% 0.4%
SCHOOL ACCOUNTABILITY REPORT CARD PAGE 4
CLIMATE FOR LEARNING
Title Number of FTE* Assigned to School
Average Number of Students per Academic Counselor
Academic Counselor 4.0 560.5
Library Media Services Staff (paraprofessional) 1.0
Psychologist 1.0
Nurse (4.6 FTE’s) Shared District-Wide
Resource Specialist (non-teaching) 1.0
SUPPORT STAFF
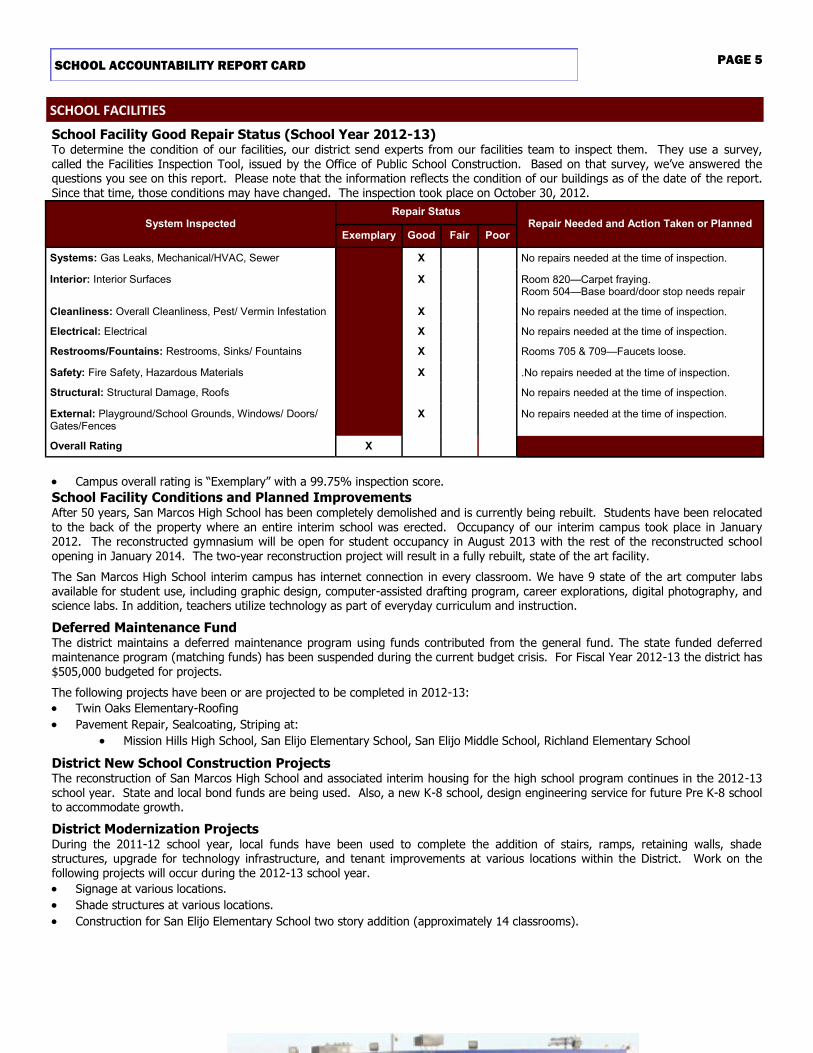
School Facility Good Repair Status (School Year 2012-13) To determine the condition of our facilities, our district send experts from our facilities team to inspect them. They use a survey, called the Facilities Inspection Tool, issued by the Office of Public School Construction. Based on that survey, we’ve answered the questions you see on this report. Please note that the information reflects the condition of our buildings as of the date of the report. Since that time, those conditions may have changed. The inspection took place on October 30, 2012.
Campus overall rating is “Exemplary” with a 99.75% inspection score.
School Facility Conditions and Planned Improvements After 50 years, San Marcos High School has been completely demolished and is currently being rebuilt. Students have been relocated to the back of the property where an entire interim school was erected. Occupancy of our interim campus took place in January 2012. The reconstructed gymnasium will be open for student occupancy in August 2013 with the rest of the reconstructed school
opening in January 2014. The two-year reconstruction project will result in a fully rebuilt, state of the art facility.
The San Marcos High School interim campus has internet connection in every classroom. We have 9 state of the art computer labs available for student use, including graphic design, computer-assisted drafting program, career explorations, digital photography, and science labs. In addition, teachers utilize technology as part of everyday curriculum and instruction.
Deferred Maintenance Fund The district maintains a deferred maintenance program using funds contributed from the general fund. The state funded deferred maintenance program (matching funds) has been suspended during the current budget crisis. For Fiscal Year 2012-13 the district has $505,000 budgeted for projects.
The following projects have been or are projected to be completed in 2012-13:
Twin Oaks Elementary-Roofing
Pavement Repair, Sealcoating, Striping at:
Mission Hills High School, San Elijo Elementary School, San Elijo Middle School, Richland Elementary School
District New School Construction Projects The reconstruction of San Marcos High School and associated interim housing for the high school program continues in the 2012-13 school year. State and local bond funds are being used. Also, a new K-8 school, design engineering service for future Pre K-8 school to accommodate growth.
District Modernization Projects During the 2011-12 school year, local funds have been used to complete the addition of stairs, ramps, retaining walls, shade structures, upgrade for technology infrastructure, and tenant improvements at various locations within the District. Work on the following projects will occur during the 2012-13 school year.
Signage at various locations.
Shade structures at various locations.
Construction for San Elijo Elementary School two story addition (approximately 14 classrooms).
SCHOOL ACCOUNTABILITY REPORT CARD PAGE 5
SCHOOL FACILITIES
System Inspected
Repair Status Repair Needed and Action Taken or Planned
Exemplary Good Fair Poor
Systems: Gas Leaks, Mechanical/HVAC, Sewer X No repairs needed at the time of inspection.
Maintenance and Repair District maintenance staff ensures that the repairs necessary to keep the school in good repair and working order are completed in a timely manner. A work order process is used to ensure efficient service and that emergency repairs are given the highest priority.
Cleaning Process and Schedule The district governing board has adopted cleaning standards for all schools in the district. A summary of these standards is available at the school office and at the district office. The principal works daily with the custodial staff to develop cleaning schedules to ensure a clean and safe school.
Professional Development San Marcos Unified School District is committed to the belief that the strongest predictor of student achievement is the quality of the teacher inside the classroom. In support of this belief SMUSD is deeply committed to teacher learning and professional development
as evidenced by our district mission statement.
San Marcos Unified School District’s Mission Statement includes these commitments:
“hiring and retaining only the best educators and investing in their success”
“providing quality education based on high standards, effective practices, continuous improvement, and innovation.”
Every new teacher and administrator in our district is engaged in a rigorous 2 year training program where they receive a minimum of 30 hours of professional development on our research based instructional framework, the Essential Elements of Instruction (EEI). These instructional strategies are applicable to any curricular area and any grade level. Additionally we have established a cadre of teacher leaders to assist their site administrators in supporting more veteran staff in refining their implementation of EEI.
The district has focused on three priorities over the past several years: standards-based instruction; effective instructional strategies, and professional collaboration. During the 2011-12 school year, the main focus of San Marcos Unified School District Professional Development was the use of effective strategies for making content understandable, particularly for English language learners, and providing all students with rigorous learning activities aligned to the state content standards. All teachers had one day of professional development conducted at their school on either August 22 or 23. In addition, principals provided staff development during regularly
scheduled staff meetings (8 hours) throughout the year.
Selected groups of teachers began work on curriculum committees to learn about the expectations of the newly adopted Common Core Standards. Another group of teachers was trained in how to design inquiry lessons and use technology to support learners in the process. These groups of teachers will work with other teachers within the district in subsequent years.
Teachers engage in professional development each week as they work collaboratively during their structured teacher collaboration time (early release Wednesdays for elementary and middles school teachers or late-start Tuesdays for high school teachers). Teachers have the opportunity to share best practices and analyze data on student performance to plan interventions and enrichments to meet students’ needs.
SCHOOL FACILITIES
INSTRUCTIONAL PLANNING AND SCHEDULING
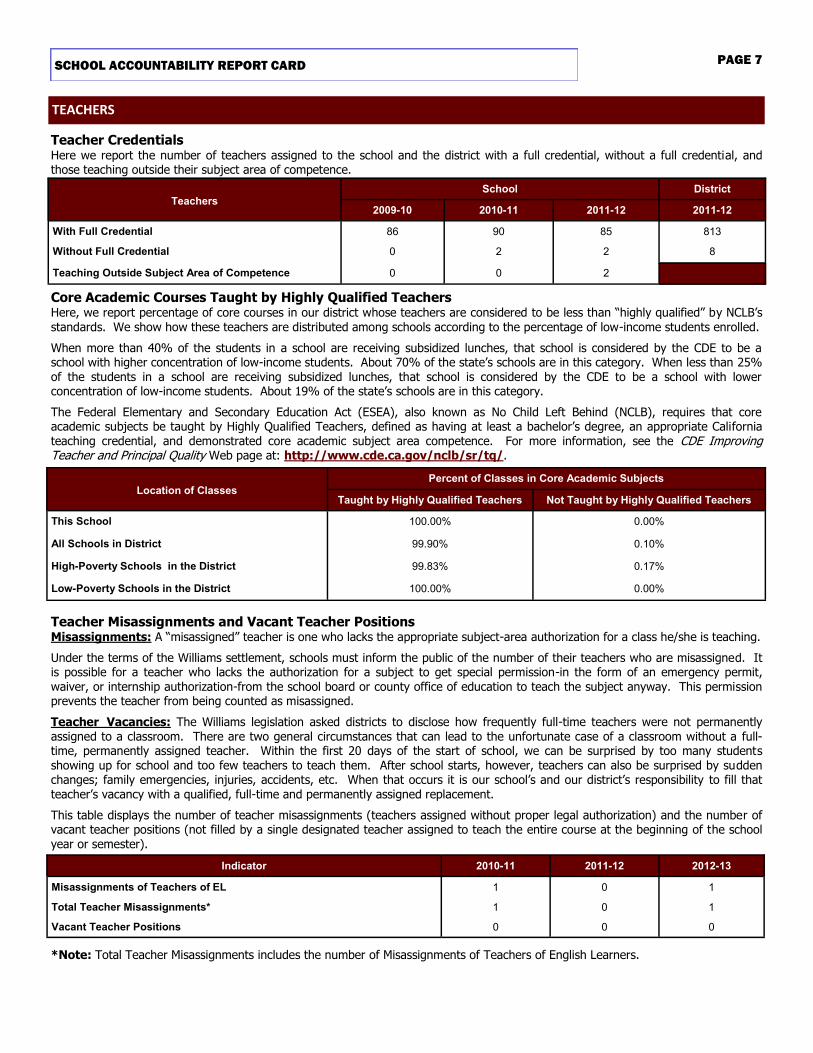
Teacher Credentials Here we report the number of teachers assigned to the school and the district with a full credential, without a full credential, and those teaching outside their subject area of competence.
Core Academic Courses Taught by Highly Qualified Teachers Here, we report percentage of core courses in our district whose teachers are considered to be less than “highly qualified” by NCLB’s
standards. We show how these teachers are distributed among schools according to the percentage of low-income students enrolled.
When more than 40% of the students in a school are receiving subsidized lunches, that school is considered by the CDE to be a school with higher concentration of low-income students. About 70% of the state’s schools are in this category. When less than 25% of the students in a school are receiving subsidized lunches, that school is considered by the CDE to be a school with lower concentration of low-income students. About 19% of the state’s schools are in this category.
The Federal Elementary and Secondary Education Act (ESEA), also known as No Child Left Behind (NCLB), requires that core academic subjects be taught by Highly Qualified Teachers, defined as having at least a bachelor’s degree, an appropriate California teaching credential, and demonstrated core academic subject area competence. For more information, see the CDE Improving Teacher and Principal Quality Web page at: http://www.cde.ca.gov/nclb/sr/tq/.
Teacher Misassignments and Vacant Teacher Positions Misassignments: A “misassigned” teacher is one who lacks the appropriate subject-area authorization for a class he/she is teaching.
Under the terms of the Williams settlement, schools must inform the public of the number of their teachers who are misassigned. It is possible for a teacher who lacks the authorization for a subject to get special permission-in the form of an emergency permit, waiver, or internship authorization-from the school board or county office of education to teach the subject anyway. This permission prevents the teacher from being counted as misassigned.
Teacher Vacancies: The Williams legislation asked districts to disclose how frequently full-time teachers were not permanently assigned to a classroom. There are two general circumstances that can lead to the unfortunate case of a classroom without a full-time, permanently assigned teacher. Within the first 20 days of the start of school, we can be surprised by too many students showing up for school and too few teachers to teach them. After school starts, however, teachers can also be surprised by sudden changes; family emergencies, injuries, accidents, etc. When that occurs it is our school’s and our district’s responsibility to fill that teacher’s vacancy with a qualified, full-time and permanently assigned replacement.
This table displays the number of teacher misassignments (teachers assigned without proper legal authorization) and the number of vacant teacher positions (not filled by a single designated teacher assigned to teach the entire course at the beginning of the school year or semester).
*Note: Total Teacher Misassignments includes the number of Misassignments of Teachers of English Learners.
SCHOOL ACCOUNTABILITY REPORT CARD PAGE 7
TEACHERS
Indicator 2010-11 2011-12 2012-13
Misassignments of Teachers of EL 1 0 1
Total Teacher Misassignments* 1 0 1
Vacant Teacher Positions 0 0 0
Percent of Classes in Core Academic Subjects Location of Classes
Taught by Highly Qualified Teachers Not Taught by Highly Qualified Teachers
Reading and Writing: San Marcos Unified School District High Schools offer a coordinated, sequenced curriculum in Humanities blending English and Social Science. These courses are offered at each grade level and are designated as College Prep and Honors. A full array of Language Arts and Social Science Advanced Placement courses are also offered. The Humanities curriculum was created with the college preparatory student in mind. Students develop analytical and interpretative skills. Students create written syntheses incorporating a variety of sources making meaningful connections between history concepts and literature.
Math: All of our mathematics courses are aligned to the California content standards for mathematics. A high number of our ninth grade students have successfully completed Algebra I in middle school and successfully complete Geometry as ninth graders. Course offerings include Algebra II, trigonometry, calculus, statistics and discrete math. We offer college preparatory, honors, and Advanced Placement courses.
Science: All science courses are aligned to the California content standards for science. SMUSD students have the opportunity to enroll in biology, medical biology, biochemistry, earth and physical science, chemistry, physics, biotech lab, and genetics. Additionally, several AP science classes are offered for students interested in taking a college level science course.
Social Studies: Ninth and tenth grade students take World Studies I and II, while eleventh and twelfth graders enroll in American Studies I and II. We also offer college preparatory, honors, and Advanced Placement courses. The Humanities curriculum was created with the college preparatory student in mind. Students develop analytical and interpretative skills. Students create written syntheses incorporating a variety of sources making meaningful connections between history concepts and literature. Students practice skills necessary for higher level classes (Advanced Placement/Honors) and college.
Quality, Currency, and Availability of Textbooks and Instructional Materials (School Year 2012-13) This table displays information about the quality, currency, and availability of the standards-aligned textbooks and other instructional materials used at the school; whether the textbooks and instructional materials are from the most recent adoption (yes/no); and information about the school’s use of any supplemental curriculum or non-adopted textbooks or instructional materials. The adoption of the resolution regarding sufficiency of instructional and supplemental instructional materials for fiscal year 2012-2013 pursuant to Education Code Sections 60119, 60422(b) and 60451 was done on September 10, 2012.
Teacher Assignment In addition to teaching five periods of class each day, many of our staff members are involved as team leaders, school group leaders, coaches for after school sports, Associated Student body (ASB) advisor, yearbook coordinators, Athletic Director, California Scholarship Federation (CSF) advisor, National Honor Society advisor, Advanced Placement (AP) coordinator, and club advisors.
CURRICULUM AND INSTRUCTIONAL MATERIALS
Core Curriculum Area
Textbooks and Instructional Materials
Year of Adoption
From the Most Recent Adoption (Yes or No)
Percent of Students Lacking Their Own Assigned Copy
Language Arts Literature and Language Arts 2003 Yes 0%
Mathematics Calculus of a Single Variable 2007 Yes 0%
Mathematics California Math Review 2005 Yes 0%
Mathematics Algebra 2/Geometry 2008 Yes 0%
Mathematics Algebra 1 2008 Yes 0%
Mathematics Pre-Calculus 2008 Yes 0%
Science Chemistry/ Biology 2005 Yes 0%
Science Physics: Principals and Problems 2005 Yes 0%
Science Modern Earth Science 2003 Yes 0%
Social Studies Ancient/ Modern World History/Americans 2006 Yes 0%
Social Studies Government in America 2011 Yes 0%
Social Studies Economics 2006 Yes 0%
SCHOOL ACCOUNTABILITY REPORT CARD PAGE 9
Specialized Programs Advancement Via Individual Determination, AVID, is a college preparatory program for students in the middle who are often economically disadvantaged and underachieving. It enables disadvantaged secondary students to succeed in rigorous curricula, enter mainstream activities in school, and increase their opportunities to enroll in four-year colleges. We currently have eight AVID sections in our master schedule. 42 out of 44 AVID seniors were accepted to four year universities.
The Humanities curriculum was created with the college preparatory student in mind. Students develop analytical and interpretative skills. Students create written syntheses incorporating a variety of sources making meaningful connections between history concepts and literature. Students create written syntheses incorporating a variety of sources making meaningful connections between history concepts and literature. Students practice skills necessary for higher level classes (Advanced Placement/Honors) and college.
Gifted and Talented Education: San Marcos High School has a curricular program specifically designed for our Gifted and Talented students. These honors courses have greater depth and complexity than college preparatory classes and are taught at a faster pace. All students have open access to challenge our Advanced Placement and Honors’ classes with no recommendations or minimal standards required for admittance. Our instructors have completed subject specific training for AP and Honors classes through College Board.
Special Education Program: Students with moderate to severe learning differences are entitled to individual education plans and extra attention. Special needs students receive the support services they require from twelve special education teachers, a speech therapist, a part-time psychologist, psychology intern, and a vocational counselor. We teach job skills to our developmentally delayed students. Appropriate programs and services are provided to all students with disabilities up to the age of 22.
English Learner Program: Most students not yet fluent in English are enrolled in classes that support the acquisition of the English language. We strive to advance our English Learners into regular classes as soon as possible. Most students who are learning English receive additional instruction in English Language Development classes.
Air Force JROTC: This program educates and trains high school students in citizenship; promotes community service, instills responsibility, character, and self-discipline; and provides instruction in air and space fundamentals. AFJROTC is grounded in the Air Force core values of integrity first, service before self, and excellence in all we do. The curriculum emphasizes the Air Force heritage and traditions, the development of flight, applied flight sciences, military aerospace policies, space exploration, leadership, communication, life skills, financial management, and career opportunities.
Student Progress Teachers use various methods to evaluate what students learn, using standardized tests, teacher generated tests, checklists, journal entries, oral questioning, projects, portfolios, end-of-course and benchmark examinations, and teacher observation.
We are on a semester system and issue six report cards each school year. Regularly updated grades can be viewed by parents and students through Ed-line, our online grade reporting program. Parents are encouraged to attend Back-to-School Knight in the fall and our parent visitation day in the spring – A Day With A Knight. Parent-Teacher conferences can be scheduled whenever parents or teachers feel it is necessary.
SPECIALIZED SERVICES
SCHOOL ACCOUNTABILITY REPORT CARD PAGE 10
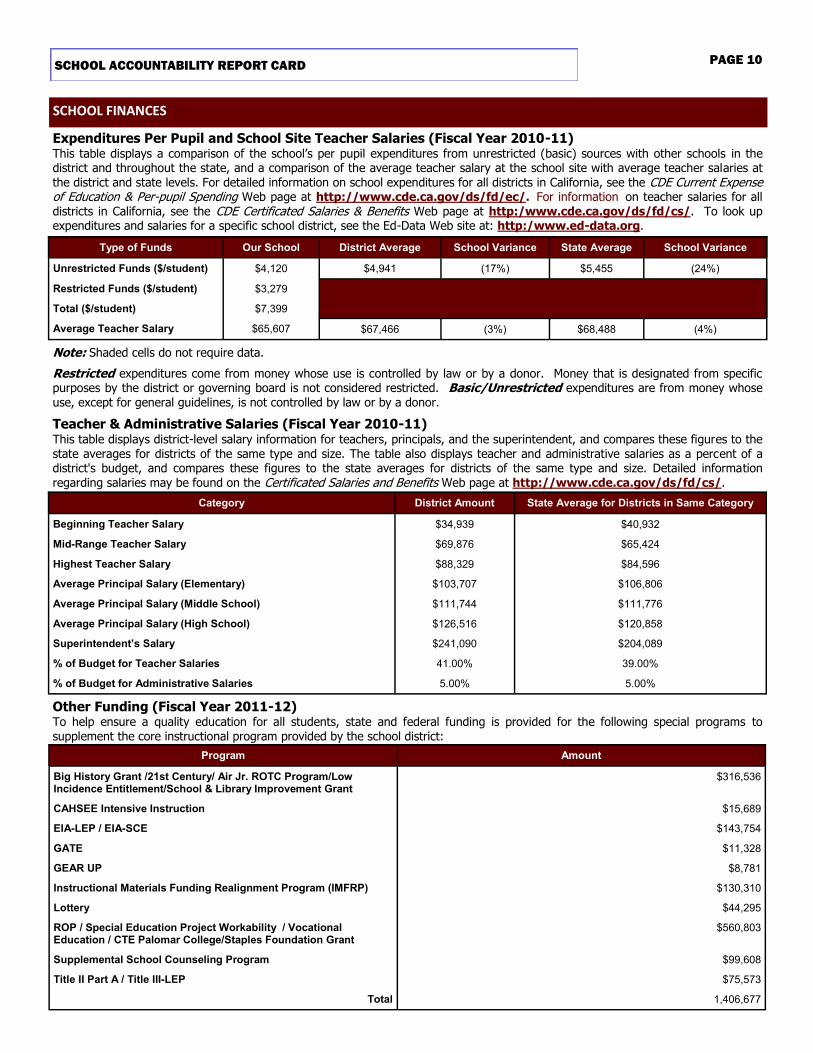
Expenditures Per Pupil and School Site Teacher Salaries (Fiscal Year 2010-11) This table displays a comparison of the school’s per pupil expenditures from unrestricted (basic) sources with other schools in the district and throughout the state, and a comparison of the average teacher salary at the school site with average teacher salaries at the district and state levels. For detailed information on school expenditures for all districts in California, see the CDE Current Expense of Education & Per-pupil Spending Web page at http://www.cde.ca.gov/ds/fd/ec/. For information on teacher salaries for all districts in California, see the CDE Certificated Salaries & Benefits Web page at http:/www.cde.ca.gov/ds/fd/cs/. To look up expenditures and salaries for a specific school district, see the Ed-Data Web site at: http:/www.ed-data.org.
Note: Shaded cells do not require data.
Restricted expenditures come from money whose use is controlled by law or by a donor. Money that is designated from specific purposes by the district or governing board is not considered restricted. Basic/Unrestricted expenditures are from money whose use, except for general guidelines, is not controlled by law or by a donor.
Teacher & Administrative Salaries (Fiscal Year 2010-11) This table displays district-level salary information for teachers, principals, and the superintendent, and compares these figures to the state averages for districts of the same type and size. The table also displays teacher and administrative salaries as a percent of a district's budget, and compares these figures to the state averages for districts of the same type and size. Detailed information regarding salaries may be found on the Certificated Salaries and Benefits Web page at http://www.cde.ca.gov/ds/fd/cs/.
Other Funding (Fiscal Year 2011-12) To help ensure a quality education for all students, state and federal funding is provided for the following special programs to supplement the core instructional program provided by the school district:
Category District Amount State Average for Districts in Same Category
Beginning Teacher Salary $34,939 $40,932
Mid-Range Teacher Salary $69,876 $65,424
Highest Teacher Salary $88,329 $84,596
Average Principal Salary (Elementary) $103,707 $106,806
Average Principal Salary (Middle School) $111,744 $111,776
Average Principal Salary (High School) $126,516 $120,858
Superintendent’s Salary $241,090 $204,089
% of Budget for Teacher Salaries 41.00% 39.00%
% of Budget for Administrative Salaries 5.00% 5.00%
SCHOOL FINANCES
Program Amount
Big History Grant /21st Century/ Air Jr. ROTC Program/Low Incidence Entitlement/School & Library Improvement Grant
$316,536
CAHSEE Intensive Instruction $15,689
EIA-LEP / EIA-SCE $143,754
GATE $11,328
GEAR UP $8,781
Instructional Materials Funding Realignment Program (IMFRP) $130,310
Lottery $44,295
ROP / Special Education Project Workability / Vocational Education / CTE Palomar College/Staples Foundation Grant
$560,803
Supplemental School Counseling Program $99,608
Title II Part A / Title III-LEP $75,573
Total 1,406,677
Type of Funds Our School District Average School Variance State Average School Variance
Standardized Testing and Reporting Program The Standardized Testing and Reporting (STAR) Program consists of several key components, including:
California Standards Tests (CSTs), which include English-language arts (ELA) and mathematics in grades two through
eleven; science in grades five, eight, and nine through eleven; and history-social science in grades eight, and nine through eleven.
California Modified Assessment (CMA), an alternate assessment that is based on modified achievement standards in ELA for
grades three through eleven; mathematics for grades three through seven, Algebra I, and Geometry; and science in grades five and eight, and Life Science in grade ten. The CMA is designed to assess those students whose disabilities preclude them from achieving grade-level proficiency on an assessment of the California content standards with or without accommodations.
California Alternate Performance Assessment (CAPA), includes ELA and mathematics in grades two through eleven, and
science for grades five, eight, and ten. The CAPA is given to those students with significant cognitive disabilities whose disabilities prevent them from taking either the CSTs with accommodations or modifications or the CMA with accommodations.
The assessments under the STAR Program show how well students are doing in relation to the state content standards. On each of
these assessments, student scores are reported as performance levels.
For detailed information regarding the STAR Program results for each grade and performance level, including the percent of students not tested, see the CDE STAR Results Web site at http://star.cde.ca.gov.
Note: Scores are not shown when the number of students tested is ten or less, either because the number of students in the category is too small for statistical accuracy or to protect student privacy.
Standardized Testing and Reporting Results for All Students—Three-Year Comparison This table displays the percent of students achieving at the Proficient or Advanced level (meeting or exceeding the state standards).
Standardized Testing and Reporting Results by Student Group (2011-12) This table displays the percent of students by group, achieving at the Proficient or Advanced level (meeting or exceeding the state standards) for the most recent testing period.
California High School Exit Examination The California High School Exit Examination (CAHSEE) is primarily used as a graduation requirement. However, the grade ten results of this exam are also used to establish the percentages of students at three proficiency levels (not proficient, proficient, or advanced) in ELA and mathematics to compute AYP designations required by the federal ESEA, also known as NCLB. For detailed information regarding CAHSEE results, see the CDE CAHSEE Web site at http://cahsee.cde.ca.gov/.
CAHSEE Results for All Students—Three-Year Comparison
CAHSEE Results by Student Group—Most Recent Year
California Physical Fitness Test Results (2011-12) The California Physical Fitness Test is administered to students in grades 5, 7, and 9 only. This table displays by grade level the percent of students meeting fitness standards (scoring in the healthy fitness zone on all six fitness standards) for the most recent testing period. Detailed information regarding this test, and comparisons of a school's test results to the district and state levels, may be found on the Physical Fitness Testing Web page at http://www.cde.ca.gov/ta/tg/pf/.
Academic Performance Index The Academic Performance Index (API) is an annual measure of state academic performance and progress of schools in California. API scores range from 200 to 1,000, with a statewide target of 800. For detailed information about the API, see the CDE API Web page at http://www.cde.ca.gov/ta/ac/ap/.
Academic Performance Index Ranks—Three-Year Comparison This table displays the school’s statewide and similar schools’ API ranks. The statewide API rank ranges from 1 to 10. A statewide rank of 1 means that the school has an API score in the lowest ten percent of all schools in the state, while a statewide rank of 10 means that the school has an API score in the highest ten percent of all schools in the state.
The similar schools API rank reflects how a school compares to 100 statistically matched “similar schools.” A similar schools rank of 1 means that the school’s academic performance is comparable to the lowest performing ten schools of the 100 similar schools, while a similar schools rank of 10 means that the school’s academic performance is better than at least 90 of the 100 similar schools.
Percent of Students Meeting Fitness Standards (on all six fitness standards)
Grade Level Four of Six Standards Five of Six Standards Six of Six Standards
Academic Performance Index Growth by Student Group—Three-Year Comparison
Academic Performance Index Growth by Student Group – 2012 Growth API Comparison This table displays, by student group, the number of students included in the API and the 2012 Growth API at the school, LEA, and state level.
Note: Scores are not shown when the number of students tested is ten or less, either because the number of students in the category is too small for statistical accuracy or to protect student privacy.
Adequate Yearly Progress The federal ESEA requires that all schools and districts meet the following Adequate Yearly Progress (AYP) criteria:
Participation rate on the state’s standards-based assessments in ELA and mathematics
Percent proficient on the state’s standards-based assessments in ELA and mathematics
API as an additional indicator
For detailed information about AYP, including participation rates and percent proficient results by student group, see the CDE AYP Web page at http://www.cde.ca.gov/ta/ac/ay/.
Group
Actual API Change
2009-10 2010-11 2011-12
All Students 25 29 0
Hispanic or Latino 28 30 -3
White 17 20 2
Socioeconomically Disadvantaged 34 17 12
English Learners 48 51 -18
Students with Disabilities 45 26 -12
ACCOUNTABILITY
Group
2012 Growth API
Number of Students
School Number of Students
District Number of Students
State
All Students 1,622 858 13,606 868 4,664,264 788
Black or African American 51 826 398 852 313,201 710
American Indian or Alaskan Native 8 74 839 31,606 742
Asian 72 932 662 953 404,670 905
Filipino 46 903 395 949 124,824 869
Hispanic or Latino 703 792 6,276 806 2,425,230 740
Admission Requirements for California Public Universities
University of California Admission requirements for the University of California (UC) follow guidelines set forth in the Master Plan, which requires that the top one-eighth of the state’s high school graduates, as well as those transfer students who have successfully completed specified college course work, be eligible for admission to the UC. These requirements are designed to ensure that all eligible students are adequately prepared for University-level work.
For general admissions requirements please visit the UC Admissions Information Web site at http://www.universityofcalifornia.edu/admissions/. (Outside source)
California State University Eligibility for admission to the California State University (CSU) is determined by three factors:
Specific high school courses
Grades in specified courses and test scores
Graduation from high school
Some campuses have higher standards for particular majors or students who live outside the local campus area. Because of the number of students who apply, a few campuses have higher standards (supplementary admission criteria) for all applicants. Most CSU campuses have local admission guarantee policies for students who graduate or transfer from high schools and colleges that are historically served by a CSU campus in that region. For admission, application, and fee information see the CSU Web page at http://www.calstate.edu/admission/admission.shtml . (Outside source)
Dropout Rate and Graduation Rate (Fiscal Year 2010-11) This table displays the school's one-year dropout rates and graduation rates for the most recent three-year period. For comparison purposes, data are also provided at the district and state levels. Detailed information about dropout rates and graduation rates can be found at the CDE Web site at http://dq.cde.ca.gov/dataquest/.
Completion of High School Graduation Requirements This table displays, by student group, the percent of students who began the 2011-12 school year in grade twelve and were a part of the school’s most recent graduating class, meeting all state and local graduation requirements for grade twelve completion, including having passed the ELA and mathematics portions of the CAHSEE or received a local waiver or state exemption.
Courses for UC and/or CSU Admission This table displays for the most recent year two measures related to the school's courses that are required for University of California (UC) and/or California State University (CSU) admission. Detailed information about student enrollment and completion of courses required for UC/CSU admission can be found at the DataQuest Web site at http://dq.cde.ca.gov/dataquest/.
Advanced Placement Courses This table displays for the most recent year the number of Advanced Placement (AP) courses that the school offered by subject and the percent of the school’s students enrolled in all AP courses.
Note: Shaded cells do not require data.
Career Technical Education Participation The following table displays information about participation in the school’s CTE programs:
Career Technical Education Programs (2011-12) The following is a list of Career Technical Educational (CTE) programs offered at our school: