2008/ED/EFA/MRT/PI/2 Background paper prepared for the Education for All Global Monitoring Report 2008 Education for All by 2015: will we make it? School Attendance and Enrolment Global trends and projections Education Policy and Data Center 2007 This paper was commissioned by the Education for All Global Monitoring Report as background information to assist in drafting the 2008 report. It has not been edited by the team. The views and opinions expressed in this paper are those of the author(s) and should not be attributed to the EFA Global Monitoring Report or to UNESCO. The papers can be cited with the following reference: “Paper commissioned for the EFA Global Monitoring Report 2008, Education for All by 2015: will we make it? For further information, please contact [email protected]
Transcript
2008/ED/EFA/MRT/PI/2
Background paper prepared for the
Education for All Global Monitoring Report 2008
Education for All by 2015: will we make it?
School Attendance and Enrolment Global trends and projections
Education Policy and Data Center 2007
This paper was commissioned by the Education for All Global Monitoring Report as background information to assist in drafting the 2008 report. It has not been edited by the team. The views and opinions expressed in this paper are those of the author(s) and should not be attributed to the EFA Global Monitoring Report or to UNESCO. The papers can be cited with the following reference: “Paper commissioned for the EFA Global Monitoring Report 2008, Education for All by 2015: will we make it? For further information, please contact [email protected]
School attendance and enrolment, November 2007, EPDC 1
Abstract This study was prepared as a background study for the 2008 Global Monitoring Report: Education for all by 2015: Will We Make It? The study deals with information on education trends and education coverage within countries from household surveys, as well as with projections of primary and secondary enrolment and gender parity ratios. The data for this study are from 174 household surveys from 82 countries. The data for the projections are from the UNESCO Institute of Statistics. From household surveys, the report finds that, with regards to education coverage, rural areas lag behind urban areas, but that in most countries the rural-urban gap has been declining thanks to high rural school attendance growth. In a few countries where attendance is falling, rural attendance is falling faster than urban - rural school attendance appears more volatile than urban school attendance. Within countries, rural school attendance is negatively correlated with the poverty incidence of sub-national regions, and rural school attendance growth within countries is not always even. Non-formal education contributes significantly (>5% of reference group) to education coverage in a small group of, mostly sub-Saharan African countries. Based on income levels of adults with highest attainment non-formal schooling compared to those with formal schooling levels, there appears to be a wide range of non-formal programs from those that are equivalent to secondary schooling to very basic programs. The sub-Saharan countries with the highest levels of non-formal schooling are also those where people with non-formal schooling are as poor or poorer than those with no schooling at all. Late school entry appears to have been reduced in most of the world, except in sub-Saharan Africa where it rose from the 1990s to the 2000s. In a few countries a significant portion of school years lost is due to late entry, but overall, non-entry is a much more important contributor to lost school years. The report finds that over-age school attendance is highly prevalent in many countries at the primary and the secondary levels. The attendance data from household surveys differs significantly (>10 percentage points) from administrative data in about one-third of 82 developing countries examined. Several hypotheses on the causes of these differences are tested and refuted; the explanation of the differences remains unresolved. The GMR team commissioned the EPDC to produce education projections for all countries covered by UNESCO Institute for statistics data for primary net and gross enrolment, secondary net and gross enrolment, and the gender ratios at the primary and secondary levels, all in 2015 and in 2025. Projections based on enrolment rate trends (Trend projections) were made for 193 countries. A separate, pilot series of projections based on a cohort-flow model (Cohort projections), similar in its core to the models used for country-level planning, was produced for 129 countries. This series, while innovative in the extent of its coverage, is at this stage experimental, and the results are presented for discussion and to improve the method. The report presents the projection methods. Tables with selected results appear in an Annex.
School attendance and enrolment, November 2007, EPDC 2
Table of Contents
Abstract ..................................................................................................................1 Table of Contents...................................................................................................2 List of Tables .........................................................................................................3 Abbreviations.........................................................................................................5 Introduction............................................................................................................6 Executive Summary ...............................................................................................9
1 Differentials between rural and urban areas over time ........................................15
1.1 Urban and rural attendance rates 1990-2006 in 43 countries ......................17 1.2 Change in ratios of rural to urban attendance at the national level..............20 1.3 Sub-national rural/urban ratios and change since Dakar. ............................25
2 Sub-national differences in rural and urban attendance by wealth of region. .....31 3 Non-formal education ..........................................................................................35
3.1 Definition of non-formal programs in MICS surveys..................................35 3.2 Scale and extent of non-formal programs....................................................36 3.3 The scope and content of non-formal programs ..........................................40
4 Age patterns of out-of-school children ................................................................43 4.1 Examples of age-specific attendance patterns .............................................52 4.2 Contribution of late entry, non-entry, and early departure to incomplete attendance rates........................................................................................................55
5 Trends in Net Enrolment and Net Attendance.....................................................59 5.1 Net enrolment rates 1999-2005....................................................................59 5.2 Comparison: net attendance and net enrolment rates ..................................61 5.3 Differences between enrolment and attendance – what are the causes?......63
6 Global series of enrolment projections to 2015 and 2025 ...................................69 6.1 Methods and assumptions in the projections: ..............................................71
Annex 1. Definitions............................................................................................80 Annex 2. Household surveys included in the analyses ........................................82 Annex 3. Tables of projection results ..................................................................84
School attendance and enrolment, November 2007, EPDC 3
List of Tables
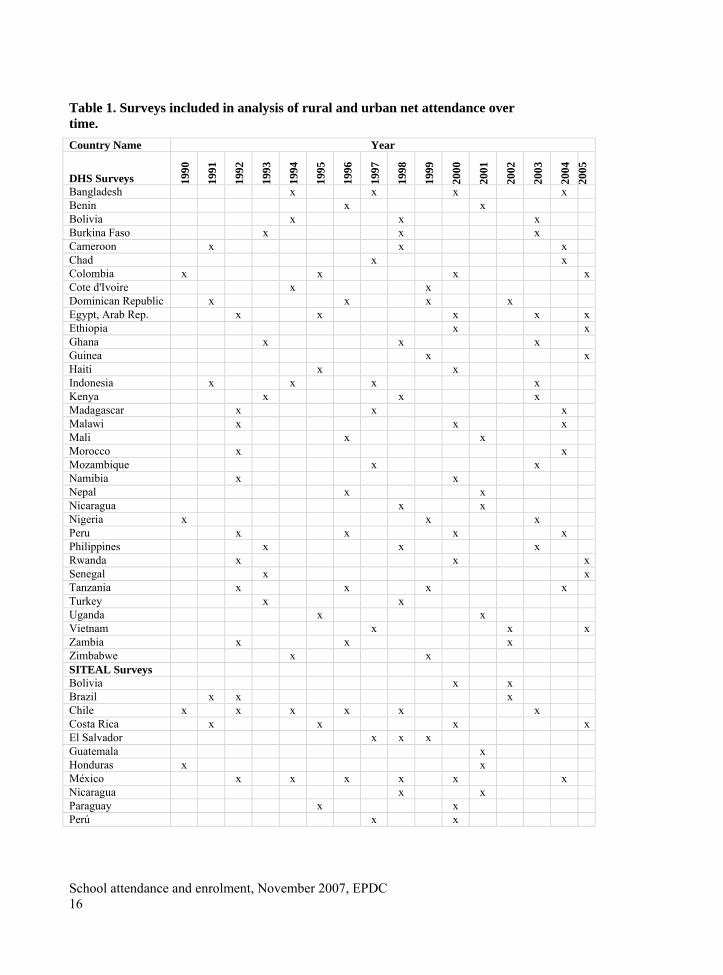
Table 1. Surveys included in analysis of rural and urban net attendance over time....16 Table 2: Dates of the pre- and post-2000 surveys used by country and the length of the
interval between surveys......................................................................................21 Table 3. Scale and extent of non-formal education programs in 28 countries, measured
by the non-formal attendance rate of primary school age children, secondary school age teenagers, and highest education attainment is non-formal for youth (15-24) and other adults (25+). Source: MICS surveys, 2000.............................38
Table 4. List of recent DHS and MICS surveys conducted entirely or partially outside the school year. ....................................................................................................65
Table 5. Measures of deviations between net and gross attendance and enrolment rates, by three groups of surveys – DHS, MICS, and other. The deviations are measured as the mean difference, mean absolute difference, standard deviation, and average deviation from the mean. .................................................................66
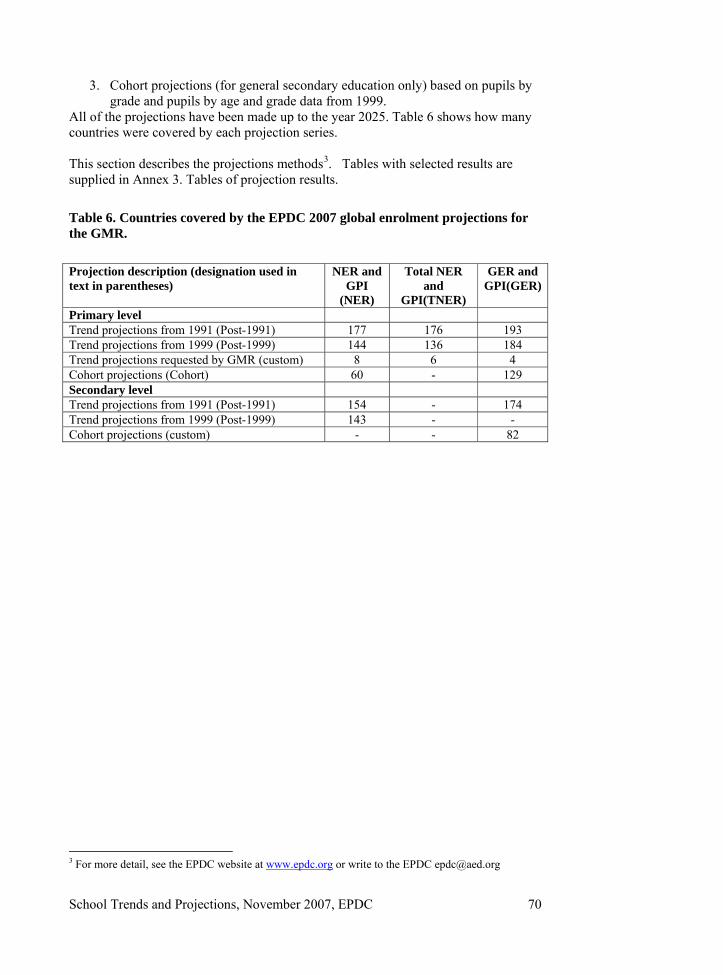
Table 6. Countries covered by the EPDC 2007 global enrolment projections for the GMR. ...................................................................................................................70
Table 7. Generic matrix for pupil flow calculations, used in the EPDC ProEnrol model but also in World Bank and UNESCO models.........................................74
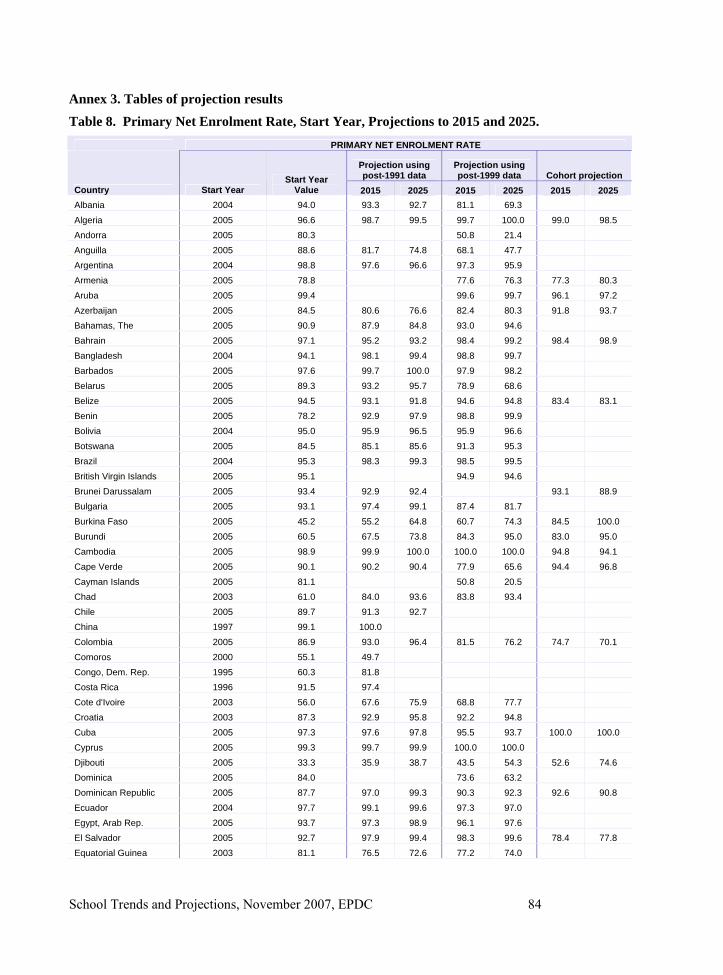
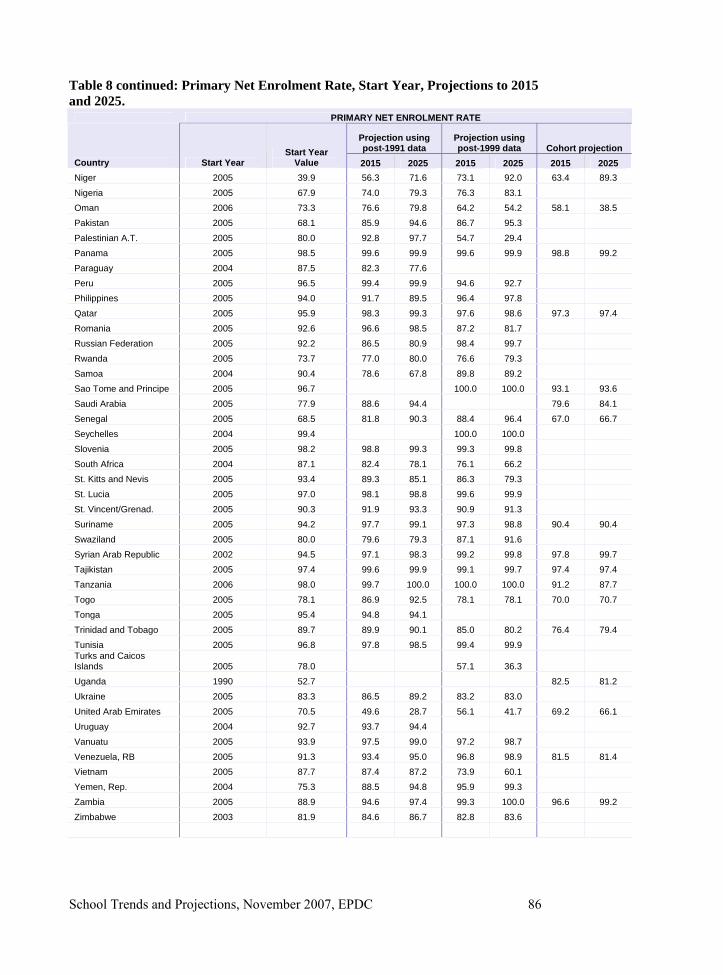
Table 8. Primary Net Enrolment Rate, Start Year, Projections to 2015 and 2025. ....84 Table 9. Primary Total Net Enrolment Rate, Start Year, Projections to 2015 and
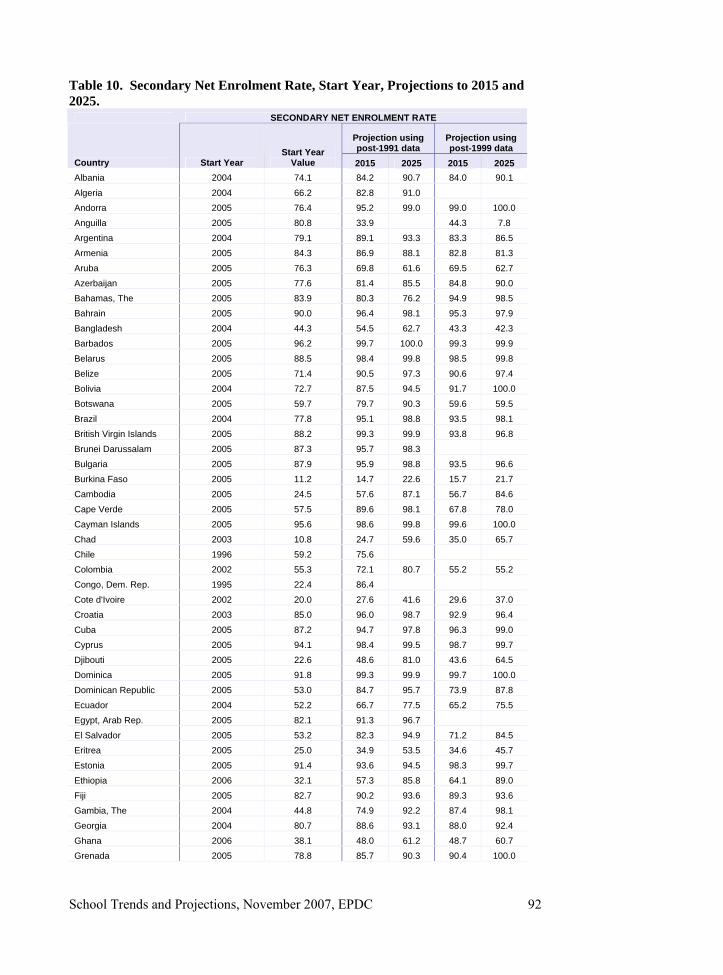
2025......................................................................................................................88 Table 10. Secondary Net Enrolment Rate, Start Year, Projections to 2015 and
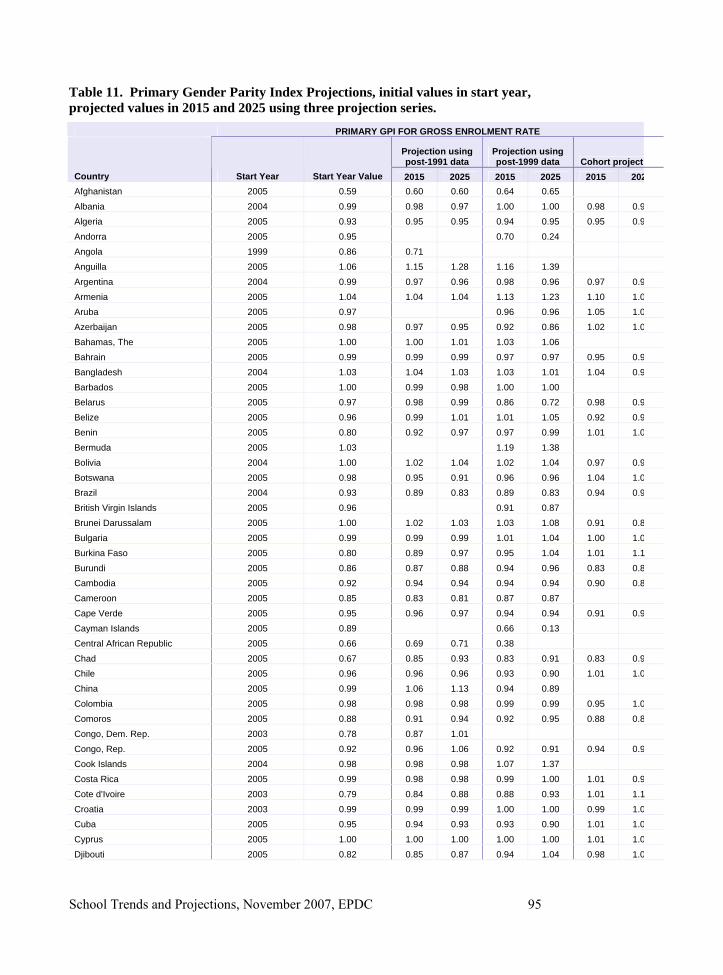
2025......................................................................................................................92 Table 11. Primary Gender Parity Index Projections, initial values in start year,
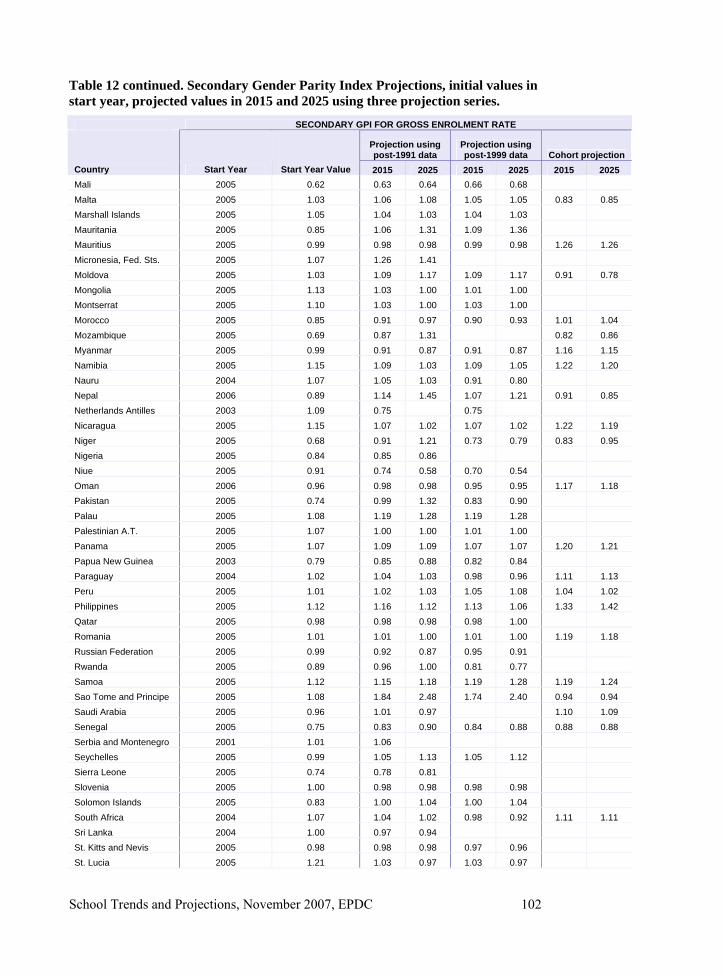
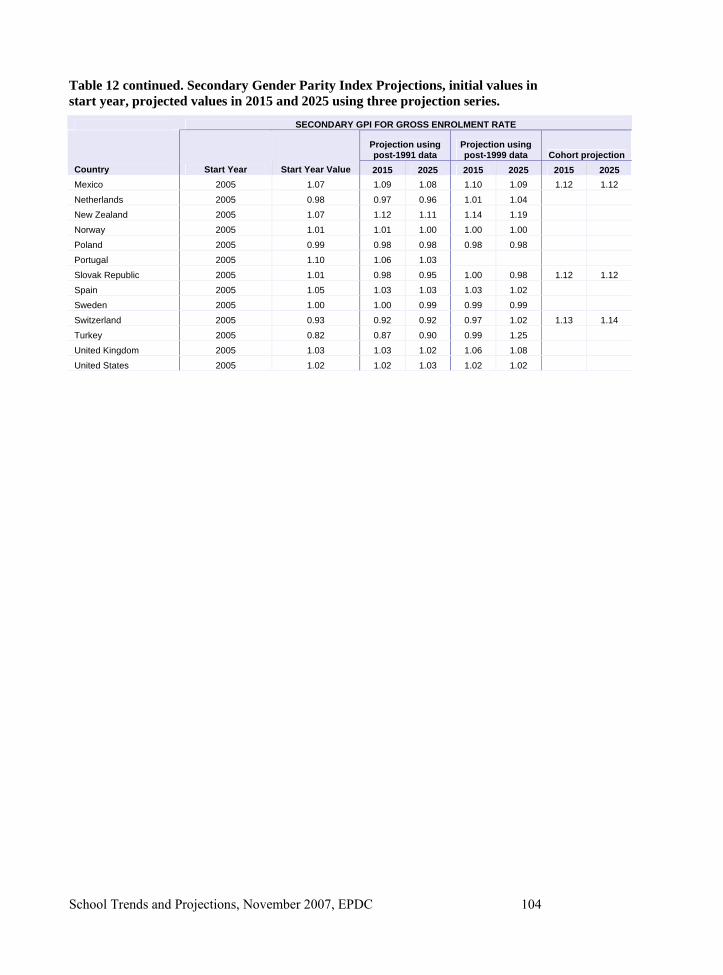
projected values in 2015 and 2025 using three projection series.........................95 Table 12. Secondary Gender Parity Index Projections, initial values in start year,
projected values in 2015 and 2025 using three projection series.......................100 Table 13. Cohort projections of the number of pupils in and primary and general
secondary schools, initial values in most recent year of data (start year), and in 2015 and 2025....................................................................................................105
List of Figures Figure 1. Net attendance rates over time in urban (top) and rural areas (bottom) from
130 household surveys taken in 1990-2006 in 43 countries. ...............................18 Figure 2. Average annual urban and rural net attendance growth rates in 41 countries.
..............................................................................................................................20 Figure 3. Rural/urban NAR ratio in two years, pre- and post-2000, for 39 countries .22 Figure 4. Average annual change in the rural/urban NAR ratio for 39 countries (top)
and change in urban NAR and in rural NAR between pre- and post-2000 (bottom), arranged in ascending arrangement by the average annual rate of change of the rural/urban ratio. ............................................................................24
Figure 5: Subnational rural/urban NAR ratios for 42 countries pre-2000, and for 40 countries post-2000. Data is grouped by country and arranged in order of ascending national net attendance ratio. ..............................................................27
Figure 6. Changes in rural/urban attendance ratios in 14 countries pre- and post-2000...............................................................................................................................29
School attendance and enrolment, November 2007, EPDC 4
Figure 7. Cross-tabulation of primary net attendance rates by relative income depravation in sub-national regions, rural and urban separated, for 21 countries...............................................................................................................................32
Figure 8. Percentage of adults age 25+ with non-formal education as the highest level, by gender. Data from MICS 2000 surveys. .........................................................39
Figure 9. Percentage of adults age 25+ with non-formal education as the highest level, by urban and rural residence. Data from MICS 2000 surveys.............................39
Figure 10. Estimated poverty incidence (people in the lowest income quintile 1) by highest level of education attained – with no education, non-formal, and formal education levels....................................................................................................42
Figure 11. Age-specific school attendance pyramids for 41 countries, data taken from most recent household survey..............................................................................44
Figure 12. Mali age-specific attendance rates 2001 and the deviations from the ideal attendance rate pattern. ........................................................................................56
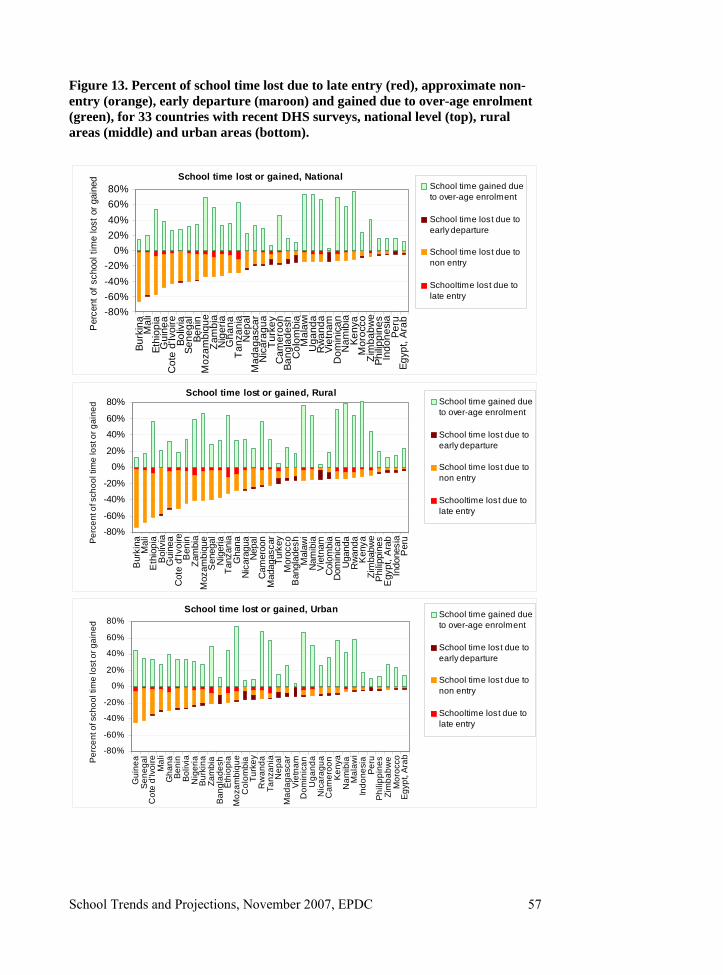
Figure 13. Percent of school time lost due to late entry (red), approximate non-entry (orange), early departure (maroon) and gained due to over-age enrolment (green), for 33 countries with recent DHS surveys, national level (top), rural areas (middle) and urban areas (bottom). ............................................................57
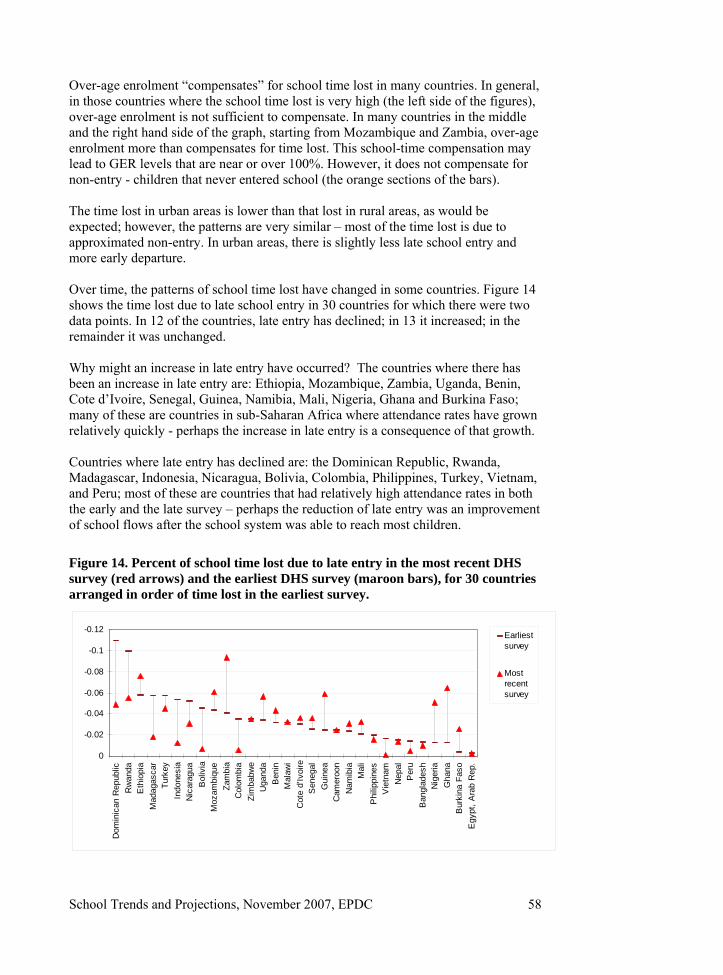
Figure 14. Percent of school time lost due to late entry in the most recent DHS survey (red arrows) and the earliest DHS survey (maroon bars), for 30 countries arranged in order of time lost in the earliest survey.............................................58
Figure 15. Net enrolment rates in 1999 and 2005/6 (or nearest years) for 88 developing countries, from UIS...........................................................................60
Figure 16. Net enrolment and net attendance rates (in percent) in 55 developing countries, using the most recent survey data. ......................................................62
Figure 17. Gross enrolment and attendance (in percent) in 82 developing countries, using the most recent attendance data from household surveys and UIS enrolment data......................................................................................................63
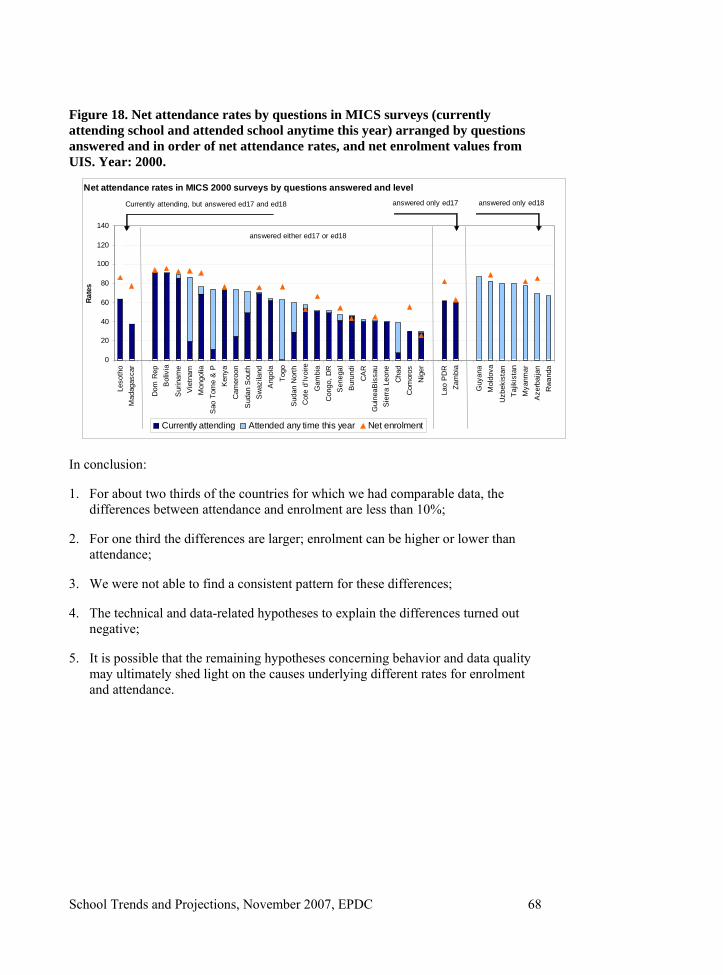
Figure 18. Net attendance rates by questions in MICS surveys (currently attending school and attended school anytime this year) arranged by questions answered and in order of net attendance rates, and net enrolment values from UIS. Year: 2000......................................................................................................................68
School attendance and enrolment, November 2007, EPDC 5
Abbreviations AED Academy for Educational Development DHS Demographic and Health Surveys EMIS Education Monitoring Information Systems EPDC Education Policy and Data Center GER Gross Enrollment Rate GIR Gross Intake Rate GMR Global Monitoring Report GPI Gender Parity Index ISCED International Standard of Education Classification MICS Multiple Indicator Cluster Survey NAR Net Attendance Rate NER Net Enrollment Rate NIR Net Intake Rate ProEnrol A cohort projections model developed by EPDC ProjecTrend A trend projections model developed by EPDC SITEAL Sistemas de Informacion de Tendencias Educativas en America Latina TNER Total Net Enrollment Rate UIS UNESCO Institute of Statistics UN United Nations UNICEF United Nations Children's Fund USAID United States Agency for International Development
School attendance and enrolment, November 2007, EPDC 6
School Attendance and Enrolment – Global trends and projections
Produced by the Education Policy and Data Center1
For the 2008 Global Monitoring Report Washington, November, 2007
This report has been prepared jointly by the Education Policy and Data Center (EPDC) staff, Annababette Wils, Karima Barrow, Sarah Oliver, Ania Chaluda, Joe Goodfriend, Hye Jin Kim and Ben Sylla. The EPDC has strived to be true to the guidelines and requirements supplied by the Global Monitoring Report (GMR) team for the studies. Where we have deviated, and in particular, where there are errors in this report, these are entirely the responsibility of the EPDC. The views presented in this report are those of the EPDC only and do not necessarily reflect those of the Global Monitoring Report or any other organization. The EPDC team is grateful to all of the GMR team for excellent guidance and commentary and for the collegial spirit in which this work was conducted. We extend our deepest thanks to the GMR team for providing us with the opportunity to work with them and to contribute to the GMR’s important work for the Education For All goals and ideals.
Introduction The 2008 Global Monitoring Report marks the halfway point between the 2000 Dakar meeting and 5 of the six “Education for All” goals for 2015. It takes stock of progress to date. The EPDC prepared a number of background analyses for this report, which are collected here. The EPDC analyses focus on information that can be gathered from household surveys and on education projections. Household surveys are an important source of information on education patterns, complementing information collected by national administrative systems. In particular, household surveys provide more detail about the background of pupils (wealth, area of residence, parents’ education levels), include forms of education not collected by national administrative systems (such as non-formal schools), and can serve a useful data check function against the administrative systems. Increasingly, over the last years, the international education community has come to appreciate the value of household surveys for education data and has begun to analyze them consistently.
1 The Education Policy and Data Center was founded in 2004 to contribute to better education policy making and planning through improved access to and use of data and analysis. The EPDC is part of the Academy for Educational Development, a non-profit organization working to solve critical social problems throughout the world. The EPDC is directed by George Ingram. It is funded in part by USAID and AED. For more information, see www.epdc.org, or send an email to [email protected].
School attendance and enrolment, November 2007, EPDC 7
The EPDC has participated in this effort, collecting information for its data system from a wide range of household surveys. For this report, the EPDC used data from 174 household surveys from a total of 82 developing and transitioning countries. There are five issues covered by the household survey analyses in this report:
1) Differentials between urban and rural attendance over time. This section covers the trends in urban and rural attendance over the period 1990-2004, and in particular the urban-rural attendance gap in that period, for 43 countries at the national and the sub-national level. The section finds that in most countries urban as well as rural attendance is rising, and that the urban-rural gap is declining in the majority of countries, mostly thanks to rapid growth of attendance in rural areas. However, progress is not uniform between countries, nor is it uniform within countries.
2) Attendance differential by wealth of sub-national regions. Within many countries, there is considerable variation of attendance rates, in particular, rural attendance. This section examines 21 countries and finds that in a number of countries, attendance is negatively correlated with the proportion of households that are among the poorest 20% of households. In other countries, there is no correlation and in one (Guinea) there is a positive correlation.
3) Contribution of non-formal education to education. This section analyzes non-formal education in 28 countries in 2000. The study finds that non-formal education is an important segment of the education system as a whole in seven out of the 28 countries, six of these in sub-Saharan Africa. It finds that the contribution of non-formal education to income generation varies from being equivalent to secondary education or higher, to equivalent to no schooling at all – in four out of the seven countries where non-formal education is most prevalent, people with non-formal education are as poor as those with no education at all, possibly a selection effect, or an indication the non-formal education is not effective in reducing poverty.
4) Age patterns of school attendance. This section analyzes age-specific entry, attendance and school departure patterns in 36 countries. The study finds that late entry is found mainly in sub-Saharan Africa, where the highest age-specific primary attendance rates are sometimes at age 11 or 12 – the official age to finish primary school. Over-age attendance in primary school, and also secondary school is pervasive in almost all countries studied – the extremes are found in some sub-Saharan countries where over-age primary attendance is about equal to the attendance of primary school-age children.
5) Household survey data vs. administrative data. Attendance rates (from household surveys) and enrolment rates (from administrative systems) often diverge more than should be the case if the data were perfect. This study examines some hypotheses of possible technical causes of unexplained gaps. None of the options studied, however, led to a conclusive result.
Education projections are an important planning and monitoring tool. In all countries, the school systems are in constant flux with an ongoing flow of changes to the number of school-age children, the backgrounds of the children, school intake and flows from primary to secondary etcetera. Quality and content change as well as curricula are modernized, teacher training shifts, and new materials are introduced. To
School attendance and enrolment, November 2007, EPDC 8
anticipate such changes and plan accordingly, and to optimize policy decisions, education projections are used by governments and donor agencies as a planning tool. Education projections can also be used for other purposes. One of these is monitoring. The GMR teams uses education projections in this sense, to monitor whether countries are on track to attain the education for all goals for 2005 and 2015 agreed upon at the 2000 Global Education Summit in Dakar. For the 2008 report, midway between 2000 and 2015, the GMR team commissioned the EPDC to produce an extensive set of education projections for all countries covered by UNESCO Institute for statistics data for primary net and gross enrolment, secondary net and gross enrolment, and the gender ratios at the primary and secondary levels, all in 2015 and in 2025. Four sets of projections were produced: 1) based on enrolment rate trends from 1991 for 193 countries; 2) from 1999 for 184 countries; and 3) from a special year selected by the GMR (only 8 projections); and 4) projections based on the cohort flow method more commonly used by governments for planning for 129 countries.
School attendance and enrolment, November 2007, EPDC 9
Executive Summary of household survey studies Five studies based on household survey attendance data are presented together in this report. The following pages provide an executive summary of these studies. Differences in urban and rural attendance National averages in attendance rates mask considerable differences within countries. In particular, many countries have significant urban-rural attendance gaps at the primary and secondary levels. Have these gaps changed over time? This study investigates the extent of urban-rural gaps and the changes since 1990 for 43 countries at the national and sub-national level using 130 household surveys from DHS and provided by SITEAL in Latin America. In most countries where primary attendance is incomplete, rural areas are behind the urban areas. In some countries, the rural-urban attendance gap is very large (notably in Burkina Faso, Ethiopia, Mali, Guinea, Benin), while in others it is practically zero (Rwanda, Uganda, most of Latin America). In the period from the 1990s to the 2000s, urban-rural gaps declined in most countries (where they existed to begin with) – in fact, in 35 out of the 41 countries for which multiple, comparable time-points were used, urban-rural gaps declined. The decline in the rural-urban gap is largely attributable to high attendance growth in rural areas; in just two countries, it is the result of a slower decline in rural areas compared to the decline in urban areas (Ghana and Zambia). The declines in the urban-rural gaps are generally larger in the countries that had a large gap to begin with. Overall, it appears that rural areas are prone to more volatile attendance rate changes, both positive and negative. Within countries the urban-rural attendance gap varies, and in some countries the range of variation is quite large. In situations with extremely low national net attendance rates (below 30%) all the regions showed a very large urban-rural attendance gap (these low rates were found only in a few countries in the 1990s). In situations with low to mid-range attendance (30-80%) there is, in many countries, a large variation in the urban-rural gap – in some regions attendance was equal in both urban and rural areas, while in others, it was very uneven. In situations with high national net attendance (>80%), the urban-rural attendance gap is uniformly small in all sub-regions of the countries. We were able to compare the sub-national urban-rural attendance gaps over time for 14 countries. This analysis shows that progress in eliminating urban-rural gaps is not uniform within countries. There are some countries where there has been across the board progress at reducing urban-rural attendance gaps in all sub-national regions - Benin, Brazil, Ethiopia, Madagascar, Mali, Nigeria, Rwanda, and Uganda – and another group with mixed sub-national progress - Mozambique, Nicaragua, Malawi, and Zambia.
School attendance and enrolment, November 2007, EPDC 10
Attendance rates by wealth of sub-national region. Within many countries, there is considerable variation of attendance rates, in particular, rural attendance. This section examines whether this variation is correlated with income variation, for 21 countries with a recent DHS survey that provides a wealth index to approximate wealth or income. The wealth index was developed by Filmer and Pritchett in 2001 to measure the wealth distribution within countries based on ownership of goods. As a measure of income depravation, we take the portion of households in the lowest 20% of wealth (at the national level) in urban and rural sub-regions. This approach reveals considerable rural wealth inequality (less so, urban inequality). The wealth depravation is cross-tabulated with primary net attendance. In about half of the countries, there is a strong, negative correlation. In the remainder there is either little or no differential in attendance rates, or little correlation between relative poverty and attendance, and in one country, there is a positive correlation (Guinea). The study does not disentangle whether aggregated household effects (more poor households, with on average lower attendance rates will depress aggregate attendance rates), compared to actual regional effects.
Contribution of non-formal education to education. Non-formal schooling is included in MICS household surveys from 2000 of which the EPDC analyzed 28. In the MICS household surveys, non-formal education is defined as any school with a non-standard curriculum, and it can thus include programs such as religious schools (if they do not also have the standard curriculum), alternative schools, literacy programs, youth and young adult training programs, professional development programs. The MICS surveys themselves do not provide any additional information, but in this study, the relation of educational attainment to income is used to gain some more insight into the programs. This study uses four measures of non-formal education: attendance rates of children of primary and of secondary school age; and non-formal education attainment for youth, age 15-24 and adults 25 and older. The scale of non-formal education is small in most of the 28 countries, both measured as a form of attendance, and as a form of highest education attainment. Significant non-formal education levels – above 5% in one or more of the four measures - are found only in Burundi, Chad, the Gambia, Guinea-Bissau, Myanmar, Niger and Senegal. In an additional six countries, non-formal education levels are between 1-5% in at least one measure, and in the remaining 15, they are less than 1% by all measures. This means in general, non-formal education is not significant at the national level – although it may be extremely important for certain target groups. In those countries where non-formal education attendance is more prevalent, it is so at the primary school-age, and a little less so at the secondary school-age. An exception is Burundi, where more people of secondary school-age attend non-formal schools than of primary school age (10% as opposed to 4%). Regarding non-formal as the highest educational attainment, it is more common among older adults and among men. In the seven countries with the highest non-formal education levels, it is more common in the rural areas.
School attendance and enrolment, November 2007, EPDC 11
The EPDC used wealth outcomes by education level to estimate the content of non-formal education programs: the idea is that if an income profile of two education levels is similar, then the level of the education is similar, or at least, is similarly effective at providing income-relevant skills. According to the findings based on this hypothesis, there is a wide range of non-formal schooling levels, from being equivalent to no schooling at all (at least in the income effect) to primary school and to secondary school or higher. In countries where non-formal is more equivalent to secondary schooling, it is more common in the urban areas; in countries where it is more equivalent to no schooling or primary, it is predominantly a rural form. In four of the seven countries with the highest prevalence of non-formal education, the poverty rate of those with non-formal education is equal to or higher than those with no schooling at all (Chad, the Gambia, Niger, and Senegal). It is possible this result comes from the specific targeting of highly marginalized groups (say in remote, rural areas), or that the wide-spread non-formal education in these countries is not effective at providing skills to rise above poverty.
School attendance and enrolment, November 2007, EPDC 12
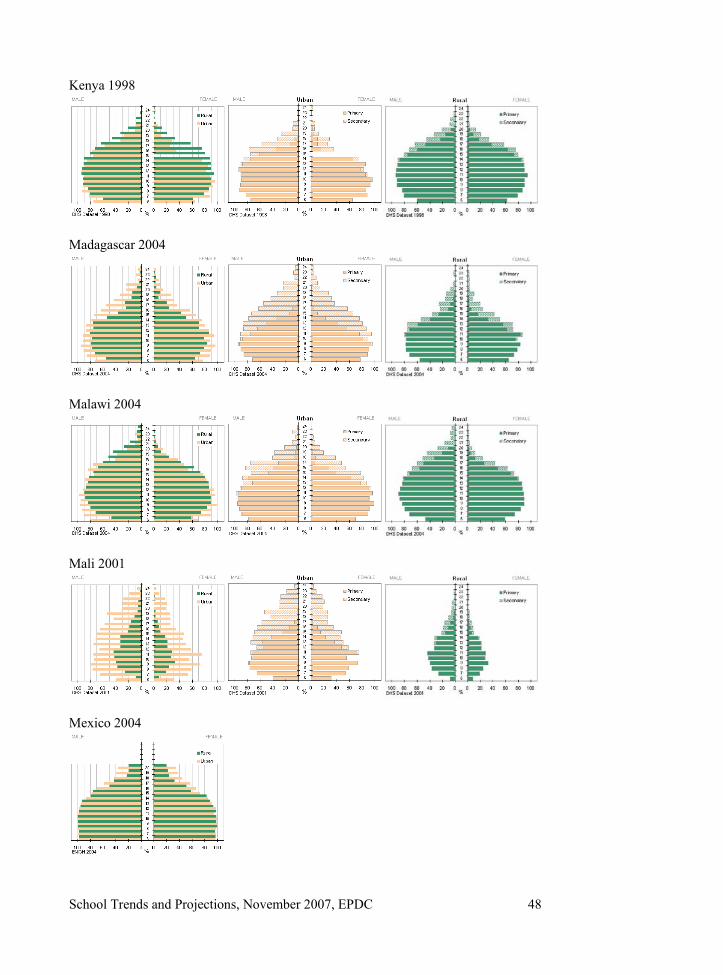
Age patterns of school attendance The EPDC produced age-specific attendance pyramids for age 6-24, for 41 countries, based on DHS and household surveys from Latin America provided by SITEAL. In total, the pyramids are based on 130 household surveys. The surveys were taken between 1990 and 2005. An age-specific attendance pyramid (pages 39-47) is a two-sided horizontal bar graph, with bars to the left signaling the level of male attendance; bars to the right for female attendance; and the bars arranged in order of age, starting with the youngest age at the bottom. The pyramids show there is variation in the level of attendance, but moreover that there is a wide variation in the age-patterns of school attendance. At one extreme are countries where almost all children enter school at the official school entry age and leave en masse at the official school departure age (with some over-age attendance due, probably, to the effects of repetition). At the other extreme are countries with a gradual increase of attendance rates with age (late entry), incomplete attendance at all ages, and a gradual decline of attendance with age with significant over-age attendance. In these countries, the highest level of primary school attendance can be at age 11 or 12 – the official age to leave primary school - and the rates of over-age attendance can approach those of on-time attendance. The pyramids show the same urban-rural attendance gap discussed in the earlier section, and that where rural attendance is lower, this is true across all age groups. The same is true for the gender attendance gap – where it exists women have lower attendance at all ages. The study calculated the number of years lost and gained – compared to an idealized age-specific attendance pattern of perfect on-time entry, and perfect, on-time departure. Together with the pyramids, this gives insight into losses and gains in the school system from age-related patterns of entry and departure. All countries with predominantly on-time entry also have near universal entry – Brazil, Chile, Costa Rica, Egypt, El Salvador, Indonesia, Mexico and Vietnam. The reverse is not true – there are some countries which have near-complete attendance at age 9 or 10, but also a pattern of late entry. High prevalence of late entry is common today in sub-Saharan Africa, but no longer in other regions of the world. From the 1990s to the 2000s, late entry changed. In sub-Saharan Africa, late entry has become more prevalent, mostly in countries that have incomplete, but growing attendance rates. Perhaps the rise in late entry is related to that growth. In countries from other regions, late entry has declined. Most of these are countries that had relatively high attendance rates in both time points – the reduction of late entry was an improvement in school flows after the system was able to reach most children. In terms of attendance losses, however, late entry is swamped by losses due to non-entry. The EPDC estimated non-attendance as the portion of children who were not attending school at the age of the highest attendance rates (which is similar to the portion of children who never entered school, say by age 12). There are many more years of school lost because children never enter school than because they enter late.
School attendance and enrolment, November 2007, EPDC 13
Over-age attendance for primary and even more so for secondary is high in most countries. In some countries, the primary attendance rates of over-age teenagers approach those of the children who are primary school age – Kenya, Malawi, and Rwanda. Over-age primary attendance is more common in rural areas than in urban. Both late entry and late attendance affect males and females equally. Household survey data versus administrative data Household surveys collect school attendance data (very rare exceptions collect enrolment) and administrative systems collect enrolment. One expects children who attend school to be a slightly smaller group sub-group of the enrolled (on the assumption that children must enroll to attend school), and for the difference to usually be small. However, this is not always the case – in some countries, attendance is higher than enrolment and in some countries the differences between enrolment and attendance are large, exceeding 10 percentage points. The EPDC study investigated what might be causing this, based on household surveys and administrative data from 82 developing and transitioning countries. For both net rates, attendance is lower than enrolment in about two-thirds of the countries, and for gross rates, attendance is lower in only half of the countries, but not always the same ones as where net rates are smaller. In some countries gross attendance is smaller than gross enrolment, while the opposite holds for the net rates, and vice versa for other countries. In two-thirds of the countries, the difference between the two rates is small, less than 10 percentage points, but in one-third it is large. The difference between attendance and enrolment rates can be quite large – up to 35 percentage points and more in Angola, Comoros, Eritrea, and both Congo’s. Again, the countries are not consistent, some countries with large gross rate differentials have small net rate differentials and vice versa. In 14 of the 52 countries where both net and gross rates could be compared, the differences were small (<10 percentage points) for one set of rates, but large for the other. The EPDC examined possible causes for these patterns. Two technical hypotheses were tested – the number of grades included in the rates is relevant (hypothesis: where more grades are included this would tend to depress the rates), and the year in which the data is collected is relevant (hypothesis: where the rates are rising, the later rate would tend to be higher). Three data-related hypotheses were tested – some survey series generate more attendance differences with enrolment than others, surveys taken outside the school year tend to produce lower attendance rates, and the formulation of the attendance question(s) affects the outcome. None of the five of these hypotheses could be confirmed, so they must be rejected. This means that other factors, which were not measured, and perhaps are not measurable, cause these differences. Other possible explanations for the differences between attendance and enrolment include:
School attendance and enrolment, November 2007, EPDC 14
- Different sets of schools are included in the administrative data compared to the surveys data (e.g. some surveys may include more private or non-formal school attendance).
- The school age population estimates used for enrolment rates are unreliable. - Administrative data collection is incomplete or contains errors. - The survey is not representative of the population or household members respond
to the school attendance question unreliably (due to complicated survey design or insufficient training of the survey team).
School attendance and enrolment, November 2007, EPDC 15
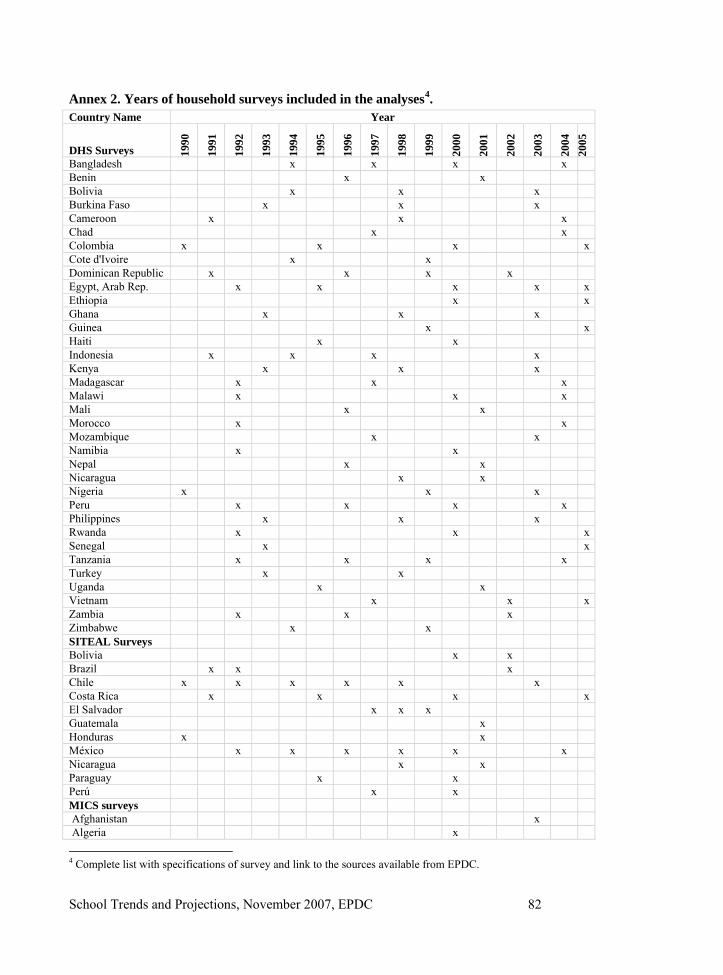
1 Differentials between rural and urban areas over time This analysis focuses on urban-rural attendance differentials, and how they have changed over time in the period from 1990-2006, at the national and at the sub-national level. The analysis includes data for 43 countries from 130 household surveys. Regional school attendance differentials are important both from an inclusive principle – all children have the right to an education, not just those from certain groups – as well as for policy guidance, since the differentials identify certain groups that are being left behind, and perhaps, need focused attention. There are real and large differences in school enrolment and attendance within many countries. The data show there are large differentials in attendance rates by area of residence and by household characteristics such as wealth and education of the parents, in particular, the mother. The first section presents urban and rural attendance rates in the 43 countries over time. In general, attendance in both rural and urban areas is increasing, although the growth rates differ between and within countries. A few countries experienced negative growth of attendance. The second section discusses the ratios of urban and rural attendance rates. Ideally, attendance rates for both urban and rural areas should be converging towards 100 and the ratio should be converging towards 1. This is often, but not always, the case, as the analysis shows. The third section looks at the data one level deeper; namely ratios of urban and rural attendance at the sub-national level. This level of detail is available only for 14 countries; these show that, in general, the ratios of urban-rural attendance are converging towards 1 in most sub-regions of countries, but that there can be considerable differences in how fast this is occurring. We don’t know at this point whether some sub-regions have stronger rural school attendance programs than others, or what other regional factors might underlie such differences. The analysis of urban and rural attendance at the national level includes 43 countries, 38 of which have data points for two separate pre- and post-Dakar years. Data for 33 of the 43 countries come from EPDC extractions from DHS datasets; the remaining 10 countries are from the SITEAL report provided by GMR and derived from household surveys administered by national governments. There are two countries, Bolivia and Peru, for which both DHS extractions and SITEAL data exist. In the case of Bolivia, both ratios (1998 and 2003) are calculated using DHS extractions; in the case of Peru, the 2000 ratio is taken from SITEAL data and the 2004 ratio is calculated from a DHS extraction. Table 1 shows the surveys which are included in this analysis and the years in which they were taken. For almost all countries at least two surveys are available; in many cases 3 or 4 and for a few countries 5 surveys. A basic analysis of the sub-national differences in urban and rural attendance is done for all 43 countries. For an analysis of the change over time of sub-national urban/rural attendance differences, only 16 countries could be included; many countries had to be dropped because the sub-national regions were not the same from one survey to the next, or because the sample size in the surveys were too small for this fine-grained analysis.
School attendance and enrolment, November 2007, EPDC 16
Table 1. Surveys included in analysis of rural and urban net attendance over time. Country Name Year
DHS Surveys 1990
1991
1992
1993
1994
1995
1996
1997
1998
1999
2000
2001
2002
2003
2004
20
05
Bangladesh x x x x Benin x x Bolivia x x x Burkina Faso x x x Cameroon x x x Chad x x Colombia x x x x Cote d'Ivoire x x Dominican Republic x x x x Egypt, Arab Rep. x x x x x Ethiopia x x Ghana x x x Guinea x x Haiti x x Indonesia x x x x Kenya x x x Madagascar x x x Malawi x x x Mali x x Morocco x x Mozambique x x Namibia x x Nepal x x Nicaragua x x Nigeria x x x Peru x x x x Philippines x x x Rwanda x x x Senegal x x Tanzania x x x x Turkey x x Uganda x x Vietnam x x x Zambia x x x Zimbabwe x x SITEAL Surveys Bolivia x x Brazil x x x Chile x x x x x x Costa Rica x x x x El Salvador x x x Guatemala x Honduras x x México x x x x x x Nicaragua x x Paraguay x x Perú x x
School attendance and enrolment, November 2007, EPDC 17
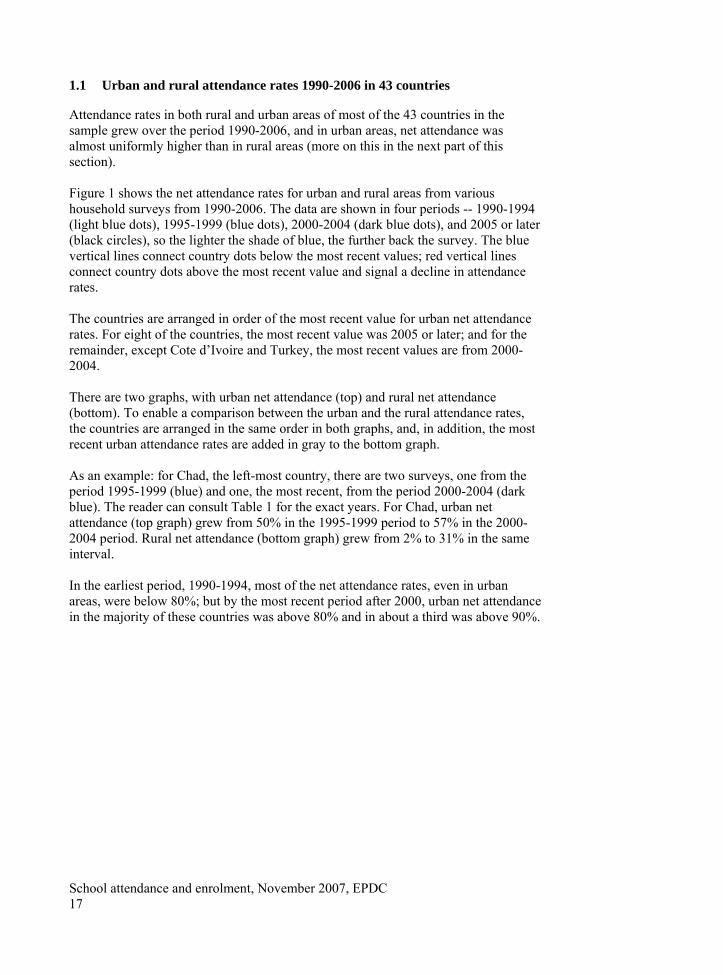
1.1 Urban and rural attendance rates 1990-2006 in 43 countries
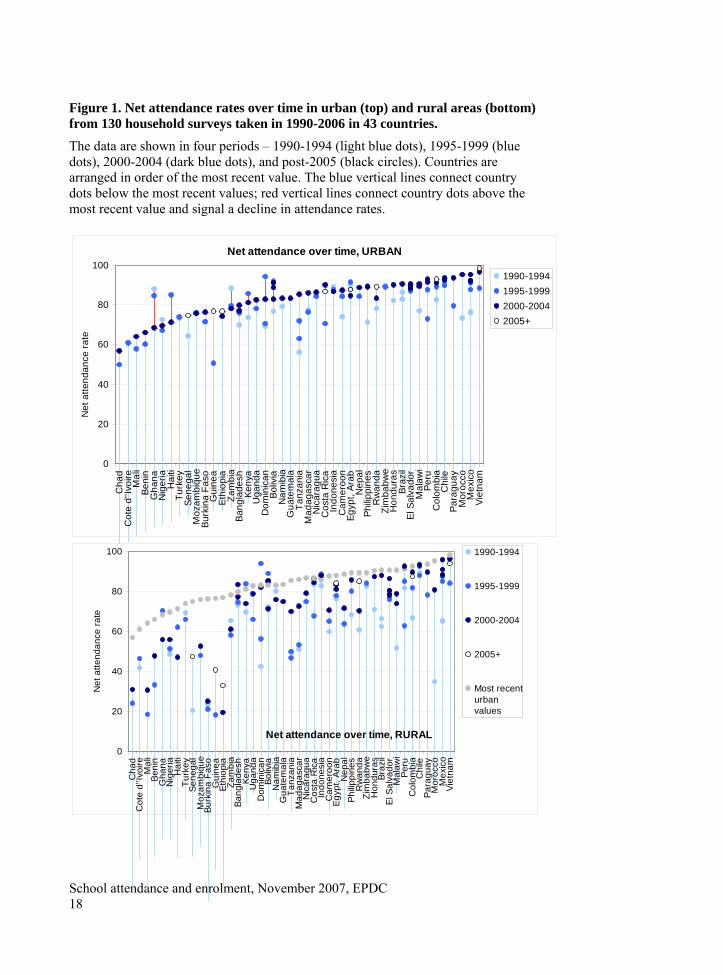
Attendance rates in both rural and urban areas of most of the 43 countries in the sample grew over the period 1990-2006, and in urban areas, net attendance was almost uniformly higher than in rural areas (more on this in the next part of this section). Figure 1 shows the net attendance rates for urban and rural areas from various household surveys from 1990-2006. The data are shown in four periods -- 1990-1994 (light blue dots), 1995-1999 (blue dots), 2000-2004 (dark blue dots), and 2005 or later (black circles), so the lighter the shade of blue, the further back the survey. The blue vertical lines connect country dots below the most recent values; red vertical lines connect country dots above the most recent value and signal a decline in attendance rates. The countries are arranged in order of the most recent value for urban net attendance rates. For eight of the countries, the most recent value was 2005 or later; and for the remainder, except Cote d’Ivoire and Turkey, the most recent values are from 2000-2004. There are two graphs, with urban net attendance (top) and rural net attendance (bottom). To enable a comparison between the urban and the rural attendance rates, the countries are arranged in the same order in both graphs, and, in addition, the most recent urban attendance rates are added in gray to the bottom graph. As an example: for Chad, the left-most country, there are two surveys, one from the period 1995-1999 (blue) and one, the most recent, from the period 2000-2004 (dark blue). The reader can consult Table 1 for the exact years. For Chad, urban net attendance (top graph) grew from 50% in the 1995-1999 period to 57% in the 2000-2004 period. Rural net attendance (bottom graph) grew from 2% to 31% in the same interval. In the earliest period, 1990-1994, most of the net attendance rates, even in urban areas, were below 80%; but by the most recent period after 2000, urban net attendance in the majority of these countries was above 80% and in about a third was above 90%.
School attendance and enrolment, November 2007, EPDC 18
Figure 1. Net attendance rates over time in urban (top) and rural areas (bottom) from 130 household surveys taken in 1990-2006 in 43 countries.
The data are shown in four periods – 1990-1994 (light blue dots), 1995-1999 (blue dots), 2000-2004 (dark blue dots), and post-2005 (black circles). Countries are arranged in order of the most recent value. The blue vertical lines connect country dots below the most recent values; red vertical lines connect country dots above the most recent value and signal a decline in attendance rates.
Net attendance over time, URBAN
0
20
40
60
80
100
Cha
dC
ote
d''Iv
oire
Mal
iBe
nin
Gha
naN
iger
iaH
aiti
Turk
eySe
nega
lM
ozam
biqu
eBu
rkin
a Fa
soG
uine
aEt
hiop
iaZa
mbi
aBa
ngla
desh
Keny
aU
gand
aD
omin
ican
Boliv
iaN
amib
iaG
uate
mal
aTa
nzan
iaM
adag
asca
rN
icar
agua
Cos
ta R
ica
Indo
nesi
aC
amer
oon
Egyp
t, Ar
abN
epal
Philip
pine
sR
wan
daZi
mba
bwe
Hon
dura
sBr
azil
El S
alva
dor
Mal
awi
Peru
Col
ombi
aC
hile
Para
guay
Mor
occo
Mex
ico
Viet
nam
Net
atte
ndan
ce ra
te
1990-19941995-19992000-20042005+
Net attendance over time, RURAL0
20
40
60
80
100
Cha
dC
ote
d''Iv
oire
Mal
iBe
nin
Gha
naN
iger
iaH
aiti
Turk
eySe
nega
lM
ozam
biqu
eBu
rkin
a Fa
soG
uine
aEt
hiop
iaZa
mbi
aBa
ngla
desh
Keny
aU
gand
aD
omin
ican
Boliv
iaN
amib
iaG
uate
mal
aTa
nzan
iaM
adag
asca
rN
icar
agua
Cos
ta R
ica
Indo
nesi
aC
amer
oon
Egyp
t, Ar
abN
epal
Philip
pine
sR
wan
daZi
mba
bwe
Hon
dura
sBr
azil
El S
alva
dor
Mal
awi
Peru
Col
ombi
aC
hile
Para
guay
Mor
occo
Mex
ico
Viet
nam
Net
atte
ndan
ce ra
te
1990-1994
1995-1999
2000-2004
2005+
Most recenturbanvalues
School attendance and enrolment, November 2007, EPDC 19
In the rural areas, net attendance rates in each country are almost all below the gray dots of the most recent urban net attendance rates. Noticeable is the variation in the distance between the urban gray dots and the blue points for the rural net attendance rates. For example, in Bangladesh, Kenya and Uganda, the rural attendance rates are similar to the urban rates (clustered around the gray dots); but in Chad and Mali, on the left-hand side, the rural rates are far below the urban values. In general, the larger differences are on the left-hand side of the graph: where urban net attendance is lower (below 80%), the rural/urban attendance ratio is also lower. The absolute changes in net attendance ratios are not comparable because they represent changes over varying periods of time. For example, the surveys for Colombia span 15 years (1990-2005); those for Costa Rica 14; and those for Rwanda, Cameroon, Nigeria, Egypt and Chile span 13 years; while there is only a 3 year observation period for Nicaragua (1998-2001). To compare the growth rates across countries, a better indicator is the average annual rate of change –computed as the log of net attendance in the most recent year divided by net attendance in the oldest year, divided by the length of the interval:
( )12
1
2ln
yearyearNARNAR
−
⎟⎟⎠
⎞⎜⎜⎝
⎛
Equation 1
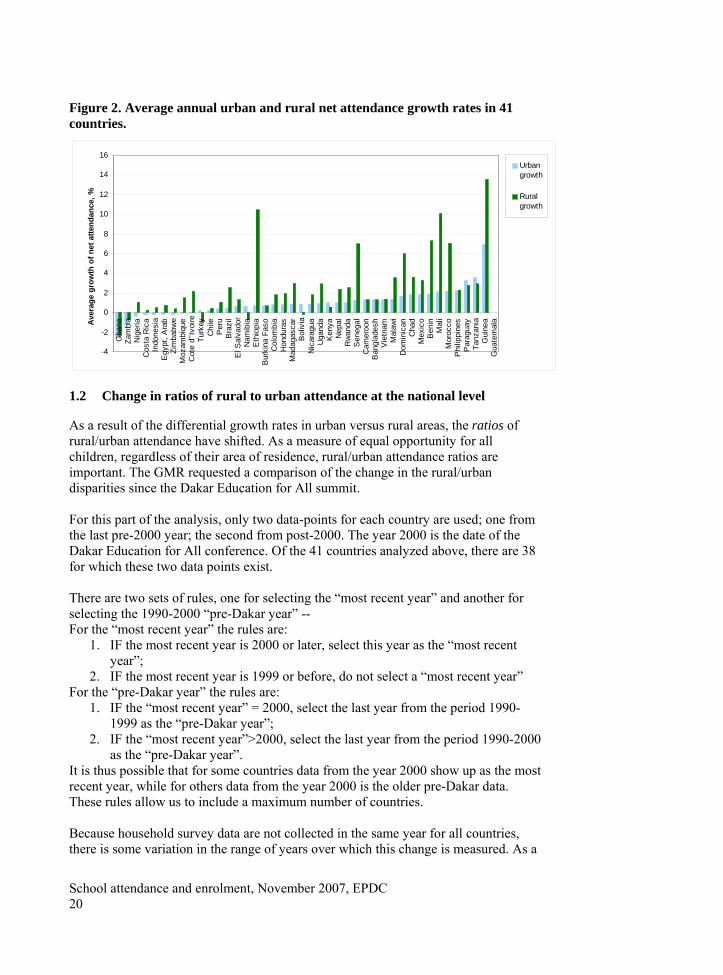
Figure 2 shows the average annual urban and rural net attendance growth for 41 countries, arranged in ascending order by annual average rate of change in the urban areas. In most countries, the average growth in both urban and rural areas is positive. Rural growth is generally higher than urban attendance growth. Easily visible are the extremely high growth rates in the rural areas of some countries, such as Ethiopia, Senegal, Dominican Republic, Benin, Mali, Morocco, and Guinea; in fact, in 33 of the 41 countries, rural growth rates exceed those of urban areas (in an additional two where there was negative attendance growth, the rural declines were less than the urban).
School attendance and enrolment, November 2007, EPDC 20
Figure 2. Average annual urban and rural net attendance growth rates in 41 countries.
-4
-2
0
2
4
6
8
10
12
14
16
Gha
naZa
mbi
aN
iger
iaC
osta
Ric
aIn
done
sia
Egy
pt, A
rab
Zim
babw
eM
ozam
biqu
eC
ote
d''Iv
oire
Turk
eyC
hile
Per
uB
razi
lE
l Sal
vado
rN
amib
iaE
thio
pia
Bur
kina
Fas
oC
olom
bia
Hon
dura
sM
adag
asca
rB
oliv
iaN
icar
agua
Uga
nda
Ken
yaN
epal
Rw
anda
Sen
egal
Cam
eroo
nB
angl
ades
hV
ietn
amM
alaw
iD
omin
ican
Cha
dM
exic
oB
enin
Mal
iM
oroc
coP
hilip
pine
sP
arag
uay
Tanz
ania
Gui
nea
Gua
tem
alaAv
erag
e gr
owth
of n
et a
ttend
ance
, %
Urbangrowth
Ruralgrowth
1.2 Change in ratios of rural to urban attendance at the national level
As a result of the differential growth rates in urban versus rural areas, the ratios of rural/urban attendance have shifted. As a measure of equal opportunity for all children, regardless of their area of residence, rural/urban attendance ratios are important. The GMR requested a comparison of the change in the rural/urban disparities since the Dakar Education for All summit. For this part of the analysis, only two data-points for each country are used; one from the last pre-2000 year; the second from post-2000. The year 2000 is the date of the Dakar Education for All conference. Of the 41 countries analyzed above, there are 38 for which these two data points exist. There are two sets of rules, one for selecting the “most recent year” and another for selecting the 1990-2000 “pre-Dakar year” -- For the “most recent year” the rules are:
1. IF the most recent year is 2000 or later, select this year as the “most recent year”;
2. IF the most recent year is 1999 or before, do not select a “most recent year” For the “pre-Dakar year” the rules are:
1. IF the “most recent year” = 2000, select the last year from the period 1990-1999 as the “pre-Dakar year”;
2. IF the “most recent year”>2000, select the last year from the period 1990-2000 as the “pre-Dakar year”.
It is thus possible that for some countries data from the year 2000 show up as the most recent year, while for others data from the year 2000 is the older pre-Dakar data. These rules allow us to include a maximum number of countries. Because household survey data are not collected in the same year for all countries, there is some variation in the range of years over which this change is measured. As a
School attendance and enrolment, November 2007, EPDC 21
result, the analysis covers a relatively wide range of years for some countries, and a relatively short range of years for others. The widest range of years represented in the table is 12 years for Morocco (1992-2004) and Senegal (1993-2005), and the shortest range of years is three years, for Nicaragua (1998-2001) and Bolivia (2000-2003). The median and mean number of years between measurements are both approximately six. The specific years used for each country are available in Table 2.
Table 2: Dates of the pre- and post-2000 surveys used by country and the length of the interval between surveys
Country Most Recent Year Pre-Dakar Year Interval Length
School attendance and enrolment, November 2007, EPDC 22
Absolute change of the rural/urban attendance ratio since Dakar. Many of the countries in our sample show considerable gains in closing the gap between rural and urban net attendance rates. Figure 3 shows the rural/urban NAR ratio in two years, pre- and post-2000, for the 39 countries included in the analysis. The small horizontal lines are the values before 2000; the triangles the values post-2000; and the vertical lines show the extent of the progress (or regression). Not all countries shown have data for both periods, notably Turkey and Zimbabwe, where the last DHS survey was in 1999. The countries are arranged in ascending order of the earlier rural/urban NAR ratio. The most dramatic improvements are observed in Morocco, Brazil, and Senegal, each of which increased their ratios by more than 0.20. Eight countries showed improvements of between 0.10 and 0.19 points, 14 countries showed improvements of between 0.01 and 0.09 points, and eight countries showed either no change or an increase in the gap between rural and urban net attendance rates. Among these, the most dramatic losses were observed in Kenya, Haiti (both minus 0.07 points), Bolivia (minus 0.08 points) and Namibia (minus 0.10 points). As a general rule, countries which started with a relatively low ratio in the 1990s tended to post the most dramatic gains, whereas countries which had high ratios in the 1990s were more likely to show either losses or a very small change in the ratio of rural to urban NAR.
Figure 3. Rural/urban NAR ratio in two years, pre- and post-2000, for 39 countries
Change in R/U NAR ratio since Dakar
0.0
0.2
0.4
0.6
0.8
1.0
1.2
Eth
iopi
aB
urki
na F
aso
Sen
egal
Mal
iG
uine
aM
oroc
coC
had
Ben
inM
ozam
biqu
eTa
nzan
iaM
adag
asca
rH
aiti
Zam
bia
Bra
zil
Nep
alN
iger
iaC
amer
oon
Mal
awi
Gha
naR
wan
daU
gand
aH
ondu
ras
El S
alva
dor
Nic
arag
uaP
hilip
pine
sB
oliv
iaC
osta
Ric
aE
gypt
, Ara
b R
ep.
Vie
tnam
Mex
ico
Ken
yaP
arag
uay
Col
ombi
aP
eru
Dom
inic
an R
epub
licB
angl
ades
hC
hile
Indo
nesi
aN
amib
ia
R/U
NAR
ratio
Most Recent Year Last Year Before 2000
School attendance and enrolment, November 2007, EPDC 23
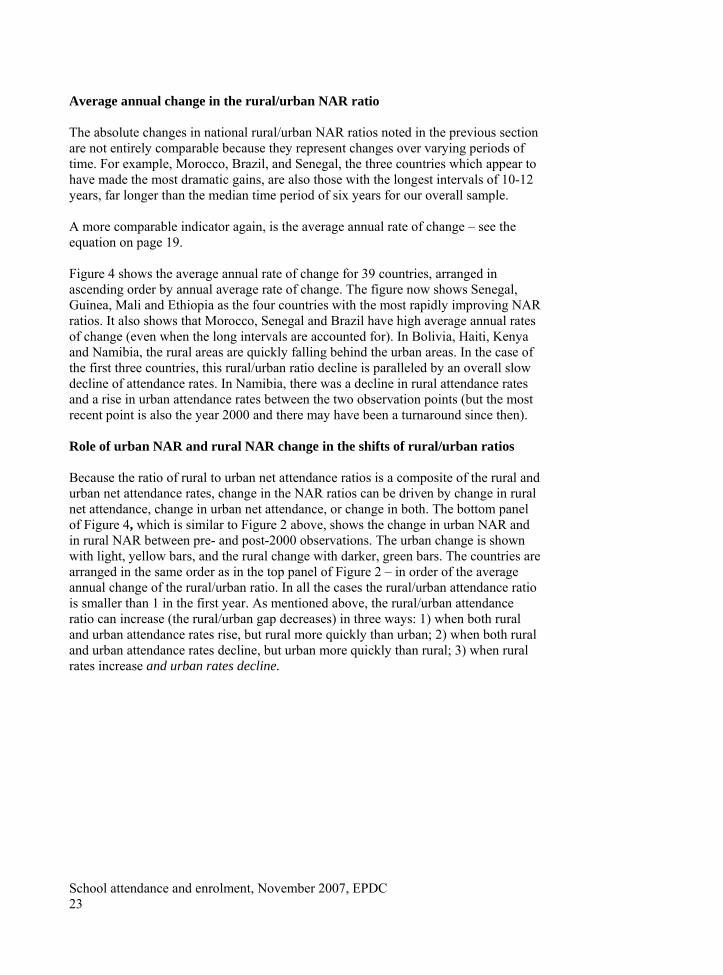
Average annual change in the rural/urban NAR ratio The absolute changes in national rural/urban NAR ratios noted in the previous section are not entirely comparable because they represent changes over varying periods of time. For example, Morocco, Brazil, and Senegal, the three countries which appear to have made the most dramatic gains, are also those with the longest intervals of 10-12 years, far longer than the median time period of six years for our overall sample. A more comparable indicator again, is the average annual rate of change – see the equation on page 19. Figure 4 shows the average annual rate of change for 39 countries, arranged in ascending order by annual average rate of change. The figure now shows Senegal, Guinea, Mali and Ethiopia as the four countries with the most rapidly improving NAR ratios. It also shows that Morocco, Senegal and Brazil have high average annual rates of change (even when the long intervals are accounted for). In Bolivia, Haiti, Kenya and Namibia, the rural areas are quickly falling behind the urban areas. In the case of the first three countries, this rural/urban ratio decline is paralleled by an overall slow decline of attendance rates. In Namibia, there was a decline in rural attendance rates and a rise in urban attendance rates between the two observation points (but the most recent point is also the year 2000 and there may have been a turnaround since then). Role of urban NAR and rural NAR change in the shifts of rural/urban ratios Because the ratio of rural to urban net attendance ratios is a composite of the rural and urban net attendance rates, change in the NAR ratios can be driven by change in rural net attendance, change in urban net attendance, or change in both. The bottom panel of Figure 4, which is similar to Figure 2 above, shows the change in urban NAR and in rural NAR between pre- and post-2000 observations. The urban change is shown with light, yellow bars, and the rural change with darker, green bars. The countries are arranged in the same order as in the top panel of Figure 2 – in order of the average annual change of the rural/urban ratio. In all the cases the rural/urban attendance ratio is smaller than 1 in the first year. As mentioned above, the rural/urban attendance ratio can increase (the rural/urban gap decreases) in three ways: 1) when both rural and urban attendance rates rise, but rural more quickly than urban; 2) when both rural and urban attendance rates decline, but urban more quickly than rural; 3) when rural rates increase and urban rates decline.
School attendance and enrolment, November 2007, EPDC 24
Figure 4. Average annual change in the rural/urban NAR ratio for 39 countries (top) and change in urban NAR and in rural NAR between pre- and post-2000 (bottom), arranged in ascending arrangement by the average annual rate of change of the rural/urban ratio.
-4%
-2%
0%
2%
4%
6%
8%
10%
Bol
ivia
Hai
tiK
enya
Nam
ibia
Par
agua
yC
hile
Gha
naD
omin
ican
Col
ombi
aV
ietn
amIn
done
sia
Egy
pt, A
rab
Per
uC
amer
oon
Nic
arag
uaH
ondu
ras
Ban
glad
esh
Zam
bia
Nig
eria
Mex
ico
Cos
ta R
ica
Nep
alM
alaw
iP
hilip
pine
sM
ozam
biqu
eC
had
Uga
nda
Bur
kina
Rw
anda
Bra
zil
El S
alva
dor
Mad
agas
car
Tanz
ania
Mor
occo
Ben
inS
eneg
alG
uine
aM
ali
Eth
iopi
a
Aver
age
annu
al c
hang
e R
/U N
AR r
atio
s
-10
-5
0
5
10
15
Boliv
iaH
aiti
Keny
aN
amib
iaPa
ragu
ayC
hile
Gha
naD
omin
ican
Col
ombi
aVi
etna
mIn
done
sia
Egyp
t, Ar
abPe
ruC
amer
oon
Nic
arag
uaH
ondu
ras
Bang
lade
shZa
mbi
aN
iger
iaM
exic
oC
osta
Ric
aN
epal
Mal
awi
Philip
pine
sM
ozam
biqu
eC
had
Uga
nda
Burk
ina
Rw
anda
Braz
ilEl
Sal
vado
rM
adag
asca
rTa
nzan
iaM
oroc
coBe
nin
Sene
gal
Gui
nea
Mal
iEt
hiop
ia
Ave
rage
ann
ual g
row
th U
/R N
AR
ratio
% Urban Change % rate Rural change % rate
Most countries - 22 out of 39 - experienced increases in rural and urban attendance rates, but larger increases in rural rates. The five countries where the rural/urban ratio rose most quickly are ones where the growth of rural attendance was very rapid (more than 5% annually), while urban growth was much slower, except in Senegal, where both rural and urban attendance rates rose quickly. In eight countries where the
School attendance and enrolment, November 2007, EPDC 25
rural/urban attendance ratio improved, rural enrolment increased while urban enrolment declined or stagnated. In a minority of countries 8 out of 39, rural/urban ratios worsened. In six of these countries, both urban and rural rates declined, but the rural rates declined more quickly. Overall, it appears that rural areas are prone to more volatile attendance rate changes, both positive and negative.
1.3 Sub-national rural/urban ratios and change since Dakar.
The next question is how the rural/urban ratios in the sub-national regions have changed within countries. We have already noted that at the national level, in most, but not all countries, the rural/urban ratio came closer to 1 in the post-Dakar period. Overall, as the whole is the sum of its parts, the sub-national rural/urban ratios must also have increased. But is there uniform change within countries or not? Figure 5 plots rural/urban net attendance ratios for regions or provinces within 42 countries in our sample in two time periods, pre-2000 (top) and post-2000 (bottom panel). These graphs can be used to compare the spread of rural/urban ratios across and between countries, but not the progress of specific, identified sub-national regions (the next section turns to the discussion of particular, named sub-national regions). The graphs show the countries arranged in order of their national net attendance ratio, which is shown on the graphs as the ascending black line. On the figures, each green point above a country’s name represents the rural/urban NAR ratio for one region or province within that country. The distribution of points above a particular country can be interpreted to convey two different types of information: 1) rural/urban attendance disparities within a particular region or province; and 2) differences in rural/urban attendance disparities across regions or provinces within the same country. When points representing the ratios for various sub-national units are packed closely together, it means that rural/urban attendance ratios are relatively consistent across the country. When points representing the ratios for various sub-national units are more widely dispersed, it means that there is considerable variation in rural/urban attendance ratios within the country. The figures reveal some general trends:
1. In all countries for which we have data, the rural/urban ratios vary from region to region;
2. The smallest disparities in rural/urban ratios correlate with very low and near universal net attendance rates;
3. The higher the overall net attendance rate, the higher most of the sub-national rural/urban ratios.
It is interesting to note that the range of ratio values for sub-national units is considerably broader than it is for national units – sub-national ratios ranged from a
School attendance and enrolment, November 2007, EPDC 26
low of 0.08 in one province of Benin to a high of 1.25 in a region of Zambia, while national ratios (Figure 3) ranged from 0.26 in Ethiopia to 1.05 in Bangladesh. This tells us that national-level NAR ratios may tend to mask the considerable variation present within countries. The sub-national regions in the two figures are not necessarily the same, because for some countries the sub-national units changed from one survey to the next. Having said that, the rural/urban ratios in the graph with the more recent data are generally higher than those in the graph with the data from before 2000; sub-national data do appear to reflect the same upward trend in rural/urban NAR ratios as observed in the national data discussed previously. The average pre-Dakar sub-national rural/urban NAR ratio was 0.83; the average post-Dakar ratio was higher at 0.86. The inter-quartile range (middle 50%) of sub-national rural/urban NAR ratios for the pre-Dakar period was 0.74-0.99; the inter-quartile range for the post-Dakar period was higher at 0.78-0.99. The data in the top panel of Figure 5 (pre-2000) exhibit a slight bell-curve pattern, with wide disparities in the middle, but coming to a narrow tail at either end. It appears that countries with either very high or very low overall net attendance rates tend to have relatively low variation in rural/urban NAR ratios across sub-national groupings. In Ethiopia, the country with the lowest pre-Dakar NAR, the difference between high and low rural/urban NAR ratios was 0.08; at the high attendance end of the graph, in Chile, the difference was 0.19. By contrast, countries which fall in the middle of the chart tend to be characterized by larger rural/urban disparities across sub-national groupings. For Nicaragua and Uganda, for example, the two countries with mid-range NAR in the pre-2000 period the differences between highest and lowest rural/urban attendance ratios were 0.47 and 0.50, respectively. In the bottom panel of Figure 5 (post-Dakar) the rural/urban ratios also cluster at the right side of the graph, but clustering in the low-attendance countries on the left of the figure is not evident. The reason for the disappearance of the low-end rural/urban ratio clustering may be that there are no longer countries with the extremely low NAR levels typical of low-end rural/urban ratio clustering. Pre-2000, the five lowest-achieving countries (Ethiopia, Burkina Faso, Guinea, Mali, and Chad) had an average overall NAR of 28%; post-2000, the same five countries were still the lowest-achieving, but now had an average overall NAR of 39%, a difference of 11 percentage points. In other words, even the lowest-achieving countries represented in the post-Dakar figure are in the NAR range that (in the pre-Dakar figure) is characterized by greater rural/urban disparities. The overall range of rural/urban ratios across the full sample of countries has not changed much. In the pre-Dakar group, the average difference between the highest and lowest rural/urban NAR ratio for each country was 0.30, with an inter-quartile range of 0.16 to 0.48. In the post-Dakar group, the average difference between the highest and lowest rural/urban NAR ratio for each country was 0.28, with an inter-quartile range of 0.09 to 0.41.
School attendance and enrolment, November 2007, EPDC 27
Figure 5: Subnational rural/urban NAR ratios for 42 countries pre-2000, and for 40 countries post-2000. Data is grouped by country and arranged in order of ascending national net attendance ratio.
R/U NAR ratio subnational, last year before 2000
Eth
iopi
aB
urki
na F
aso
Gui
nea
Mal
iC
had
Sen
egal
Ben
inM
oroc
coC
ote
d''Iv
oire
Tanz
ania
Moz
ambi
que
Hai
tiN
iger
iaM
adag
asca
rN
epal
Zam
bia
Uga
nda
Cam
eroo
nTu
rkey
Rw
anda
Gha
naH
ondu
ras
Mal
awi
Ban
glad
esh
Nam
ibia
Bra
zil
Nic
arag
uaE
l Sal
vado
rK
enya
Phi
lippi
nes
Vie
tnam
Egy
pt, A
rab
Rep
.
Cos
ta R
ica
Indo
nesi
aB
oliv
iaC
olom
bia
Mex
ico
Par
agua
yP
eru
Chi
leD
omin
ican
Rep
ublic
Zim
babw
e0.0
0.5
1.0
1.5
R/U
NA
R ra
tio
0
50
100
150
Nat
iona
l NA
R
National NAR
R/U NAR ratio subnational, most recent year
Bur
kina
Fas
oC
had
Eth
iopi
aM
ali
Gui
nea
Ben
inH
aiti
Sen
egal
Moz
ambi
que
Nig
eria
Gha
naZa
mbi
aN
epal
Tanz
ania
Ken
yaM
adag
asca
rG
uate
mal
aN
amib
iaB
oliv
iaC
amer
oon
Uga
nda
Mal
awi
Dom
inic
an R
epub
licB
angl
ades
hN
icar
agua
Egy
pt, A
rab
Rep
.R
wan
daE
l Sal
vado
rC
osta
Ric
aP
hilip
pine
sIn
done
sia
Mor
occo
Col
ombi
aH
ondu
ras
Par
agua
yP
eru
Chi
leB
razi
lV
ietn
am
Turk
eyC
ote
d''Iv
oire
Mex
ico
0.0
0.5
1.0
1.5
R/U
NAR
rat
io
0
50
100
150Na
tiona
l NAR
National NAR
School attendance and enrolment, November 2007, EPDC 28
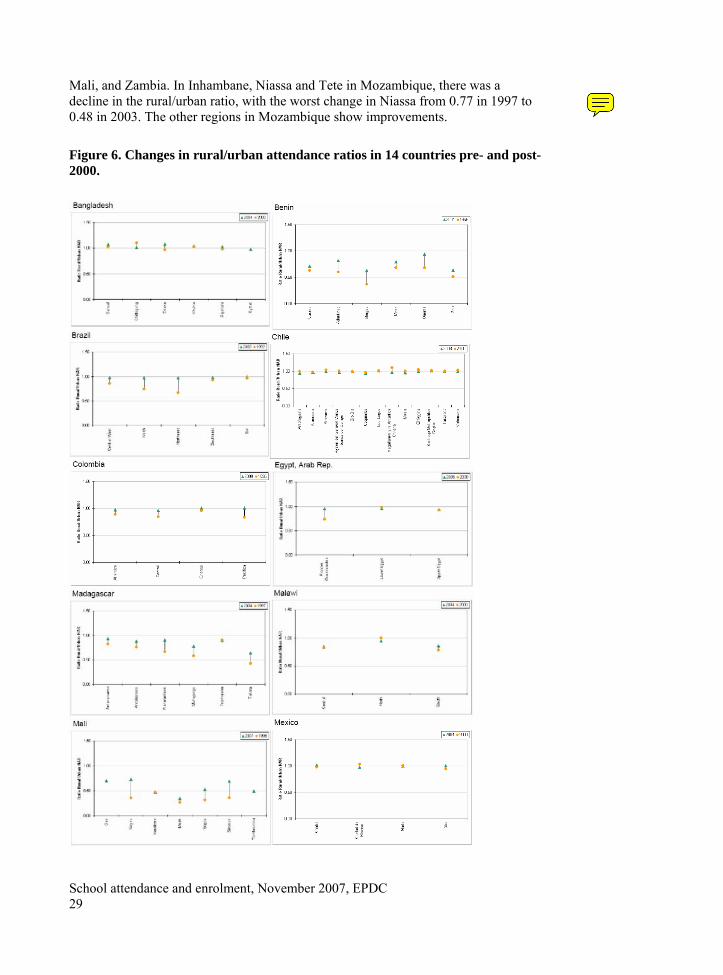
It is possible to look even closer at the sub-national changes in rural/urban attendance ratio, tracking the progress of individual sub-national regions, but only for a smaller sub-set of 14 countries. Not all of the data are available for all regions for two time points. Some regions in some countries had to be eliminated due to small sample sizes. In some surveys, there are some regions with only rural respondents, or with only urban respondents (for example, in a region that is a large city). Finally, for many countries, the regions changed from one survey to the next, so no comparison can be made. Figure 6 shows graphs of the available 14 countries with rural/urban ratios by sub-national region for the same pre- and post-2000 years as used in the previous section. The first year’s data is represented by orange circles and the second year by green triangles. Where there are two years of data available and there are significant differences between the ratios, there is a line drawn between the two points to help visualize magnitude of the change. These charts provide a detailed view of rural/urban disparities at the sub-national level. A crucial marker in all of the charts is the horizontal line at 1.00. This represents the point of rural/urban parity. The further the symbols for the ratios are from this line, the larger the gap is between urban and rural net attendance rates in each region. If points are below 1.00, urban net attendance rates are higher than rural net attendance rates. The converse is true for ratios above 1.00; rural NAR is higher than urban NAR. The trends shown in the graphs are mixed and can be divided into three groups. Countries where there has been very little change. In most of the regions in these countries, the ratio of rural/urban NAR starts close to 1.00 in all regions. This group includes: Bangladesh, Chile, Colombia, Malawi, and Mexico. However, even among these countries where the majority of the regions are doing well, the stock graphs help to reveal the regions that may be behind the others and require more targeted programs. Countries with across the board progress eliminating rural/urban disparities in attendance In a second group of countries, all regions show notable progress in eliminating rural/urban disparities. The countries in this group are: Benin, Brazil, Ethiopia, Madagascar, Mali, Nigeria, Rwanda, and Uganda. Within this group though, not all progress was equal. For example, in the North-East region of Brazil the rural/urban ratio increased from 0.67 in 1992 to 0.97 in 2002, but in the Central-West, South-East and South regions, there was little change over time – these three regions had rural/urban ratios close to 1.00 in both years. In the Oueme region of Benin the rural/urban ratio increased 0.26 points from 0.68 to 0.94, but in the Zou region the change was only 0.13 points from 0.51 to 0.64. Countries with mixed progress In the third group of countries, progress in eliminating rural/urban disparities is unequal – there are some regions where there has been progress and other regions that are going backwards. The countries in this group include: Mozambique, Nicaragua,
School attendance and enrolment, November 2007, EPDC 29
Mali, and Zambia. In Inhambane, Niassa and Tete in Mozambique, there was a decline in the rural/urban ratio, with the worst change in Niassa from 0.77 in 1997 to 0.48 in 2003. The other regions in Mozambique show improvements.
Figure 6. Changes in rural/urban attendance ratios in 14 countries pre- and post-2000.
UNESDOC
Note
Graphs are partially illegible
School attendance and enrolment, November 2007, EPDC 30
UNESDOC
Note
Graphs are partially illegible
School attendance and enrolment, November 2007, EPDC 31
2 Sub-national differences in rural and urban attendance by wealth of region.
One can infer from the review of rural and urban attendance differentials over time, that there are substantial attendance rate differentials within many countries. These sub-national differences, which can match the variation between countries globally, have been given increased attention in recent years - see for example, World Bank EdStats, 2007; UIS/UNICEF 2005; Wils et.al. 2005. These datasets and studies show that at the household level, children of poorer households and with less educated parents (in particular, mothers) are less likely to be in school. The GMR’s question is whether the poverty level of sub-national regions as a whole is also correlated with lower regional attendance rates. To investigate, we use data from 21 DHS household surveys, which provide household wealth index. The wealth index was by Filmer and Pritchett (2001) to measure relative wealth within countries in the absence of income information. It is a composite of material goods owned by the household. From the distribution of wealth indices across all households, one can construct five quintiles of income (upper fifth of incomes, second fifth, etcetera). This provides a cut-off level for each quintile. To estimate the relative income depravation within countries, one can then calculate the portion of households living below the cut-off level for the lowest quintile in each sub-national region. One can expect that in each country there are some regions with greater portions of households living at this lowest income level than in others. With this method, the EPDC calculated relative income depravation, measured as the portion of households in the lowest income quintile, for urban and rural sub-national regions. As it turns out there is considerable variation within countries in the spread of income depravation. With few exceptions, all urban areas have fewer households living in the lowest quintile than even the wealthiest rural areas. Between rural areas, there is, in many countries, a large spread of the portion of households living in the lowest quintile. For example, in Burkina Faso in 2003, in the “wealthiest” rural area, Centre, only 8% of the households were in the lowest quintile, compared to 46% in the “poorest” rural area Sahel. Similarly wide spreads are found in most of the 17 of the 21 countries, but less so in Bangladesh, Egypt, Malawi and Vietnam. To examine the correlation of relative income depravation by region with school attendance, the wealth measures are cross-tabulated with sub-national primary net attendance rates in Figure 7. A linear regression line is shown with the correlation measured by R2. In some countries, there is a clear income-attendance correlation. These include: Burkina Faso, Cameroon, Chad, Ethiopia, and Kenya. In other countries, there is no correlation, and these are also countries with overall high attendance rates: Bangladesh, Egypt, Indonesia, Malawi, Morocco, the Philippines, Rwanda, and to a lesser extent Tanzania (in Tanzania there is one region, rural Tabora, with more income depravation and lower attendance). There are also two countries with a wide income spread and a wide attendance spread but little correlation: Nigeria, Senegal. Finally, in Guinea, there is the exceptional pattern of higher attendance rates in the rural areas with relatively more income depravation.
School attendance and enrolment, November 2007, EPDC 32
To some extent, these correlations must be due to the aggregation of household-level effects – a greater prevalence of poor households, each with a lower attendance rate of its children, will, in the aggregate, add up to lower regional attendance. However, it is also possible that a portion of the correlations is due to regional effects – meaning that the regions with more poverty also have a less developed school system, less access to funding, or some other characteristics that both increase poverty and lower school attendance such as remote, mountainous terrain, or the predominance of a minority ethnic group. To disentangle these effects will require further analysis that was not, at this point, undertaken.
Figure 7. Cross-tabulation of primary net attendance rates by relative income depravation in sub-national regions, rural and urban separated, for 21 countries.
Bangladesh
y = -0.4233x + 84.221R2 = 0.0202
y = -0.5694x + 95.889R2 = 0.1102
0
20
40
60
80
100
0 5 10 15 20 25 30
Portion of HHs in Poorest Quintile
Prim
ary
Net
Atte
ndan
ce R
ate
Rural Urban Burkina Faso
y = -0.5381x + 37.942R2 = 0.4982
0
20
40
60
80
100
0 10 20 30 40 50
Portion of HHs in Poorest Quintile
Prim
ary
Net
Atte
ndan
ce R
ate
RuralUrban
Cameroon
y = -0.983x + 103.9R2 = 0.7507
y = -1.0288x + 92.149R2 = 0.3567
0
20
40
60
80
100
0 20 40 60 80
Portion of HHs in Poorest Quintile
Prim
ary
Net
Atte
ndan
ce R
ate
Rural Urban Chad
y = -0.4978x + 43.005R2 = 0.59950
20
40
60
80
100
0 20 40 60 80 100
Portion of HHs in Poorest Quintile
Prim
ary
Net
Atte
ndan
ce R
ate
Rural Urban
Egypt
0
20
40
60
80
100
0 10 20 30 40 50
Portion of HHs in Poorest Quintile
Prim
ary
Net
Atte
ndan
ce R
ate
RuralUrban
Ethiopia
y = -0.3952x + 43.63R2 = 0.6291
0
20
40
60
80
100
0 20 40 60 80 100
Portion of HHs in Poorest Quintile
Prim
ary
Net
Atte
ndan
ce R
ate
Rural Urban
School attendance and enrolment, November 2007, EPDC 33
Ghana
y = -0.3372x + 66.355R2 = 0.6622
0
20
40
60
80
100
0 20 40 60 80 100
Portion of HHs in Poorest Quintile
Prim
ary
Net
Atte
ndan
ce R
ate
Rural Urban
Guinea
y = 0.4565x + 28.264R2 = 0.4293
0
20
40
60
80
100
0 10 20 30 40 50
Portion of HHs in Poorest Quintile
Prim
ary
Net
Atte
ndan
ce R
ate
Rural Urban
Indonesia
y = -0.0166x + 87.404R2 = 0.0134
0
20
40
60
80
100
0 20 40 60 80 100
Portion of HHs in Poorest Quintile
Prim
ary
Net
Atte
ndan
ce R
ate
Rural Urban
Kenya
y = -0.7794x + 93.589R2 = 0.9689
0
20
40
60
80
100
0 20 40 60 80 100
Portion of HHs in Poorest Quintile
Prim
ary
Net
Atte
ndan
ce R
ate
Rural Urban
Madagascar
y = -0.5359x + 85.324R2 = 0.6295
0
20
40
60
80
100
0 10 20 30 40 50 60
Portion of HHs in Poorest Quintile
Prim
ary
Net
Atte
ndan
ce R
ate
Rural Urban
Malawi
y = -1.179x + 106.26R2 = 0.7799
0
20
40
60
80
100
0 5 10 15 20 25 30
Portion of HHs in Poorest Quintile
Prim
ary
Net
Atte
ndan
ce R
ate
Rural Urban
Morocco
y = -0.2619x + 92.457R2 = 0.3386
0
20
40
60
80
100
0 20 40 60 80
Portion of HHs in Poorest Quintile
Prim
ary
Net
Atte
ndan
ce R
ate
Rural Urban
Mozambique
y = -0.4719x + 67.53R2 = 0.2002
0
20
40
60
80
100
0 10 20 30 40 50
Portion of HHs in Poorest Quintile
Prim
ary
Net
Atte
ndan
ce R
ate
Rural Urban
School attendance and enrolment, November 2007, EPDC 34
Nigeria
y = -0.9939x + 90.508R2 = 0.3485
0
20
40
60
80
100
0 10 20 30 40 50
Portion of HHs in Poorest Quintile
Prim
ary
Net
Atte
ndan
ce R
ate
Rural Urban
Peru
y = -0.1057x + 97.268R2 = 0.2892
0
20
40
60
80
100
0 20 40 60 80 100
Portion of HHs in Poorest Quintile
Prim
ary
Net
Atte
ndan
ce R
ate
Rural Urban
Philippines
0
20
40
60
80
100
0 20 40 60 80
Portion of HHs in Poorest Quintile
Prim
ary
Net
Atte
ndan
ce R
ate
RuralUrban
Rwanda
0
20
40
60
80
100
0 10 20 30 40
Portion of HHs in Poorest Quintile
Prim
ary
Net
Atte
ndan
ce R
ate
RuralUrban
Senegal
0
20
40
60
80
100
0 10 20 30 40 50 60
Portion of HHs in Poorest Quintile
Prim
ary
Net
Atte
ndan
ce R
ate
RuralUrban
Tanzania
0
20
40
60
80
100
0 10 20 30 40 50 60
Portion of HHs in Poorest Quintile
Prim
ary
Net
Atte
ndan
ce R
ate
RuralUrban
Vietnam
0
20
40
60
80
100
0 10 20 30 40
Portion of HHs in Poorest Quintile
Prim
ary
Net
Atte
ndan
ce R
ate
RuralUrban
School attendance and enrolment, November 2007, EPDC 35
3 Non-formal education In some countries, where there are gaps in the formal public and private education systems, non-formal education programs are a way to reach children, youth, and adults with instruction. Non-formal programs are an umbrella designation for a wide array of activities, including alternative primary schools, youth training, literacy programs, and professional education. A good inventory of non-formal programs does not exist, and, given the dispersed nature of these programs, is unlikely to come about in the near future. Still, a picture of education would not be complete without the inclusion of non-formal training and schooling. This study is an inventory of how many people attend or have attended non-formal programs. It also estimates the level of the non-formal programs by using income effects of the programs. The source of information is a set of 28 MICS household surveys, which include a category “non-standard curriculum” in the questionnaire. In some countries non-formal school attendance comprises up to 10% of the total school attendance of primary school-age children – a significant proportion. In other countries, non-formal schooling affects mainly youth – in the form of job training for example, or adults – as job training or literacy programs. What kinds of programs are these? What is the scale of these programs in countries – or, how many people have had at least a part of their education in non-formal programs? In this section, we approach these questions in two ways: 1) Scale and extent of non-formal programs – by measuring the proportion of
household members who are attending non-formal programs or indicate some form of non-formal program as their highest level of education attainment.
2) Level of education or training given by the non-formal programs – by looking at:
a. Age-specific attendance of non-formal programs – the age-distribution of participants in non-formal programs can give insight into the type of program, with alternative primary schools reaching mostly school-age children; youth and work programs reaching people in their teens and early twenties; adult literacy programs.
b. Non-formal schooling and wealth outcome – we can compare the wealth outcome of formal education levels – the idea being that if the average wealth of a group with non-formal is equal to, say, the wealth of those with complete primary education, then we will assume that the non-formal programs on average correspond to finishing primary school.
3.1 Definition of non-formal programs in MICS surveys
The GMR investigated which household surveys include non-formal education, and concluded that in general, the collection of questions about non-formal education is too varied to allow an international comparison and inventory (informal exchange in early 2006). The only series of household surveys that has consistent and comparable
School attendance and enrolment, November 2007, EPDC 36
questions on non-formal education are 28 MICS surveys from 2000 that include the non-standard curriculum. The MICS surveys include the following levels of schooling: pre-primary, primary, secondary, higher, and non-standard curriculum. The analysis is based on these 28 household surveys. The survey manual distinguishes between the three levels of formal schooling and non-standard curriculum in two paragraphs (UNICEF 2007:A3.12):
“The term ‘school’ includes primary, secondary and post-secondary schooling, as well as any other intermediate levels of schooling in the formal school system. It also includes technical or vocational training beyond the primary-school level, such as long-term courses in mechanics or secretarial work. Schools that carry out non-standard curriculum are also included here. Ensure that respondents understand what is meant by ‘non-standard curriculum’. A non-standard curriculum includes religious schools, such as Koranic schools, that do not teach a full, standard school curriculum. If a school teaches religious courses but also includes the standard curriculum – such as many Catholic schools – it would be coded as a standard school. “
According to this formulation, the non-standard schools cover a range of activities outside the standard curriculum, and could include any of the types of non-formal schooling mentioned above - alternative schooling for school-age children, youth to work programs, literacy, as well as the religious schooling mentioned in the MICS manual. Beyond this general distinction from formal schools, there is no further specification about the non-formal programs. Section 3.3 uses wealth outcomes to indicate something about the level, if not the content, of the programs.
3.2 Scale and extent of non-formal programs
How many people in developing countries make use of, and benefit from, non-formal programs? Are they an important slice of the education system? This section uses information about attendance in non-formal programs and education attainment to make an inventory of the scale and extent of non-formal programs. Some of the numbers in this section are still an under-estimate of the actual extent of non-formal programs. The education attainment data provides “non-formal” only if this was the highest form of education that the respondent received; if the respondent started out with a non-formal program but then proceeded to a higher level of formal education the non-formal portion of that person’s education is not counted. That aside, non-formal attendance and attainment provide a first indication of how many people are receiving non-formal education in developing countries. This study uses four measures of non-formal education: attendance rates of children of primary and of secondary school age; and non-formal education attainment for youth, age 15-24 and adults 25 and older.
School attendance and enrolment, November 2007, EPDC 37
In summary, the MICS surveys indicate that non-formal education is a significant portion of the education system overall, between 5 and 30%, in a number of sub-Saharan countries, where levels of formal education are among the lowest in the continent, namely Burundi, Chad, Gambia, Guinea-Bissau, Niger, and Senegal. In addition, Myanmar has relatively high levels of non-formal education. If the non-formal education has a similar or equivalent level compared to formal programs, the enrolment and attendance rates in these countries may be under-estimated. In about half of the 28 countries (depending on the measurement), non-formal education reaches less than 1% of the population; in others, the levels are small, from 1-5%. Table 3 shows four non-formal education measures: the attendance rate for primary school-age children, secondary school-age teenagers, and the percentage of youth (age 15-24 and other adults (25+) who list non-formal education as their highest attainment. Depending on the indicator, non-formal education affects less than 1% of the population in a little over half to half of the countries, that is, it is an insignificant portion of the education system overall – although it may be very important for the particular sections of the population that it reaches. On the other hand, non-formal education is significant, affecting 5% of more of the children in school or attainment level of youth or adults, in 7 of the 28 countries. Notable is the high portion of African countries with higher levels of non-formal education. Children of primary as well as secondary school age attend non-formal programs in most of the countries studied here, in some countries a significant portion. In Burundi, 10% of the secondary school-age children was attending a non-formal program, equivalent to about two thirds of total secondary school attendance. In Chad, about 8% of both primary and secondary age children attend a non-formal program, and for secondary school-age children this represents half of all attendance in that age-group. In general, the adults over 25 have higher levels of non-formal education attainment than youth 15-24. For example, in Myanmar, only 4.4% of the youth 15-24 have non-formal education as their highest level; compared to 17.9% of the adults. One possible reason is that formal schooling has increased significantly in recent years, and for the youth, has replaced non-formal education. Another possibility is that non-formal education in Myanmar is largely adult-focused, as in the form of adult literacy classes, remedial primary or secondary schooling, or job training. Also, there is some indication that countries continue long traditions of commitment to non-formal education – the attendance rates of children in non-formal schooling mirror the non-formal attainment rates of the adults. This also suggests (albeit inconclusively) that for those people who receive non-formal education it is the last and highest education form.
School attendance and enrolment, November 2007, EPDC 38
Table 3. Scale and extent of non-formal education programs in 28 countries, measured by the non-formal attendance rate of primary school age children, secondary school age teenagers, and highest education attainment is non-formal for youth (15-24) and other adults (25+). Source: MICS surveys, 2000.
In most countries, males appear more likely to have non-formal education than females as shown in Figure 8, with the portion of household members with the highest attainment as non-formal education shown by sex for the 25+ age group. The one exception to this rule is Burundi. The gender pattern is similar for attendance and also younger age-groups for attainment (not shown). Non-formal education is prevalent in both urban and rural areas. Figure 9 shows the portion of household members age 25+ with the highest attainment as non-formal
Comment [c1]: Something missing here; the “is” does not make sense?
School attendance and enrolment, November 2007, EPDC 39
education by area. For a number of countries with relatively low to moderate overall levels of non-formal training, non-formal training is more prevalent in the urban regions; in those countries with overall high levels of non-formal training, it is more prevalent in the rural areas. As it turns out, the countries with extensive, more rural non-formal programs are the same ones where, as the next section shows, non-formal appears to be correlated with the same poverty levels as no schooling at all – indicating that non-formal there is either of a very basic, pre-primary level, or that it selectively reaches people who will remain poor even with non-formal training. And, the next section also shows, in the same countries where non-formal is more prevalent in the urban areas, non-formal training is correlated with low poverty levels (approaching those of people with secondary education) suggesting that the more urban non-formal programs are of a higher training level.
Figure 8. Percentage of adults age 25+ with non-formal education as the highest level, by gender. Data from MICS 2000 surveys.
05
10152025303540
Uzb
ekis
tan
Rw
anda
Sao
Tom
e &
Prin
cipe
Ken
ya
Leso
tho
Sud
an S
outh
Mol
dova
Guy
ana
Cen
tral A
frica
n R
epub
lic
Sie
rra L
eone
Tajik
ista
nV
ietn
am
Cam
eroo
n
Sud
an N
orth
Sw
azila
nd
Lao
PD
R
Bol
ivia
Con
go, D
em R
ep.
Com
oros
Cot
e d'
Ivoi
reTo
go
Gui
nea-
Bis
sau
Sen
egal
Cha
d
Mya
nmar
Gam
bia
Nig
er
Bur
undi
Perc
enta
ge o
f adu
lts 2
5+ Female Male
Figure 9. Percentage of adults age 25+ with non-formal education as the highest level, by urban and rural residence. Data from MICS 2000 surveys
0
5
10
15
20
25
30
35
Rw
anda
Uzb
ekis
tan
Leso
tho
Ken
ya
Sao
Tom
e &
Prin
cipe
Cen
tral A
frica
n R
epub
lic
Sie
rra L
eone
Tajik
ista
n
Guy
ana
Mol
dova
Togo
Sud
an N
orth
Cot
e d'
Ivoi
re
Bol
ivia
Con
go, D
em R
ep.
Gui
nea-
Bis
sau
Vie
tnam
Sw
azila
nd
Cam
eroo
n
Lao
PD
R
Com
oros
Cha
d
Sen
egal
Nig
er
Gam
bia
Mya
nmar
Bur
undi
Perc
enta
ge o
f adu
lts 2
5+ Rural Urban
Comment [c2]: Aix says “portion” rather than “percentage”
School attendance and enrolment, November 2007, EPDC 40
3.3 The scope and content of non-formal programs
As mentioned, the category of programs that fall under non-formal education can cover a wide range. The MICS surveys provide no further detail as to the contents. So we look for another indicator that might provide insight - the outcome of education measured by income. For formal education, there is a well-established relationship between an adult’s level of education attained and outcomes such as that person’s income or wealth, health and the schooling of their children. The same should apply to non-formal education. If we compare these outcomes for formal education with those with non-formal education, this gives an indication of the average level of the non-formal programs. In this section, we look first at the poverty incidence of households by the education of the head of the household, including formal and non-formal levels, and second we look at the sub-national level, at poverty incidence in sub-national regions and the spread of non-formal education. Non-formal education and poverty at the household level We first look at the household level, and how likely it is for a household to be among the poorest 20% in the country, by the education level of the head of the household. Being in the lowest 20% is an indication at least of relative poverty – although the absolute level differs from country to country. For the education categories, six categories are included: no education, non-formal education, some primary, completed primary, some secondary, completed secondary, for each country. Figure 10 shows the relative poverty incidence by these six education attainment categories. The education levels are arranged from lowest (no schooling) to highest (completed secondary), with non-formal next to no schooling. Non-formal education is highlighted with a bolded circle; the other education levels are designated with small, orange triangles. With regards to the formal education levels, there is a clear gradient of poverty - the higher the level of education attainment, the lower the poverty incidence. But with regards to non-formal schooling, there are clear differences from country to country. In one group of countries, the poverty levels of households headed by a person with non-formal education are close or equal to the poverty incidence of people with no schooling: Cameroon, Chad, Comoros, Gambia, Niger, Senegal, Sudan North and South. In these countries, we conclude, non-formal education is of a very basic level, and its effect on income is not clear. In Chad, the Gambia, Senegal, and South Sudan, the poverty incidence with non-formal schooling is even higher than for those with no education at all. Four of these countries – Chad, the Gambia, Niger and Senegal, are those where non-formal education is highly prevalent. Why are these groups with non-formal education as poor or poorer as those with no education at all? Perhaps because non-formal schooling programs are specifically targeting very poor groups. Another possible explanation is that the non-formal programs are ineffective, at least, for removing poverty.
School attendance and enrolment, November 2007, EPDC 41
In a second group of countries the poverty incidence of household headed by a person with non-formal education is close to the poverty incidence for those with primary education: Burundi, Central African Republic, Lesotho, Moldova, Myanmar, Sao Tome, Sierra Leone, Swaziland and Vietnam. Finally, in a third group of countries non-formal education appears to be of a more professional, skilled level, complementing formal education – the poverty incidence of those with non-formal education is equal to or lower than that of households headed by a person with secondary education: Bolivia, Democratic Republic of Congo, Cote d’Ivoire, Guinea-Bissau, Guyana, Kenya, Laos, Rwanda, Tajikistan, and Togo. These categories provide only hypotheses for each country regarding the average level of non-formal training. A further, more field- and program-based analysis could investigate a number of these countries, and confirm whether indeed, the non-formal programs in these countries conform to the levels hypothesized here. If the results were consistent with the hypotheses for a number of countries, one might venture to extrapolate it to other countries, and use wealth outcomes as an indication of non-formal program content.
School Trends and Projections, November 2007, EPDC 42
Figure 10. Estimated poverty incidence (people in the lowest income quintile 1) by highest level of education attained – with no education, non-formal, and formal education levels.
Non-formal education is highlighted in the figure. 27 countries with MICS 2000 surveys are included. Education levels for all countries in same order as for Bolivia.
0
0.1
0.2
0.3
0.4
0.5
0.6
Bolivia
Burundi
Cameroon
CAR
Chad
Comoros
Congo, DR
Cote d'Ivoire
Gambia
Guinea-
Guyana
Kenya
Lao PDR
Lesotho
Moldova
Myanmar
Niger
Rwanda
Sao Tome &
Senegal
Sierra Leone
Sudan North
Sudan South
Swaziland
Tajikistan
Togo
Vietnam
Estimated poverty incidence
Highest education is non-formal
All other education levels in sam
e order as for Bolivia
Estimated Poverty Incidence (incom
e Q1) by highest educational attainm
ent, both sexes age 25+
No schooling
Some prim
aryCom
plete primary
Some secondary
Complete secondary
School Trends and Projections, November 2007, EPDC 43
4 Age patterns of out-of-school children Low levels of primary and secondary school net enrolment and net attendance are the result of 1) some children never entering school, 2) children entering school late, and 3) children dropping out early. One can imagine that for each of these three causes (or combination) different policy interventions may be called for, and that it is useful to engage in an analysis of these separate causes of low attendance rates. The age-attendance pyramids provide insight into these patterns. Figure 11 shows the age-specific school attendance pyramids by school level, sex and age for 34 countries in the latest year for which data are available. Attendance for an additional 7 countries from Latin America is shown by sex and age, without the school level distinction. A full collection of attendance pyramids, which includes earlier years to 1990, is available from the EPDC2. The pyramids show females on the right and males on the left, with age starting at age 6 at the bottom of the pyramid and going to up age 24 at the top. The length of the bars in the pyramids is the attendance rate; the maximum is 100%. The pyramids can be used to analyze overall attendance, over-age entry and attendance, and early departure. Three sets of pyramids are included: 1) an overlay of age-specific urban and rural school attendance (regardless of level) to highlight urban/rural differentials; 2) an urban pyramid with primary and secondary shown separately, and 3) a rural pyramid with primary and secondary shown separately. Reflective of the sections above, the pyramids show that in general, rural attendance is lower than urban attendance, that male attendance is higher than female attendance and this is more pronounced at the secondary level than the primary. But the pyramids also provide new, age-specific information. First, the patterns of lower rural attendance and lower female attendance are persistent at all ages. Second, in many countries, there are is a gradual rise of attendance rates with age – and a gradual decline with age. The former is a characteristic of dispersed and late entry; the latter of dispersed and early or late departure. Third, there is a significant amount of over-age attendance in primary (in many countries large groups of teenagers are still in primary school), as well as in secondary (in many countries, secondary attendance persists well beyond age 20). We will first present a few country-specific examples of typical patterns of age-specific attendance.
School Trends and Projections, November 2007, EPDC 44
Figure 11. Age-specific school attendance pyramids for 41 countries, data taken from most recent household survey.
Bangladesh 2004
Benin 2001
Bolivia 2003
Brazil 2002
Burkina Faso 2003
School Trends and Projections, November 2007, EPDC 45
Cameroon 2004
Chile 2003
Colombia 2005
Costa Rica 2005
School Trends and Projections, November 2007, EPDC 46
Cote d’Ivoire 2005
Dominican Republic 2002
Egypt 2005
El Salvador 2003
Ethiopia 2005
School Trends and Projections, November 2007, EPDC 47
Ghana 2003
Guatemala 2001
Guinea 2005
Honduras 2001
Indonesia 2003
School Trends and Projections, November 2007, EPDC 48
Kenya 1998
Madagascar 2004
Malawi 2004
Mali 2001
Mexico 2004
School Trends and Projections, November 2007, EPDC 49
Morocco 2004
Mozambique 2003
Namibia 2000
Nepal 2001
Nicaragua 2001
School Trends and Projections, November 2007, EPDC 50
Nigeria 2003
Paraguay 2000
Peru 2004
Philippines 2003
School Trends and Projections, November 2007, EPDC 51
Rwanda 2005
Senegal 2005
Tanzania 2004
Turkey 1998
Uganda 2001
School Trends and Projections, November 2007, EPDC 52
Vietnam 2005
Zambia 2002
Zimbabwe 1999
4.1 Examples of age-specific attendance patterns
Burkina Faso – Large urban and rural differences at all ages The Burkina Faso pyramids highlight a pattern of large urban and rural differences at all ages, at the primary and secondary levels. Maximum age-specific enrolment rates in the urban areas are more than 80% for 9 year-olds, compared to less than 30% in the rural areas. In the urban areas, school attendance persists into the teenage-years – and by age 14, the majority of school attendees is in secondary school – but in the rural areas, age-specific attendance diminishes to 7% at age 15; 4% at age 16; and 0-2% at higher ages, mostly in primary school. Morocco – Large urban and rural differences for secondary school and teenagers In Morocco, attendance rates at primary school ages diverge less between urban and rural areas. Primary school attendance in the primary ages is high, nearly universal. In contrast, the secondary school attendance during teenage years drops off markedly in the rural areas compared to urban, in particular for teenage girls. Egypt – On-time school entry Typical of on-time school entry is an attendance pyramid with a wide, flat base starting from the official school-entry age. Egypt is an example of a country with on-
School Trends and Projections, November 2007, EPDC 53
time and near universal school entry at the official school age of 7—there is even some early primary school attendance at age 6. Other examples are: Bolivia, Brazil, Chile, Mexico, and Vietnam. All countries where the majority of school entry is on time, also reach near-universal school entry. Ethiopia – Dispersed and late school entry Where school entry is spread over a wider range of ages—with a significant portion of over-age school entry—the attendance pyramid has a tapered shape at the bottom, starting narrow and widening to a maximum at an age beyond the official school-entry age. Ethiopia’s attendance pyramid is a pronounced example – age attendance at the official school entry age 7 is only 20% (17% in rural areas and 58% in cities and towns); and rises to a maximum of 57% at age 12 (officially the age to finish primary school). In our sample of countries, late school entry is almost exclusively confined to countries in Sub-Saharan Africa, including Benin, Burkina Faso, Cameroon, Cote d’Ivoire, Ghana, Guinea, Mozambique, Nigeria, Rwanda, Senegal, Tanzania, Uganda, Zambia; the one exception is the Dominican Republic in Latin America.
School Trends and Projections, November 2007, EPDC 54
Indonesia – On-time school departure in primary A pattern of on-time school departure, which implies that the majority of children in school leave at the official age to end primary school, means children have entered school on time, remained in school for the complete duration of primary, and have experienced relatively low repetition rates. As such, it is a single indicator to characterize a school system with a well-functioning flow of pupils (it does not necessarily imply anything about quality). There are a few countries with this characteristic, among them Indonesia. In both urban and rural areas, primary school attendance is high (>90%) up to the highest official primary school age 11, and abruptly declines after that. There is a small group of older pupils, and more in the rural areas. Other countries with this characteristic (for which we have the data) are: urban Colombia, Egypt, and the Philippines, and Vietnam. Bangladesh – Gradual, multi-age school departure and over-age attendance A more typical pattern of primary school departure in the developing countries in our sample is one of gradual departure, spread over a range of ages. This is clearly illustrated in Bangladesh by a gradual tapering of the top of the primary attendance pyramid. As it turns out, the attendance pyramids for primary school typically begin to decline at ages beyond the official end of primary school. This means most children are leaving late, attending primary school at ages beyond the official primary school age. We know from data on school survival that in many countries a large portion of children drops out before they have finished the primary school cycle, so a significant portion of this late departure must be related to late school entry and/or high repetition rates. Urban Guinea - High proportions enter school Even if a country has common late entry, and a dispersed pattern of school departure, it is possible that most children, at some point, enter school, and theoretically, finish primary school. The best way to measure the proportion of children who ever enter school is with the household survey question “Did NAME ever attend school?” But a minimum approximation can be made by taking the highest age-specific attendance rate. In the urban pyramid of Guinea, despite high rates of late entry, and a dispersed school departure pattern, there is a high maximum attendance rate: 84% at age 9. At least 84% of the children in urban areas attend school at some point – probably there are somewhat more, as some children may have dropped out before age 9, and some children enter beyond age 9; the 84% is a minimum estimate of ever-entry. Rural Guinea - High rates of non-entry On the other hand, the highest age-specific attendance rate also gives a maximum estimate of non-entry. In rural Guinea, the highest age-specific attendance rate is 51% at age 9 for males; consequently, 49% is a maximum estimate of non-entry. As above, there may be some children who drop out before or who enter later than age 9; 49% provides the maximum estimate for non-entry. Other countries where the maximum level of non-attendance is high are: Mali (55%), Ethiopia (50%), and Cote d’Ivoire (40%).
School Trends and Projections, November 2007, EPDC 55
Senegal –over-age secondary school attendance Concurrent with late primary school departure, secondary school attendance in many countries is over-age. In Senegal, the highest rates of secondary school attendance are from age 16; but the official secondary school start age is 13. In most other countries the age of maximum secondary school attendance is well above the official age of secondary entry. For example, countries where the highest secondary school attendance rate is at age 17 are: Rwanda, Tanzania, Mozambique, Haiti, Kenya, Malawi, Chad, Mali, Uganda, Ethiopia, Zambia, Benin, Guinea, Dominican Republic, Namibia and Cameroon. Countries where the highest secondary school attendance rate is 16 are: Burkina Faso, Cote d'Ivoire, Senegal, Bolivia, Nicaragua, Ghana, Nigeria and Zimbabwe. The only countries with the highest secondary school attendance rates at age 13, close to the official entry age are (in this sample): Turkey, Vietnam and Bangladesh. Dominican Republic – low secondary school attendance In addition to over-age secondary attendance, the maximum age-specific attendance rates for secondary are low in most countries. The Dominican Republic lies in the middle of the range for secondary school attendance; but the maximum age-specific attendance rate, at age 17, is only 44%. Only 8 countries achieve maximum age-specific secondary attendance rates above 51%: Vietnam, Peru, Egypt, Colombia, Philippines, Indonesia, Zimbabwe and Turkey.
4.2 Contribution of late entry, non-entry, and early departure to incomplete attendance rates.
As the examples and figures above show, there are many countries where over-age entry; non-entry; and late departure are common. How much does late entry, non-entry, or early departure each contribute to incomplete attendance rates? And how much does over-age attendance compensate for these factors? To compare countries with some summary measures, the EPDC devised estimates of the percentage of school-years lost due to over-age entry, estimated non-entry, and early departure and the percentage of school-years gained through over-age attendance. In an “ideal” school system, every child completes 100% of the official school years (if there are 6 grades, the child completes all 6); with no early entry, no non-entry, and no over-age attendance caused by repetition or late entry. The estimation algorithm calculates how much the actual pattern deviates from this ideal. Figure 12 shows the estimation graphically. The orange line shows the actual attendance rate in Mali. The blue line shows the ideal attendance rate, with perfect and complete on-time entry, full completion and no repetition. The area between the ideal attendance rate and the maximum age-specific attendance is the school time lost due to estimated non-entry. The small, triangular area to the left of the maximum attendance rate is the school time lost due to late entry. There is no school time lost in Mali due to early departure; and much school time gained through over-age attendance – the area under the orange attendance line and to the right of the blue ideal attendance box. To calculate the percent years lost or gained, we take the years in each of the shapes and divide it by the years in the ideal attendance box.
School Trends and Projections, November 2007, EPDC 56
Figure 12. Mali age-specific attendance rates 2001 and the deviations from the ideal attendance rate pattern.
Mali primary attendance
0102030405060708090
100
Age
6A
ge7
Age
8A
ge9
Age
10A
ge11
Age
12A
ge13
Age
14A
ge15
Age
16A
ge17
Age
18A
ge19
Age
20
Atte
ndan
ce ra
te
Actual Attendance
Ideal Attendance
Lost due to estimated non-entry
Lost due to late entry
Gained due to over-age attendance
For each of 36 countries for which the data was available, the EPDC calculated:
- % of school time lost due to late entry - % of school time lost due to estimated non-entry - % of school time lost due to early departure - % of school time gained due to late departure/ over-age attendance
The results are shown in Figure 13 for the country as a whole (top), rural areas only (middle), and the urban areas only (bottom). Each country is represented by a bar with four colors. The red portion shows the percentage of time lost due to late entry; the orange, time lost due to approximate non-entry; maroon, time lost due to early departure; and the green, time gained due to over-age enrolment. Countries are arranged in order of total time lost. In Burkina Faso (on the far left of the top panel in Figure 12), about 65% of school-time is lost due to non-entry, but almost none due to late entry; some of the time lost is compensated by over-age enrolment. In contrast, in Tanzania (middle of the graph), approximately 30% of school time is lost, but nearly half of that is due to late entry. In Tanzania, time gained through over-age enrolment is greater than time lost through the late- and non-entry. The graph shows that in terms of time lost, the approximate non-entry is by far the leading cause of low enrolment rates: the lower parts of the bars are dominated by the orange color. A small group of African countries (plus the Dominican Republic) loses a noticeable portion of school time to late entry – as mentioned above, these are Ethiopia, Guinea, Benin, Mozambique, Zambia, Nigeria, Ghana, Tanzania, Uganda and Rwanda. An even smaller group of countries loses school time due to early departure.
School Trends and Projections, November 2007, EPDC 57
Figure 13. Percent of school time lost due to late entry (red), approximate non-entry (orange), early departure (maroon) and gained due to over-age enrolment (green), for 33 countries with recent DHS surveys, national level (top), rural areas (middle) and urban areas (bottom).
School time lost or gained, National
-80%-60%-40%-20%
0%20%40%60%80%
Burk
ina
Mal
iEt
hiop
iaG
uine
aC
ote
d'Iv
oire
Boliv
iaSe
nega
lBe
nin
Moz
ambi
que
Zam
bia
Nig
eria
Gha
naTa
nzan
iaN
epal
Mad
agas
car
Nic
arag
uaTu
rkey
Cam
eroo
nBa
ngla
desh
Col
ombi
aM
alaw
iU
gand
aR
wan
daVi
etna
mD
omin
ican
Nam
ibia
Keny
aM
oroc
coZi
mba
bwe
Philip
pine
sIn
done
sia
Peru
Egyp
t, Ar
abPer
cent
of s
choo
l tim
e lo
st o
r gai
ned
School time gained dueto over-age enrolment
School time lost due toearly departure
School time lost due tonon entry
Schooltime lost due tolate entry
School time lost or gained, Rural
-80%
-60%
-40%
-20%
0%
20%
40%
60%
80%
Bur
kina
Mal
iE
thio
pia
Bol
ivia
Gui
nea
Cot
e d'
Ivoi
reB
enin
Zam
bia
Moz
ambi
que
Sen
egal
Nig
eria
Tanz
ania
Gha
naN
icar
agua
Nep
alC
amer
oon
Mad
agas
car
Turk
eyM
oroc
coB
angl
ades
hM
alaw
iN
amib
iaV
ietn
amC
olom
bia
Dom
inic
anU
gand
aR
wan
daK
enya
Zim
babw
eP
hilip
pine
sE
gypt
, Ara
bIn
done
sia
Per
uPerc
ent o
f sch
ool t
ime
lost
or g
aine
d School time gained dueto over-age enrolment
School time lost due toearly departure
School time lost due tonon entry
Schooltime lost due tolate entry
School time lost or gained, Urban
-80%
-60%
-40%
-20%
0%
20%
40%
60%
80%
Gui
nea
Sene
gal
Cot
e d'
Ivoi
reM
ali
Gha
naBe
nin
Bol
ivia
Nig
eria
Bur
kina
Zam
bia
Ban
glad
esh
Ethi
opia
Moz
ambi
que
Col
ombi
aTu
rkey
Rw
anda
Tanz
ania
Nep
alM
adag
asca
rVi
etna
mD
omin
ican
Uga
nda
Nic
arag
uaC
amer
oon
Keny
aN
amib
iaM
alaw
iIn
done
sia
Peru
Phili
ppin
esZi
mba
bwe
Mor
occo
Egyp
t, Ar
abPer
cent
of s
choo
l tim
e lo
st o
r gai
ned
School time gained dueto over-age enrolment
School time lost due toearly departure
School time lost due tonon entry
Schooltime lost due tolate entry
School Trends and Projections, November 2007, EPDC 58
Over-age enrolment “compensates” for school time lost in many countries. In general, in those countries where the school time lost is very high (the left side of the figures), over-age enrolment is not sufficient to compensate. In many countries in the middle and the right hand side of the graph, starting from Mozambique and Zambia, over-age enrolment more than compensates for time lost. This school-time compensation may lead to GER levels that are near or over 100%. However, it does not compensate for non-entry - children that never entered school (the orange sections of the bars). The time lost in urban areas is lower than that lost in rural areas, as would be expected; however, the patterns are very similar – most of the time lost is due to approximated non-entry. In urban areas, there is slightly less late school entry and more early departure. Over time, the patterns of school time lost have changed in some countries. Figure 14 shows the time lost due to late school entry in 30 countries for which there were two data points. In 12 of the countries, late entry has declined; in 13 it increased; in the remainder it was unchanged. Why might an increase in late entry have occurred? The countries where there has been an increase in late entry are: Ethiopia, Mozambique, Zambia, Uganda, Benin, Cote d’Ivoire, Senegal, Guinea, Namibia, Mali, Nigeria, Ghana and Burkina Faso; many of these are countries in sub-Saharan Africa where attendance rates have grown relatively quickly - perhaps the increase in late entry is a consequence of that growth. Countries where late entry has declined are: the Dominican Republic, Rwanda, Madagascar, Indonesia, Nicaragua, Bolivia, Colombia, Philippines, Turkey, Vietnam, and Peru; most of these are countries that had relatively high attendance rates in both the early and the late survey – perhaps the reduction of late entry was an improvement of school flows after the school system was able to reach most children.
Figure 14. Percent of school time lost due to late entry in the most recent DHS survey (red arrows) and the earliest DHS survey (maroon bars), for 30 countries arranged in order of time lost in the earliest survey.
-0.12
-0.1
-0.08
-0.06
-0.04
-0.02
0
Dom
inic
an R
epub
licR
wan
daE
thio
pia
Mad
agas
car
Turk
eyIn
done
sia
Nic
arag
uaB
oliv
iaM
ozam
biqu
eZa
mbi
aC
olom
bia
Zim
babw
eU
gand
aB
enin
Mal
awi
Cot
e d'
Ivoi
reS
eneg
alG
uine
aC
amer
oon
Nam
ibia
Mal
iP
hilip
pine
sV
ietn
amN
epal
Per
uB
angl
ades
hN
iger
iaG
hana
Bur
kina
Fas
oE
gypt
, Ara
b R
ep.
Earliestsurvey
Mostrecentsurvey
School Trends and Projections, November 2007, EPDC 59
5 Trends in Net Enrolment and Net Attendance What causes attendance rates to differ from enrolment rates? A common measure of schooling is the portion of school age children who are in school. This measure can be counted in at least two ways: by enrolment – that is, the children who have registered with a school; and by attendance – the children who are actually going to school. School enrolment rates are generally collected by the Ministry of Education in annual school censuses and compiled in education monitoring information systems (EMIS). School attendance rates are generally collected through household surveys and population censuses.
Enrolment and attendance rates generally relay similar trends and schooling levels; but significant differences remain. In its estimates of global number of children out of school each year, the GMR uses information about enrolment and attendance. UIS and UNICEF do the same in their estimates (UNESCO-UNICEF, 2005). To make these estimates, it is important to know when and how to apply the different values given by enrolment and by attendance rates. On the country level, it is also important to use these different sources of information to improve understanding of how many children are in school and which groups of children. This section compares levels and trends of enrolment and attendance rates, and discusses the extent of the differences and what might underlie them.
5.1 Net enrolment rates 1999-2005
Net enrolment rates are collected by the administrative EMIS systems in each country, and centrally compiled for the world as a whole by the UIS. The net enrolment rates presented in this section are from the UIS. The advantages of using net enrolment rates are multiple: they are collected annually around the world; compiled into one data system at the UIS; quality controlled in a consistent manner; and slightly adjusted so the school levels are comparable across countries. The disadvantages of using net enrolment rates are that: the quality of administrative systems in a number of countries is low, causing errors in the data; some data is intentionally scrubbed by national authorities to portray a school system in a better light; and the population data that is used to calculate rates can be out of date and incorrect. Figure 15 shows the net enrolment rates of developing countries in 1999 and 2005/6 or the closest year available. The figure shows the general pattern of growth, also observed in recent overview reports by the GMR, World Bank, and the UIS.
School Trends and Projections, November 2007, EPDC 60
Figure 15. Net enrolment rates in 1999 and 2005/6 (or nearest years) for 88 developing countries, from UIS.
Niger Djibouti Ethiopia Burkina Eritrea
Mali Burundi Guinea
Tanzania Benin
Senegal Mozambique Ghana Yemen
Lesotho Mauritania
Zambia Madagascar
Kenya Nepal
Morocco Namibia
Swaziland Nicaragua Botswana
United Arab Togo Laos
Oman Burma
El Salvador Armenia
India Iran
Guatemala Dominican
Iraq Sao Tome Cambodia Azerbaijan Venezuela
Kuwait Honduras
Jamaica Kyrgyzstan
Moldova Colombia
Kazakhstan Bangladesh
Mongolia Chile
Vanuatu Algeria
Mauritius Tonga Brazil
Paraguay Jordan Samoa
Philippines South Africa Trinidad and
Egypt Georgia Tunisia
Dominica Uruguay
Indonesia Lebanon
Qatar Belize United
Korea, Rep. Bolivia
Vietnam Tajikistan
Bahrain West
Bulgaria Slovenia Maldives Ecuador Mexico
Israel Peru
Malaysia Cuba
Malawi
0 20 40 60 80 100 120%
About 1999Most Recent Year
School Trends and Projections, November 2007, EPDC 61
There has been very high growth in net enrolment in a number of countries in the period since 1999 – in particular, but not exclusively in Sub-Saharan Africa. Among the countries with the highest growth are: Benin (28 percentage points), Burundi (17), Ethiopia (36), Guinea (21), Kenya (15), Lesotho (27), Madagascar (29), Morocco (14), Mozambique (25), Nepal (15), Niger (16), Senegal (17), Tanzania (50), Yemen (18) and Zambia (26). This shows that at least for a short period, with concerted effort, rapid growth is possible. Thirty-one countries registered declines, all but three of them with starting net enrolment rates above 80%. The biggest declines were in the Maldives (-18 percentage points) and West Bank/Gaza (-17). But there are also net enrolment declines in Dominica, United Arab Emirates, Cape Verde, Vietnam, Oman, Mongolia, South Africa and Albania.
5.2 Comparison: net attendance and net enrolment rates
Net attendance rates, the alternative measure of school participation, come from household surveys and population censuses. Survey or census respondents answer questions about household members of school age, which are often formulated something like: “Is NAME going to school this year?”; or “Did NAME go to school at all this year?”, or “Did NAME go to school in the past week?”. Not all surveys are consistent about the school attendance question, and we discuss some of the possible measurement repercussions in section 5.3 below. The advantages of using net attendance rates, over net enrolment, are that they represent actual schooling – children are in school, rather than mere administrative slots – and also, that both the population of school-age children and the population of pupils are collected at the same time, so the numerator and the denominator in attendance rates are from the same source. The disadvantages of using net attendance rates are that in almost all countries they are collected intermittently (with a few exceptions, which conduct a household survey every year or every other year), and that they cover only a sample of the population, possibly a non-representative sample. In the ideal situation, net enrolment and net attendance would both be identical at 100% – that is, all children of school-age are both enrolled in school and actually are attending school. In reality, the values are below 100% in many countries, but also, enrolment and attendance differ. Figure 16 shows net enrolment and net attendance rates in 55 developing countries for the year in which the most recent survey was collected. The general expectation would be that where there is a difference, attendance would be lower than enrolment – since the attending children should be a sub-group of those who enroll; one imagines children who are not enrolled cannot attend school. It turns out that in many cases, net attendance is actually higher than enrolment - in a little under one-third of the countries, net attendance exceeds net enrolment, and in almost half of the countries, gross attendance exceeds gross enrolment.
School Trends and Projections, November 2007, EPDC 62
Second, one would expect that where there is a difference, it would be small – that most children who enroll in school also attend. Again, this is generally the case – in 36 out of 55 countries, the difference is less than 10 percentage points, but in the remaining one third the differences are larger. For example, starting from the left in Figure 16, there are similar values for Niger, Burkina Faso and Burundi, but a large difference in Eritrea – enrolment was 45%, and attendance was 61% (both for a five-year primary cycle); net attendance and enrolment are similar in Guinea-Bissau, Cote d’Ívoire and Senegal, but in Comoros there is a large difference - enrolment was 55% in 2000, while net attendance was 31%.
Figure 16. Net enrolment and net attendance rates (in percent) in 55 developing countries, using the most recent survey data.
0
20
40
60
80
100
120
Nig
erB
urki
na F
aso
Bur
undi
Erit
rea
Gui
nea-
Bis
sau
Cot
e d'
Ivoi
reS
eneg
alC
omor
osE
thio
pia
Moz
ambi
que
Gha
naZa
mbi
aG
uine
aP
akis
tan
Gam
bia,
The
Nam
ibia
Sw
azila
ndTo
goK
enya
Mad
agas
car
Arm
enia
Lao
PD
RM
yanm
arB
otsw
ana
Nic
arag
uaC
olom
bia
Aze
rbai
jan
Leso
tho
Tanz
ania
Gua
tem
ala
Mor
occo
Hon
dura
sIra
qM
oldo
vaC
ambo
dia
Mon
golia
El S
alva
dor
Alg
eria
Bra
zil
Sur
inam
eV
ietn
amJo
rdan
Dom
inic
an R
epub
licB
angl
ades
hP
hilip
pine
sE
gypt
, Ara
b R
ep.
Bol
ivia
Indo
nesi
aM
alaw
iB
eliz
eP
eru
Pan
ama
Mex
ico
Ecu
ador
Arg
entin
a
Net
atte
ndan
ce o
r enr
olm
ent r
ate
Net Enrolment
Net Attendance
As with net attendance and enrolment, there are many differences between gross attendance and enrolment. The comparison can be made for 82 countries, shown in Figure 17. There are a couple of extreme outlying differences greater than 35 percentage points (Angola, Comoros, Eritrea and both Congo’s). As with net rates, in two thirds of the countries, the differences between the gross attendance and enrolment rates are smaller than 10 percentage points (53 out of 82). However, it is often not in the same countries as those with small differences in the net rates. In 20 out of the 53 comparable cases, the differences were small (<10%) in one set of rates (net or gross), but large (>10%) in the other set.
School Trends and Projections, November 2007, EPDC 63
Figure 17. Gross enrolment and attendance (in percent) in 82 developing countries, using the most recent attendance data from household surveys and UIS enrolment data.
0
20
40
60
80
100
120
140
160
180
Nig
erB
urki
na F
aso
Con
go, D
em. R
ep.
Mal
iBu
rund
iEr
itrea
Ango
laS
eneg
alSi
erra
Leo
neG
uine
a-B
issa
uC
ote
d'Iv
oire
Cen
tral A
frica
nZa
mbi
aG
hana
Gui
nea
Gam
bia,
The
Cha
dP
akis
tan
Afgh
anis
tan
Moz
ambi
que
Com
oros
Beni
nC
ongo
, Rep
.M
yanm
arA
rmen
iaEt
hiop
iaAz
erba
ijan
Mol
dova
Tajik
ista
nIra
qU
zbek
ista
nM
ongo
liaN
iger
iaC
hile
Swaz
iland
Egyp
t, A
rab
Rep
.Jo
rdan
Tanz
ania
Rw
anda
Nam
ibia
Viet
nam
Mal
dive
sTo
goS
outh
Afri
caBo
tsw
ana
Gua
tem
ala
Nic
arag
uaH
ondu
ras
Mor
occo
Cam
bodi
aAl
geria
Cos
ta R
ica
Ban
glad
esh
Pana
ma
Turk
men
ista
nN
epal
Mex
ico
Uru
guay
Hai
tiKe
nya
Col
ombi
aAr
gent
ina
Phili
ppin
esEl
Sal
vado
rPa
ragu
ayB
oliv
iaP
eru
Indo
nesi
aE
cuad
orLa
o P
DR
Cam
eroo
nM
adag
asca
rB
eliz
eSu
rinam
eD
omin
ican
Rep
ublic
Guy
ana
Mal
awi
Sao
Tom
e an
dU
gand
aG
abon
Leso
tho
Braz
il
Gro
ss a
ttend
ance
or e
nrol
men
t rat
e
Gross Enrolment Gross Attendance
5.3 Differences between enrolment and attendance – what are the causes?
What causes the differences between attendance and enrolment rates? This section raises and examines some of the possibilities. Where we were able to look into possible causes, we find some explanation, but only enough to explain a small portion of the differences. The remainder of the differences between attendance and enrolment must lie in the unexamined hypotheses, or other causes. None of hypotheses that were explored for this report turned out to provide consistent explanation for the deviations of enrolment versus attendance. Some technical reasons that attendance and enrolment might differ include: 1. The number of grades included in primary is not the same for the attendance as the
enrolment rates. 2. The years from which the data come are not the same. Some causes related to how data is collected include: 3. Survey data is collected outside the school-year, leading to an under-estimate of
attendance. 4. Incorrect or inconsistent responses to the question on school-attendance, due to
complicated survey structure or poor training of the team taking the survey. Some types of surveys might consistently have lower or higher estimates of attendance.
5. Not all schools that children attend, in particular private, religious, or non-formal schools, are included in administrative counts, leading to higher attendance rates.
6. School-age population estimates, the denominator for enrolment rates, are too high (under-estimation of enrolment) or too low (over-estimation of enrolment).
7. Administrative data collection is incomplete, leading to an under-estimate of enrolment.
School Trends and Projections, November 2007, EPDC 64
8. In general, poor management and quality of either the household survey or administrative data.
Some causes rooted in behavior include: 9. Children enroll in school, but do not attend, leading to lower attendance rates. 10. Children start school sometime during the school year, after the official start of
school, leading to higher attendance than enrolment. 11. Administrative data is deliberately or accidentally over- or under-counted. The rest of the section examines the technical possibilities and the first three of the data-related causes. Without more access to information and possibly field research, we could not devise a manner to investigate the other possible causes of differences between attendance and enrolment. Technical causes for differences between attendance and enrolment. As mentioned above, the number of grades included in primary school is not always the same in UIS and household survey data. Household surveys use national definitions of school levels, while the UIS enrolment data conforms with the system defined by the International Standard of Education Classification 1997 (ISCED 1997). As a result, the primary school age definitions used in calculating attendance and enrolment data are not always comparable. In four out of the 55 countries, the national definition of primary used in the household survey has one more grade than the definition used by UIS; in four countries the national definition is two years longer; and in one (Brazil) it is four years longer. One would also expect there to be higher correlation between attendance and enrolment rates if the primary school duration is the same. Where the duration is different, the expectation would be that for the rate with the longer primary school duration, the values would be lower (there are more grades in which children could have dropped out).
Years for the enrolment data differ from the attendance data. In practice, because UIS data for net enrolment is relatively complete, there are only four countries where the UIS data for net enrolment is one year earlier than the attendance data; and one country where the UIS data is one year later.
In countries where the general trend in school participation is upwards, the expectation is that the rates from the later years would tend to be higher; and the highest correlation would be where the years are identical.
The hypothesis that these technical factors might have influenced differences between attendance and enrolment do not bear out. Two statistical regressions - one with the differences in primary duration as the independent variable, and differences in gross attendance and enrolment rates as the dependent; and the second using differences in year of data as the independent variable – showed no statistical distinctions.
School Trends and Projections, November 2007, EPDC 65
Data collection causes for differences between attendance and enrolment. As mentioned above, possible causes for differences between attendance and enrolment rooted in the data collection are: surveys conducted outside the school year; structure of surveys leading to consistent under- or over-estimates; different school types included in the data; incorrect school-age population data; incomplete administrative data; and in general, poor data management and low data quality. We could test (better, partially test) the first three of these causes; the latter three all remain possible but speculative at this point. As it turns out, 35 out of the 82 surveys were conducted entirely or partially outside the school-year, see Table 4. However, we found that surveys held outside the school year do not have a particular bias towards higher or lower attendance rates.
Table 4. List of recent DHS and MICS surveys conducted entirely or partially outside the school year.
DHS Surveys (16) MICS Surveys (19) all from 2000 Bolivia 2003, Burkina Faso 2003, Cambodia 2000, Cameroon 2004, Chad 2004, Rep. of Congo 2005, Dominican Republic 2002, Ethiopia 2005, Gabon 2000, Ghana 2003, Haiti 2000, Jordan 2002, Kenya 2003, Mozambique 2003, Nigeria 2003, Philippines 2003
Angola, Azerbaijan, Burundi, Central African Republic, Dem. Rep. of Congo, Cote d’Ivoire, Guinea-Bissau, Guyana, Moldova, Mongolia, Myanmar, Niger, Rwanda, Sao Tome & Principe, Senegal, Swaziland, Tajikistan, Togo, Uzbekistan
A test of whether particular survey types have a bias towards lower or higher attendance rates (compared to enrolment), or deviate more from enrolment rates, was negative. Table 5 shows four different measures of the differences between net and gross attendance and enrolment rates by three groups of surveys – DHS, MICS, and others. The deviations are measured as the mean difference, mean absolute difference, standard deviation, and average deviation from the mean. The measures show that the differences between the gross rates are larger than the differences between the net rates. The gross attendance rates for the MICS surveys deviate more from enrolment rates than those of either DHS or other surveys, with a tendency to be higher than enrolment rates. This is not so for the MICS net attendance rates. The net attendance rates of all three groups of surveys deviate in the same amount from the enrolment rates; there is no pattern.
School Trends and Projections, November 2007, EPDC 66
Table 5. Measures of deviations between net and gross attendance and enrolment rates, by three groups of surveys – DHS, MICS, and other. The deviations are measured as the mean difference, mean absolute difference, standard deviation, and average deviation from the mean.
Gross enrolment
minus gross attendance
Net enrolment minus net attendance
Gross enrolment
minus gross attendance
Net enrolment minus net attendance
DHS mean difference
-1 4 DHS standard deviation
12 10
MICS mean difference
-6 7 MICS standard deviation
26 9
Other mean difference
1 6 Other standard deviation
13 12
DHS mean absolute difference
10 6 DHS average deviation
11 8
MICS mean absolute difference
14 5 MICS average deviation
15 7
Other mean absolute difference
9 5 Other average deviation
9 8
Formulation of school attendance question as a cause of differences between attendance and enrolment
Household surveys ask about school attendance in different ways, for example, “was NAME in school this year?”, “Is NAME currently in school?” The structure of the question may influence the measured attendance rates. At the request of the GMR team, the EPDC examined the influence of survey questions and responses on the levels of primary net attendance rates in 35 developing countries, using MICS 2000 household surveys. The objective of this analysis is to determine whether and how the manner in which attendance questions are asked influences the calculated net attendance rate, and in particular, the difference between the net attendance and the net enrolment rates. The conclusion from this exploration is that for the MICS surveys, the manner of querying for school attendance does not explain differences between enrolment and attendance.
The 35 countries with MICS surveys included in this analysis are: Angola, Azerbaijan, Bolivia, Burundi, Cameroon, Central African Republic, Chad, Comoros, Congo, DR, Cote d'Ivoire, Dominican Republic, Gambia, Guinea-Bissau, Guyana, Kenya, Lao PDR, Lesotho, Madagascar, Moldova, Mongolia, Myanmar, Niger, Rwanda, Sao Tome & Principe, Senegal, Sierra Leone, Sudan North, Sudan South, Suriname, Swaziland, Tajikistan, Togo, Uzbekistan, Vietnam, Zambia
In the MICS surveys, three questions are asked of household members age 5-24 years old to calculate attendance rates:
Ed 17: Is (name) currently attending school?
Or:
Ed18: During the year, 2000 did (name) attend school at any time?
School Trends and Projections, November 2007, EPDC 67
If the answer to either Ed17 or Ed18 is yes, then
Ed19: And During 2000, which level and grade is/was (name) attending?
In most countries, Ed18 is asked only if the answer to Ed17 is NO (as is the intent of the MICS survey as UNICEF devised it); however, two of the 35 countries have responses only for Ed17 – Zambia and Laos -; seven have answers only to Ed18 – Guyana, Moldova, Uzbekistan, Tajikistan, Myanmar, Azerbaijan, and Rwanda –; and in two countries, most respondents answered both questions – Lesotho and Madagascar.
In the official MICS publications primary net attendance rates is equal to those who answered YES to either or both Ed17 and Ed18 and named primary as the level in Ed19.
Figure 18 shows the net attendance rates from these MICS surveys in bars along with orange triangles denoting the enrolment rates. There are four groups of countries: the two countries where both Ed17 and Ed18 received responses; those where Ed18 was answered only if Ed17 was no; those where only Ed17 received responses; or only Ed18. Responses to Ed17 (currently attending) are shown in dark blue portions of the bars; and the responses to Ed18 (attended sometime) in light blue. In most of the MICS surveys, attendance is slightly lower than enrolment; in a few, the differences are larger (Comoros, Lesotho, and Madagascar).
In many countries, the “currently attending” portion of the bar is the larger. In seven countries, there is a significant light blue portion - students who were not attending presently but had attended at sometime this year. The seven surveys where only Ed18 was answered were all held outside the school year. Other surveys with significant light blue portions (Ed18) were also held, at least partially, outside the school year include Togo, Sao Tome and Principe, and Chad.
There is no apparent pattern of deviation between the attendance and the enrolment rates related to the type of question answered. One cannot say that a predominance of either positive responses to Ed17 on current attendance, or Ed18 on ever attended during the year, corresponds to a greater or smaller deviation between attendance and enrolment. One cannot say that where surveys were held outside the school term the deviation was larger than surveys held during the school terms.
It is possible that attendance in private, religious or non-formal schools is an explanatory factor for higher attendance rates but this possibility was not explored as part of this analysis.
School Trends and Projections, November 2007, EPDC 68
Figure 18. Net attendance rates by questions in MICS surveys (currently attending school and attended school anytime this year) arranged by questions answered and in order of net attendance rates, and net enrolment values from UIS. Year: 2000.
Net attendance rates in MICS 2000 surveys by questions answered and level
0
20
40
60
80
100
120
140
Leso
tho
Mad
agas
car
Dom
Rep
Bol
ivia
Sur
inam
eV
ietn
amM
ongo
liaS
ao T
ome
& P
Ken
yaC
amer
oon
Sud
an S
outh
Sw
azila
ndA
ngol
aTo
goS
udan
Nor
thC
ote
d'Iv
oire
Gam
bia
Con
go, D
RS
eneg
alB
urun
diC
AR
Gui
neaB
issa
uS
ierra
Leo
neC
had
Com
oros
Nig
er
Lao
PD
RZa
mbi
a
Guy
ana
Mol
dova
Uzb
ekis
tan
Tajik
ista
nM
yanm
arA
zerb
aija
nR
wan
da
Rate
s
Currently attending Attended any time this year Net enrolment
Currently attending, but answered ed17 and ed18
answered either ed17 or ed18
answered only ed17 answered only ed18
In conclusion:
1. For about two thirds of the countries for which we had comparable data, the differences between attendance and enrolment are less than 10%;
2. For one third the differences are larger; enrolment can be higher or lower than attendance;
3. We were not able to find a consistent pattern for these differences;
4. The technical and data-related hypotheses to explain the differences turned out negative;
5. It is possible that the remaining hypotheses concerning behavior and data quality may ultimately shed light on the causes underlying different rates for enrolment and attendance.
School Trends and Projections, November 2007, EPDC 69
6 Global series of enrolment projections to 2015 and 2025 The GMR includes projections in its report to assess whether countries are making progress towards universal primary education. In the past, these projections have been Trend projections for total primary net enrolment rates and the gender parity indices in primary and secondary gross enrolment ratios, and have been made to 2015. In preparation of the 2008 report, GMR commissioned EPDC to produce a series of Trend projections and a series of Cohort projections, which are based on a different method and different data. The Cohort projections at the very least are useful to show whether or not the projection results are skewed by the chosen method of projection. If a Cohort projection is significantly different from the Trend projection, this raises the uncertainty level of both projections, and at least suggests that they warrant further investigation. The Cohort projections are built on pupil flows. In their core, the equations for these projections are the same as the ones used by the World Bank, UNDP and various country governments when making pupil projections (see for example, UNDP, 2007; World Bank, 2007; Porta and Wils, 2007) – often for budgeting purposes – to project future pupils and with that the needs for school resources such as teachers, administrators, buildings, furniture, and books. Such models have been applied in many countries, but this is the first effort to produce a large-scale international series using comparable data and assumptions. The Cohort projection model developed by the EPDC is the first effort to make cohort projections in an international, global series and is done here on an experimental basis. The intention of the GMR at this point is to test this method. All of these projections are based on data from the UNESCO Institute of Statistics. The EPDC developed four series of projections for primary level NER, Total NER, GER, and GPI for primary, for male, female, and both genders. Each series was made for as many of the 203 countries that the GMR tracks as the data allowed. Not all of the projections were used in the GMR monitoring report because of various issues with the data. The four series are:
1) Trend projections based on data from 1991 onwards (or whatever year after 1991 data was first available);
2) Trend projections based on data from 1999 onwards (or whatever year after 1999 data was first available);
3) Trend custom projections based on a special request interval from GMR that was not already included in 1) or 2);
4) Cohort projections based on pupils by grade and pupils by age and grade data from 1999, and intake and repetition rates from 1990.
In addition, the EPDC developed three series of projections for secondary level NER, GER, and GPI based on GER for male, female, and both genders:
1. Trend projections for NER, GER, and GPI based on data from 1991 onwards (or whatever year after 1991 data was first available);
2. Trend projections for NER based on data from 1999 onwards (or whatever year after 1999 data was first available);
School Trends and Projections, November 2007, EPDC 70
3. Cohort projections (for general secondary education only) based on pupils by grade and pupils by age and grade data from 1999.
All of the projections have been made up to the year 2025. Table 6 shows how many countries were covered by each projection series. This section describes the projections methods3. Tables with selected results are supplied in Annex 3. Tables of projection results.
Table 6. Countries covered by the EPDC 2007 global enrolment projections for the GMR.
Projection description (designation used in text in parentheses)
School Trends and Projections, November 2007, EPDC 71
6.1 Methods and assumptions in the projections:
All of the projections are based on the continuation of historical trends. In the case of the Trend projections, this means, quite literally, the extrapolation of past rates of NER, TNER, or GER. In the case of the Cohort projections, this means the extrapolation of past net or gross intake rates (depending on data availability) and constant values of promotion and repetition equal to the most recent year those data are available. The Cohort projections are more influenced by actual starting conditions, because the projections begin with the number of pupils by grade and that distribution affects, to a certain extent, what is possible in the future. The assumptions do not take into account shifts in trends that might occur because of future changes in policy, or even recent changes in policy that have not yet manifested themselves in the data (because of lags in the data availability, or lags in the time from policy decisions to implementation). The projections simply state: “If past trends continue, these are the outcomes.” This being said, many countries do tend to stay on a rather consistent path of enrolment growth for multiple decades. There are notable exceptions to this rule, where countries are able to accelerate growth after major education policy changes or post-conflict stabilization, or where enrolment stagnates after a period of high growth. The projections help to distinguish those countries that are already on a path of adequate growth (say, to reach EFA) from those where policy change is needed to accelerate growth. Method and rules for the Trend projections model, ProjecTrend. Technical features of the Trend projections model. The Trend projections are made using the ProjecTrend model developed by the EPDC. It is programmed in Microsoft Excel and uses macros to import data from the EPDC SQL database. The model imports historical values of NER, TNER, and GER for males, females, and both, at the primary and secondary levels for all years starting in 1991 from a list of 203 countries provided by the GMR. Once the values are imported, the model automatically computes the projections (described below), generates graphs of the results which are saved on the EPDC server, and uploads the projections to the EPDC SQL database. We can set the model to look for “All Countries” and import them one after the other, also saving all of the graphs and results automatically, or a user can click Select Country from a country-selection box in the model interface and import data only for that country. We used the All Countries mode to run the entire projections series, and the Select Country mode to trouble-shoot and correct the projections. At present the model is set up to receive a maximum of 16 years of data (potentially from 1991-2006 if all years are available) but it can be easily modified to import more years. NER and TNER Observations of long-term growth of net enrolment rates have found that the pattern generally tends to follow an s-shaped curve that approaches 100%. The trend projections for NER and TNER therefore are based on a logistic curve with a maximum at 100%, but there are some exceptions. The following are the rules for NER and TNER projections:
School Trends and Projections, November 2007, EPDC 72
1. IF more than 5 years of data are available AND the growth trend is positive, apply a logistic growth function to the data.
2. IF between 2 and 5 years of data are available OR the growth trend is negative, apply a linear growth function to the data.
3. IF none of the above applies, no projection is made. GER GER does not have a natural maximum at any particular level, such as 100%. In fact, many countries report many years of GER levels above 100%, in the range of 120% or 130%. There are even some countries where GER can exceed 200% for a short period. Such high GER levels, while they signal high access and participation, are also indicators of inefficiency caused by high rates of repetition and/or high re-entry (where a child leaves school but re-enrolls in a later year). Over time, as school systems mature, the GER levels should decline back down to 100%. At this point, not enough is known about the pattern of long-term GER trends to be able to express the patterns in an equation. Therefore, two simpler methods are used to project GER:
1. IF NER and NER/GER projections exist, then the GER projection is the NER projection divided by the projected ratio of NER/GER (see below for NER/GER ratio).
2. IF NER projections do not exist AND two or more years of GER data exist, a linear projection of GER is made.
3. If none of the above applies no projection is made. NER/GER ratio In countries with fully mature primary school systems, the NER/GER ratio is close to 1 – in other words, almost all children in school are of the official school age. This is when late school entry, repetition rates, and dropout rates are all very low. In countries with high levels of particularly late entry and high repetition rates, the NER/GER ratio is below 1 (it cannot exceed 1 by definition). We observed, by matching years where NER and GER is available, that the NER/GER trend changes over time, in some countries rising, in others declining. For those where NER/GER is rising, the assumption of a logistic curve – as a school system gets closer to a ratio of 1, it becomes more difficult to make the last improvements – produced more reasonable behavior in the projections and also seems empirically more likely. We also found that there are some countries where the ratio of NER/GER is declining – this implies that the growth of the over-age or under-age school population is more rapid than the on-time students. We believe that such a pattern occurs when there is rapid enrolment growth, but did not test this hypothesis. For those countries, we found that if we projected the trend of the NER/GER ratio, there were instances where that ratio approached zero, resulting in impossibly high GER ratios and division by zero errors. Because we know too little at present about the long-term behavior of the NER/GER ratio in the case of a downward recent trend, and to avoid impossible results, in these cases, we maintain a constant ratio for the projections. The assumptions for NER/GER ratio projections are:
1. IF the NER/GER trend is positive, project a logistic curve. 2. IF the NER/GER trend is negative, maintain constant at most recent value. 3. IF only one year of NER/GER ratio is available, maintain this value in the
projections. 4. IF none of the above apply, no NER/GER projections are made.
School Trends and Projections, November 2007, EPDC 73
Trend projections using different sets of historical data The GMR is interested in comparing the enrolment ratios trends from a longer period, starting in 1991, and the trends from the period that only includes the post-Dakar years, 1999 and forward. In addition, the GMR checked all of the enrolment ratios trends, and, based on expert judgment, suggested some additional intervals that would exclude years of unlikely data or undesirably long data intervals. Following this direction, the EPDC made three sets of Trend projections based on the following rules:
1. Projection including all years from 1991 (post-1991) = Include all of the years for which data exist, in the interval 1991-2006, to estimate the trends. If the data do not start at 1991, use whatever is the oldest year of data post-1991 to start the trend estimation. In effect, this caused some trend estimations to include intervals starting in 1992, 1993 or later. IF there is no data at all available prior to 1999, then proceed to the Post-1999 projection.
2. Projection from 1999 (Post-1999) = Include only years from 1999 or later to estimate the trends. If there is no data for 1999, use whatever is the first year after 1999 to have data available to make the trend estimation. This caused some projections in this second series to start in 2000, or 2001.
3. GMR special requests (Custom) = Include only years starting at a year specified by the GMR, IF those specially requested start years are not already covered by Post-1991 OR Post-1999. We found that most of the special requests for trend start years were already covered by rules 1) or 2).
Tables of the projection results for the Start Year, 2015 and 2025 are in Annex 3. Tables of projection results. Graphical reports are also available from the EPDC. Method and rules for Cohort projections model ProEnrol. The Cohort projection model is similar to the ones used by the World Bank, UNESCO and many country governments to plan their school systems based on an expected number of pupils. The core of all these models is a matrix of pupil flows where pupils enter the system in grade 1, and each year flow to the next grade according to the promotion rate, or repeat the grade according to the repetition rate. The matrix is shown in Table 7. The projection years are symbolized by (t) with (T) for the final year of the projection, and grades are symbolized by (g), with (G) for the final grade of the system. GIR is gross intake rate; E is population of the official entry age; P(n,t) is pupils in grade n in year t; p(n,t) is the promotion rate in grade n in year t; r(n,t) is the repetition rate in grade n in year t. The gray shaded cells are data that is imported; all other data is calculated. The arrows show the direction in which the pupils flow.
School Trends and Projections, November 2007, EPDC 74
Table 7. Generic matrix for pupil flow calculations, used in the EPDC ProEnrol model but also in World Bank and UNESCO models.
The matrix shown includes only pupils by grade; but to project pupils by age and grade the same principles are used, only adding the additional dimension of age. As an example, with the age dimension, the number of pupils of age (a), in grade (2) in year (3) would be: Pupils (a,2,3) = P(a-1,1,t+1)*p(1,t+1)+ P(a-1,2,t+1)*r(2,t+1). Note that the promotion and the repetition rates are not age-specific. In reality, there is some evidence that promotion is negatively correlated with age and repetition rates are positively correlated (over-age pupils in the same grade are less likely to be promoted, perhaps more likely to repeat, and more likely to drop out compared to their on-time counterparts). In these models the direction of the pupil flow is fixed by the hierarchical organization of the school-system – pupils must complete and pass grade (g) in order to get to grade (g+1); if they do not pass grade (g) they will repeat or dropout. The speed and efficiency of the flows is determined by intake rates, promotion rates, and repetition rates. Assumptions in the model have to be made about these flows. In addition, assumptions have to be made about the number of people at the official school start age. The assumptions and rules used in the projections are discussed below. Technical features of the Cohort projections model. The Cohort projections are made using the ProEnrol model developed by the EPDC. Like its trend counterpart, ProjecTrend, it is programmed in Excel and uses macros to import data from the EPDC SQL database. All of the imported data is supplied by UIS via the GMR from the list of 203 countries provided by the GMR. The model imports historical values of pupils by grade, females and both sexes (males not
School Trends and Projections, November 2007, EPDC 75
presented by UIS), at the primary and secondary levels for years starting in 1999, and pupils by age and grade data is imported for the most recent year. Once the values are imported, the model automatically computes the projections (described below), generates graphs of the results which are saved on the EPDC server, and uploads the projections to the EPDC SQL database. We can set the model to look for “All Countries” and import them one after the other, saving all of the graphs and results automatically, or a user can click Select Country from a country-selection box in the model interface, and import data only for that country. We used the All Countries mode to run the entire projections series, and the Select Country mode to trouble-shoot and correct the projections. At present the model is set up to receive any data available from 1999 and it can be re-run again in the future as the data gets updated. The user can also input their own data, but this feature is not used for the GMR projections. Starting data on pupils The Cohort projection imports the number of pupils by grade, and pupils by age and grade for females and both genders provided by the UIS. Male pupils are calculated as the difference between both and females. In those cases where only both genders data is available, males and females are not calculated separately. With regards to secondary school, only the data for general secondary education were provided by the UIS, so the projections do not cover other secondary school flows such as vocational. All of the secondary school flows in these projections (transition to secondary, repetition, promotion) apply to only general secondary education. School start age and number of grades per school level The official school start-age and number of years in primary and secondary level schools are imported for all years from 1999 on, and, if length of primary or secondary has changed, these are accommodated in the projections. The model automatically adjusts all calculations to the official school start age and number of grades per level. The model checks to ensure that all of the data per school level are available; some of the calculations (such as NER, GER, and GPI) are done only if all grades are available. Historical, starting, and future school age population The model imports the population from 2000-2025 as projected by the United Nations, medium projection (the UN has 4 projections - low, medium, high, and constant). Population data are used in the model calculations of the number of pupils to enter grade 1 (gross intake rate multiplied by population of school entry age), and the primary and secondary NER and GER values (number of pupils divided by the population of primary or secondary school age). The UN historical and future values for population are imported in 5-year age-groups for the years 2000, 2005, 2010, 2015, 2020, and 2025 (the UN Population Division has only 5-year age-groups for every five years publicly available on its website), and the model interpolates to obtain 1-year age-estimates, and the values for the intervening years. These 1-year estimates are summed up to obtain estimated primary and secondary age population. For the historical years, the model’s school-age population estimates are compared to the UIS school-age population estimates, and where there is a difference, this ratio of the two values is applied to shift all the future interpolated 1-year population estimates
School Trends and Projections, November 2007, EPDC 76
up or down. In this way, the model’s school-age population estimates match the UIS historical school-age population values, and there is a smooth continuation for future values. Gross intake rate assumptions The gross intake rates (GIR) are calculated similarly to GER in the Trend projections above. There is no logical maximum for GIR; but there is a logical maximum of 1 for net intake rates (NIR) and progress towards 1 is along a logistic curve. As with the calculations for GER, the model imports NIR and GIR, projects NIR where there is sufficient data, computes the ratio of NIR/GIR, and projects GIR by calculating NIR divided by the projected ratio of NIR/GIR (where NIR/GIR is also projected). If there is no NIR, then only GIR is projected. The following are the rules of GIR projection:
1. IF there are 4 or more NIR values and the NIR slope is positive, project NIR on logistic curve, otherwise make no projection.
2. IF there are 4 or more values for NIR/GIR (4 or more years with both NIR and GIR data), and the NIR/GIR slope is positive, project NIR/GIR, otherwise use constant NIR/GIR value from most recent year.
3. IF there are both NIR and NIR/GIR projections, then GIR is equal to NIR divided by NIR/GIR.
4. IF there are no NIR and NIR/GIR projections, AND the slope of the historical GIR trend is positive with a standard error of less than 3.5 in the trend, then run a linear extrapolation of the GIR trend with a maximum of 130%. This setting allows GIR to grow but not to exceed 130% in any cases. Without this maximum, the projection of GIR in some countries expands to more than 200%.
5. IF there are no NIR and NIR/GIR projections AND the slope of the historical GIR trend is negative with a standard error of less than 3.5 in the trend AND the most recent GIR exceeds 100%, then run a linear extrapolation of the GIR trend to a minimum of 100%. This rule captures those countries that have high GIR but are on a trend towards greater efficiency.
6. IF there are no NIR and NIR/GIR projections AND the slope of the historical GIR trend is negative with a standard error of less than 3.5 in the trend AND the highest GIR is less than 100%, then run a linear extrapolation of GIR. We considered including a rule that if GIR were declining it would be held constant, because in some countries this rule leads GIR to decline by 20% or more over the projection period. However, we decided to keep it in place, because if GIR is declining with a clear trend (s.e. < 3.5) then there should be a warning to that effect in the projections.
7. IF there are no NIR and NIR/GIR projections AND the slope of the historical GIR has a standard error of greater than 3.5 in the trend, keep GIR constant.
Repetition rate rules and assumptions For historical years, GMR provided UIS repetition rates for primary and secondary overall, as well as by grade (if available). The UIS calculates the grade-specific repetition rates from its own pupil and repeaters data, in the following manner: repetition rate for grade (g), time (t) is equal to the number of repeaters grade (g), time (t) divided by the number of pupils grade (g), time (t-1). The model calculates trends for average primary and average secondary repetition rates and can project three variations of repetition rates: 1) constant values, 2) trend
School Trends and Projections, November 2007, EPDC 77
values, and 3) user-set values. For the GMR projections, constant values are used, because in early tests with the variable repetition rates the projected repetition values for some countries were too extreme – for example, some trends would rise up to 50% percent repetition, and we did not write code to automatically separate the plausible repetition trends from the implausible ones. In the case of the trend values, school-level primary and general secondary repetition rates are calculated with the following rules:
1. IF there are sufficient repetition rate data, calculate the linear slope and do a linear extrapolation of repetition, with a maximum at 1 and a minimum at 0.
2. IF there is not sufficient data to make a linear extrapolation, the trend extrapolation is constant.
By grade, repetition rates can vary considerably, typically with a clustering of higher repetition in grade 1 or the final grade of primary school. For a correct projection of the pupils, these different, grade-level repetition rates should be used. However, because the model projects average repetition rates by primary and secondary overall, a method has to be devised to redistribute those average repetition rates across the grades, taking account of the grade-specific variation. The grade level repetition rates must take account of the shifting proportions of pupils in each grade relative to the whole primary or secondary school pupil population so the average repetition rates are maintained. This is done by the model in a couple of steps. First, the model imports the most recent grade-specific repetition rates, but only uses them if grade-specific rates are available for all grades of the school level, otherwise, the average repetition rate is applied to all grades in the school level. To calculate the differing grade-specific repetition rates from the average school-level rates, it is simpler to assume that the grade specific repetition rates maintain a consistent relation to each other (in other words, if first grade repetition is initially 1.5 times as high as second grade repetition, it remains 1.5 times as high throughout the projection period), than to work with shifting relations among the repetition rates. The grade-specific repetition rates will be shifted up and down, just enough so that the weighted average equals the projected average repetition rate. This shifting has to happen even if the average repetition rates are constant because the relative weight of each grade size shifts over time. Let us continue with the example of the 100,000 first graders and 20,000 sixth graders and assume that first grade repetition is 20%; compared to 5% for the sixth grade. The average of these two is a repetition rate of 17.5%. In the GMR projection, the average rate is held constant. But over the course of the projection, the size of the classes shifts and does not necessarily remain in the same ratio. Assume that in year t^, the first grade is 150,000 and the sixth grade is 50,000. If the grade-specific repetition rates are unchanged, the weighted average repetition is now 16.25%, violating the assumption of a constant average. The solution is to shift the grade specific rates of grade 1 and 6 slightly so that the average is again 17.5%. But how much? The solution is to find one repetition multiplier that can be applied to all grades to achieve the desired average school-level rate. The question then becomes how to calculate the repetition multiplier. Here is the solution we applied. The average repetition rate (Ar) in a grade is equal to:
School Trends and Projections, November 2007, EPDC 78
Ar(t) = [r(1,t)*P(1,t) + r(2,t)*P(2,t) + r(3,t)*P(3,t) + … + r(G,t)*P(G,t) ] Where r(g,t) is the grade specific repetition rate in grade g at time t, and P(g,t) is the number of pupils in each grade at time t, and G is the last grade of the school level. The initial grade-specific repetition rates are held consistent in the calculation for future years, t^, the average repetition rate, and are all shifted by the same multiplier δ(t^), so the future average repetition Ar(t^) is: Ar(t^) = [δ(t^)*r(1,t)*P(1,t^) + δ(t^)*r(2,t)*P(2,t^) + δ(t^)*r(3,t)*P(3,t^) + … +
δ(t^)*r(G,t)*P(G,t^) ] And all the δ(t^) can be collected to obtain: Ar(t^) = δ(t^) * [r(1,t^)*P(1,t^) + r(2,t)*P(2,t^) + r(3,t^)*P(3,t^) + … + r(G,t^)*P(G,t^) ] But we will know from the projections, the Ar(t^) (the projected value of the average repetition rates discussed above and held constant in the GMR projections), as well as the number of pupils, and the initial grade-specific repetition rates, so by rearranging the formula, δ can be calculated as: δ(t^) = Ar(t^) / [r(1,t^)*P(1,t^) + r(2,t)*P(2,t^) + r(3,t^)*P(3,t^) + … + r(G,t^)*P(G,t^) ] This multiplier is used to shift the initial grade specific repetition rates just enough so that the average repetition rate matches the projected level, and it is used to calculate the future grade-specific repetition rates as: r(g,t^) = δ(t^) * r(g,t). Promotion rate rules and assumptions The promotion rate in grade (g) in year (t) is defined as the number of new pupils in grade (g+1) in the year (t+1) divided by the total pupils in grade (g-1) in year (t-1) (see definitions above). It is not provided as an indicator by the UIS, but the historical values can be calculated from the number of pupils by grade in two consecutive years, and the percentage of repeaters in the second year. The historical promotion rate calculated using pupils and repetition is the number of non-repeating pupils in grade (g+1), year (t+1) divided by the number of pupils in grade (g), year (t). The non-repeating pupils are calculated as pupils grade (g), year (t) times the quantity 1 minus the repetition rate. p(g,t) = [(1-r(g,t))*P(g+1,t+1)] / P(g,t).
School Trends and Projections, November 2007, EPDC 79
References Benavot, A.. 2006. “The Diversification of Secondary Education: School Curricula in Comparative Perspective”. IBE Working Papers on Curriculum Issues Nº 6, UNESCO International Bureau of Education. Geneva, Switzerland.
Filmer, D. and Pritchett, L. 2001. Estimating Wealth Effects Without Expenditure Data--Or Tears: An Application to Educational Enrollments in States of India Demography - Volume 38, Number 1, February 2001, pp. 115-132
Porta, E, and A. Wils, 2007, Review and Evaluation of Selected Education Projection Models in Use in 2006, Education Policy and Data Center. Washinton, DC. Obtainable from the Internet at: http://www.epdc.org/Analysis.aspx#Reports on November 12, 2007
UNESCO Institute of Statistics (UIS) and United Nation’s Children Fund (UNICEF), 2005, Children Out of School: Measuring Exclusion from Primary Education. UNESCO Institute of Statistics, 2005. Montreal. Obtainable from internet at: http://www.uis.unesco.org/template/pdf/educgeneral/OOSC_EN_WEB_FINAL.pdf on November 12, 2007.
United Nation’s Children Fund (UNICEF), 2007, “Appendix Three, Instructions for Interviewers”. Obtainable from internet at http://www.childinfo.org/mics/mics3/manual.php on November 12, 2007.
United Nations Development Programme (UNDP), 2007, “EPSSim Aggregate Education Model” User software, obtainable from the Internet at: http://www.undp.org/poverty/tools.htm on November 12, 2007.
Wils, A., B. Carrol, K. Barrow. 2005. Educating the World’s Children: Patterns of Growth and Inequality. Education Policy and Data Center, Academy for Educational Development. Washington, DC.
World Bank, 2006, Modeling the Impact of HIV/AIDS on Education Systems: How to Use the Ed-SIDA Model for Education-HIV/AIDS Forecasting 2nd Edition 2006. World Bank. Washington, DC.
World Bank. 2007. EdStats, Selected Group Data, DHS Data on Education Indicators. Sub-national country profiles. Obtainable from the Internet at http://devdata.worldbank.org/edstats/td16.asp on November 12, 2007. World Bank. Washington DC.
School Trends and Projections, November 2007, EPDC 80
Annex 1. Definitions Average annual change in rural/urban net attendance ratio is calculated as:
ln[(ratio(2)/ratio(1)] / (year2-year1). Children of primary school age = the total number of children who are of the ages in
the primary school age interval. Children of secondary school age = the total number of children who are of the ages
in the secondary school age interval. Gender parity index (GPI) = the ratio of the female enrolment rate to the male
enrolment rate. Can be applied to any of the enrolment rates mentioned above. Gross intake rate (GIR) = the number of new first grade entrants regardless of age,
divided by the number of children who are of the official school start age. Length of primary school = the number of grades included in the primary school,
taken from the UIS data system for level ISCED1 for enrolment rates; and the national definitions for the attendance rates.
Length of secondary school = the number of grades included in the secondary school level, taken from the UIS data system for level ISCED2 for enrolment rates; and the national definitions for the attendance rates.
Net intake rate (NIR) = the number of new first grade entrants of the official school start age divided by the number of children who are of the official school start age.
Never attended rate (official primary age) is defined as the total number of children of official (ISCED) primary school age who said they had never attended school expressed as a percentage of the primary school age population.
Official age to start school = official age at which children should enter first grade of primary school. Taken from the UIS data system.
Primary gross attendance rate is defined as the total number of children who said they were attending primary school in the present year expressed as a percentage of the primary school age population.
Primary age specific attendance rates are defined as the total number of children who said they were attending primary school expressed as a percentage of the specific age populations.
Primary gross enrolment rate is the number of children who are enrolled in primary school, regardless of age, expressed as a percentage of the primary school age population.
Primary school age = the age between the official age to start school, and the official age to end primary school (official start age plus number of grades in primary school).
Primary school net attendance rate is the total number of children who said they were attending primary school in the present year and who are of primary school age, expressed as a percentage of the primary school age population.
Primary school net enrolment rate is the number of children who are enrolled in school and who are of primary school age, expressed as a percentage of the primary school age population.
Promotion rate (p) = in grade X, and year T, is the number of new pupils in grade X+1, year T+1, divided by the total number of pupils in grade (X), year (T).
Repetition rate (r) = in grade (X), year (T) the number of repeating pupils in grade X, year T, divided by the total number of pupils in grade X, year (T-1).
School Trends and Projections, November 2007, EPDC 81
Rural/urban net attendance ratio is calculated as the rural net attendance rate divided by the urban net attendance rate.
Secondary age specific attendance rates are defined as the total number of children who said they were attending secondary school expressed as a percentage of the specific age populations.
Secondary gross enrolment rate (GER) = all children who are enrolled in secondary school, regardless of age, divided by the number of children of secondary school age.
Secondary net attendance rate is defined as the total number of children of the official (ISCED) secondary school age who said they were attending secondary school in the present year expressed as a percentage of the secondary school age population.
Secondary net enrolment rate (NER) = all children of secondary school age who are enrolled in secondary school divided by the number of children of secondary school age.
Secondary school age = the age between the official start age for secondary (the last official age of primary school plus one), and official age to end secondary school (the official start age for secondary plus the number of grades secondary school).
Total primary net enrolment rate (TNER) = all children of primary school age who are enrolled in either primary or secondary school (but not pre-primary) divided by the number of children of primary age.
School Trends and Projections, November 2007, EPDC 82
Annex 2. Years of household surveys included in the analyses4. Country Name Year
DHS Surveys 1990
1991
1992
1993
1994
1995
1996
1997
1998
1999
2000
2001
2002
2003
2004
20
05
Bangladesh x x x x Benin x x Bolivia x x x Burkina Faso x x x Cameroon x x x Chad x x Colombia x x x x Cote d'Ivoire x x Dominican Republic x x x x Egypt, Arab Rep. x x x x x Ethiopia x x Ghana x x x Guinea x x Haiti x x Indonesia x x x x Kenya x x x Madagascar x x x Malawi x x x Mali x x Morocco x x Mozambique x x Namibia x x Nepal x x Nicaragua x x Nigeria x x x Peru x x x x Philippines x x x Rwanda x x x Senegal x x Tanzania x x x x Turkey x x Uganda x x Vietnam x x x Zambia x x x Zimbabwe x x SITEAL Surveys Bolivia x x Brazil x x x Chile x x x x x x Costa Rica x x x x El Salvador x x x Guatemala x Honduras x x México x x x x x x Nicaragua x x Paraguay x x Perú x x MICS surveys Afghanistan x Algeria x
4 Complete list with specifications of survey and link to the sources available from EPDC.
School Trends and Projections, November 2007, EPDC 83
Country Name MICS surveys cont’d 19
90
1991
1992
1993
1994
1995
1996
1997
1998
1999
2000
2001
2002
2003
2004
20
05
Angola x Azerbaijan x Burundi x Central African Republic
x
Comoros x Congo, Dem. Rep. x Cote d'Ivoire x Gambia, The x Guinea-Bissau x Guyana x Lao PDR x Moldova x Mongolia x Myanmar x Niger x Rwanda x Sao Tome and Principe
x
Senegal x Sierra Leone x Suriname x Swaziland x Tajikistan x Togo x Uzbekistan x Other surveys Argentina x Belize x Botswana x Brazil x Chile x Costa Rica x Ecuador x El Salvador x Guatemala x Honduras x Iraq x Maldives x Mexico x Pakistan x Panama x Paraguay x South Africa x Uruguay x
School Trends and Projections, November 2007, EPDC 84
Annex 3. Tables of projection results
Table 8. Primary Net Enrolment Rate, Start Year, Projections to 2015 and 2025. PRIMARY NET ENROLMENT RATE
School Trends and Projections, November 2007, EPDC 96
Table 11 continued. Primary Gender Parity Index Projections, initial values in start year, projected values in 2015 and 2025 using three projection series.
PRIMARY GPI FOR GROSS ENROLMENT RATE
Projection using post-1991 data
Projection using post-1999 data Cohort project
Country Start Year Start Year Value 2015 2025 2015 2025 2015 202Dominica 2005 0.99 1.13 1.36
School Trends and Projections, November 2007, EPDC 97
Table 11 continued. Primary Gender Parity Index Projections, initial values in start year, projected values in 2015 and 2025 using three projection series.
PRIMARY GPI FOR GROSS ENROLMENT RATE
Projection using post-1991 data
Projection using post-1999 data Cohort project
Country Start Year Start Year Value 2015 2025 2015 2025 2015 202Malta 2005 0.94 0.94 0.95 0.84 0.72 0.87 0.8
School Trends and Projections, November 2007, EPDC 98
Table 11 continued. Primary Gender Parity Index Projections, initial values in start year, projected values in 2015 and 2025 using three projection series.
PRIMARY GPI FOR GROSS ENROLMENT RATE
Projection using post-1991 data
Projection using post-1999 data Cohort project
Country Start Year Start Year Value 2015 2025 2015 2025 2015 202Syrian Arab Republic 2005 0.95 0.96 0.97 0.98 0.98 0.97 0.9
School Trends and Projections, November 2007, EPDC 99
Table 11 continued. Primary Gender Parity Index Projections, initial values in start year, projected values in 2015 and 2025 using three projection series.
PRIMARY GPI FOR GROSS ENROLMENT RATE
Projection using post-1991 data
Projection using post-1999 data Cohort project
Country Start Year Start Year Value 2015 2025 2015 2025 2015 202Portugal 2005 0.96 0.96 0.96 0.95 0.92
School Trends and Projections, November 2007, EPDC 101
Table 12 continued. Secondary Gender Parity Index Projections, initial values in start year, projected values in 2015 and 2025 using three projection series.
SECONDARY GPI FOR GROSS ENROLMENT RATE
Projection using post-1991 data
Projection using post-1999 data Cohort projection
Country Start Year Start Year Value 2015 2025 2015 2025 2015 2025 Dominica 2005 0.97 0.96 0.96 0.96 0.96
School Trends and Projections, November 2007, EPDC 102
Table 12 continued. Secondary Gender Parity Index Projections, initial values in start year, projected values in 2015 and 2025 using three projection series.
SECONDARY GPI FOR GROSS ENROLMENT RATE
Projection using post-1991 data
Projection using post-1999 data Cohort projection
Country Start Year Start Year Value 2015 2025 2015 2025 2015 2025 Mali 2005 0.62 0.63 0.64 0.66 0.68
School Trends and Projections, November 2007, EPDC 103
Table 12 continued. Secondary Gender Parity Index Projections, initial values in start year, projected values in 2015 and 2025 using three projection series.
SECONDARY GPI FOR GROSS ENROLMENT RATE
Projection using post-1991 data
Projection using post-1999 data Cohort projection
Country Start Year Start Year Value 2015 2025 2015 2025 2015 2025 St. Vincent/Grenad. 2005 1.24 1.06 1.00 1.07 1.00
School Trends and Projections, November 2007, EPDC 104
Table 12 continued. Secondary Gender Parity Index Projections, initial values in start year, projected values in 2015 and 2025 using three projection series.
SECONDARY GPI FOR GROSS ENROLMENT RATE
Projection using post-1991 data
Projection using post-1999 data Cohort projection
Country Start Year Start Year Value 2015 2025 2015 2025 2015 2025 Mexico 2005 1.07 1.09 1.08 1.10 1.09 1.12 1.12
School Trends and Projections, November 2007, EPDC 105
Table 13. Cohort projections of the number of pupils in and primary and general secondary5 schools, initial values in most recent year of data (start year), and in 2015 and 2025.
NUMBER OF PUPILS BY SCHOOL LEVEL (Cohort projection) Country Primary General Secondary Start Year Start Year
5 The projections include only pupils in lower and upper level general secondary education, but no pupils in vocational, professional, religious or other secondary schools. In many countries, secondary education is diversified and includes those other streams as well (Benavot, 2006).
School Trends and Projections, November 2007, EPDC 106
Table 13 continued. Cohort projections of the number of pupils in and primary and general secondary schools, initial values in most recent year of data (start year), and in 2015 and 2025.
NUMBER OF PUPILS BY SCHOOL LEVEL (Cohort projection) Country Primary General Secondary Start Year Start Year
School Trends and Projections, November 2007, EPDC 107
Table 13 continued. Cohort projections of the number of pupils in and primary and general secondary schools, initial values in most recent year of data (start year), and in 2015 and 2025.
NUMBER OF PUPILS BY SCHOOL LEVEL (Cohort projection) Country Primary General Secondary Start Year Start Year