SCHOOL CHILDREN AND SPORT IN IRELAND TONY FAHEY LIAM DELANEY BRENDA GANNON Copies of this paper may be obtained from The Economic and Social Research Institute (Limited Company No. 18269). Registered Office: 4 Burlington Road, Dublin 4. www.esri.ie Price €16.00 (Special rate for students, €8.00)
Transcript
SCHOOL CHILDREN
AND SPORT
IN IRELAND
TONY FAHEY
LIAM DELANEY
BRENDA GANNON
Copies of this paper may be obtained from The Economic and Social Research Institute (Limited Company No. 18269). Registered Office: 4 Burlington Road, Dublin 4.
www.esri.ie Price €16.00
(Special rate for students, €8.00)
Tony Fahey is a Research Professor, Brenda Gannon is a Research Analyst and Liam Delaney was a Research Fellow at The Economic and Social Research Institute, Dublin, and is now at the Geary Institute, University College Dublin. This paper has been accepted for publication by the Institute, which does not itself take institutional policy positions. Accordingly, the authors are solely responsible for the content and the views expressed.
Chapter Page Executive Summary i 1. INTRODUCTION 1 1.1 Context and Objectives 1 1.2 Importance of Sport for Children 3 1.3 Previous Research 4 1.4 Data 9 2. POLICY CONTEXT 11 2.1 Introduction 11 2.2 Education Policy and Sport 11 2.3 Sports Policy and Children’s Sport 14
3. SPORT IN SECOND-LEVEL SCHOOLS: PARTICIPATION AND ATTITUDES 18 3.1 Introduction 18 3.2 Sports Participation 18 3.3 Overall Exercise Levels 29
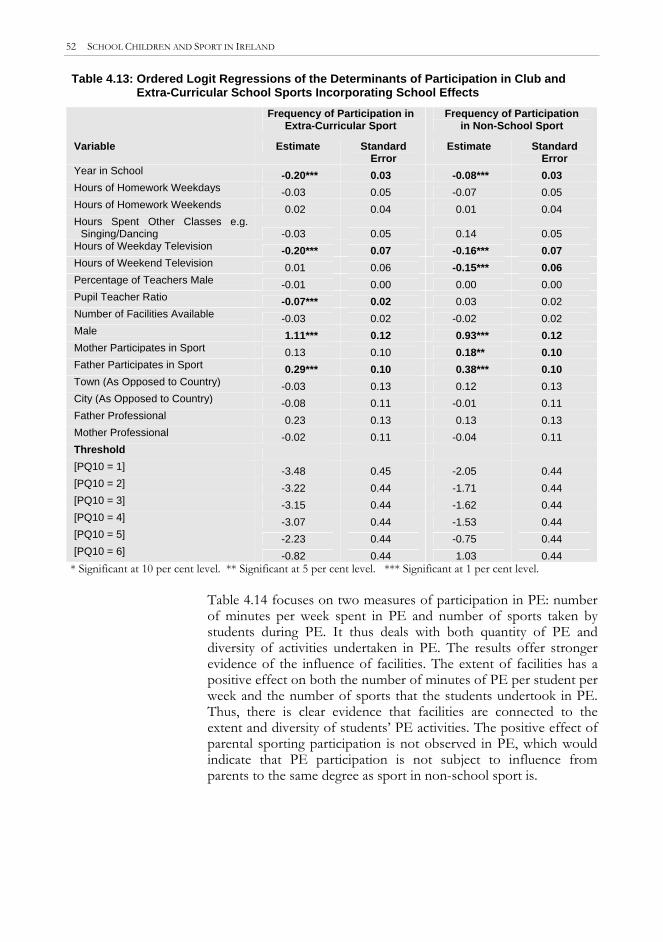
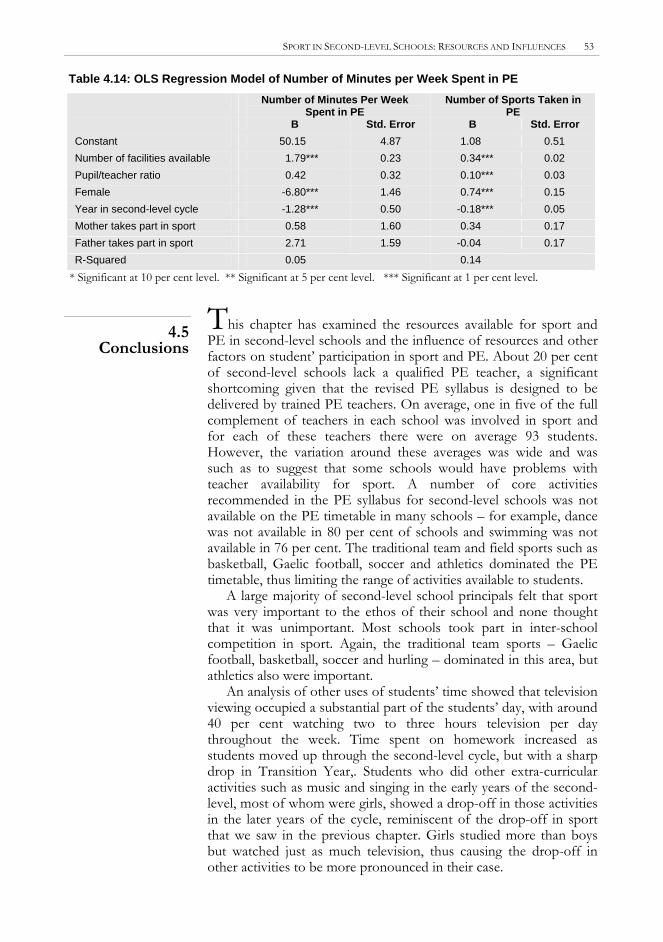
3.4 Perceptions and Attitudes Regarding Sport 32 3.5 Conclusions 37
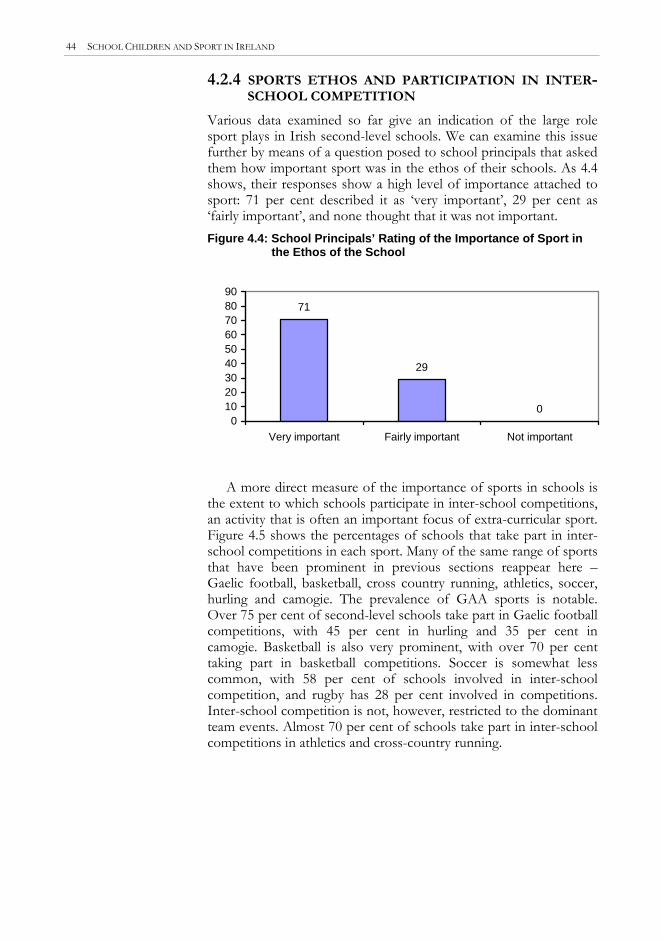
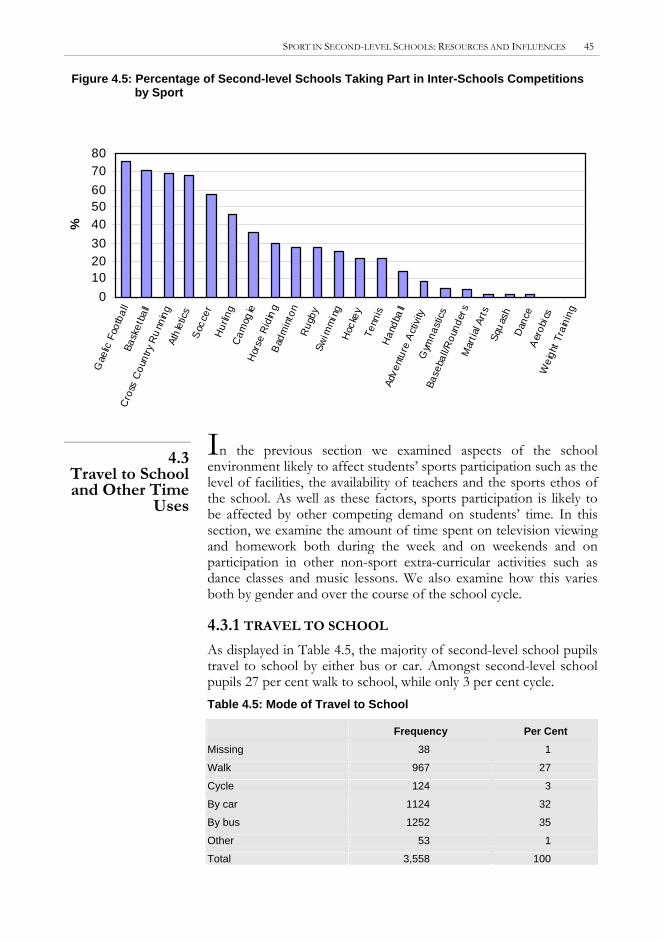
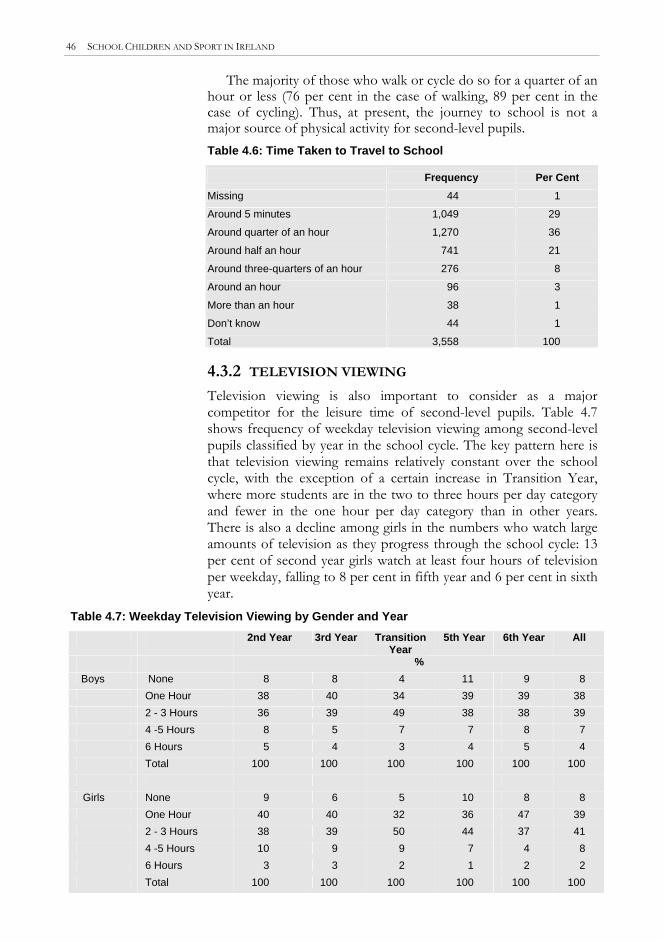
4. SPORT IN SECOND-LEVEL SCHOOLS: RESOURCES AND INFLUENCES 39 4.1 Introduction 39 4.2 Resources, Facilities and Sports Culture in the School 39 4.3 Travel to School and Other Time Uses 46 4.4 Multiple Regression Models of Pupils Level of Sporting Participation 50 4.5 Conclusions 54 5. SPORT IN PRIMARY SCHOOLS 55 5.1 Introduction 55 5.2 Sports Participation 55 5.3 Resources and Facilities 60 5.4 Travel to School and Other Time Uses 63 5.5 Determinants of Participation 64 5.6 Conclusions 66
Chapter Page 6. SPORT, PHYSICAL ACTIVITY AND OBESITY 67 6.1 Introduction 67 6.2 Measuring Obesity and Overweight in Children 68 6.3 Obesity Among Second-Level Pupils 70 6.4 Obesity and Physical Activity Among Second-Level Students 72
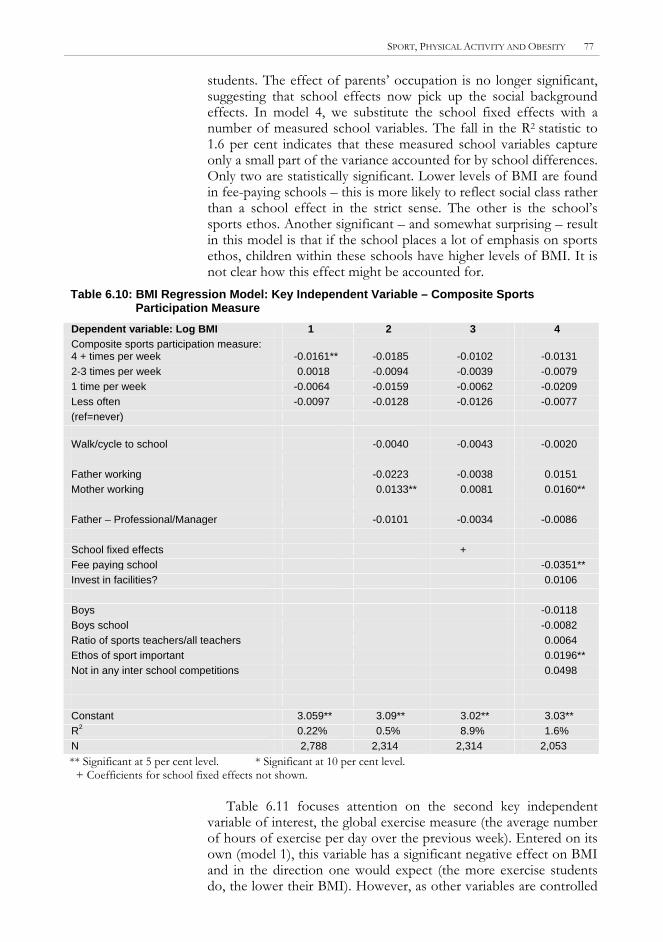
6.5 Multivariate Analysis of Obesity and Participation in Physical Activity in Secondary Schools 75
6.6 Obesity and Overweight Among Primary School Children 78 6.7 Conclusions 80 7. CONCLUSIONS AND POLICY IMPLICATIONS 82 7.1 Main Findings 82 7.2 Policy Implications 85 References 93 Appendix 1 97 Appendix 2 100
1. INTRODUCTION
Organised children’s sport in Ireland rests on three main pillars: the physical education (PE) curriculum in schools, extra-curricular sport played in the school, and sport played outside the school in sports clubs or other organised contexts. These three pillars come within the remit of two main areas of public policy – education policy as it relates to PE and sport in schools, and sports policy. Education policy has primary responsibility for the first pillar – PE – but its interest also spills over into the second pillar, extra-curricular sport in schools. Sports policy is primarily concerned with the third pillar – sport played in clubs and other organised contexts outside the school – but in what is an important policy evolution in recent years, its sports promotion programmes have also increasingly come to extend into the school, in regard to both PE and extra-curricular sport. Education policy and sports policy thus have responsibilities for children’s sport that are distinct to a great degree but that also overlap in important ways. While the two policy areas in general are likely to support each other, their core orientations are not identical. PE, the primary concern of education policy, takes a broad view of the children’s development and considers sport as but one of a number of forms of physical activity that can benefit children. Sports policy, as might be expected, is concerned more specifically with sport. While its approach in this area often strives to incorporate aspects of the broad PE approach and to encourage sports bodies to become more aware of holistic PE principles, its focus is necessarily more restricted to the types of physical expression and social interaction traditionally associated with sport. Thus the distinctive dual structure in policy for children’s sport gives rise to questions about how the two sides of the structure should relate to each other, reflecting larger questions about the proper role of sport in school PE programmes.
1.1 Context and
Objectives
The overall objective of this study is to examine children’s levels and patterns of participation in the three pillars of children’s sport – PE, extra-curricular sport in the school and organised sport outside the school – and to draw implications for public policy, with reference especially to education policy and sports policy. A fourth important form of children’s sport, consisting of unstructured sport engaged in as part of children’s informal play both in the school and outside it, is also essential to children’s development but is given only secondary attention in this study. Although energetic, self-directed play is a key contributor to children’s well-being, it is less amenable to direct policy intervention than the three pillars we focus on and is a vastly complex field to study in its own right (for a recent
1
2 SCHOOL CHILDREN AND SPORT IN IRELAND
review and set of policy initiatives in this area, see the National Play Policy published in 2004 – National Children’s Office, 2004). In order to preserve a coherent policy focus in the study and to contain its substantive and methodological concerns within manageable dimensions, we pay only limited attention here to children’s unstructured physical activity and its relationship with sport.
Other policy sectors such as health and health promotion also have an interest in these three pillars of children’s sport. Indeed, policy interest in children’s sport is strongly motivated by the health benefits that sport can yield both in childhood and in later adulthood. This is particularly so in view of the growing problem of obesity among children and adults and the possible role of increased physical activity as a means to combat this problem. However, the health sector does not have central responsibility for the inputs to children’s sport in the form of policies or expenditure underpinning any of the three pillars we are concerned with. While health promotion does have a background role in these areas, the main interest of the health sector lies in the outputs of the three pillars for health rather than the inputs and structures that determine how they work. The present study is concerned to some degree with the outputs of children’s sport as far as health is concerned, particularly in regard to overweight and obesity among children – the subject of Chapter 6 below. However, the greater concern is with the input side, that is, with schools and sports organisations as structures through which sport is provided and supported among children. The study is also concerned with factors such as home background and competing use of children’s time that may influence the impact and effectiveness of these inputs into children’s sport. These concerns mean that the primary policy reference points for the study are those of education policy and sports policy rather than of health policy.
The focus on sport and its relationship with PE, rather than on physical activity more generally, means that this is not an epidemiological study of children’s health behaviours, and does not attempt to duplicate broader ranging research in this area such as that based on the Health Behaviour of School-Aged Children (HBSC) surveys carried out in Ireland in 1998 and 2002 (Kelleher et al., 2003; Currie et al., 2000). Given its particular concern with sport, the character of this study is considerably influenced by the paucity of previous research in Ireland focused specifically on children’s sport rather than on physical activity. This sparse research background means that general baseline data are lacking on many key aspects of children’s sport and so the need to fill in the basic picture is a priority. This study attempts to respond to this priority and therefore is more concerned with providing overview data on a range of aspects of children’s sport rather than in-depth treatment of any particular issue.
The aims of the report can thus be summarised as follows:
1. to provide an overview of children’s levels and patterns of participation in sport, distinguishing between three main arenas of such participation – PE in schools, extra-
INTRODUCTION 3
curricular sport in schools, and sport played in clubs and other structured settings outside the school;
2. to examine sports facilities and resources available to schools (including staff resources) and assess their impact on the sports participation of pupils;
3. to examine a range of other factors that may affect children’s sports participation, including other uses of their time (such as study and television watching) and certain aspects of their family background;
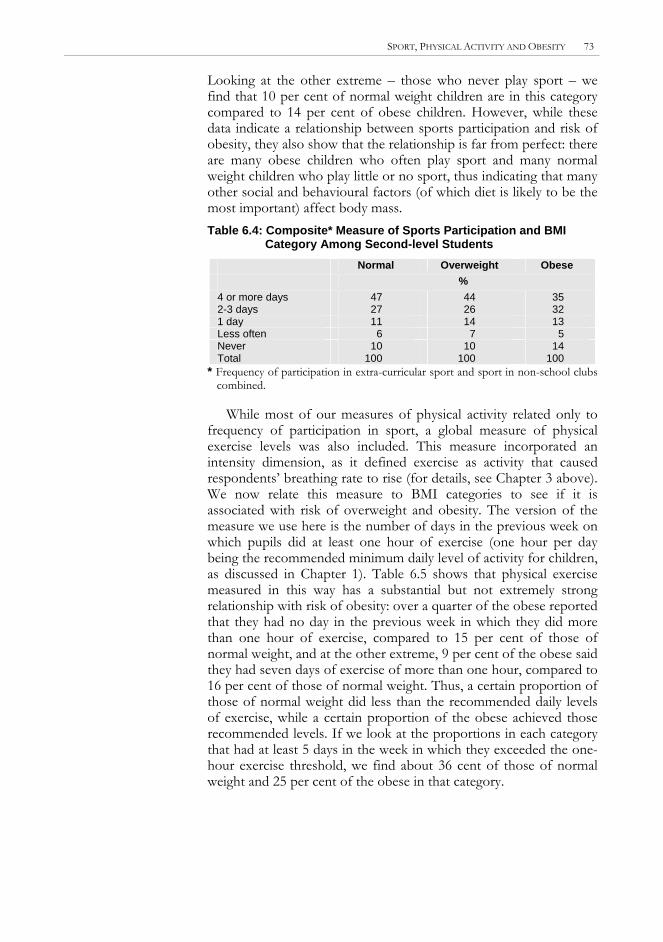
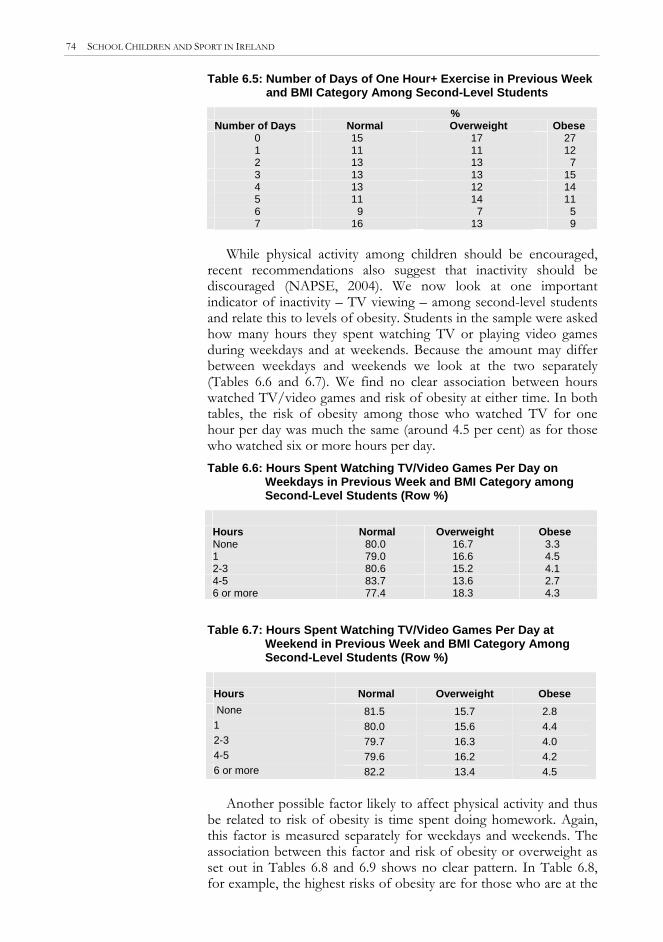
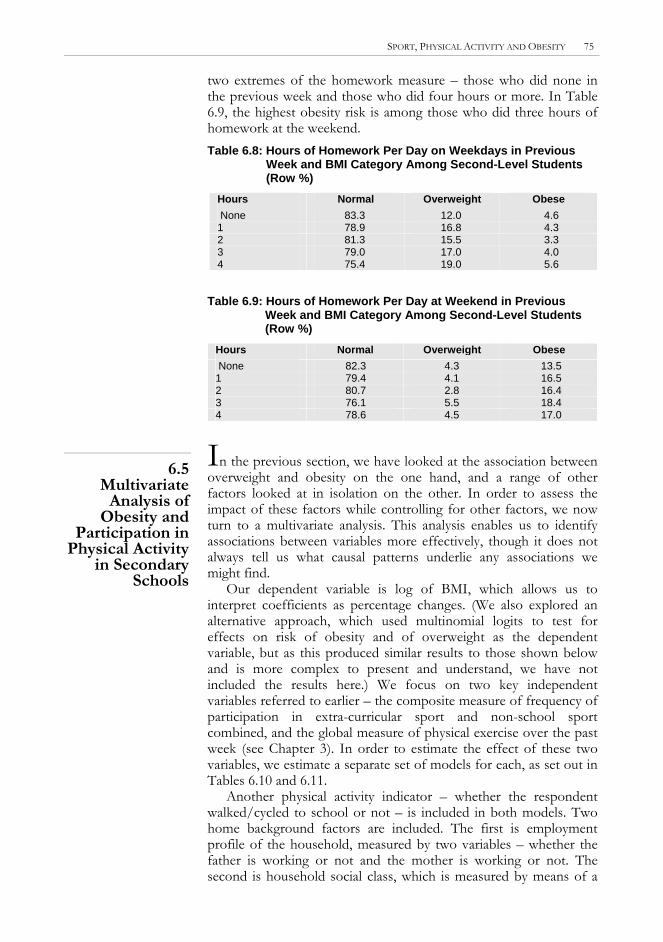
4. to examine the link between sports participation and obesity among children, as measured by body-mass index (BMI), keeping in mind the limitations of the measures of sports participation available in the data as indicators of physical activity;
5. to draw implications for policy, with reference especially to education policy on PE and sports policy.
This report is the third in a series of baseline studies of sport in Ireland carried out by the Economic and Social Research Institute in conjunction with the Irish Sports Council. The first of these examined participation in sport in the adult population (Fahey, Layte and Gannon, 2004) and the second was a study of the social and economic value of sport (Delaney and Fahey, 2005). Taken together, the three reports provide a broad outline of key life-cycle dimensions of Irish sport and their implications for sports policy.
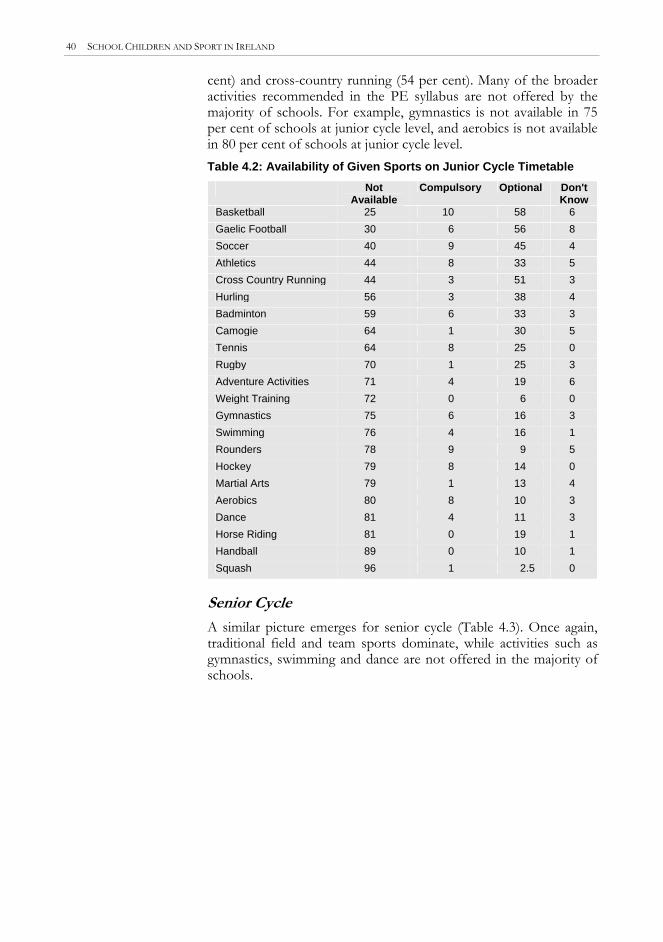
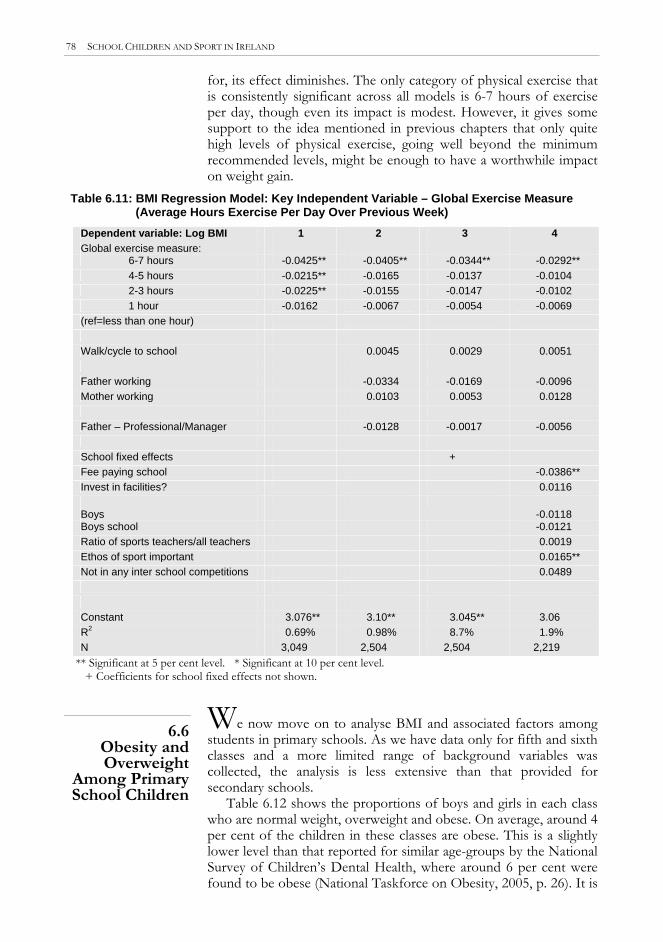
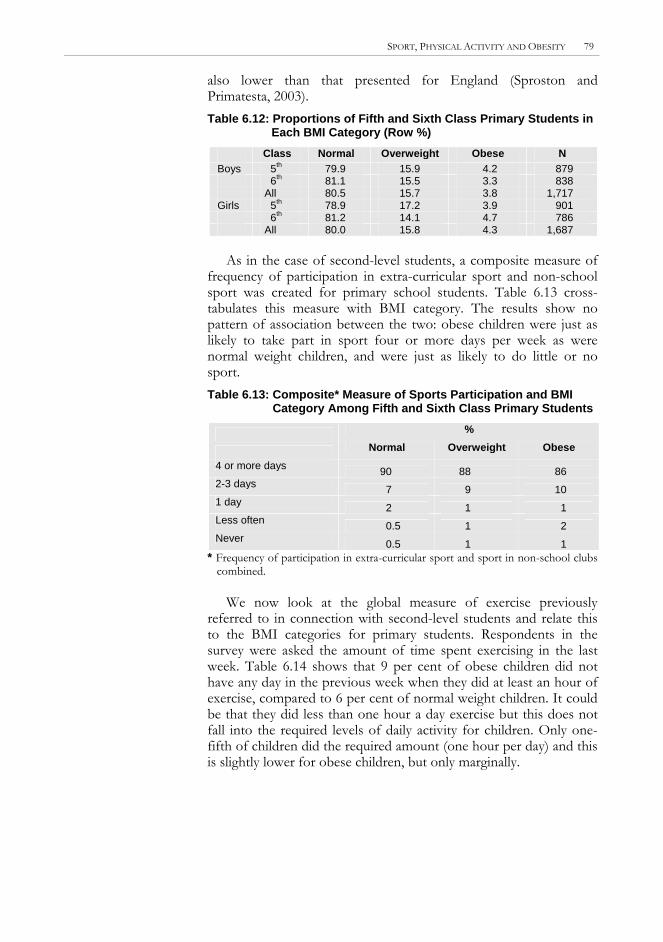
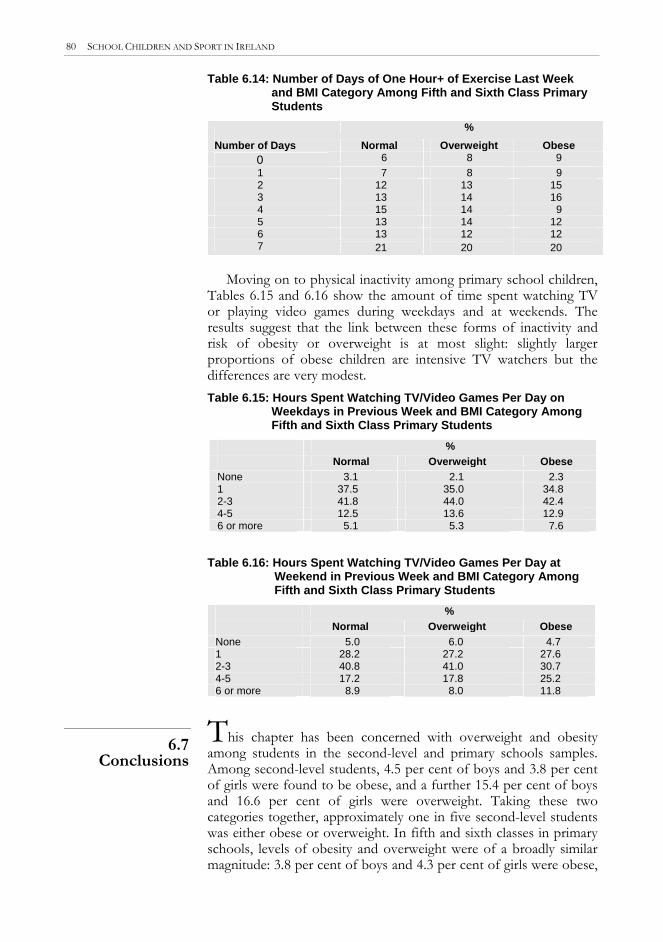
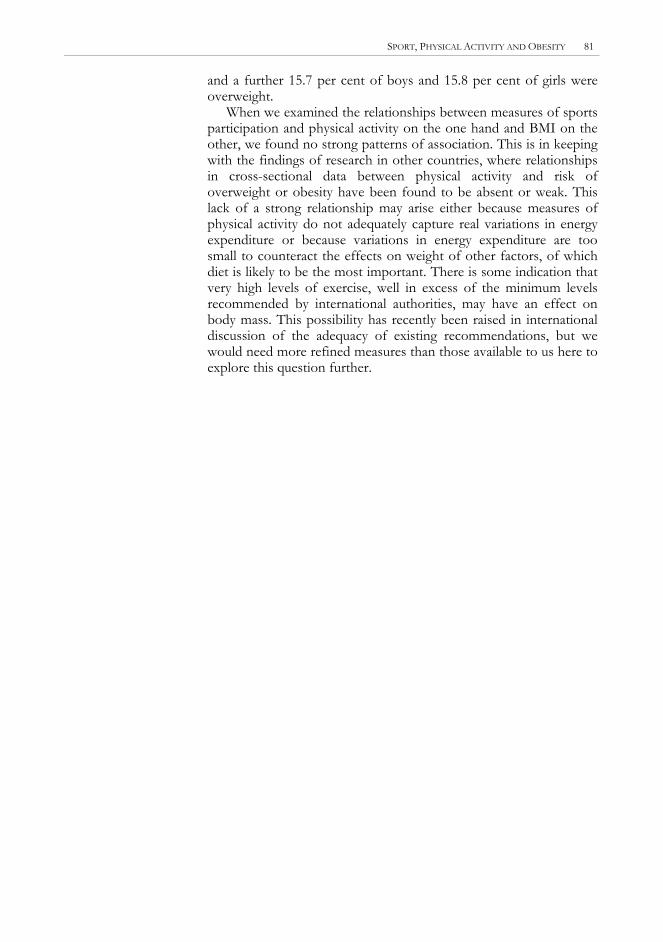
Much of the interest in children’s sport is motivated by concerns
for its role in promoting children’s health and well-being. There is abundant evidence that physical activity is good for children’s physical and psychological development and that lack of physical activity can be a contributory cause of a wide range of health problems, both in childhood and as a carry-over into adulthood (Boreham and Riddoch, 2001; Koplan et al., 2005). The main health benefits commonly associated with physical activity for children are improved cardiovascular performance, strengthening of the musculoskeletal system, reduced stress and anxiety, enhanced self-esteem, reduced risk of chronic disease such as hypertension, type 2 diabetes, obesity and cardiovascular disease (Koplan et al., 2005, p. 114). The relationship between lack of physical activity and obesity has become a particularly important issue in recent years because of concerns about the rapidly rising incidence of obesity among children and adults (National Task Force on Obesity, 2005).
1.2 Importance of
Sport for Children
In addition to its benefits for health, sport also makes an important contribution to children’s physical, personal, social and emotional development, a fact that underpins the place of physical education in the school curriculum (see, e.g., Department of Education and Science, 2003). While the contribution of physical education to children’s overall development is widely recognised, it is often lamented that sport and physical education are the poor relations of the school curriculum and receive less time and attention than examination subjects (MacPhail and Halbert, 2005). However,
4 SCHOOL CHILDREN AND SPORT IN IRELAND
it has also been recognised that, whatever the role of PE in schools, extra-curricular sport is a central focus of the life and identity of many schools and plays a major role in defining what Lynch (1989) calls their ‘hidden curriculum’ – the ethos and informal structures and processes that play a large role in defining the character of schools and the overall educational experience encountered by students (see also Lynch and Lodge, 2002). In order to appreciate the role of sport in schools and thus in children’s education and development, it is therefore necessary to look beyond PE and take account of extra-curricular sport and the sometimes central significance it has in school life.
In assessing the importance of sport in schools, a further significant consideration to take into account is that many children – especially boys – enjoy sport. It is an aspect of the life of schools that is more responsive to what children themselves want and enjoy than most others. As such, it is an attraction in schools that can have a positive effect on the motivation and willingness to participate of many students – and again, this is particularly the case for boys. Children’s own views of sport are often overlooked in considering the role that it should play in their lives. The need to take these views into account is an issue that will be returned to below in assessing the role of sport in schools and the emphasis that should be given to it as a means to further the physical education of young people.
A primary motivation for government expenditure on sport is the assumption that it is a “merit good”, that is, one that should be available as a matter of fairness to all irrespective of whether they can afford to pay for it. For children, this point is particularly relevant as they do not have independent access to income. The “merit good” character of sport should also caution us against an over-focus on the instrumental outcomes arising from sport, as opposed to the intrinsic value of sport as a good in itself. Research on children’s sport has arisen primarily within a public health perspective. That perspective is primarily concerned with physical activity, energy expenditure and aerobic fitness and their effects on physical and psychological health.
1.3 Previous Research
1.3.1 MEASUREMENT ISSUES
A key problem for research conducted within this perspective, among both children and adults, is that physical activity is difficult to measure, as it is a complex, multi-dimensional behaviour that varies by frequency, intensity, duration and type of activity. Each of these dimensions is difficult to quantify on its own and complex instruments are needed to capture them all together. Measurement techniques in large-scale population surveys often collapse this complexity into global self-reports that produce only approximate results (Rennie and Wareham, 1998). Even when more elaborate questionnaires are designed to capture different domains and dimensions of physical activity, they are still relatively imprecise as
INTRODUCTION 5
measures of energy expenditure (Wareham et al., 2002). Having reviewed the evidence on this issue, Wareham et al. (2005, p. 230) conclude that “the inherent limitations of self-report measures of activity for population surveillance of energy expenditure are so great that alternative strategies, including the use of objective monitoring [may be] required”. Referring particularly to children, Molnár and Livingstone (2000) state that “… there is no valid method of assessing activity levels that is feasible for use in large field studies.” Koplan et al. (2005, p. 113) also warn of the uncertain accuracy of self-report measures of physical activity, especially among children and their parents, but in addition caution that objective measures of motion (such as those based on pedometers and accelerometers) have not yet been sufficiently tested to ensure their validity among children and young people in diverse settings. They point to a particular need “to establish better methods of measurement of energy expenditure in children going through their normal daily activities in their home and school environments” (Koplan et al., 2005, p. 113).
These measurement problems have hampered the development of a clear picture of patterns of physical activity among young people and have made it difficult to establish their effects on health and well-being. As a result, there is a great deal of uncertainty about many basic questions in this area, though there are also some issues on which clear, robust findings have emerged. In providing an overview of the topics below, we attempt to distinguish between those issues on which agreed, well-established findings are available and those that remain uncertain.
1.3.2 HOW ACTIVE SHOULD CHILDREN BE?
While it is clear that physical activity is good for children, it is less clear what levels and forms of activity among children should be considered as adequate from a health point of view. Prior to the 1990s, adult standards were often used as a guide to youth activity levels but since the early 1990s a number of attempts have been made to set out guidelines specifically for young people and children (Presidents Council on Physical Fitness, 2004, pp. 4-5). The most widely cited recommendation at present is that children should accumulate at least 60 minutes of moderate to vigorous physical activity each day (Koplan et al., 2005, p. 113). However, concerns have been raised that this level of activity may be inadequate to prevent long-term weight gain. Rising obesity levels among both children and adults may indicate a need to increase both the total amount and the intensity of physical activity well beyond existing guidelines (Saris et al., 2003). As a result, more recent guidelines have emphasised the need for children to accumulate more than the 60 minute minimum of moderate to vigorous physical activity, to incorporate several bouts of activity lasting 15 minutes or more each day, and to avoid extended bouts of inactivity (NASPE, 2004).
6 SCHOOL CHILDREN AND SPORT IN IRELAND
1.3.3 HOW ACTIVE ARE CHILDREN?
Difficulties with measurement referred to earlier mean that estimates of activity levels among children vary a great deal and are of uncertain accuracy. It is therefore often difficult to establish the degree to which children attain recommended levels of physical activity. Broadly speaking, two types of measures are available: those based on self-reports collected by questionnaire, which are the more widely used, and those based on objective monitoring by means of pedometers or accelerometers (devices attached to the leg or body that measure movement). In general, questionnaire-based self-reports provide lower estimates of physical activity than do objective measures, particularly those based on accelerometers, and there is some evidence that the latter are the more accurate (Pate et al., 2002). One widely cited accelerometer study in the US (Trost et al., 2002), found that younger elementary school children (grades 1-3) accumulated on average over three hours of moderate to vigorous physical activity per day, while children in grades 4-6 accumulated almost two hours – much higher levels of activity than normally measured for children of those ages using self-reported data. A study of 9 year olds and 15 year olds using similar accelerometer data in a number of European countries found that almost all 9 year old boys and girls (97.4 and 97.6 per cent respectively) attained the minimum health-related physical activity recommendations. Among 15 year olds, attainment of the recommendations was lower but was still reasonably high in absolute terms (81.9 per cent among boys and 62 per cent among girls).
Despite the uncertainties of measurement, a number of well-established patterns in children’s activity can be identified (Sallis, 2000; Caspersen et al., 2000). These include the following:
• Children aged from around 8 or 9 years to 12 or 13 years are most likely to be active and likely to attain the recommended levels of activity.
• Physical activity declines during the teenage years, with the onset of decline usually identified as occurring sometime between 13 and 15 years of age. By the late teenage years, substantial minorities have developed sedentary or low-activity lifestyles, though not to the same degree as adults. According to Sallis (2000), age-related decline in physical activity is so common in human populations and occurs so widely also in many animal species that it must have a biological basis and is not simply a consequence of social factors (such as pressures of study) that arise in particular cultures.
• Boys are more active than girls and are less likely to be completely sedentary.
Research on physical activity among children in Ireland has been based primarily on self-reported data. These data are too varied in character to provide a consistent picture of children’s level of activity. Ní Mhuircheartaigh (1999), in a study of pupils in a number
INTRODUCTION 7
of secondary schools in the Western Health Board area, found that adolescents spent on average twelve hours per week in sport and physical activities, with the majority participating in light to moderate activities. The surveys on the Health Behaviour of School-aged Children generally found lower levels of physical activity: less than 40 per cent of girls and just over 60 per cent of boys reported that they exercised four or more times per week (Kelleher et al., 2003, pp. 64-65; see also Hickman et al., 2000). O’Connor’s (2003) study of second-level students in Waterford examined participation in sport rather than overall activity levels and found that 27 per cent of students did not participate in any sport. A study of a small sample (N=41) of 4-5 year olds in rural Ireland as it was unusual in being based on accelerometer data found a high incidence of sedentary lifestyle (Kelly et al., 2005).
An as yet unpublished study of 15-17 year olds in the East Coast Area Health Board region showed that their levels of physical activity were low – only 20 per cent of participants were involved in moderate to vigorous physical activity for more than five days per week. It also showed that obese adolescents were more sedentary in their lifestyles and less aerobically fit than normal weight adolescents (Woods et al., 2004, cited in National Taskforce on Obesity, 2005, p. 47).
1.3.4 HAS CHILDREN’S PHYSICAL ACTIVITY DECLINED?
It is widely believed that children’s levels of physical activity have declined over time and that this decline has contributed to the problems of obesity and overweight among children (National Task Force on Obesity, 2005). However, direct evidence on long-term trends in children’s physical activity levels is lacking. Measurement in this area has commenced so recently and is so difficult to conduct on a consistent, accurate basis over time that reliable trend data are extremely difficult to construct (Livingstone, 2000). Indirect evidence suggests that children are less active now than their counterparts of 50 years ago (Boreham and Riddoch, 2001). However, it is less clear that more recent trends in childhood physical activity have been downward. A recent study of children’s activity in the Centers for Disease Control and Prevention in the United States found that time spent by children in physical activity had increased and time spent in sedentary activity had declined between 1981 and 1997 (Sturm, 2005). Ham et al. (2004) similarly found a decrease in total inactivity during leisure time in the US population as a whole between 1998 and 2002. As noted by Wareham et al. (2005), these findings indicating recent rises in physical activity levels are paradoxical given the rapid increase in obesity that occurred over the same period.
8 SCHOOL CHILDREN AND SPORT IN IRELAND
1.3.5 IS PHYSICAL INACTIVITY A CAUSE OF THE RISE IN OBESITY?
Rising obesity levels among children and adults is now a universal pattern in developed countries and is becoming increasingly common in poor countries also (Koplan et al., 2005; National Task Force on Obesity, 2005). Obesity is caused by an excess of energy intake over energy expenditure. However, as Livingstone (2000) points out, the relative contribution of increased energy intake compared to declining energy expenditure as causes of the rise in obesity is quite unclear, with the research on this issue presenting “a confused and confusing picture”. A number of reviews of research on the relationship between physical activity and obesity have found inconsistent results: some studies find a connection between the two, but others do not, and where a connection is found, it is generally found to be weak. Fogelholm and Kukkonen-Harjula’s (2000) review, for example, concluded that the evidence on the relationship between baseline physical activity and weight gain was inconsistent, and such effects as could be established were modest. Molnár and Livingstone (2000) reviewed the evidence on this issue in relation to children and adolescents. Of the seven studies they examined, four found an association between physical activity and weight gain and three did not. Wareham et al. (2005) reviewed more recent studies relating to children and found similar results: many studies found no effect of physical activity on weight gain, while in those that did, the measures of association tended to be small. Research on the relationship between school-based physical activity such as PE and weight gain has also failed to find robust effects. The study by Cawley et al. (2005) on the relationship between PE requirements across the states of the United States and weight gain among students found that, while students in states where PE requirements were more demanding had higher levels of physical activity, their risk of becoming overweight or obese was no less than it was in states where PE requirements and consequent physical activity levels among students were lower.
The absence of a robust link between physical activity and risk of being overweight is counter-intuitive and runs against the grain of much received wisdom. There is an outside possibility that it is a methodological artefact: available measures of physical activity may be so crude and prone to measurement error that they fail to capture real and significant differences in energy expenditure and so fail to reveal a link between energy expenditure and weight gain (Wareham et al., 2005). The more likely possibility is that levels of physical activity that are considered normal and desirable in populations in developed societies may be too low to counter the large increases in energy intake that have occurred in modern diets. As the Surgeon General in the United States has pointed out, a typical fast food meal consisting of cheeseburger, French fries and soft drink (1,500 calories) would take 2½ hours jogging at 10 minutes per mile to work off, and one jelly-filled doughnut is the energy equivalent of one hour of walking at a moderate pace (Department of Health and Human Services, 2001). Such energy dense foods play a large part in
INTRODUCTION 9
modern diets. This has led some experts to suggest that recommended minimum physical activity levels would need to be raised to much higher levels than they have been up to now in order to counter the trend towards weight gain (Saris et al., 2003).
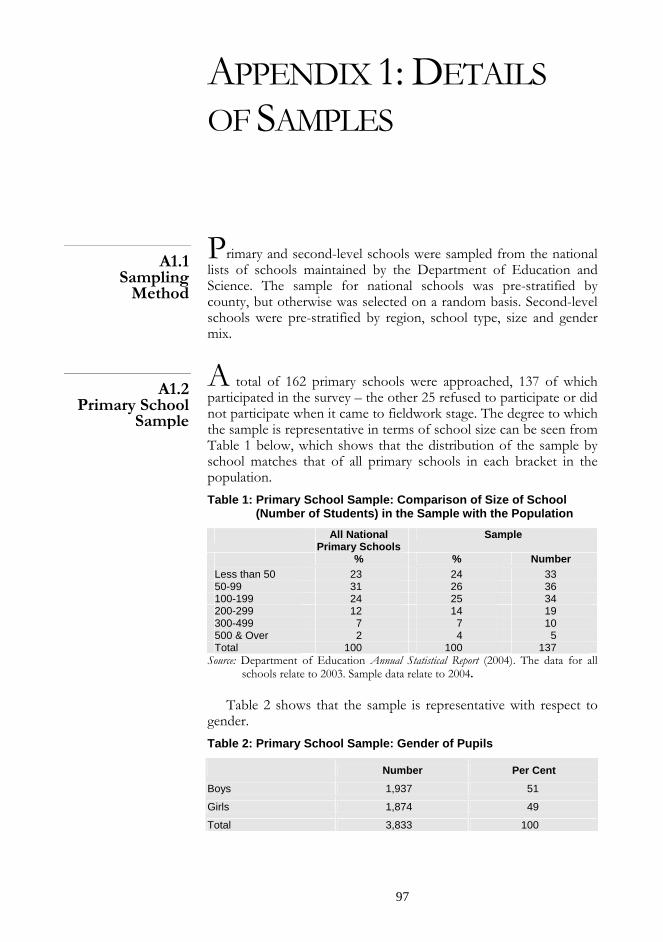
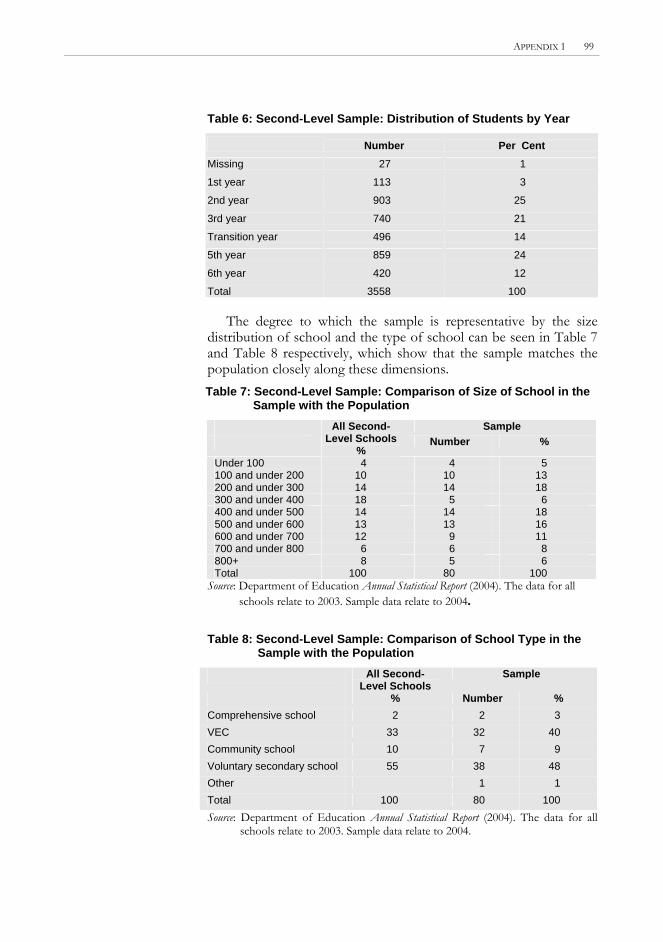
The study is based on nationally representative survey data
collected from students in second-level schools and in fifth and sixth class in primary schools and from principals in the same schools. The samples consist of 80 schools and 3,527 students at second level and 137 schools and 3,833 pupils at primary level. In second-level schools, one junior cycle class and one senior cycle class was selected for inclusion in the sample. In primary schools, a fifth and sixth class in each school was selected. For further details on the sampling methodology and representativeness of the samples, see Appendix 1. Letters informing parents of the survey and offering the option of withholding their children from participating were distributed through the schools in advance of fieldwork. Fieldwork was carried out by The Economic and Social Research Institute’s Survey Unit in November/December 2004.
1.4 Data
The data collection instruments consisted of four questionnaires – one each for principals in second-level and primary schools and for students in second-level and primary schools. All were self-completion questionnaires. The students’ questionnaires were designed to be administered in the classroom during a single class period under the direction of an ESRI interviewer who explained the purpose of the questionnaire and guided the class through it. While the main focus of the survey was on issues connected with sport, it was also decided to make use of the opportunity presented by the survey to measure children’s height and weight and thus to provide the data needed to compute the body-mass index, the most commonly used indicator for overweight and obesity. In the course of the class period, therefore, the ESRI interviewer weighed and measured the height of each child and recorded the results on the questionnaire completed by the child. The height-weight data recorded in this way had certain limitations, and these are discussed in Chapter 6.
Younger primary school children were omitted from the survey as it was considered that their inclusion would extend the substantive and methodological concerns beyond the range of what a single study of this type could cope with. Methodologically, for example, younger children would have required a quite different approach to data collection than that which could be used with older children. Fifth class was thought to be the lowest level in the primary school cycle at which the majority of children could be expected to have the levels of literacy and understanding needed to complete self-report questionnaires. Therefore, fifth class was chosen as the lower cut-off for sampling for the study. No upper limit was set in that second-level pupils up to the final year were included in the sample. It was anticipated during the pilot testing of the survey instruments that the main fieldwork would take place in
10 SCHOOL CHILDREN AND SPORT IN IRELAND
the early part of the school year (between September and November). As some of these items related to pupils’ regular sports participation, it was felt that it might be too early for first year pupils in second level-schools to have settled into school life and established a clear sense of what their regular pattern of sports participation would be. It was therefore decided to omit first year pupils in second-level schools from the sample as a way of enhancing data quality.
The omission from the survey of children who have left school or are in special schools reflects the concern of the study with the standard school context as an influence on sports participation among young people. Early school leavers or pupils in special schools could justifiably be regarded as a serious concern for policy on sport and physical education among young people. However, specially designed studies would be required to collect information on these groups.
2. POLICY CONTEXT
As outlined in the introduction, there are three main pillars of organised children’s sport in Ireland – physical education in schools, extra-curricular sport in schools, and sport played in clubs apart from the school. These come within the remit of two main policy sectors – education policy as it relates to physical education (PE) and sport, and sports policy. The purpose of this chapter is to review the two latter areas of policy as they affect children’s sport and outline the organisational context in which they operate. This organisational context consists partly of state bodies with responsibilities in the fields of PE and sport and partly of a range of sports bodies and organisations, many of which are voluntary and community-based in character. The chapter is intended to set the scene for the data analysis contained in subsequent chapters. It aims not to provide a comprehensive account of bodies with a role in children’s sport but to identify a number of key policy issues and features that have a bearing on the interpretation of the empirical data in subsequent chapters and the policy implications they give rise to.
2.1 Introduction
The interest of education policy in sport arises primarily in the context of the PE element of the school curriculum but it extends also to extra-curricular sport in the school. Though PE and extra-curricular sport both take place in the school, they are usually structured as distinct elements in the school programme and serve different purposes.
2.2 Education
Policy and Sport
2.2.1 PHYSICAL EDUCATION
11
PE is concerned, in principle at least, with all students equally and with physical and personal development broadly conceived. The present approach to PE is based on a holistic concept of physical activity for young people: it “… recognises the physical, mental, emotional and social dimensions of human movement, and emphasises the contribution of physical activity to the promotion of individual and group well-being” (Department of Education and Science, 2003, p. 2). In order to reflect this philosophy, the PE syllabus at primary level and in both the junior cycle and senior cycle in second-level schools has recently been revised and the new syllabuses are now being phased in. A decision has also been taken that PE should be included as a subject option in the Leaving Certificate examination, a major departure in view of the traditional status of PE as a subject outside of the examination system. Given all of these developments, the present period has been described as
12 SCHOOL CHILDREN AND SPORT IN IRELAND
one of unprecedented change for PE in schools (MacPhail and Halbert, 2005). The new syllabuses at second level distinguish seven core disciplines within PE – adventure activities, aquatics, athletics, dance, games, gymnastics and health related activities. While these disciplines encompass sport, they extend well beyond what is normally provided under the heading of sport in most schools.
Although the pedagogical underpinnings of PE in Irish schools are now highly developed, actual delivery varies a great deal between schools and is widely perceived to fall far short of recommended standards (for a good recent overview, see MacPhail and Halbert, 2005). For second-level schools, curriculum guidelines require that PE be delivered by formally qualified PE teachers but in practice up to 30 per cent of second-level schools do not have a qualified PE teacher on their staff (O’Connor 2003, p. 48; MacPhail and Halbert, 2005, p. 291; see also below, p.40). The official recommendation is that two hours of PE be delivered per week per student, but the available evidence suggests that many schools do not meet this recommendation and that students’ participation in PE drops sharply in the senior cycle (MacPhail and Halbert, 2005). The single biggest constraint on PE at second level is widely perceived to be the overcrowded curriculum and the consequent lack of time to devote to PE. Other major constraints are inadequacies in equipment and facilities and insufficient staff (MacPhail and Halbert, 2005, p. 296). The introduction of PE as a Leaving Certificate subject is viewed by many as a way of improving the status and resources devoted to PE. Others are concerned that it will lead to a concentration of PE effort on those who take it as a Leaving Certificate subject and a consequent decline in PE for other students (MacPhail and Halbert, 2005, p. 299).
At primary level, PE is delivered by class teachers rather than specialists. Primary teachers often undertake a PE element in their basic professional training or in-service training in PE but the general perception is that primary teachers are poorly equipped to deliver PE (MacPhail and Halbert, 2005, p. 300). Other problems at primary level include the lack of facilities and insufficient time, all of which lead to a general under-provision of PE at primary level (ibid.; see also National Children’s Office, 2004, p. 25).
2.2.2 EXTRA-CURRICULAR SPORT
Extra-curricular sport is often an important part of the school programme, especially at second level, but it takes place outside the formal curriculum and in principle is wholly a concern of the school rather than of national education policy (see Lynch, 1989 for an account of the role of sport in the informal or ‘hidden’ curriculum of the school; see also Lynch and Lodge, 2002). Its extent and character therefore varies a great deal across schools – some schools do only a little and attach little importance to it but for others it may be a major part of the life and identity of the school (Lynch and Lodge 2002, pp 108-114, 125). It may also vary in the degree to which it is inclusive of all students equally rather than being tilted towards the better performers, or towards boys rather than girls
POLICY CONTEXT 13
(ibid.). In many schools, extra-curricular sport is intensively focused on a particular sport (as in the ‘rugby school’ or the ‘hurling/football school’) rather than on a broad PE approach. The organisation and delivery of extra-curricular sport for students are often assumed to be a part of the teacher’s job but in fact are normally outside the teacher’s formal duties and are voluntary. The teacher’s willingness to take on these tasks often reflects a commitment to a particular sport on the teacher’s part but usually is not accompanied by formal training in PE or sports coaching.
Though extra-curricular sport in principle is the province of the school and is outside the purview of education policy, in practice it overlaps with PE in important ways and shapes how PE is provided. Much of the interaction between the two is positive and mutually reinforcing. Students often have a strong interest in sport, especially those sports that have a high profile in the world outside the school. The inclusion of such sports in the PE syllabus can make PE more appealing and enjoyable to many students. PE and extra-curricular sport also often draw on the same resources, and facilities developed for one, whether through public funding or the efforts of the school, can be used for the other.
However, there are also concerns about possible drawbacks in the relationship between sport and PE in schools. The key such concern is that a dominant interest in a narrow range of team-based competitive sports in extra-curricular sport may have a spill-over effect on PE and displace the broader, more inclusive objectives of the PE curriculum. Two particular problems may arise as a result. The first is that the physical education needs of students with a limited interest in or capacity for competitive sport may be poorly served. The second is that even for those who enthusiastically take part in sport, the kinds of sports they undertake may be difficult to sustain in adult life and may lead to a high rate of drop-out from sport in the years after leaving school. Among the adult population in Ireland, Fahey et al. (2004) found that women in particular had tended to give up the sports they had played in school quite soon after leaving school. Even though men were more likely to continue playing their school sports into their twenties and thirties, they too had either moved to physically less demanding sports (such as golf) or given up sport altogether by the time they reached middle age. In the UK, Fairclough et al. (2002) pointed to similar problems, especially in schools with male PE teachers, and recommended that “ … physical educators must recognise which activities have the greatest carry-over value into adult life, and aim to provide more opportunities for all students to experience these activities”.
Thus the degree to which schools focus on a limited range of team-based competitive sports in extra-curricular sport, and possibly also in PE, is an important concern and is a question that we will examine in some detail in the following chapters.
14 SCHOOL CHILDREN AND SPORT IN IRELAND
Sport is a relatively new sector for public policy in Ireland, having become significant only with the growth of National Lottery funding for sport in the mid-1990s and the appointment of a government minister for sport in 1997. Public expenditure on the areas of sport towards which National Lottery funding is directed amounted to €131 million in 2004. The remit of sports policy extends over the whole field of competitive and recreational sport for the entire population. Its key aims include increasing public participation in sport, raising performance levels in sport and supporting high level sports competition (Irish Sports Council, 2003). While part of the remit of sports policy relates to sports played mainly by adults, much of it either embraces adults and children equally or is specifically concerned with children.
2.3 Sports Policy
and Children’s Sport
The two main avenues of public funding of sport are the Sports Capital Programme administered by the Department of Arts, Sports and Tourism and the funding for current activities provided through the Irish Sports Council, a statutory body set up in 1999. The Sports Capital Programme is designed to support the provision or upgrade of facilities available for Irish sport, ranging from wholly funded major national facilities such as the National Aquatic Centre and state contributions towards the re-development of Croke Park through to small scale facilities developed at local level by sports clubs. To the extent that most sports clubs have youth sections, funding for the Sports Capital Programme can be viewed partially as funding for youth sports.
The Irish Sports Council, which had a budget of €30 million in 2004, provides current funding for sport primarily through a grants programme directed at a range of sports bodies and activities. Its biggest single category of expenditure, amounting to €7.9 million in 2004, consists of the grants to the national governing bodies of Irish sport, of which there are over 60. These account for the great majority of recreational sports in Ireland. While the sports participants who ultimately benefit from grants to national governing bodies are not classified by age, most of the sports involved would have a significant youth component.
A number of programmes funded by the Council are specifically oriented to young people. A feature of these programmes that amounts to an important policy innovation in children’s PE and sport is that many of them reach into the school, either directly or through the activities of local sports organisations. An example of direct support to PE is provided by the Buntús programme, an initiative designed to assist primary teachers implement the games element in the primary level PE syllabus. It aims to utilise pedagogically advanced, age-appropriate PE techniques to contribute to the holistic approach of the PE syllabus at primary level. The programme is administered by the Local Sports Partnerships. These are bodies that have been set up in 16 areas in the country (usually on a county basis) with the objective of bringing together local agencies with an interest in sport in order to promote local sports participation.
POLICY CONTEXT 15
A second example of new initiatives of this kind is the Youth Field Sports programme. After the programme of grants to the national governing bodies, this is the second largest of the Irish Sports Council’s funding programmes, having accounted for €6.7 million in expenditure in 2004. It is directed at three major national governing bodies of sport, the Gaelic Athletic Association (Gaelic games), the Football Association of Ireland (soccer) and the Irish Rugby Football Union (rugby). As its name suggests, this programme is wholly intended to serve young people, its purpose being to increase and support youth participation in the sports run by these three bodies. While the activities funded under the programme are varied, one significant activity is the appointment of paid sports development officers by clubs that come under the umbrella of the GAA, the FAI and the IRFU. From the point of view of the three sports bodies, the significance of this development is that it expands the role of paid, professional staff in youth programmes that formerly were run almost entirely on a voluntary basis. It thus offers an important opportunity to extend the youth services they provide while also presenting the challenge of integrating the new professional element in such a way as to enhance rather than displace traditional voluntary activity.
In addition, however, the initiative is significant for sport played within schools, under the heading both of PE and extra-curricular sport. It is here that its importance as policy innovation needs to be appreciated. While the role of games development officers supported by the initiative is defined in different ways by the three sports organisations and indeed by the individual clubs within those organisations, that role often includes assisting local schools to provide their students with sport – specifically with Gaelic games, soccer and rugby. Many schools have long relied on local sports clubs to assist them in providing these sports, especially in connection with access to playing pitches and other facilities but also, in some instances, through assistance with coaching. In recent years also, many individual clubs, with the back-up of their governing bodies, had themselves begun to explore ways to extend their relationship with schools through the use of coaching and development staff paid out of their own resources. The Youth Field Sports initiative adds a major new dimension to these efforts, as it amounts to official recognition and support for the role of sports clubs in supporting the provision of sport within the school system.
These initiatives are too new for their full significance to have emerged and are as yet too limited in extent to have made an impact in all schools. Yet, the potential advantages they represent are many. They can provide additional resources to what is often seen as under-resourced PE and extra-curricular sport in schools. Stronger links between sports clubs and schools can aid the integration of schools into local community life and strengthen local social cohesion. Sports clubs in turn can acquire regular structured access to young people in schools and thus enhance their ability to recruit and develop new generations of players and club members.
16 SCHOOL CHILDREN AND SPORT IN IRELAND
At the same time, increased reliance on sports clubs and the funding they receive under sports funding programmes as a means to support PE and sport in schools may have drawbacks. The most obvious is that the sports that some people view as already too dominant in schools – that is, team based competitive sports – may become more dominant still. Thus, for example, the Youth Field Sports programme is wholly oriented to GAA games, soccer and rugby, typical examples of the kinds of sport that cause concern in this regard. A further possible problem is that supports to schools delivered through local sports clubs could be supply driven tather than demand led: they will be distributed not primarily on the basis of the needs of schools but on the basis of the capacity of sports clubs to deliver – and that capacity might be in greatest supply in better-off areas where sport in schools may be already reasonably well catered for.
It is the advent of these school-oriented programmes within the sports policy sector that gives rise to the overlapping dual structure in the policy context for children’s sport referred to earlier. While PE and sport in schools traditionally has been the preserve of education policy, these new programmes now give sports policy a role in the same fields. Questions about the implications of this dual structure for children’s PE and sport, and about its suitability as a basis for further development in these areas, are a key concern in the present study and will be further addressed in the following chapters.
Although education policy and sports policy are important
influences on children’s sport, it is worth recalling that much of children’s sporting life takes place outside of schools and outside of sports programmes funded by the state, as is described in the following chapters in connection with children’s sport in clubs apart from the school. That pillar of children’s sport is founded on an extensive network of voluntary, community based sports clubs and organisations that have grown up outside the state system and have only recently begun to receive state assistance. A previous report (Delaney and Fahey, 2005) estimated that approximately 15 per cent of the adult population provided some form of volunteering to sport, and while the precise share of that volunteering devoted to children’s sport was not established, the indications are that as much as half of it may be oriented in that direction. Furthermore, the same study found that a great deal of attendances at sports events (approximately 30 per cent) was accounted for by attendance at children’s events.
2.4 Broader
Organisational Context
Some of the community-based organisations with an interest in children’s sport go beyond the club in the usual sense and embrace a number of different sports. For example, the Community Games is a national voluntary organisation that organises local-level competitions for children aged 6-16 years in a range of sports such as athletics, soccer, and basketball, as well as some alternative versions of team sports such as tag rugby. It has been in operation
POLICY CONTEXT 17
since 1968 and claims to have over 500,000 participants and 20,000 volunteers. Special Olympics Ireland is another cross-sport body. It organises year-round sports training for children and adults with a learning disability and hosted the Special Olympics World Summer Games in 2003.
Taken all together, these organisations represent a massive social infrastructure and a major resource for children’s sport. Their economic value is substantial, and in current expenditure terms, is greater by a large margin than the value of expenditure incurred under national sports policy (Delaney and Fahey, 2005). While it is not possible to isolate expenditure on PE in schools, it is likely that community-based sport is at least of a similar order of economic value. Thus, while we are concerned here with the areas of children’s sport that come within the remit of sports policy and education policy, we need to keep in mind the scale and importance of organised children’s sport that has grown up independently of each.
This chapter has examined the two main policy sectors that have
responsibility for policy development and expenditure underpinning children’s sport. These sectors are education policy, which primarily is responsible for physical education in schools but by extension has an interest also in extra-curricular sport in schools, and sports policy, which primarily is responsible for sport outside of the school but also, quite importantly, has recently come to have an interest also in sport and PE within the school. Within the education sector, the PE syllabuses at primary, junior cycle and senior cycle levels have recently been revised and are now based on a sophisticated, holistic approach to children’s physical development. The reality of the delivery of PE is less impressive and widely falls short of recommended standards, though account must also be taken of extra-curricular sport in the school in order to arrive at an overall judgement on how schools promote the physical education of children. Sports policy as it relates to children operates with an awareness of the holistic PE approach but it is necessarily more concerned with sport understood in a more conventional sense. At the same time, a number of its programmes are designed to offer support to sport and PE in schools, either directly or through the agency of local clubs and sports organisations. This brings outside sports organisations into closer contact with schools, a development that seems positive overall but may have some drawbacks as far as children’s physical education and sport are concerned.
2.5 Conclusions
The overlapping interest of these policy sectors gives rise to a distinctive dual structure in the policy context for children’s sport. This in turn gives rise to questions about how the two sides of the structure should relate to each other, and these questions will inform the analysis provided in the following chapters.
18
3. SPORT IN SECOND-LEVEL SCHOOLS: PARTICIPATION AND ATTITUDES
This chapter examines sports participation among students in second-level schools. Using a set of broad measures, it analyses students’ participation in sport across the three pillars referred to in previous chapters – physical education (PE) in schools, extra-curricular sport in schools, and sports played outside the school in clubs and other organised settings. It also examines perceptions and attitudes among both students and principals regarding students’ participation in sport.
3.1 Introduction
The analysis draws on data collected both from students and principals in the second-level school sample. As explained earlier (see ‘Data’ in Chapter 1), students from second year to sixth year in second-level schools were included in this sample. Because of the constraints of questionnaire space, the measures of students’ participation in sport for the most part focused on frequency of participation and did not attempt to quantify other important dimensions such as intensity and duration of activity (though duration of participation in PE was measured). This approach reflected the priority adopted in the study, which was to obtain relatively simple measures on a wide range of topics rather than in-depth measures on a narrower range.
As the review of research in Chapter 1 found, physical activity
among young people tends to peak up to the early teenage years and to drop thereafter, though it still tends to remain above adult levels throughout the teenage years. Girls also tend to be less active than boys and to show a sharper drop-off in activity as they age. The decline in participation by age may be exacerbated by the overcrowded curriculum in schools and the pressure of examinations as students move up the school cycle, factors that would limit the time available for PE and sport (MacPhail and Halbert, 2005). One feature of the Irish second-level curriculum provides an interesting test of the robustness of some of these
3.2 Sports
Participation
SPORT IN SECOND-LEVEL SCHOOLS: PARTICIPATION AND ATTITUDES 19
patterns. This is the existence of Transition Year as a bridge between the junior and senior cycles. Learning in Transition Year is intended to de-emphasise academic, examination-oriented subjects and focus instead on a broader range of life skills and non-academic topics. While schools are encouraged to be creative and independent in their design of Transition Year, sports and leisure activities are one of the ‘layers’ that are recommended to be included in the Transition Year programme. Over 90 per cent of schools that offer the programme include this layer and almost two-thirds of them offer four or more class periods in it per week (Smyth et al., 2004, pp. 70-73, 84). Given this freeing up of space for sport and leisure activities in Transition Year, one would expect it to show a ‘bounce’ in participation in sport and leisure activities among students. Since such a bounce would be out of line with the general tendency of physical activity to decline with age, the degree to which it occurs could be taken as an indication of the extent of curriculum influence on sports and physical activity among students.
3.2.1 PARTICIPATION IN PHYSICAL EDUCATION
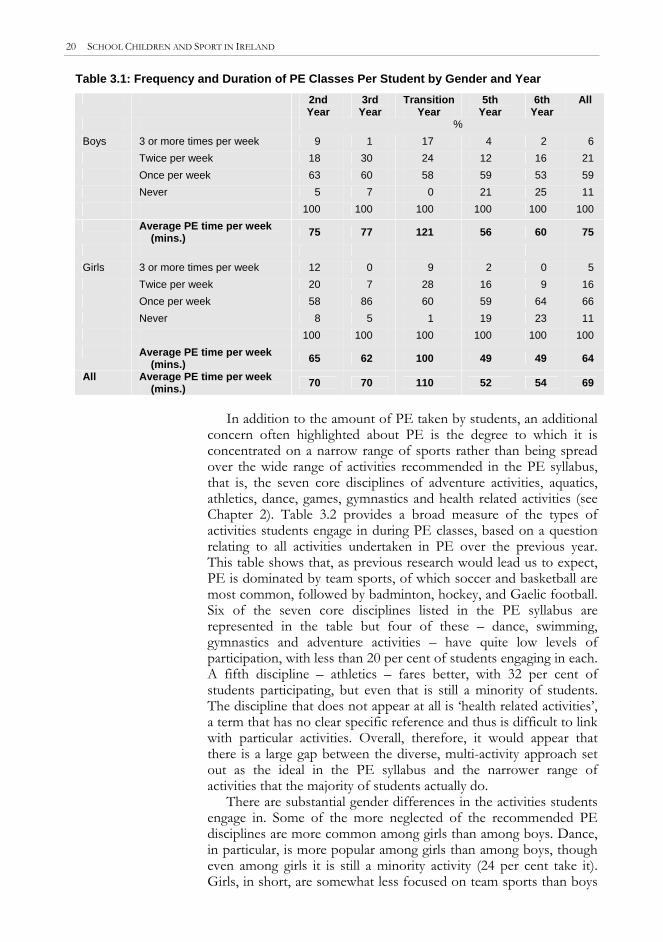
As was mentioned in Chapter 2, the PE curriculum for second-level schools recommends two hours of PE per student per week, though the indications are that schools often fail to supply that minimum. Table 3.1 confirms the low level of provision of PE: over 60 per cent of students have only one PE class per week, while only less than one in five students have two classes of PE per week or more. One in ten students (11 per cent) say they have no PE at all. Table 3.1 also shows that, in general, participation in PE declines as students move through the years: a quarter of sixth year pupils take no PE, compared to 5 per cent of second year boys and 8 per cent of second year girls. However, the Transition Year bounce mentioned above is also evident and provides a temporary reversal of the decline in PE with age. The proportion of students that take PE twice or more per week jumps to over 40 per cent in Transition Year, well above the level found in all other years.
The number of PE classes per week of itself does not indicate time spent in PE, since PE classes can vary in duration. Students were therefore also asked what the average length of their PE classes was, and taking the number of classes and class duration together, their average PE time per week was calculated (also Table 3.1). For boys and girls combined, PE time per week calculated in this way was 69 minutes, well below the two hours recommended in the PE syllabus. For most years in the second-level cycle, neither boys nor girls exceeded 80 minutes per week, and girls were generally well below that level. Again, however, the exceptional pattern in Transition Year is evident: here boys had an average of 121 minutes per week, which is the recommended two hours, while girls had 100 minutes.
20 SCHOOL CHILDREN AND SPORT IN IRELAND
Table 3.1: Frequency and Duration of PE Classes Per Student by Gender and Year 2nd
Year 3rd
Year Transition
Year 5th
Year 6th
Year All
% Boys 3 or more times per week 9 1 17 4 2 6 Twice per week 18 30 24 12 16 21 Once per week 63 60 58 59 53 59 Never 5 7 0 21 25 11 100 100 100 100 100 100 Average PE time per week
(mins.) 75 77 121 56 60 75 Girls 3 or more times per week 12 0 9 2 0 5 Twice per week 20 7 28 16 9 16 Once per week 58 86 60 59 64 66 Never 8 5 1 19 23 11 100 100 100 100 100 100 Average PE time per week
(mins.) 65 62 100 49 49 64 All Average PE time per week
(mins.) 70 70 110 52 54 69
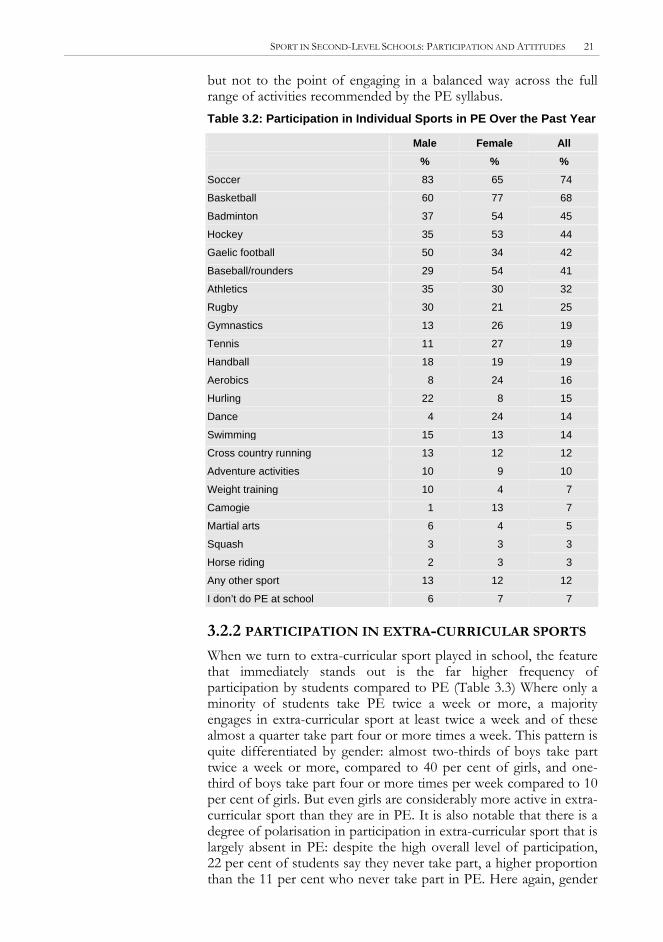
In addition to the amount of PE taken by students, an additional
concern often highlighted about PE is the degree to which it is concentrated on a narrow range of sports rather than being spread over the wide range of activities recommended in the PE syllabus, that is, the seven core disciplines of adventure activities, aquatics, athletics, dance, games, gymnastics and health related activities (see Chapter 2). Table 3.2 provides a broad measure of the types of activities students engage in during PE classes, based on a question relating to all activities undertaken in PE over the previous year. This table shows that, as previous research would lead us to expect, PE is dominated by team sports, of which soccer and basketball are most common, followed by badminton, hockey, and Gaelic football. Six of the seven core disciplines listed in the PE syllabus are represented in the table but four of these – dance, swimming, gymnastics and adventure activities – have quite low levels of participation, with less than 20 per cent of students engaging in each. A fifth discipline – athletics – fares better, with 32 per cent of students participating, but even that is still a minority of students. The discipline that does not appear at all is ‘health related activities’, a term that has no clear specific reference and thus is difficult to link with particular activities. Overall, therefore, it would appear that there is a large gap between the diverse, multi-activity approach set out as the ideal in the PE syllabus and the narrower range of activities that the majority of students actually do.
There are substantial gender differences in the activities students engage in. Some of the more neglected of the recommended PE disciplines are more common among girls than among boys. Dance, in particular, is more popular among girls than among boys, though even among girls it is still a minority activity (24 per cent take it). Girls, in short, are somewhat less focused on team sports than boys
SPORT IN SECOND-LEVEL SCHOOLS: PARTICIPATION AND ATTITUDES 21
but not to the point of engaging in a balanced way across the full range of activities recommended by the PE syllabus. Table 3.2: Participation in Individual Sports in PE Over the Past Year
Male Female All % % %
Soccer 83 65 74
Basketball 60 77 68
Badminton 37 54 45
Hockey 35 53 44
Gaelic football 50 34 42
Baseball/rounders 29 54 41
Athletics 35 30 32
Rugby 30 21 25
Gymnastics 13 26 19
Tennis 11 27 19
Handball 18 19 19
Aerobics 8 24 16
Hurling 22 8 15
Dance 4 24 14
Swimming 15 13 14
Cross country running 13 12 12
Adventure activities 10 9 10
Weight training 10 4 7
Camogie 1 13 7
Martial arts 6 4 5
Squash 3 3 3
Horse riding 2 3 3
Any other sport 13 12 12
I don’t do PE at school 6 7 7
3.2.2 PARTICIPATION IN EXTRA-CURRICULAR SPORTS
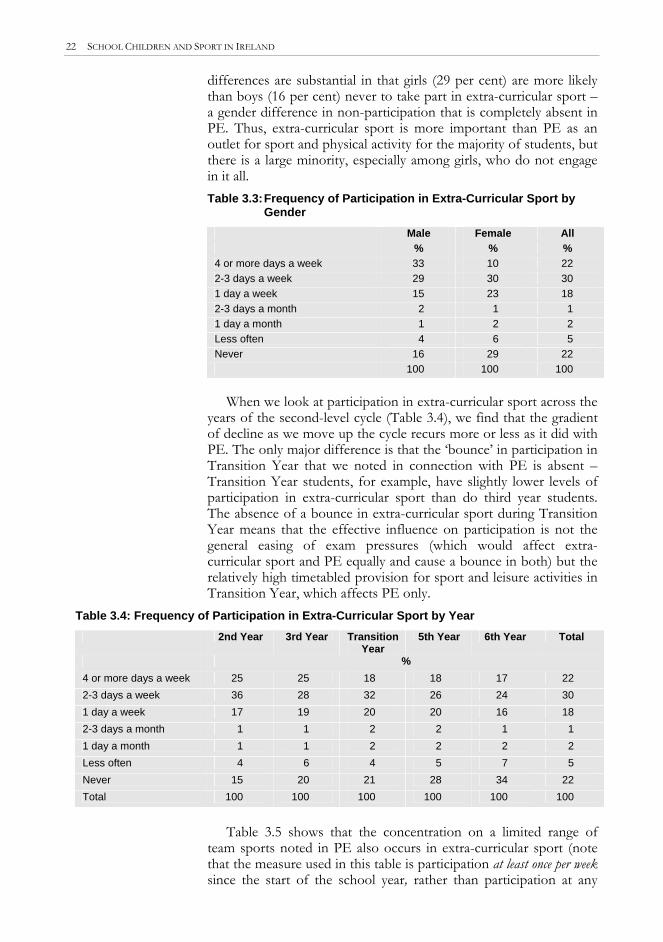
When we turn to extra-curricular sport played in school, the feature that immediately stands out is the far higher frequency of participation by students compared to PE (Table 3.3) Where only a minority of students take PE twice a week or more, a majority engages in extra-curricular sport at least twice a week and of these almost a quarter take part four or more times a week. This pattern is quite differentiated by gender: almost two-thirds of boys take part twice a week or more, compared to 40 per cent of girls, and one-third of boys take part four or more times per week compared to 10 per cent of girls. But even girls are considerably more active in extra-curricular sport than they are in PE. It is also notable that there is a degree of polarisation in participation in extra-curricular sport that is largely absent in PE: despite the high overall level of participation, 22 per cent of students say they never take part, a higher proportion than the 11 per cent who never take part in PE. Here again, gender
22 SCHOOL CHILDREN AND SPORT IN IRELAND
differences are substantial in that girls (29 per cent) are more likely than boys (16 per cent) never to take part in extra-curricular sport – a gender difference in non-participation that is completely absent in PE. Thus, extra-curricular sport is more important than PE as an outlet for sport and physical activity for the majority of students, but there is a large minority, especially among girls, who do not engage in it all. Table 3.3: Frequency of Participation in Extra-Curricular Sport by
Gender Male Female All % % %
4 or more days a week 33 10 22 2-3 days a week 29 30 30 1 day a week 15 23 18 2-3 days a month 2 1 1 1 day a month 1 2 2 Less often 4 6 5 Never 16 29 22
100 100 100
When we look at participation in extra-curricular sport across the years of the second-level cycle (Table 3.4), we find that the gradient of decline as we move up the cycle recurs more or less as it did with PE. The only major difference is that the ‘bounce’ in participation in Transition Year that we noted in connection with PE is absent – Transition Year students, for example, have slightly lower levels of participation in extra-curricular sport than do third year students. The absence of a bounce in extra-curricular sport during Transition Year means that the effective influence on participation is not the general easing of exam pressures (which would affect extra-curricular sport and PE equally and cause a bounce in both) but the relatively high timetabled provision for sport and leisure activities in Transition Year, which affects PE only.
Table 3.4: Frequency of Participation in Extra-Curricular Sport by Year 2nd Year 3rd Year Transition
Year 5th Year 6th Year Total
% 4 or more days a week 25 25 18 18 17 22 2-3 days a week 36 28 32 26 24 30 1 day a week 17 19 20 20 16 18 2-3 days a month 1 1 2 2 1 1 1 day a month 1 1 2 2 2 2 Less often 4 6 4 5 7 5 Never 15 20 21 28 34 22 Total 100 100 100 100 100 100
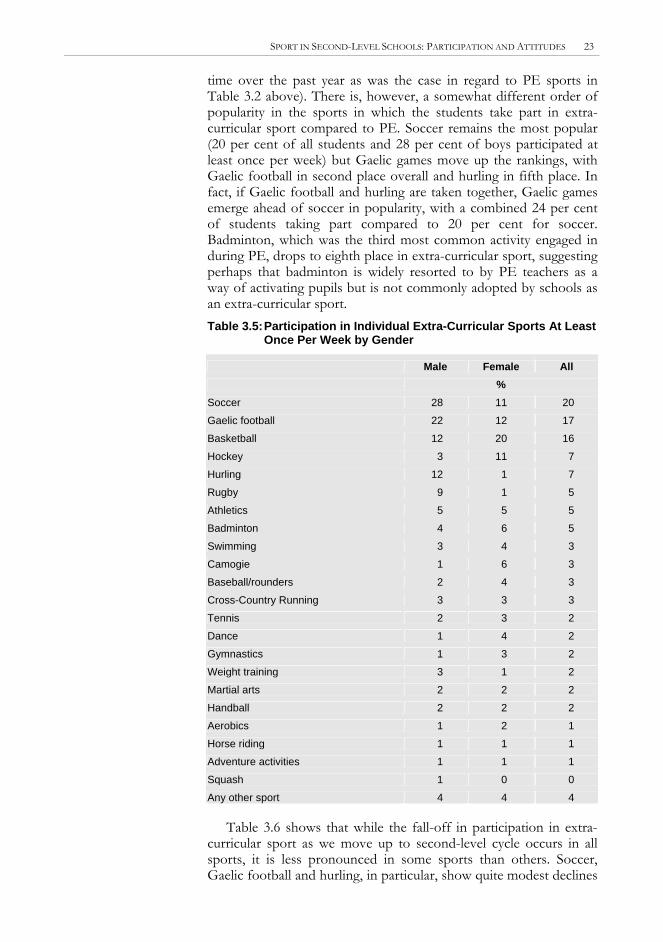
Table 3.5 shows that the concentration on a limited range of
team sports noted in PE also occurs in extra-curricular sport (note that the measure used in this table is participation at least once per week since the start of the school year, rather than participation at any
SPORT IN SECOND-LEVEL SCHOOLS: PARTICIPATION AND ATTITUDES 23
time over the past year as was the case in regard to PE sports in Table 3.2 above). There is, however, a somewhat different order of popularity in the sports in which the students take part in extra-curricular sport compared to PE. Soccer remains the most popular (20 per cent of all students and 28 per cent of boys participated at least once per week) but Gaelic games move up the rankings, with Gaelic football in second place overall and hurling in fifth place. In fact, if Gaelic football and hurling are taken together, Gaelic games emerge ahead of soccer in popularity, with a combined 24 per cent of students taking part compared to 20 per cent for soccer. Badminton, which was the third most common activity engaged in during PE, drops to eighth place in extra-curricular sport, suggesting perhaps that badminton is widely resorted to by PE teachers as a way of activating pupils but is not commonly adopted by schools as an extra-curricular sport. Table 3.5: Participation in Individual Extra-Curricular Sports At Least
Once Per Week by Gender
Male Female All %
Soccer 28 11 20
Gaelic football 22 12 17
Basketball 12 20 16
Hockey 3 11 7
Hurling 12 1 7
Rugby 9 1 5
Athletics 5 5 5
Badminton 4 6 5
Swimming 3 4 3
Camogie 1 6 3
Baseball/rounders 2 4 3
Cross-Country Running 3 3 3
Tennis 2 3 2
Dance 1 4 2
Gymnastics 1 3 2
Weight training 3 1 2
Martial arts 2 2 2
Handball 2 2 2
Aerobics 1 2 1
Horse riding 1 1 1
Adventure activities 1 1 1
Squash 1 0 0
Any other sport 4 4 4
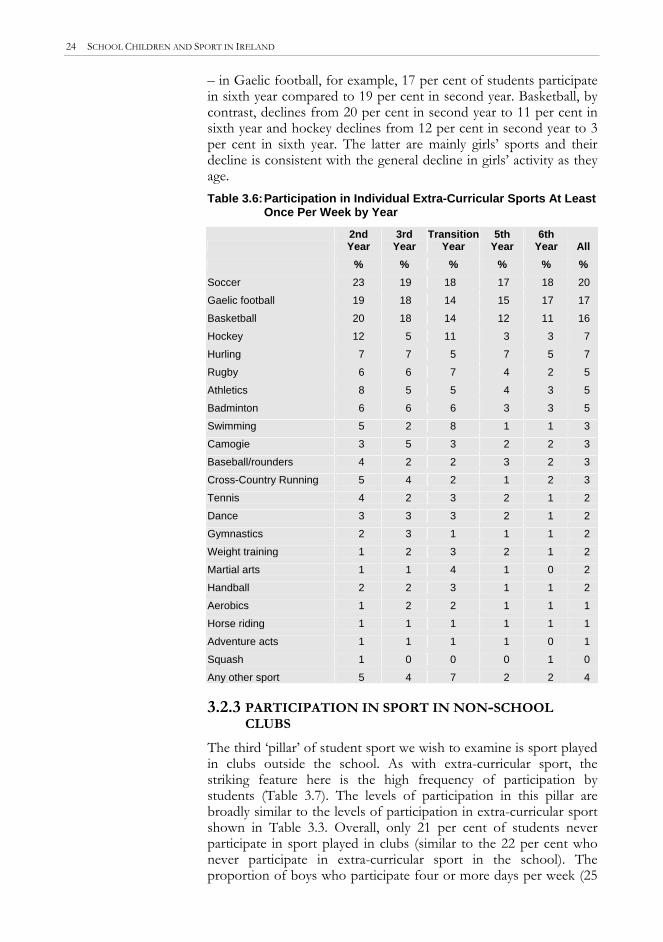
Table 3.6 shows that while the fall-off in participation in extra-curricular sport as we move up to second-level cycle occurs in all sports, it is less pronounced in some sports than others. Soccer, Gaelic football and hurling, in particular, show quite modest declines
24 SCHOOL CHILDREN AND SPORT IN IRELAND
– in Gaelic football, for example, 17 per cent of students participate in sixth year compared to 19 per cent in second year. Basketball, by contrast, declines from 20 per cent in second year to 11 per cent in sixth year and hockey declines from 12 per cent in second year to 3 per cent in sixth year. The latter are mainly girls’ sports and their decline is consistent with the general decline in girls’ activity as they age. Table 3.6: Participation in Individual Extra-Curricular Sports At Least
Once Per Week by Year
2nd Year
3rd Year
TransitionYear
5th Year
6th Year All
% % % % % % Soccer 23 19 18 17 18 20
Gaelic football 19 18 14 15 17 17
Basketball 20 18 14 12 11 16
Hockey 12 5 11 3 3 7
Hurling 7 7 5 7 5 7
Rugby 6 6 7 4 2 5
Athletics 8 5 5 4 3 5
Badminton 6 6 6 3 3 5
Swimming 5 2 8 1 1 3
Camogie 3 5 3 2 2 3
Baseball/rounders 4 2 2 3 2 3
Cross-Country Running 5 4 2 1 2 3
Tennis 4 2 3 2 1 2
Dance 3 3 3 2 1 2
Gymnastics 2 3 1 1 1 2
Weight training 1 2 3 2 1 2
Martial arts 1 1 4 1 0 2
Handball 2 2 3 1 1 2
Aerobics 1 2 2 1 1 1
Horse riding 1 1 1 1 1 1
Adventure acts 1 1 1 1 0 1
Squash 1 0 0 0 1 0
Any other sport 5 4 7 2 2 4
3.2.3 PARTICIPATION IN SPORT IN NON-SCHOOL CLUBS
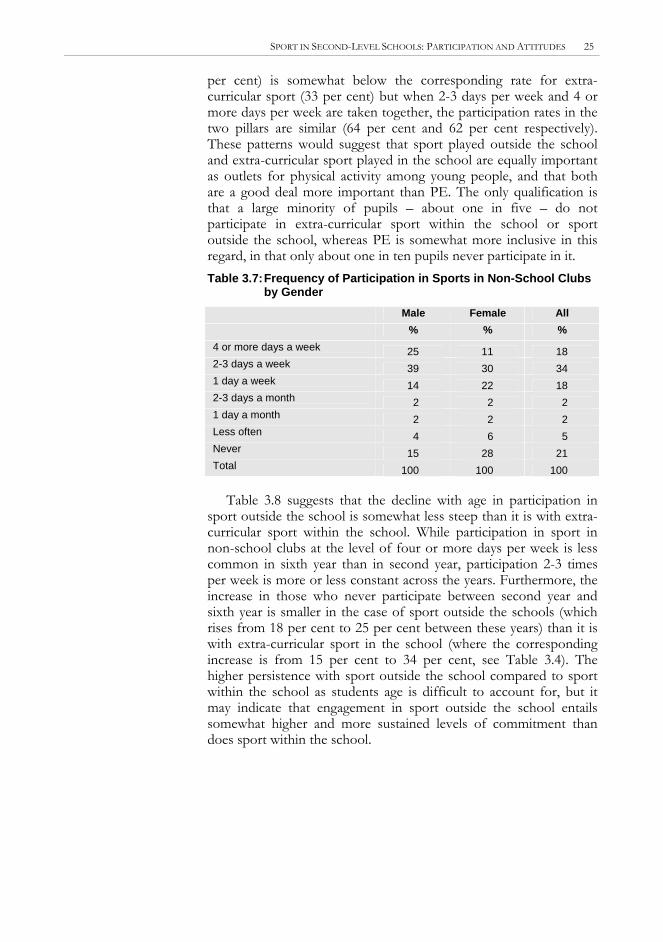
The third ‘pillar’ of student sport we wish to examine is sport played in clubs outside the school. As with extra-curricular sport, the striking feature here is the high frequency of participation by students (Table 3.7). The levels of participation in this pillar are broadly similar to the levels of participation in extra-curricular sport shown in Table 3.3. Overall, only 21 per cent of students never participate in sport played in clubs (similar to the 22 per cent who never participate in extra-curricular sport in the school). The proportion of boys who participate four or more days per week (25
SPORT IN SECOND-LEVEL SCHOOLS: PARTICIPATION AND ATTITUDES 25
per cent) is somewhat below the corresponding rate for extra-curricular sport (33 per cent) but when 2-3 days per week and 4 or more days per week are taken together, the participation rates in the two pillars are similar (64 per cent and 62 per cent respectively). These patterns would suggest that sport played outside the school and extra-curricular sport played in the school are equally important as outlets for physical activity among young people, and that both are a good deal more important than PE. The only qualification is that a large minority of pupils – about one in five – do not participate in extra-curricular sport within the school or sport outside the school, whereas PE is somewhat more inclusive in this regard, in that only about one in ten pupils never participate in it. Table 3.7: Frequency of Participation in Sports in Non-School Clubs
by Gender Male Female All % % %
4 or more days a week 25 11 18 2-3 days a week 39 30 34 1 day a week 14 22 18 2-3 days a month 2 2 2 1 day a month 2 2 2 Less often 4 6 5 Never 15 28 21 Total 100 100 100
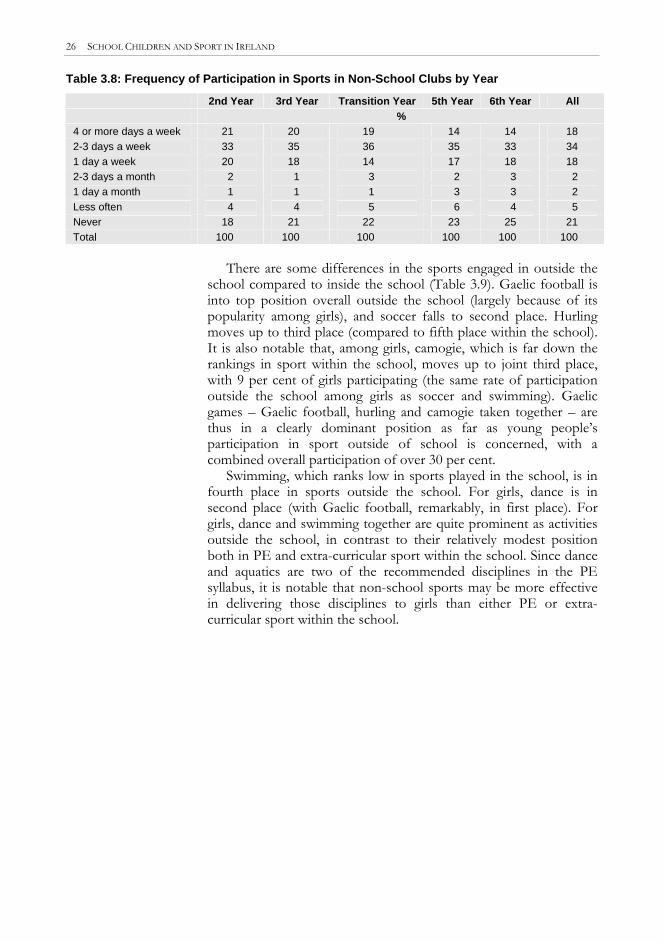
Table 3.8 suggests that the decline with age in participation in
sport outside the school is somewhat less steep than it is with extra-curricular sport within the school. While participation in sport in non-school clubs at the level of four or more days per week is less common in sixth year than in second year, participation 2-3 times per week is more or less constant across the years. Furthermore, the increase in those who never participate between second year and sixth year is smaller in the case of sport outside the schools (which rises from 18 per cent to 25 per cent between these years) than it is with extra-curricular sport in the school (where the corresponding increase is from 15 per cent to 34 per cent, see Table 3.4). The higher persistence with sport outside the school compared to sport within the school as students age is difficult to account for, but it may indicate that engagement in sport outside the school entails somewhat higher and more sustained levels of commitment than does sport within the school.
26 SCHOOL CHILDREN AND SPORT IN IRELAND
Table 3.8: Frequency of Participation in Sports in Non-School Clubs by Year
2nd Year 3rd Year Transition Year 5th Year 6th Year All %
4 or more days a week 21 20 19 14 14 18 2-3 days a week 33 35 36 35 33 34 1 day a week 20 18 14 17 18 18 2-3 days a month 2 1 3 2 3 2 1 day a month 1 1 1 3 3 2 Less often 4 4 5 6 4 5 Never 18 21 22 23 25 21 Total 100 100 100 100 100 100
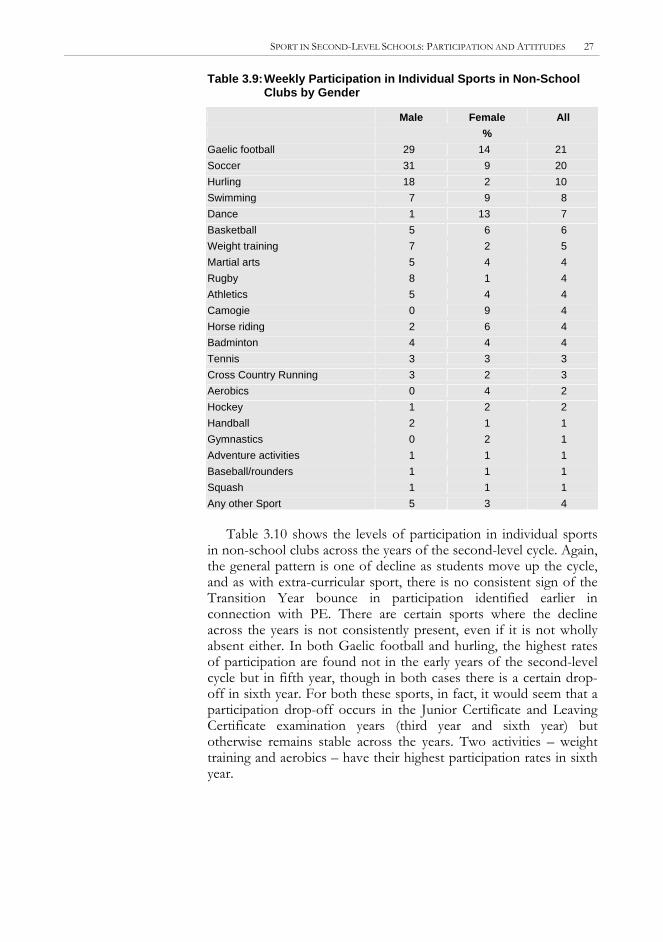
There are some differences in the sports engaged in outside the
school compared to inside the school (Table 3.9). Gaelic football is into top position overall outside the school (largely because of its popularity among girls), and soccer falls to second place. Hurling moves up to third place (compared to fifth place within the school). It is also notable that, among girls, camogie, which is far down the rankings in sport within the school, moves up to joint third place, with 9 per cent of girls participating (the same rate of participation outside the school among girls as soccer and swimming). Gaelic games – Gaelic football, hurling and camogie taken together – are thus in a clearly dominant position as far as young people’s participation in sport outside of school is concerned, with a combined overall participation of over 30 per cent.
Swimming, which ranks low in sports played in the school, is in fourth place in sports outside the school. For girls, dance is in second place (with Gaelic football, remarkably, in first place). For girls, dance and swimming together are quite prominent as activities outside the school, in contrast to their relatively modest position both in PE and extra-curricular sport within the school. Since dance and aquatics are two of the recommended disciplines in the PE syllabus, it is notable that non-school sports may be more effective in delivering those disciplines to girls than either PE or extra-curricular sport within the school.
SPORT IN SECOND-LEVEL SCHOOLS: PARTICIPATION AND ATTITUDES 27
Table 3.9: Weekly Participation in Individual Sports in Non-School Clubs by Gender
Table 3.10 shows the levels of participation in individual sports
in non-school clubs across the years of the second-level cycle. Again, the general pattern is one of decline as students move up the cycle, and as with extra-curricular sport, there is no consistent sign of the Transition Year bounce in participation identified earlier in connection with PE. There are certain sports where the decline across the years is not consistently present, even if it is not wholly absent either. In both Gaelic football and hurling, the highest rates of participation are found not in the early years of the second-level cycle but in fifth year, though in both cases there is a certain drop-off in sixth year. For both these sports, in fact, it would seem that a participation drop-off occurs in the Junior Certificate and Leaving Certificate examination years (third year and sixth year) but otherwise remains stable across the years. Two activities – weight training and aerobics – have their highest participation rates in sixth year.
28 SCHOOL CHILDREN AND SPORT IN IRELAND
Table 3.10: Weekly Participation in Individual Sports in Non-School Clubs by Year
3.2.4 PARTICIPATION IN NON-PE SPORT: COMPOSITE MEASURE
Up to now, we have examined sports participation in the three domains in isolation. However, it is clear that many students play sports in multiple contexts and it is instructive to examine a composite measure of sports participation. It is particularly useful from a policy point of view to obtain such a composite measure in relation to sports other than those engaged in as part of PE, since that will enable us to assess the relative importance of PE versus the other two pillars of children’s sport combined as a means to promote sport and physical activity among young people. To construct such a combined measure, we sum the responses to the questions on levels of participation in extra-curricular sport and sport in non-school clubs and group the summed scores into four categories, ‘4 or more days’, ‘2-3 days’, ‘1 day’, ‘less often’ and ‘never’.
The composite measure reveals that almost half (46 per cent) of students engage in non-PE sports four or more times a week, with a further 26 per cent engaging two to three times per week. In other words, over 70 per cent of students exceed a two session per week threshold of participation. This is roughly three times the proportion that exceed the same threshold through PE, where less than 25 per cent have two sessions per week or more (Table 3.1). With the composite measure, we also find that the polarisation noted earlier in regard to extra-curricular and non-school sport treated separately
SPORT IN SECOND-LEVEL SCHOOLS: PARTICIPATION AND ATTITUDES 29
(where, for each taken in isolation, over 20 per cent of students never participate at all) is reduced by half when we look at them both together: 10 per cent never participate under the composite measure. Significantly also, this is slightly below the 11 per cent who never participate in PE in school. In other words, non-PE sport not only gets students involved in physical activity far more frequently than does PE but also is just as effective in the goal of including all students in physical activity.
Table 3.11: Composite Measure* of Non-PE Sports Participation by Gender Male Female All % % %
4 or more days 60 31 46 2-3 days 23 31 26 1 day 7 16 11 Less often 4 8 6 Never 6 14 10 100 100 100
*Participation in extra-curricular sport in school and in non-school sport combined.
Table 3.12 shows that the decline in participation as students move up the second-level cycle that is found in the three pillars separately occurs in the composite measure also. However, it is notable how high the frequency of participation is even at the end of the cycle: 37 per cent of sixth year students participate 4 or more days per week according to the composite measure and a further 27 per cent participate two or three times a week. Some 16 per cent of sixth years never participate, which is well below the level of non-participation among sixth years found in each of the two components of the measure separately and in PE.
Table 3.12: Composite Measure* of Non-PE Sports Participation by Year 2nd Year 3rd Year Transition Year 5th Year 6th Year Total
% 4 or more days 53 49 46 40 37 46 2-3 days 26 25 28 28 27 26 1 day 11 11 12 11 12 11 Less often 4 6 4 8 8 6 Never 6 9 11 12 16 10
100 100 100 100 100 100 * Participation in extra-curricular sport in school and in non-school sport combined.
Given the focus of the present study on sport rather than physical activity in toto, detailed multi-dimensional measures of physical activity were not included. There was also a concern that, as the review of research in Chapter 1 indicated, existing methods for measuring physical activity levels in large-scale population studies are prone to serious measurement error. Nevertheless, in order to provide a broad context for the measures of sports participation contained in the study, it seemed worthwhile to attempt a global measure of physical exercise against which the measures of frequency of sports participation might be located.
3.3 Overall Exercise
Levels
The measure used for this purpose asked students to indicate the amount of time they spent at exercise on the average weekday, the average Saturday and the average Sunday, using a six-category
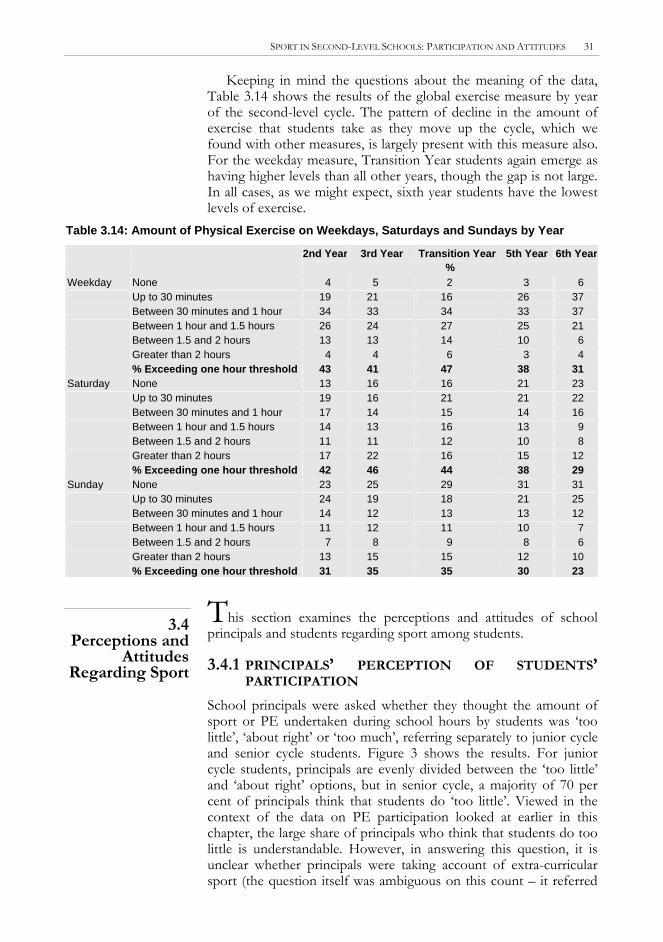
30 SCHOOL CHILDREN AND SPORT IN IRELAND
measure of time ranging from ‘none’ to ‘over two hours’ (see Table 3.13). No attempt was made to measure dimensions such as the intensity of exercise. Exercise was defined as any physical activity, whether work, sport, PE, that caused respondents to breathe more rapidly than normal. The minimum amount of moderate-to-vigorous physical activity now widely recommended for young people is 60 minutes per day on all, or most, days of the week. By aggregating the top three response categories in our measure of physical activity, we can obtain an indicator of the percentage of students who exceed this threshold.
The results of this measure are presented by gender in Table 3.13. This indicates relatively low levels of physical activity overall, especially among girls (we must keep in mind here that the data for weekdays refer to an average over five days, which might often entail a combination of some days with a lot of exercise and other days with little or even none). Averaged in this way, only 49 per cent of boys and 31 per cent of girls exceeded the one-hour exercise threshold per weekday, while 4 per cent of boys and 4 per cent of girls did no exercise at all on those days. Amounts of exercise on Saturdays indicate the pattern likely to occur on individual days, where the incidence of no exercise is a good deal higher. The data contain no indicators of intensity of activity, which is difficult to measure on Table 3.13: Amount of Physical Exercise on Weekdays, Saturdays
and Sundays by Gender
Male Female % %
Weekday (average per day) None 4 4
Up to 30 minutes 17 27 Between 30 minutes and 1 hour 31 37 Between 1 hour and 1.5 hours 28 21 Between 1.5 and 2 hours 15 8 Greater than 2 hours 6 2 % Exceeding one-hour threshold 49 31
Saturday None 15 20 Up to 30 minutes 18 22 Between 30 minutes and 1 hour 14 17 Between 1 hour and 1.5 hours 14 13 Between 1.5 and 2 hours 12 9 Greater than 2 hours 20 14 % Exceeding one-hour threshold 46 35
Sunday None 23 32 Up to 30 minutes 19 24 Between 30 minutes and 1 hour 13 13 Between 1 hour and 1.5 hours 12 9 Between 1.5 and 2 hours 10 6 Greater than 2 hours 16 9 % Exceeding one-hour threshold 38 23
SPORT IN SECOND-LEVEL SCHOOLS: PARTICIPATION AND ATTITUDES 31
Keeping in mind the questions about the meaning of the data, Table 3.14 shows the results of the global exercise measure by year of the second-level cycle. The pattern of decline in the amount of exercise that students take as they move up the cycle, which we found with other measures, is largely present with this measure also. For the weekday measure, Transition Year students again emerge as having higher levels than all other years, though the gap is not large. In all cases, as we might expect, sixth year students have the lowest levels of exercise.
Table 3.14: Amount of Physical Exercise on Weekdays, Saturdays and Sundays by Year
2nd Year 3rd Year Transition Year 5th Year 6th Year %
Weekday None 4 5 2 3 6 Up to 30 minutes 19 21 16 26 37 Between 30 minutes and 1 hour 34 33 34 33 37 Between 1 hour and 1.5 hours 26 24 27 25 21 Between 1.5 and 2 hours 13 13 14 10 6 Greater than 2 hours 4 4 6 3 4 % Exceeding one hour threshold 43 41 47 38 31
Saturday None 13 16 16 21 23 Up to 30 minutes 19 16 21 21 22 Between 30 minutes and 1 hour 17 14 15 14 16 Between 1 hour and 1.5 hours 14 13 16 13 9 Between 1.5 and 2 hours 11 11 12 10 8 Greater than 2 hours 17 22 16 15 12 % Exceeding one hour threshold 42 46 44 38 29
Sunday None 23 25 29 31 31 Up to 30 minutes 24 19 18 21 25 Between 30 minutes and 1 hour 14 12 13 13 12 Between 1 hour and 1.5 hours 11 12 11 10 7 Between 1.5 and 2 hours 7 8 9 8 6
Greater than 2 hours 13 15 15 12 10 % Exceeding one hour threshold 31 35 35 30 23
This section examines the perceptions and attitudes of school principals and students regarding sport among students. 3.4
Perceptions and Attitudes
Regarding Sport 3.4.1 PRINCIPALS’ PERCEPTION OF STUDENTS’ PARTICIPATION
School principals were asked whether they thought the amount of sport or PE undertaken during school hours by students was ‘too little’, ‘about right’ or ‘too much’, referring separately to junior cycle and senior cycle students. Figure 3 shows the results. For junior cycle students, principals are evenly divided between the ‘too little’ and ‘about right’ options, but in senior cycle, a majority of 70 per cent of principals think that students do ‘too little’. Viewed in the context of the data on PE participation looked at earlier in this chapter, the large share of principals who think that students do too little is understandable. However, in answering this question, it is unclear whether principals were taking account of extra-curricular sport (the question itself was ambiguous on this count – it referred
32 SCHOOL CHILDREN AND SPORT IN IRELAND
to ‘sport or PE undertaken during school hours’). It is quite unlikely that they were taking account of students’ participation in non-school sport. We have seen in previous sections that taking both extra-curricular and non-school sport into account, the frequency of participation by students seems quite high, with almost half of students having four or more sessions of sport per week and a further quarter having two or three sessions per week. In view of these reasonably high levels of participation, the views of the principals who think that students are not doing enough could be interpreted to refer particularly to PE, perhaps without much reflection on students’ overall level of sports participation.
Figure 3.1: Second-Level School Principals’ Perception of Adequacy of Student Sport or PE
0
10
20
30
40
50
60
70
80
Too little About right Too much
Junior
Senior
School principals who thought that students were doing too little were presented with a list of possible reasons why students might not do more sport or PE and were asked which they thought was the single most important reason. Figure 3.2 shows that, as has been found in previous research, the most common reason given is time pressure (reflecting the crowded nature of the second-level curriculum), an influence that was highlighted especially for senior cycle students. The second most common reason overall was lack of adequate facilities, though for senior cycle students, lack of interest was equally important.
SPORT IN SECOND-LEVEL SCHOOLS: PARTICIPATION AND ATTITUDES 33
Figure 3.2: School Principals’ Perceptions of Reasons Why Students Don’t Do More Sport/ PE (Base: Principals Who Think Students Do Too Little Sport or PE)
0 5
10 15 20 25 30 35 40 45
lack of interestamong
students
time pressuresfrom school
work
lack adequatesports/PEfacilities
teacher notavailable to do
sports/PE
other
Junior Senior
3.4.2 STUDENTS’ ATTITUDES TO SPORT
Students were asked two sets of items that tapped into their attitudes to sport. The first set, which asked for their responses to a set of statements about sport that were generally favourable in tone, is displayed in Table 3.15. The striking feature of the students’ attitudes revealed by these items is how positive they are. The vast majority of students indicate that they enjoy PE and sport; they think they are good at sport, their families encourage them to play sport, and they consider themselves as sporty types. A smaller majority agrees that that they enjoy sport only if they are doing well at it, but one-third disagree with this view. Attitudes are more divided in connection with playing when there is lots of pressure to win: half the students like to play under that circumstance but 43 per cent do not.
Table 3.15: Students’ Reponses to Positive Statements About Sport
Enjoy PE/Sport in School
Enjoy Sport in Leisure
Time Am
Good
Family Encourage
Me
Only Enjoy If Do
It Well
Sporty Type of Person
Like Pressure
to Win Not Answered 3 3 3 3 3 3 3
Agree strongly 57 57 38 48 33 41 29
Agree slightly 24 27 32 27 29 25 21
Disagree slightly 8 8 14 12 19 15 18 Disagree
strongly 5 3 8 6 14 14 25
Don’t know 4 2 5 4 3 3 5
Total 100 100 100 100 100 100 100 Note: Full statements – ‘I enjoy PE and sport in school’; ‘I enjoy doing sport and exercise in my leisure time’; ‘I am
good at sport and exercise’; ‘My family encourages me to do sport and exercise’; ‘I only enjoy sport and exercise if I do it well; ‘I am a sporty type of person’; ‘I like participating in sport where there is lots of pressure to win’.
34 SCHOOL CHILDREN AND SPORT IN IRELAND
Table 3.16 shows the same items differentiated by gender. The results here show that girls and boys differ in their attitudes, but in most cases only as a matter of degree rather than of underlying direction. Where girls are quite positive about sport, boys are overwhelmingly so. For example, 66 per cent of boys ‘strongly agree’ that they enjoy both sport and PE, compared to 47 per cent of girls. The one item on which there is a real difference of direction in attitudes between girls and boys is in relation to playing sport when there is pressure to win: almost two-thirds of boys agreed that they liked to play under that circumstance but only one-third of girls did so.
Table 3.16: Students’ Reponses to Positive Statements About Sport by Gender Enjoy PE/Sport in School Enjoy Sport in Leisure
Note: For full statement of items, see Note, Table 3.15. A second set of attitudinal items examined students’ feelings
about a number of possibly negative aspects of sport (Table 3.17). The majority of students were not particularly bothered by most of these items, though substantial minorities had problems with most of them. For example, 29 per cent minded getting hot, sweaty or dirty either ‘a lot’ or ‘a bit’ and 38 per cent had similar attitudes to playing sport in bad weather. The one aspect of sport that a majority
SPORT IN SECOND-LEVEL SCHOOLS: PARTICIPATION AND ATTITUDES 35
of students did not like was ‘If you get left out because you are not good enough’: one-third of students minded this a lot and a further quarter minded it a bit. Thus, the risk of feeling excluded in sport stands out as a widespread negative concern in what otherwise is a generally positive picture.
Table 3.17: Students’ Attitudes Towards Possible Negative Aspects of Sport
Hot,
Sweaty Bad
Weather Shower
Afterwards Being
Hit Playing with
Opposite SexNot as Good
Being Left Out
Missing 3 3 4 4 6 4 4 I mind a lot 11 16 5 12 4 9 35 I mind a bit 18 22 7 18 8 27 24 I don’t mind much 24 23 18 24 17 28 10 I don’t mind at all 44 34 63 39 62 26 9 It doesn’t happen
to me 1 1 3 3 4 5 18 Total 100 100 100 100 100 100 100
Note: Question: Here is a list of things that can sometimes put people off doing sports. How much do you mind about each of these? Getting hot, sweaty or dirty; Going outside for sport in bad weather; Having to wash or shower after sports; Being hit, kicked or falling over during sport; Playing sports with members of opposite sex; If you are not as good as the others who are playing; If you get left out because you are not good enough.
Table 3.18: Students’ Attitudes Towards Possible Negative Aspects of Sport by Gender Bad Weather Shower Being Hit, Knocked or
Falling Male Female Male Female Male Female
Not answered 4 2 4 2 4 3 I mind a lot 7 26 5 6 7 18 I mind a bit 16 28 6 9 14 23 I don’t mind much 26 21 18 19 24 25 I don’t mind at all 46 22 65 61 48 29 It doesn’t happen to me 1 1 3 3 3 2 Total 100 100 100 100 100 100
Not as Good as Others
Getting Left Out Playing with the Opposite Sex
Male Female Male Female Male Female Not answered 5 3 4 2 6 5 I mind a lot 7 12 31 41 3 4 I mind a bit 22 33 22 27 7 8 I don’t mind much 28 30 10 11 15 19 I don’t mind at all 31 21 10 7 64 60 It doesn’t happen to me 8 2 24 13 5 3 Total 100 100 100 100 100 100 Getting Hot, Sweaty or
Dirty
Male Female Missing 3 1 I mind a lot 4 18 I mind a bit 10 26 I don’t mind much 21 27 I don’t mind at all 59 27 It doesn’t happen to me 2 1 Total 100 100
Note: For full question, see Note, Table 3.17.
36 SCHOOL CHILDREN AND SPORT IN IRELAND
Table 3.18 examines the same attitudes classified by gender. Here, it is apparent that girls are much more bothered about the possible negative aspects of sport than are boys: for example, 54 per cent of girls mind playing in bad weather either a lot or a little, compared to 23 per cent of boys, and 41 per cent of girls mind being hit, knocked or falling over during sport, compared to 21 per cent of boys. A majority of both girls and boys dislike the risk of getting left out, but this majority is bigger among girls (68 per cent) than among boys (53 per cent), while 24 per cent of boys say this never happens to them, compared to 13 per cent of girls. This chapter has examined participation among second-level students in the three pillars of children’s sport – physical education in schools, extra-curricular sport in schools and sport in non-school clubs. Students were found to be receiving less PE than is recommended in the PE syllabuses for second level. The average was 69 minutes of PE per student per week, compared to the recommended two hours per week. Transition Year students, who received an average of 110 minutes of PE per week, were the only ones to come close the recommended level. Boys got slightly more PE than girls, and students in the earlier years of the second-level cycle got more than those in the later years. The mix of activities delivered in PE did not match the broad range recommended in the PE syllabus: those activities were heavily comprised of a small range of team sports such as soccer, basketball and Gaelic games for boys, and basketball, soccer, badminton and hockey for girls. Core activities recommended in the PE syllabus, such as dance, swimming, gymnastics and adventure activities, were taken by less than one in five students in PE classes.
3.5 Conclusions
Although the amount of PE received by second-level students was relatively small, this is not to say that they received little structured sport or physical exercise. They took part much more frequently in extra-curricular sport in schools and in sport outside the school than they did in PE. It was these two pillars, rather than PE, that provided the main contexts for their organised recreational physical activity. The frequency of participation in the two pillars reported by the students was quite high: taking both together, almost half of the students (46 per cent) took part four times or more per week, and a further quarter (26 per cent) took part two or three times per week. The kinds of sports and activities they undertook in extra-curricular sport and non-school sport showed a broadly similar concentration on a limited range of team sports to that found in PE, though with some differences of detail.
It is not possible to say with any confidence from the data how many students are getting the minimum of 60 minutes of moderate-to-vigorous physical activity that is now widely accepted as an international minimum standard. The intensity of physical activity is important but is difficult to measure, so that the frequency data we have here tell only part of the story. It does seem likely that many students are partaking in sufficient sport, especially boys and those in
SPORT IN SECOND-LEVEL SCHOOLS: PARTICIPATION AND ATTITUDES 37
the earlier years of the second-level cycle. But sport does not necessarily equate with sustained moderate-to-vigorous physical activity and is not the only possible source of such activity. There are also minorities of students who take part in little sport. So the question of the adequacy of students’ level of physical activity remains open until the research community finds ways of resolving the measurement difficulties that hamper research in this field.
In the view of school principals who think that students’ levels of sport and PE is too low, the main obstacles to raising those levels are pressure of time from school work, especially at senior cycle, and inadequate facilities. Students’ own attitudes to sport and PE are strongly positive. Of the possible negative aspects of sport investigated here, the only one to cause widespread concern among students was the fear of being left out because they were not good enough.
A persistent pattern running through the findings is gender difference: boys and girls behave differently and feel differently when it comes to sport. Boys spend more time at sport, enjoy it more, and are more enthusiastic about its rough and tumble aspects. Of course, some girls enjoy sport and are competitive about it, and some boys avoid or dislike sport, but in the overall there is a considerable gulf between the way boys and girls approach sport. A further recurrent theme is the decline in sports participation as students move up through the second-level cycle, though in some respects Transition Year (which comes in the fourth year of the cycle) temporarily reverses this downward movement. A previous report (Fahey et al., 2004) has shown that the decline with age continues through adult life, and eventually leads to high levels of inactivity in later years. It therefore is a fundamental concern for people’s long-term well-being.
38
4. SPORT IN SECOND-LEVEL SCHOOLS: RESOURCES AND INFLUENCES
This chapter continues the examination of sport in second-level schools, shifting the focus to a range of factors likely to influence students’ participation in PE and sport within the school. These factors include the resources and facilities available to schools for sport, the sports ethos of the schools and a range of other factors relevant to students’ physical activity including mode of travel to school, TV viewing, homework and certain household characteristics. Multivariate analysis is then used to assess the effects of these factors on students’ levels and patterns of participation in PE and sport.
4.1 Introduction
4.2.1 PUPIL TEACHER RATIOS AND TEACHERS
INVOLVED IN SPORT 4.2
Resources, Facilities and
Sports Culture in the School
The first two pillars of children’s sport analysed in the previous chapter, namely PE and extra-curricular sport in the school, require teacher support. This highlights the importance of teachers’ availability, commitment and skills as influences on the place of PE and sport in the life of the school and thus on the physical education and sporting development of young people. These are complex issues, which cannot be addressed within the limited scope of this study, but it is important to keep in mind that the teacher’s perspective is a crucial issue for children’s sport in schools and is one that needs to be better understood.
The survey of principals in second-level schools asked principals how many teachers they had in their school, how many of these were involved in sport and PE, and whether they had any teachers with formal PE qualifications. Amongst the schools 77 per cent said they had at least one teacher with a PE qualification, and about half of these said they had two (or, in a very small number of cases, three) such teachers.
SPORT IN SECOND-LEVEL SCHOOLS: RESOURCES AND INFLUENCES 39
Table 4.1 shows the data relating to the numbers of all teachers and teachers available for sport in the schools. The latter averaged seven teachers per school, which was about one-fifth of the average full complement of teachers, including part-time teachers. In general, non-PE teachers involved in sport outnumbered trained PE teachers by about five- or six-fold, though measured in terms of time input, the PE teacher would be likely to play a larger role than these comparisons would suggest. Nevertheless, it is clear that non-PE teachers are a major foundation for the provision of sport to children in second-level schools. The overall pupil/teacher ratio (including part time-teachers) was on average 12 students per teacher, while there were 93 students per teacher involved in sport. However, there was a wide range of variation around these averages, indicating that some schools were much better supplied with teacher support for sport than others and the worst-off schools in this regard would be likely to have problems with teacher availability for sport. Table 4.1: Availability of Teachers and Teachers Involved in Sports
in Second-Level School Sample (n=80 schools)
Maximum Mean Minimum
Number of full time teachers per school 72 30 4 Number of part time teachers per school 20 6 0 Total number of teachers per school 80 36 8 Number of teachers involved in sport per
school 30 7 1
Number of students per school 886 430 24 Students per teacher (including part-time
teachers) 16 12 3
Students per teacher involved in sport 428 93 12
4.2.2 AVAILABILITY OF DIFFERENT SPORTS ON THE SCHOOL TIMETABLE
The amount and type of PE received by second-level students was examined in the previous chapter. The extent to which different sports are available on the junior and senior cycle PE syllabus is a factor likely to influence what students do in PE and so is important to examine. The results from the previous chapter indicate that team-based competitive sports dominated students’ actual take-up. The question is whether the broader range of activities recommended in the PE syllabus (such as dance, gymnastics and aquatics) is provided and is widely ignored by students or simply is not available.
Junior Cycle
The availability of different sports in timetabled PE classes in Junior Cycle is displayed in Table 4.2. As can be seen, sports are offered predominantly on an optional rather than a compulsory basis. They consist mainly of traditional team and field sports, with the most common being basketball (available in 68 per cent of schools), Gaelic football (62 per cent), soccer (54 per cent), athletics (41 per
40 SCHOOL CHILDREN AND SPORT IN IRELAND
cent) and cross-country running (54 per cent). Many of the broader activities recommended in the PE syllabus are not offered by the majority of schools. For example, gymnastics is not available in 75 per cent of schools at junior cycle level, and aerobics is not available in 80 per cent of schools at junior cycle level. Table 4.2: Availability of Given Sports on Junior Cycle Timetable
A similar picture emerges for senior cycle (Table 4.3). Once again, traditional field and team sports dominate, while activities such as gymnastics, swimming and dance are not offered in the majority of schools.
SPORT IN SECOND-LEVEL SCHOOLS: RESOURCES AND INFLUENCES 41
Table 4.3: Availability of Given Sports on Senior Cycle Timetable
Both the school principals and students were asked to rate the overall adequacy of the facilities available for sport in their schools. The responses from the students were in general reasonably positive (Figure 4.1): over 20 per cent described the facilities as being ‘very adequate’, and only 20 per cent described them as ‘not at all adequate’. The principals were more negative: almost half (46 per cent) said they were ‘not at all adequate’ while only 8 per cent said they were very adequate. In response to a further question about a need for investment in facilities, 68 per cent of school principals said that their school required major sports investment and 28 per cent said that their school needed minor sports investment.
42 SCHOOL CHILDREN AND SPORT IN IRELAND
Figure 4.1: Perception of Adequacy of Sports Facilities Among Students and Principals in Second-level schools
0
10
20
30
40
50
very adequate fairlyadequate
not at alladequate
not sure/dontknow
Students Principals
School principals were also asked what facilities their school had
or could access off-site when required (Figure 4.2). Looking first at overall access, whether on-site or off-site, basketball courts and GAA pitches were the most widely available facilities, with 87 per cent having access to a basketball court and 87 per cent to a GAA pitch. Swimming pools were available to 63 per cent of schools, but in this case, nearly all availability was off-site – only 3 per cent of the schools had their own pool. A quarter of schools lacked access to a multi-purpose indoor floor. Looking back to the sports made available to students in PE as set out in Tables 4.2 and 4.3 above, it is notable that some sports for which schools had facilities, or had access to off-site facilities, were not widely offered to students on the PE timetable. For example, 64 per cent of schools did not offer tennis on the PE timetable for junior cycle (Table 4.2), but Figure 4.2 shows that 69 per cent of schools had access to tennis courts and almost half (47 per cent) had tennis courts on-site. Three-quarters of schools did not offer swimming, but 63 per cent had access to a swimming pool. In these instances, it is likely that the facilities were used as resources for extra-curricular activity rather than PE.
Generally speaking, off-site facilities are an important contributor to overall access to facilities for schools, as can be seen in Figure 4.2 from the way that on- and off-site facilities together outstrip on-site facilities on their own. In many instances, off-site facilities are publicly owned, as in the case of local authority playing pitches and swimming pools. But in many cases also, local clubs make their facilities available to schools. This is part of the general support that local clubs often provide to sport in schools. To examine this issue further, school principals were asked how much help they got from local clubs in providing their students with sport. Figure 4.3 shows that a large majority of the principals felt that they got such help – 15 per cent received a lot of help and 64 per cent received some help.
SPORT IN SECOND-LEVEL SCHOOLS: RESOURCES AND INFLUENCES 43
Figure 4.2: Percentage of Second-level Schools with Access to Facilities for Various Sports
0
20
40
60
80
100
Baske
tball
GAA Pitc
h
Indoo
r Floo
rs
Gymna
stics
equip
ment
Socce
r Pitc
h
Tennis
Cou
rt
Swimming
pool
Fitnes
s Equ
ipmen
t
Runnin
g Trac
k
Rugby
Pitc
h
Hand/r
acke
tball c
ourt
Hocke
y Pitc
h
Squas
h Cou
rt
On or off siteOn site
Figure 4.3. Second-Level School Principals’ Perceptions of How Much Help They Receive from Local Sports Clubs
15
64
21
01020304050607080
A lot of help A little help No help
The figures looked at so far mask a considerable heterogeneity in
the level of facilities available to second-level schools. To examine this, we constructed a simple index, which sums the level of facilities available using the above 13 categories. The maximum score on the index is 13 and the minimum is 0. The mean score on this index was 7.5, indicating that the average school had access to just over half of the thirteen types of facilities listed, either on-site or off-site. Four of the schools surveyed had access to only two of the facilities listed and six of the schools having access to all thirteen.
44 SCHOOL CHILDREN AND SPORT IN IRELAND
4.2.4 SPORTS ETHOS AND PARTICIPATION IN INTER-SCHOOL COMPETITION
Various data examined so far give an indication of the large role sport plays in Irish second-level schools. We can examine this issue further by means of a question posed to school principals that asked them how important sport was in the ethos of their schools. As 4.4 shows, their responses show a high level of importance attached to sport: 71 per cent described it as ‘very important’, 29 per cent as ‘fairly important’, and none thought that it was not important. Figure 4.4: School Principals’ Rating of the Importance of Sport in
the Ethos of the School
71
29
00
102030405060708090
Very important Fairly important Not important
A more direct measure of the importance of sports in schools is
the extent to which schools participate in inter-school competitions, an activity that is often an important focus of extra-curricular sport. Figure 4.5 shows the percentages of schools that take part in inter-school competitions in each sport. Many of the same range of sports that have been prominent in previous sections reappear here – Gaelic football, basketball, cross country running, athletics, soccer, hurling and camogie. The prevalence of GAA sports is notable. Over 75 per cent of second-level schools take part in Gaelic football competitions, with 45 per cent in hurling and 35 per cent in camogie. Basketball is also very prominent, with over 70 per cent taking part in basketball competitions. Soccer is somewhat less common, with 58 per cent of schools involved in inter-school competition, and rugby has 28 per cent involved in competitions. Inter-school competition is not, however, restricted to the dominant team events. Almost 70 per cent of schools take part in inter-school competitions in athletics and cross-country running.
SPORT IN SECOND-LEVEL SCHOOLS: RESOURCES AND INFLUENCES 45
Figure 4.5: Percentage of Second-level Schools Taking Part in Inter-Schools Competitions by Sport
01020304050607080
Gae
lic F
ootb
all
Bask
etba
ll
Cro
ss C
ount
ry R
unn
ing
Ath
letic
sS
occe
rH
urlin
gC
amog
ieH
orse
Rid
ing
Bad
min
ton
Rug
bySw
imm
i ng
Hoc
key
Tenn
isH
andb
all
Adve
ntur
e A
ctiv
ityG
ymna
stic
sBa
seba
ll/R
ound
ers
Mar
tial A
rts
Squ
ash
Dan
ceA
erob
i cs
Wei
ght T
rain
ing
%
In the previous section we examined aspects of the school environment likely to affect students’ sports participation such as the level of facilities, the availability of teachers and the sports ethos of the school. As well as these factors, sports participation is likely to be affected by other competing demand on students’ time. In this section, we examine the amount of time spent on television viewing and homework both during the week and on weekends and on participation in other non-sport extra-curricular activities such as dance classes and music lessons. We also examine how this varies both by gender and over the course of the school cycle.
4.3 Travel to School and Other Time
Uses
4.3.1 TRAVEL TO SCHOOL
As displayed in Table 4.5, the majority of second-level school pupils travel to school by either bus or car. Amongst second-level school pupils 27 per cent walk to school, while only 3 per cent cycle. Table 4.5: Mode of Travel to School
Frequency Per Cent Missing 38 1
Walk 967 27
Cycle 124 3
By car 1124 32
By bus 1252 35
Other 53 1
Total 3,558 100
46 SCHOOL CHILDREN AND SPORT IN IRELAND
The majority of those who walk or cycle do so for a quarter of an hour or less (76 per cent in the case of walking, 89 per cent in the case of cycling). Thus, at present, the journey to school is not a major source of physical activity for second-level pupils. Table 4.6: Time Taken to Travel to School
Frequency Per Cent Missing 44 1
Around 5 minutes 1,049 29
Around quarter of an hour 1,270 36
Around half an hour 741 21
Around three-quarters of an hour 276 8
Around an hour 96 3
More than an hour 38 1
Don’t know 44 1
Total 3,558 100
4.3.2 TELEVISION VIEWING
Television viewing is also important to consider as a major competitor for the leisure time of second-level pupils. Table 4.7 shows frequency of weekday television viewing among second-level pupils classified by year in the school cycle. The key pattern here is that television viewing remains relatively constant over the school cycle, with the exception of a certain increase in Transition Year, where more students are in the two to three hours per day category and fewer in the one hour per day category than in other years. There is also a decline among girls in the numbers who watch large amounts of television as they progress through the school cycle: 13 per cent of second year girls watch at least four hours of television per weekday, falling to 8 per cent in fifth year and 6 per cent in sixth year.
Table 4.7: Weekday Television Viewing by Gender and Year
SPORT IN SECOND-LEVEL SCHOOLS: RESOURCES AND INFLUENCES 47
Table 4.8 provides the corresponding picture for television viewing at the weekend. Almost one-third of both boys and girls in second-level schools watch more than four hours of television a day over the weekends. Again, a notable pattern here is the constancy of this pattern across the years of the school cycle: there is no decline in television viewing as examination pressures increase in the later years of the cycle, in contrast to what we found with all the other student activities we have looked at in this study in previous sections.
Table 4.8: Weekend Television Viewing by Gender and Year
Table 4.9 shows the amount of time spent doing homework per day on weekdays classified by gender and year in the school cycle. As can be seen, homework increases markedly over the school cycle, though with a sharp dip in Transition Year. Among boys, for example, 35 per cent of sixth years do three or more hours of homework a day, compared to 13 per cent of second year boys and 3 per cent of Transition Year boys. It is clear also that girls study more than boys: taking the whole sample of girls, 30 per cent study three hours a day or more, compared to 17 per cent of boys. Table 4.10 looks at homework over the weekend and finds similar patterns, both over the years of the school cycle and between boys and girls. In Transition Year, over half of both boys and girls say that they do no homework over the weekends.
48 SCHOOL CHILDREN AND SPORT IN IRELAND
Table 4.9: Time Spent on Homework per Day on Weekdays by Age and Gender 2nd Year 3rd Year Transition
Year 5th Year 6th Year Total
Boys Not Answered 4 3 1 0 2 2 None at all 8 10 40 14 9 14 About 1 hour a day 46 30 48 39 28 39 About 2 hours a day 29 34 8 27 27 27 About 3 hours a day 9 16 2 14 21 12 About 4 hours a day 2 4 4 10 3 About 5 hours a day 1 1 1 0 3 1 About 6 hours a day 0 1 0 0 About 7 or more daily 1 1 1 1 1 100 100 100 100 100 100 % above 3 hours
per day
13
23
3
19
35
17 Girls Not Answered 1 3 1 1 1 2
None at all 5 5 29 4 3 8 About 1 hour a day 36 22 53 27 9 30 About 2 hours a day 39 31 10 34 25 30 About 3 hours a day 14 29 6 24 36 21 About 4 hours a day 3 7 1 9 18 7 About 5 hours a day 1 3 2 5 2 About 6 hours a day 0 1 0 1 0 About 7 or more daily 0 0 0 1 1 0 100 100 100 100 100 100 % above 3 hours
per day
18
40
7
36
61
30
Table 4.10: Time Spent on Homework on Weekends by Year and Gender
2nd Year 3rd Year Transition Year
5th Year 6th Year Total
Boys Not Answered 10 6 3 4 5 6 None at all 27 23 56 28 27 30 About 1 hour a day 37 32 31 32 19 32 About 2 hours a day 16 18 7 18 21 16 About 3 hours a day 6 11 2 11 13 9 About 4 hours a day 2 6 0 3 11 4 About 5 hours a day 1 3 2 2 2 About 6 hours a day 1 1 1 1 2 1 About 7 or more daily 1 1 1 1 1 100 100 100 100 100 100 % above 3 hours 11 22 3 18 29 17
Girls Not Answered 3 4 3 3 3 3 None at all 20 19 55 17 9 23 About 1 hour a day 38 24 24 28 21 28 About 2 hours a day 22 19 11 16 18 18 About 3 hours a day 11 16 4 18 20 14 About 4 hours a day 4 9 3 12 13 8 About 5 hours a day 1 4 1 3 8 3 About 6 hours a day 0 2 3 5 2 About 7 or more daily 0 2 2 3 1 100 100 100 100 100 100 % above 3 hours 16 33 8 38 49 28
SPORT IN SECOND-LEVEL SCHOOLS: RESOURCES AND INFLUENCES 49
4.3.4 TIME SPENT ON OTHER ACTIVITIES
Table 4.11 shows the time students spend in other extra-curricular activities such as music, singing and drama classes, classified by gender and year in the school cycle. As can be seen, girls spend more time on these activities than boys throughout the school cycle, with almost 50 per cent of girls spending at least some time on these activities compared to 23 per cent of boys. However, girls’ participation declines over the course of the school cycle with 66 per cent of girls in sixth year spending no time on these activities compared to 45 per cent in second year.
Table 4.11: Time Spent on Music/Singing/Drama Classes by Gender and Year
2nd Year
3rd Year
Transition Year
5th Year
6th Year
All
% Boys Not Answered 5 4 1 2 3 3 I don’t attend any such classes 72 77 63 80 78 74 About 0-2 hours per week 14 10 19 6 6 11 About 3-4 hours per week 4 3 8 6 2 5 About 5 or more hours per week 6 6 9 7 11 7 100 100 100 100 100 100 Girls Not Answered 3 3 1 1 2 2 I don’t attend any such classes 45 53 33 57 66 50 About 0-2 hours per week 28 22 34 24 17 26 About 3-4 hours per week 13 12 19 8 9 12 About 5 or more hours per week 11 10 13 10 7 10 100 100 100 100 100 100
These patterns can be compared with figures for sports
participation and television viewing. Taken together, the measures indicate that students begin to prioritise homework more as they progress through the school cycle, but that they afford television a relatively constant level of attention. As homework increases, students appear to cut back on participation both in sport and other extra-curricular activities. This pattern is particularly marked for girls whose rates of decline in both sports participation and other activities are higher than for boys and whose time spent in homework increases more sharply than for boys.
In the previous chapter and previous sections of this chapter, we
examined a number of aspects of sports participation in second-level schools and a number of contextual features likely to influence sports participation. In this section, we examine the extent to which different contextual and background factors are linked to students’ participation in sport and exercise, looking first at extra-curricular sport in the school and sport in non-school clubs and then at PE. We analyse these issues using multiple regression methods, which allow us to assess the independent effect of different factors, holding other factors constant, and to assess the relative effect of different
4.4 Multiple
Regression Models of
Pupils Level of Sporting
Participation
50 SCHOOL CHILDREN AND SPORT IN IRELAND
factors on sports participation. We begin with individual models focusing on the characteristics of the pupils and their parents and then extend the models to examine the effects of school characteristics.
4.4.1 INDIVIDUAL LEVEL MODELS OF THE DETERMINANTS OF PARTICIPATION
Table 4.12 displays the results of an ordered logit regression model examining the determinants of the number of times per week that students participate in (i) extra-curricular sport in the school and (ii) sports with non-school sports clubs. The multivariate findings confirm our earlier analysis that boys participate in substantially higher levels of sport and that sporting participation declines over the course of the school cycle. Controlling for other factors, the effect of either the mother or father being in a professional as opposed to other occupation is not statistically significant. However, both mothers’ and fathers’ sports participation has a substantial effect on the students’ level of sports participation with a club, and fathers’ sports participation has a statistically significant effect on extra-curricular participation in the school. This suggests that students are more likely to be keen on sport if their parents, and especially their fathers, are keen on sport. In terms of other time use factors, the number of hours spent doing homework either on weekdays or at weekends does not have a statistically significant effect on the frequency of participation in either the school or club. This would suggest that those who drop out of sport as they move up the second-level cycle are not necessarily responding to rising examination pressures since they do not necessarily increase their study time in keeping with the decline in the time they spend at sport. Time spent watching television is remarkably constant over all years of the second-level cycle and thus seems impervious to increasing time spent at homework. It has a significant negative effect on sports participation with a club, and weekday television viewing has a negative effect on participation in extra-curricular sports in the school. Interestingly, other extra-curricular activities appear to complement rather than compete with sports participation: hours spent at singing and other classes are positively associated with the level of sports participation with a club.
SPORT IN SECOND-LEVEL SCHOOLS: RESOURCES AND INFLUENCES 51
Table 4.12: Ordered Logit Regressions of the Determinants of Participation in Club and Extra-Curricular School Sports
Frequency of Participation in Extra-Curricular Sport
Frequency of Participation in Non-School Sport
Estimate Std. Error Estimate Std. Error Coefficient Year at School -0.18*** 0.03 -0.10*** 0.03
Hours of Weekday Homework -0.03 0.04 -0.01 0.04 Hours of Weekend Homework 0.01 0.03 0.01 0.03 Hours Spent Other Classes e.g. Singing/Dancing
-0.06 0.04 0.11*** 0.04
Hours of Weekday Television -0.17*** 0.05 -0.09* 0.05 Hours of Weekend Television 0.03 0.05 -0.17*** 0.05 Male 0.90*** 0.08 0.95*** 0.08 Mother Participates in Sport 0.13 0.08 0.22*** 0.08 Father Participates in Sport 0.24*** 0.08 0.31*** 0.08 Town (As Opposed to Country) -0.18* 0.10 -0.15* 0.10 City (As Opposed to Country) -0.21** 0.09 -0.12 0.09 Father Professional 0.13 0.10 0.06 0.10 Mother Professional -0.01 0.09 0.01 0.09 Threshold [Q10 = 1] -2.21 0.25 -2.19 0.25 [Q10 = 2] -1.93 0.25 -1.87 0.25 [Q10 = 3] -1.85 0.25 -1.78 0.25 [Q10 = 4] -1.78 0.25 -1.68 0.25 [Q10 = 5] -0.97 0.25 -0.88 0.25 [Q10 = 6] 0.48 0.24 0.86 0.25 * Significant at 10 per cent level. ** Significant at 5 per cent level. *** Significant at 1 per cent level.
4.4.2 DO DIFFERENCES IN SCHOOL FACILITIES AND STRUCTURES MATTER?
We now extend the individual models by including three measures of school resources for sport: the pupil-teacher ratio, the level of sports facilities available to the school, and the gender composition of the teaching staff (percentage of teachers who are male). The results suggest that facilities of themselves do not affect participation in either extra-curricular school sport or, less surprisingly, club sport. We should note that the measure of facilities used here relates simply to quantity, without any reference to quality or to inconvenience of access such as might arise in the case of off-site facilities. The latter aspects of facilities may have effects on participation in school sport that are not captured by our measures. The pupil-teacher ratio does have a statistically significant effect on participation in extra-curricular sport – the worse the pupil-teacher ratio, the lower the participation in extra-curricular sport – but the gender composition of the teaching staff does not have a statistically significant effect. As can be seen from the coefficients for the other variables, the results of these models confirm the effects of gender, stage in the school cycle and parental participation on frequency of participation in extra-curricular sport.
52 SCHOOL CHILDREN AND SPORT IN IRELAND
Table 4.13: Ordered Logit Regressions of the Determinants of Participation in Club and Extra-Curricular School Sports Incorporating School Effects
Frequency of Participation in Extra-Curricular Sport
Frequency of Participation in Non-School Sport
Variable Estimate Standard Error
Estimate Standard Error
Year in School -0.20*** 0.03 -0.08*** 0.03 Hours of Homework Weekdays -0.03 0.05 -0.07 0.05 Hours of Homework Weekends 0.02 0.04 0.01 0.04 Hours Spent Other Classes e.g.
Singing/Dancing -0.03 0.05 0.14 0.05 Hours of Weekday Television -0.20*** 0.07 -0.16*** 0.07 Hours of Weekend Television 0.01 0.06 -0.15*** 0.06 Percentage of Teachers Male -0.01 0.00 0.00 0.00 Pupil Teacher Ratio -0.07*** 0.02 0.03 0.02 Number of Facilities Available -0.03 0.02 -0.02 0.02 Male 1.11*** 0.12 0.93*** 0.12 Mother Participates in Sport 0.13 0.10 0.18** 0.10 Father Participates in Sport 0.29*** 0.10 0.38*** 0.10 Town (As Opposed to Country) -0.03 0.13 0.12 0.13 City (As Opposed to Country) -0.08 0.11 -0.01 0.11 Father Professional 0.23 0.13 0.13 0.13 Mother Professional -0.02 0.11 -0.04 0.11 Threshold [PQ10 = 1] -3.48 0.45 -2.05 0.44 [PQ10 = 2] -3.22 0.44 -1.71 0.44 [PQ10 = 3] -3.15 0.44 -1.62 0.44 [PQ10 = 4] -3.07 0.44 -1.53 0.44 [PQ10 = 5] -2.23 0.44 -0.75 0.44 [PQ10 = 6] -0.82 0.44 1.03 0.44
* Significant at 10 per cent level. ** Significant at 5 per cent level. *** Significant at 1 per cent level. Table 4.14 focuses on two measures of participation in PE: number of minutes per week spent in PE and number of sports taken by students during PE. It thus deals with both quantity of PE and diversity of activities undertaken in PE. The results offer stronger evidence of the influence of facilities. The extent of facilities has a positive effect on both the number of minutes of PE per student per week and the number of sports that the students undertook in PE. Thus, there is clear evidence that facilities are connected to the extent and diversity of students’ PE activities. The positive effect of parental sporting participation is not observed in PE, which would indicate that PE participation is not subject to influence from parents to the same degree as sport in non-school sport is.
SPORT IN SECOND-LEVEL SCHOOLS: RESOURCES AND INFLUENCES 53
Table 4.14: OLS Regression Model of Number of Minutes per Week Spent in PE
Number of Minutes Per Week Spent in PE
Number of Sports Taken in PE
B Std. Error B Std. Error Constant 50.15 4.87 1.08 0.51 Number of facilities available 1.79*** 0.23 0.34*** 0.02 Pupil/teacher ratio 0.42 0.32 0.10*** 0.03 Female -6.80*** 1.46 0.74*** 0.15 Year in second-level cycle -1.28*** 0.50 -0.18*** 0.05 Mother takes part in sport 0.58 1.60 0.34 0.17 Father takes part in sport 2.71 1.59 -0.04 0.17 R-Squared 0.05 0.14
* Significant at 10 per cent level. ** Significant at 5 per cent level. *** Significant at 1 per cent level. This chapter has examined the resources available for sport and PE in second-level schools and the influence of resources and other factors on student’ participation in sport and PE. About 20 per cent of second-level schools lack a qualified PE teacher, a significant shortcoming given that the revised PE syllabus is designed to be delivered by trained PE teachers. On average, one in five of the full complement of teachers in each school was involved in sport and for each of these teachers there were on average 93 students. However, the variation around these averages was wide and was such as to suggest that some schools would have problems with teacher availability for sport. A number of core activities recommended in the PE syllabus for second-level schools was not available on the PE timetable in many schools – for example, dance was not available in 80 per cent of schools and swimming was not available in 76 per cent. The traditional team and field sports such as basketball, Gaelic football, soccer and athletics dominated the PE timetable, thus limiting the range of activities available to students.
4.5 Conclusions
A large majority of second-level school principals felt that sport was very important to the ethos of their school and none thought that it was unimportant. Most schools took part in inter-school competition in sport. Again, the traditional team sports – Gaelic football, basketball, soccer and hurling – dominated in this area, but athletics also were important.
An analysis of other uses of students’ time showed that television viewing occupied a substantial part of the students’ day, with around 40 per cent watching two to three hours television per day throughout the week. Time spent on homework increased as students moved up through the second-level cycle, but with a sharp drop in Transition Year,. Students who did other extra-curricular activities such as music and singing in the early years of the second-level, most of whom were girls, showed a drop-off in those activities in the later years of the cycle, reminiscent of the drop-off in sport that we saw in the previous chapter. Girls studied more than boys but watched just as much television, thus causing the drop-off in other activities to be more pronounced in their case.
54 SCHOOL CHILDREN AND SPORT IN IRELAND
Multivariate analysis confirmed that gender and year in the school cycle were the strongest predictors of the frequency with which students played sport, both in school and out of it: girls and those in the later years of second-level schooling played least. Time spent watching television also had a negative effect, but time spent on homework did not appear to be an important influence. The influence of parents was another significant factor: if parents, and especially fathers, played sport, their children were more likely to do so too. Of the school-level factors that might be expected to influence students’ physical activity, the extent of sports facilities did not seem to affect students’ participation in extra-curricular sport but it did have a positive effect on time spent at PE.
5. SPORT IN PRIMARY SCHOOLS
This chapter examines participation in sport among children in fifth and sixth class in primary schools. It also presents information on factors likely to affect that participation such as the extent of resources and facilities available for sport in primary schools and time spent on other activities such as homework. It uses multivariate analysis to test whether these factors do in fact show an association with participation in sport. This chapter thus echoes the analysis of second-level schools provided in the previous two chapters. However, given the younger age of the children involved, it was not possible to ask as detailed a range of questions as were asked of second-level students and thus the analysis in this chapter is more limited than it was in the previous two chapters. The analysis was further simplified by virtue of the fact that only fifth and sixth classes were included in the primary school sample. As variance between these two classes in most of the variables examined here was limited, we do not show responses separately for fifth and sixth class.
5.1 Introduction
5.2.1 PARTICIPATION IN PE 5.2
Sports Participation
Principals in primary schools report that the vast majority of schools provide PE classes but the number of those classes per student is low. As Figure 5.1 shows, 62 per cent of schools provided timetabled PE classes once a week and 31 per cent did so two or three times a week. Of the 137 schools sampled, only 3 held timetabled classes less than once a week, and 3 held classes four or more times a week.
Table 5.1 shows the range of activities children undertook in PE, based on a question to children about the sports they played in PE over the past year. Soccer was the most common, having been played by 72 per cent of children, and Gaelic football was next, with 69 per cent. Basketball was the most common sport among girls, having been played by 71 per cent of girls. It is notable that the proportion of primary school students who recorded swimming as an activity they had undertaken in PE over the past year (53 per cent) was much greater than the corresponding proportion among second-level students (13 per cent), as shown in Table 3.2 above.
55
56 SCHOOL CHILDREN AND SPORT IN IRELAND
Figure 5.1: Number of Timetabled PE Classes Provided Per Week Per Student According to Primary School Principals
0
10
20
30
40
50
60
70
4 or more perweek
2-3 per week once a week less often
%
Table 5.1: Participation in Individual Sports in PE over the Past Year by Primary School Pupils
All Boys Girls %
Soccer 72 82 61 Gaelic football 69 75 64 Basketball 69 67 71 Swimming 53 50 57 Baseball/rounders 49 51 49 Hurling 36 48 25 Athletics 33 34 32 Hockey 33 35 31 Dance 31 24 39 Rugby 25 30 20 Handball 24 25 22 Aerobics/exercise class 19 18 20 Cross country running 17 16 17 Camogie 16 2 30 Adventure activities 14 16 11 Tennis 13 11 14 Gymnastics 11 9 13 Martial arts 7 7 8 Badminton 6 7 5 Squash 3 3 2 Horse riding 2 1 2 Weight training 1 1 0 Any other sport 17 16 17 Don’t do PE/games at school 1 1 1
SPORT IN PRIMARY SCHOOLS 57
5.2.2 EXTRA-CURRICULAR SPORTS IN SCHOOL
Turning to the second pillar of children’s sport, Table 5.2 shows the frequency of participation in extra-curricular sports in school. The participation rate here is low: 25 per cent never take part in extra-curricular sport, 12 per cent do so less than once a week, and 23 per cent do so once a week, giving a combined total of 60 per cent who do so once a week or less. On the other hand, a combined 39 per cent take part either two, three or four or more times per week, a level of high-frequency participation that has no parallel in PE within the school. Gender differences in the frequency of participation in extra-curricular sport are not marked, with boys reporting only slightly higher levels of participation than girls. Table 5.2: Frequency of Participation in Extra-Curricular Sport by
Gender among Primary School Pupils
Boys Girls All %
4 or more days a week 18 13 16 2-3 days a week 21 25 23 One day a week 20 26 23 Less often 13 11 12 Never 26 24 25
100 100 100
Table 5.3 shows the range of activities undertaken by students in
extra-curricular sports. The pattern is in some respects similar to what we earlier saw with PE among primary pupils and with sport in general among second-level students, in that three traditional team sports – Gaelic football, soccer and basketball – dominate. However, two other activities – swimming and dance – that have not been prominent in other contexts are high up the table among primary pupils, coming in fourth and sixth place respectively. Combining the figure for hurling and camogie indicates that 22 per cent of pupils play hurling/camogie each week in extra-curricular sports. Here again, as with PE at primary level, gender differences in activities undertaken in extra-curricular sport at primary level are less marked than at second level. In the case of soccer, for example, one of the sports with the strongest gender differences, 35 per cent of boys take part compared to 25 per cent of girls – not a major gap by comparison with corresponding gaps in second level.
58 SCHOOL CHILDREN AND SPORT IN IRELAND
Table 5.3: Participation in Individual Extra-Curricular Sports At Least Once Per Week by Gender
Boys Girls Total Gaelic football 36 32 34
Soccer 35 25 30
Basketball 20 28 24
Swimming 18 18 18
Hurling 21 9 15
Dance 9 17 13
Baseball/rounders 9 11 10
Athletics 9 9 9
Rugby 9 6 8
Handball 7 7 7
Camogie 1 13 7
Hockey 6 6 6
Cross Country Running 4 3 4
Aerobics 3 4 3
Tennis 3 3 3
Adventure act 3 2 3
Gymnastics 2 3 3
Martial arts 2 2 2
Badminton 2 2 2
Squash 1 1 1
Horse riding 1 1 1
Weight training 1 0 0
Any other sport 5 7 6
5.2.3 PARTICIPATION WITH A CLUB OUTSIDE OF SCHOOL
Table 5.4 below shows the frequency of participating in sport with a club outside school. The results here indicate a greater rate of high-frequency participation than occurs either in PE or in extra-curricular sport: 19 per cent take part four or more days a week, with 37 per cent participating two to three days a week. The proportion that never participates is 12 per cent, considerably lower than the 25 per cent of primary pupils who never participate in extra-curricular sport in the school. Gender differences are somewhat larger here than in the case of extra-curricular school sport: 21 per cent of boys participate four or more days a week, with 39 per cent participating two to three days a week, compared to 16 per cent of girls who participate four or more times a week and 34 per cent who participate two to three days a week.
SPORT IN PRIMARY SCHOOLS 59
Table 5.4: Frequency of Participation with Club
Boys Girls Total
4 or more days a week 21 16 19 2-3 days a week 39 34 37 1 day a week 23 28 25 2-3 days a month 2 2 2 1 day a month 1 1 1 Less often 3 4 4 Never 10 14 12 100 100 100
The kinds of activities primary school pupils undertake in sport outside the school echo those they undertake in extra-curricular sport in the school, and again the notable feature here is the relatively high profile of swimming, dance and athletics, alongside the usual soccer, Gaelic football and basketball (Table 5.5). In fact, among girls, swimming and dance are the most common activities. Among boys, dance hardly features at all, in contrast to the substantial place it occupies for boys within the school. Girls, on the other hand, are little attracted to hurling/camogie or rugby, though they are more attracted to Gaelic football and soccer. Table 5.5: Participation in Individual Sports with a Club At Least
As Figure 5.2 shows, the main reason that the primary pupils give for not participating more in sports is the feeling that they are already doing enough. This is the case for both boys and girls (58 per cent of boys, 43 per cent of girls). Not having enough spare time and the school not offering the sport are two other reasons but on a much lesser scale. The results on this question indicate that there is no general feeling of discouragement with sport among the pupils, nor that girls feel very differently on this question from boys.
Figure 5.2: Reasons Given for Not Playing More Sport by Gender among Primary Pupils
0
10
20
30
40
50
60
already doenoughsport
don't likeplayingsports
haven'tenough
spare time
not goodenough at
sport
never beenasked
difficult toget home
school notoffer sport
boygirl
5.3.1 PUPIL TEACHER RATIOS AND TEACHERS
INVOLVED IN SPORT 5.3
Resources and Facilities Table 5.6 shows the numbers of teachers and students in the schools
in the primary school sample and the ratios between them. The pupil-teacher ratio in primary schools is on average 16 pupils with a maximum of 26. Out of a total average staff of 9 teachers per school, 6 were involved in sport with the pupils. There are, on average, 25 students per teacher involved in sport.
Table 5.6: Availability of Teachers and Teachers Involved in Sports in Primary School Sample (N=137 Schools)
Maximum Mean Minimum Number of full time teachers per school 37 8 2 Number of part-time teachers per school 13 1 0 Total number of teachers per school 50 9 2 Number of teachers involved in sport per school 39 6 0 Total number of students per school 823 148 17 Number of students per teacher involved in sport 108 25 7 Pupil-teacher ratio 26 16 3
SPORT IN PRIMARY SCHOOLS 61
5.3.2 AVAILABILITY OF FACILITIES As in the case of principals in second-level schools, principals in primary schools were generally dissatisfied with the facilities for sport in their schools: two-thirds said they were ‘not at all adequate’, while one-third said they ‘were adequate’ or ‘very adequate’. Additional comments provided by principals suggested that they were more concerned by indoor than outdoor facilities (for a selection of these comments, see Appendix 2). Several mentioned how their physical activity programmes were dependent on weather conditions arising from lack of access to indoor facilities and equipment. In line with this, two-thirds of principals believed that their school needed major investment in sports facilities, 29 per cent believed that their school needed minor investment in sports facilities and 5 per cent believed that their school did not need further sports investment. A number of principals referred to help received from local sports clubs in providing facilities. The role of local sports clubs in providing facilities is borne out in Figure 5.3, which illustrates that the vast majority of primary schools acknowledge at least some degree of help with facilities provided by local sports clubs.
Figure 5.3: Primary School Principals’ Perceptions of How Much Help They Receive from Local Sports Clubs
0
10
20
30
40
50
60
70
yes,we got a lot of help yes we get a little help no,we get no help
Figure 5.4 displays the percentage of schools that had access to facilities for different types of sports, either on-site or off-site. Basketball is the only sport for which the majority of schools had on-site facilities. For all other sports, there was heavy reliance on off-site facilities. This was especially so in regard to GAA pitches, where off-site facilities were the main form of provision and as such were widely available to schools. Swimming pools, as one might expect, were in almost all cases available only off-site. Echoing the complaints of principals referred to earlier, only 23 per cent of primary schools had their own multi-purpose indoor floor, though when combined with off-site access, such floors were available to almost 60 per cent of schools. In general, the picture of facilities available to primary schools portrayed by Figure 5.4 would seem
62 SCHOOL CHILDREN AND SPORT IN IRELAND
inadequate, both because of the low overall level of provision and the high share of that provision accounted for by off-site access.
Figure 5.4: Percentage of Primary Schools with Access to Facilities for Various Sports
0
20
40
60
80
100
GAA pitch
Basketb
all
Swimming po
ol
Indoor floor
Soccer
pitch
Gymnasti
cs
Tennis
Running tra
ck
Handball
Rugby pitc
h
Fitness
Equ
ip
Squash
Hockey
O n- or off-s iteO n-site
5.3.3 SPORTS ETHOS AND PARTICIPATION IN INTER-SCHOOLS SPORT
As in second-level schools, the vast majority of principals in primary schools felt that sport was important to the ethos of their school, with three-quarters saying that it was ‘very important’, a quarter saying that it was ‘fairly important’, and none saying that it was ‘not important’. A further indication of the importance of sport is the high degree of involvement in inter-schools competitions. As Figure 5.5 shows, the majority of inter-schools competitions revolve around team sports. Over 90 per cent of the schools were involved in Gaelic football competitions, 82 per cent in basketball competitions, and 70 per cent in soccer competitions.
Figure 5.5: Percentage of Primary Schools Taking Part in Inter-Schools Competitions by Sport
0
20
40
60
80
100
Gaelic
footba
ll
bask
etball
socc
er
base
ball/r
ound
ers
hurlin
g
swim
ming
athlet
icsda
nce
camog
ie
cross
ctry
runnin
g
gymna
stics
rugby
hock
ey
aerob
ics
adve
nture
activ
ityten
nis
badm
inton
other
sport
hand
ball
martial
arts
weight
traini
ng
horse
riding
squa
sh
SPORT IN PRIMARY SCHOOLS 63
5.4.1 TRAVEL TO SCHOOL 5.4
Travel to School and Other Time
Uses
As Table 5.7 shows, the majority of Irish primary school children are driven to school, either by car (55 per cent) or by bus (18 per cent). Almost one in four children walk to school and less than one in twenty cycle to school. Table 5.7: Mode of Travel to School Among Primary School Pupils
Frequency Per Cent Walk 895 23
Cycle 114 3
By car 2,091 55
By bus 700 18
Total 3,833 100 Of the children who walk or cycle to school the vast majority
spend a quarter of an hour or less doing so (89.1 per cent for walking, 87.7 per cent for cycling). Thus, as in the case of second-level students, it is clear that travel to school is not a significant source of physical activity for primary school children. Table 5.8: Time Taken to Travel to School Among Primary School
Pupils
Frequency Per Cent Around 5 minutes 2,378 62
Around quarter of an hour 851 22
Around half an hour 294 8
More than half an hour 79 2
Don’t know 203 5
Total 3,833 100
5.4.2 TELEVISION VIEWING AND OTHER EXTRA-CURRICULAR ACTIVITIES
Table 5.9 shows that high levels of television viewing are common, with one in five boys and almost one in six girls watching more than four hours a day during the week and somewhat higher proportions doing so at the weekend. One in ten boys watches six hours or more television a day at weekends. The largest groups of children watch two to three hours of television per day, both during the week and at weekends.
64 SCHOOL CHILDREN AND SPORT IN IRELAND
Table 5.9: Time Spent Watching Television
Boys Girls TV Weekdays Missing 2 2
None at all 3 3 About 1 hour a day 34 38 About 2-3 hours a day 41 41 About 4-5 hours a day 13 12 About 6 or more hours daily 7 4
TV Weekends Missing 7 6 None at all 5 4 About 1 hour a day 24 28 About 2-3 hours a day 36 40 About 4-5 hours a day 18 15 About 6 or more hours daily 10 7
Sport should also be set in the context of other forms of time usage. As Table 5.10 shows, girls are almost twice as likely as boys to take part in activities such as music, singing and drama. This may be the other side of the coin of their lower participation in sport, though as we shall see below, higher participation in these activities does not necessarily correlate with lower participation in sport. Table 5.10: Time Spent on Various Activities by Gender
Boys Girls % %
Music/Singing/Drama Missing 2 1 I don’t attend any such classes 42 18 About 0-2 hours per week 38 38 About 3-4 hours per week 12 21 About 5 or more hours per week 7 21
In the preceding sections, we have examined factors likely to
influence participation in sport and physical activity individually. In this section, we present a multiple regression analysis, which assesses the effects of each of these factors while controlling for the others.
5.5 Determinants of
Participation
5.5.1 INDIVIDUAL LEVEL DETERMINANTS
We begin by analysing the effects of the individual characteristics of students on frequency of participation (i) in extra-curricular sports in the school and (ii) in sport in the sports clubs outside the school (Table 5.11). No information on home background was collected from primary school pupils, other than a question on whether their mothers and fathers played sport. Factors that have a significant positive association with both measures of participation include being a boy, mother’s playing of sport, and father’s playing of sport. The number of extra-curricular classes taken by pupils also has a significant positive association, thus underlying the point that these classes seem to go hand in hand with more rather than less participation in sport. The effect of having a mother or father involved in sport on the frequency of club sport participation is double the effect on school sport participation. Similarly, gender has a substantially bigger effect on participation in clubs as opposed to school participation.
SPORT IN PRIMARY SCHOOLS 65
Table 5.11: Determinants of Frequency of Participation in Extra-Curricular Sporting Context and in Sports Clubs
Participation in Extra-Curricular Sport
Participation in Sport in a Club
Estimate Standard Error Estimate Std. Error Explanatory Variables Hours of Television Weekdays -0.03 0.03 -0.17*** 0.03 Hours of Television Weekends -0.07* 0.03 -0.10*** 0.03 Number of Other Classes e.g.
Music/Dance Per Week
0.16***
0.03
0.23***
0.03 Boys 0.14*** 0.06 0.61*** 0.06 Fifth Class -0.09 0.06 -0.17*** 0.06 Mother Plays Sport 0.19** 0.06 0.60*** 0.07 Father Plays Sport 0.25** 0.06 0.58*** 0.06 Thresholds 1 -0.78 0.14 -1.68 0.14 2 -0.20 0.14 -1.33 0.14 3 0.77 0.14 -1.27 0.14 4 2.01 0.14 -1.11 0.14 5 0.24 0.14 6 2.09 0.14
* Significant at 10 per cent level. ** Significant at 5 per cent level. *** Significant at 1 per cent level.
5.5.2 DO SCHOOL DIFFERENCES MATTER?
We now extend our analysis of the determinants of participation in sport by incorporating two school-level characteristics – the number of facilities available in schools and the pupil-teacher ratio. The results in Table 5.12 shows that the first of these has an effect on participation in extra-curricular sport but the second does not.
Table 5.12: Effects of Individual and School Variables on Frequency of Sporting Participation
Participation in Extra-Curricular Sport
Participation in Sport in a Club
Estimate
Std. Error
Estimate
Std. Error
Explanatory Variables Hours of Television Weekdays -0.01 0.04 -0.17*** 0.04 Hours of Television Weekends -0.08*** 0.03 -0.11*** 0.03 Number of Other Classes e.g. Music/Dance Per Week 0.17*** 0.03 0.22*** 0.04 Number of Facilities Available 0.05*** 0.01 -0.01 0.01 Pupil Teacher Ratio -0.01 0.01 0.01 0.01 Male 0.11 0.07 0.60*** 0.07 Fifth Class -0.12* 0.07 -0.16*** 0.07 Mother Plays Sport 0.14** 0.07 0.56*** 0.07 Father Plays Sport 0.20*** 0.07 0.52*** 0.07 Thresholds 1 -0.88 0.22 -1.64 0.23 2 -0.21 0.22 -1.30 0.23 3 0.74 0.22 -1.23 0.23 4 2.04 0.23 -1.08 0.23 5 0.28 0.23 6 2.11 0.23
* Significant at 10 per cent level. ** Significant at 5 per cent level. *** Significant at 1 per cent level.
66 SCHOOL CHILDREN AND SPORT IN IRELAND
This chapter has dealt with sports participation among children in fifth and sixth classes in primary school and has examined a range of factors likely to affect that participation. The results echo those found for second-level students in previous chapters in many respects, though with some differences. As in second-level schools, PE is widely provided in primary schools, but usually only once a week. Again echoing the situation in second-level schools, extra-curricular sport in the school and sport in clubs outside the school are more important than PE as outlets for physical activity among children. Team sports dominate the activities undertaken in the school – and here too, as in second-level schools, basketball is an important sport in the school but is much less prominent in the non-school context. Primary schools differ from second-level schools in the prominence of swimming and dance in the activities they undertake, both in the school and out of it (dance in this context presumably often means Irish dancing).
5.6 Conclusions
Primary schools seem to be worse off than second-level schools for sports facilities – they are more dependent on off-site facilities (except for basketball) and generally have access to a narrower range of facilities. Over 60 per cent of children in fifth and sixth class in primary school watch two hours or more of television per day. Of the factors in children’s lives that were measured in the data, parents’ participation in sport had a positive effect on childrens’ participation in sport. So too did participation in other extra-curricular activities such as music or singing classes, suggesting that the more active children tended to be more active across a number of domains. The level of sports facilities in school had a positive effect on sports participation in the school, while television viewing had a negative effect on sports participation outside the school.
6. SPORT, PHYSICAL ACTIVITY AND OBESITY
This chapter examines body mass among Irish school children and its relationship to their physical activity levels. It focuses mainly on second-level students but makes reference also to students from fifth and sixth classes in primary school, on whom more limited data were gathered. The main concern of the chapter is with overweight and obesity, issues that are now recognised as a major public health problem among both children and adults (National Taskforce on Obesity, 2005). Obesity is economically costly and the number of premature deaths it causes is estimated at 2,000 per year. The National Taskforce on Obesity has also estimated that treating patients with obesity-related problems (such as high blood pressure, type 2 diabetes and excess cholesterol) cost approximately €70 million in Ireland in 2002.
6.1 Introduction
Obese children and adolescents face many immediate and long-term health risks. Type 2 diabetes and other weight-related diseases are being increasingly observed in children (National Taskforce on Obesity, 2005). Another complication of childhood obesity is the metabolic syndrome, diagnosed when a person has at least three of five metabolic abnormalities. This syndrome is now present in at least 30 per cent of obese children in the United States (Cook et al., 2003). Apart from the physical health risks, obesity is also associated with psychosocial problems such as social marginalisation and low self-esteem. The physical and social effects of obesity may carry through to adulthood and reduce life expectancy (Koplan et al., 2005).
In Ireland, as in many other countries, measurement of obesity among children is too recent and unstandardised for it to be possible to assess trends over time with any precision. Some studies have been carried out, but not as part of a consistent series (see National Task Force on Obesity, 2005, pp. 21-28, for an outline of data available for Ireland). In 1990, the Irish National Nutrition Survey found that 1.9 per cent of 12-15 year olds were obese. In 2001-2002, the Irish Oral Health Research Centre carried out the National Survey of Children’s Dental Health in which children’s height and weight were measured. The data show that approximately 6 per cent of children aged 11 to 16 years were obese (the report on this survey has not been published at time of writing; see National Task Force on Obesity, 2005, p. 26 for preliminary data). The Health Behaviour in School Children (HBSC) survey carried out in Ireland and 28
67
68 SCHOOL CHILDREN AND SPORT IN IRELAND
other countries in 2002 gathered information on height and weight among children aged 13 and 15 years. This information was based on self-reports by the children rather than objective measurement and, in Ireland, was subject to high rates of item non-response. Yet, with adjustments for measurement error, the results are said to tally with those obtained from objective measures (National Task Force on Obesity, 2005, p. 21). The findings suggested that 13 year-old girls and boys in Ireland (of whom 2.1 per cent and 3.9 per cent respectively were obese) had above the average levels of obesity for the 28 other HBSC countries, but 15 year-old boys (1.4 per cent obese) were below the average.
Obesity is the result of an excess of energy intake (i.e. food consumption) over energy expenditure. While a better understanding of both sides of this balance is required, the focus of this study is on one side only – energy expenditure – as we have no information on energy intake (diet). Furthermore, in its focus on school students, the present report is not primarily concerned with energy expenditure in total but with participation in sport and PE, an important but not all-inclusive category of energy expenditure. It does not examine in any detail children’s physical activity outside of organised sport and PE, though a simple global measure of overall exercise levels is included. A number of factors likely to be related to physical activity is also examined, such as time spent TV viewing and doing homework. Indicators of these behaviours are based on self-reports by respondents and therefore are prone to measurement error. Furthermore, the measures of physical activity deal primarily with frequency and for the most part do not capture other dimensions such as intensity or duration. They are, therefore, regarded here as providing an approximate and preliminary basis for examining factors associated with overweight and obesity, while recognising that more sophisticated methodological approaches would be needed to examine the relevant issues thoroughly. 6.2.1 THE BMI INDEX AND CUT-OFFS 6.2
Measuring Obesity and
Overweight in Children
In general, the body mass index (BMI) is used as a proxy for body fatness and this measure has been applied worldwide as a basis on which to assess the extent of obesity. BMI is an indirect measure of body fat calculated as the ratio of a person’s body weight in kilograms to the square of a person’s height in metres:
BMI= W/H2
where W = weight in Kg and H = height in metres
For adults, a BMI in excess of 30 is defined as obese, and a BMI of 25-29.9 is defined as overweight. BMI below 25 is defined as normal weight. For children, such fixed BMI thresholds are considered to be inappropriate since BMI continuously changes between birth and late teenage years. A number of different approaches have been devised to take account of the way BMI varies by age among children. Two of these are particularly important in the international
SPORT, PHYSICAL ACTIVITY AND OBESITY 69
research literature, one developed by the Centers for Disease Control and Prevention (CDC) in the United States, the other by the International Obesity Task Force (IOTF).
The CDC devised a growth reference in 2000 that established BMI scores for each percentile of the child population classified by age and gender (Kuczmarski et al., 2002). The growth reference data were based on BMI distributions calculated from combined US surveys of children aged 6 to 19 years carried out between 1963 and 1980. BMI at the 95th percentile in each age-gender group in those combined surveys was defined as the obesity threshold (Koplan, 2005, p. 62). This and related thresholds from the CDC growth charts have been applied in many countries and are widely viewed as a standard for assessing obesity in children.
However, questions arose in some countries as to why international obesity levels should be assessed on the basis of reference standards constructed from US data. The IOTF proposed as an alternative that BMI centiles for children should be linked to adult cut-off points for overweight and obesity as a means of providing cut-off points for children. Obesity thresholds for each age-gender group of children were defined by modelling the BMI scores children would need to have at each age if they were to pass through a BMI of 30 (the adult obesity threshold) at age 18 years. Similarly, overweight thresholds were defined by estimating the BMI values that children would need to have at each age to pass through a BMI of 25 (the adult overweight threshold) at age 18 years (Cole et al., 2000). Cut-offs calculated in this way were recommended for use in international comparisons of prevalence of overweight and obesity.
In this study, we base our analysis on the IOTF age and gender specific BMI cut-offs for overweight and obesity for children, as they are widely though to be more appropriate for European countries.1 It is worth noting that measures of obesity and overweight in our second-level student sample based on CDC cut-offs lead to considerably different estimates of obesity and overweight than those based on IOTF cut-offs. For example, using the CDC cut-offs, 11 per cent of boys in our sample would be considered overweight, compared to 15.5 per cent using the IOTF cut-offs. Similar differences arose with girls. The extent of these differences between two different ways of measuring overweight in the same sample should caution us against making comparisons across time or place between measures of obesity and overweight among children based on different standards.
1 Alternatively, it has been argued that the cut-offs calculated on UK data in 1990
(Cole et al., 1995) are more applicable in Ireland given that our lifestyles are similar to those in the UK. However, the IOTF cut-offs were used to assess obesity and overweight in the National Survey of Children’s Dental Health (National Taskforce on Obesity, 2005, p. 26), and this is an additional reason for using the IOTF cut-offs here.
70 SCHOOL CHILDREN AND SPORT IN IRELAND
6.2.2 BMI MEASURES IN PRESENT SURVEY DATA
The data on height and weight and the resulting BMI scores used in this study are based on objective measurement conducted in the classroom (see Section 1.4 ‘Data’ in Chapter 1). At the same time, the surveys in which the data were collected were primarily concerned with sports participation rather than anthropometric measurement, and the height and weight data were subject to a certain margin of error. In particular, in order to minimise the intrusiveness of this aspect of the survey, respondents remained fully dressed in indoor clothing (including shoes) as the height/weight measures were taken. This means that height and weight were somewhat overstated – height by the thickness of the soles of respondents’ shoes, weight by the weight of their clothes and shoes. We conducted a range of sensitivity tests that assess the level of error in the BMI scores likely to have resulted from this overstatement. These tests, which are available separately from the authors, show that the distribution of the sample between normal, overweight and obese categories is not sensitive to adjustments to height and weight that correct for the effect of clothes and shoes. We conclude, therefore, that the unadjusted data are sufficiently accurate for our purposes, and are the data we use in this chapter.
It should also be noted that the samples we examine were designed to represent years/classes in the mainstream school system, not age-cohorts of children. The samples did not include children not attending school or attending special schools. In particular, they do not represent the substantial proportions of age-cohorts above compulsory school age (16 years) who have left school. The data for 18 year-olds in the sample are likely to be particularly unrepresentative in this sense, given the high proportion of 18 year-olds who are no longer in second-level schools, and this should be kept in mind in reading results tabulated by age in this chapter.
Table 6.1 presents descriptive statistics for BMI for each age
group and gender for second-level students aged from 13 to 18 years. As expected, we see that BMI increases as children get older but we also note that there is a lot of variation within the age groups. For example, for boys aged 14 years, the minimum BMI is 12 and the maximum is 40. For girls of the same age, the minimum and maximum are 10 and 41 respectively. A girl aged 14 years with BMI of 41 is well over the obesity cut-off, which for girls of that age is 29.8.
6.3 Obesity Among
Second-level Pupils
SPORT, PHYSICAL ACTIVITY AND OBESITY 71
Table 6.1: Descriptive Statistics of BMI for Second-Level Students
Based on these data, Table 6.2 shows the proportions of boys
and girls in each age-group who are normal weight, overweight and obese. The overall rate of obesity is higher for boys, at 4.5 per cent, than for girls, at 3.8 per cent, but the rate of overweight is slightly lower for boys (15.4 per cent) than for girls (16.6 per cent). There is no consistent age-gradient in risk of obesity. In any event, allowing for margins of error in the data (both measurement error and sampling error), these differences are not that substantively significant. Among boys, obesity rates decline between ages 13 and 16 years but rise for ages 17 and 18 years, while for girls, obesity rates are highest at ages 15 and 18 years. Table 6.2: Percentages of Second-Level Students in each BMI
Category (Row %)
Age Normal Overweight Obese N Boys 13 77.6 16.4 6.1 165
The overall obesity rates measured here are broadly similar to
those of the National Survey of Children’s Dental Health 2001-2002, as reported by the National Taskforce on Obesity (2005, p. 26). They are slightly below those found for children in the Health Survey for England 2002, which also used IOTF cut-offs (Sproston and Primatesta, 2003). In England the obesity rates are higher for boys by 1-2 percentage points for most years of age, and for girls they are 2-5 percentage points higher.
72 SCHOOL CHILDREN AND SPORT IN IRELAND
Evidence in the US suggests that family socio-economic status is inversely related to obesity prevalence in children (e.g., Strauss and Knight, 1999; Goodman, 2003). In Ireland, the picture seems different, as Table 6.3 shows. Here, the proportion of children who are obese does not vary consistently by father’s socio-economic group. Table 6.3: BMI Categories by Socio-Economic Group of Father
Among Second-Level Students (Row %)
Normal Overweight Obese Total Professional or technical 79.4 17.2 3.4 100 Business owner 75.0 20.2 4.8 100 Manager 85.7 12.4 2.0 100 Clerical or administration 85.0 10.0 5.0 100 Service or sales 78.5 16.9 4.5 100 Skilled or semi-skilled 78.3 17.8 3.9 100 Labourer 79.3 16.2 4.5 100 Farmer 83.3 14.0 2.7 100 Army/naval corp/air corp 84.4 6.3 9.4 100
The relationship between physical activity and obesity has been a major focus of international research. As was pointed out in the overview of research in Chapter 1, however, the results of this research have been inconclusive, for both children and adults: some studies find no association between low levels of physical activity and risk of obesity while others do. Furthermore, where an association is found, the direction of causality is often unclear: inactivity could be a cause of obesity, but equally people could be inactive because they are becoming obese.
6.4 Obesity and
Physical Activity Among Second-
Level Students
Our main focus here is on the connection between participation in sport and physical exercise on the one hand and risk of obesity on the other. We also have measured a range of other factors, such as TV viewing, time spent on homework, and various characteristics of the students’ home background that might influence physical activity and homework. We first consider the relationship of some of these factors with obesity and overweight in isolation, before turning in a later section to a multivariate analysis that considers their joint association with BMI.
SPORT AND OBESITY/OVERWEIGHT
As outlined in Chapter 3, students’ participation in sport was measured across three ‘pillars’ – physical education (PE) in schools, extra-curricular sport within school and sport in non-school clubs. As the latter two pillars were the more important for students’ frequency of participation in sport, we created a composite measure of frequency of participation in both combined (see Chapter 3 and Table 3.11 above). Table 6.4 sets out the relationship between this composite measure and students’ BMI category. It shows that there is an association between the two – normal weight children play more sport than obese children. For example, 47 per cent of normal-weight children play sport 4 or more days per week (the highest frequency category) compared to 35 per cent of obese children.
SPORT, PHYSICAL ACTIVITY AND OBESITY 73
Looking at the other extreme – those who never play sport – we find that 10 per cent of normal weight children are in this category compared to 14 per cent of obese children. However, while these data indicate a relationship between sports participation and risk of obesity, they also show that the relationship is far from perfect: there are many obese children who often play sport and many normal weight children who play little or no sport, thus indicating that many other social and behavioural factors (of which diet is likely to be the most important) affect body mass. Table 6.4: Composite* Measure of Sports Participation and BMI
Category Among Second-level Students
Normal Overweight Obese
% 4 or more days 47 44 35 2-3 days 27 26 32 1 day 11 14 13 Less often 6 7 5 Never 10 10 14 Total 100 100 100
* Frequency of participation in extra-curricular sport and sport in non-school clubs combined.
While most of our measures of physical activity related only to
frequency of participation in sport, a global measure of physical exercise levels was also included. This measure incorporated an intensity dimension, as it defined exercise as activity that caused respondents’ breathing rate to rise (for details, see Chapter 3 above). We now relate this measure to BMI categories to see if it is associated with risk of overweight and obesity. The version of the measure we use here is the number of days in the previous week on which pupils did at least one hour of exercise (one hour per day being the recommended minimum daily level of activity for children, as discussed in Chapter 1). Table 6.5 shows that physical exercise measured in this way has a substantial but not extremely strong relationship with risk of obesity: over a quarter of the obese reported that they had no day in the previous week in which they did more than one hour of exercise, compared to 15 per cent of those of normal weight, and at the other extreme, 9 per cent of the obese said they had seven days of exercise of more than one hour, compared to 16 per cent of those of normal weight. Thus, a certain proportion of those of normal weight did less than the recommended daily levels of exercise, while a certain proportion of the obese achieved those recommended levels. If we look at the proportions in each category that had at least 5 days in the week in which they exceeded the one-hour exercise threshold, we find about 36 cent of those of normal weight and 25 per cent of the obese in that category.
74 SCHOOL CHILDREN AND SPORT IN IRELAND
Table 6.5: Number of Days of One Hour+ Exercise in Previous Week and BMI Category Among Second-Level Students
While physical activity among children should be encouraged,
recent recommendations also suggest that inactivity should be discouraged (NAPSE, 2004). We now look at one important indicator of inactivity – TV viewing – among second-level students and relate this to levels of obesity. Students in the sample were asked how many hours they spent watching TV or playing video games during weekdays and at weekends. Because the amount may differ between weekdays and weekends we look at the two separately (Tables 6.6 and 6.7). We find no clear association between hours watched TV/video games and risk of obesity at either time. In both tables, the risk of obesity among those who watched TV for one hour per day was much the same (around 4.5 per cent) as for those who watched six or more hours per day. Table 6.6: Hours Spent Watching TV/Video Games Per Day on
Weekdays in Previous Week and BMI Category among Second-Level Students (Row %)
Hours Normal Overweight Obese None 80.0 16.7 3.3 1 79.0 16.6 4.5 2-3 80.6 15.2 4.1 4-5 83.7 13.6 2.7 6 or more 77.4 18.3 4.3
Table 6.7: Hours Spent Watching TV/Video Games Per Day at
Weekend in Previous Week and BMI Category Among Second-Level Students (Row %)
Hours Normal Overweight Obese None 81.5 15.7 2.8
1 80.0 15.6 4.4 2-3 79.7 16.3 4.0 4-5 79.6 16.2 4.2 6 or more 82.2 13.4 4.5
Another possible factor likely to affect physical activity and thus
be related to risk of obesity is time spent doing homework. Again, this factor is measured separately for weekdays and weekends. The association between this factor and risk of obesity or overweight as set out in Tables 6.8 and 6.9 shows no clear pattern. In Table 6.8, for example, the highest risks of obesity are for those who are at the
SPORT, PHYSICAL ACTIVITY AND OBESITY 75
two extremes of the homework measure – those who did none in the previous week and those who did four hours or more. In Table 6.9, the highest obesity risk is among those who did three hours of homework at the weekend. Table 6.8: Hours of Homework Per Day on Weekdays in Previous
Week and BMI Category Among Second-Level Students (Row %)
In the previous section, we have looked at the association between overweight and obesity on the one hand, and a range of other factors looked at in isolation on the other. In order to assess the impact of these factors while controlling for other factors, we now turn to a multivariate analysis. This analysis enables us to identify associations between variables more effectively, though it does not always tell us what causal patterns underlie any associations we might find.
6.5 Multivariate
Analysis of Obesity and
Participation in Physical Activity
in Secondary Schools Our dependent variable is log of BMI, which allows us to
interpret coefficients as percentage changes. (We also explored an alternative approach, which used multinomial logits to test for effects on risk of obesity and of overweight as the dependent variable, but as this produced similar results to those shown below and is more complex to present and understand, we have not included the results here.) We focus on two key independent variables referred to earlier – the composite measure of frequency of participation in extra-curricular sport and non-school sport combined, and the global measure of physical exercise over the past week (see Chapter 3). In order to estimate the effect of these two variables, we estimate a separate set of models for each, as set out in Tables 6.10 and 6.11.
Another physical activity indicator – whether the respondent walked/cycled to school or not – is included in both models. Two home background factors are included. The first is employment profile of the household, measured by two variables – whether the father is working or not and the mother is working or not. The second is household social class, which is measured by means of a
76 SCHOOL CHILDREN AND SPORT IN IRELAND
dichotomised measure of fathers’ social class – professional, business owners and managers versus the rest (non-response on this item was 16 per cent). We deal with school characteristics in two ways in the models. The first is by calculating a school fixed effects model, which takes account of all differences between schools, observed and unobserved. The second is by focusing on specific measured characteristics of schools and estimating their association with BMI. The first of these measured school variables is whether the school is fee-paying or not, a measure that proxies the social class composition of the school in that fee-paying schools are likely to have more children from higher social class backgrounds. We would expect children in fee-paying schools to have lower BMI. The other measured school variables relate to the standing of sport or resources for sport in the school. One is based on an item that asked school principals to rate the adequacy of investment in sports facilities in the school. Two others are based on further questions to principals about the ethos of sport in the school and whether or not the school takes part in inter-schools competitions. The possibility that single-sex boys’ schools may have a different approach to sport than other schools and so affect BMI is considered by including this as a dichotomous variable. The gender of pupils is included at the same time. Finally, we include a measure of the number of teachers available for sport, expressed as a proportion of all teachers (as reported by the school principals).
As already mentioned, we present two sets of regression models, the first (as set out in Table 6.10) focusing on the composite measure of sports participation as the key independent variable of interest, the second (Table 6.11) on the global measure of physical activity as the key independent variable of interest.
In model 1 in Table 6.10, we show results for the key independent variable on its own – the composite sports participation measure. This shows that only the highest frequency of participation (four or more days per week) is associated with lower BMI. However, the association is small – BMI among those with this frequency of sports participation is 1.61 per cent lower than for those who never participate in sport. In model 2 we add in parents’ working status and social class and we show that if a mother is working, there is a small but significant positive effect on children’s BMI levels. However, the important result in model 2 is that regular activity is no longer significant once we control for these household characteristics.
The third model in Table 6.10 introduces school fixed effects, for which the coefficients are not shown. This model estimates how much of the variance in BMI is accounted for by differences between schools, including those differences not measured in our data. The main finding from this model is that the explanatory power of the model, as measured by the R2 statistic, at 8.9 per cent, is a good deal higher than in the other models, though it is still not high in absolute terms. This indicates that differences between schools (such as, perhaps, differences in their social composition that our data do not capture) have some association with the BMI of
SPORT, PHYSICAL ACTIVITY AND OBESITY 77
students. The effect of parents’ occupation is no longer significant, suggesting that school effects now pick up the social background effects. In model 4, we substitute the school fixed effects with a number of measured school variables. The fall in the R2 statistic to 1.6 per cent indicates that these measured school variables capture only a small part of the variance accounted for by school differences. Only two are statistically significant. Lower levels of BMI are found in fee-paying schools – this is more likely to reflect social class rather than a school effect in the strict sense. The other is the school’s sports ethos. Another significant – and somewhat surprising – result in this model is that if the school places a lot of emphasis on sports ethos, children within these schools have higher levels of BMI. It is not clear how this effect might be accounted for.
Dependent variable: Log BMI 1 2 3 4 Composite sports participation measure: 4 + times per week -0.0161** -0.0185 -0.0102 -0.0131 2-3 times per week 0.0018 -0.0094 -0.0039 -0.0079 1 time per week -0.0064 -0.0159 -0.0062 -0.0209 Less often -0.0097 -0.0128 -0.0126 -0.0077 (ref=never) Walk/cycle to school -0.0040 -0.0043 -0.0020 Father working -0.0223 -0.0038 0.0151 Mother working 0.0133** 0.0081 0.0160** Father – Professional/Manager -0.0101 -0.0034 -0.0086 School fixed effects + Fee paying school -0.0351** Invest in facilities? 0.0106 Boys -0.0118 Boys school -0.0082 Ratio of sports teachers/all teachers 0.0064 Ethos of sport important 0.0196** Not in any inter school competitions 0.0498 Constant 3.059** 3.09** 3.02** 3.03** R2 0.22% 0.5% 8.9% 1.6% N 2,788 2,314 2,314 2,053 ** Significant at 5 per cent level. * Significant at 10 per cent level.
+ Coefficients for school fixed effects not shown. Table 6.11 focuses attention on the second key independent
variable of interest, the global exercise measure (the average number of hours of exercise per day over the previous week). Entered on its own (model 1), this variable has a significant negative effect on BMI and in the direction one would expect (the more exercise students do, the lower their BMI). However, as other variables are controlled
78 SCHOOL CHILDREN AND SPORT IN IRELAND
for, its effect diminishes. The only category of physical exercise that is consistently significant across all models is 6-7 hours of exercise per day, though even its impact is modest. However, it gives some support to the idea mentioned in previous chapters that only quite high levels of physical exercise, going well beyond the minimum recommended levels, might be enough to have a worthwhile impact on weight gain.
Table 6.11: BMI Regression Model: Key Independent Variable – Global Exercise Measure (Average Hours Exercise Per Day Over Previous Week)
(ref=less than one hour) Walk/cycle to school 0.0045 0.0029 0.0051 Father working -0.0334 -0.0169 -0.0096 Mother working 0.0103 0.0053 0.0128 Father – Professional/Manager -0.0128 -0.0017 -0.0056 School fixed effects + Fee paying school -0.0386** Invest in facilities? 0.0116 Boys
-0.0118
Boys school -0.0121 Ratio of sports teachers/all teachers 0.0019 Ethos of sport important 0.0165** Not in any inter school competitions 0.0489 Constant 3.076** 3.10** 3.045** 3.06 R2 0.69% 0.98% 8.7% 1.9% N 3,049 2,504 2,504 2,219
** Significant at 5 per cent level. * Significant at 10 per cent level. + Coefficients for school fixed effects not shown.
We now move on to analyse BMI and associated factors among students in primary schools. As we have data only for fifth and sixth classes and a more limited range of background variables was collected, the analysis is less extensive than that provided for secondary schools.
6.6 Obesity and Overweight
Among Primary School Children Table 6.12 shows the proportions of boys and girls in each class
who are normal weight, overweight and obese. On average, around 4 per cent of the children in these classes are obese. This is a slightly lower level than that reported for similar age-groups by the National Survey of Children’s Dental Health, where around 6 per cent were found to be obese (National Taskforce on Obesity, 2005, p. 26). It is
SPORT, PHYSICAL ACTIVITY AND OBESITY 79
also lower than that presented for England (Sproston and Primatesta, 2003). Table 6.12: Proportions of Fifth and Sixth Class Primary Students in
Each BMI Category (Row %)
Class Normal Overweight Obese N Boys 5th 79.9 15.9 4.2 879 6th 81.1 15.5 3.3 838 All 80.5 15.7 3.8 1,717 Girls 5th 78.9 17.2 3.9 901 6th 81.2 14.1 4.7 786 All 80.0 15.8 4.3 1,687
As in the case of second-level students, a composite measure of
frequency of participation in extra-curricular sport and non-school sport was created for primary school students. Table 6.13 cross- tabulates this measure with BMI category. The results show no pattern of association between the two: obese children were just as likely to take part in sport four or more days per week as were normal weight children, and were just as likely to do little or no sport. Table 6.13: Composite* Measure of Sports Participation and BMI
Category Among Fifth and Sixth Class Primary Students
%
Normal Overweight Obese 4 or more days 90 88 86 2-3 days 7 9 10 1 day 2 1 1 Less often 0.5 1 2 Never 0.5 1 1
* Frequency of participation in extra-curricular sport and sport in non-school clubs combined.
We now look at the global measure of exercise previously
referred to in connection with second-level students and relate this to the BMI categories for primary students. Respondents in the survey were asked the amount of time spent exercising in the last week. Table 6.14 shows that 9 per cent of obese children did not have any day in the previous week when they did at least an hour of exercise, compared to 6 per cent of normal weight children. It could be that they did less than one hour a day exercise but this does not fall into the required levels of daily activity for children. Only one-fifth of children did the required amount (one hour per day) and this is slightly lower for obese children, but only marginally.
80 SCHOOL CHILDREN AND SPORT IN IRELAND
Table 6.14: Number of Days of One Hour+ of Exercise Last Week and BMI Category Among Fifth and Sixth Class Primary Students
Moving on to physical inactivity among primary school children,
Tables 6.15 and 6.16 show the amount of time spent watching TV or playing video games during weekdays and at weekends. The results suggest that the link between these forms of inactivity and risk of obesity or overweight is at most slight: slightly larger proportions of obese children are intensive TV watchers but the differences are very modest. Table 6.15: Hours Spent Watching TV/Video Games Per Day on
Weekdays in Previous Week and BMI Category Among Fifth and Sixth Class Primary Students
% Normal Overweight Obese None 3.1 2.1 2.3 1 37.5 35.0 34.8 2-3 41.8 44.0 42.4 4-5 12.5 13.6 12.9 6 or more 5.1 5.3 7.6
Table 6.16: Hours Spent Watching TV/Video Games Per Day at
Weekend in Previous Week and BMI Category Among Fifth and Sixth Class Primary Students
% Normal Overweight Obese None 5.0 6.0 4.7 1 28.2 27.2 27.6 2-3 40.8 41.0 30.7 4-5 17.2 17.8 25.2 6 or more 8.9 8.0 11.8
This chapter has been concerned with overweight and obesity among students in the second-level and primary schools samples. Among second-level students, 4.5 per cent of boys and 3.8 per cent of girls were found to be obese, and a further 15.4 per cent of boys and 16.6 per cent of girls were overweight. Taking these two categories together, approximately one in five second-level students was either obese or overweight. In fifth and sixth classes in primary schools, levels of obesity and overweight were of a broadly similar magnitude: 3.8 per cent of boys and 4.3 per cent of girls were obese,
6.7 Conclusions
SPORT, PHYSICAL ACTIVITY AND OBESITY 81
and a further 15.7 per cent of boys and 15.8 per cent of girls were overweight.
When we examined the relationships between measures of sports participation and physical activity on the one hand and BMI on the other, we found no strong patterns of association. This is in keeping with the findings of research in other countries, where relationships in cross-sectional data between physical activity and risk of overweight or obesity have been found to be absent or weak. This lack of a strong relationship may arise either because measures of physical activity do not adequately capture real variations in energy expenditure or because variations in energy expenditure are too small to counteract the effects on weight of other factors, of which diet is likely to be the most important. There is some indication that very high levels of exercise, well in excess of the minimum levels recommended by international authorities, may have an effect on body mass. This possibility has recently been raised in international discussion of the adequacy of existing recommendations, but we would need more refined measures than those available to us here to explore this question further.
7. CONCLUSIONS AND POLICY IMPLICATIONS
The preceding chapters have described children’s participation in the three pillars of sport – the physical education (PE) curriculum in schools, extra-curricular sport played in the school, and sport played outside the school in sports clubs or other organised contexts – and examined a range of factors likely to affect their participation. This chapter first summarises the main findings arising from the empirical analysis, and then discusses the implications for public policy, with reference especially to the two areas of public policy that were of main concern in this report, namely, education policy and sports policy. 7.1.1 SPORT IN SECOND-LEVEL SCHOOLS 7.1
Main Findings Participation, Perceptions and Attitudes
Students in second-level schools received less PE per week than is recommended in the PE syllabuses for second level. The average was 69 minutes of PE per student per week, compared to the recommended two hours per week. Transition Year students were the only ones to come close to the recommended level. Boys got slightly more PE than girls, and students in the earlier years of the second-level cycle got more than those in the later years. The mix of activities delivered in PE, was dominated by a limited number of team sports, especially soccer, basketball and badminton, all of which can be played indoors. Certain recommended core activities such as dance, swimming, gymnastics and adventure activities were taken by less than one in five students in PE classes.
Second-level students took part more frequently in extra-curricular sport in schools and in sport outside the school than they did in PE. It was these two pillars, rather than PE, that provided the main outlets for their organised physical activity. Taking both pillars together, almost half of the students (46 per cent) took part four or more times per week, and a further quarter (26 per cent) took part two or three times per week. The kinds of sports and activities they undertook showed a broadly similar concentration on a limited range of team sports to that found in PE, though with outdoor sports, including Gaelic games and hockey, in a more prominent position. Basketball again featured strongly in extra-curricular sport in the
82
CONCLUSIONS AND POLICY IMPLICATIONS 83
school but not in non-school sports. This indicates that basketball has popularity as a school sport, both in PE and extra-curricular sport, that is in contrast with its rather limited presence outside the school.
It is not possible to say with any confidence from the data how many students are getting the minimum of 60 minutes of moderate-to-vigorous physical activity that is now widely recommended for children. Physical activity is difficult to measure, and certain measures in the present data are not sufficiently informative on this question. It does seem likely that many students are taking part in a lot of sport, especially boys and those in the earlier years of the second-level cycle. But in the absence of reliable data on the intensity and duration of activity (data that are difficult to gather with present methods), it is uncertain whether this gives rise to a sufficient level of physical activity. There are also minorities of students who take part in little sport, and they are unlikely to achieve the recommended levels through compensating activities outside of sport. These minorities are larger among girls than among boys and among students in the later years of the second-level cycle.
School principals felt that the main obstacles to raising students’ levels of sport and PE are pressures of time from schoolwork, especially at senior cycle, and inadequate facilities. Students’ own attitudes to sport and PE are strongly positive. Of the possible negative aspects of sport investigated here, the only one to cause widespread concern among students was the fear of being left out because they were not good enough.
A persistent pattern running through the findings is gender difference: boys and girls behave differently and feel differently when it comes to sport. Boys spend more time at sport and enjoy it more, and are more enthusiastic about its rough and tumble aspects. A further recurrent theme is the decline in sports participation as students move up through the second-level cycle, though in some respects Transition Year (which comes in the fourth year of the cycle) temporarily reverses this downward movement.
Resources and Influences
Over 20 per cent of second-level schools lacked a qualified PE teacher, a significant shortcoming given that the revised PE syllabus at second level is intended to be delivered by teachers with PE qualifications. On average, one in five of the full complement of teachers in schools was involved in sport and for each of these teachers there were on average 93 students. However, the variation around these averages was wide and was such as to suggest that some schools would have problems with teacher availability for sport. A number of core activities recommended in the PE syllabus for second-level schools was not available on the PE timetable in many schools – for example, dance was not available in 80 per cent of schools and swimming was not available in 76 per cent.
The majority of second-level school principals felt that sports facilities in their schools were inadequate, though students were less
84 SCHOOL CHILDREN AND SPORT IN IRELAND
critical in this regard. Most schools had access to basketball courts and football pitches, but a quarter lacked access to a multi-purpose indoor floor. Off-site facilities were an important contributor to overall facilities, and a large majority of school principals reported that they received help from local sports clubs in providing sport to their students. Some sports for which schools had facilities, or had access to off-site facilities, were not widely offered to students on the PE timetable. In these instances, it is likely that the facilities were used as resources for extra-curricular activity more than for PE.
A large majority of second-level school principals felt that sport was very important to the ethos of their school and none thought that it was unimportant. Most schools took part in inter-school competition in sport. Team sports – Gaelic football, basketball, soccer and hurling – dominated in this area, but athletics also were important.
Television viewing occupied a substantial part of the students’ day, with around 40 per cent watching two to three hours television per day throughout the week. Time spent watching television was one activity that showed no decline over the years of the second-level cycle. Time spent on homework increased as students moved up through the second-level cycle, but with a sharp drop in Transition Year, where students did little homework. Students who did other extra-curricular activities, such as music and singing, in the early years of second level, most of whom were girls, showed a drop-off in those activities in the later years, reminiscent of the drop-off in sport. Girls studied more than boys, especially as examination pressures increased, but they watched just as much television, thus causing the drop-off in other activities to be more pronounced in their case.
7.1.2 SPORT IN PRIMARY SCHOOLS
As in second-level schools, PE is widely provided in primary schools, but usually only once a week. Again echoing the situation in second-level schools, extra-curricular sport in the school and sport in clubs outside the school are more important than PE as outlets for physical activity among children. Team sports dominate the activities undertaken in the school – and here too, as in second-level schools, basketball is an important sport in the school but is much less prominent in the non-school context. Primary schools differ from second-level schools in the prominence of swimming and dance in the activities they undertake, both in the school and out of it (dance in this context presumably often means Irish dancing).
Primary schools seem to be worse off than second-level schools for sports facilities – they are more dependent on off-site facilities (except for basketball) and generally have access to a narrower range of facilities. Over 60 per cent of children in fifth and sixth class in primary school watch two hours or more of television per day. Of the factors in children’s lives that were measured in the data, parents’ participation in sport had a positive effect on children’s participation in sport. So too did participation in other extra-curricular activities
CONCLUSIONS AND POLICY IMPLICATIONS 85
such as music or singing classes, suggesting that the more active children tended to be more active across a number of domains. The level of sports facilities in school had a positive effect on sports participation in the school, while television viewing had a negative effect on sports participation outside the school.
7.1.3 OVERWEIGHT AND OBESITY
Among second-level students, 4.5 per cent of boys and 3.8 per cent of girls were found to be obese, and a further 15.4 per cent of boys and 16.6 per cent of girls were overweight. Taking these two categories together, approximately one in five second-level students was either obese or overweight. In fifth and sixth classes in primary schools, levels of obesity and overweight were of a broadly similar magnitude: 3.8 per cent of boys and 4.3 per cent of girls were obese, and a further 15.7 per cent of boys and 15.8 per cent of girls were overweight.
When we examined the relationships between measures of sports participation and physical activity on the one hand and body-mass on the other, we found no strong patterns of association. This is in keeping with the findings of research in other countries, where relationships in cross-sectional data between physical activity and risk of overweight or obesity have sometimes been found to be present and sometimes not, and when present, have usually been found to be weak. The lack of a robust relationship between physical inactivity and risk of obesity in research findings may arise either because measures of physical activity do not adequately capture real variations in energy expenditure or because variations in energy expenditure are too small to counteract the effects on weight of other factors, of which diet is likely to be the most important. There is some indication from our data that very high levels of exercise, well in excess of the minimum levels recommended by international authorities, may have an effect on body mass. This possibility has recently been raised in international discussion of the adequacy of existing recommendations regarding minimum levels of physical activity required to avoid weight gain, but we would need more refined measures than those available to us here to explore this question further.
The policy implications of these findings can be considered under
three headings: policy integration, delivery mechanisms, and objectives.
7.2 Policy
Implications
86 SCHOOL CHILDREN AND SPORT IN IRELAND
7.2.1 POLICY INTEGRATION
A key policy issue underlying this report is the relationship between education policy and sports policy in shaping children’s sport and physical development. This reflects a broader question about the proper role of traditional sport in PE. In that context, a central empirical finding of the present report concerns the balance of activity between the three pillars of children’s sport – PE in the school, extra-curricular sport in the school, and sport in clubs outside the school. Each of the latter two gives rise to more sport and physical activity for children than does PE, together they are just as effective as PE in including all children in physical activity, and all three pillars provide a similar, and rather narrow, range of sporting activities for children.
This situation poses a challenge for education policy: the area of sport and physical activity within the school to which it devotes most of its attention – the PE curriculum – is not the only, nor even the most important, generator of organised physical activity among children, either within the school or outside it. Within the school, extra-curricular sport is more important for children’s physical activity – but because it is extra-curricular and is provided independently by schools, it lies outside the purview of official education policy. In addition, there is the equally important realm of children’s sport in clubs outside the school. This arena is external to the education sector entirely even though schools often draw on it for access to facilities or other supports for children’s sport.
The present study offers no grounds for arguing that extra-curricular sport in schools should be brought within the ambit of official policy on PE, nor that the independence of schools in this area should be reduced. Yet the present lack of integrated thinking on PE and extra-curricular sport, and the consequent lack of an over-arching framework within which the two might be reflected upon and organised, is unhelpful. It forces education policy to work on the premise that PE is the key structured arena of school life in which children’s physical education and development takes place. It also inhibits education policy from developing a partnership with the world of extra-curricular sport, even though the latter is not only a major arena of structured physical activity for children in schools but also is often a major focus of the life of the school. The need to develop better integration between formal PE and extra-curricular sport in schools is a key challenge for education policy as far as children’s physical education and development are concerned. Such an integrated approach should respect the independence of schools in organising extra-curricular sport and should acknowledge the differences of character and function that distinguish PE and extra-curricular sport from each other. But it should also seek to develop synergies and complementarities between formal PE and extra-curricular sport, and thus enhance the potential for mutual support between the two that inheres in the wide range of activities and interests they share in common.
CONCLUSIONS AND POLICY IMPLICATIONS 87
The balance of activities between PE, extra-curricular sport and sport outside the school also creates challenges and opportunities for sports policy. The realm of children’s sport that is most central to its remit – sport in clubs outside the school – is just as prominent in children’s patterns of physical activity as are sport and PE within the school. In addition, sports policy has developed programmes that reach into the school, in support of both PE (for example, through the Buntús programme in primary schools) and of extra-curricular sport (for example, through the Youth Field Sports initiative, which, among other things, enables clubs in Gaelic games, soccer and rugby to enhance the assistance they give to schools). The breadth of reach now being achieved by sports policy creates an obligation on it to ensure that the arenas of children’s sport in which it is involved, including especially the very large arena of children’s sport in clubs outside the school, contribute to a holistic and genuinely developmental approach to children’s sport and physical activity. This, in effect, amounts to an obligation to take on board the best of insights and practices available from PE and the scientific research that backs it up, in a manner appropriate to the wide range of contexts in which children’s sport takes place outside the school. Sports policy is already conscious of this obligation and takes account of broad PE principles in its approach to children’s sport. However, the task of adapting these principles to make them suitable for the broad world of children’s sport in the community and disseminating them widely is an enormous one. A key challenge for sports policy is to further develop its understanding of what a holistic, developmental approach to children’s sport would entail, drawing on the knowledge available within PE, and to encourage and support those involved in children’s sport – especially those outside the school system – to adopt that knowledge and integrate it into their practice.
Looking at education policy and sports policy side-by-side, it is clear that education policy needs to become more aware of and involved with children’s sport outside of PE, while sports policy needs to adopt and adjust to the knowledge and insights of the PE approach. Extra-curricular sport in schools is at the intersection where the domains involved might meet. The challenges involved in the crossing of the boundaries between these domains are not easy. The PE and traditional sports approach represent two different worlds. PE is professional, has a strong pedagogical and scientific base, is increasingly represented in second-level schools by qualified PE teachers, and is formally integrated into the school curriculum. Sport outside the school for the most part is founded on amateur, loosely organised effort, usually structured around community-based clubs. It relies on the enthusiasm and commitment of armies of largely untrained volunteers, as well as of players, for its energy and impact (see Delaney and Fahey, 2005). The challenge of bringing PE and the traditional sports approach closer together, therefore, requires that the professionalism and formal expertise of PE on the one hand and the enthusiasm and drive of community-based sport on the other hand be brought into
88 SCHOOL CHILDREN AND SPORT IN IRELAND
mutual contact in such a way that both are enhanced and neither is harmed by the process.
7.2.2 DELIVERY MECHANISMS
These considerations make clear that the channels and agents through which sport is to be made available to children – the delivery mechanisms – are an important concern for policy. A useful way to think of these mechanisms is in terms of three key figures in the delivery system – the adult volunteer in community sport, the general teacher who runs extra-curricular sport in schools, and the trained PE teacher.
Adult volunteers who run children’s sport outside the school typically are non-professional enthusiasts whose motivation and drive are a valuable resource for children’s sport (many are parents of the children involved – Delaney and Fahey, 2005). Efforts to support or improve their practice have to be delivered with a light hand, since such efforts can run the risk of overburdening or demotivating a form of commitment that hitherto has operated without state intervention. For example, training for adult volunteers could be a useful support, but were it to become widely seen as a necessary part of volunteering, it could daunt potential volunteers and deter them from stepping forward. Much of the research and expert knowledge in the field of children’s sport has rightly focused on children’s needs and behaviour. The adult volunteer who runs children’s sport outside the school has received little attention and as a consequence his or her motivations, capacities and needs are little understood. This is undesirable, since it leaves policy in a position where it must seek certain outcomes for children’s sport while knowing little of a key agent through whom those outcomes must be delivered. The lack of research and understanding concerning the motivations, capacities, needs and resources of adult volunteers who are the foundation of children’s sport outside the school is an important gap in knowledge, and is one that sports policy should urgently seek to fill if it is to devise successful means to improve either the quality or the quantity of children’s participation in sport.
Alongside the adult volunteer in the world of non-school sport, a second key figure in delivery of children’s sport is the teacher who runs extra-curricular sport in the school. His or her role lies half way between the world of PE and that of non-school sport. It is a part of school programmes but is outside of the formal curriculum, it is structured according to school traditions but with a large element of the ad hoc and contingent, it may get some support from trained PE teachers but relies to a large extent on teachers who, as far as PE and sport are concerned, are non-professionals, it is a responsibility that by convention is often seen as part of the teacher’s job, but in fact is typically outside of their contracted duties and so depends on their goodwill and voluntary commitment. Despite the centrality of this role for children’s sport, neither education policy nor sports policy knows a great deal about how it functions or what its strengths and
CONCLUSIONS AND POLICY IMPLICATIONS 89
shortcomings are. This too is undesirable, since again it leaves policy – and in this instance both education policy and sports policy are involved – without a good understanding of a key instrument through which its objectives must be achieved. Extra-curricular sport in schools needs to be brought much closer to the centre of attention in research on children’s sport, and included in that is the need to investigate and better understand the circumstances and requirements of teachers of whom this arena of children’s sport depends.
The third key figure in the delivery of children’s sport is the PE teacher in the school. This teacher, in principle, should have professional training, either as a specialist in PE (the recommended situation in second-level schools) or, as is the case in primary schools, as a general class teacher with some training in PE, received either as part of basic training or through in-service courses. The PE teacher is important in part because he or she is the key frontline agent in delivering PE to children. In addition, as the main professional in the largely non-professional world of children’s sport, he or she is the main link into the body of professional knowledge and expertise that has built up in this area. The proportion of second-level schools with teachers qualified in PE has been rising in recent years, and according to our data is now nearly 80 per cent. The professional support base for PE teachers has also been strengthened, particularly through the training and research services for PE and coaching now available in the University of Limerick, along with parallel services in sports science in locations such as Dublin City University and University College Dublin. Given this extensive professional infrastructure, the importance of PE teachers rests not only on the services they can provide to students, but also in their potential to act as intermediaries between that infrastructure and the wider world of children’s sport. In order to enhance the delivery of children’s sport, both education policy and sports policy needs to maximise the benefits to be obtained from PE teachers, who represent a core of professional expertise in the largely non-professional world of children’s sport. It is therefore important to consider not only how they can be assisted in their work with children but also whether and in what ways they can serve as points of support and professional expertise for others involved with children’s sport, especially the other teachers who run extra-curricular sport.
In addition to the human resources for children’s sport discussed in the preceding paragraphs, questions also arise about capital resources – the facilities needed for children’s sport, of which, in the present context, we are especially concerned with facilities in schools. Discussion of this question is often unbalanced by a sole concern for buildings, pitches and equipment, and a consequent failure to pay attention to human resources. Nevertheless, while not necessarily the main problem, facilities are a real problem, and in particular would seem to be a real constraint in primary schools. There may be issues of scale in the many small primary schools in the country, where the small numbers of students
90 SCHOOL CHILDREN AND SPORT IN IRELAND
make it difficult to justify an adequate minimum range of facilities. In general, however, sports facilities in schools, and perhaps especially in primary schools, need to be improved, particularly in regard to facilities needed for indoor activities.
7.2.3 OBJECTIVES
Consideration of the delivery mechanisms and resources for children’s sport must be accompanied by reflection on what policy in this area should aim to achieve. Here there are three questions we can address: how much sport children should have, what the right mix of sports for children should be, and what role children’s sport should be expected to play in the fight against overweight and obesity among children.
There is a general perception that children are insufficiently active and that more sport for children is one way of addressing that problem. The findings of the present report do not contradict that view, since the measures of physical activity available in the data are not thorough enough to justify firm conclusions on this question. However, on the somewhat narrower question of how much sport children get, the findings suggest that for many children participation rates are quite high and may not justify being pushed any higher. At the same time, there are children who are on the margins of sport or who drift in that direction over time. They are likely to be left out of – or evade – timetabled PE, as well as extra-curricular sport or non-school sport. Among these are the minority of children who are completely uninterested in sport and never take part if they can avoid it. There are also those who are interested in sport but are not good at it, and suffer the indignity and discouragement of being left out of teams or games because they are seen as not being good enough – an experience that, as we saw earlier, causes more concern to students in second-level schools than any of the other possible negative aspects of sport we looked at. Finally there are those who once were interested in sport, or at least were willing to take part, but who lost interest and abandoned it as they grew older. The latter are more likely to be girls than boys and are more likely to be found in the later rather than the earlier years of the second-level cycle – by which stage they are likely to represent a sizeable minority of young people. Rather than aim to achieve a generic increase in the amount of sport for young people, a more useful approach would be to identify specific types and categories of non-participation, understand the experiences, orientations and preferences of the young people found in those categories, and design responses accordingly.
The leads us to the question about what the proper mix of sports for young people should be, since it is often suggested that one cause of non-participation in sport among young people is the lack of alternatives to traditional team sports such as football or basketball. There is also the concern that even those who take part in such sports with gusto while in school may drift away from them once they leave school or as they become busier and less fit in later
CONCLUSIONS AND POLICY IMPLICATIONS 91
life. The problem that has been identified in their case is that the habit of exercise and physical fitness that they received in school was too concentrated on sports that had little carry-over into adult life and that left them at a loss for alternatives when they became older. It is partly for such reasons that policy in this field has sought to promote a broader and more diverse set of activities in children’s sport and physical activity, as exemplified by the wide range of PE disciplines incorporated into the revised PE syllabuses in second-level schools.
This is an admirable development in PE. However, one should be cautious about how far it can be pushed, especially as far as extra-curricular sport and non-school sport are concerned. The evidence of our study is that many children – especially boys – love sport as it is provided at present. Many teachers are energised by it also, for it is out of their enthusiasm and goodwill that these sports are provided to so many students in an extra-curricular context. The same is true of the wider volunteer community outside the school, where the present range of sports provided is equally dependent on popular enthusiasm. Narrow as the present range of sports for children might be, they have the dominant position they occupy because they are popular, and are effective in evoking the passions of those who play and support them. These are strengths not be taken for granted, and not to be imagined as easy to replicate in other activities. The sports involved may have some effects in displacing activities that are more marginal and sedate, while also being more capable of being kept up in later life. Yet the dominant team sports also have very positive effects in evoking energy and commitment among young people, teachers and adult volunteers as they do. While it is desirable that children be introduced to as rich and diverse a range of physical activities as possible, it is important to appreciate the virtues of the traditional dominant sports as energisers of both young people and adults, and the difficulties likely to be faced by efforts to create similar virtues in other arenas of physical activity.
A final question to consider is the role of physical activity for young people as a means to combat the rising incidence of overweight and obesity both in childhood and as a carry-over into later adult life. The weight of expectation now being placed on sport and physical education as an instrument of this struggle is great. The common belief is that if children can be made to become more active, a major battle in the fight against overweight will be won. This is not an issue on which the findings of this study can throw much light, since its investigation of overweight and obesity was not designed to test causal models. But international research on this question, which was briefly outlined in Chapter 1, suggests that the reality is more complex, not to say more discouraging. Physical activity and excess weight have not been found to be strongly and consistently linked to each other, and increases in physical activity have not consistently led to stabilisation, much less reduction, in weight gain. While the reasons for this are not clear, one possibility is that the intake of energy dense food has increased by so much
92 SCHOOL CHILDREN AND SPORT IN IRELAND
among at-risk population groups that variance in physical activity is of modest significance by comparison. In any event, uncertainty on these matters does not imply that the value of physical activity for health should be questioned. Rather, it is to say that its significance for one particular health problem – overweight and obesity – may not be as great as is widely believed. The implication is that while physical activity among children should continue to be strongly promoted as an important contributor to their general health and wellbeing, expectations about what it can achieve in the fight against overweight should be tempered by caution, given the limits to what had been achieved and understood in this area in other countries. Policy should therefore maintain a broad perspective on children’s physical activity and should not become overly focused on its relationship with body mass.
93
REFERENCES
ANDERSON, P., K. BUTCHER and P. LEVINE, 2002. “Maternal employment and overweight children,” NBER Working Paper w8770, New York: NBER.
BOREHAM, C. and C. RIDDOCH, 2001. “The physical activity, health and fitness of children”, Journal of Sports Science, Vol. 19, No. 1, pp. 915-929.
CASPERSEN, C.J., M.A. PEREIRA, K.M. CURRAN, 2000. “Changes in physical activity patterns in the United States, by sex and cross-sectional age”, Medicine & Science in Sports & Exercise, Vol. 32, No.9, pp. 1601-1609.
CAWLEY, J., C. MEYERHOEFER and D. NEWHOUSE, 2005. “The Impact of State Physical Education Requirements on Youth Physical Activity and Overweight,” NBER Working Paper w11411. New York: National Bureau of Economic Research.
COLE, T.J., J.V. FREEMAN and M.A. PREECE, 1995. “Body Mass Index reference curves for the UK 1990.”Archives of Disease in Childhood, Vol. 73, No. 1, pp. 25-29.
COLE, T.J., M.C. BELLIZZI and K.M. FLEGAL, 2000. “Establishing a standard definition for child overweight and obesity worldwide,” International Survey. British Medical Journal, Vol. 320, pp. 1-6.
COOK, S., M. WEITZMAN, P. AUINGER, M. NGUYEN, W.H. DIETZ, 2003. “Prevalence of a metabolic syndrome phenotype in adolescents: Findings from the Third National Health and Nutrition Examination Survey 1988-1994”, Archive of Paedriatric and Adolescents Medicine, Vol. 157, pp. 821-827.
CURRIE, C., K. HURRELMANN, W. SETTERTOBULTE, R. SMITH, J. TODD (eds.), 2000. Health and Health Behaviour among Young People. Copenhagen: WHO Regional Office for Europe.
DALE, D., C. CORBIN and K. DALE, 2000. “Restructuring opportunities to be active during school time: do children compensate by increasing physical activity levels after school,” Research Quarterly For Exercise and Sport, Vol. 71, No. 3, pp. 240-248.
DELANEY, L. and T. FAHEY, 2005. Social and Economic Value of Sport in Ireland. Dublin: Economic and Social Research Institute.
DEPARTMENT OF EDUCATION AND SCIENCE, 2003. Junior Cycle: Physical Education. Dublin: Department of Education and Science.
DEPARTMENT OF HEALTH AND HUMAN SERVICES, 2001. The Surgeon General’s Call to Action to Prevent and Decrease Obesity and Overweight. Rockville, MD.: Office of the Surgeon General.
FAHEY, T., R. LAYTE and B. GANNON, 2004. Sports Participation and Health Among Adults in Ireland. Dublin: Economic and Social Research Institute.
FAIRCLOUGH, S, G. STRATTON and G. BALDWIN, 2002. “The contribution of secondary school physical education to lifetime physical activity”, European Physical Education Review, Vol. 8, pp. 69-84.
FOGELHOLM, M. and K. KUKKONEN-HARJULA, 2000. “Does physical activity prevent weight gain – a systematic review”, Obesity Reviews, Vol. 1, pp. 95-111.
GOODMAN, E., G. SLAP and G. HUANG, 2003. “The public health impact of socioeconomic status on adolescent depression and obesity,” American Journal of Public Health, Vol. 93, No. 11, pp. 1844-1850.
94 SCHOOL CHILDREN AND SPORT IN IRELAND
HAM, S.A., M.M. YORE, J.E. FULTON and H.W. KOHL, 2004. “Prevalence of no leisure-time physical activity – 35 states and the District of Columbia, 1988-2002”, Centers for Disease Control, Morbidity and Mortality Weekly Report, Vol. 53, No. 04, pp. 82-86.
HICKMAN, M., C. ROBERTS and M. GASPER DE MATOS, 2000. “Exercise and leisure-time activities”, in C. Currie, K. Hurrelmann, W. Settertobulte, R. Smith, J. Todd (eds.), Health and Health Behaviour among Young People. pp. 65-72, Copenhagen: WHO Regional Office for Europe.
HURSON, M. and C. CORISH, 1997. “Evaluation of lifestyle, food consumption and nutrient intake among Irish teenagers”, Irish Journal of Medical Science, Vol. 166, No. 4, pp. 225-230.
IRISH SPORTS COUNCIL, 2003. Sport For Life: The Irish Sports Council’s Statement of Strategy 2003-2005. Dublin: Irish Sports Council.
KAHN, E., L.T. RAMSEY, R.C. BROWNSON, G.W. HEATH, E.H. HOWZE, K.E. POWELL, E.J. STONE, M.W. RAJAB, P. CORSO, 2002. “The effectiveness of interventions to increase physical activity: a systematic review.” American Journal of Preventative Medicine, Vol. 22, (4S), pp. 73-107.
KELLEHER, C., S. FRIEL, G. NOLAN and B. FORBES, 2002. “Effect of social variation on the Irish diet,” Proceedings of the Nutrition Society, Vol. 61, No. 4, pp. 527-536.
KELLEHER, C., S. NIC GABHAINN, H. CORRIGAN, S. FRIEL, J. SIXSMITH, E. DALY, M. GALVIN, L. DALY, M. LOYTA, 2003. The National Health and Lifestyle Surveys 2003. Regional Results of the National Health and Lifestyle Surveys SLÁN (Survey of Lifestyle, Attitudes and Nutrition) & HBSC (Health Behaviour in School Aged Children). Dublin: Health Promotion Unit.
KELLY, L.A., J.J. REILLY, S. GRANT, J.Y. PATTON, 2005. “Low physical activity levels and high levels of sedentary behaviour are characteristic of rural Irish primary school children.” Irish Medical Journal, Vol. 98, No. 5, pp. 138-41.
KOPLAN, J.P, C.T. LIVERMAN and V.I. KRAAK (eds.), 2005. Preventing Childhood Obesity. Health in the Balance. Committee on Prevention of Obesity in Children and Youth, Institute of Medicine of the National Academies. Washington: National Academies Press.
KUCZMARSKI, R.J., C.L. OGDEN, S.S. GUO et al., 2002. “CDC growth charts for the United States: Methods and development” National Center for Health Statistics. Vital and Health Statistics, Vol. 11 (246).
LIVINGSTONE, B., 2000. “Epidemiology of childhood obesity in Europe”, European Journal of Pediatrics, Vol. 159, No. 13.
LYNCH, K., 1989. The Hidden Curriculum. Reproduction in education: an appraisal. Sussex: Falmer Press.
LYNCH, K. and A. LODGE, 2002. Equality and Power in Schools. Redistribution, recognition and representation. London and New York: Routledge Falmer.
MULVIHILL C., A. NEMETH and A. VEREECKEN, 2004. “Body image, weight control and body weight” in C. Currie, C. Roberts, A. Morgan et al. (eds.), Young people’s health in context. Health Behaviour in School-aged Children (HBSC) study: international report from the 2001/2002 survey. Copenhagen: WHO Regional Office for Europe (Health Policy for Children and Adolescents, No. 4, pp.120-129).
MacPHAIL, A. and J. HALBERT, 2005. “The implementation of a revised physical education syllabus in Ireland: circumstances, rewards and costs”, European Physical Education Review, Vol. 11, pp. 287 - 308.
REFERENCES 95
MOLNAR, D. and B. LIVINGSTONE, 2000. “Physical activity in relation to overweight and
obesity in children and adolescents”, European Journal of Pediatrics, Vol. 159, Suppl 1: S45-S55.
NASPE (National Association for Sport and Physical Activity) 2004. Physical Activity for Children. A statement of guidelines for children ages 5-12. Reston, VA: NAPSE Publications.
NATIONAL TASKFORCE ON OBESITY, 2005. Obesity. The Policy Challenges. The Report of the National Taskforce on Obesity. Dublin: Department of Health and Children.
Ní MHUIRCHEARTAIGH, J., 1999. Participation in Sport and Physical Activities Among Secondary School Students. Department of Public Health, Western Health Board. Galway: Western Health. Board.
PATE R.R., P.S. FREEDSON, J.F. SALLIS, W.C. TAYLOR, J. SIRARD, S.G. TROST, M. DOWDA, 2002. “Compliance with physical activity guidelines: prevalence in a population of children and youth”, Annals of Epidemiology, Vol. 12, No. 5, pp. 303-308.
PRESIDENT’S COUNCIL ON PHYSICAL FITNESS AND SPORT, 2004. “Physical activity for children: current patterns and guidelines” Research Digest 5 (2).
RENNIE, K.L. and N.J. WAREHAM, 1998. “The validation of physical activity instruments for measuring energy expenditure”, Public Health Nutrition 1, pp. 265-271.
RIDDOCH C.J., L. BO ANDERSEN, N. WEDDERKOPP, M. HARRO, L. KLASSON-HEGGEBO, L.B. SARDINHA, A.R. COOPER, U. EKELUND, 2004. “Physical activity levels and patterns of 9- and 15-yr-old European children”, Medicine & Science in Sports & Exercise, Vol. 36, No. 1, pp.86-92.
SALLIS, J.F., 2000. “Age-related decline in physical activity: a synthesis of human and animal studies”, Medicine & Science in Sports & Exercise, Vol. 32, No. 9, p. 5.
SARIS, W.H., S.N. BLAIR, M.A. VAN BAAK, S.B. EATON et al., 2003. “How much physical activity is enough to prevent unhealthy weight gain? Outcome of the IASO 1st Stock Conference and consensus statement” Obesity Review, Vol. 4, No. 2, pp. 101-14.
SMYTH, E., D. BYRNE and C. HANNAN, 2004. The Transition Year Programme. An Assessment. Dublin: Liffey Press in association with The Economic and Social Research Institute.
SPROSTON, K. and P. PRIMATESTA, (eds.), 2003. Health Survey for England 2002: volume 1: the health of children and young people, London: The Stationery Office.
STRAUSS R.S. and J. KNIGHT, 1999. “Influence of the home environment on the development of obesity in children.” Pediatrics, Vol. 103, No. 6.
STURM, R., 2005. “Childhood obesity – what we can learn from existing data on societal trends, part 1”. Preventing Chronic Disease [serial online]: available from www.cdc.gov/ped/issues/2004/jan/04_0038.htm.
TROST S.G., R.R. PATE, J.F. SALLIS, P.S. FREEDSON, W.C. TAYLOR, M. DOWDA, J. SIRARD, 2002. “Age and gender differences in objectively measured physical activity in youth”, Medicine & Science in Sports & Exercise, Vol. 34, No. 2. pp. 350-355.
VAN COEVERING, P., L. HARNACK, K. SCHMITZ, J.E. FULTON, D.A. GALUSKA, S. GAO, 2005. “Feasibility of using accelerometers to measure physical activity in young adolescents”, Medicine & Science in Sports & Exercise, Vo. 37, No. 5, pp. 867-871.
WAREHAM, N.J., R.W. JAKES, K.L RENNIE, J. MITCHELL, S. HENNINGS and N.E. DAY, 2002. “Validity and repeatability of the EPIC-Norfolk Physical Activity Questionnaire”, International Journal of Epidemiology, Vol. 31, pp. 168-174.
96 SCHOOL CHILDREN AND SPORT IN IRELAND
WAREHAM, N.J., E. M. F. VAN SLUIJS and U. EKELUND, 2005. “Physical activity and obesity prevention: a review of the current evidence”, Proceedings of the Nutrition Society, Vol. 64, pp. 229-247.
WOODS, C., E. FOLEY, D. O’GORMAN, J. KEARNEY and N. MOYNA, 2004. The Take PART Study: Physical Activity Research for Teenagers. A Report for the East Coast Area Health Board by the Centre for Sport Science and Health, Dublin City University.
97
APPENDIX 1: DETAILS OF SAMPLES
Primary and second-level schools were sampled from the national lists of schools maintained by the Department of Education and Science. The sample for national schools was pre-stratified by county, but otherwise was selected on a random basis. Second-level schools were pre-stratified by region, school type, size and gender mix.
A1.1 Sampling
Method
A total of 162 primary schools were approached, 137 of which participated in the survey – the other 25 refused to participate or did not participate when it came to fieldwork stage. The degree to which the sample is representative in terms of school size can be seen from Table 1 below, which shows that the distribution of the sample by school matches that of all primary schools in each bracket in the population.
A1.2 Primary School
Sample
Table 1: Primary School Sample: Comparison of Size of School (Number of Students) in the Sample with the Population
All National Primary Schools
Sample
% % Number Less than 50 23 24 33 50-99 31 26 36 100-199 24 25 34 200-299 12 14 19 300-499 7 7 10 500 & Over 2 4 5 Total 100 100 137
Source: Department of Education Annual Statistical Report (2004). The data for all schools relate to 2003. Sample data relate to 2004.
Table 2 shows that the sample is representative with respect to
gender. Table 2: Primary School Sample: Gender of Pupils
Number Per Cent Boys 1,937 51
Girls 1,874 49
Total 3,833 100
98 SCHOOL CHILDREN AND SPORT IN IRELAND
Table 3 displays the distribution of the sample between the different school classes. Although the target population consisted of pupils from fifth and sixth class only, pupils from third or fourth class were present in the same classroom in some of the schools during the class period when data were collected. For convenience, those children were allowed to take part in the survey and were subsequently excluded from the analysis. Table 3: Primary School Sample: Distribution by School Class
Number Per Cent 3rd class 54 1
4th class 66 2
5th class 1,944 51
6th class 1,748 46
Total 3,833 100
Principals from the sampled schools were also asked to complete questionnaires or nominate a deputy to do so. Table 4 shows that in 99 per cent of cases, the questionnaires were completed by the school principal. Table 4: Primary School Sample: Job Title of Respondent
Number Per Cent Principal 128 93
Assistant principal 3 2
Other 5 4
Total 136 99
Don’t know 1 1
137 100 A total of 97 second-level schools were approached, 80 of whom participated in the survey – the other 17 either refused to participate or did not participate when it came to it. The sample focuses on students from second year to sixth year (see Section 1.4 ‘Data’, in Chapter 1). In cases where first year students were present in the same classroom with sampled students, they were invited to complete questionnaires and subsequently were excluded from the analysis.
A1.3 Second-Level
School Sample
Table 5: Second-Level Sample: Gender of Students
Number Per Cent Missing 31 1
Boys 1,839 52
Girls 1,688 47
Total 3,558 100
APPENDIX 1 99
Table 6: Second-Level Sample: Distribution of Students by Year
Number Per Cent Missing 27 1
1st year 113 3
2nd year 903 25
3rd year 740 21
Transition year 496 14
5th year 859 24
6th year 420 12
Total 3558 100
The degree to which the sample is representative by the size distribution of school and the type of school can be seen in Table 7 and Table 8 respectively, which show that the sample matches the population closely along these dimensions. Table 7: Second-Level Sample: Comparison of Size of School in the
Sample with the Population
Sample
All Second-Level Schools
% Number %
Under 100 4 4 5 100 and under 200 10 10 13 200 and under 300 14 14 18 300 and under 400 18 5 6 400 and under 500 14 14 18 500 and under 600 13 13 16 600 and under 700 12 9 11 700 and under 800 6 6 8 800+ 8 5 6 Total 100 80 100
Source: Department of Education Annual Statistical Report (2004). The data for all schools relate to 2003. Sample data relate to 2004.
Table 8: Second-Level Sample: Comparison of School Type in the
Sample with the Population
All Second-Level Schools
Sample
% Number % Comprehensive school 2 2 3 VEC 33 32 40 Community school 10 7 9 Voluntary secondary school 55 38 48 Other 1 1 Total 100 80 100 Source: Department of Education Annual Statistical Report (2004). The data for all
schools relate to 2003. Sample data relate to 2004.
100
APPENDIX 2: COMMENTS FROM SCHOOL PRINCIPALS ON SPORTS
In completing the survey questionnaires, school principals were invited to add any comments they wished, especially in connection with the questions on sports facilities. A selection of the comments they provided is set out below, first from primary principals (whose comments on facilities were more extensive) and then from second-level principals.
A. Primary School Principals.
The provision of a P.E. Hall is greatly needed. There is a huge interest in sports activities in this rural area. It is paramount that we get a sports hall attached to the school to facilitate the needs of the community. We have made a request to the D. of Ed for same supported by the community council The importance of competitive and recreational sports is vital to the well-being and good health of children. The facilities available to schools are inadequate as is the training available to teachers. Greater emphasis on PE, increased time allocated While we place a lot of emphasis on sport in the school and have a certain amount of sports equipment, we are lacking (big time) on indoor facilities (sports hall/changing-storage facilities) When the weather is dry we do well, (basketball/volleyball court, use of GAA pitch - attached to school), mini games drawn on yard. In wet weather the hall is too small, the ceiling too low I'm hoping to do some work on the playing field (draining, re-seeding) with the help of a Clar programme. Badly in need of PE room. There is a big emphasis on sport in this school. However, we are a highly disadvantaged area and provisions for sport activities are very limited. Not adequate. Should have advisors in the different areas Every school should have a Gym and proper equipment. Indoor facilities necessary equipment for small children Sports facilities are fairly adequate, but more is always appreciated. Because of a recent refurbishment programme, our indoor facilities are good. However, with limited space, our outdoor activities are limited. Our school is overcrowded yard much too small, uneven surface. Small field is accessed by steep slope which is dangerous in damp weather. Local pitch is a distance from school and involves crossing a busy road. No assembly area, hall suitable for PE.
101
Children have to travel up to 10 miles to avail of facilities belonging to local clubs. We greatly appreciate the help we get from our school's PARENT'S ASSOCIATION in providing and maintaining our sports grounds (field adjacent to school) We are very open to having coaches in any sports, especially basketball! We firmly believe that we should have a sports hall and showers in the school This school has c.600 pupils - yet we have no gym. Participation in sport/activity is very much dependant on weather. The GP room has classes in it which rules out other uses. We have reasonably good facilities, with our own pitch. Most children take part in various sports. Unfortunately over 90% come to school by car. Equipment we received last year from "Buntus Sport" was hugely beneficial to the school Lack of funding makes it nearly impossible to purchase equipment in order to provide an adequate P.E. programme. We have no school hall - no equipment, very little funding. If facilities are not provided & funding we will have a big percentage of obese children in this country We would love to have more sports facilities in our school but, unfortunately, we are very limited with space. Children are well provided for with the help of outside coaches for hockey, tennis, rugby, swimming and general P.E. We are interested in sports. However, the D of Ed informed us to use our Sports hall as a classroom to facilitate educating an extra class from the travelling community. Policy needs to be reviewed so that facilities are not lost due to increase in numbers. Much greater input needed from Local Clubs (e.g. GAA). All schools need a GP Room/Hall in order to provide revised Primary P.E. Curriculum. Considering the appalling lack of facilities, I believe the children in this school are introduced and participate in a good range of sporting activities Ours is a mixed school and I feel that the girls in particular could do with improved facilities, especially dressing rooms, gymnastics and athletics. We have no indoor facilities. We use the yard. If it's wet we have to stay inside and PE is not used. The teachers do their best with what we have. Funding!!! P.E. Hall an necessity. No indoor facilities during inclement weather - which can be most of the school year. Part of rural community which funded a sports hall for the school without any help from D of Ed. It is of tremendous benefit to us but there is a lack of equipment due to lack of funding. Teachers are active in the community, GAA and water sports also. No indoor facilities and no storage for equipment. No access to swimming facilities. PE grant not received in number of years. Participated in Buntus- wonderful initiative. Parents association provide supervised activities during the summer. We have absolutely no facilities to teach P.E. at all - School located on a hill, small, sloping playground. Fundraising for same, however, the cost of same is over €100,000 Severe lack of facilities Our school needs its own indoor P.E. Room, especially taking into account our numbers, and weather conditions We need a "hall" or "General Purposes" room so that PE can be taught and, for indoor activities. We have a fine football pitch but the lack of a "hall" limits the PE activities We are fortunate to have a good pitch and basketball court in the school. With multi-classes it's difficult to find adequate time with busy curriculum. Lockers & showers would be difficult to manage in mixed junior school where children need help! We would love to improve our school hall- enlarge it and improve the heating but it is a preserved building so it is impossible. The Dept will not give us a new hall. Saving to purchase land to extend school-struggling to raise money needed that should be available under CPO schedule. Our hall has been used as a classroom since it was built. Teacher enthusiasm curbed by litigious attitude of general public militants
102
Playing space is limited in our school at the moment but, we hope to acquire more land. The cost of hiring buses to bring children to inter-schools competitions is prohibitive - parents not available during the day. Grassy area for field games too limited, lacking tarmac area for basketball, tennis etc. P.E. is totally dependant on the weather as no indoor play area available As an inner-city school the nearest grass pitch is 30mins away. We have no showering/changing facilities. This year we cut back on PE activities (swimming and Judo) because of time restraints and cost of pool hire. More sporting facilities in the area and, more equipment necessary for the schools and outside coaches Sports facilities are satisfactory but, are all hard core areas. The school has no playing pitches which is a distinct disadvantage Dressing rooms not available. Help received from parents Total lack of facilities We have no room for indoor P.E. in the school - gymnastics is not a realistic option. Dept. of Ed. needs to Grant Aid Aquatics. More equipment would always be welcome. No grassy area in school. Park 15 mins. walk away - very busy roads. Poor facilities in school. No money to improve. Teachers use school yard mainly - soccer, Gaelic, running etc. We have no indoor facilities. P.E. activities are weather dependant Need for a lot more parental participation. More funding needed for purchase of equipment. The issue of transportation of school teams i.e. parents with cars/private hire & cost etc., need to be looked at. Our school is overdue for refurbishment. The sports facilities are all outdoor - These amount to 1 basketball court and a hurling pitch which is half the size of the standard pitch - no land available to extend!!! We have no gym hall so, during the winter months very little P.E. is done As well as time-tabled classes sports activities are organised during lunch break. New school being built. Equipment & resources a constant problem - Funding, replacing, storage etc. Source & fund outside expertise where possible. Until funding is made available to provide proper, safe facilities for Primary Schools, the delivery of sport through schools will remain unattainable. While we are delighted to have the help and generous co-operation of the local GAA club, every school needs to have in-house P.E. facilities. During bad weather we can't walk the children to the GAA club and they miss PE class. Storage space needed Ideally, the school needs a purpose built room for P.E., along with enough equipment to cater for all tastes and needs. Equipment is lacking in delivering Curriculum - grants needed here. School facilities and safety issues i.e. gymnastics - need courses for teaching staff. Some do not feel qualified to teach some areas of the curriculum Swimming in Fermoy every Sept/Oct. Horse riding a large part of children's lives. Local squash court built but too far away to be used by the school. Good local GAA, however numbers falling. We failed to get a grant from Dept. of Ed. & Science to replace 50 year old cracked concrete playground. So, having a P.E. Hall or General Purposes room which we are applying for anyway seems light years away. Sports/activities are weather dependant. We have no hall. The football area becomes water-logged quite often We have a small school - no P.E. Hall or General Purpose Room. Children involved in a lot of Gaelic and, more recently, basketball. It is essential that a PE teacher is employed in each school to implement PE curriculum. Swimming is part of the curriculum and although we have booked a pool for 2005 how will
103
we adequately supervise in accordance to Child protection laws etc. We have no school hall which makes sport during the winter difficult to provide. Only one teacher is interested in coaching teams, entering competitions etc. This limits school's involvement in sports Cost of equipment - Difficulty of storage. Difficulty in every teacher having to be an expert in all fields, including P.E. Access to hurling pitches during school hours is a problem as they are too far away. Our own pitch is only 50m long. At present awaiting school extension so no PE hall for the last 5 years as it is used as a classroom. Despite lacking facilities we promote a wide choice of PE and the Buntus programme and are linked to the local GAA and yacht club. Don't have facilities All sport in the school is weather dependant. Swimming is expensive because of bus hire and pool hire. We need indoor facilities to provide a proper P.E. programme. Indoor facilities are non existent Lack of proper facilities at school means sporting activities are limited, particularly in inclement weather. Overloaded curriculum tends to push sporting activities down the order of priorities Without a multi-purpose room it is impossible to implement any of the activities that would be extremely beneficial - gymnastics, dance, indoor games - even wet day play areas Every school in the country should have a sports field. I am interested in sport but have no facilities to develop that interest Waiting for new P.E. Hall €80,000 spent on fees and planning etc. Work was due to start 3 years ago but, no work carried out to date. We are very happy with the sports facilities and fitness carried out by the pupils The school could do with more sports facilities, and more equipment Inadequate facilities - No P.E. Hall or storage space for equipment. School curriculum overloaded. Provision of a coach for all schools would help, especially schools with multi-classes. Totally inadequate space. Balls go onto a busy road when playing field sports. The playing facilities are far too small. We have absolutely no indoor facility for exercise. Sports Hall required urgently On site facilities are vital to running a proper PE/Sports programme. Time & expense in travelling to facilities too great. Our school spends almost €10k p.a. (fund raised) towards sports equipment and extra tuition/coaching. DES should provide Cannot realistically do PE without indoor PE facilities. Do as much PE as possible and encourage participation in sport despite lack of facilities. Huge need for proper coaching in hurling, Gaelic, football, rugby etc. Teachers are 'jack of all trades'. For 95 pupils the sports facilities in our school are not adequate. During the winter months P.E. is out of the question. We need an indoor facility for P.E. Also need a grant for proper equipment. We play a lot of sports but facilities are totally inadequate. Very dependant on weather conditions throughout the year. Should have proper funding to facilitate swimming, adventure activities etc. Basic playing surface - hard surface areas totally inadequate and unsafe, not to mention total lack of indoor sports area. Have been looking for proper General Purposes Room/Hall for 11 years!! Every school should have a full-time qualified PE teacher and a fully operational gym. Additional money from DES is required to entice more pupils to become active.
104
Because of an all female staff, more facilities and trainers would be helpful, paid for by the Department. Sports facilities are totally inadequate as we are weather dependant and the GAA pitch is too far from the school. The school hall is now like a big classroom as extra resource teacher facilities having to be made available. There is no sports hall. Although staff try to implement PE curriculum, it is difficult as we do not have an indoor gym or multi-purpose room. Grassy playground is also weather dependant and tarmac area is in need of resurfacing which D. of Ed will not grant. Lack of indoor sports area make us over dependant on weather conditions Because the hall roof is too low, sports like volleyball and badminton cannot be played We are very lucky to have great support our local GAA clubs and, also, a shared project for playing fields with our neighbours, Beaumont Hospital Sports facilities totally inadequate for 150 pupils We are very sports & games conscious - pupils, teachers and parents. Make the best possible use of what facilities we have at present. Look forward to major facilities in new school Hall in school too small for proper PE class. Very little grassed area around school so, we have to travel for proper training of teams. We hire Community Centre on Wednesday afternoons during winter, Each class only has access every 4/5 weeks though Would love to have a proper Sports Hall on the School campus that would have a multi-purpose function. Board of Mgmt very determined to address this issue. Revised Primary PE Curriculum can't be fully implemented without facilities. Most of our facilities and equipment are the result of local initiative. The present level of funding for sport from the D.E.S. is totally inadequate We have a general purpose room but it is too small to have any worthwhile sports activity in it. We also have a very small playing pitch which is too small to cater for our two main sports activities - hurling and football. We need funds to develop a site at the rear of the school for playground facility Due to small numbers and gender balance it is difficult to provide teams for competitions but we hope to take part in a Gaelic 7-a-side next year. More department money needed for equipment - more in-service training for teachers. Outdoor sports and field games are well catered for in our school. We have applied to the Dept. of Ed. & Science to have a PE Hall in the school for the past five years but, with no success to date. Lack of facilities makes PE irregular in winter B: Second-level School Principals
We are due to lose both soccer and all weather hockey pitches due to the school grounds being sold for development. As a result we will be reduced to much smaller outdoor playing area. Need funding to pay coaches after school hours. We have been granted a PE hall by D Ed 6 years ago but no sign of it being built yet Difficult anymore to get teachers involved in some sports activities There is a need for a PE teacher, ex-quota, for our school. We need further injection of funds to resource new PE course at Junior Cert level. Getting rugby coaches is presenting a problem. Lack of sports grounds is a big drawback to getting more involved. The sports staff have made a big push over the last 3 years to improve participation in Junior cycle. A fully equipped sport hall with shower facilities is seriously lacking for our school community There is a very good interest among a large percentage of students. Our outdoor facilities
105
have be curtailed because we are a centre city school with very limited space. Our teachers and coaches do very well in spite of all this. To compete with other schoool we need an outdoor astroturf facility. We desperately need indoor dedicated facilities - our hall doubles as a canteen on a daily basis. Sport in our school completion programme. We have no sports hall- an extension is on line that includes one. We rent the complex in Killorglin for basketball. We are too far from our sports grounds. We need sports areas much closer to the school. Cost of providing these is prohibitive in a large urban area. Sport is very important in our school. Our facilities are very poor to say the least. We do not have basic changing rooms. Despite this, our boys do us proud in all competitions in the different codes. As sports hall was involved in the original plan for the school to be built by the Dept of Ed. That was in a letter from the dept dated 1969. We still await it. We need a minimum per capita grant dedicated to sports. Timetacle is academically overloaded and with students doing seven subjects in leaving cert this is not set to change in immediate future his is a very valuable experience Facilities are virtually non existent. Being an old established school we have good pitches etc. but our gymnasium is badly in need of an upgrade. Facilities improving (new gym currently being built), lack of money for sports/PE from Dept of Education. The lack of availability of teachers/supervisory staff for after school activities. We do not have any sports facilities in school but we hire sports complex during school year. We also have access to GAA and rugby pitches in town. We concentrate on indoor sports since we do not have outdoor pitches. We have as excellent gym and our PE teacher offers a varied PE programme. Lack of pitches e.g. gaelic football and hockey is a huge disadvantage. We provide a wide range of sporting activities for our students and we do not have a sports hall. The hire of the local sports hall is prohibitively expensive. We urgently need a full-sized sports hall Facilities are excellent for boys while very poor for the girls- none. We need a full size Sports hall and changing facilities No sports hall. The school is fortunate to have the services of two very hardworking and enthusiastic PE teachers who co-ordinate the subject and also a number of voluntary teachers who take after school sports training. Facilities in the school for sports are inadequate. However, at the moment a soccer pitch is in the process of development in conjunction with a local soccer club- on the school grounds. Pupils are very interested in PE. We badly need a gym! Increased teacher allocations required. This must be ex-quota. We urgently need outdoor facilities- pitches and playing area (grass or all-weather). We look forward to a much improved situation with our new building. We have no facilities at all hence we cannot offer PE to our students I am happy with the sports/facilities in our school, however, it is the same students that take part in all the sports. There is a lack of interest in sport from girls in particular. Equipment needs to be updated every year but generally this school is very well served in the sports area. Serious lack of playing fields. Indoor sports hall.
106
I have grave concerns about the diet and fitness of our students. Our sports facilities are inadequate bordering on non-existent. One small GAA pitch with no changing facility is totally inappropriate for the range of sports we attempt to introduce. Despite asking for a sports hall over the last 23 years, it has never been built. We have been waiting for 15 years for a sports hall but we still haven't got it. Could do with more facilities Lack of sports facilities or lack of access to adequate facilities due to rural location is an insurmountable problem. Transition year introduced for the first time this year. They have a block of 3 classes for leisure and recreation- very popular. In need of refurbishment (dressing rooms). Wooden floor would be far safer and avoid injuries. Lack of funds to pay coaches from outside in absence of a teacher not having the specialist knowledge required. PE should be embedded fully in the curriculum at JC/LC. 'Credits' should apply. Team sports should be supported by ex-quota staff and coaches. Sport is totally underfunded and understructured in Irish education. The bulk of funding for our sports/PE facilities was provided through school fundraising over the past 33 years, not by the Dept. of Ed. & Sc. or any other source. Awaiting the go-ahead for the construction of a new school. New school built in 1999. No provision of pitches/dressing room. Failed to get funding from D.E.S. lottery, EU sport in ed to date E240K all fundraised purchase and E100K. Dressing rooms- hope to build over next 2 years depending on funding. Have a full time PE teacher. Have more time to do sports. Have the D Ed give more capital towards sports. It is getting very difficult to attract teachers to participate in extra curricular activities (ie. sport) without remuneration of some kind.