Page 1
THE STATE EDUCATION DEPARTMENT THE UNIVERSITY OF THE STATE OF NEW YORK ALBANY, NY 12234
School District: UNION FREE SCHOOL DISTRICT #24 VALLEY STREAM, NY
BEDS Code: 28-02-24-02-0000
Address: 75 Horton Avenue, Valley Stream, NY 11581
Contact Person: Don Sturz, Ph.D.
(name & title) Superintendent of Schools
Telephone: 516-434-2830 Fax Number: 516-256-0163
E-Mail Address: [email protected]
* Plan Start Date: July 1, 2016 Plan End Date: June 30, 2019
* Plans should be for 3 years beginning on September 1.
Page 2
2
School District: Valley Stream UFSD #24
BEDS Code: 28-02-24-02-0000
PLANS INCLUDED IN THIS CDEP
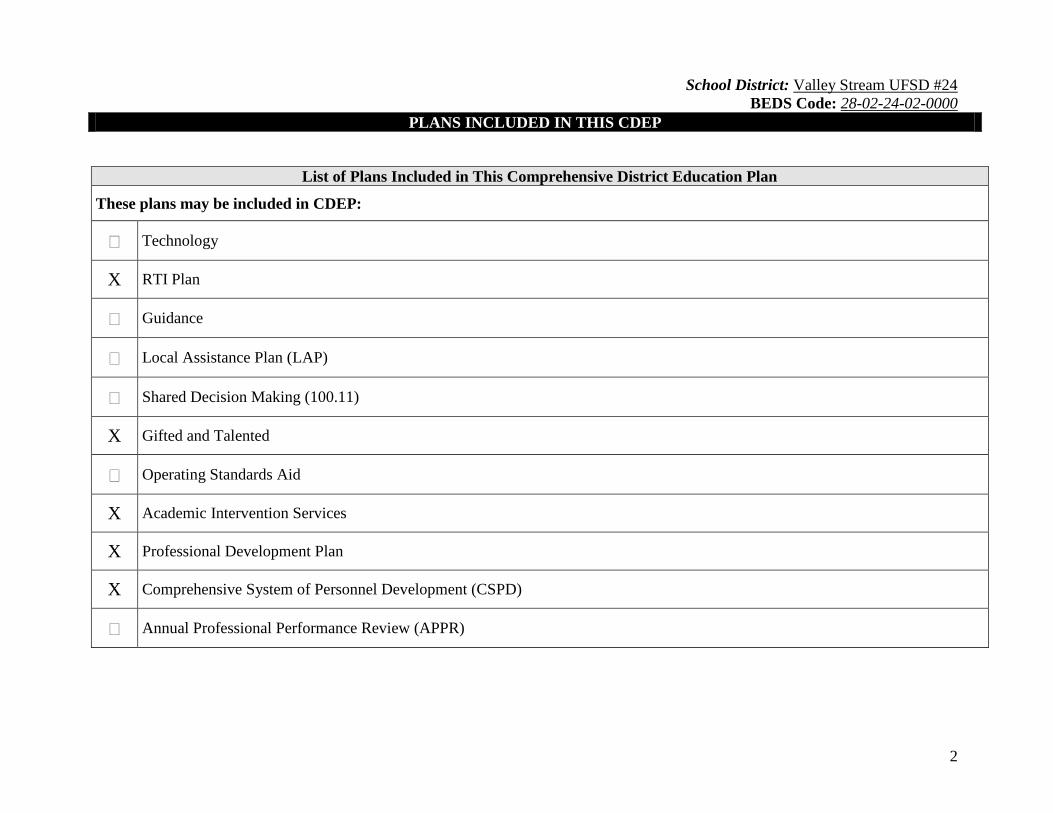
List of Plans Included in This Comprehensive District Education Plan
These plans may be included in CDEP:
Technology
X RTI Plan
Guidance
Local Assistance Plan (LAP)
Shared Decision Making (100.11)
X Gifted and Talented
Operating Standards Aid
X Academic Intervention Services
X Professional Development Plan
X Comprehensive System of Personnel Development (CSPD)
Annual Professional Performance Review (APPR)
Page 3
3
School District: Valley Stream UFSD #24
BEDS Code: 28-02-24-02-0000
ADDITIONAL INFORMATION FOR PLANS INCLUDED IN THIS CDEP
Opportunities are provided for certified teachers, provisional teachers, teaching assistants and substitute teachers who work on a long
term basis to participate in the professional development program of the district.
Opportunities are provided for staff to maintain professional certificates in good standing based upon successfully completing 100
hours of professional development every five years. This professional development will include full and half day workshops, approved
external professional development opportunities such as college courses or conferences, or internal professional development
opportunities such as during school or after school in-service. Principals can use the time for the observations toward their CTLE
hours (100 hours for Professional Development) observing ELA, math and other curricular areas.
Mentoring program is provided according to collective bargaining obligations. The following criteria are included: Procedures for
selection of mentors, role of the mentors, preparation of mentors, time allotted for mentoring, and mentoring activities.
Page 4
4
School District: Valley Stream UFSD #24
BEDS Code: 28-02-24-02-0000
SECTION I: BACKGROUND / DEMOGRAPHICS
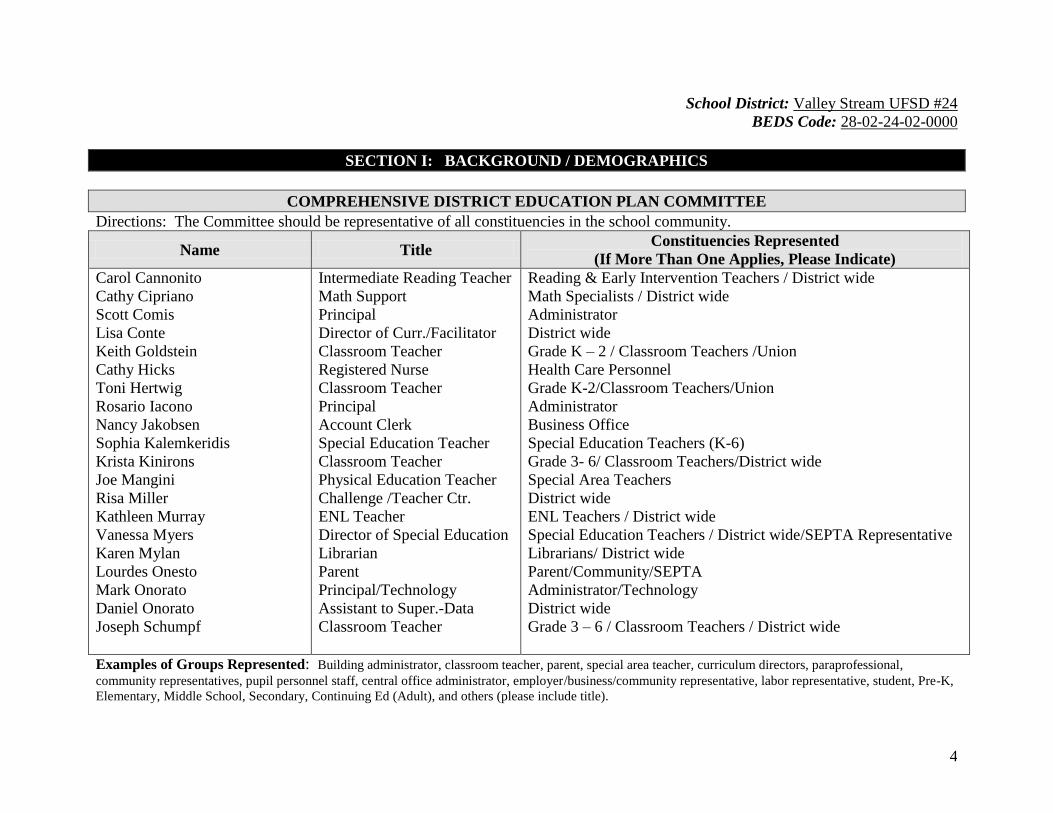
COMPREHENSIVE DISTRICT EDUCATION PLAN COMMITTEE
Directions: The Committee should be representative of all constituencies in the school community.
Name Title Constituencies Represented
(If More Than One Applies, Please Indicate)
Carol Cannonito
Cathy Cipriano
Scott Comis
Lisa Conte
Keith Goldstein
Cathy Hicks
Toni Hertwig
Rosario Iacono
Nancy Jakobsen
Sophia Kalemkeridis
Krista Kinirons
Joe Mangini
Risa Miller
Kathleen Murray
Vanessa Myers
Karen Mylan
Lourdes Onesto
Mark Onorato
Daniel Onorato
Joseph Schumpf
Intermediate Reading Teacher
Math Support
Principal
Director of Curr./Facilitator
Classroom Teacher
Registered Nurse
Classroom Teacher
Principal
Account Clerk
Special Education Teacher
Classroom Teacher
Physical Education Teacher
Challenge /Teacher Ctr.
ENL Teacher
Director of Special Education
Librarian
Parent
Principal/Technology
Assistant to Super.-Data
Classroom Teacher
Reading & Early Intervention Teachers / District wide
Math Specialists / District wide
Administrator
District wide
Grade K – 2 / Classroom Teachers /Union
Health Care Personnel
Grade K-2/Classroom Teachers/Union
Administrator
Business Office
Special Education Teachers (K-6)
Grade 3- 6/ Classroom Teachers/District wide
Special Area Teachers
District wide
ENL Teachers / District wide
Special Education Teachers / District wide/SEPTA Representative
Librarians/ District wide
Parent/Community/SEPTA
Administrator/Technology
District wide
Grade 3 – 6 / Classroom Teachers / District wide
Examples of Groups Represented: Building administrator, classroom teacher, parent, special area teacher, curriculum directors, paraprofessional,
community representatives, pupil personnel staff, central office administrator, employer/business/community representative, labor representative, student, Pre-K,
Elementary, Middle School, Secondary, Continuing Ed (Adult), and others (please include title).
Page 5
5
School District: Valley Stream UFSD #24
BEDS Code: 28-02-24-02-0000
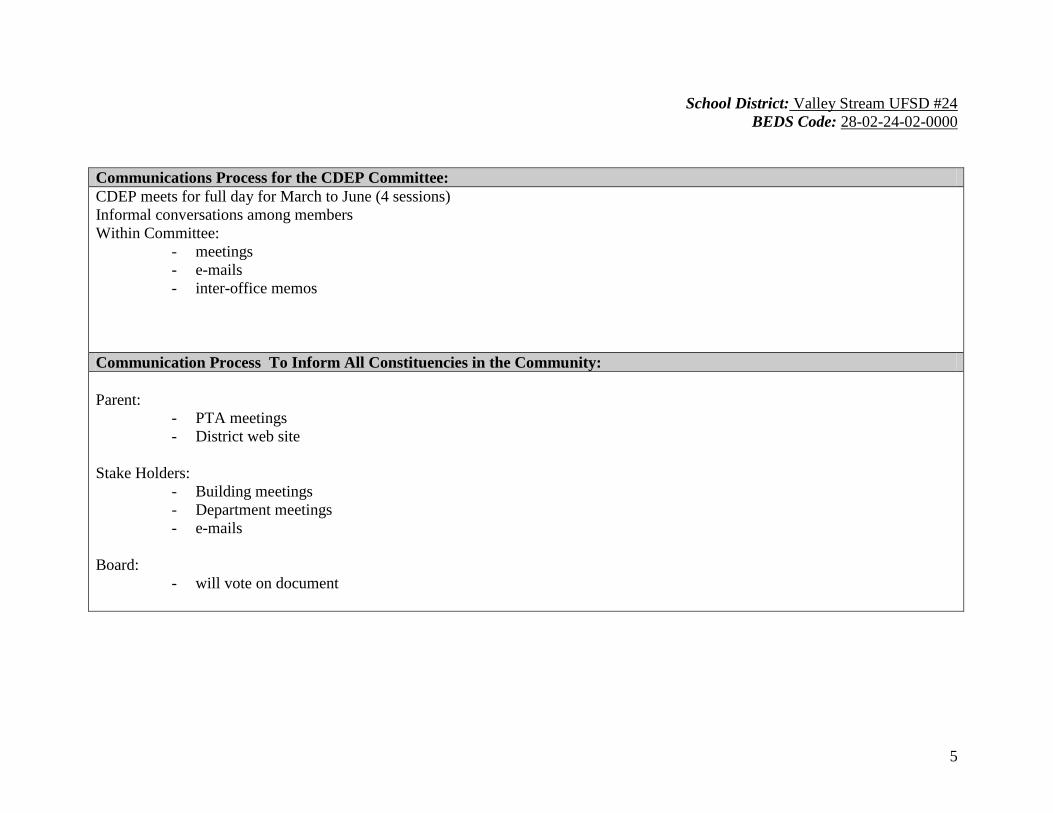
Communications Process for the CDEP Committee:
CDEP meets for full day for March to June (4 sessions)
Informal conversations among members
Within Committee:
- meetings
- e-mails
- inter-office memos
Communication Process To Inform All Constituencies in the Community:
Parent:
- PTA meetings
- District web site
Stake Holders:
- Building meetings
- Department meetings
- e-mails
Board:
- will vote on document
Page 6
6
School District: Valley Stream UFSD #24
BEDS Code: 28-02-24-02-0000
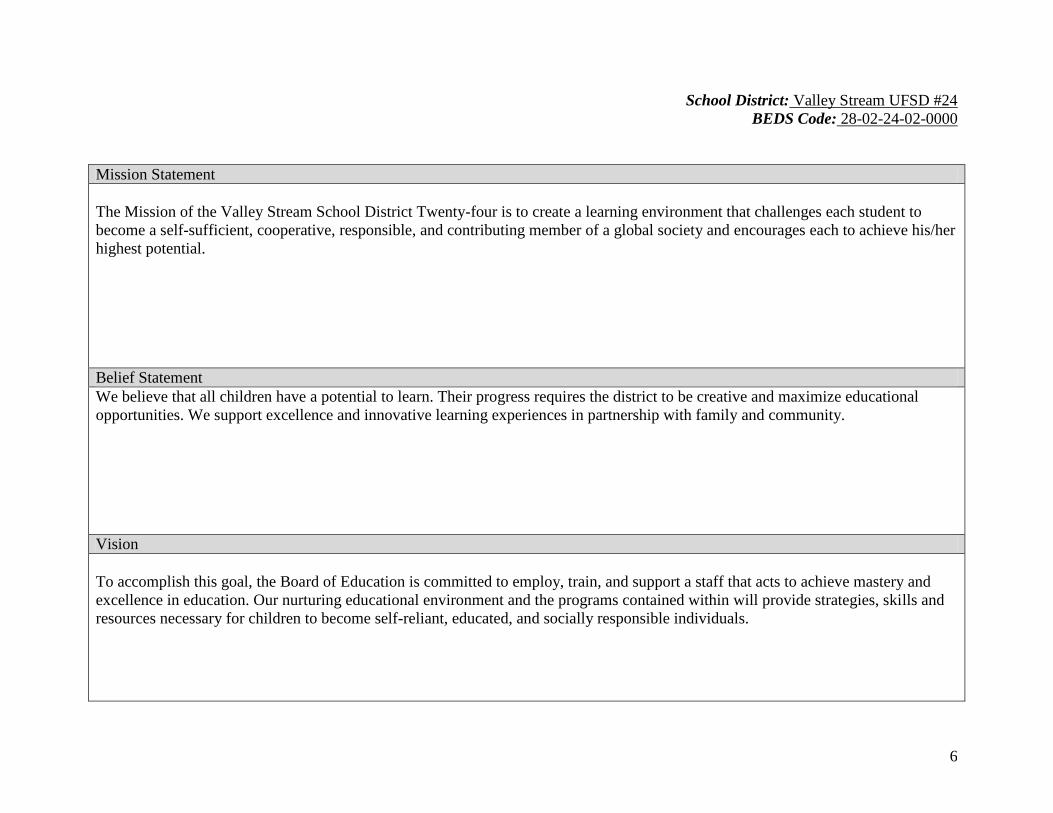
Mission Statement
The Mission of the Valley Stream School District Twenty-four is to create a learning environment that challenges each student to
become a self-sufficient, cooperative, responsible, and contributing member of a global society and encourages each to achieve his/her
highest potential.
Belief Statement
We believe that all children have a potential to learn. Their progress requires the district to be creative and maximize educational
opportunities. We support excellence and innovative learning experiences in partnership with family and community.
Vision
To accomplish this goal, the Board of Education is committed to employ, train, and support a staff that acts to achieve mastery and
excellence in education. Our nurturing educational environment and the programs contained within will provide strategies, skills and
resources necessary for children to become self-reliant, educated, and socially responsible individuals.
Page 7
7
School District: Valley Stream UFSD #24
BEDS Code: 28-02-24-02-0000
District Statement/Influencing Factors:
Please use this space to supply additional information that would be helpful for anyone reading or reviewing the plans.
For example, a brief description of the locality, its demographics, number of students and school buildings, economic
conditions, etc., that might further clarify the context of the plan.
Valley Stream UFSD #24 serves about 1,111 students in the villages of Valley Stream and a portion of Lynbrook in Nassau County with a staff
of 124 professional staff members and 87 civil service personnel. The district includes three elementary school buildings, grades K–6 only.
Our oldest school, Brooklyn Avenue School, is 107 years old. The William L. Buck School is 61 years old and the Robert W. Carbonaro
School is 60 years old. Our school district completed a Geo-Thermal Project at the William L. Buck School, which was environmentally
responsive and will reduce our energy and operating costs. This project will significantly improve the comfort of the building environment and
lighting quality/aesthetics of the classrooms and common areas. The peak energy demand and overall load on the district’s utility systems will
be reduced. In addition, the future operational costs and capital outlay needs will be reduced. Our district is one of three Valley Stream Districts
(the others are Elementary Districts 13 and 30) whose students graduate to a separately managed district, Valley Stream Central High School
District, for grades 7 through 12. The average class size is 20 students (all grades).
Approximately, 3,771 residents make their home in Valley Stream UFSD #24. Our annual market value for a single family home is $299,808.
The average resident’s taxes are $6,239.50. Over the past five years, the average tax increase was 1.6%. Our district’s per pupil spending is less
than the per pupil expenditures across New York State for general education and special education programs. Our general education per pupil
expenditure is $10, 677 and the New York State per pupil expenditure is $11, 739. The same is true for special education. Our district’s special
education expenditure per pupil is $30, 207 and the state’s reported expenditure per pupil is $31, 502.
Most of the current demographic data sites report from the census report of 2010. In this report it was concluded that there were 37,511 people,
12,189 households, and 9,541 families residing in the Village. The racial composition of the village was 46% White (not Hispanic), 18.6%
African American, 0.3% Native American, 11.4% Asian, .1% from other races and 3.5% from two or more races. Hispanic or Latino was
22.2% of the population (U.S. Census Bureau). Median household income for the village was $82,279, and the median income for a family was
$93,214. Males had a median income of $56,201 versus $48,925 for females. About 4.0% of families and 4.5% of the population were below
the poverty line, including 7.1% of those under age 18 and 4.9% of that age 65 or over. About 35% of households had children under the age of
18 living with them, 58.8% were married couples living together, 14.4% had a female householder with no husband present, and 21.7% were
non-families. 18.4% of all households were made up of individuals and 31% had someone living alone who was 65 years of age or older. The
average household size was 3.07 and the average family size was 3.50. This data has dramatically changed for our district in the past six years.
Page 8
8
School District: Valley Stream UFSD #24
BEDS Code: 28-02-24-02-0000
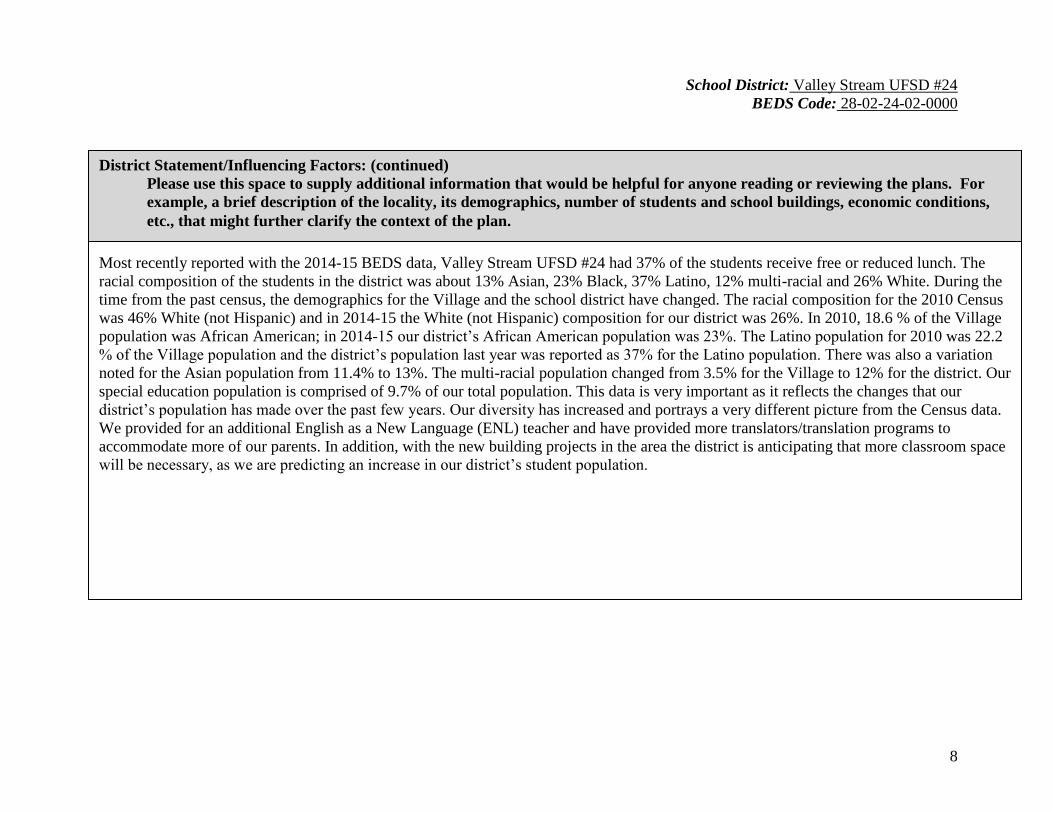
District Statement/Influencing Factors: (continued)
Please use this space to supply additional information that would be helpful for anyone reading or reviewing the plans. For
example, a brief description of the locality, its demographics, number of students and school buildings, economic conditions,
etc., that might further clarify the context of the plan.
Most recently reported with the 2014-15 BEDS data, Valley Stream UFSD #24 had 37% of the students receive free or reduced lunch. The
racial composition of the students in the district was about 13% Asian, 23% Black, 37% Latino, 12% multi-racial and 26% White. During the
time from the past census, the demographics for the Village and the school district have changed. The racial composition for the 2010 Census
was 46% White (not Hispanic) and in 2014-15 the White (not Hispanic) composition for our district was 26%. In 2010, 18.6 % of the Village
population was African American; in 2014-15 our district’s African American population was 23%. The Latino population for 2010 was 22.2
% of the Village population and the district’s population last year was reported as 37% for the Latino population. There was also a variation
noted for the Asian population from 11.4% to 13%. The multi-racial population changed from 3.5% for the Village to 12% for the district. Our
special education population is comprised of 9.7% of our total population. This data is very important as it reflects the changes that our
district’s population has made over the past few years. Our diversity has increased and portrays a very different picture from the Census data.
We provided for an additional English as a New Language (ENL) teacher and have provided more translators/translation programs to
accommodate more of our parents. In addition, with the new building projects in the area the district is anticipating that more classroom space
will be necessary, as we are predicting an increase in our district’s student population.
Page 9
9
School District: Valley Stream UFSD #24
BEDS Code: 28-02-24-02-0000
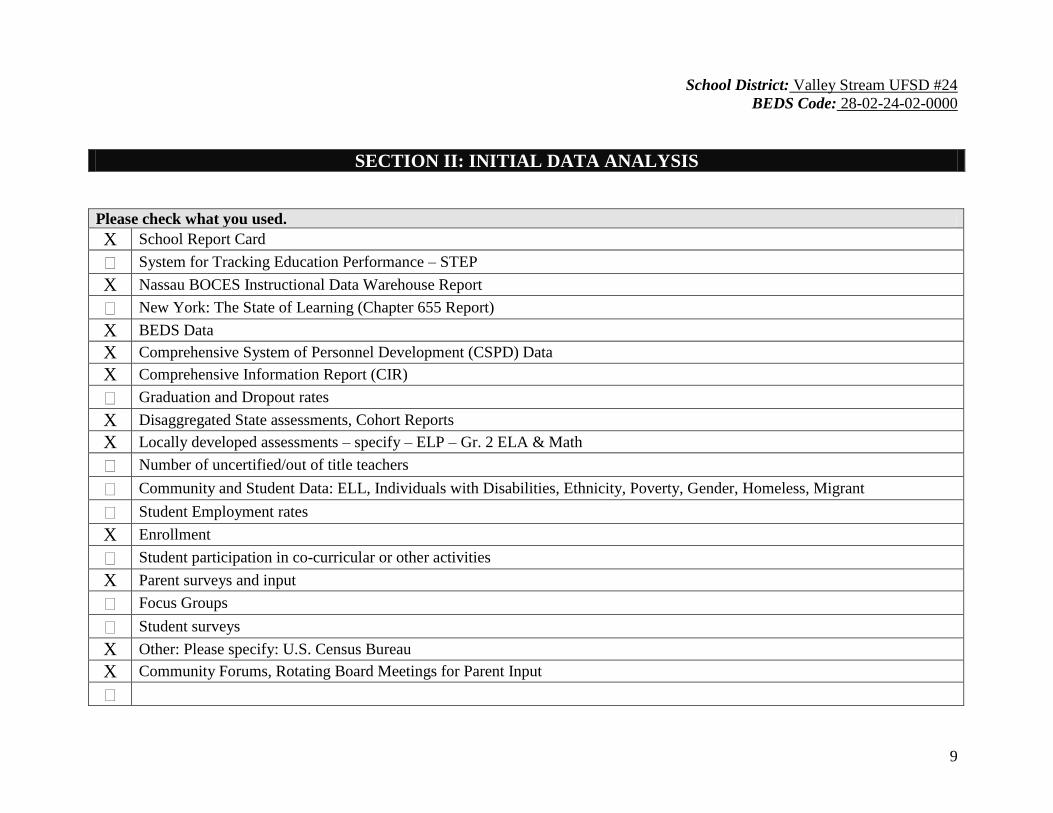
SECTION II: INITIAL DATA ANALYSIS
Please check what you used.
X School Report Card
System for Tracking Education Performance – STEP
X Nassau BOCES Instructional Data Warehouse Report
New York: The State of Learning (Chapter 655 Report)
X BEDS Data
X Comprehensive System of Personnel Development (CSPD) Data
X Comprehensive Information Report (CIR)
Graduation and Dropout rates
X Disaggregated State assessments, Cohort Reports
X Locally developed assessments – specify – ELP – Gr. 2 ELA & Math
Number of uncertified/out of title teachers
Community and Student Data: ELL, Individuals with Disabilities, Ethnicity, Poverty, Gender, Homeless, Migrant
Student Employment rates
X Enrollment
Student participation in co-curricular or other activities
X Parent surveys and input
Focus Groups
Student surveys
X Other: Please specify: U.S. Census Bureau
X Community Forums, Rotating Board Meetings for Parent Input
Page 10
10
School District: Valley Stream UFSD #24
BEDS Code: 28-02-24-02-0000
Key Indicators of Student Success: List and describe the district-identified State and local key indicators of success.
Definition of Key Indicator of Student Success: A student-focused, measurable outcome which the district has the ability,
desire, or need to influence for which it is willing, or required, to be accountable.
Content Area Intervention Target
Population Evidence Growth Goal
ELA:
Classroom
Instruction
1. Emotional Intelligence – Ruler –
Feeling Words Curriculum
K-6 NWEA MAP/MAP Primary
2. Jr. Great Books
K-6 NWEA MAP/MAP Primary
3. Raz-Kids K-2 Raz-Kids Assessments
4. ELA Interim Diagnostic
Assessments/Activities
3-6 NWEA MAP/SLO
5. Learning Farm 2-6 NWEA MAP/Map Primary/SLO
6. NYS Common Core
Learning Standards
Resources (i.e. Ready Assessments) 3-6 NWEA MAP
Page 11
11
School District: Valley Stream UFSD #24
BEDS Code: 28-02-24-02-0000
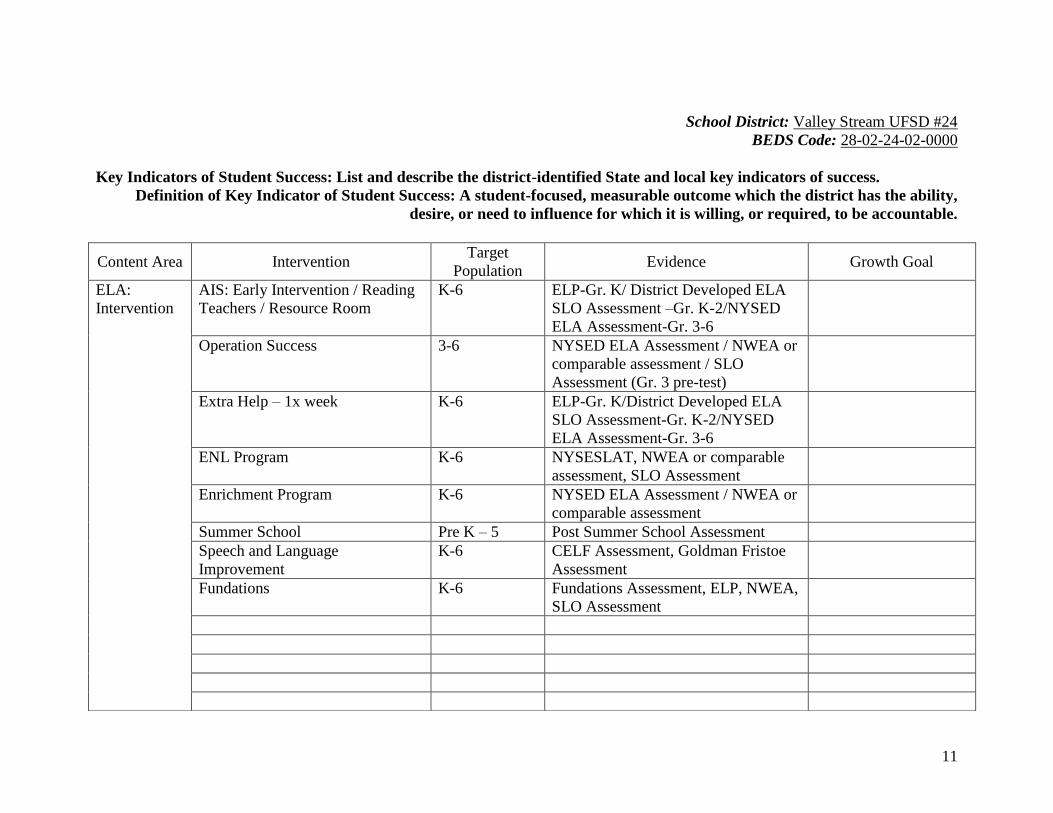
Key Indicators of Student Success: List and describe the district-identified State and local key indicators of success.
Definition of Key Indicator of Student Success: A student-focused, measurable outcome which the district has the ability,
desire, or need to influence for which it is willing, or required, to be accountable.
Content Area Intervention Target
Population Evidence Growth Goal
ELA:
Intervention
AIS: Early Intervention / Reading
Teachers / Resource Room
K-6 ELP-Gr. K/ District Developed ELA
SLO Assessment –Gr. K-2/NYSED
ELA Assessment-Gr. 3-6
Operation Success 3-6 NYSED ELA Assessment / NWEA or
comparable assessment / SLO
Assessment (Gr. 3 pre-test)
Extra Help – 1x week K-6 ELP-Gr. K/District Developed ELA
SLO Assessment-Gr. K-2/NYSED
ELA Assessment-Gr. 3-6
ENL Program K-6 NYSESLAT, NWEA or comparable
assessment, SLO Assessment
Enrichment Program K-6 NYSED ELA Assessment / NWEA or
comparable assessment
Summer School Pre K – 5 Post Summer School Assessment
Speech and Language
Improvement
K-6 CELF Assessment, Goldman Fristoe
Assessment
Fundations K-6 Fundations Assessment, ELP, NWEA,
SLO Assessment
Page 12
12
School District: Valley Stream UFSD #24
BEDS Code: 28-02-24-02-0000
Key Indicators of Student Success: List and describe the district-identified State and local key indicators of success.
Definition of Key Indicator of Student Success: A student-focused, measurable outcome which the district has the ability,
desire, or need to influence for which it is willing, or required, to be accountable.
Content Area Intervention Target Population Evidence
Growth Goal
Mathematics:
Intervention
AIS: Early Intervention / Math
Teacher / Resource Room
K-6 NYSED Math Assessment – Gr. 3-6 /
District Developed Math Assessment –
Gr. K-2
Operation Success 3-6 NYSED Math Assessment – Gr. 3-6 /
NWEA or comparable assessment / SLO
Assessment (Gr. 3 pre-test)
Extra Help-1x week K-6 NYSED Math Assessment – Gr. 3-6 /
District Developed Math Assessment –
Gr. K-2
Enrichment Program 4-6 NYSED Math Assessment – Gr. 3-6 /
NWEA
Learning Farm 2-6 NWEA MAP/SLO Assessment
Summer School Pre K – 5 Post Summer School Assessment
NYS Common Core Learning
Standards Resources (i.e.
Crosswalk Coach Plus)
3-6 NWEA MAP/SLO Assessment
Page 13
13
School District: Valley Stream UFSD #24
BEDS Code: 28-02-24-02-0000
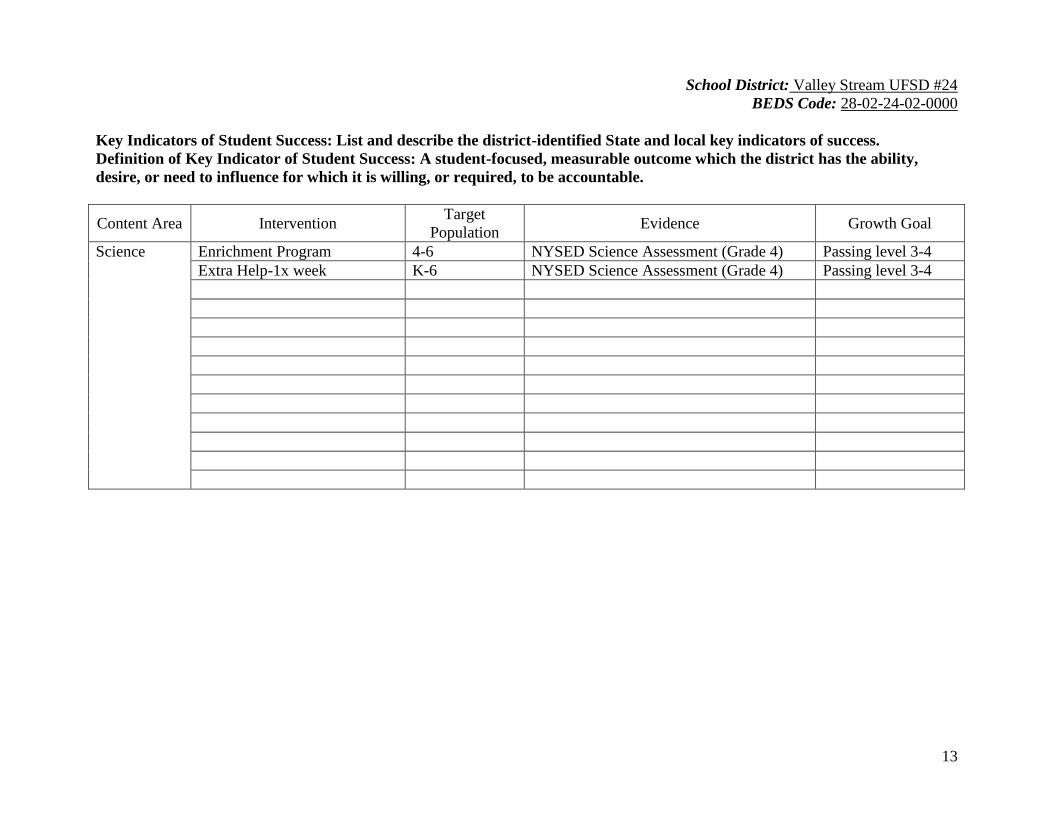
Key Indicators of Student Success: List and describe the district-identified State and local key indicators of success.
Definition of Key Indicator of Student Success: A student-focused, measurable outcome which the district has the ability,
desire, or need to influence for which it is willing, or required, to be accountable.
Content Area Intervention Target
Population Evidence Growth Goal
Science Enrichment Program 4-6 NYSED Science Assessment (Grade 4) Passing level 3-4
Extra Help-1x week K-6 NYSED Science Assessment (Grade 4) Passing level 3-4
Page 14
14
School District: Valley Stream UFSD #24
BEDS Code: 28-02-24-02-0000
BASIC SCHOOL DISTRICT DATA
STUDENT RACIAL/ETHNIC ORIGIN
2012-2013 2013-2014 2014-2015
No. of
Students
% of Enroll
No. of
students
% of Enroll
No. of
students
% of Enroll
American Indian, Alaskan,
Asian, or Pacific Islander 172 15% 148 14% 147 13%
Black (Not Hispanic) 217 20% 221 21% 241 22%
Hispanic 373 34% 376 35% 407 37%
White (Not Hispanic) 347 31% 312 29% 283 26%
Multi Racial 5 0.5% -- -- 12 11%
LIMITED ENGLISH PROFICIENT STUDENTS (LEP)
2012-2013 2013-2014 2014-2015
No. of Students % of Enroll No. of Students % of Enroll No. of Students % of Enroll
99
9%
88
8%
87
8%
Page 15
15
School District: Valley Stream UFSD #24
BEDS Code: 28-02-24-02-0000
BA BASIC SCHOOL DISTRICT DATA .
ATTENDANCE, SUSPENSION AND DROPOUT RATES
2012-2013 2013-2014 2014-2015
No. of
Students
% of
Enroll.
No. of
Students
% of
Enroll.
No. of
Students
% of
Enroll.
Annual Attendance Rate 96% 96% 96%
Student Suspensions 17 2% 26 2% 19 2%
Student Dropouts N/A N/A N/A N/A N/A N/A
Entered Alternative HS N/A N/A N/A N/A N/A N/A
STUDENT SOCIOECONOMIC AND STABILITY INDICATORS (PERCENT OF ENROLLMENT)
2012-2013 2013-2014 2014-2015
Free Lunch 23% 22% 24%
Reduced Lunch 7% 6% 6%
Public Assistance N/A N/A N/A
Student Stability N/A N/A N/A
Page 16
16
School District: Valley Stream UFSD #24
BEDS Code: 28-02-24-02-0000
DISAGGREGATION OF STUDENT DATA
2014/2015 Grade 3 ELA
Total
Students
% of Total Level 1
Count
% at Level
1
Level 2
Count
% at Level
2
L3 + L4
Count
% at L3 +
L4
Disabled 16 12.8% 13 81.2% 3 18.8% 0 0%
Not
Disabled
109 87.2% 25 22.9% 44 40.4% 40 36.7%
LEP
Eligible
11 8.8% 8 72.7% 2 18.2% 1 9.1%
Not LEP
Eligible
114 91.2% 30 26.3% 45 39.5% 39 34.2%
Total 125 100% 38 30.4% 47 37.6% 40 32%
2014/2015 Grade 3 Math
Total
Students
% of Total Level 1
Count
% at Level
1
Level 2
Count
% at Level
2
L3 + L4
Count
% at L3 +
L4
Disabled 14 12.4% 11 78.6% 3 21.4% 0 0%
Not
Disabled
99 87.6% 6 6.1% 31 31.3% 62 62.6%
LEP
Eligible
9 8% 5 55.6% 2 22.2% 2 22.2%
Not LEP
Eligible
104 92% 12 11.5% 32 30.8% 60 57.7%
Total 113 100% 17 15% 34 30.1% 62 54.9%
Page 17
17
School District: Valley Stream UFSD #24
BEDS Code: 28-02-24-02-0000
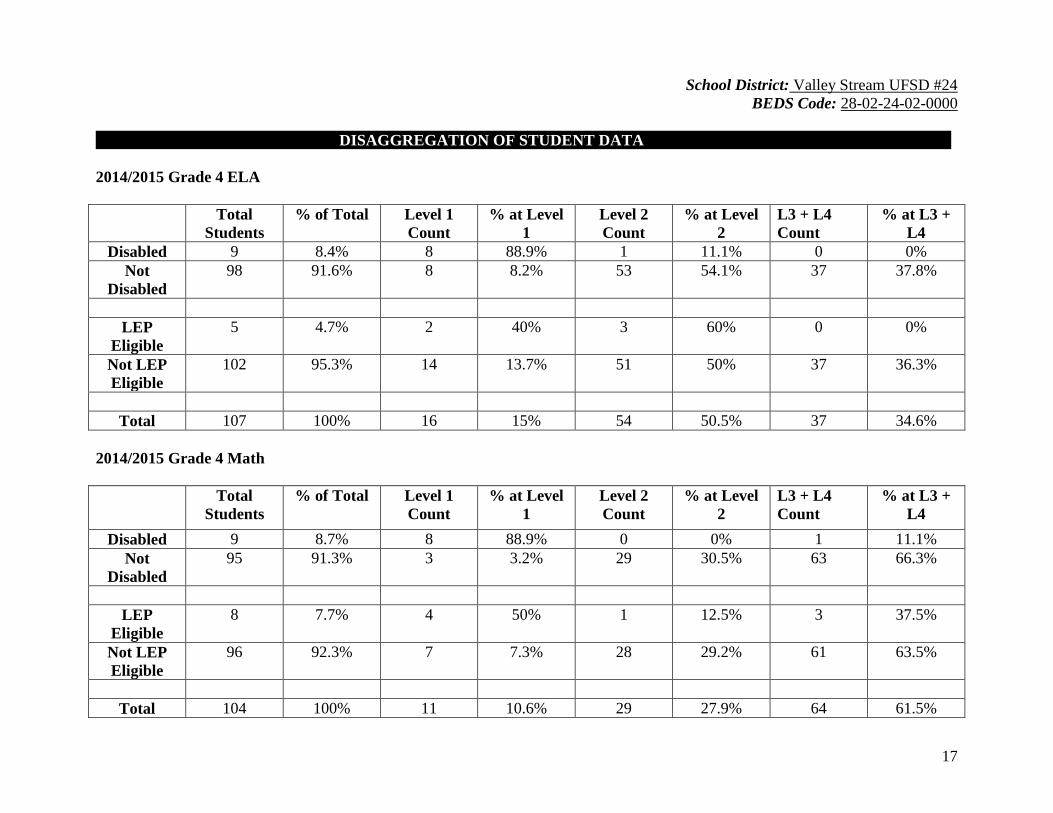
DISAGGREGATION OF STUDENT DATA .
2014/2015 Grade 4 ELA
Total
Students
% of Total Level 1
Count
% at Level
1
Level 2
Count
% at Level
2
L3 + L4
Count
% at L3 +
L4
Disabled 9 8.4% 8 88.9% 1 11.1% 0 0%
Not
Disabled
98 91.6% 8 8.2% 53 54.1% 37 37.8%
LEP
Eligible
5 4.7% 2 40% 3 60% 0 0%
Not LEP
Eligible
102 95.3% 14 13.7% 51 50% 37 36.3%
Total 107 100% 16 15% 54 50.5% 37 34.6%
2014/2015 Grade 4 Math
Total
Students
% of Total Level 1
Count
% at Level
1
Level 2
Count
% at Level
2
L3 + L4
Count
% at L3 +
L4
Disabled 9 8.7% 8 88.9% 0 0% 1 11.1%
Not
Disabled
95 91.3% 3 3.2% 29 30.5% 63 66.3%
LEP
Eligible
8 7.7% 4 50% 1 12.5% 3 37.5%
Not LEP
Eligible
96 92.3% 7 7.3% 28 29.2% 61 63.5%
Total 104 100% 11 10.6% 29 27.9% 64 61.5%
Page 18
18
School District: Valley Stream UFSD #24
BEDS Code: 28-02-24-02-0000
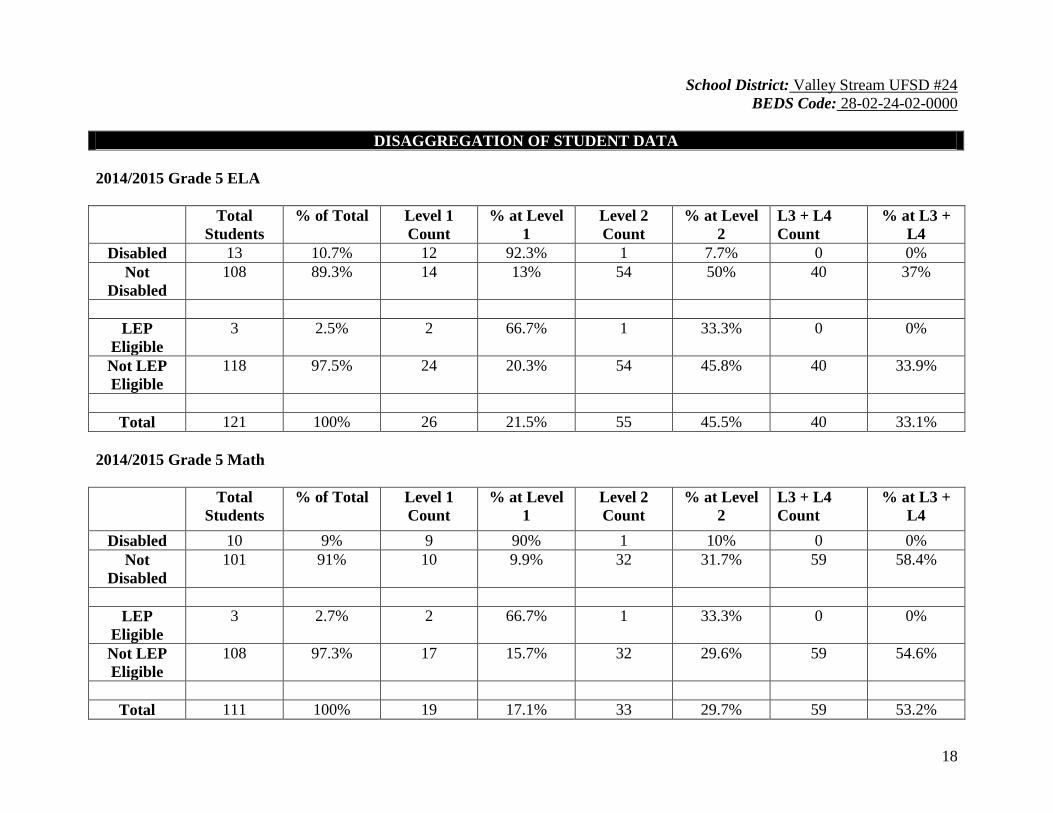
DISAGGREGATION OF STUDENT DATA
2014/2015 Grade 5 ELA
Total
Students
% of Total Level 1
Count
% at Level
1
Level 2
Count
% at Level
2
L3 + L4
Count
% at L3 +
L4
Disabled 13 10.7% 12 92.3% 1 7.7% 0 0%
Not
Disabled
108 89.3% 14 13% 54 50% 40 37%
LEP
Eligible
3 2.5% 2 66.7% 1 33.3% 0 0%
Not LEP
Eligible
118 97.5% 24 20.3% 54 45.8% 40 33.9%
Total 121 100% 26 21.5% 55 45.5% 40 33.1%
2014/2015 Grade 5 Math
Total
Students
% of Total Level 1
Count
% at Level
1
Level 2
Count
% at Level
2
L3 + L4
Count
% at L3 +
L4
Disabled 10 9% 9 90% 1 10% 0 0%
Not
Disabled
101 91% 10 9.9% 32 31.7% 59 58.4%
LEP
Eligible
3 2.7% 2 66.7% 1 33.3% 0 0%
Not LEP
Eligible
108 97.3% 17 15.7% 32 29.6% 59 54.6%
Total 111 100% 19 17.1% 33 29.7% 59 53.2%
Page 19
19
School District: Valley Stream UFSD #24
BEDS Code: 28-02-24-02-0000
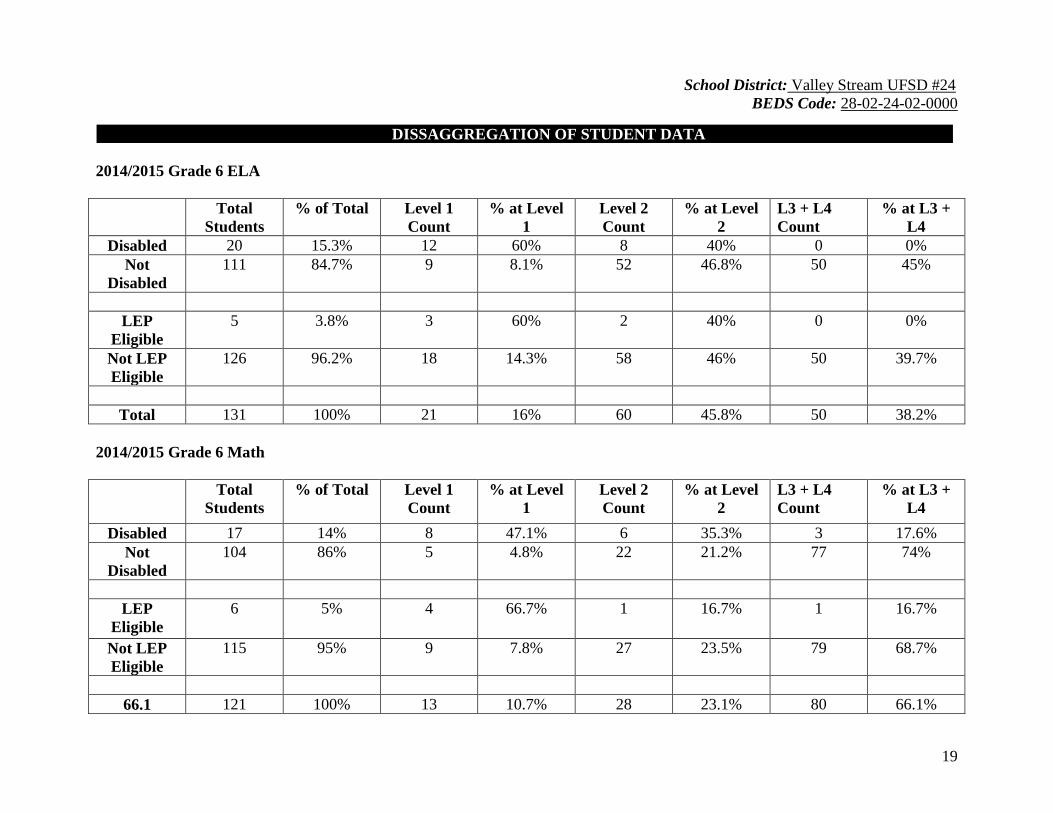
DISSAGGREGATION OF STUDENT DATA .
.
2014/2015 Grade 6 ELA
Total
Students
% of Total Level 1
Count
% at Level
1
Level 2
Count
% at Level
2
L3 + L4
Count
% at L3 +
L4
Disabled 20 15.3% 12 60% 8 40% 0 0%
Not
Disabled
111 84.7% 9 8.1% 52 46.8% 50 45%
LEP
Eligible
5 3.8% 3 60% 2 40% 0 0%
Not LEP
Eligible
126 96.2% 18 14.3% 58 46% 50 39.7%
Total 131 100% 21 16% 60 45.8% 50 38.2%
2014/2015 Grade 6 Math
Total
Students
% of Total Level 1
Count
% at Level
1
Level 2
Count
% at Level
2
L3 + L4
Count
% at L3 +
L4
Disabled 17 14% 8 47.1% 6 35.3% 3 17.6%
Not
Disabled
104 86% 5 4.8% 22 21.2% 77 74%
LEP
Eligible
6 5% 4 66.7% 1 16.7% 1 16.7%
Not LEP
Eligible
115 95% 9 7.8% 27 23.5% 79 68.7%
66.1 121 100% 13 10.7% 28 23.1% 80 66.1%
Page 20
20
School District: Valley Stream UFSD #24
BEDS Code: 28-02-24-02-0000
DISSAGGREGATION OF STUDENT DATA .
.
ELA Trends
% at L3 + L4 2012-13 % at L3 + L4 2013-14 % at L3 + L4 2014-15
Gr 3 ELA Regional 46% 44.0% 43%
Gr 3 ELA VS 24 50% 29% 32%
Difference 4% -15% -11%
% at L3 + L4 2012-13 % at L3 + L4 2013-14 % at L3 + L4 2014-15
Gr 4 ELA Regional 43% 42% 45%
Gr 4 ELA VS 24 47% 31% 35%
Difference 4% -11% -10%
% at L3 + L4 2012-13 % at L3 + L4 2013-14 % at L3 + L4 2014-15
Gr 5 ELA Regional 43% 40% 42%
Gr 5 ELA VS 24 38% 28% 33%
Difference -5% -12% -9%
% at L3 + L4 2012-13 % at L3 + L4 2013-14 % at L3 + L4 2014-15
Gr 6 ELA Regional 42% 39% 42%
Gr 6 ELA VS 24 36% 27% 38%
Difference -6% -12% -4%
Page 21
21
School District: Valley Stream UFSD #24
BEDS Code: 28-02-24-02-0000
DISSAGGREGATION OF STUDENT DATA .
.
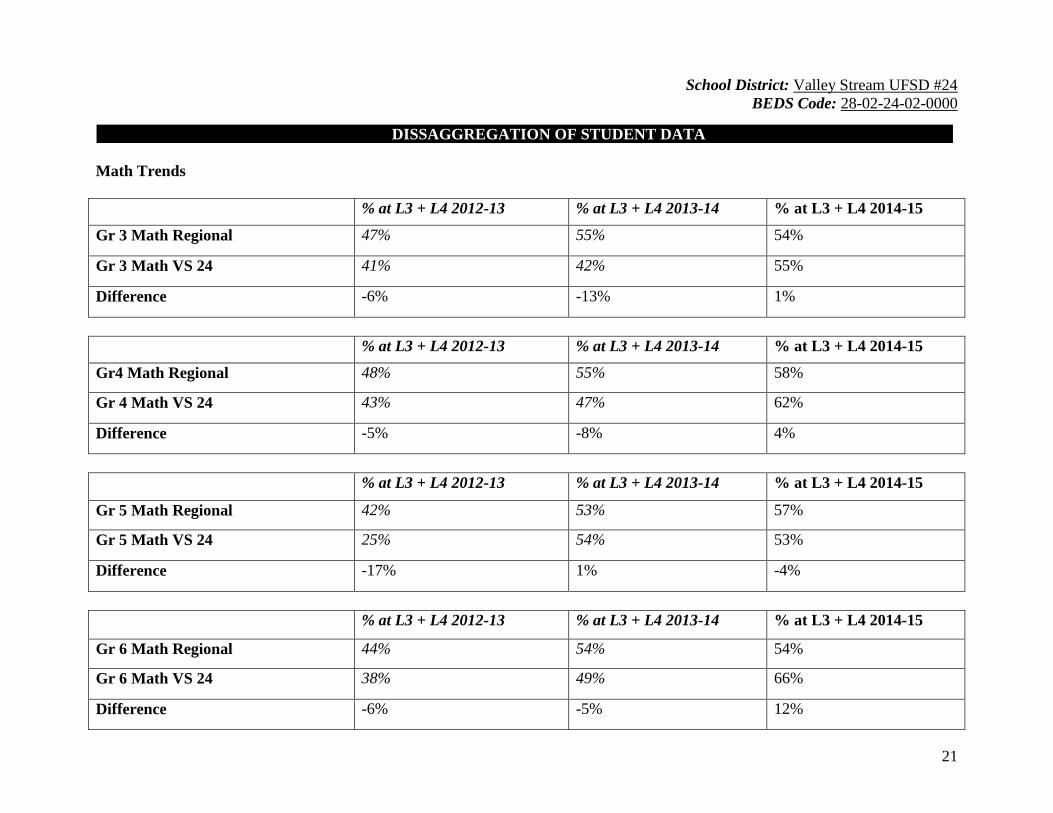
Math Trends
% at L3 + L4 2012-13 % at L3 + L4 2013-14 % at L3 + L4 2014-15
Gr 3 Math Regional 47% 55% 54%
Gr 3 Math VS 24 41% 42% 55%
Difference -6% -13% 1%
% at L3 + L4 2012-13 % at L3 + L4 2013-14 % at L3 + L4 2014-15
Gr4 Math Regional 48% 55% 58%
Gr 4 Math VS 24 43% 47% 62%
Difference -5% -8% 4%
% at L3 + L4 2012-13 % at L3 + L4 2013-14 % at L3 + L4 2014-15
Gr 5 Math Regional 42% 53% 57%
Gr 5 Math VS 24 25% 54% 53%
Difference -17% 1% -4%
% at L3 + L4 2012-13 % at L3 + L4 2013-14 % at L3 + L4 2014-15
Gr 6 Math Regional 44% 54% 54%
Gr 6 Math VS 24 38% 49% 66%
Difference -6% -5% 12%
Page 22
22
School District: Valley Stream UFSD #24
BEDS Code: 28-02-24-02-0000
DISSAGGREGATION OF STUDENT DATA .
.
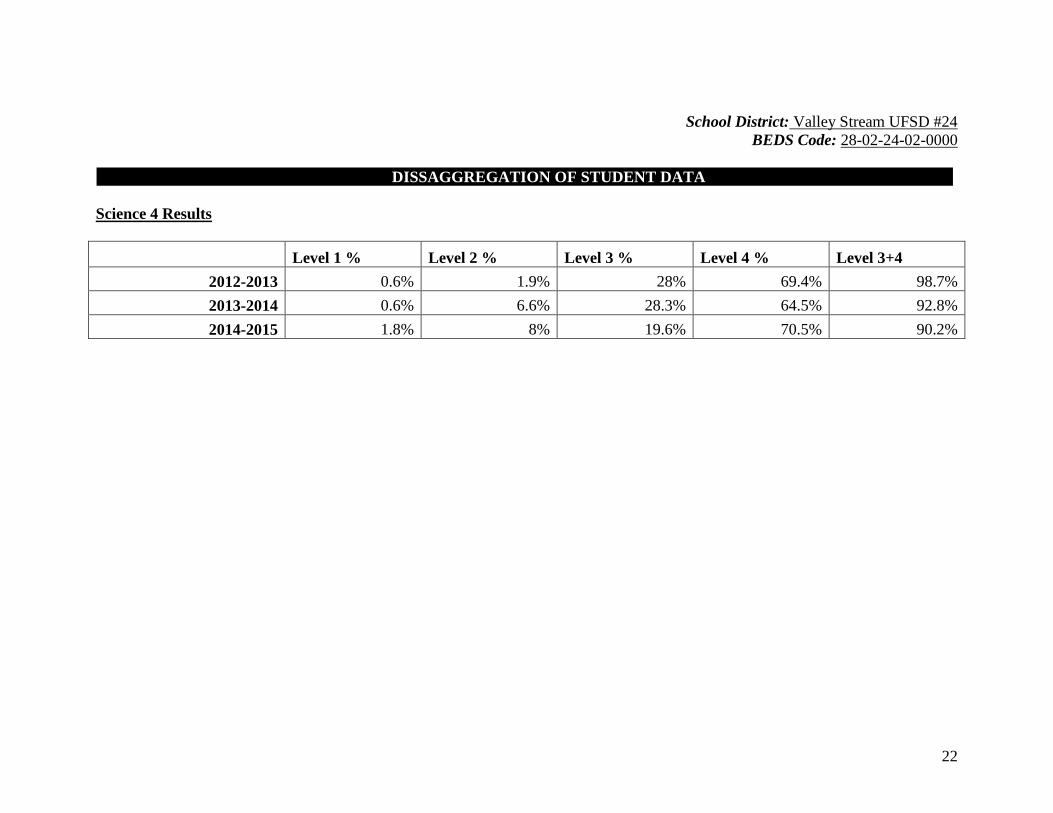
Science 4 Results
Level 1 % Level 2 % Level 3 % Level 4 % Level 3+4
2012-2013 0.6% 1.9% 28% 69.4% 98.7%
2013-2014 0.6% 6.6% 28.3% 64.5% 92.8%
2014-2015 1.8% 8% 19.6% 70.5% 90.2%
Page 23
23
School District: Valley Stream UFSD #24
BEDS Code: 28-02-24-02-0000
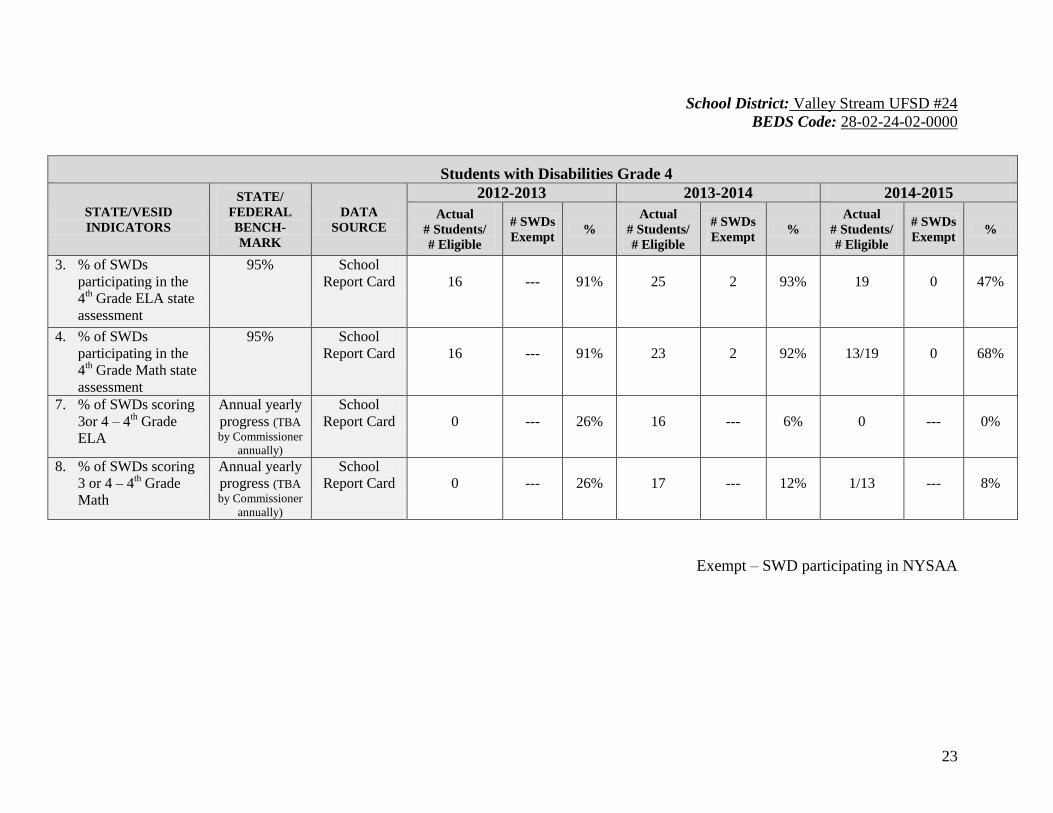
Students with Disabilities Grade 4
STATE/VESID
INDICATORS
STATE/
FEDERAL
BENCH-
MARK
DATA
SOURCE
2012-2013 2013-2014 2014-2015
Actual
# Students/
# Eligible
# SWDs
Exempt %
Actual
# Students/
# Eligible
# SWDs
Exempt %
Actual
# Students/
# Eligible
# SWDs
Exempt %
3. % of SWDs
participating in the
4th Grade ELA state
assessment
95% School
Report Card
16
---
91%
25
2
93%
19
0
47%
4. % of SWDs
participating in the
4th Grade Math state
assessment
95% School
Report Card
16
---
91%
23
2
92%
13/19
0
68%
7. % of SWDs scoring
3or 4 – 4th Grade
ELA
Annual yearly
progress (TBA
by Commissioner
annually)
School
Report Card
0
---
26%
16
---
6%
0
---
0%
8. % of SWDs scoring
3 or 4 – 4th Grade
Math
Annual yearly
progress (TBA
by Commissioner
annually)
School
Report Card
0
---
26%
17
---
12%
1/13
---
8%
Exempt – SWD participating in NYSAA
Page 24
24
School District: Valley Stream UFSD #24
BEDS Code: 28-02-24-02-0000
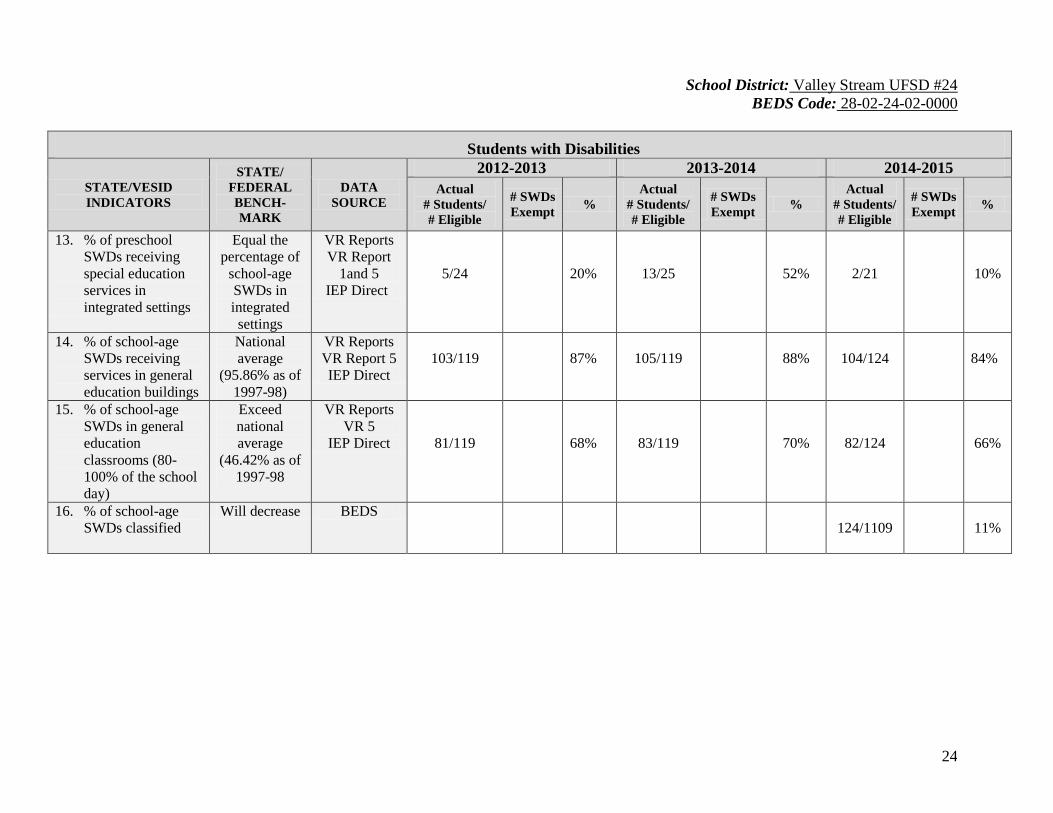
Students with Disabilities
STATE/VESID
INDICATORS
STATE/
FEDERAL
BENCH-
MARK
DATA
SOURCE
2012-2013 2013-2014 2014-2015
Actual
# Students/
# Eligible
# SWDs
Exempt %
Actual
# Students/
# Eligible
# SWDs
Exempt %
Actual
# Students/
# Eligible
# SWDs
Exempt %
13. % of preschool
SWDs receiving
special education
services in
integrated settings
Equal the
percentage of
school-age
SWDs in
integrated
settings
VR Reports
VR Report
1and 5
IEP Direct
5/24
20%
13/25
52%
2/21
10%
14. % of school-age
SWDs receiving
services in general
education buildings
National
average
(95.86% as of
1997-98)
VR Reports
VR Report 5
IEP Direct
103/119
87%
105/119
88%
104/124
84%
15. % of school-age
SWDs in general
education
classrooms (80-
100% of the school
day)
Exceed
national
average
(46.42% as of
1997-98
VR Reports
VR 5
IEP Direct
81/119
68%
83/119
70%
82/124
66%
16. % of school-age
SWDs classified
Will decrease BEDS
124/1109
11%
Page 25
25
School District: Valley Stream UFSD #24
BEDS Code: 28-02-24-02-0000
District Essential Data
Key Indicator Target/Goal
2016 – 2019 2012-2013 2013-2014 2014-2015
% Gap
2012-2013
% Gap
2013-2014
% Gap
2014-2015
ELA 3 44.2% on
Levels 3 & 4
50.7% on
Levels 3 & 4
29% on
Levels 3 & 4
32% on
Levels 3 & 4
6.5% -15.2% -12.2%
Mathematics 3 52.2% on
Levels 3 & 4
41.5% on
Levels 3 & 4
42% on
Levels 3 & 4
55% on
Levels 3 & 4
-10.7% -10.2% 2.8%
ELA 4 43.4% on
Levels 3 & 4
47.2% on
Levels 3 & 4
31% on
Levels 3 & 4
36% on
Levels 3 & 4
3.8% -12.4% -7.4%
Mathematics 4 53.6% on
Levels 3 & 4
42.5% on
Levels 3 & 4
47% on
Levels 3 & 4
62% on
Levels 3 & 4
-11.1% -6.6% 8.4%
ELA 5 41.6% on
Levels 3 & 4
37.8% on
Levels 3 & 4
28% on
Levels 3 & 4
35% on
Levels 3 & 4
-3.8% -13.6% -6.6%
Mathematics 5 50.5% on
Levels 3 & 4
25.3% on
Levels 3 & 4
54% on
Levels 3 & 4
54% on
Levels 3 & 4
-25.2% 3.5% 3.5%
ELA 6 41% on
Levels 3 & 4
36.3% on
Levels 3 & 4
27% on
Levels 3 & 4
38% on
Levels 3 & 4
-4.7% -14% -3%
Mathematics 6 51% on
Levels 3 & 4
38.4% on
Levels 3 & 4
49% on
Levels 3 & 4
68% on
Levels 3 & 4
-12.6% -2% 17%
Science 4 94.3% on
Levels 3 & 4 98.7% on Levels 3 & 4
92.8% on
Levels 3 & 4
90.2% on
Levels 3 & 4
4.4% -1.5% -4.1%
Note: This is based on current data. The target/goal was set to reflect at or above scores for the region for the past three years for
levels 3 and 4. The target/goal will be re-evaluated to reflect any new NYSED Assessments and cut scores in the future.
Page 26
26
School District: Valley Stream UFSD #24
BEDS Code: 28-02-24-02-0000
PRIORITY GAP
Prioritize area gaps and provide a rationale for prioritization
Priority Gap Rationale
ELA Difference from region
Math Difference from region and sustain current improvement
Note: Special Education did not meet AYP for 2 years district-wide (2010/2011, 2014/2015). Therefore, Special Education will be a
focus within ELA and mathematics.
Page 27
27
School District: Valley Stream UFSD #24
BEDS Code: 28-02-24-02-0000
SECTION III: ROOT CAUSE ANALYSIS
Area: ELA
Gap: (Specify desired change in student performance) refer to page 25
Target: refer to page 25
Primary Root Causes Justification Rationale
Central Ideas/Message and Details 2014 – 2015 ELA data (NYSED) Gap reports items below county
Text Evidence/Claims/Reasons 2014 – 2015 ELA data (NYSED) Gap reports items below county
Text Features/Structures-time,
cause/effect,
2014 – 2015 ELA data (NYSED) Gap reports items below county
Unfamiliar words in context – lack of
academic /domain specific vocabulary,
multiple meaning words
2014 – 2015 ELA data (NYSED) Gap reports items below county
Literary elements – events, characters,
actions
2014 – 2015 ELA data (NYSED) Gap reports items below county
Author’s Purpose/Reason 2014 – 2015 ELA data (NYSED) Gap reports items below county
Genres: Summarize text, poetry, drama,
fables, folktales
2014 – 2015 ELA data (NYSED) Gap reports items below county
Lack of parent understanding of Common
Core Learning Standards
Parent Survey
Lack of stamina Students do not complete interim
assessments/activities
Predicted length of NYSED Assessment
Pre-school (lack of) Parent Survey/Registration Material
Page 28
28
School District: Valley Stream UFSD #24
BEDS Code: 28-02-24-02-0000
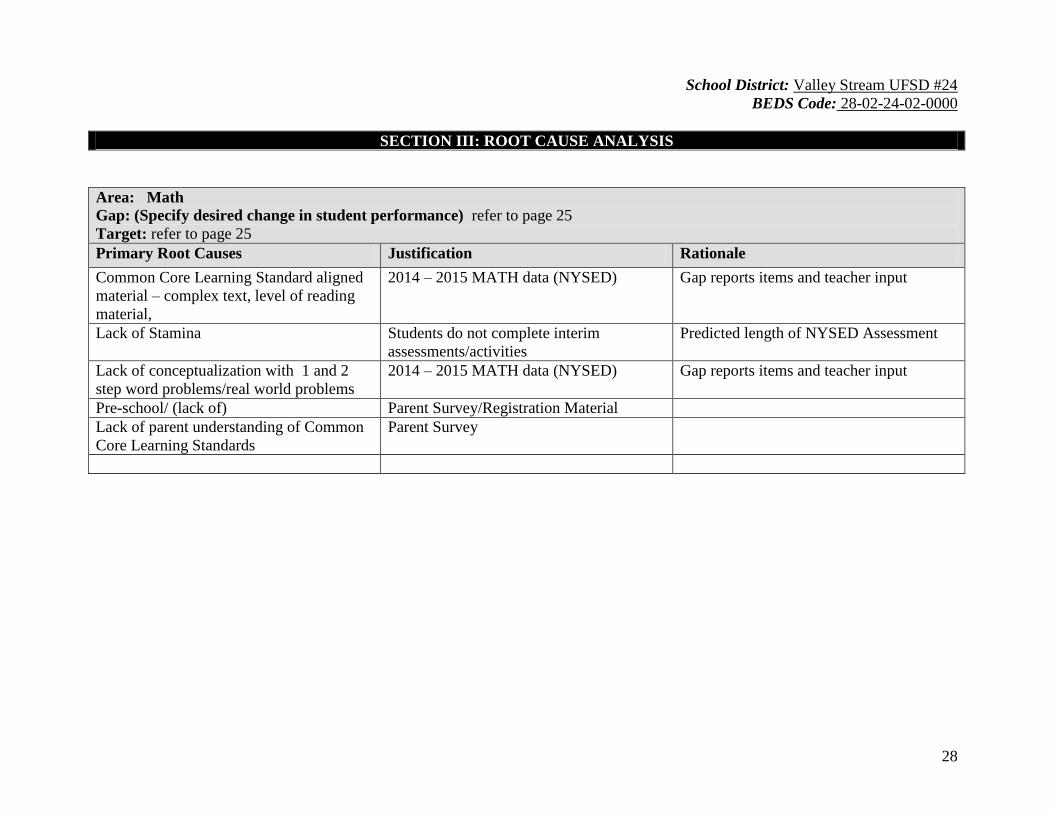
SECTION III: ROOT CAUSE ANALYSIS
Area: Math
Gap: (Specify desired change in student performance) refer to page 25
Target: refer to page 25
Primary Root Causes Justification Rationale
Common Core Learning Standard aligned
material – complex text, level of reading
material,
2014 – 2015 MATH data (NYSED) Gap reports items and teacher input
Lack of Stamina Students do not complete interim
assessments/activities
Predicted length of NYSED Assessment
Lack of conceptualization with 1 and 2
step word problems/real world problems
2014 – 2015 MATH data (NYSED) Gap reports items and teacher input
Pre-school/ (lack of) Parent Survey/Registration Material
Lack of parent understanding of Common
Core Learning Standards
Parent Survey
Page 29
29
School District: Valley Stream UFSD #24
BEDS Code: 28-02-24-02-0000
SECTION IV: IMPLEMENTATION PLAN /PROFESSIONAL DEVELOPMENT PLAN
This plan addresses continuing Teacher Leader Education (CTLE) Activities that will be offered in appropriate subject areas
highlighted in this plan. The activities:
will expand educators’ content knowledge, and the knowledge and skills necessary to provide rigorous,
developmentally appropriate instructional strategies and assesses student progress;
are research-based and provide educators with opportunities to analyze, apply, and engage in research;
include the necessary opportunities for professionals to obtain CTLE to meet the English language learner provisions.
This plan is designed to ensure that educators:
have the knowledge, skill, and opportunity to collaborate to improve instruction and student achievement in a respectful
and trusting environment;
have the knowledge and skill to meet the diverse needs of all students;
have the knowledge and skill to create safe, secure, supportive, and equitable learning environments for all students;
have the knowledge, skills, and opportunity to engage and collaborate with parents, families, and other community
members as active partners in children’s education.
This plan:
uses disaggregated student data and other evidence of student learning to determine professional development learning
needs and priorities, to monitor student progress, and to help sustain continuous professional growth;
promotes technological literacy and facilitates the effective use of all appropriate technology;
evaluates using multiple sources of information to assess its effectiveness in improving professional practice and
student learning.
Professional Development activities provided in this plan for CTLE credit will be:
offered by a SED- approved sponsor;
professional development programs and technical activities offered by national, state, and local professional
associations and other organizations acceptable and approved by SED;
any other organized educational and technical activities that are acceptable and approved by SED
Valley Stream #24’s Professional Development Plan is being supported in part by BOCES, RIC, RBERN, RSE-TASC,
Teacher Centers and approved consultants.
Page 30
30
School District: Valley Stream UFSD #24
BEDS Code: 28-02-24-02-0000
SECTION IV: IMPLEMENTATION PLAN
Implementation Plan: Complete the following chart for each identified gap or success.
Area: ELA
Gap: (Specify desired change in student performance) refer to page 25
Target: refer to page 25
What How Who Time-line Support Responsibility
Strategies Major Tasks / Activities Professional
Development
Target
Population Dates
Funding
Sources
To Be
Used
Who Does It
Common Core
Learning Standards
aligned materials
Implement Common Core
Learning Standards
materials / New Reading
Programs
Workshops /
Coaching-Presented
by District Staff or
BOCES
K-6 Teachers 2016-2019 District Director of
Curriculum
Central idea & details,
evidences, Author’s
Purpose / Reason
Professional Development Workshop
Workshops /
Coaching-Presented
by District Staff or
BOCES s
K-6 Teachers 2016-2019 District Director of
Curriculum
Literary elements –
events, characters,
actions / Genres:
Summarize text, poetry,
drama, fables, folktales
Professional Development Workshops /
Coaching-Presented
by District Staff or
BOCES shops
K-6 Teachers 2016-2019 District Director of
Curriculum
Unfamiliar words and
context
Professional Development Workshops /
Coaching-Presented
by District Staff or
BOCES
K-6 Teachers 2016-2019 District Director of
Curriculum
Page 31
31
School District: Valley Stream UFSD #24
BEDS Code: 28-02-24-02-0000
SECTION IV: IMPLEMENTATION PLAN
Implementation Plan: Complete the following chart for each identified gap or success.
Area: ELA (continued)
Gap: (Specify desired change in student performance) refer to page 25
Target: refer to page 25
What How Who Time-line Support Responsibility
Strategies Major Tasks / Activities Professional
Development
Target
Population Dates
Funding
Sources
To Be
Used
Who Does It
New materials /
standards
New curriculum
program materials
(ELA, Social Studies,
Science)
Implement new
standards/materials
Workshops /
Coaching-
Presented by
Harcourt Houghton
Mifflin /Superkids
Consultants/
BOCES
Consultants
K-6 Teachers 2016-2019 District Director of
Curriculum
CDEP Sub-Committee Data disaggregation to
determine ELA Focus
Workshops K-6 Teachers 2016-2019 District Director of
Curriculum
Use Technology
Resources (software,
programs, data bases,
etc.) (Refer to
Instructional
Technology Plan and
Smart Schools
Investment Plan)
Research and implement
technology
resources/strategies
Workshops-
Presented by
District Technology
Team, BOCES
consultants
K-6 Teachers 2016-2019 District Director of
Curriculum /
Technology
Liaison
Page 32
32
School District: Valley Stream UFSD #24
BEDS Code: 28-02-24-02-0000
SECTION IV: IMPLEMENTATION PLAN
Implementation Plan: Complete the following chart for each identified gap or success.
Area: ELA (continued)
Gap: (Specify desired change in student performance) refer to page 25
Target: refer to page 25
What How Who Time-line Support Responsibility
Strategies Major Tasks / Activities Professional
Development
Target
Population Dates
Funding
Sources To
Be Used
Who Does It
Target Professional
Development based on
needs identified by
NYSED Assessment
Data Interpretation Based on
2016-2019
data- Presented
by District
Staff
K-6 Teachers 2016-2019 District Director of
Curriculum /
Professional
Development
Committee /
Principals
Co-teaching Strategies Workshop Co-teaching
Workshop-
Presented by
BOCES
consultant/
District staff
K-6 Co-
teaching
Teams
2016-2019 District Director of
Special
Education
Primary Research /
Big 6 Research /
Writing Genre Log
Students prepare major
research project
Workshop-
Presented by
District
Librarians
K-3 Teachers 2016-2017
District Director of
Curriculum
Parent Common Core
Learning Standards
meeting
Workshop – Common
Core Learning Standards
content and assessment
tips
Workshop-
Presented by
District Staff
Pre-K-6
Parents
2016-2019 District Director of
Curriculum
Page 33
33
School District: Valley Stream UFSD #24
BEDS Code: 28-02-24-02-0000
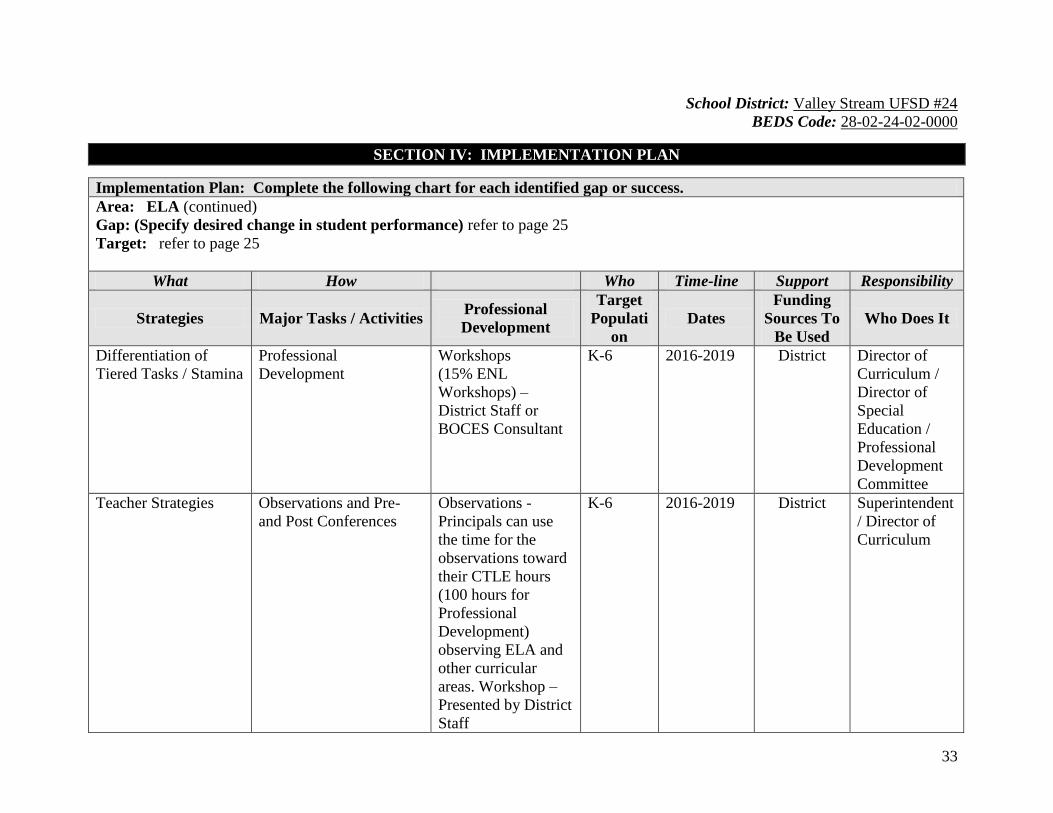
SECTION IV: IMPLEMENTATION PLAN
Implementation Plan: Complete the following chart for each identified gap or success.
Area: ELA (continued)
Gap: (Specify desired change in student performance) refer to page 25
Target: refer to page 25
What How Who Time-line Support Responsibility
Strategies Major Tasks / Activities Professional
Development
Target
Populati
on
Dates
Funding
Sources To
Be Used
Who Does It
Differentiation of
Tiered Tasks / Stamina
Professional
Development
Workshops
(15% ENL
Workshops) –
District Staff or
BOCES Consultant
K-6 2016-2019 District Director of
Curriculum /
Director of
Special
Education /
Professional
Development
Committee
Teacher Strategies Observations and Pre-
and Post Conferences
Observations -
Principals can use
the time for the
observations toward
their CTLE hours
(100 hours for
Professional
Development)
observing ELA and
other curricular
areas. Workshop –
Presented by District
Staff
K-6 2016-2019 District Superintendent
/ Director of
Curriculum
Page 34
34
School District: Valley Stream UFSD #24
BEDS Code: 28-02-24-02-0000
SECTION IV: IMPLEMENTATION PLAN
Implementation Plan: Complete the following chart for each identified gap or success.
Area: Math
Gap: (Specify desired change in student performance) refer to page 25
Target: refer to page 25
What How Who Time-line Support Responsibility
Strategies Major Tasks / Activities Professional
Development
Target
Population Dates
Funding
Sources
To Be
Used
Who Does It
Fluency Use Sprints and Choral
Recitations
As needed-
District staff
K-6 2016-2017 District Director of
Curriculum
Common Core
Learning Standards
aligned materials –
complex text, level of
reading material
Continue adaptation of
NYSED Modules
As needed-
Presented by
District staff or
BOCES
Consultant
K-6 Teachers 2016-2019 District Director of
Curriculum
Co-teaching
Strategies
Workshop Co-teaching-
Presented by
BOCES
Consultant or
District Staff
K-6 Co-
teaching
Teams
2016-2019 District Director of
Special
Education
Parent Common Core
Learning Standards
meeting
Plan Common Core
Learning Standards
workshop for parents
(content & assessment
tips)
Workshop-
Presented by
District Staff
Pre-K – 6 2016-2019 District Director of
Curriculum
Page 35
35
School District: Valley Stream UFSD #24
BEDS Code: 28-02-24-02-0000
SECTION IV: IMPLEMENTATION PLAN
Implementation Plan: Complete the following chart for each identified gap or success.
Area: Math (continued)
Gap: (Specify desired change in student performance) refer to page 25
Target: refer to page 25
What How Who Time-line Support Responsibility
Strategies Major Tasks / Activities Professional
Development
Target
Population Dates
Funding
Sources To
Be Used
Who Does It
Reinforce K-6 teaching
strategies (procedural,
conceptual and
application strategies;
Lack of
conceptualization,
stamina
Workshop / Grade Level
Meetings
Workshop /
Grade Level
Meetings –
Presented by
District staff or
BOCES
K-6 Teachers 2016-2019 District Director of
Curriculum /
Professional
Development
Committee
CDEP Sub-Committee Data disaggregation to
determine Math focus
CDEP Sub-
Committee
Meeting/
Correspondence
K-6 Teachers 2016-2019 District Director of
Curriculum
Differentiation of Tiered
Tasks
Professional Development Workshop-
Presented by
District staff or
BOCES
K-6 2016-2019 District Director of
Curriculum /
Director of Special
Education /
Professional
Development
Committee
Page 36
36
School District: Valley Stream UFSD #24
BEDS Code: 28-02-24-02-0000
SECTION IV: IMPLEMENTATION PLAN
Implementation Plan: Complete the following chart for each identified gap or success.
Area: Math (continued)
Gap: (Specify desired change in student performance) refer to page 25
Target: refer to page 25
What How Who Time-line Support Responsibility
Strategies Major Tasks / Activities Professional
Development
Target
Populatio
n
Dates
Funding
Sources To
Be Used
Who Does It
Use Technology
Resources (software,
programs, data bases,
etc.) (Refer to
Instructional
Technology Plan and
Smart Schools
Investment Plan)
Research and implement
technology
resources/strategies
Workshop-
Presented by
BOCES consultant
or District
Technology Team
K-6
Teachers
2016-2019 District Director of
Curriculum /
Technology Liaison
Teacher Strategies Observations and Pre and
Post Conferences
Observations –
Principals can use
the time for the
observations toward
their CTLE Hours
(100 hours for
Professional
Development)
observing Math and
other curricular
areas. Workshop
presented by
District staff.
K-6 2016-2019 District Superintendent /
Director of
Curriculum
Page 37
37
School District: Valley Stream UFSD #24
BEDS Code: 28-02-24-02-0000
SECTION IV: IMPLEMENTATION PLAN
Implementation Plan: Complete the following chart for each identified gap or success.
Area: RTI/AIS
Gap: Did not make AYP for district for three years (2010, 2011and 2014) and in 2013 the EAMO was very close to the PI.
Target: Make AYP yearly for math and ELA for all subgroups
What How Who Time-
line Support Responsibility
Strategies Major Tasks /
Activities
Professional
Development
Target
Population Dates
Funding
Sources To
Be Used
Who Does It
Differentiation of
Tiered Tasks
Professional
Development
Workshops, grade
level meetings-
Presented by District
staff
All teaching
staff
2016-
2019
District Director of Special
Education / Director
of Curriculum
Address CCLS
needs of identified
students
Professional
Development
Workshops, grade
level meetings-
Presented by District
staff
All teaching
staff
2016-
2019
District Director of Special
Education / Director
of Curriculum
Progress monitoring
for ELA and Math
Identify appropriate
assessments and data
collection
Workshops- Presented
by District Staff
All teaching
staff
2016-
2019
District Director of Special
Education / Director
of Curriculum
Page 38
38
School District: Valley Stream UFSD #24
BEDS Code: 28-02-24-02-0000
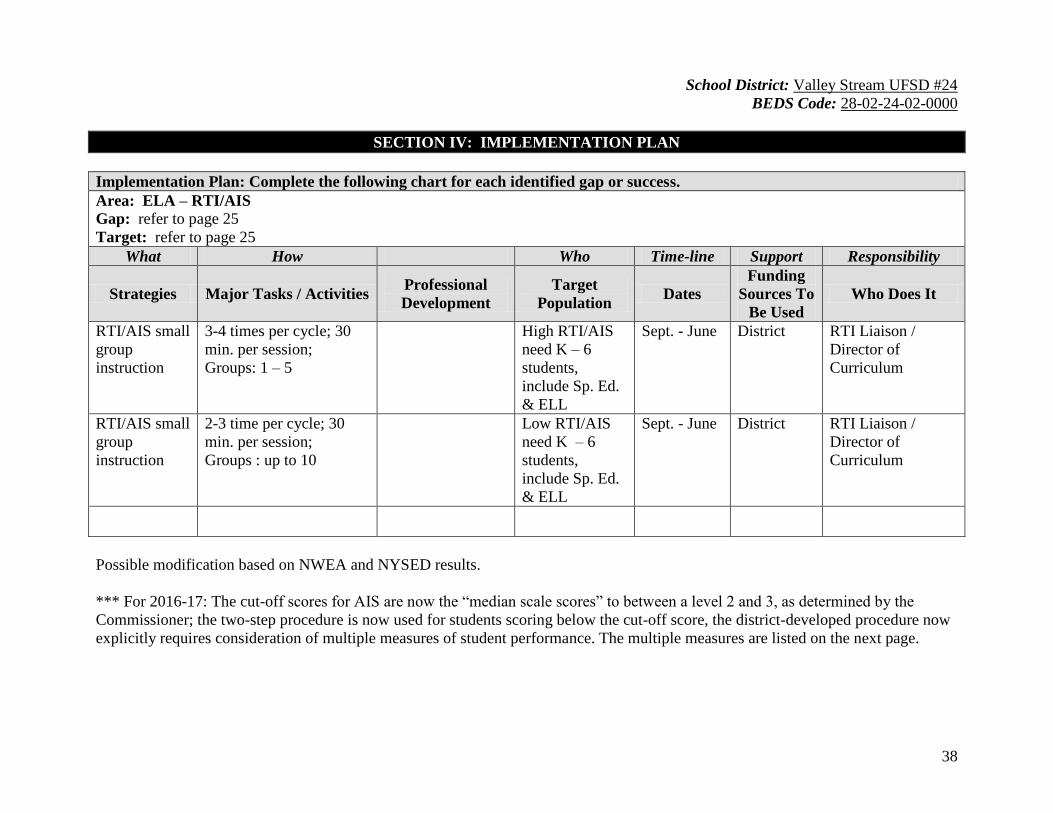
SECTION IV: IMPLEMENTATION PLAN
Implementation Plan: Complete the following chart for each identified gap or success.
Area: ELA – RTI/AIS
Gap: refer to page 25
Target: refer to page 25
What How Who Time-line Support Responsibility
Strategies Major Tasks / Activities Professional
Development
Target
Population Dates
Funding
Sources To
Be Used
Who Does It
RTI/AIS small
group
instruction
3-4 times per cycle; 30
min. per session;
Groups: 1 – 5
High RTI/AIS
need K – 6
students,
include Sp. Ed.
& ELL
Sept. - June District RTI Liaison /
Director of
Curriculum
RTI/AIS small
group
instruction
2-3 time per cycle; 30
min. per session;
Groups : up to 10
Low RTI/AIS
need K – 6
students,
include Sp. Ed.
& ELL
Sept. - June District RTI Liaison /
Director of
Curriculum
Possible modification based on NWEA and NYSED results.
*** For 2016-17: The cut-off scores for AIS are now the “median scale scores” to between a level 2 and 3, as determined by the
Commissioner; the two-step procedure is now used for students scoring below the cut-off score, the district-developed procedure now
explicitly requires consideration of multiple measures of student performance. The multiple measures are listed on the next page.
Page 39
39
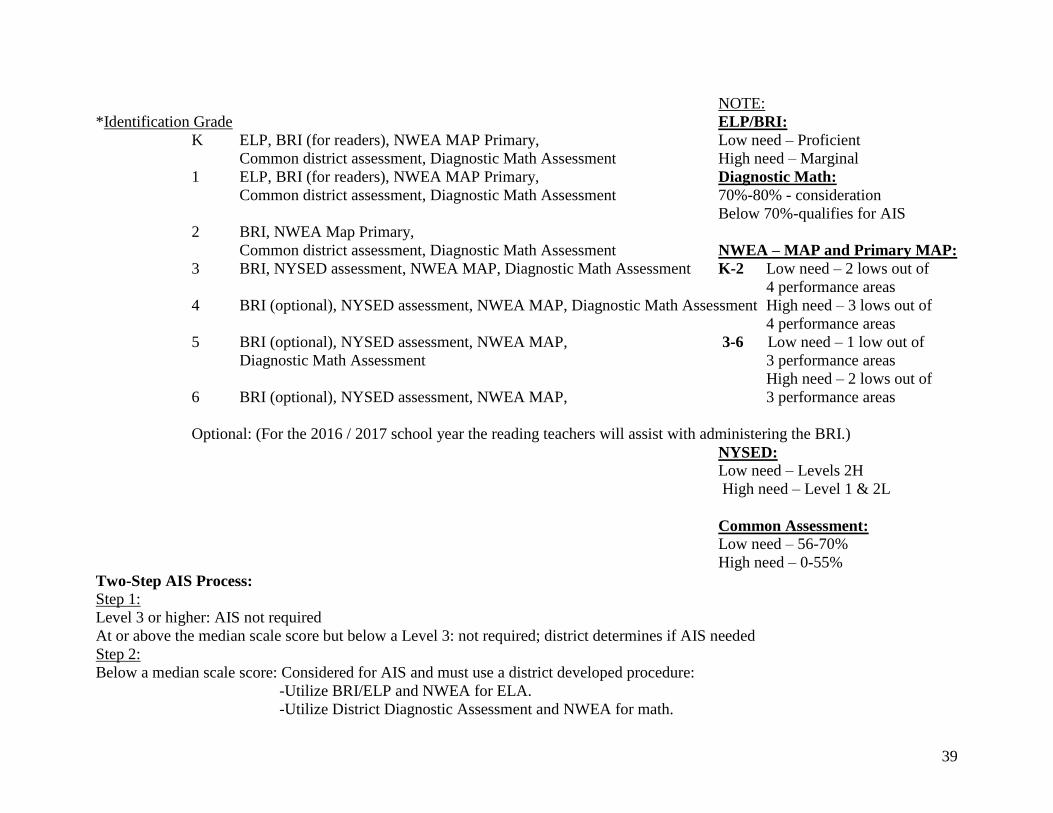
NOTE:
*Identification Grade ELP/BRI:
K ELP, BRI (for readers), NWEA MAP Primary, Low need – Proficient
Common district assessment, Diagnostic Math Assessment High need – Marginal
1 ELP, BRI (for readers), NWEA MAP Primary, Diagnostic Math:
Common district assessment, Diagnostic Math Assessment 70%-80% - consideration
Below 70%-qualifies for AIS
2 BRI, NWEA Map Primary,
Common district assessment, Diagnostic Math Assessment NWEA – MAP and Primary MAP:
3 BRI, NYSED assessment, NWEA MAP, Diagnostic Math Assessment K-2 Low need – 2 lows out of
4 performance areas
4 BRI (optional), NYSED assessment, NWEA MAP, Diagnostic Math Assessment High need – 3 lows out of
4 performance areas
5 BRI (optional), NYSED assessment, NWEA MAP, 3-6 Low need – 1 low out of
Diagnostic Math Assessment 3 performance areas
High need – 2 lows out of
6 BRI (optional), NYSED assessment, NWEA MAP, 3 performance areas
Optional: (For the 2016 / 2017 school year the reading teachers will assist with administering the BRI.)
NYSED: Low need – Levels 2H
High need – Level 1 & 2L
Common Assessment:
Low need – 56-70%
High need – 0-55%
Two-Step AIS Process:
Step 1:
Level 3 or higher: AIS not required
At or above the median scale score but below a Level 3: not required; district determines if AIS needed
Step 2:
Below a median scale score: Considered for AIS and must use a district developed procedure:
-Utilize BRI/ELP and NWEA for ELA.
-Utilize District Diagnostic Assessment and NWEA for math.
Page 40
40
School District: Valley Stream UFSD #24
BEDS Code: 28-02-24-02-0000
SECTION IV: IMPLEMENTATION PLAN
Implementation Plan: Complete the following chart for each identified gap or success.
Area: Math – RTI/AIS
Gap: refer to page 25
Target: refer to page 25
What How Who Time-line Support Responsibility
Strategies Major Tasks / Activities Professional
Development
Target
Population Dates
Funding
Sources To
Be Used
Who Does It
RTI/AIS small
group
instruction
3-4 times per cycle; 30 min. per
session;
Groups: 1 – 5
High RTI/AIS
need K – 6
students, include
Sp. Ed. & ELL
Sept. - June District RTI Liaison /
Director of
Curriculum
RTI/AIS small
group
instruction
2-3 time per cycle; 30 min. per
session;
Groups : up to 10
Low RTI/AIS
need K – 6
students, include
Sp. Ed. & ELL
Sept. - June District RTI Liaison /
Director of
Curriculum
Possible modification based on NWEA and NYSED results.
Page 41
41
NOTE:
*Identification Grade ELP/BRI:
K ELP, BRI (for readers), NWEA MAP Primary, Low need – Proficient
Common district assessment, Diagnostic Math Assessment High need – Marginal
1 ELP, BRI (for readers), NWEA MAP Primary, Diagnostic Math:
Common district assessment, Diagnostic Math Assessment 70%-80% - consideration
Below 70%-qualifies for AIS
2 BRI, NWEA Map Primary,
Common district assessment, Diagnostic Math Assessment NWEA – MAP and Primary MAP:
3 BRI, NYSED assessment, NWEA MAP, Diagnostic Math Assessment K-2 Low need – 2 lows out of
4 performance areas
4 BRI (optional), NYSED assessment, NWEA MAP, Diagnostic Math Assessment High need – 3 lows out of
4 performance areas
5 BRI (optional), NYSED assessment, NWEA MAP, 3-6 Low need – 1 low out of
Diagnostic Math Assessment 3 performance areas
High need – 2 lows out of
6 BRI (optional), NYSED assessment, NWEA MAP, 3 performance areas
Optional: (For the 2016 / 2017 school year the reading teachers will assist with administering the BRI.)
NYSED: Low need – Levels 2H
High need – Level 1 & 2L
Common Assessment:
Low need – 56-70%
High need – 0-55%
Two-Step AIS Process:
Step 1:
Level 3 or higher: AIS not required
At or above the median scale score but below a Level 3: not required; district determines if AIS needed
Step 2:
Below a median scale score: Considered for AIS and must use a district developed procedure:
-Utilize BRI/ELP and NWEA for ELA.
-Utilize District Diagnostic Assessment and NWEA for math.
Page 42
42
School District: Valley Stream UFSD #24
BEDS Code: 28-02-24-02-0000
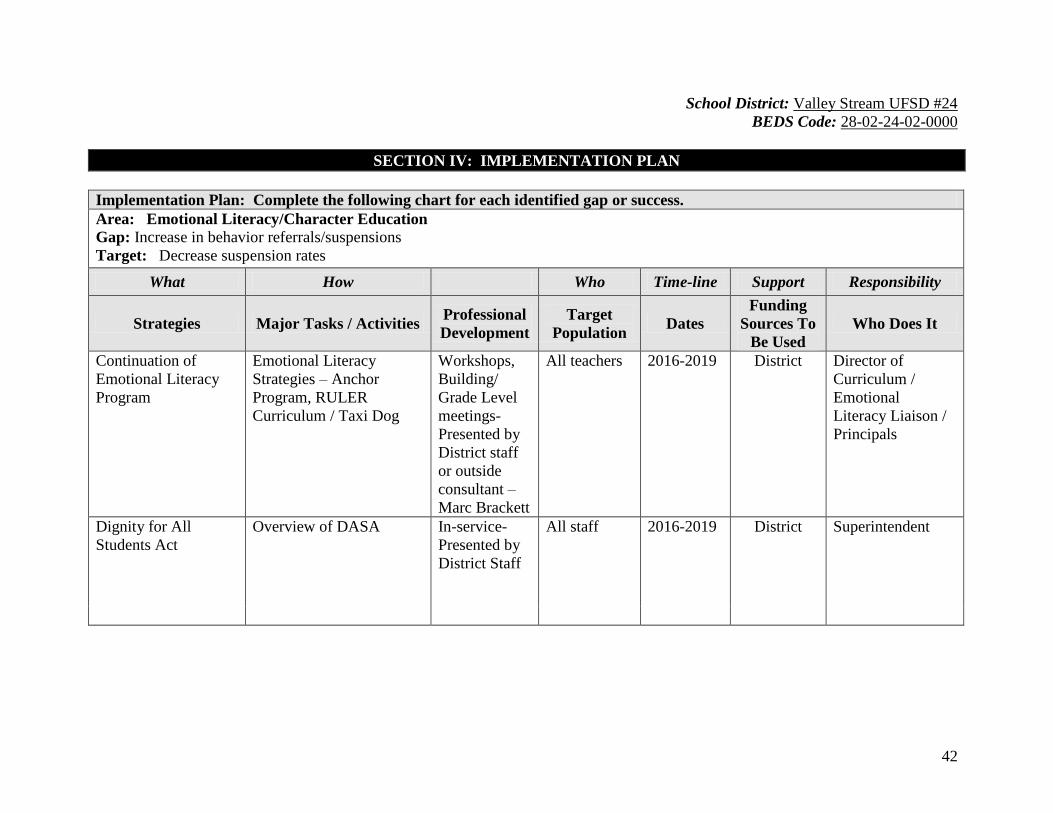
SECTION IV: IMPLEMENTATION PLAN
Implementation Plan: Complete the following chart for each identified gap or success.
Area: Emotional Literacy/Character Education
Gap: Increase in behavior referrals/suspensions
Target: Decrease suspension rates
What How Who Time-line Support Responsibility
Strategies Major Tasks / Activities Professional
Development
Target
Population Dates
Funding
Sources To
Be Used
Who Does It
Continuation of
Emotional Literacy
Program
Emotional Literacy
Strategies – Anchor
Program, RULER
Curriculum / Taxi Dog
Workshops,
Building/
Grade Level
meetings-
Presented by
District staff
or outside
consultant –
Marc Brackett
All teachers 2016-2019 District Director of
Curriculum /
Emotional
Literacy Liaison /
Principals
Dignity for All
Students Act
Overview of DASA In-service-
Presented by
District Staff
All staff 2016-2019 District Superintendent
Page 43
43
School District: Valley Stream UFSD #24
BEDS Code: 28-02-24-02-0000
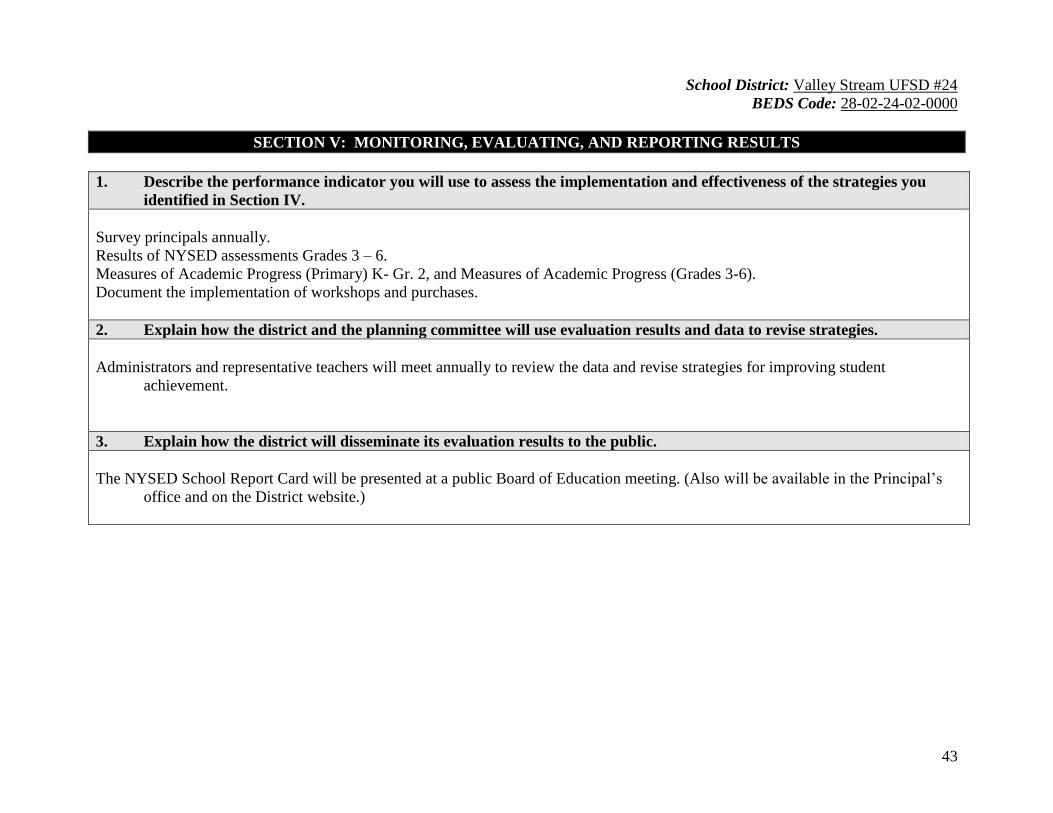
SECTION V: MONITORING, EVALUATING, AND REPORTING RESULTS
1. Describe the performance indicator you will use to assess the implementation and effectiveness of the strategies you
identified in Section IV.
Survey principals annually.
Results of NYSED assessments Grades 3 – 6.
Measures of Academic Progress (Primary) K- Gr. 2, and Measures of Academic Progress (Grades 3-6).
Document the implementation of workshops and purchases.
2. Explain how the district and the planning committee will use evaluation results and data to revise strategies.
Administrators and representative teachers will meet annually to review the data and revise strategies for improving student
achievement.
3. Explain how the district will disseminate its evaluation results to the public.
The NYSED School Report Card will be presented at a public Board of Education meeting. (Also will be available in the Principal’s
office and on the District website.)
Page 44
44
School District: Valley Stream UFSD #24
BEDS Code: 28-02-24-02-0000
SECTION VI: EVALUATION
2016 - 2019
Goal/Target
Success
Indicator
How Did
We Do?
Why?
Implications
For Updated Plan
The achievement of
the students in the
district will
improve from year
to year relative to
the Nassau County
benchmark.
Page 45
45
School District: Valley Stream UFSD #24
BEDS Code: 28-02-24-02-0000
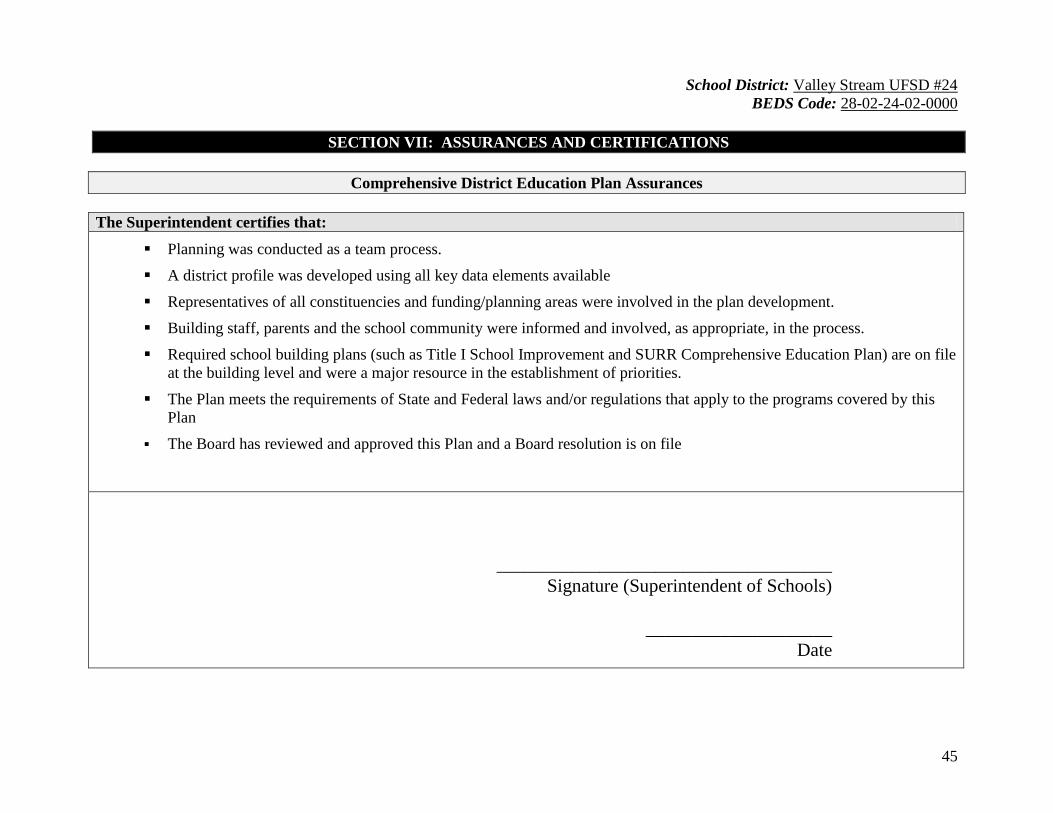
SECTION VII: ASSURANCES AND CERTIFICATIONS
Comprehensive District Education Plan Assurances
The Superintendent certifies that:
Planning was conducted as a team process.
A district profile was developed using all key data elements available
Representatives of all constituencies and funding/planning areas were involved in the plan development.
Building staff, parents and the school community were informed and involved, as appropriate, in the process.
Required school building plans (such as Title I School Improvement and SURR Comprehensive Education Plan) are on file
at the building level and were a major resource in the establishment of priorities.
The Plan meets the requirements of State and Federal laws and/or regulations that apply to the programs covered by this
Plan
The Board has reviewed and approved this Plan and a Board resolution is on file
____________________________________
Signature (Superintendent of Schools)
____________________
Date