Consortium for Research on Educational Access, Transitions and Equity School Drop Out in Bangladesh: New Insights from Longitudinal Evidence Ricardo Sabates Altaf Hossain Keith M Lewin CREATE PATHWAYS TO ACCESS Research Monograph No. 49 October 2010 University of Sussex Centre for International Education Institute of Education and Development, BRAC University, Dhaka, Bangladesh
Transcript
Consortium for Research onEducational Access,Transitions and Equity
School Drop Out in Bangladesh:New Insights from Longitudinal Evidence
Ricardo SabatesAltaf Hossain
Keith M Lewin
CREATE PATHWAYS TO ACCESSResearch Monograph No. 49
October 2010
University of SussexCentre for International Education Institute of Education and Development,
The Consortium for Educational Access, Transitions and Equity (CREATE) is a Research ProgrammeConsortium supported by the UK Department for International Development (DFID). Its purpose is to undertakeresearch designed to improve access to basic education in developing countries. It seeks to achieve this throughgenerating new knowledge and encouraging its application through effective communication and disseminationto national and international development agencies, national governments, education and developmentprofessionals, non-government organisations and other interested stakeholders.
Access to basic education lies at the heart of development. Lack of educational access, and securely acquiredknowledge and skill, is both a part of the definition of poverty, and a means for its diminution. Sustained accessto meaningful learning that has value is critical to long term improvements in productivity, the reduction ofinter-generational cycles of poverty, demographic transition, preventive health care, the empowerment ofwomen, and reductions in inequality.
The CREATE partners
CREATE is developing its research collaboratively with partners in Sub-Saharan Africa and South Asia. Thelead partner of CREATE is the Centre for International Education at the University of Sussex. The partners are:
The Centre for International Education, University of Sussex: Professor Keith M Lewin (Director)The Institute of Education and Development, BRAC University, Dhaka, Bangladesh: Dr Manzoor AhmedThe National University of Educational Planning and Administration, Delhi, India: Professor R Govinda
The Education Policy Unit, University of the Witwatersrand, South Africa: Dr Shireen MotalaThe Universities of Education at Winneba and Cape Coast, Ghana: Professor Jerome Djangmah,
Professor Joseph Ghartey AmpiahThe Institute of Education, University of London: Professor Angela W Little
Disclaimer
The research on which this paper is based was commissioned by the Consortium for Research on EducationalAccess, Transitions and Equity (CREATE http://www.create-rpc.org). CREATE is funded by the UKDepartment for International Development (DFID) for the benefit of developing countries and is coordinatedfrom the Centre for International Education, University of Sussex. The views expressed are those of theauthor(s) and not necessarily those of DFID, the University of Sussex, or the CREATE Team. Authors areresponsible for ensuring that any content cited is appropriately referenced and acknowledged, and that copyrightlaws are respected. CREATE papers are peer reviewed and approved according to academic conventions.Permission will be granted to reproduce research monographs on request to the Director of CREATE providingthere is no commercial benefit. Responsibility for the content of the final publication remains with authors andthe relevant Partner Institutions.
Address for correspondence:CREATE,Centre for International Education, Department of EducationSchool of Education & Social WorkEssex House, University of Sussex, Falmer BN1 9QQUnited KingdomTel: + 44 (0) 1273 877984Fax: + 44 (0) 1273 877534Author email: [email protected]
School Drop Out in Bangladesh:New Insights from Longitudinal Evidence
Ricardo SabatesAltaf Hossain
Keith M Lewin
CREATE PATHWAYS TO ACCESSResearch Monograph No. 49
October 2010
ii
iii
Contents
Preface......................................................................................................................................viiSummary.................................................................................................................................viii1. Introduction............................................................................................................................12. Background Literature ...........................................................................................................3
2.1 The child – health, gender and disability .........................................................................32.2 The child within the household........................................................................................42.3 Cost of schooling .............................................................................................................52.4 Household characteristics ................................................................................................52.5 Precursors to drop out ......................................................................................................62.6 School Drop Out in Bangladesh ......................................................................................7
3. Research Methods..................................................................................................................93.1 Data ..................................................................................................................................93.2 Outcome Variable ..........................................................................................................103.3 Predictors of Drop Out in the Data ................................................................................103.3.1 Factors that belong to the child...................................................................................10
3.3.2 The child and its relationship within the household ...............................................113.3.3 Cost of schooling and distance to school................................................................113.3.4 Households Characteristics.....................................................................................113.3.5 School precursors of drop out .................................................................................12
4.1 Drop Out versus Remained In School ...........................................................................144.2 Multivariate analysis: Drop Out versus In School.........................................................164.3 Drop Out versus Enrolled in School on 2009 but not 2007...........................................184.4 Multivariate analysis: Drop Out versus Enrolled in 2009 but not in School in 2007....204.5 Drop Out versus Permanently Out of School ................................................................204.6 Multivariate analysis: Drop Out versus Permanently Out of School.............................22
Table 1: Total number of children included in survey, rounds 1 and 2 .....................................9Table 2: Description of outcome variable (total number of children) .....................................10Table 3: Individual level factors: Drop Out versus Enrolled In School ..................................14Table 4: Child within household and child within school: Drop Out versus In School ..........15Table 5: Household and school variables: Drop Out versus In School ...................................16Table 6: Estimated odd ratio [s.d.] of likelihood of drop out: comparison group children whoremained in school ...................................................................................................................18Table 7: Individual level factors: Drop Out versus Enrolled in 2009 but not in School in 2007..................................................................................................................................................19Table 8: Household level factors: Drop Out versus Enrolled in 2009 but not in School in 2007..................................................................................................................................................19Table 9: Estimated odd ratio [s.d.] of likelihood of drop out: comparison group childrenenrolled in 2009 but not in school in 2007 ..............................................................................20Table 10: Individual level factors: Drop Out versus Permanently Out of School ...................21Table 11: Household level factors: Drop Out versus Permanently Out of School ..................21
iv
Table 12: Estimated odd ratio [s.d.] of likelihood of drop out: comparison group childrenpermanently out of education...................................................................................................22
v
List of Acronyms
BRAC Building Resources Across the Community
COMSS Community and School Studies
CREATE Consortium for Research on Educational Access, Transitions and Equity
EFA Education for All
EPDC Education Policy and Data Centre
GBP Great Britain Pound
GOB Government of Bangladesh
IED- Institute of Educational Development-BRAC UniversityBRACU
LRT Likelihood Ratio Test
UN United Nations
UPE Universal Primary Education
vi
Acknowledgements
This paper was developed from data collected by the Bangladesh CREATE team. Thehousehold survey was conceptualised by CREATE and designed within a frameworkdeveloped at the University of Sussex in workshops led by Keith Lewin. Proto-typeinstruments were piloted and adapted for use in Bangladesh and applied between 2007 and2009 by a team lead by Altaf Hossain who also oversaw data entry. Ricardo Sabates took thelead on developing this paper based on analysis of the cleaned data set and drew on ideasfrom other parts of CREATE and worked with the co-authors to generate the findingsreported here.
Special thanks are due to Benjamin Zeitlyn for his comments and painstaking editing of thisPTA paper. We are also thankful to Justine Rachel Charles for her indefatigable efforts tomake this report presentable. We are extremely thankful to all the families and children andlocal officials who participated in this project
vii
Preface
This paper offers a unique and important insight into patterns of drop out amongst a largescale sample of children from six districts across Bangladesh. Data collected in 2007 and2009 is used to track the characteristics of those who never enroll, those who enroll and dropout, and those who are enrolled in both periods. Clear differences emerge between the groupssome of which are individual level, some school level and some related to households. Thefindings suggest a range of possible interventions that have some potential to reduce drop outand the numbers who never enrol and those who enrol late. Growing numbers of drop outs,substantial amounts of migration, and multiple of deprivation paint a challenging picture ofwhat needs to be done to realise ambitions for full enrolment. It should be possible tocontinue tracking this cohort in future to establish whether the patterns identify persist.
This analysis is one of several being conducted on the data set that has been collected. Otherswill focus on equity and age in grade and other matters of concern for improved educationalaccess.
Keith LewinDirector of CREATECentre for International EducationUniversity of Sussex
viii
Summary
This paper examines factors associated with school drop out using longitudinal data collectedover a three year period in Bangladesh. A sample of 9,047 children, aged 4 to 15, wereselected by the CREATE Bangladesh research team across six districts for a specialisedhousehold survey developed in technical workshops. The survey was developed by CREATEthrough workshops in Sussex and Bangladesh and was based on a framework developed byKeith Lewin and Angela Little. The survey instruments were modified to suit the Bangladeshcontext and were first administered in 2007. The same cohort of children was followed upand resurveyed two years later in 2009.
Children aged 6 to 15 were selected since all these children should have been in school orhave completed primary education in the first round of the survey. Four groups of childrenwere identified: (i) those who were enrolled in school in both 2007 and 2009, (ii) those whodropped out by 2009, (iii) those who were not enrolled in 2007 but were in 2009 and (iv)those excluded from education in both 2007 and 2009.
First, children who dropped out were compared with those who remained in education. Thosewho dropped out were on average older, had repeated more school grades, came from lowerincome families, had parents with lower levels of education, had more householdresponsibilities, and significantly received less support from parents for their school work.
Second those who were not enrolled in 2007 but were in 2009 were similar in householdcharacteristics to drop outs. These children were becoming progressively over age between2007 and 2009 and it is likely that the factors that discouraged enrolment in 2007 persistedinto 2009. Poverty, low levels of parental education, and unskilled parental occupations arefactors related to late entry into education of these children and these are also factors relatedto drop out of those who do enrol. Children who start school late are more at risk of droppingout than those enrolled at the appropriate age.
Third, the characteristics of children who remained permanently excluded from educationbetween 2007 and 2009 were and compared with children who enrolled but dropped out fromschool. Children who were permanently excluded from education were more likely to bedisabled and less likely to play normally than children who dropped out. These excludedchildren were poorer, both economically and educationally, than families of children whodropped out.
This study identifies some possible interventions that could reduce educational exclusion.These include campaigns to reduce late entry and overage enrolment caused by repetition ofgrades; reductions in direct costs to households of attendance, more support for lowachieving children or compensate for lack of educational support at household level, andinterventions designed to lessen the impact of disabilities on enrolment and attendance.
1
School Drop Out in Bangladesh:New Insights from Longitudinal Evidence
1. Introduction
Effective policies to improve school progression and reduce the numbers of childrendropping out of school are critical if Universal Primary Education (UPE) is to be achieved.Although children are starting primary school in greater numbers than ever before, the rate atwhich children drop out from school remains high in many low income countries where overhalf of the children who start primary school do not complete the full cycle of education(Lewin and Sabates, 2011). In Bangladesh although entry into Grade 1 has reached nearuniversal levels the primary school completion rate has remained around 60 percent since2000 (World Bank, 2009). Repetition and drop out remain substantial problems.
There are many factors associated with the process of dropping out from school. Some ofthese factors belong to the individual or child, such as poor health, under-nutrition or lack ofmotivation to learn (Hunt, 2008). Others emerge from children’s household situations such aschild labour, migration and poverty. School level factors also play a role in increasingpressures to drop out such as teacher absenteeism, school location and poor qualityeducational provision (Alexander, 2008). The system of educational provision at thecommunity level generates conditions that can ultimately have an impact on the likelihood ofchildren dropping out from school. Both demand and supply driven factors, embedded incultural and contextual realities, impact on the process of dropping out from school.
Most empirical evidence on drop out from large scale surveys is based on informationcollected at one point in time. Children who are in school are compared with those who wereonce in school but who at the time of the survey were not enrolled in order to investigate thepossible causes of school drop out. This approach has two shortcomings. First, mostobservable factors are measured after children have dropped out from school, and are onlyable to provide post facto explanations of drop out. Second, this approach fails to recognisethat drop out is often a complex process which may include sequences of inter related events(Lewin, 2007; Hunt, 2008). Thus the process of dropping out from school needs to be studiedover time and be related to a number of possible determinants in order to understand itsdynamics.
This paper explores the factors associated with school drop out using longitudinal datacollected over a three year period in Bangladesh. A sample of 9,047 children, aged 4 to 15,were selected by the CREATE Bangladesh research team from six districts for a specialisedhousehold survey developed and pretested in technical workshops. The survey instrumentswere developed in workshops in Sussex University based on a framework developed byKeith Lewin and Angela Little. It was then developed and pre-tested by the BangladeshCREATE team. The survey was first administered in 2007. The same cohort of children wasfollowed up and resurveyed two years later in 2009. Children aged 6 to 15 were selectedsince all these children should have been in school or have completed primary education inthe first round of the survey. Four groups of children were identified: (i) those who wereenrolled in school in both 2007 and 2009, (ii) those who dropped out by 2009, (iii) those whowere not enrolled in 2007 but were in 2009 and (iv) those excluded from education in both2007 and 2009. The longitudinal nature of the data enables us to investigate patterns ofschool drop out and ‘drop in’ (out of school children who return to school) over time.
School Drop Out in Bangladesh: New Insights from Longitudinal Evidence
2
The analysis takes a close look at children’s situation at home and in school and therelationship between the home and the school in order to bring new evidence of the reasonswhy children are dropping out. Do children who drop out from school receive less supportfrom teachers and parents than children who remained in education? Do children who dropout have more substantial household chores than children who remained in education? Arethey older? Are they more likely to be sick or have disabilities, etc? We also examine theincome poverty which is often cited as a cause of drop out. Rather than only associatingfamily income at one point in time with drop out, we investigate whether both the magnitudeand changes in the financial situation of the household is related to decisions to leaveeducation. This analysis also provides some insight into the role of fluctuations in income asa determinant of school drop out.
Our paper has strong foundations in the CREATE model of educational access (Lewin,2007). In particular, this paper compares children who have dropped out from education(Zone 3) with those who have never been enrolled (Zone 1) and in this sense remainedpermanently excluded from educational opportunities. In addition, we also identify childrenwho start or re-enter education after the official age of entry into primary school and comparethem with children who drop out. Although children who start or re-enter education late maybe considered a net gain towards achieving UPE, it is probable that these children thesechildren are more likely to drop out and may be “silently excluded” (Lewin, 2009) andleaning little. Without additional support these children are likely to remain at risk of notcompleting a full cycle of primary and lower secondary education.
This paper is structured as follows. Section 2 reviews the background literature on schooldrop out, drawing on the work of CREATE and especially Hunt (2008) with the addition ofrecent material on Bangladesh. Section 3 describes the methods, data and estimation, to beused for the analyses, which are presented in Section 4. Results are divided according towhether children were in education, dropped out, entered education after 2007, or wereexcluded from education in 2007 and 2009. Since the focus of this paper is on drop out, allthe results are discussed relative to the group of children who drop out. The paper ends with adiscussion of the main findings and the implications for policy.
School Drop Out in Bangladesh: New Insights from Longitudinal Evidence
3
2. Background Literature
There are many factors associated with drop out, some of which are associated with theindividual, such as poor health or under-nutrition and children’s school motivation. Othersemerge from children’s household situations such as child labour and poverty. School levelfactors also play a role in increasing pressures to drop out such as teacher’s absenteeism,school location and poor quality educational provision. The nature of educational provisionat the community level e.g. type of school, level of community support) generates conditionsthat can ultimately have an impact on the likelihood of children dropping out from school.Both demand and supply driven factors play a role in the process of school drop out.
In this section, we review studies on the causes of school drop out focusing on the childwithin the household and school contexts. This review is informed by the workcommissioned by CREATE by Hunt (2008) and Pridmore ((2007). We discuss evidence onthe child’s health, gender and disability; the child within the household; the cost ofschooling; household characteristics; precursors to drop out; and recent studies fromBangladesh.
2.1 The child – health, gender and disability
Personal characteristics of a child, influenced by social norms can determine whether thechild drop out from education. Some studies explore associations between child health andeducational outcomes, in particular how nutritional status impacts on school enrolment andcognitive development (Ghuman et al, 2006; Alderman et al, 2001) but only a few studieslook at how health problems are directly related to dropping out from school (Pridmore,2007). In general, studies suggest that poor health is often a result of poverty and throughunder-nutrition, children’s educational access and attainment are severely jeopardised. Thusthere is evidence that haemoglobin levels in the blood, and height and weight (body mass forage), are both indicators of nutritional status, and have significant and positive associationswith school enrolment (Alderman et al, 2001; Ghuman et al, 2006). In addition, early childunder-nutrition is associated with delayed school enrolment (Glewwe and Jacoby, 1995). InBangladesh nutrition deficiencies are associated with slow school progress due to its impacton children’s cognitive development (Grira, 2001).
The patterns and process of school drop out are likely to be substantially different for boysand girls. Different social norms, values, beliefs, traditions and practices have strongdiscriminatory elements mitigating against girl’s educational persistence and performance(Colclough et al, 2000) and in many areas drop out from education is disproportionatelyexperienced by girls (Bandyopadhyay and Subrahmanian, 2008; Hossain, 2010b) thoughthere are an increasing number of locations where boys drop out more frequently, especiallywhere there are income earning opportunities. In addition, there may be a gendereddimension of intra-household resource allocation. This may imply a reduced willingness tosupport girls’ education when resources are insufficient to cover all children, or when costsincrease (Nekatibeb, 2002).
Reproductive health problems and teenage pregnancy push girls out of school in manycountries. Several studies have shown that pregnancy is a major cause of dropout of girlsfrom school (Dunne and Leach, 2005; Grant and Hallman, 2006; Cardoso and Verner, 2007).As well as pregnancy, early marriage, child slavery, child fostering, trafficking, and multiplehousehold duties for girls are some of the reasons behind the higher likelihood that girls
School Drop Out in Bangladesh: New Insights from Longitudinal Evidence
4
leave the educational system before boys in societies where their rights are not secured andwhere social norms undervalue girls’ education (Vavrus, 2002; Tuwor and Antoinette, 2008).As suggested by Brock and Cammish (1997):
The onset of puberty is an important factor in its effect on girls’ education. We haveseen that it increases vulnerability and may therefore make parents decide to withdrawtheir daughters from school. Distance to school, the lack of female teachers, poor ornon-existent toilet facilities and the necessity to board away from home can be factorscontributing to such a decision at this age (Brock and Cammish, 1997:47).
Finally, disabilities are another important factor that may contribute to school drop out. Amajor issue with disability is that many children in low income countries who suffer from aphysical or psychological impediment are denied access to education (Peters, 2003). Whendisabled children do have access to education, their chances of completion of a full cycle areseverely limited due to the unavailability of resources, specially trained teachers and clearschool policy guidelines regarding disabled children (Peters, 2003). In Bangladesh, forexample, children with disabilities are less likely to start school and if they do, their overallschool attainment and possibilities for transition into lower secondary schooling remain verylow (Filmer, 2005). Birdsall et al. (2005) claim that only around five percent of the world’schildren who have some form of disability complete primary schooling; many never enrol ordropout very early. Disability, therefore, remains an important issue to be tackled both interms of access to school and progression through to successful completion of basiceducation.
2.2 The child within the household
The family context, in particular the relationship of the child with other members of thehousehold and the child’s responsibilities may be important determinants of school drop out(Rose and Al-Samarrai, 2001; Khanam, 2008). In many poor countries children combineschool with work (at home or away from home) in order to satisfy household needs(Admassie, 2003).
However, not all forms of child labour are compatible with school participation (Hadley,2010). Some labour activities, especially in agriculture, are seasonal and the timing ofseasons do not correspond to the school calendar (Hadley, 2010). Other activities, such aschild care for younger members in the household, are labour intensive and time consumingand may detract from children’s ability to undertake school work (Dar et al, 2002).
Another important aspect of the life of children within the household is the relationship withtheir parents, in particular the support given by parents with the child’s schooling and theperceptions of parents about the potential benefits of education for their children (Ananga,2011 forthcoming). It is likely that parental support for the child’s education is linked tolower chances that the child will drop out from schooling. Not all parents are engaged withtheir children’s education. A study by Liu (2004) in China found that the majority of parentswere indifferent about their children dropping out from school and left the schooling decisionto the child, particularly for older children. Liu (2004) suggested that parents do not want tobe blamed by the child for not continuing in education, particularly at junior secondary level.
School Drop Out in Bangladesh: New Insights from Longitudinal Evidence
5
2.3 Cost of schooling
The direct and indirect costs of schooling can exclude some children from school. One of themost important direct costs underlying the process of drop out is school fees where these arelevied. Thus school fees were found to be a potent reason for drop out of 27 percent of boysand 30 percent of girls before matriculation in South Africa (Hunter and May, 2002). Manycountries have now adopted fee free for the basic education cycle because of the effects onparticipation. Some have also introduced capitation systems to offset the loss in schoolincome. But other charges and indirect costs continue to be an obstacle to enrolment of thepoorest households (Lewin, 2008).
Thus the costs of pens/pencils, copybooks, private coaching, transportation, and schooluniform remain a relative economic burden for poor households (Ananga, 2011forthcoming). Lack of money to buy essential school materials for children’s schooling islikely to cause lack of enrolment in the first place and potentially high dropout at a later stage(Kadzamira and Rose, 2003). This is the case in Kenya, where dropout rates among thechildren of economically vulnerable families have gone up due to lack of resources to pay forthe costs of education for their children that are not covered by the fee free educational policy(Mukudi, 2004). The ‘cost-sharing’ policy of Kenya compelled parents to pay about 65percent of school costs, which caused many poor children to drop out (Ackers et al, 2001).
The opportunity cost of schooling is the income forgone of the next best activity available forchildren who are in education. These activities relate to child labour or caring responsibilitiesboth within and outside of the household (see Section 2.2 above). The opportunity cost forchildren who are in schooling often increases as they get older, which increases the pressureon them to withdraw from school (Colclough et al, 2000). In Bangalore, India, for example,if the wage earnings of parents are low children may be called to supplement householdincome either by working or by taking on other household responsibilities to free up otherhousehold members for work (Chugh, 2004). This is likely to increase the risk that childrendrop out from education.
2.4 Household characteristics
Several studies have focused on income and dropout. Most of these studies are undertaken ata macro-level. A UN taskforce report on education and gender equality on low and middleincome countries shows that completion rates are lowest for children from poor householdsand less than half of the poorest children complete even the first year of school (Birdsall et al,2005). At a micro-level, family income is directly linked to the affordability of education andas such has a direct impact on whether children attend education (Hadley, 2010). If childrendo attend education, changes in the financial situation of parents, as reflected by the volatilityof family income, may push some children out of education. Although this may be atemporary effect and income may recover and return to schooling (Kane, 2004; Hadley,2010).
Another important factor that is often related to drop out is parental education level(Chowdhury et al, 2002; Nath et al, 2008). Parents with low levels of education are morelikely to have children who do not attend school. If they do, they tend to drop out in greaternumbers (Blick and Sahn, 2000; Brown and Park, 2002) and engage in more incomegenerating activities than children of parents with high levels of education (Duryea, 2003;Ersado, 2005). A recent case study of a rural village in Ghana showed parental illiteracy was
School Drop Out in Bangladesh: New Insights from Longitudinal Evidence
6
associated with low household income as two important factors likely to cause girls to dropout (Pryor and Ampiah, 2003). Furthermore, there may be some gendered dimensions to thelinks between parental education and children’s drop out with differential effects for boysand girls (Connelly and Zheng, 2003). For girls, the risk of becoming pregnant, and hencepotentially dropping out of school, declines significantly as the educational attainment of thehousehold head increases (Grant and Hallman, 2006).
Finally, children whose parents/siblings fall ill might be expected to be caregivers for thesesick relatives, at times causing them to miss or drop out of school. This is especially the casefor girls (Case and Ardington, 2006; Kane, 2004). A study of adolescents in South Africashows that household members who had experienced illness in the last three months wereassociated with a higher likelihood of dropping out from school for boys than for girls(Hunter and May, 2002). A study of HIV/AIDS affected families in Kenya show children’sreduced chances of completing school from the affected families (Akunga et al, 2000).
2.5 Precursors to drop out
The process of dropping out from school may have precursors. CREATE has hypothesisedthat these are likely to include the child not attending school regularly, low achievement,grade repetition, and late enrolment (Lewin, 2007). These precursors or signs that the child islikely to drop out and are different from school level factors that are associated with thedecision to drop out from school, such as school quality, safety or relationship with teachers(Tikly and Barrett, 2010). The latter are not included in this brief review but have beendiscussed by Hunt (2008).
Grade repetition and late enrolment cause the child to be over the age-in-grade appropriate.Over age entry and progression delays primary school completion to ages where boys andgirls may be subject to growing pressure to contribute to household income and to enter intomarriage (Lewin, 2007). Roderick (1994) shows that in the U.S. children who repeat grades(from kindergarten to Grade 6) are significantly more prone to drop out even after controllingfor difference in background characteristics. As explained above, older children have higheropportunity cost of schooling which is linked to the probability of drop out. Similarly, oldergirls face issues of school safety, teenage pregnancy and marriage which are associated withdropping out from school, and this is particularly important in low enrolment countries.
Although it is expected that children with low achievement are more likely than those withhigher achievement to drop out, empirical evidence is scarce (Boyle et al, 2002; Hunter andMay, 2002). Evidence from rural South Africa has shown that children who were enrolled inGrade 2 and had low achievement, were less likely to complete Grade 7 than children whohad high achievement (Liddell and Rae, 2001). Each additional standard deviation scored inGrade 2 exams resulted in children being 4.8 times as likely to reach Grade 7 withoutrepeating a year of schooling.
According to Hunt (2008) irregular attendance and temporary withdrawals can be caused bya range of factors including: child ill health; ill health of family members; distance to school;labour requirements; pending school fees. As a result of irregular attendance or temporarywithdrawal, children can fall behind at school and find it difficult to readjust on returning.
School Drop Out in Bangladesh: New Insights from Longitudinal Evidence
7
2.6 School Drop Out in Bangladesh
High repetition and dropout rates are two barriers to universalising access to primaryeducation in Bangladesh. The levels of these two indicators are the main reasons behindBangladesh being ‘off-track’ to achieve the completion of universal primary education by2021 (National Audit Office, 2010). A document produced by the Bangladesh governmentshows a 55 percent survival rate to the final grade of elementary school in 2008 (53 percentboys and 57 percent girls), which means that 45 percent of children who enter in Grade 1 arelikely to drop out without completing primary school (GoB, 2009). Government informationshows the dropout rates at primary level have been falling slowly, from around 60 percent in1991 to 48 percent in 2004 as described in Figure 1. The decline is far too slow to allowuniversal completion by 2015.
Figure 1: Dropout rate by year: Bangladesh
0
20
40
60
80
100
1991
1992
1993
1994
1995
1996
1997
1998
1999
2000
2001
2002
2003
2004
Year
%of
cycle
dro
pout
Source: DPE records for GPS and RNGPS schools (Ahmed et al, 2007). Notes: Dropout calculatedas ratio of student who dropout during the year relative to total students registered in that year.
In many cases, children enter school but remain ‘silently excluded’ (Lewin 2007), whichmeans that they have poor attendance records and very low school performance. In addition,they suffer from a lack of learning materials, the inability to pay school fees and employprivate tutors (Karim, 2004), and are largely oblivious of teachers in the teaching sessions(Hossain, et al, 2003). All these factors increase the chances that children in Bangladesh donot complete primary education.
From recent literature in Bangladesh there are two major reasons for drop out. Over 40percent children who dropped out of primary schools indicated that poverty was the mainreason. Disliking school was cited by 37.5 percent as a main reason (Ahmed et al, 2005).Hossain et al. (2009) found that:
Drop out children came from households with significantly lower income, and whichwere twice as likely to be ‘always in need’ on the food security measure. Similarly,these households were more likely to have a household head working in unskilledwork, less likely to own a desk, radio, television or mobile phone, less likely to haveelectricity and more likely to have poor ventilation (Hossain et al., 2009:50).
School Drop Out in Bangladesh: New Insights from Longitudinal Evidence
8
At the secondary level, over half of the girls reported their cessation of schooling was due tomarriage, a reason cited by only 2 percent of boys. Boys’ departure was more likely to be dueto the necessity for income earning for their families (44 percent), a reason much lessfrequently cited for girls drop out (Nath, et al., 2008).
Various editions of ‘Education Watch’, the NGO produced annual assessment of the status ofeducation in Bangladesh, contain insights into drop out but none to date have attempted totrack a cohort of children over several years. We now turn to the data that CREATE has beenable to assemble by following a cohort of children from 2007.
School Drop Out in Bangladesh: New Insights from Longitudinal Evidence
9
3. Research Methods
The review of the literature confirms that the child and his/her responsibilities within thehousehold, and the relationship between the school and the household are important factorsinfluencing the process of drop out. In addition, poor school performance, low attendanceand late enrolment are likely to be signals for teachers that children with these characteristicsare more likely to drop out. In this section we describe the methods we used to investigatethese issues empirically.
3.1 Data
CREATE’s partner in Bangladesh, the Institute of Educational Development-BRACUniversity (IED-BRACU) has developed Community and School Studies (ComSS) in sixlocations, one in each of the administrative divisions of Bangladesh within the frameworkgenerated by the CREATE. The study covered 6,696 households with 9,045 children age 4-15 years from 18 school catchment areas (12 government primary schools and 6 registerednon-government primary schools). Table 1 shows the total number of children aged 4 to 15 in2007 and the corresponding number of children aged 6 to 17 in 2009 by their educationalstatus, whether they were in school, had dropped out from school or had never been enrolledin education.
The survey was designed to understand the overall access to basic education situation inthese districts in Bangladesh using CREATE’s conceptual model of ‘zones of exclusion’(Lewin, 2007). As a part of this COMSS study, a baseline survey was conducted in 2007 andafter two years, in 2009, a follow up survey was done with the same households. This paperuses the data from both survey rounds to understand school dropout in Bangladesh.
We identified children who have been excluded from education in both 2007 and 2009 whoare in ‘zone 1’ – never enrolled. We also identified children who dropped out from primaryschool (zone 2), and those who were enrolled in 2009 but not 2007. In principle it is alsopossible to identify those who are at risk of non-completion of the educational cycle (zone 3)because they had one or more of the following characteristics - irregular attendance, lowattainment or grade repetition. This is consistent with the CREATE definition of zones ofexclusion. Taking into consideration all the zones of exclusion significantly increases thenumber of possible patterns of educational access over time and in this paper we have chosento concentrate on drop out.
Table 1: Total number of children included in survey, rounds 1 and 2
School Drop Out in Bangladesh: New Insights from Longitudinal Evidence
10
3.2 Outcome Variable
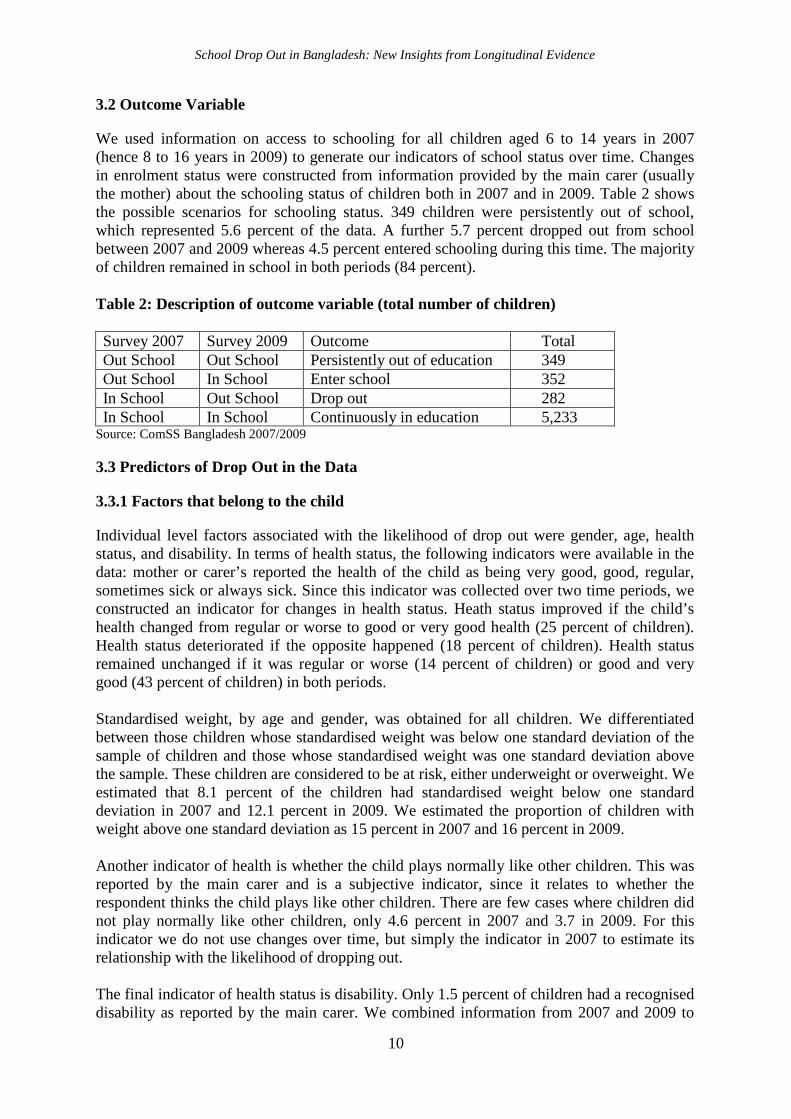
We used information on access to schooling for all children aged 6 to 14 years in 2007(hence 8 to 16 years in 2009) to generate our indicators of school status over time. Changesin enrolment status were constructed from information provided by the main carer (usuallythe mother) about the schooling status of children both in 2007 and in 2009. Table 2 showsthe possible scenarios for schooling status. 349 children were persistently out of school,which represented 5.6 percent of the data. A further 5.7 percent dropped out from schoolbetween 2007 and 2009 whereas 4.5 percent entered schooling during this time. The majorityof children remained in school in both periods (84 percent).
Table 2: Description of outcome variable (total number of children)
Survey 2007 Survey 2009 Outcome TotalOut School Out School Persistently out of education 349Out School In School Enter school 352In School Out School Drop out 282In School In School Continuously in education 5,233
Source: ComSS Bangladesh 2007/2009
3.3 Predictors of Drop Out in the Data
3.3.1 Factors that belong to the child
Individual level factors associated with the likelihood of drop out were gender, age, healthstatus, and disability. In terms of health status, the following indicators were available in thedata: mother or carer’s reported the health of the child as being very good, good, regular,sometimes sick or always sick. Since this indicator was collected over two time periods, weconstructed an indicator for changes in health status. Heath status improved if the child’shealth changed from regular or worse to good or very good health (25 percent of children).Health status deteriorated if the opposite happened (18 percent of children). Health statusremained unchanged if it was regular or worse (14 percent of children) or good and verygood (43 percent of children) in both periods.
Standardised weight, by age and gender, was obtained for all children. We differentiatedbetween those children whose standardised weight was below one standard deviation of thesample of children and those whose standardised weight was one standard deviation abovethe sample. These children are considered to be at risk, either underweight or overweight. Weestimated that 8.1 percent of the children had standardised weight below one standarddeviation in 2007 and 12.1 percent in 2009. We estimated the proportion of children withweight above one standard deviation as 15 percent in 2007 and 16 percent in 2009.
Another indicator of health is whether the child plays normally like other children. This wasreported by the main carer and is a subjective indicator, since it relates to whether therespondent thinks the child plays like other children. There are few cases where children didnot play normally like other children, only 4.6 percent in 2007 and 3.7 in 2009. For thisindicator we do not use changes over time, but simply the indicator in 2007 to estimate itsrelationship with the likelihood of dropping out.
The final indicator of health status is disability. Only 1.5 percent of children had a recogniseddisability as reported by the main carer. We combined information from 2007 and 2009 to
School Drop Out in Bangladesh: New Insights from Longitudinal Evidence
11
generate an indicator of disability. We did this as it is likely that a disability condition stayswith the child for a long period, hence the fact that it was not reported in one time periodcould be due to the non-recognition of the problem. Even after combining this information,only 163 children were identified as disabled (2.6 percent of children). It is possible thatother children are disabled but were not reported by households.
3.3.2 The child and its relationship within the household
One of the important indicators to capture the situation of the child within the household ischild labour and child household responsibilities within the household. The ComSS datacontain detailed information on the time spent on different activities, both within thehousehold and outside of the household for children who were in school during 2007. Timespent on household work included all household chores and looking after other members.Time spent on income generating activities was divided into remunerated work for familyand remunerated work outside the family. Over the two years, we estimated an increase inthe time spent by children who were in school on household work (on average from 51 to 56minutes a day), an increase in time spend on remunerated activities for the family (onaverage from 5.6 to 7.0 minutes a day) and a decrease in time spent on remunerated activitiesin the labour market (on average from 0.5 to 0.2 of a minute a day). We can only estimate thetime spent on activities other than school work for children who were in school in 2007. Wecan then estimate whether time spent working was higher for children who dropped out in2009 relative to children who remained in school in 2009.
Another useful indicator is whether children asked for help with school work and whetherthis help was given, either by parents or another family member. Of all children in school in2007, 75 percent asked for help and got help from parents or another family member, 6.4percent asked for help but did not get any help and 18 percent never asked for help. Again,this information is only available for children who were in school in 2007; hence it is onlyuseful when comparing children who dropped out with those who remained in schoolbetween 2007 and 2009.
Parental interest in the children’s schooling was measured by whether household membershave attended teacher-parent meetings (49 percent of households), have gone to school totalk to the teacher (57 percent of households), or have been visited by the teacher (50 percentof households) within the last year. This information was only collected for children whowere enrolled in school in 2007.
3.3.3 Cost of schooling and distance to school
Cost of schooling was measured by the total yearly expenditure on education, including alldirect and indirect cost of schooling, except opportunity costs. On average, 3.5 percent ofparental annual income was used for the child’s education. Distance to school was measuredin kilometres, with an average distance between households and school of one kilometre.
3.3.4 Households Characteristics
Household level variables included household income, parental education, parentaloccupation, and other socio-demographic information of the household. Household incomewas measured in both time periods. Real income was obtained by deflating yearly income by17 percent, which is the estimated inflation rate between 2007 and 2009. Average income in
School Drop Out in Bangladesh: New Insights from Longitudinal Evidence
12
real prices was 5,588 Taka in 2007 and 5,337 Taka in 2009, a reduction in real income of 4.5percent1. Two indicators were obtained for household income, real per capita income and theproportion of households below the 50 cents a day poverty line2. Since these indicators werecollected in both periods, we were able to measure changes over time.
Parental education was measured by the highest level of education of the mother or father(46.6 percent with some primary education). Parental occupation was measured by a dummyvariable to differentiate those in unskilled or low-status occupations (47 percent ofhouseholds) from the rest. The child dependency ratio was measured by the number ofchildren under the age of 15 relative to the household size (0.50) and the total dependencyratio was measured by the number of children and elderly relative to the total household size(0.52). Female-headed households were differentiated from male-headed households (only6.1 percent of households were headed by women).
3.3.5 School precursors of drop out
For all children going to school in 2007, information was collected on school attendance,repetition, relative performance in class, and age-in-grade. Weekly attendance was measuredby the number of days the child was absent from school during the week prior to the survey(8 percent of children who were in school in 2007 were absent for at least one day). Graderepetition was measured by the number of times the child had repeated a school year (16percent of ongoing school children in 2007 had repeated at least once). Child schoolperformance was measured by the mother’s or main carer’s perception on whether the childwas among the top 25 percent, the upper middle, the lower middle or the lowest 25 percent ofthe class. This was necessary in the absence of any standardised tests. The distribution ofresponses was biased towards the middle part of the distribution, with only 10 percent ofmothers rating their children among the lowest 25 percent of the distribution. In addition, 14percent of the mothers did not know their children’s relative performance in school. Finally,on-time progress in school was measured by the proportion of children who were enrolled inthe right grade for their age (80 percent of children enrolled in school in 2007 were in thecorrect grade for their age)3. All this information is useful when comparing children whodropped out with those who remained in school between 2007 and 2009.
3.4 Analytical Strategy
The longitudinal nature of the data enables us to observe children entering into education,children dropping out of education, children remaining out of education and childrenremaining in schooling over the two year period. Hence, we investigate factors associatedwith the likelihood of children belonging to each of these groups. For example, we expectpositive changes in health to be associated with lower likelihood of school drop out andhigher likelihood of children entering into education. At the same time, positive changes in
1 Bangladeshi Taka-GBP exchange rate 132 Taka per GBP in 2007 and 115 Taka per GBP in 2009.2 Most households interviewed lived below the US 1 Dollar a day (90 percent of the households). Hence the US0.50 Cents a day was a better indicator for this sample to differentiate those who were living in extreme poverty.3 Age-in-grade was considered for those children who were of the age appropriate or one year above. This is toavoid discrepancies between school year cycle and calendar year. So children aged 6 and 7 were considered tobe in age appropriate for Grade 1, those aged 7 and 8 for Grade 2, and so on. This is discussed at greater lengthin Hossain (2010b).
School Drop Out in Bangladesh: New Insights from Longitudinal Evidence
13
health could have a sustaining effect on children remaining in education and lowering thechances that children will remain persistently out of education4.
For each of the factors described in Section 3.3, we investigate whether there is a relationshipwith school status over time. Empirically, we use contingency tables as well as statisticaltools to test for independence and strength of the relationship between predictor and ouroutcome variable. Statistical tests used depend on the nature of these variables. Our outcomevariable drop out is categorical, and is related to measurements of independent factors. Someof these are ordinal, such as parental education, others continuous, such as parental income,and still others categorical, for example changes in health status.
In order to investigate the relationship between these factors and the likelihood of drop outwe use multivariate regression analysis. We compare children who dropped out from schoolbetween 2007 and 2009 (352 children). Other children are divided into three groups: thosewho remained out of school during this period (349 children); children who entered intoeducation (282 children); and children who remained in education during this period (5,233children). In order to simplify the analysis and the interpretation of results we use logisticregression for each of the comparisons5. With this analytical strategy our aim is to estimatedifferences between the children who actually dropped out and another marginalised group(children who are permanently excluded from education). We also estimate differencesbetween children who dropped out and those who enrolled in education by 2009. Finally, weestimate differences between children who dropped out and those who remained permanentlyin education. Some of the children who were enrolled may be silently excluded fromeducational access as suggested by the CREATE conceptual model of zones of exclusion.
4 Of course one could argue that movements in and out of school are not the result of changes in health statusbut that the opposite is true (reverse causality). School drop out (or drop in) may be associated with changes inhealth status since children’s health can improve as a result of schooling. For example, the provision of schoolmeals can improve child nutrition. Reverse causality is problematic if the aim of the paper were to test causalityin a narrow sense. Our empirical evidence identifies associations that identify the correlates of drop out.5 An alternative approach is to use multinomial logit models. In general, the multinomial logit model is thegeneralisation of the logit model. In the multinomial logit model, we leave one group as comparison andestimate the factors that predict the relative risk that children fall into one of the categories relative to thereference category. The independence of irrelevant alternatives and the zero correlation of residuals imply thatresults from the multinomial logit model are equivalent to those obtained from the combinations of logit models.However, there are several factors that can only be used to compare children who dropped out with those whoremained in school, hence the usefulness of estimating independent logit models.
School Drop Out in Bangladesh: New Insights from Longitudinal Evidence
14
4. Results
4.1 Drop Out versus Remained In School
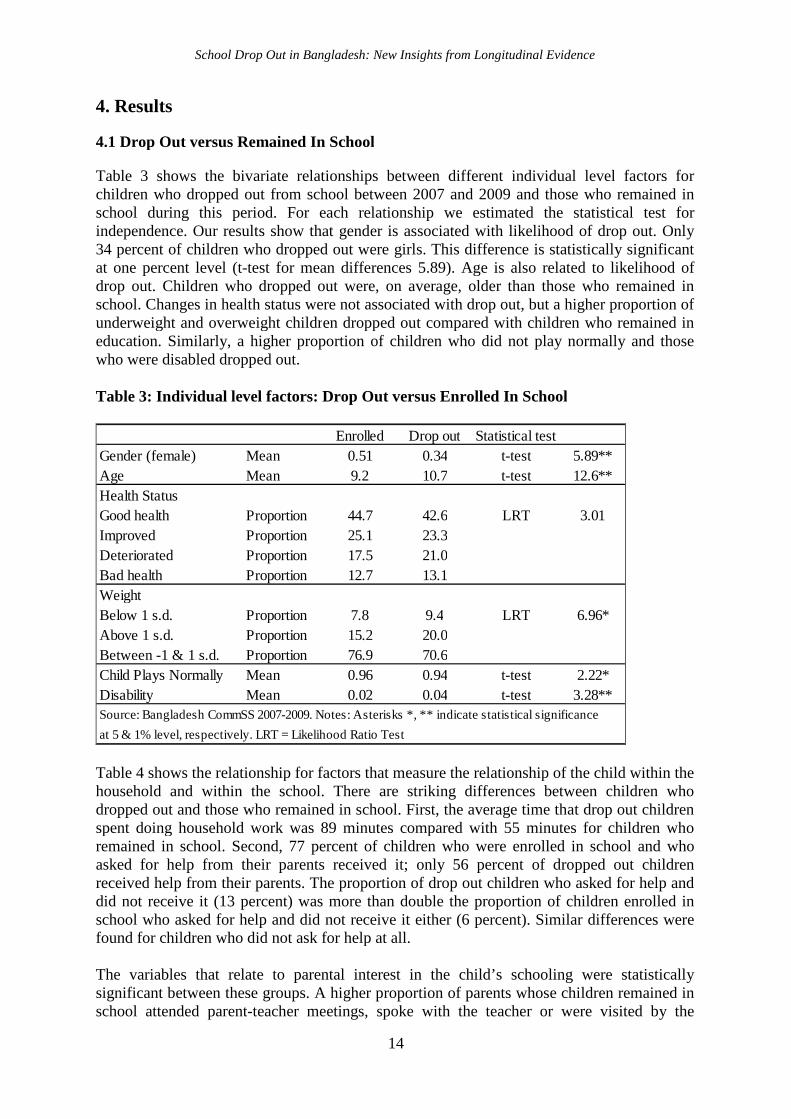
Table 3 shows the bivariate relationships between different individual level factors forchildren who dropped out from school between 2007 and 2009 and those who remained inschool during this period. For each relationship we estimated the statistical test forindependence. Our results show that gender is associated with likelihood of drop out. Only34 percent of children who dropped out were girls. This difference is statistically significantat one percent level (t-test for mean differences 5.89). Age is also related to likelihood ofdrop out. Children who dropped out were, on average, older than those who remained inschool. Changes in health status were not associated with drop out, but a higher proportion ofunderweight and overweight children dropped out compared with children who remained ineducation. Similarly, a higher proportion of children who did not play normally and thosewho were disabled dropped out.
Table 3: Individual level factors: Drop Out versus Enrolled In School
at 5 & 1% level, respectively. LRT = Likelihood Ratio Test
Table 4 shows the relationship for factors that measure the relationship of the child within thehousehold and within the school. There are striking differences between children whodropped out and those who remained in school. First, the average time that drop out childrenspent doing household work was 89 minutes compared with 55 minutes for children whoremained in school. Second, 77 percent of children who were enrolled in school and whoasked for help from their parents received it; only 56 percent of dropped out childrenreceived help from their parents. The proportion of drop out children who asked for help anddid not receive it (13 percent) was more than double the proportion of children enrolled inschool who asked for help and did not receive it either (6 percent). Similar differences werefound for children who did not ask for help at all.
The variables that relate to parental interest in the child’s schooling were statisticallysignificant between these groups. A higher proportion of parents whose children remained inschool attended parent-teacher meetings, spoke with the teacher or were visited by the
School Drop Out in Bangladesh: New Insights from Longitudinal Evidence
15
teacher. This last association may indicate that where teachers do visit households of those atrisk of drop out their interventions do have the effect of reducing subsequent drop out.Children who ended up dropping out from school had higher levels of absenteeism, graderepetition, and being overage for their grade.
School precursors of drop out, absenteeism, grade repetition, over age and performance,showed the expected results with respect to drop out. On average, children who dropped outby 2009 already had greater school absenteeism in 2007 than children who remained inschool. Similarly, children who dropped out had also higher grade repetition in 2007 thanchildren who remained in school between 2007 and 2009. Drop out children were morelikely to be over age by two or more years (33 percent) compared with children whoremained in school (23 percent). Finally, children who dropped out were more likely to beidentified by their carers as not performing academically relative to other children. A greaterproportion of children who dropped out were identified as in the lower-middle part of theperformance classification. There was some evidence that caregivers had difficulty placingtheir children on different points of the achievement distribution since this was a subjectivemeasure based on information from schools and children which varied between schools.
Table 4: Child within household and child within school: Drop Out versus In School
Enrolled Drop out Statistical test
Child Within Household
Time spent working Mean 0.91 1.49 t-test 9.43**
Ask for Help
Yes and got it Proportion 77.1 55.7 LRT 73.71**
Yes and did not get it Proportion 6.0 13.1
Did not ask for help Proportion 16.9 31.2
Teacher-parent meeting Mean 0.51 0.44 t-test 2.29**
at 5 & 1% level, respectively. LTR = Likelihood Ratio Test
Finally, Table 5 shows the cost and distance to schooling. Interestingly, per capita schoolexpenditure in 2007 was not statistically different between children who dropped out andthose who remained in school. Distance to school was not statistically significant either,though this might partly be because most children were not located far from schools.
School Drop Out in Bangladesh: New Insights from Longitudinal Evidence
16
Household level factors were associated with a likelihood of dropping out in the expecteddirection (Table 5). Children who dropped out were more likely to come from poorerhouseholds compared with children who remained in school in both periods. In addition,household income for children who dropped out from school dropped by 2.4 percentcompared with a zero percent real change in household income for parents of children whoremained in school. A higher proportion of children who dropped out lived below the US$0.50 a day poverty line in 2007 and remained below this poverty line in both time periods,compared with children who were in school.
The education of parents of children who dropped out was lower than for parents of childrenwho remained in school, and a higher proportion of parents of children who dropped out hadunskilled occupations, compared with children who remained in school. Finally, there wasevidence of differences in child dependency ratio but not in total dependency ratio. A higherchild dependency ratio was estimated for the families of children enrolled in education.
Table 5: Household and school variables: Drop Out versus In School
Enrolled Drop out Statistical test
Cost and Distance to School
PC school expenditure Mean 0.035 0.033 t-test 0.89
Distance to school Mean 1.02 1.12 t-test 1.73
Household
PC income 2007 Mean 1026 800 t-test 4.46**
Real income growth Mean 0.001 -0.024 t-test 1.86*
Below US$ 0.50 a day Mean 0.71 0.83 t-test 5.02**
Persistently below $0.50 Mean 0.56 0.71 t-test 5.55**
Education above secondary Mean 0.57 0.45 t-test 4.25**
Unskilled occupations Mean 0.44 0.56 t-test 4.30**
Child dependency ratio Mean 0.50 0.48 t-test 2.55*
Total dependency ratio Mean 0.52 0.50 t-test 1.90
Female headed household Mean 0.06 0.08 t-test 1.74
4.2 Multivariate analysis: Drop Out versus In School
Having undertaken detailed analysis of the different factors that may be associated with thelikelihood of drop out, we now perform multivariate logistic analysis. For this analysis wecompare children who drop out and those who remained in school in both periods. Theestimate uses all factors provided in tables above, regardless of whether these factors werestatistical significant or not with the t-test. It is possible that those that were statisticallysignificant in the bivariate relationship become statistically insignificant when other factorsare introduced in the analysis.
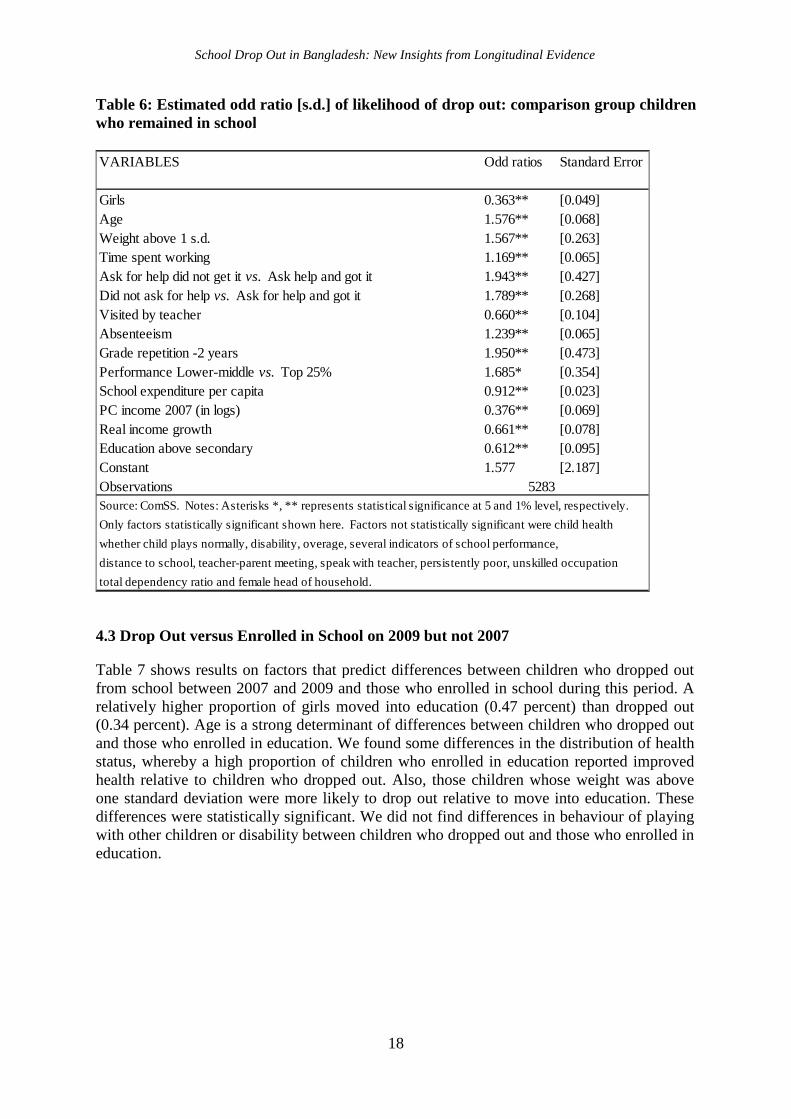
We found that girls were only 0.36 times less likely to drop out than remain in educationcompared with boys (Table 6). This may in part reflect the success of the campaigns andincentives provided to discourage female drop out. Age is a very important determinant,since an additional year is associated with an increase of 1.57 times in the likelihood of
School Drop Out in Bangladesh: New Insights from Longitudinal Evidence
17
dropping out relative to remaining in education. Interestingly, we found that being above thestandardised weight for age is associated with greater likelihood of dropping out relative toremaining in education. This result is surprising as we expected that being underweightwould be associated with an increased likelihood of drop out, but this was not the case in thissample. It should be noted that there are uncertainties about the ages of children which mayreduce the reliability of these estimates.
In terms of the relationship of the child within the household we found that the higherproportion of time that children spend working the greater the likelihood of dropping outrelative to remaining in education. New insights into the factors that may be related to dropout are the relationship of the child to the parents, in particular the indicator of whether thechild requested help for school related work and received this help from parents or a familymember. Compared to children who asked for help and received, those who asked for helpand did not get it were nearly twice as likely to drop out rather than remain in education.Similarly, children who did not ask for help were 1.7 times more likely to drop out thanchildren who asked for help and received it.
Indicators related to the child within the school also remained statistically significantpredictors of drop out. In particular, greater school absenteeism and higher grade repetitionwere associated with higher odds ratios for drop out. School performance, as reported by themother, was only statistically significant when comparing children in the lower middle of thedistribution relative to those placed at the top 25 percent. The sign of this coefficient was inthe expected direction, indicating that children whose mothers rated them in the middle lowerpart of the performance distribution were more likely to drop out relative to children whosemothers rated them in the top 25 percent of the distribution. Interestingly, we found thatbeing over age in grades was not associated with an increased likelihood of drop out inmultivariate analysis. This result may be explained by the inclusion of age as a determinantof drop out.
Per capita expenditure in education was associated with likelihood of drop out relative toremaining in education. The higher the per capita expenditure the lower the chances ofschool drop out. This may be interrelated with household interest in child schooling. Childrenwhose parents have been visited by the teacher have a lower probability of dropping outrelative to remaining in education compared with children whose parents have not beenvisited by the teacher. This result has to be contextualised with respect to reasons why someparents are visited by teachers.
Finally, among household level factors we found that household income and parentaleducation were associated with the likelihood of drop out relative to remaining in education.Interestingly for income, we found that both the level of income and income growth reducethe likelihood of school drop out. The result for income growth is particularly important.Higher income growth during this period was associated with lower chances of school dropout. Children of parents with secondary education were 0.61 times less likely to drop outcompared with children of parents with less than secondary education.
School Drop Out in Bangladesh: New Insights from Longitudinal Evidence
18
Table 6: Estimated odd ratio [s.d.] of likelihood of drop out: comparison group childrenwho remained in school
VARIABLES Odd ratios Standard Error
Girls 0.363** [0.049]
Age 1.576** [0.068]
Weight above 1 s.d. 1.567** [0.263]
Time spent working 1.169** [0.065]
Ask for help did not get it vs. Ask help and got it 1.943** [0.427]
Did not ask for help vs. Ask for help and got it 1.789** [0.268]
Visited by teacher 0.660** [0.104]
Absenteeism 1.239** [0.065]
Grade repetition -2 years 1.950** [0.473]
Performance Lower-middle vs. Top 25% 1.685* [0.354]
School expenditure per capita 0.912** [0.023]
PC income 2007 (in logs) 0.376** [0.069]
Real income growth 0.661** [0.078]
Education above secondary 0.612** [0.095]
Constant 1.577 [2.187]
Observations 5283
Source: ComSS. Notes: Asterisks *, ** represents statistical significance at 5 and 1% level, respectively.
Only factors statistically significant shown here. Factors not statistically significant were child health
whether child plays normally, disability, overage, several indicators of school performance,
distance to school, teacher-parent meeting, speak with teacher, persistently poor, unskilled occupation
total dependency ratio and female head of household.
4.3 Drop Out versus Enrolled in School on 2009 but not 2007
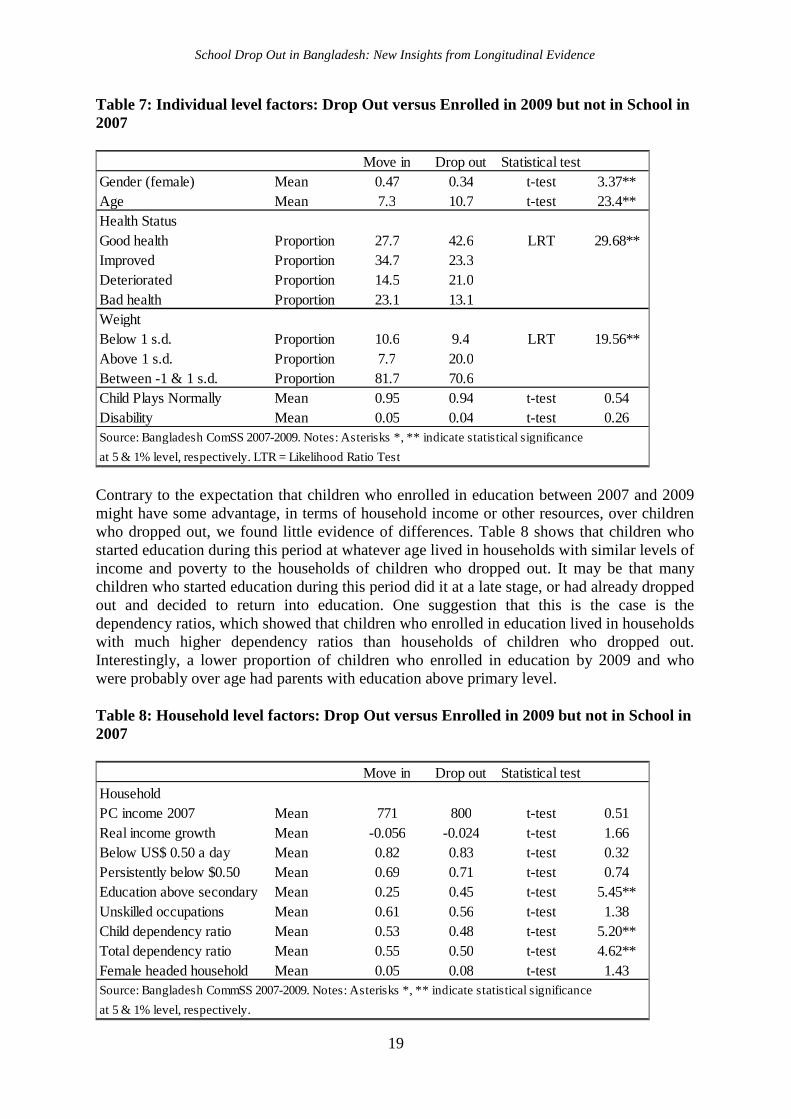
Table 7 shows results on factors that predict differences between children who dropped outfrom school between 2007 and 2009 and those who enrolled in school during this period. Arelatively higher proportion of girls moved into education (0.47 percent) than dropped out(0.34 percent). Age is a strong determinant of differences between children who dropped outand those who enrolled in education. We found some differences in the distribution of healthstatus, whereby a high proportion of children who enrolled in education reported improvedhealth relative to children who dropped out. Also, those children whose weight was aboveone standard deviation were more likely to drop out relative to move into education. Thesedifferences were statistically significant. We did not find differences in behaviour of playingwith other children or disability between children who dropped out and those who enrolled ineducation.
School Drop Out in Bangladesh: New Insights from Longitudinal Evidence
19
Table 7: Individual level factors: Drop Out versus Enrolled in 2009 but not in School in2007
at 5 & 1% level, respectively. LTR = Likelihood Ratio Test
Contrary to the expectation that children who enrolled in education between 2007 and 2009might have some advantage, in terms of household income or other resources, over childrenwho dropped out, we found little evidence of differences. Table 8 shows that children whostarted education during this period at whatever age lived in households with similar levels ofincome and poverty to the households of children who dropped out. It may be that manychildren who started education during this period did it at a late stage, or had already droppedout and decided to return into education. One suggestion that this is the case is thedependency ratios, which showed that children who enrolled in education lived in householdswith much higher dependency ratios than households of children who dropped out.Interestingly, a lower proportion of children who enrolled in education by 2009 and whowere probably over age had parents with education above primary level.
Table 8: Household level factors: Drop Out versus Enrolled in 2009 but not in School in2007
Move in Drop out Statistical test
Household
PC income 2007 Mean 771 800 t-test 0.51
Real income growth Mean -0.056 -0.024 t-test 1.66
Below US$ 0.50 a day Mean 0.82 0.83 t-test 0.32
Persistently below $0.50 Mean 0.69 0.71 t-test 0.74
Education above secondary Mean 0.25 0.45 t-test 5.45**
Unskilled occupations Mean 0.61 0.56 t-test 1.38
Child dependency ratio Mean 0.53 0.48 t-test 5.20**
Total dependency ratio Mean 0.55 0.50 t-test 4.62**
Female headed household Mean 0.05 0.08 t-test 1.43
School Drop Out in Bangladesh: New Insights from Longitudinal Evidence
20
4.4 Multivariate analysis: Drop Out versus Enrolled in 2009 but not in School in 2007
Table 9 shows results from multivariate logistic analysis for the risk of drop out usingchildren who were enrolled in 2009 but not 2007 as a comparison group. The firstobservation is that there are fewer factors associated with the risk of drop out when wecompare these two groups of children as suggested by our previous bivariate analysis. Fewergirls than boys drop out than enrol by 2009. Older children were more likely to drop out thanto enrol by 2009. Interestingly, children whose parents reported improved health were lesslikely to drop out. Finally, children living in female headed households were 3.6 times morelikely to drop out than to enrol by 2009 compared to children living in male headedhouseholds.
Table 9: Estimated odd ratio [s.d.] of likelihood of drop out: comparison group childrenenrolled in 2009 but not in school in 2007
VARIABLES Odd ratios Standard Error
Girls 0.451** [0.116]
Age 2.318** [0.164]
Improved Health vs. Persistent Good Health 0.373** [0.125]
Deteriorated Health vs. Persistent Good Health 0.810 [0.262]
Persistent Bad Health vs. Persistent Good Health 0.436* [0.156]
Weight below 1 s.d. 0.864 [0.349]
Weight above 1 s.d. 2.095 [0.811]
Child plays normally 1.985 [1.239]
Disability 0.962 [0.628]
PC income 2007 (in logs) 0.920 [0.304]
Real income growth 1.127 [0.253]
Persistently below $0.50 1.564 [0.555]
Education above secondary 1.656 [0.481]
Unskilled occupations 0.670 [0.169]
Child dependency ratio 0.129 [0.230]
Total dependency ratio 1.982 [3.382]
Female headed household 3.643* [2.284]
Constant 0.002* [0.004]
Observations 596
Source: ComSS. Notes: Asterisks *, ** represents statistical significance at 5 and 1% level, respectively.
4.5 Drop Out versus Permanently Out of School
Comparing children who dropped out during 2007 and 2009 with those who remainedcompletely out of education during this period provides some further interesting insights. Interms of individual characteristics, there are no gender or age differences between thesegroups of children, although there are differences in whether children who remainedpermanently excluded from education were disabled, did not play normally or had healthissues (Table 10).
School Drop Out in Bangladesh: New Insights from Longitudinal Evidence
21
Table 10: Individual level factors: Drop Out versus Permanently Out of School
at 5 & 1% level, respectively. LTR = Likelihood Ratio Test
Drop out Statistical test
In terms of household characteristics, Table 11 shows that children who are permanentlyexcluded lived in households with similar levels of income poverty as children who droppedout. The financial situation over time of households where children were permanently out ofschool was, however, much worse than for children who dropped out. The real per capitahousehold income for children permanently out of school was reduced by 8.7 percent onaverage compared with a reduction of 2.4 percent for children who dropped out. A higherdependency ratio and lower levels of parental education were associated with higherlikelihood of permanently being excluded from education compared with dropping out.
Table 11: Household level factors: Drop Out versus Permanently Out of School
Permanently
Excluded
Household
PC income 2007 Mean 804 800 t-test 0.051
Real income growth Mean -0.087 -0.024 t-test 1.94*
Below US$ 0.50 a day Mean 0.84 0.83 t-test 0.46
Persistently below $0.50 Mean 0.74 0.71 t-test 0.61
Education above secondary Mean 0.24 0.45 t-test 5.98**
Unskilled occupations Mean 0.64 0.56 t-test 2.14*
Child dependency ratio Mean 0.52 0.48 t-test 3.99**
Total dependency ratio Mean 0.54 0.50 t-test 3.62**
Female headed household Mean 0.07 0.08 t-test 0.68
School Drop Out in Bangladesh: New Insights from Longitudinal Evidence
22
4.6 Multivariate analysis: Drop Out versus Permanently Out of School
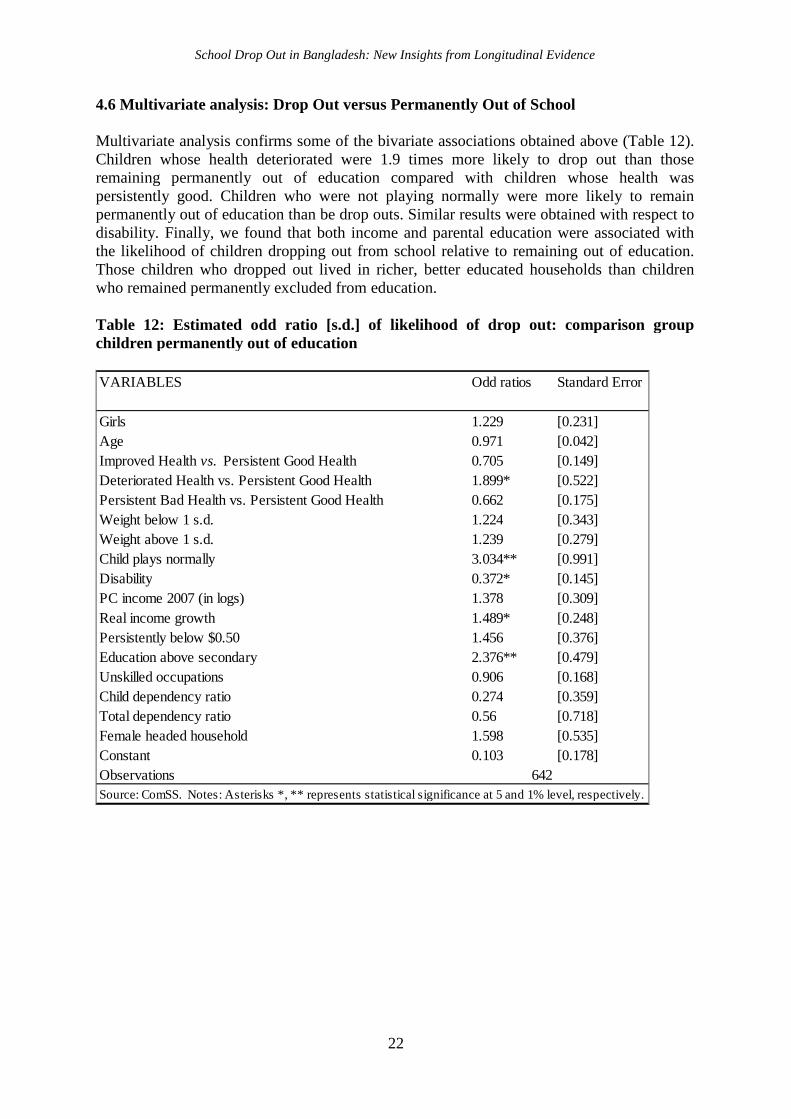
Multivariate analysis confirms some of the bivariate associations obtained above (Table 12).Children whose health deteriorated were 1.9 times more likely to drop out than thoseremaining permanently out of education compared with children whose health waspersistently good. Children who were not playing normally were more likely to remainpermanently out of education than be drop outs. Similar results were obtained with respect todisability. Finally, we found that both income and parental education were associated withthe likelihood of children dropping out from school relative to remaining out of education.Those children who dropped out lived in richer, better educated households than childrenwho remained permanently excluded from education.
Table 12: Estimated odd ratio [s.d.] of likelihood of drop out: comparison groupchildren permanently out of education
VARIABLES Odd ratios Standard Error
Girls 1.229 [0.231]
Age 0.971 [0.042]
Improved Health vs. Persistent Good Health 0.705 [0.149]
Deteriorated Health vs. Persistent Good Health 1.899* [0.522]
Persistent Bad Health vs. Persistent Good Health 0.662 [0.175]
Weight below 1 s.d. 1.224 [0.343]
Weight above 1 s.d. 1.239 [0.279]
Child plays normally 3.034** [0.991]
Disability 0.372* [0.145]
PC income 2007 (in logs) 1.378 [0.309]
Real income growth 1.489* [0.248]
Persistently below $0.50 1.456 [0.376]
Education above secondary 2.376** [0.479]
Unskilled occupations 0.906 [0.168]
Child dependency ratio 0.274 [0.359]
Total dependency ratio 0.56 [0.718]
Female headed household 1.598 [0.535]
Constant 0.103 [0.178]
Observations 642
Source: ComSS. Notes: Asterisks *, ** represents statistical significance at 5 and 1% level, respectively.
School Drop Out in Bangladesh: New Insights from Longitudinal Evidence
23
5. Discussion
This paper set out to investigate the factors associated with the likelihood of dropping outfrom school for children living in poor districts in Bangladesh. Looking into the process ofdrop out requires data that follows children over time. This is what the CREATE project inBangladesh set out to do in 2007, when a group of children selected from 18 schoolcatchment areas were selected for a longitudinal study of access to education. Two rounds ofinformation form the basis for the analysis that we undertook in this paper.
In 2007, during the first round of interviews, over 10 percent of school age children were notin education in the catchment areas. By 2009, the school status of all children was recordedagain and with this information we identified transitions into and out of education. Somechildren remained in schooling, others dropped out, others were enrolled in 2009 but not in2007, and others remained permanently excluded from education. All these children formedthe basis of our research enquiries. In particular, we were interested in differences as well assimilarities between children who dropped out from school and the rest of the children. Forinstance, is poverty related to school drop out when we compare children who dropped outwith children who entered school? What is the poverty status of drop out children versuschildren who remained in education or between drop out children and children who remainedpermanently excluded from education? Do children who drop out come from the poorestfamilies?
Our first set of results refers to differences between children who dropped out and those whoremained in school between 2007 and 2009. Although all the children who participated inthis study lived in deprived areas, we found very important differences between householdswhere children dropped out and those where children were continuously enrolled that couldshed some light into the factors that predict school drop out. One of these factors refers to therelationship of the child within the household and the support received from parents when thechild requested help for school work. Children who remained in education were more likelyto receive support from their families for school work and spent less time doing householdwork or engaged in income generating activities. In addition, children whose teachers visitedtheir parents to discuss school related work were also less likely to drop out. Finally, higherexpenditure per child in education was associated with reduced chances of dropping out fromschool. All these factors indicate the importance of the household in influencing decisions toremain at school. It is not only income, but parental interest and engagement in children’sschooling that determines whether these children remain in education.
Interestingly, we did not find that over age was simply associated with school drop out. Onewould have expected that being two or more years above the age in grade specific shouldhave been related to drop out. That is, children who were 8 year or older in Grade 1 shouldbe more likely to drop out than children who were 6 or 7 years old. To test this further, weincluded an interaction term between grade and over age and found that grade was associatedwith likelihood of drop out with an increasing relationship for those who were over age. Thismeans that over age children in higher school grades are much more likely to drop out thanover age children in lower school grades. This result is consistent with findings from EPDC(2009). In addition, Sabates et al. (2010) showed that risk of drop out was related to age inseveral African countries. Together these results indicate that the problem of drop out forchildren who are over age is likely to occur after a few years in primary school and isparticularly severe for older children.
School Drop Out in Bangladesh: New Insights from Longitudinal Evidence
24
The above result is also consistent with our finding that grade repetition is linked to drop out,but not for children who have only repeated once. Only children who have repeated morethan twice have increasing chances of dropping out from school. This issue provides anopportunity for targeting interventions for children who are still in school but who are at highrisk of dropping out. Grade repetition, after a few years of primary school, may give schoolsa clear indication for targeting resources towards children who are at risk, in particular ifthese children are much older than the rest of their classmates.
Overall, when we compared children who dropped out with those who remained in educationwe see clear areas for policy interventions. First, school absenteeism, over age and graderepetition are precursors of drop out. Schools then, have an important role to play first inidentifying these children and secondly in targeting efforts to prevent them from leavingeducation. Secondly, the relationship between teachers and parents seems to be important inreducing the risk of drop out. Schools may need to strengthen links and communication withparents and communities. But parents have also an important role to play, not only with theprovision of material resources for children, but also helping them when school work isneeded. If children do not see that their parents care, perhaps they do not see the value ofeducation either. Lastly, there is the issue of financial support, as children who dropped outcame from poorer households across this sample of materially deprived children. Direct andindirect costs have to be reduced to zero, and subsidies may be necessary to ensure thesustained enrolment of the poorest.
The second set of results refers to differences between children who dropped out and thosewho enrolled in 2009 but not 2007. Although we have only partial indicators for exploringdifferences between these children we found very little variation. There are gender and agedifferences, both in the expected direction. Older children were more likely to drop out thanmove into school. Boys were more likely to drop out than enrol in education in 2009. Genderdifferences are mainly driven by differences in the likelihood of drop out (since 65 percent ofdrop outs were boys), than in likelihood of starting or re-entering school (since 52 percentwere boys). We also found differences in health status, in particular improving health wasassociated with greater chances to start or re-enter school.
Income, parental education, parental occupation and income growth were factors that did notexplain differences between children who drop out and those who enrolled by 2009. Thismay be surprising as socioeconomic factors are usually significant in explaining educationalstatus. One reason may be that children who moved into education did not start on time.There were children aged 6 to 15 who were not in education in 2007 when they should havebeen, but who were in education two years later. It is possible that these children were notable to start education because of poverty and two years later they started education. Anotherpossible reason may be that children re-entered education, or they moved in and out ofeducation, in which these children had previously dropped out. Both of these possiblereasons may explain why children who enrolled and those who dropped out were similar interms of the socioeconomic characteristics of their households. If indeed there are nodifferences in income or income growth, or even more, if income growth of families withchildren who entered education was lower than for families with children who drop out, it islikely that children who enrolled late in education have a high risk of drop out in the future.Understanding the dynamics of children who moved in and out of education requires a studythat spans over a longer period and collects information at shorter time spans.
School Drop Out in Bangladesh: New Insights from Longitudinal Evidence
25
A late start to education provides a clear signal to teachers and head teachers of the probabledifficulties that these children will face over time. Clearly late starters will be over age. Theolder they become, the higher the opportunity cost of schooling in terms of the forgoneincome that is needed to cover for household needs, even if this income comes from non-remunerated activities within the household such as child care. Hence, late starters face ahigh risk of leaving schooling, possibly without even completing a full cycle of primaryeducation. Late starters are identified as possible targets for educational interventions aimedto secure their progression and completion of basic education.
Our last set of results focuses on children who remained permanently excluded fromeducation between 2007 and 2009. These children were more likely to be disabled and lesslikely to play normally than children who dropped out. Permanently excluded children livedin families who were even poorer than families of children who dropped out and had parentswith lower levels of education than the parents of children who dropped out. This is a pictureof a severely marginalised group of children, who require special education or other forms ofintervention to secure their inclusion into education and aid their progression through thecycle of primary and lower secondary schooling if meaningful learning is to be achieved.
School Drop Out in Bangladesh: New Insights from Longitudinal Evidence
26
References
Ackers, J., Migoli, J. and Nzomo, J. (2001) Identifying and addressing the causes ofdeclining participation rates in Kenyan primary schools. International Journal ofEducational Development, 21 (4): 361-374.
Admassie, A. (2003) Child Labour and Schooling in the Context of a Subsistence RuralEconomy: Can They be Compatible? International Journal of Educational Development,23 (2): 167-185.
Ahmed, M. et al (2007) Access to Education in Bangladesh: Country Analytic Review ofPrimary and Secondary Education, Institute of Educational Development-BRACUniversity, Dhaka, Bangladesh.
Ahmed, M. Nath, S.R., Hossain, A., Kabir, M., Kalam, A., Shahjamal, M., Yasmin, R.N.,and Zafar, T. (2005) Quality with Equity: The Primary Education Agenda, EducationWatch, 2003/4, Campaign for Popular Education (CAMPE), Bangladesh.
Akunga, A., Midi, L., Mogere, J., Muia, D., Mutahi, D., Mwangi, M., Oriko, L., Yulu, T.,Wandera Solomon, C. and Ennew, J. (2000) The impact of HIV/AIDS on education inKenya. Nairobi: Government of Kenya/UNICEF Kenya.
Alderman, H. Behram, J.R. and Lavy, V. (2001) Child Health and School Enrollment: ALongitudinal Analysis. The Journal of Human Resources- XXXVI, 36(1):185-205.
Alexander, R. (2008). Education for All, the Quality Imperative and the Problem ofPedagogy. CREATE Pathways to Access No 20. Brighton: University of Sussex.
Ananga, E., (2011 forthcoming) Typologies of School Dropout: the Dimensions andDynamics of Exclusion from Universal Basic Education in Ghana, paper accepted for aCREATE special issue of the International Journal of Educational Development
Bandyopadhyay, M. and Subrahmanian, R. (2008) Gender Equity in Education: A Review ofTrends and Factors, CREATE PATHWAYS TO ACCESS, Research Monograph No. 18,National University of Educational Planning and Administration, NUEPA.
Blick, P. and Sahn, D.E. (2000) Schooling of girls and boys in a West African country: theeffects of parental education, income, and household structure, Economics of EducationReview, 19, 63-87.
Boyle, S., Brock, A., Mace, J. and Sibbons, M. (2002) Reaching the Poor: The ‘Costs’ ofSending the Children to School. Synthesis Report, London: DFID.
Birdsall, N., Levine, D. and Ibrahim, A. (2005) Towards Universal Primary Education:Investments, Incentives, and Institutions. European Journal of Education, 40 (3): 337-349.
Brock, C. and Cammish, N. (1997) Factor Affecting Female Participation in Education inSeven Developing Countries, Education Research Paper No. 9, London: DFID.
School Drop Out in Bangladesh: New Insights from Longitudinal Evidence
27
Brown, P.H. and Park, A. (2002) Education and poverty in rural China. Economics ofEducation Review, 21: 523–541.
Cardoso, A.R. and Verner, D. (2007) School Drop-out and Push-our Factors in Brazil: TheRole of Early Parenthood, Child Labor, and Poverty. IZA Discussion Paper No 2515.Bonn: Institute for the Study and Labor (IZA).
Case, A., and Ardington, C. (2006) The Impact of Parental Death on school outcomes:Longitudinal evidence from South Africa. Demography, 43(3): 401-420.
Chowdhury, A.M.R., Nath, S.R., Choudhury, R.K. and Ahmed, M. (2002) Renewed HopeDaunting Challenges: State of Primary Education in Bangladesh, Education Watch 2001,The University Press Limited.
Chugh, S. (2004) Why Children Dropout: Case Study of a Metropolitan City. New Delhi:Bookwell.
Colclough, C., Rose, P. and Tembon, M. (2000) Gender Inequalities in Primary Schooling:The Roles of Poverty and Adverse Cultural practices. International Journal ofEducational Development, 20: 5-27.
Connelly, R. and Zheng, Z. (2003) Determinants of school enrolment and completion of 10to18 year olds in China. Economics of Education Review, 22 (4): 379-388.
Dar, A., Blunch, N.H., Kim, B. and Sasaki, M. (2002) Participation of Children in Schoolingand Labour Activities: A Review of Empirical Studies, Social Protection Unit, HumanDevelopment Network. Washington DC: The World Bank.
Dunne, M., and Leach, F. (2005) Gendered School Experiences: The Impact on Retentionand Achievement. London: DFID.
Duryea, S. (2003) School Attendance, Child Labor and Local Labor Market Fluctuations inUrban Brazil. World Development, 31 (7): 1165-1178.
Education Policy and Data Center, EPDC. (2009) ‘Pupil Performance and Age: A Study ofPromotion, Repetition, and Dropout Rates among Pupils in Four Age Groups in 35Developing Countries.’ Working Paper EDPC-09-02. Washington DC: Education Policyand Data Center.
Ersado, L. (2005) Child labor and schooling decisions in urban and rural areas: comparativeevidence from Nepal, Peru, and Zimbabwe. World Development, 33 (3): 455-480.
Filmer, D. (2005) Disability, Poverty, and Schooling in Developing Countries: Results from11 Household Surveys. Washington DC: World Bank.
Ghuman, S., Behrman, J.R. and Gultiano, S (2006) Children’s Nutrition, School Quality andPrimary School Enrollment in Philippines, Working Paper Series, Volume, 2006-24.
School Drop Out in Bangladesh: New Insights from Longitudinal Evidence
28
Glewwe, P. and Jacoby, H.G. (1995) An Economic Analysis of Delayed Primary-schoolEnrolment in a Low-income Country: The Role of Early Childhood Nutrition. Review ofEconomics and Statistics, 77: 156-169.
Government of Bangladesh, GoB (2009) Bangladesh Primary Education Annual SectorPerformance Report, Directorate of Primary Education, Second Primary EducationDevelopment programme.
Grant, M. and Hallman, K. (2006) Pregnancy Related School Dropout and Prior SchoolPerformance in South Africa. Plocy Research Division Working Paper No 212. NewYork: Population Council.
Grira, H. (2001) Delayed School Enrolment in Bangladesh: Who Is Responsible, PantheonSorbonne University and CNRS, Maison des Sciences Economiques.
Hadley, S. (2010) Seasonality and Access to Education: the case of primary education insub-Saharan Africa, CREATE Pathways to Access, Research Monograph No. 31,Brighton: University of Sussex.
Hossain, A. (2010a) CREATE Bangladesh: Community and School Study (COMSS: SecondRound, July 2010
Hossain, A. (2010b) Age in Grade Congruence and Progression in Basic Education inBangladesh, CREATE Pathways to Access, Research Monograph, No. 48. Brighton:University of Sussex.
Hossain, A. et al. (2009) CREATE Bangladesh: Community and School Study (COMSS),Base line Report,
Hossain, A. et al (2003) Classroom Situation at Primary Level, Research and EvaluationDivision (RED) of BRAC, Bangladesh.
Hunt, F. (2008) Dropping Out from School: A Cross Country Review of Literature, CREATEPathways to Access, Research Monograph, No, 16. Brighton: University of Sussex.
Hunter, N. and May, J. (2002) Poverty, Shocks and School Disruption Episodes amongAdolescents in South Africa, CSDS Working Paper No 35.
Kane, E. (2004) Girls’ Education in Africa: What Do We Know About Strategies ThatWork? Washington DC: World Bank.
Kadzamira, E. and Rose, P. (2003) Can free primary education meet the needs of the poor?Evidence from Malawi, International Journal of Educational Development, 23. 501-516.
Karim S., (2004) Transparency in Education: Report Card in Bangladesh: InternationalInstitute for Educational Planning (IIEP), Paris
Khanam, R. (2008) Child Labour and School Attendance: Evidence from Bangladesh,International Journal of Social Economics. Vol. 35, Iss:1/2, pp 77-89.
School Drop Out in Bangladesh: New Insights from Longitudinal Evidence
29
Lewin, K.M. (2007) Improving Access, Equity and Transitions in Education: Creating aResearch Agenda, CREATE Pathways to Access, Research Monograph No 1. Brighton:University of Sussex.
Lewin, K.M. (2008) Strategies for Sustainable Financing of Secondary Education in Africa.World Bank Working Paper No 136 Africa Human Development Series World BankWashington.
Lewin, K.M. (2009) ‘Access to education in sub-Saharan Africa: Patterns, problems andpossibilities.’ Comparative Education, 45(2): 151-174.
Lewin, K.M. and Sabates, R. (2011 forthcoming) Who gets what? Is improved access tobasic education pro-poor in SSA?’ International Journal of Educational Development.
Liddell, C and Rae, G (2001) Predicting early grade retention: A longitudinal investigation ofprimary school progress in a sample of rural South African children. British Journal ofEducational Psychology, 71 (Part 3): 413-428.
Liu, F. (2004) Basic education in China’s rural areas: a legal obligation or an individualchoice? International Journal of Educational Development, 24: 5-21.
Mukudi, E. (2004) The Effects of User-Fee Policy on Attendance Rates among KenyanElementary School Children. International Review of Education, 50(5/6): 447-461.
Nath, S.R. Haq, M.N. Begum, U.S., Ullah, A. Sattar, M.A. and Chowdhury, A.M.R. (2008)The State of Secondary Education: Quality and Equity Challenges, Education Watchreport, 2007, CAMPE, Bangladesh.
Nekatibeb, T. (2002) Low Participation of Female Students in Primary Education: A CaseStudy of Dropouts from the Amhara and Oromia Regional States in Ethiopia. AddisAbaba: UNESCO.
National Audit Office (2010) Bilateral Support to Primary Education, Department ofInternational Development, Report by the comptroller and Auditor General, HC 69,Session 2010-2011.
Peters, S.J. (2003) Inclusive Education: Achieving Education for All by Including Thosewith Disabilities and Special Needs. Washington DC: World Bank.
Pridmore, P. (2007). Impact of health on education access and achievement: A cross-national review of the research evidence. CREATE Pathways to Access No 26. Brighton:University of Sussex.
Pryor, J. and Ampiah, J.G. (2003) Understandings of Education in an African Village: TheImpact of Information and Communication Technologies. London: DFID.
Roderick, M. (1994) Grade Retention and School Dropout: Investigating the Association.American Educational Research Journal, 31(4): 729-759.
School Drop Out in Bangladesh: New Insights from Longitudinal Evidence
30
Rose, P., and Al-Samarrai, S. (2001) Household Constraints on Schooling by Gender:Empirical Evidence from Ethiopia. Comparative Education Review, 45(1): 36-63.
Sabates, R., Akyeampong, K., Westbrook, J. and Hunt, F. (2010). School Drop out: Patterns,Causes, Changes and Policies. Background Paper for the UNESCO GMR. Paris:UNESCO.
Tikly, L and Barrett, A. (2010). Social justice, capabilities and the quality of education in lowincome countries. International Journal of Education and Development. DOI:10.1016/j.ijedudev.2010.06.001
Tuwor, T. and Antoinette, M. (2008) Gender Discrimination and Education n West Africa:Strategies for Maintaining Girls in School. International Journal of Inclusive Education,12(4): 363-379.
Vavrus, F. (2002) Making distinctions: privatization and the (un) educated girl on MountKilimanjaro, Tanzania. International Journal of Educational Development, 22: 527-547.
World Bank (2009). Education at a Glance: Bangladesh. Washington D.C.: The WorldBank.
Report summary:This report provides new evidence into the factors that predict school drop out for children in Bangladesh. It also examinessimilarities and differences between children who enter late into primary schooling, those who are permanently excludedand those who drop out. Our results show that the relationship of the child within the household and the possible supportreceived from parents when the child requested help for school work were factors associated with the risk of drop out. Inaddition, over age in the final years of primary school and low school attendance were signals of a high risk of school dropout. Children who started school late were similar to children who drop out in terms of background family characteristics.However, children who were permanently excluded from school were poorer and more marginalised than children whodropped out. Several recommendations are drawn from the analyses of this report.
Author notes:Dr Ricardo Sabates is a Senior Lecturer International Education & Development within the Centre for InternationalEucation, University of Sussex. His research focuses on the links between education and the uptake of preventative healthcare and on parents' education and children's outcomes. He has academic publications on issues of child nutrition and oneducation and crime and the intergenerational transmission of education. He has also contributed to research reports for theUK Department of Education and Skills.Altaf Hossain is a Team Leader in the Research Policy Studies and Advocacy Unit in BRAC University Institute ofEducational Development in Bangladesh. Working with Dr. Manzoor Ahmed and others, he has contributed to several of theannual Education Watch publications. He was part of a team that designed, planned and implemented a large communityand school survey for CREATE in Bangladesh. He has also written several monographs for CREATE and is completing hisdoctorate in education from the University of Sussex. His research interests include education assessment and evaluation.Professor Keith Lewin is Director of the Centre for International Education at the University of Sussex and Director of theCREATE research partnership. He has extensive experience of school systems in Sub-Saharan Africa, South and South EastAsia, and China, has published 18 books and over 100 scholarly articles and chapters, and has supervised 40 D Philstudents. He has worked extensively with the International Institute of Educational Planning, and with the World Bank,DFID, DSE/GTZ, UNICEF, and UNESCO and with many national governments. Keith made invited contributions to theworld education conferences at Jomtien and Dakar, and has subsequently been directly involved in national sectordevelopment planning in Uganda, Tanzania and Rwanda, and in India supporting DFID's bilateral programmes. Hisresearch interests include the economics of education and educational financing, educational policy and planning for EFA,teacher education, educational innovation and implementation, science education policy, assessment, and aid to education.
Address for Correspondence: CREATE, Centre for International Education, Department of Education,School of Education & Social Work, Essex House, University of Sussex, Falmer, BN1 9QQ, UK.Website: http://www.create-rpc.org / Email: [email protected]