U.S. Department of Commerce Economics and Statistics Administration U.S. CENSUS BUREAU U S C E N S U S B U R E A U Helping You Make Informed Decisions School Enrollment in the United States: 2006 Population Characteristics Issued August 2008 P20-559 Current Population Reports By Jessica W. Davis and Kurt J. Bauman This report discusses school enrollment • Diversity plays a prominent role levels and trends in the population aged among the school population, with 3 and older based on data collected in differences apparent by geography. 2006 by the U.S. Census Bureau in the In the Western region of the United American Community Survey (ACS) and States, native non-Hispanic Whites the Current Population Survey (CPS). 1 His- were the minority among students torically, the CPS has been the only data enrolled in kindergarten through source used to produce school enrollment twelfth grade. reports. This is the first report to show • Also in the Western region of the data from the ACS, supplemented with United States, over one-third of stu- CPS data where they provide better infor- dents enrolled in kindergarten through mation. The ACS has a larger sample size twelfth grade spoke a language other and will provide statistics for small levels than English at home. of geography, which are reasons why it is used as a main source of enrollment data. THE AMERICAN COMMUNITY Highlights of the report are: SURVEY AND THE CURRENT POPULATION SURVEY: • In 2006, compared with the enrollment TWO SOURCES OF SCHOOL distribution of 2000, there were more ENROLLMENT DATA students in college and high school The American Community Survey is the and fewer in nursery, kindergarten, cornerstone of the government’s effort and elementary school. This reflects to keep pace with the nation’s ever- change in the composition of school increasing need for timely and relevant enrollment by age. data about population and housing char- • High school dropouts constituted 11 acteristics. The ACS, part of the Census percent of the population aged 18 to Bureau’s reengineered 2010 Census 24 years old. States with the highest program, looks at a wide range of social, concentration of dropouts are pre- economic, and housing characteristics dominantly located along the entire for the population by a multitude of southern border of the United States. demographic variables. The ACS is used to provide annual data on more than • More women than men are enrolled in 7,000 areas, including all congressional college, and this has been true since districts as well as counties, cities, metro 1979. Women have also become the areas, and American Indian and Alaska majority of graduate students. Native areas with a population of 65,000 1 or more. In 2008, the Census Bureau will For information on the differences between the ACS and CPS estimates, see Shin, Hyon, 2007, A Com- release 3-year estimates from the ACS parison of Estimates on School Enrollment From the for areas with populations larger than ACS and the CPS: 2003, Washington, DC: U.S. Census Bureau, and accompanying tables and figures, avail- 20,000. It will release 5-year estimates able from the Web page <www.census.gov/acs/www for all geographic areas down to the /AdvMeth/Papers/Papers1.htm>.
Transcript
U.S. Department of CommerceEconomics and Statistics Administration
U.S. CENSUS BUREAUU S C E N S U S B U R E A UHelping You Make Informed Decisions
School Enrollment in the United States: 2006Population Characteristics
Issued August 2008
P20-559
CurrentPopulationReports
ByJessica W. Davis and Kurt J. Bauman
This report discusses school enrollment • Diversity plays a prominent role levels and trends in the population aged among the school population, with 3 and older based on data collected in diff erences apparent by geography. 2006 by the U.S. Census Bureau in the In the Western region of the United American Community Survey (ACS) and States, native non-Hispanic Whites the Current Population Survey (CPS).1 His- were the minority among students torically, the CPS has been the only data enrolled in kindergarten through source used to produce school enrollment twelfth grade.reports. This is the fi rst report to show
• Also in the Western region of the data from the ACS, supplemented with
United States, over one-third of stu-CPS data where they provide better infor-
dents enrolled in kindergarten through mation. The ACS has a larger sample size
twelfth grade spoke a language other and will provide statistics for small levels
than English at home.of geography, which are reasons why it is used as a main source of enrollment data.
THE AMERICAN COMMUNITY Highlights of the report are: SURVEY AND THE CURRENT
POPULATION SURVEY: • In 2006, compared with the enrollment TWO SOURCES OF SCHOOL
distribution of 2000, there were more ENROLLMENT DATAstudents in college and high school
The American Community Survey is the and fewer in nursery, kindergarten, cornerstone of the government’s eff ort and elementary school. This refl ects to keep pace with the nation’s ever-change in the composition of school increasing need for timely and relevant enrollment by age. data about population and housing char-
• High school dropouts constituted 11 acteristics. The ACS, part of the Census percent of the population aged 18 to Bureau’s reengineered 2010 Census 24 years old. States with the highest program, looks at a wide range of social, concentration of dropouts are pre- economic, and housing characteristics dominantly located along the entire for the population by a multitude of southern border of the United States. demographic variables. The ACS is used
to provide annual data on more than • More women than men are enrolled in
7,000 areas, including all congressional college, and this has been true since
districts as well as counties, cities, metro 1979. Women have also become the
areas, and American Indian and Alaska majority of graduate students.
Native areas with a population of 65,000
1or more. In 2008, the Census Bureau will
For information on the diff erences between the ACS and CPS estimates, see Shin, Hyon, 2007, A Com- release 3-year estimates from the ACS parison of Estimates on School Enrollment From the for areas with populations larger than ACS and the CPS: 2003, Washington, DC: U.S. Census Bureau, and accompanying tables and fi gures, avail- 20,000. It will release 5-year estimates able from the Web page <www.census.gov/acs/www for all geographic areas down to the /AdvMeth/Papers/Papers1.htm>.
2 U.S. Census Bureau
tract level beginning in 2010. The ACS surveys information from about 3 million addresses, or 2.5 percent of the nation’s population each year. In contrast with the CPS, the ACS is administered to the entire domestic population, including those living in institu-tions and other group quarters. In this respect, data from the ACS are highly comparable with data col-lected in Census 2000 and earlier decennial censuses.2 The ACS asks respondents throughout the entire calendar year whether they were enrolled in regular school at any time in the 3 months before the interview. The survey also asks whether each person attended public school or private school, and in what grade or level the per-son was enrolled. Tables from the ACS about school enrollment can be accessed through the American FactFinder on the Census Bureau’s Web site at <factfi nder.census.gov>.
The Current Population Survey surveys approximately 72,000 housing units each month. Unlike the ACS, the reference population is the civilian noninstitutionalized population, so that people living in institutions are not included. While the sample size is not suffi -cient to describe small geographic areas, the CPS is designed to meet reliability requirements for the 50 states and the District of Colum-bia. Estimates of school enroll-ment from the CPS are based on a special supplement administered each October since 1956, allowing the construction of a time series of trends for school enrollment. The supplement on school enrollment
2 Other diff erences between the ACS and Census 2000 aff ect comparisons of school enrollment. One of the most important is the reference time of data collection, which is the 3 months preceding collection (which occurs year-round) in the ACS but is fi xed to the time preceding April 1 in the census. This diff erence especially aff ects comparisons of enrollment by age.
asks detailed questions of children overall school enrollment in the aged 3–14 and people 15 and older. United States. In 2006, 79.1 mil-Twenty questions are asked, gath- lion people aged 3 and older were ering information on single year of enrolled in school (Figure 1).3 Of enrollment, enrollment status and the total, 8.9 million were enrolled level for the previous year, whether in nursery school, preschool, or respondents go to school full-time kindergarten. More than one-or part-time, whether they attend half, 49.8 million, of the enrolled a 2-year or 4-year institution, population in 2006 was enrolled whether they are obtaining any in grades 1 through 12. A total of vocational training, and what year 20.5 million were enrolled in col-they received their most recent lege or graduate school.degree. Tables about students and
Enrollment in 2006 was higher than school enrollment from the CPS can
at the time of Census 2000, when be found on the Census Bureau’s Web site at <www.census.gov 3 The estimates in this report (which /population/www/socdemo may be shown in text, fi gures, and tables)
/school.html>. are based on responses from a sample of the population and may diff er from actual values because of sampling variability or
To learn more about the diff erences other factors. As a result, apparent diff er-
between the ACS and CPS see the ences between the estimates for two or more groups may not be statistically signifi cant.
comparison grid at the end of this All comparative statements have undergone report. statistical testing and are signifi cant at the
90-percent confi dence level unless otherwise noted. The CPS estimates total enrollment
SCHOOL ENROLLMENT at 75.2 million. The diff erence in enrollment totals between the ACS and the CPS can be
Due to its sample size the ACS is explained in part by diff erences in sampling size, coverage of the institutionalized popula-used in this section to describe tion, and wording of questions.
Census 2000
ACS 2006
Nursery
Kindergarten
Elementary(grades 1 through 4)
Elementary(grades 5 through 8)
High school(grades 9 through 12)
College (undergraduate)
College (graduate)
5.04.9
4.04.2
15.816.9
16.716.5
17.516.4
14.417.1
3.43.1
Figure 1.Number of Students Aged 3 and Older Enrolled in School by Level of Enrollment, 2000 and 2006(In millions)
Note: See <www.census.gov/acs/www/Downloads/ACS/accuracy2006.pdf> for further information on the accuracy of the data.
Source: U.S. Census Bureau, Census 2000 and 2006 American Community Survey.
U.S. Census Bureau 3
76.6 million people were enrolled in school. The increase was not even across all levels of school, however. Higher levels of school showed an increase in enrollment, while early elementary grades showed a decline. For example, college undergraduate enrollment grew from 14.4 million in 2000 to 17.1 million in 2006. Enrollment in grades 1 through 4 fell from 16.9 million in 2000 to 15.8 million in 2006. These changes ran parallel to a shift in the age distribution, which showed an increase in the population 18 to 21 years old and a drop in the population aged 6 to 11.4
The percentage of children aged 10 to 14 who were enrolled in school was at 98 percent or higher in 2006. Increases have been observed in school enroll-ment rates at younger and older ages.5 The next section examines the enrollment in nursery school; the following sections examine high school and the transition to college.
NURSERY SCHOOL ENROLLMENT
It is helpful to use the CPS to look at nursery school enrollment because its data allow for examina-tion of historical trends. In 2006, 4.7 million children aged 3 and over were enrolled in nursery
4 Calculations of changes from April 2000 to July 2006 are taken from NC-EST2006- ALLDATA: Monthly Population Estimates by Age, Sex, Race, and Hispanic Origin for the United States: April 1, 2000, to July 1, 2006 (with short-term projections to dates in 2007). Source: Population Estimates Program, Population Division, U.S. Census Bureau. Release Date: May 17, 2007.
5 The percentage of 5- and 6-year-olds enrolled in school, for example, increased from 58 percent to 95 percent from 1947, the fi rst year for which consistently reported CPS data are available, to 2005. The percentage of 16- and 17-year-olds enrolled in school increased from 68 percent to 95 percent from 1947 to 2005.
school or preschool.6 Over half of remained at 26 percent, while the students enrolled in nursery school percentage of 4-year-olds enrolled were 4 years old and most of the in nursery school increased from rest were 3 years old. Children 5 35 percent to 41 percent. In 1994, and older made up 12 percent of the Census Bureau changed ques-nursery school students. tion wording and collection proce-
dures, making comparisons with The rate of nursery school atten-
prior years somewhat tenuous. dance by 3- and 4-year-olds has
The nursery school enrollment increased over the years. In 1968,
rates of both 3- and 4-year-olds 11 percent of 4-year-olds were
increased from 1994 to 2006— enrolled in nursery school or
from 54 to 60 percent for 4-year-preschool (Figure 2). By 1980, the
olds and from 33 percent to 41 percentage had increased to 35
percent for 3-year-olds.7
percent. During this same period, nursery school or preschool enroll- HIGH SCHOOL DROPOUTSment of 3-year-olds went from 8
The ACS is used in this section percent to 26 percent. From 1980 because of its geographic detail, to 1993, the rate of enrollment which is an important component did not climb for 3-year-olds, who
6 The estimate of 4.7 million children in 7 The apparent increases in nursery school nursery school was taken from the CPS. The enrollment rates for 3- and 4-year-olds from ACS estimates a slightly larger number of 2000 to 2006 in Figure 2 (CPS data) are not children (4.9 million). statistically signifi cant.
Percent of 3-year-oldsPercent of 4-year-olds
0
10
20
30
40
50
60
70
20062000199519901985198019751968
Percent
Figure 2.Nursery School Enrollment of 3- and 4-Year-Olds, 1968 to 2006
Source: U.S. Census Bureau, Current Population Surveys, October 2006 and previous years.
4 U.S. Census Bureau
to the discussion of high school some of the states close to the with dropout rates at or below 5 dropouts.8 In 2006, 3.3 million southern border of the United percent among 18- to 24-year-olds people, or 11 percent of people States than in the rest of the coun- were North Dakota (upper Midwest) aged 18 to 24, were high school try in 2006 (Figure 3). Louisiana and New Hampshire (New England). dropouts. In this report the drop- and Mississippi, along the Gulf out rate is the proportion of 18- to Coast, and Arizona and New Mex- TRANSITION TO COLLEGE24-year-olds not enrolled in school ico, in the Southwest, were among An advantage of the CPS data is who do not have a high school the seven states with dropout rates that questions are asked about degree. at or above 14 percent.9 The other enrollment in the previous year,
three were Georgia (near but not allowing the tracking of changes in This dropout rate shows geo-directly on the Gulf Coast), Nevada enrollment from year to year. This graphic variation. The lack of high (near but not on the Southwest bor- section uses the CPS to examine school completion was higher in der), and Texas (on both the Gulf the transition from high school
8 Coast and the Southwest border). “Dropouts” include all those who are to college. In 2006, the majority
not enrolled in high school or lower grades (58 percent) of high school gradu-and do not have a high school diploma. This States with low dropout rates includes immigrants and others who may ates aged 16 to 21 were enrolled included some of those in the not have “dropped out” from a U.S. school in college (Table 1). Not all were because they never attended one. Davis and upper Midwest and in New Eng-Bauman estimate that 23 percent of U.S. drop- enrolled full-time in 4-year colleges. land. For example, the two states outs attended foreign schools (Davis, Jessica Full-time students in 4-year col-and Kurt Bauman, 2006, “The Contribution of Foreign Schools to Educational Attainment 9 Alabama and Delaware had status drop- leges were 38 percent of all high in the United States,” presented at the annual out rates that were not statistically diff erent school graduates in the 16 to 21 meetings of the Population Association of from 14 percent, although the point estimates America (March)). for these states were below 14. years age range; full-time students
12.3 to 16.5
8.1 to 12.2
Under 8.1
U.S. average: 11.2 percent
MT
AK
NM
OR MN
KS
SD
ND
MO
WA
FL
IL IN
WI NY
PA
MI
OH
IA
ME
MA
CT
AZ
NV
TX
COCA
WY
UT
ID
NE
OK
GA
AR
AL
NC
MS
LA
TN
KY
VA
SC
WV
RI
DE MD
NJ
HI
VTNH
DC *
Percentage
Figure 3.Percent Aged 18 to 24 Not Enrolled and Not Having a High School Diploma or Equivalent, 2006
* DC is represented at 4.5 times the scale of other continental states.
Note: See <www.census.gov/acs/www/Downloads/ACS/accuracy2006.pdf> for further information on the accuracy of the data.
Source: U.S. Census Bureau, 2006 American Community Survey.
U.S. Census Bureau 5
in 2-year colleges were 13 per- percent of people aged 16 to 21 Therefore, two basic ways of defi ning a race group are possible. A group, such as Black,
cent. Six percent of 16- to 21-year- who were enrolled in college in may be defi ned as those who reported Black
old high school graduates were 2005 remained enrolled in Octo- and no other race (the race-alone or single race concept) or as those who reported Black
enrolled part-time—about 3 percent ber 2006. On the other hand, of regardless of whether they also reported
in 4-year colleges and 3 percent in people 16 to 21 years who were another race (the race-alone-or-in-combina-tion concept). The body of this report (text,
2-year colleges.10 not enrolled in 2005, 15 percent fi gures, and tables) shows data for people were enrolled in 2006. who reported they were the single race White,
Of the population aged 16 to 21 people who reported the single race Black,
enrolled in 2005, the majority Enrollment levels diff ered by race and people who reported the single race Asian. Use of the single-race populations does
continued in school during 2006. and ethnicity. Seventy-nine per- not imply that it is the preferred method of
Two-thirds (66 percent) of the 2.4 cent of Asian-alone 16- to 21-year- presenting or analyzing data. The Census Bureau uses a variety of approaches.
million 16- to 21-year-olds who old high school graduates were Because Hispanics may be any race, data
graduated from high school during enrolled in college, compared with in this report for Hispanics overlap slightly with data for the Black population. Based
2006 were attending college in 61 percent of the non-Hispanic on the 2006 CPS October supplement, 3.1
October of that year, thus continu- White-alone population, 49 percent percent of the Black-alone population and 1.6 percent of Asian-alone population aged 3 and
ing their enrollment. Eighty-fi ve of the Black-alone population, and over were Hispanic. Data for the American
45 percent of the Hispanic popu- Indian and Alaska Native population and the Native Hawaiian and Other Pacifi c Islander
lation of this age.1110 The percentage of 16- to 21-year-old Research on population are not shown in this report
high school graduates enrolled part-time in 4- because of their small sample size.year colleges (3 percent) was not statistically The enrollment levels of Blacks (49 diff erent from the percent enrolled part-time 11 Federal surveys now give respondents percent) and Hispanics (45 percent) were not in 2-year colleges (3 percent). the option of reporting more than one race. statistically diff erent from each other.
Table 1.College Enrollment of High School Graduates Aged 16 to 21 by Race and Ethnicity: 2006(Numbers in thousands and percents)
Characteristic
Enrolled
2-year institution 4-year institution
Total Total Full-time Part-time Full-time Part-time
Total . . . . . . . . . . . . . . .Graduated this year . . . . . . . .Enrolled last year . . . . . . . . . .Not enrolled last year . . . . . .
– Represents or rounds to zero.Source: U.S. Census Bureau, Current Population Survey, October 2006.
6 U.S. Census Bureau
diff erences in college education by percent for Black alone, 58 percent COLLEGE ENROLLMENTrace and Hispanic origin points to for Hispanic, 69 percent for non-
The CPS is used to discuss college three important aspects. First, race Hispanic White alone).13 Among
enrollment because of its historical and Hispanic-origin groups vary those who were enrolled in the
data series, which is particularly in their rate of entry into college. previous year, all groups had a
useful when looking at gender Second, the groups vary in their tendency to return (85 percent for
patterns of enrollment. Overall persistence in college. Third, the Black alone, 78 percent for His-
enrollment in college and graduate characteristics of the college vary panic, 86 percent for non-Hispanic
12 White alone).14school increased from 15.3 mil-
by group. All three aspects are Especially notable lion to 17.2 million from 2000 to
evident in the data presented in was the variation in type of school 2006. This increase is a departure
Table 1. attended. The percentage enrolled from much of the previous decade,
in a 2-year college was not statisti-Asian-alone 16- to 21-year-old high which saw little change in college
cally diff erent among non-Hispanic school graduates fared better than enrollment. (The estimate of 15.3
White-alone, Black-alone, Asian-their non-Hispanic White-alone million enrolled in 2000 was not
alone, and Hispanic 16- to 21-year-counterparts in most aspects. statistically diff erent from the 15.0
old high school graduates. By Asian-alone high school graduates million observed in 1994.)17
contrast, enrollments in 4-year col-were more likely to go directly to
leges diff ered among non-Hispanic Partly fueling the recent increase college than were non-Hispanic
White-alone students and each of was continued growth in the col-White-alone high school gradu-
the other groups.15 lege enrollment of women. Prior ates (82 percent versus 69 per-
to the late 1970s, most college cent). For both Asians and Whites, Both Asian-alone and Hispanic
students were men (Figure 4). In those who had been enrolled in groups include relatively large
1971, for example, men were 58 the previous year were likely to be numbers of the foreign born (see
percent of the population enrolled enrolled again in the current year the section on “Diversity of the
in undergraduate college and 70 (90 percent of Asian-alone stu- School Population” in this report).
percent of those enrolled in gradu-dents, 86 percent of non-Hispanic In calculations not shown here,
ate school. In 2006, by contrast, White-alone students—estimates the eff ect of excluding the foreign that are not statistically diff erent). born was examined.16
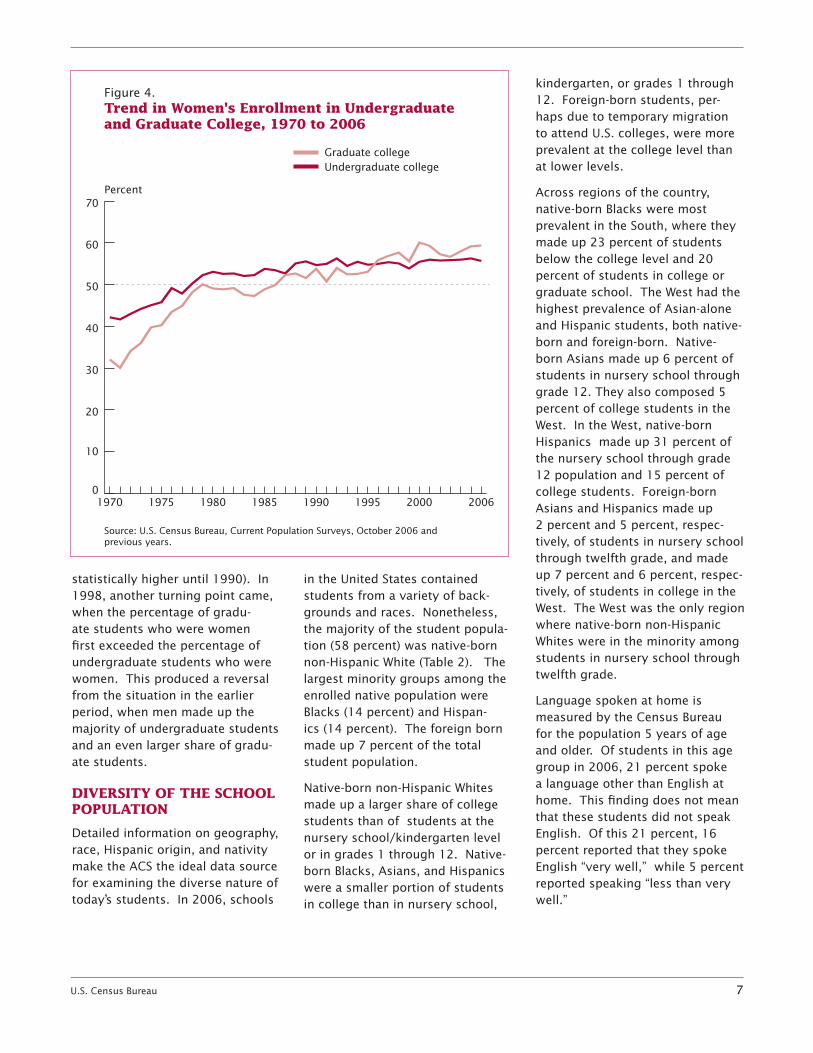
women made up 56 percent of Enrollment
undergraduate students and 59 A larger share of Asian-alone than patterns of Asians were largely
percent of students in graduate of non-Hispanic White-alone 16- to unchanged when only native-born
school.18 21-year-old high school graduates Asians were examined. The overall were enrolled full-time in 4-year enrollment rate of Asian-alone 16- A turning point came in 1979, institutions (61 percent and 41 to 21-year-old high school gradu- which was the fi rst time that percent, respectively). ates remained at 79 percent. The women became a majority of
patterns of Hispanics, on the other students in undergraduate college. Black-alone and Hispanic high
hand, changed. Overall enrollment By 1990, women had become school graduates had a lower
of native Hispanic 16- to 21-year- a majority of those in graduate probability of going directly to
olds was 52 percent, compared school (in 1987, the estimated college than non-Hispanic White-
with a rate of 45 percent for all women’s percentage started to alone high school graduates (55
Hispanic 16- to 21-year olds. exceed 50 percent, but it was not
12 For an overview of group diff erences in college entry and completion, see U.S. 13 The diff erence between Black (55 17 Census 2000 shows enrollment of 17.5 Department of Education, National Center for percent) and Hispanic (58 percent) students million in college, undergraduate and gradu-Education Statistics, 2005, The Condition of enrolling in college directly after high school ate combined—higher than the 15.3 million Education 2005, NCES 2005-094, Washing- graduation is not statistically signifi cant. reported in CPS that year. ACS estimates for ton, D.C.: U.S. Government Printing Offi ce, 14 The diff erence between Black alone 2006 are also higher than CPS estimates—Section 3, Indicator 22. Also see Kao, Grace (85 percent) and non-Hispanic White alone 20.5 million and 17.2 million, respectively.and Jennifer S. Thompson, 2003, “Racial and (86 percent) enrollment was not statistically 18 In 2006, CPS data show the percentage Ethnic Stratifi cation in Educational Achieve- signifi cant. of women exceeded the percentage of men ment and Attainment,” Annual Review of 15 Asian students had the highest enroll- enrolled in college for most age groups. In Sociology 2003, 29: 417–42. For a discussion ment rate in 4-year colleges followed by the 65 and older age group, there was not a of institutional selectivity and other charac- White, Black, and Hispanic students. signifi cant diff erence between the percentage teristics see Karen, David, 2002, “Changes 16 See the appendix tables included with of men and women enrolled in college. For all in Access to Higher Education in the United this report on the Web site <http://www other age groups, the percentage of women States: 1980–92,” Sociology of Education, 75 .census.gov/population/www/socdemo exceeded the percentage of men enrolled in (July): 191–210. /school.html>. college.
U.S. Census Bureau 7
statistically higher until 1990). In in the United States contained 1998, another turning point came, students from a variety of back-when the percentage of gradu- grounds and races. Nonetheless, ate students who were women the majority of the student popula-fi rst exceeded the percentage of tion (58 percent) was native-born undergraduate students who were non-Hispanic White (Table 2). The women. This produced a reversal largest minority groups among the from the situation in the earlier enrolled native population were period, when men made up the Blacks (14 percent) and Hispan-majority of undergraduate students ics (14 percent). The foreign born and an even larger share of gradu- made up 7 percent of the total ate students. student population.
Native-born non-Hispanic Whites DIVERSITY OF THE SCHOOL POPULATION made up a larger share of college
students than of students at the Detailed information on geography, nursery school/kindergarten level race, Hispanic origin, and nativity or in grades 1 through 12. Native-make the ACS the ideal data source born Blacks, Asians, and Hispanics for examining the diverse nature of were a smaller portion of students today’s students. In 2006, schools in college than in nursery school,
kindergarten, or grades 1 through 12. Foreign-born students, per-haps due to temporary migration to attend U.S. colleges, were more prevalent at the college level than at lower levels.
Across regions of the country, native-born Blacks were most prevalent in the South, where they made up 23 percent of students below the college level and 20 percent of students in college or graduate school. The West had the highest prevalence of Asian-alone and Hispanic students, both native-born and foreign-born. Native-born Asians made up 6 percent of students in nursery school through grade 12. They also composed 5 percent of college students in the West. In the West, native-born Hispanics made up 31 percent of the nursery school through grade 12 population and 15 percent of college students. Foreign-born Asians and Hispanics made up 2 percent and 5 percent, respec-tively, of students in nursery school through twelfth grade, and made up 7 percent and 6 percent, respec-tively, of students in college in the West. The West was the only region where native-born non-Hispanic Whites were in the minority among students in nursery school through twelfth grade.
Language spoken at home is measured by the Census Bureau for the population 5 years of age and older. Of students in this age group in 2006, 21 percent spoke a language other than English at home. This fi nding does not mean that these students did not speak English. Of this 21 percent, 16 percent reported that they spoke English “very well,” while 5 percent reported speaking “less than very well.”
Graduate collegeUndergraduate college
0
10
20
30
40
50
60
70
20062000199519901985198019751970
Percent
Figure 4.Trend in Women's Enrollment in Undergraduate and Graduate College, 1970 to 2006
Source: U.S. Census Bureau, Current Population Surveys, October 2006 and previous years.
8 U.S. Census Bureau
Table 2.Level of School and Region of Residence by Race, Nativity, Language, and Ability to SpeakEnglish: 2006(Numbers in thousands and percents)
languages . . . . . . . . . . . . .All other languages . . . . . .
English Speaking AbilityVery well . . . . . . . . . . . . . . . .Less than very well . . . . . .
79,122
92.865.7
58.514.12.8
14.3
7.22.9
1.30.91.9
3.0
75,287
79.420.6
13.5
3.3
2.91.0
15.55.1
8,914
97.666.5
56.914.63.6
18.5
2.41.0
0.50.20.7
1.0
5,079
79.920.1
14.6
2.5
2.30.8
11.58.6
49,757
94.265.2
57.215.02.8
16.0
5.82.6
0.90.51.1
3.1
49,757
79.420.6
14.8
2.8
2.20.8
15.74.8
20,451
87.366.6
62.311.92.5
8.3
12.74.4
2.71.94.4
3.4
20,451
79.220.8
10.1
4.7
4.61.4
16.14.8
10,314
94.468.0
63.313.73.3
12.3
5.61.9
1.31.01.4
1.8
9,567
79.620.4
11.3
5.6
2.51.0
15.94.5
3,900
84.167.7
64.99.22.5
6.3
15.95.0
3.83.75.1
3.0
3,900
76.923.1
8.6
7.8
4.91.7
17.85.3
12,972
96.875.1
72.213.11.6
6.8
3.21.4
0.80.30.7
1.3
12,178
88.811.2
6.8
2.3
1.30.8
8.22.9
4,614
92.277.6
76.09.71.3
3.4
7.82.6
2.11.13.1
1.3
4,614
87.212.8
4.8
3.8
2.81.4
9.53.2
21,378
95.262.1
53.523.01.6
14.3
4.82.3
0.60.60.7
2.8
19,970
82.517.5
13.7
1.9
1.30.5
12.94.6
6,948
89.463.3
58.419.91.3
7.8
10.64.1
2.02.42.8
3.4
6,948
82.217.8
10.2
3.8
2.71.2
14.13.7
14,007
92.359.4
44.25.25.8
31.2
7.73.5
0.90.21.6
4.9
13,122
66.034.0
26.2
2.4
4.41.1
25.38.7
4,989
82.460.3
53.14.85.4
15.1
17.66.0
3.40.77.4
5.8
4,989
69.230.8
16.0
4.5
8.91.5
23.67.2
1Undergraduate or graduate school.Note: See <www.census.gov/acs/www/Downloads/ACS/accuracy2006.pdf> for further information on the accuracy of the data.Source: U.S. Census Bureau, 2006 American Community Survey.
California had the highest percent- Unlike the distribution of foreign- The West was the region where age of enrolled students speaking born students, which was higher non-English speakers were most a language other than English at at the college level, speakers of prevalent. Just over one-third of home, with 44.8 percent (Figure 5). languages other than English were students below the college level in Texas (34.5 percent), New Mexico just as prevalent at lower grades. the West spoke a language other (34.1 percent), and Arizona (31.7 Foreign-born students made up 13 than English at home. The pre-percent) had the next highest percent of college students, but dominant language was Spanish, percentages of students speak- only 2 percent of students in nurs- spoken at home by 26 percent of ing a language other than English ery school and kindergarten and all nursery school through twelfth-at home (Texas and New Mexico 6 percent of students in grades 1 grade students in the West region were not statistically signifi cantly through 12. By contrast, students and 16 percent of college students. diff erent). At the opposite end were speaking a language other than Asian languages were spoken by Mississippi (2.7 percent) and West English in their homes made up 21 4 percent of students in nursery Virginia (3.0 percent) statistically percent of college students, 20 per- school through twelfth grade and 9 tied for the lowest percentage of cent of students in nursery school percent of students in college.enrolled students speaking a lan- and kindergarten, and 21 percent guage other than English at home. of students in grades 1 through 12.
U.S. Census Bureau 9
30.6 percent to 44.8
16.6 to under 30.6
Under 16.6
U.S. average: 20.5 percent
MT
AK
NM
OR MN
KS
SD
ND
MO
WA
FL
IL IN
WI NY
PA
MI
OH
IA
ME
MA
CT
AZ
NV
TX
COCA
WY
UT
ID
NE
OK
GA
AR
AL
NC
MS
LA
TN
KY
VA
SC
WV
RI
DE MD
NJ
HI
VTNH
DC *
Percentage
Figure 5.Percent of Children Enrolled in Kindergarten Through Twelfth Grade Speaking a Language Other Than English at Home, 2006
* DC is represented at 4.5 times the scale of other continental states.
Note: See <www.census.gov/acs/www/Downloads/ACS/accuracy2006.pdf> for further information on the accuracy of the data.
Source: U.S. Census Bureau, 2006 American Community Survey.
10 U.S. Census Bureau
Several western states also had Jersey, and Hawaii, also had at least states showed notable diff erences. high concentrations of students in one-quarter of their kindergarten In New Mexico, 34 percent spoke kindergarten through twelfth grade through twelfth grade students a language other than English at who had at least one foreign-born with at least one foreign-born home, while 22 percent of students parent (Figure 6). Half of all kin- parent. had one or more parents who were dergarten through twelfth-grade foreign born. In Hawaii, the pattern
As with students who spoke a lan-students in California (49.9 per- went the opposite way, with 26
guage other than English at home, cent) and 36 percent in Nevada had percent of students having at least
larger proportions of students with at least one foreign-born parent. one foreign-born parent and 17
at least one foreign-born parent Several states, including New percent speaking a language other
lived in the West, Southwest, East York, Florida, Texas, Arizona, New than English at home.
Central states, and Florida. Two
34.1 to 49.9 percent
18.2 to 34.0
Under 18.2
U.S. average: 21.9 percent
MT
AK
NM
OR MN
KS
SD
ND
MO
WA
FL
IL IN
WI NY
PA
MI
OH
IA
ME
MA
CT
AZ
NV
TX
COCA
WY
UT
ID
NE
OK
GA
AR
AL
NC
MS
LA
TN
KY
VA
SC
WV
RI
DE MD
NJ
HI
VTNH
DC *
Percentage
Figure 6.Percent of Students Aged 5 to 18 Who Have at Least One Foreign-Born Parent, 2006
* DC is represented at 4.5 times the scale of other continental states.
Note: See <www.census.gov/acs/www/Downloads/ACS/accuracy2006.pdf> for further information on the accuracy of the data.
Source: U.S. Census Bureau, 2006 American Community Survey.
U.S. Census Bureau 11
SOURCES OF THE DATA confi dence level. This means the The CPS weighting procedure uses 90-percent confi dence interval for ratio estimation whereby sample
Most estimates in this report are the diff erence between estimates estimates are adjusted to inde-
from the 2006 American Com-being compared does not include pendent estimates of the national
munity Survey (ACS), the 2006 zero. Nonsampling error in surveys population by age, race, sex, and
October supplement to the Cur-may be attributed to a variety of Hispanic origin. This weighting
rent Population Survey (CPS), and sources, such as how the survey partially corrects for bias due to
Census 2000. Some estimates are was designed, how respondents undercoverage, but biases may still
based on data obtained by the CPS interpret questions, how able and be present when people who are
in earlier years.willing respondents are to provide missed by the survey diff er from
The population represented (the correct answers, and how accu- those interviewed in ways other population universe) in the Octo- rately answers are coded and clas- than age, race, sex, and Hispanic ber 2006 ACS includes both the sifi ed. To minimize these errors, origin. How this weighting pro-household and the group quarters the Census Bureau employs qual- cedure aff ects other variables in populations (that is, the resident ity control procedures in sample the survey is not precisely known. population). The group quarter’s selection, the wording of questions, All of these considerations aff ect population consists of the insti- interviewing, coding, data process- comparisons across diff erent tutionalized population (such as ing, and data analysis. surveys or data sources. Further people in correctional institutions information on the source of the
The fi nal ACS population estimates or nursing homes) and the nonin- data and accuracy of the estimates,
are adjusted in the weighting pro-stitutionalized population (most of including standard errors and con-
cedure for coverage error by con-whom are in college dormitories). fi dence intervals, can be found at
trolling specifi c survey estimates to <www.census.gov/apsd/techdoc
The population represented (the independent population controls by /cps/cpsoct06.pdf> or by con-
population universe) in the School sex, age, race, and Hispanic origin. tacting John Finamore of the
Enrollment Supplement to the Octo- This weighting partially corrects for Demographic Statistical Methods
ber 2006 CPS is the civilian nonin- bias due to over- or undercoverage, Division via e-mail at <dsmd
stitutionalized population living in but biases may still be present, for [email protected]>.
the United States. The institutional- example, when people who were ized population, which is excluded missed diff er from those inter- MORE INFORMATIONfrom the population universe, is viewed in ways other than sex, age,
Detailed tabulations, related infor-composed primarily of the popula- race, and Hispanic origin. How this mation, and historic data are avail-tion in correctional institutions and weighting procedure aff ects other able on the Internet at the School nursing homes (91 percent of the variables in the survey is not pre-Enrollment page on the Census 4.1 million institutionalized people cisely known. All of these consid-Bureau’s Web site at <www.censusin Census 2000). erations aff ect comparisons across .gov/population/www/socdemodiff erent surveys or data sources.
ACCURACY OF THE /school.html>.For information on sampling and ESTIMATES estimation methods, confi dential- For additional questions or
ity protection, and sampling and Statistics from sample surveys co mments, contact Jessica W. Davis nonsampling errors, please see the are subject to sampling error and at 301-763-2464 or via e-mail at “2006 ACS Accuracy of the Data” nonsampling error. All comparisons <[email protected]>.document located at <www.censuspresented in this report have taken .gov/acs/www/Downloads/ACSsampling error into account and /accuracy2006.pdf>.are signifi cant at the 90-percent
12 U.S. Census Bureau
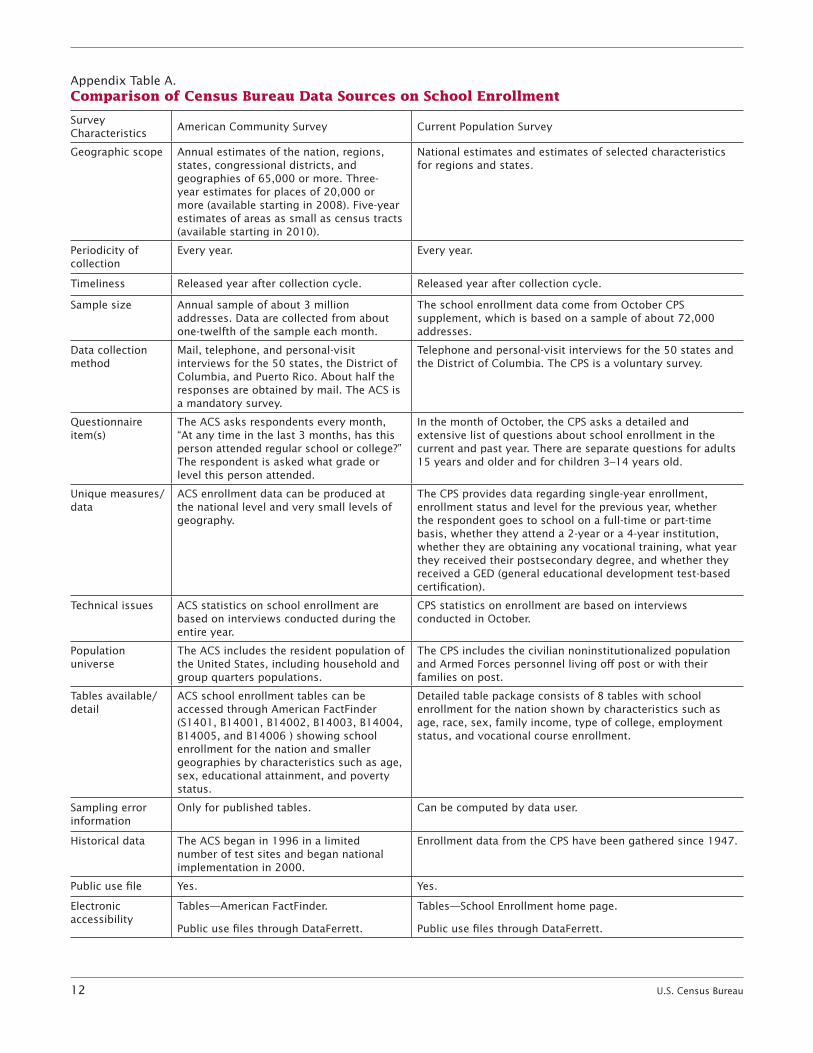
Appendix Table A.Comparison of Census Bureau Data Sources on School Enrollment
Survey Characteristics
Geographic scope
Periodicity of collection
Timeliness
Sample size
Data collection method
Questionnaire item(s)
Unique measures/data
Technical issues
Population universe
Tables available/detail
Sampling error information
Historical data
Public use fi le
Electronic accessibility
American Community Survey
Annual estimates of the nation, regions, states, congressional districts, and geographies of 65,000 or more. Three-year estimates for places of 20,000 or more (available starting in 2008). Five-year estimates of areas as small as census tracts (available starting in 2010).
Every year.
Released year after collection cycle.
Annual sample of about 3 million addresses. Data are collected from about one-twelfth of the sample each month.
Mail, telephone, and personal-visit interviews for the 50 states, the District of Columbia, and Puerto Rico. About half the responses are obtained by mail. The ACS is a mandatory survey.
The ACS asks respondents every month, “At any time in the last 3 months, has this person attended regular school or college?” The respondent is asked what grade or level this person attended.
ACS enrollment data can be produced at the national level and very small levels of geography.
ACS statistics on school enrollment are based on interviews conducted during the entire year.
The ACS includes the resident population of the United States, including household and group quarters populations.
ACS school enrollment tables can be accessed through American FactFinder (S1401, B14001, B14002, B14003, B14004, B14005, and B14006 ) showing school enrollment for the nation and smaller geographies by characteristics such as age, sex, educational attainment, and poverty status.
Only for published tables.
The ACS began in 1996 in a limited number of test sites and began national implementation in 2000.
Yes.
Tables—American FactFinder.
Public use fi les through DataFerrett.
Current Population Survey
National estimates and estimates of selected characteristics for regions and states.
Every year.
Released year after collection cycle.
The school enrollment data come from October CPS supplement, which is based on a sample of about 72,000 addresses.
Telephone and personal-visit interviews for the 50 states and the District of Columbia. The CPS is a voluntary survey.
In the month of October, the CPS asks a detailed and extensive list of questions about school enrollment in the current and past year. There are separate questions for adults 15 years and older and for children 3–14 years old.
The CPS provides data regarding single-year enrollment, enrollment status and level for the previous year, whether the respondent goes to school on a full-time or part-time basis, whether they attend a 2-year or a 4-year institution, whether they are obtaining any vocational training, what year they received their postsecondary degree, and whether they received a GED (general educational development test-based certifi cation).
CPS statistics on enrollment are based on interviews conducted in October.
The CPS includes the civilian noninstitutionalized population and Armed Forces personnel living off post or with their families on post.
Detailed table package consists of 8 tables with school enrollment for the nation shown by characteristics such as age, race, sex, family income, type of college, employment status, and vocational course enrollment.
Can be computed by data user.
Enrollment data from the CPS have been gathered since 1947.


![ENROLLMENT ANALYSIS JANUARY 9, 2017 · ENROLLMENT PROJECTION DISTRICTWIDE STUDENT ENROLLMENT PROJECTIONS BY SCHOOL YEAR[2] Projection Window [1] School Year 2016/2017 Enrollment is](https://static.documents.pub/doc/80x56/5f8b9146b2f36505874904a0/enrollment-analysis-january-9-2017-enrollment-projection-districtwide-student-enrollment.jpg)


