ACTION FOR CONTINUOUS SCHOOL IMPROVEMENT PLAN Action Taken Support Needed Proposed Action Area of Improvement (As per the defined Core Standard) Mission Statement SHAALA SIDDHI Evaluation for Improvement Unit on School Standards and Evaluation National University of Educational Planning and Administration New Delhi Unit on School Standards and Evaluation National University of Educational Planning and Administration 17-B, Sri Aurobindo Marg, New Delhi-110016 (INDIA) EPABX Nos. : 26565600, 26544800 Fax : 91-011-26853041, 26865180 E-mail: [email protected]Website: www.nuepa.org, www.shaalasiddhi.nuepa.org ABOUT THE SCHOOL EVALUATION DASHBOARD The School Evaluation Dashboard facilitate each school to provide consolidated self-evaluation report in key performance domains and core standards, including action for improvement. It has three parts i) Basic Information about learners and teachers ii) ‘School Evaluation Composite Matrix’, which provides the holistic picture of school performance across seven key domains and their core standards and iii) Action for Continuous School Improvement Plan. The dashboard has also the provision for external evaluation report. The ‘School Evaluation Dashboard’ is available online in a dedicated web portal. Each school can submit its self-evaluation report by using the interactive web portal. The external evaluators have to use the same web portal to provide their evaluation report. A consolidated school evaluation report, encompassing both self and external evaluation is generated online by the web portal. The ‘School Evaluation Dashboard’ can be used for viewing and analysing school evaluation report and data which can further be consolidated at the block, district, and state level to extend appropriate support to school. It also facilitates schools in monitoring their own progress and improvement over the years. It would further direct the schools to take appropriate action for its continuous improvement and allow for revisiting their practices. The consolidated data at the block, district and state level can also direct policy-level decisions across the levels. School Evaluation Dashboard
Transcript
ACTI
ON
FO
R C
ON
TIN
UO
US
SCH
OO
L IM
PROV
EMEN
T PL
AN
Actio
n Ta
ken
Supp
ort N
eede
dPr
opos
ed A
ctio
nAr
ea o
f Im
prov
emen
t(A
s pe
r the
def
ined
Co
re S
tand
ard)
Mis
sion
Sta
tem
ent
SHAALA SIDDHI
Evaluation for Improvement
Unit on School Standards and EvaluationNational University of Educational
Planning and AdministrationNew Delhi
Unit on School Standards and Evaluation National University of Educational Planning and Administration
17-B, Sri Aurobindo Marg, New Delhi-110016 (INDIA)EPABX Nos. : 26565600, 26544800Fax : 91-011-26853041, 26865180
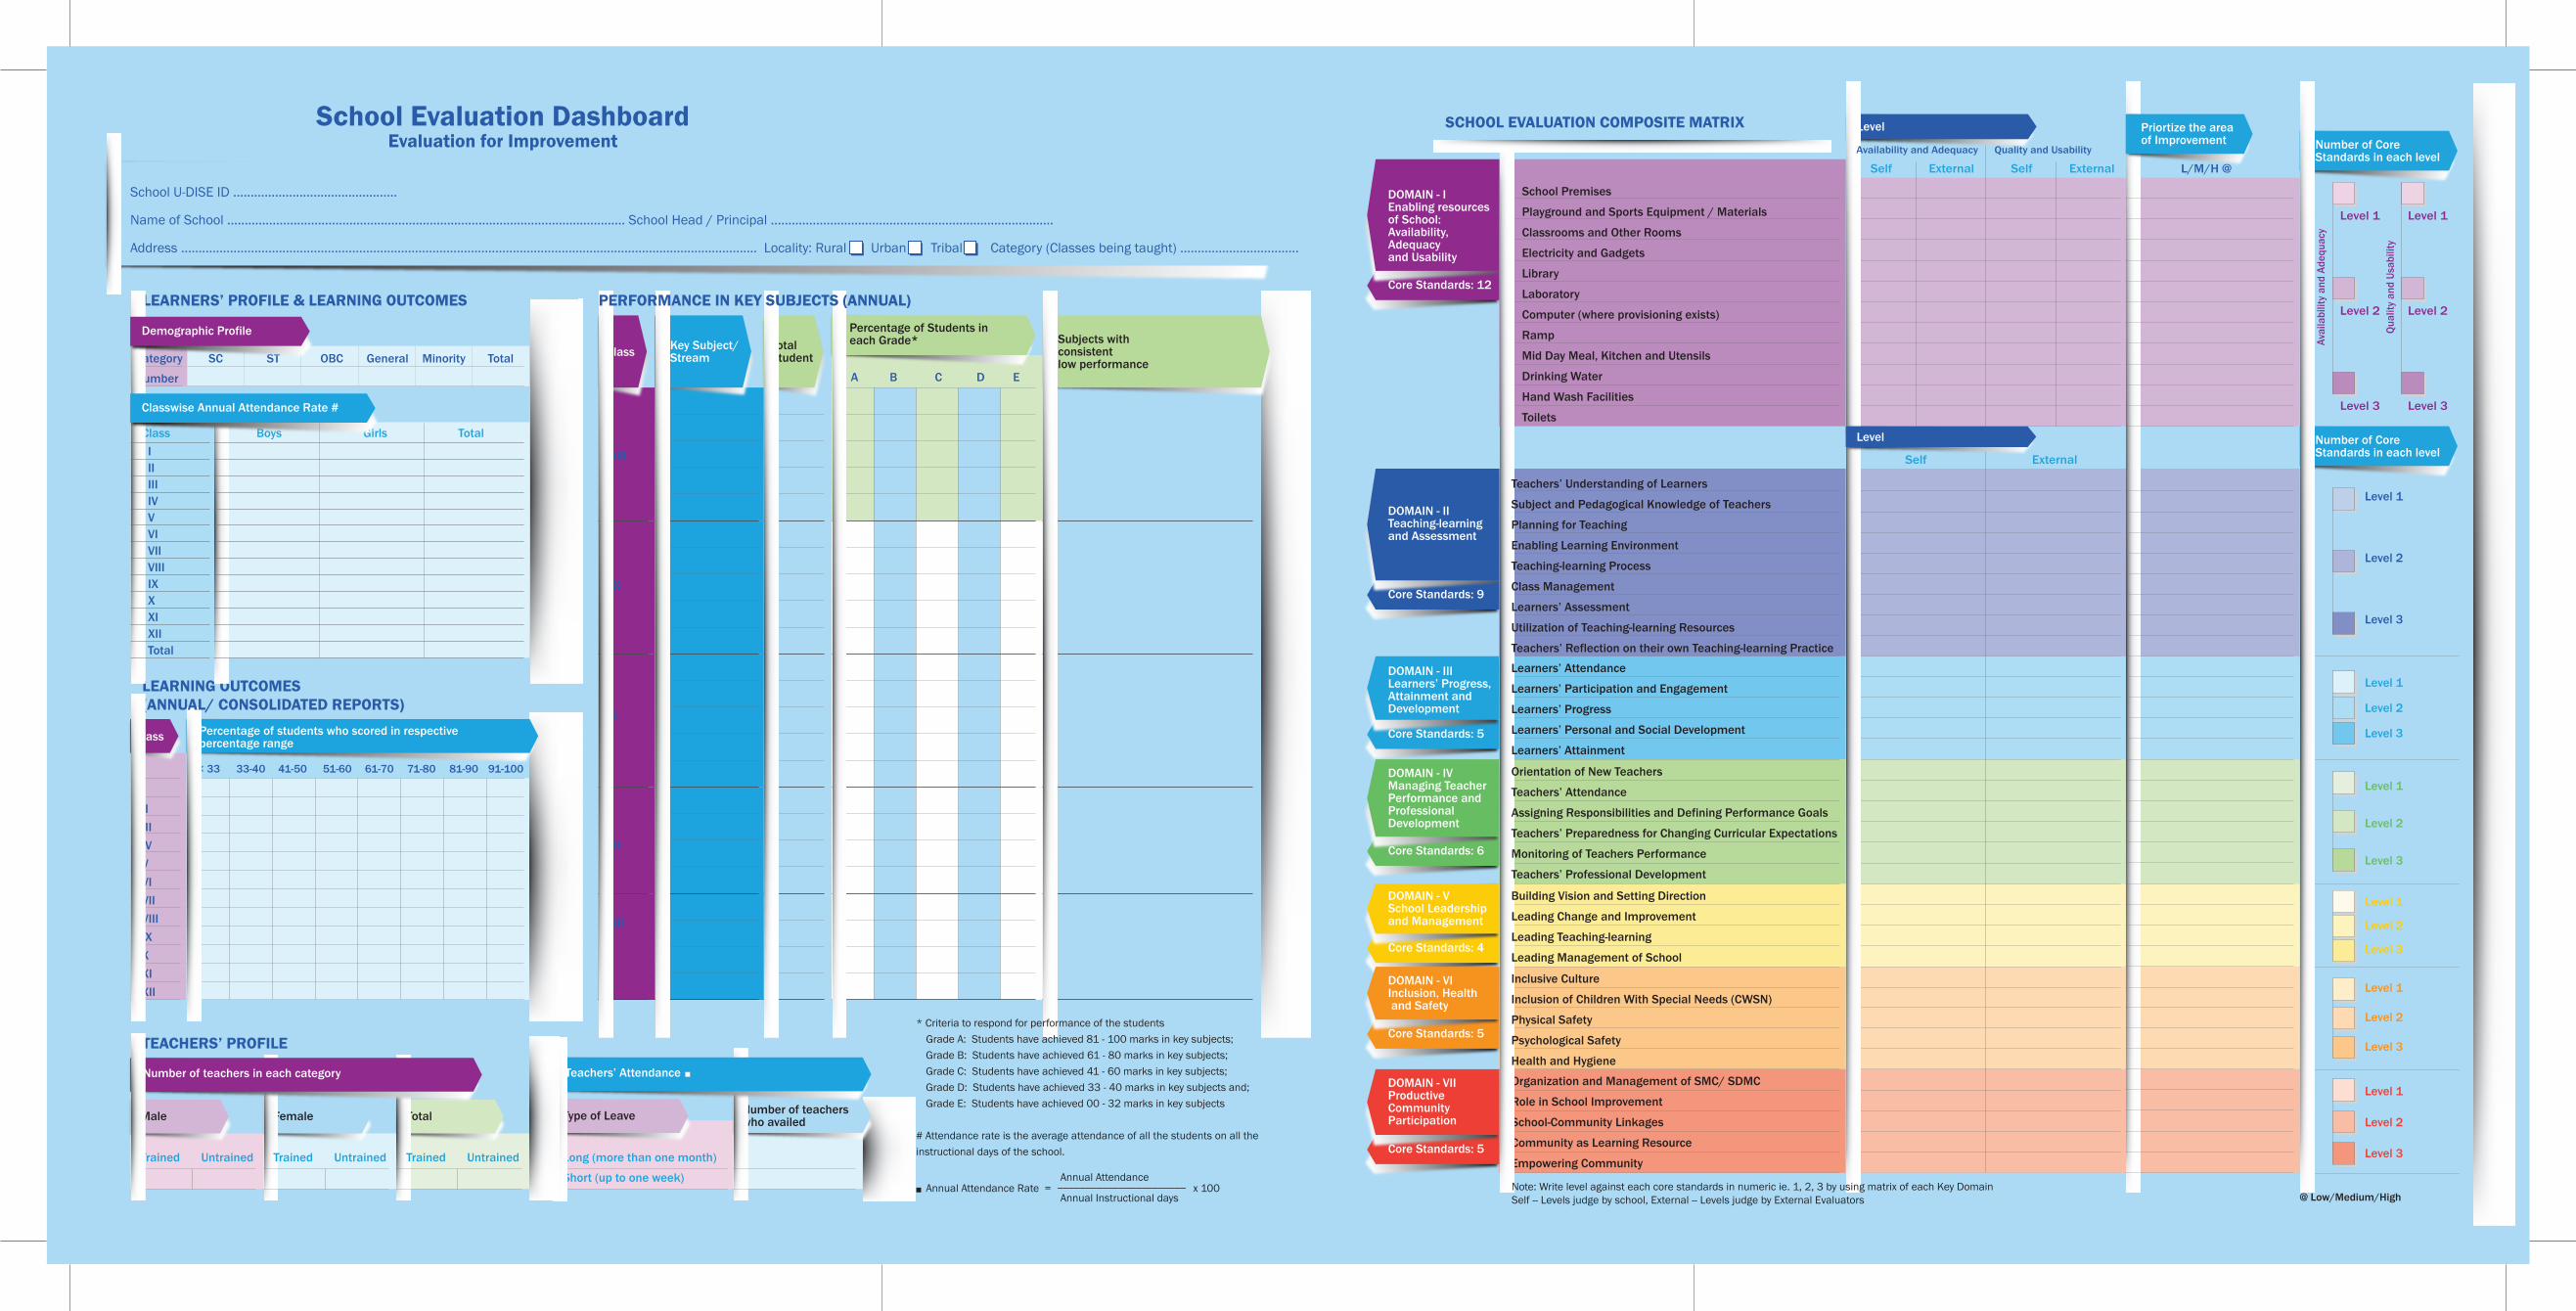
The School Evaluation Dashboard facilitate each school to provide consolidated self-evaluation report in key performance domains and core standards, including action for improvement. It has three parts i) Basic Information about learners and teachers ii) ‘School Evaluation Composite Matrix’, which provides the holistic picture of school performance across seven key domains and their core standards and iii) Action for Continuous School Improvement Plan. The dashboard has also the provision for external evaluation report.
The ‘School Evaluation Dashboard’ is available online in a dedicated web portal. Each school can submit its self-evaluation report by using the interactive web portal. The external evaluators have to use the same web portal to provide their evaluation report. A consolidated school evaluation report, encompassing both self and external evaluation is generated online by the web portal.
The ‘School Evaluation Dashboard’ can be used for viewing and analysing school evaluation report and data which can further be consolidated at the block, district, and state level to extend appropriate support to school. It also facilitates schools in monitoring their own progress and improvement over the years. It would further direct the schools to take appropriate action for its continuous improvement and allow for revisiting their practices. The consolidated data at the block, district and state level can also direct policy-level decisions across the levels.
School Evaluation Dashboard
School Evaluation DashboardEvaluation for Improvement
LEARNERS’ PROFILE & LEARNING OUTCOMES
< 33
Class Percentage of students who scored in respective percentage range
School U-DISE ID ...............................................
Name of School .................................................................................................................. School Head / Principal .................................................................................
DOMAIN - IEnabling resources of School: Availability, Adequacyand Usability
DOMAIN - IITeaching-learningand Assessment
Category
Number
SC ST OBC General Minority Total
Boys Girls TotalClass
Demographic Profile
Classwise Annual Attendance Rate #
IIIIIIIVVVIVIIVIIIIXXXIXIITotal
* Criteria to respond for performance of the students Grade A: Students have achieved 81 - 100 marks in key subjects; Grade B: Students have achieved 61 - 80 marks in key subjects; Grade C: Students have achieved 41 - 60 marks in key subjects; Grade D: Students have achieved 33 - 40 marks in key subjects and; Grade E: Students have achieved 00 - 32 marks in key subjects
# Attendance rate is the average attendance of all the students on all the instructional days of the school.
@ Low/Medium/HighNote: Write level against each core standards in numeric ie. 1, 2, 3 by using matrix of each Key DomainSelf -- Levels judge by school, External -- Levels judge by External Evaluators
Annual Attendance _______________________ Annual Instructional days