Prairie Perspectives: Geographical Essays (Vol: 14) ISSN 1911-5814 1 School mapping in education micro-planning: a case study of Union Council Chak 84/15L, District Khanewal, Pakistan Tayyab I. Shah Department of Geography and Planning, University of Saskatchewan, Saskatoon SK Canada S7M 5C8 [email protected]Scott Bell Department of Geography and Planning, University of Saskatchewan, Saskatoon SK Canada S7M 5C8 [email protected]Mehboob Elahi Department of Sociology, University of the Punjab, Lahore, Pakistan Abstract This research took place in the Union Council Chak 84/15L, Khanewal District, Pakistan. Pakistan is a developing coun- try with a large and rapidly growing population; it faces many challenges and as a result socio-economic indicators tend not to show positive trends. In developing countries school mapping (SM), a normative approach to the micro-planning of school locations, is often used to create the necessary conditions for achieving universal primary and secondary educa- tion (UPE and USE). With the introduction of a new local government system, development planning is carried out by the district governments with a focus on local priorities and needs. The objective of this research was to identify the poten- tial school sites at the local level by mapping and analyzing the existing inequalities in access and distribution of schools based on reliable spatial and aspatial baseline data. Community maps were updated to identify the scattered population sites and school locations with the help of internet resources (Google Earth, Wikimapia) and by community participa- tion. A household survey was conducted to gather baseline data including out-of-school children and the illiterate popu- lation. The results provide some practical guidelines for the identification of locations where schools are to be opened. Key words: School Mapping, Universal primary education, Education micro-planning
School mapping in education micro-planning: a case study of Union Council Chak 84/15L, District Khanewal, Pakistan
Tayyab I. ShahDepartment of Geography and Planning, University of Saskatchewan, Saskatoon SK Canada S7M 5C8 [email protected]
Scott BellDepartment of Geography and Planning, University of Saskatchewan, Saskatoon SK Canada S7M 5C8 [email protected]
Mehboob ElahiDepartment of Sociology, University of the Punjab, Lahore, Pakistan
Abstract
This research took place in the Union Council Chak 84/15L, Khanewal District, Pakistan. Pakistan is a developing coun-try with a large and rapidly growing population; it faces many challenges and as a result socio-economic indicators tend not to show positive trends. In developing countries school mapping (SM), a normative approach to the micro-planning of school locations, is often used to create the necessary conditions for achieving universal primary and secondary educa-tion (UPE and USE). With the introduction of a new local government system, development planning is carried out by the district governments with a focus on local priorities and needs. The objective of this research was to identify the poten-tial school sites at the local level by mapping and analyzing the existing inequalities in access and distribution of schools based on reliable spatial and aspatial baseline data. Community maps were updated to identify the scattered population sites and school locations with the help of internet resources (Google Earth, Wikimapia) and by community participa-tion. A household survey was conducted to gather baseline data including out-of-school children and the illiterate popu-lation. The results provide some practical guidelines for the identification of locations where schools are to be opened. Key words: School Mapping, Universal primary education, Education micro-planning
IntroductionPakistan is a developing country with a large and rapidly
growing population; it faces many challenges but as a result of its slow progress in development, socio-economic indica-tors tend not to show positive trends (Government of Pakistan 2010). Education opportunities and their expansion provides the base for national economic development, individual economic welfare, and also narrows social inequalities by promoting a meritocratic basis for status attainment in which the talented can rise to appropriate positions in the economy, regardless of social background (Hannum and Buchmann 2005, 333-354). Hannum and Buchmann also found that countries with better-educated citizens have healthier and slower-growing populations, as edu-cated individuals make more informed health choices, live lon-ger, and have fewer and healthier children. In Pakistan, in spite of all the efforts and measures taken by federal and provincial governments, educational data and reports shows poor growth in net and gross enrolment ratios (see Table 1), a decline in the quality of education (Memon 2007, 47-55) and gender equality in education index1 (GEEI) (Aikman and Unterhalter 2005), and an increasing burden of illiterate citizens (see Figure 1). With the introduction of the new local government (LG) system (con-sists of three tiers i.e. District / Tehsil / Union Council) under the devolution of power plan in 2001 development planning is car-ried out by the district governments with a focus on local priori-ties and needs (National Reconstruction Bureau 2001). The dis-trict government allocates substantial resources for development initiatives in social sectors to improve service delivery in the field of education, health, and other social sector departments. An outcome assessment of development initiatives and resource allocation for different sectors is unlikely without reliable spa-tial and aspatial baseline data. The district Educational Manage-ment Information Systems (EMIS) are collecting public school data including basic school information, enrollment by gender, level and class, and facility infrastructure (electricity, drinking water, toilets, etc.) on a yearly basis through a school census, but are unable to support the educational planning and monitoring activities at the micro level i.e. union council and mouza/village (Revenue Estate), because of missing student and spatial infor-mation at this scale, and are also unable to compute the district or school level indicators due to a lack of skill and knowledge (Shah 2009, 1-25).
In a recent study, the Pakistani planning process examined by Mitchell does not consider data for out-of-school children, students in private schools, or the distribution of school age population (Mitchell 2008, 1-13). There is a need to consider such important data as they are relevant to establishing a base-
line understanding of education in the study area. For example, in a recent report based on the Pakistan Social and Living Stan-dards Measurement Survey (PSLM), which is one of the main mechanisms for monitoring the implementation of the national programs in Pakistan, 54 percent of the population aged 10 years and older had attended some school in Khanewal district with 60 percent net primary enrolment, and 57 percent (female 53 per-cent, male 60 percent) in rural areas (Statistics Division 2010).
The advancement in the field of geographical information systems (GIS) had contributed greatly to a number of studies dealing with measures of spatial access to educational facilities and resources. In developing countries, GIS and school mapping (SM) technique are often used to create the necessary condi-tions for achieving universal primary and secondary education (UPE and USE) and increasing access to educational facilities for socially disadvantaged populations (Hite 2008). Use of a GIS tool in social sector planning is not new in Pakistan (Bashir and Ikram 2003, 227; Almas et al. 2005, 277-282; Naqvi 2007), but fewer efforts are seen at the micro (community) level for planning and monitoring (Alam et al.2008b). In the education sector, there are few attempts and initiatives involving GIS at the provincial EMIS units, but none of the provinces are able to produce GIS related reports of these activities (Ministry of Edu-cation (P&P) Wing 2005); moreover, these units are using GIS tools for mapping and displaying locations of existing public schools. City District Government Faisalabad developed a GIS project for improved planning and service delivery, in which a detailed basemap of a 5,856 square kilometre area was devel-oped by digitizing 0.6-meter resolution imagery from the Quick-bird satellite (Alam et al. 2008b). For the sake of updating, a sur-vey (Services Information Collection Survey, 2007) was carried out to gather information about the available services, includ-ing educational facilities, and their location (Alam et al.2008a). The scattered settlements having more than 40 households were considered for this activity (Alam et al. 2008b). However, the utilization of GIS for the purpose of policy analysis and review has not been observed. The central objective of this article is to examine the potential for combining spatial data analysis with the school mapping activity to identify potential school sites at local level by mapping and analyzing the inequalities in access
1The Gender Equality in Education Index (GEEI) is developed for the Beyond Access Project scorecard for gender equality in education. The GEEI combines data gathered by UNICEF on girls’ attendance at school, by UNESCO on girls’ achievement in primary school and access to secondary school, and by UNDP on the gender development index (GDI). Four widely used measures have been used to develop the GEEI for girls’ access and retention in school: girls’ net at-tendance rate at primary school, girls’ survival rate over five years in primary schooling, girls’ secondary NER, and a country’s GDI.
Table 1: Out-of-school population in 1998 and 2005 in Khanewal district.
and distribution of existing schools based on the reliable base-line data.
Study AreaThis research took place in the rural Union Council Chak
84/15L of the Khanewal District2 in Pakistan. In 1998, the population of the Khanewal district was over two million with a population density 475 persons per km2. UC Chak 84/15L is located on southeast of the City of Khanewal, the largest city in this district (see Figure 2). Being at a distance from the urban area and main highways, this UC is a typical example of the rural area of the Punjab Province. The UC Chak 84/15L consists of seven mouzas with a scattered population (population density varies from 6.6 to 10.8 persons per km2) and the literacy rate varies from 28.1 to 43.3 percent (Population Census Organiza-tion 2000). It is important to explain the concept of mouza here for the sake of understanding the study area clearly. As stated by the Pakistan Agriculture Census Organization (ACO), the term mouza /deh3 is a territorial unit with a separate name, definite boundaries, and an area precisely measured and divided into plots/khasras/survey numbers. Each mouza is a revenue estate and has a cadastral map maintained in the land revenue record with a hadbast number. The term mouza/deh is widely used in the settled areas and there may be one or more settlements, aba-dies, basties, dhokes, etc. in the territory of a mouza/deh. The mouza may also have scattered inhabitation while there may be some mouza without a population as well (Agriculture Census Organization 2008). It is important to talk about the school type
in the study area as well as in rural Pakistan; most of the pub-lic schools are single-sex school whereas there are some private schools providing co-educational schooling.
MethodMaterials and procedures
Initially, a base map of the study area showing population settlement sites, school locations, roads, water bodies etc. was prepared in a GIS format. For this purpose, mouza maps along with the list of settlements, abadies, basties, etc. were collected from the Pakistan Census Organization. These maps were up-dated with the consultation of staff of the revenue department and local community members. The community maps were also helpful in this process. These maps were digitized with the help of AutoCAD Map software. Later Google Earth and Wikimapia were used to further improve the locations of scattered inhabit-ants, and the sites of public/private schools in the study area (see Figure 3a, b, and c). Google Earth is a free-of-charge web based mapping software using satellite images and aerial photographs with varying resolutions that shows a visually accurate represen-tation of the entire Earth surface (Emmanuel and Kostas 2008, 143). It also allows users to overlay and modify their vector data. Finally, through community participation, a detailed map of the study area and the list of scattered inhabitants in the form of settlements, abadies, basties, dhokes, etc., along with estimated number of households, were prepared to conduct the household survey for gathering the socio-demographic information includ-ing out-of-school children and illiterate population of the entire UC. This data collection activity was conducted by a group of students from the Department of Sociology, University of the Punjab, Lahore and was supervised and monitored by the Punjab Literacy Promotion Project (PLPP), a technically funded project by the Japan International Cooperation Agency (JICA) in the
2Khanewal District has four tehsils, 100 UCs and 670 Mouzas (mouza is the lowest level at which the census data are available).3The word “Deh” commonly used in Sind Province.
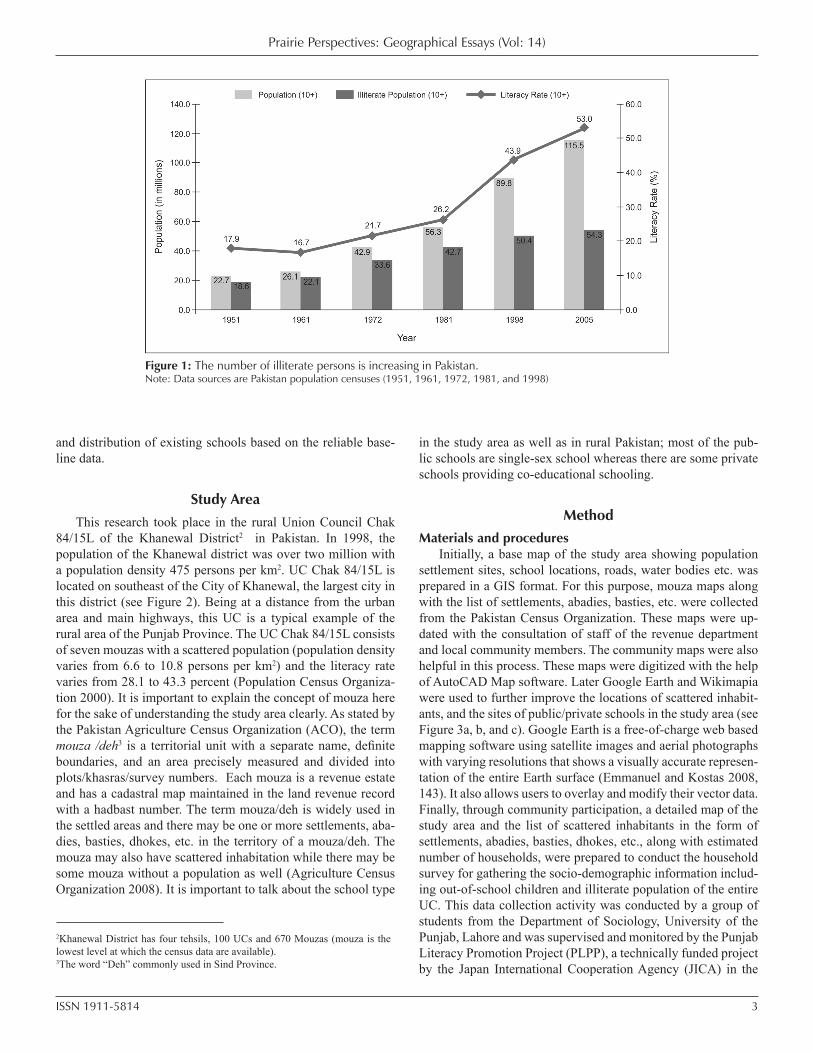
Figure 1: The number of illiterate persons is increasing in Pakistan.Note: Data sources are Pakistan population censuses (1951, 1961, 1972, 1981, and 1998)
Figure 2: Study area: (a) map of Pakistan and surrounding areas; (b) map of Khanewal district showing tehsil boundaries; (c) map of UC Chak 84/15L.
Figure 3: Mapping process (a) use of Google Earth to update and improve the locations of scattered inhabitants (b) use of Wikimapia to identify the map features including basic public facilities-schools (c) community consultation for map verification and improvment .
summer of 2006. A team of 20 people was selected from the study area, and was engaged for the door-to-door data collection activity after providing them onsite one-day training. During the training, the map of the study area having scattered inhabitants was delineated into 18 clusters based on the estimated number of households, and then these clusters were assigned to the survey team based on their place of living either within or closest to the cluster. Three factors were considered while assigning the survey area to the interviewers. First, to control travel costs local interviewers were recruited. Second, familiarity with the survey area in terms of the local customs and culture was a priority ( i.e. families in this area and in other parts of rural Pakistan are less willing to give the information about their young girls/female member especially when visitors are not form their own community/area) is helpful to maximize the of survey coverage. Third, flexible working hours were deemed important to maxi-mizing data quality as some household members might not be comfortable providing such information in the absence or pres-ence of the family head or male family members. It took ten days to complete the data collection; on-site data cleaning and data verification where the number of surveyed households was not close to the estimated number of households at a particular settlement. Data entry software was developed in MicroSoft Ac-cess with the help of PLPP’s software developers. This database helped in generating various queries and reports on the survey dataset. The survey data were joined with the spatial data using ArcGIS software. The proximity of the population settlements from the nearest schools was determined using the proximity analysis tool Near (point to point) that determined the distance of each population settlement from the nearest school, in esti-mating the inequalities in distribution of the existing schools and in identifying the potential sites where schools need to be opened.
ResultsThe demographic and social characteristics of the UC Chak
84/15L are summarized in Table 2. Overall, 3,413 household in-terviews were completed. For mapping and analysis purposes, the scattered inhabitants with less than five households were grouped with nearby sites (inhabitants) to keep individual house-holds confidential. In total, there were 141 inhabitants including the main settlements of the seven mouza’s (revenue estates, sim-ple village) in the UC Chak 84/15L. The survey found that the 7,308 people (32.6 percent of the total population) were living as scattered inhabitants (abadis, basti, dhokes, etc.) and Figure 4 demonstrates the distribution of these inhabitants according to population size and the locations of the public and private schools in the study area. There were a total of 24 schools (16 public and 8 private) in this UC. The proportion of the out-of-school children in the 5-14 years age-group among the scattered inhabitants was 57.3 percent which was comparatively higher than those living in the main settlements (49.3 percent). In rural areas of developing countries, research has examined the impact of access to electricity on achieving the universal primary edu-
cation and literacy rate (Daka and Ballet 2011, Kanagawa and Nakata 2008). In general, access to elec-tricity, heating, and related services are related to development. Here it would be useful to calculate the household electrification rate for the sake of comparison between main village locations and scattered popu-lation. In our study area, the propor-tion of households among scattered inhabitants having electricity was 37.5 percent which was compara-tively lower than the main settle-ments (83.3 percent).
Table 3 shows a summary of the characteristics of the female popu-lation including educated, illiter-ate, and out-of-school by groupings among the population settlements into six categories based on the dis-tance from the nearest girl’s primary
Table 2: Socio-demographic indicators of UC Chak 84/15L.
Figure 4: Distribution of the settlements by population size, and the locations of the public and private schools.
school and similarly Table 4 shows a summary of the charac-teristics of the male population based on the distance from the nearest boy’s primary school. Figure 5 shows the distribution of out-of-school boys of the 5-14 years of age-group and their distances from nearest boy’s primary school. Similarly, Figure 6 shows distribution of out-of-school girls of the 5-14 years of age-group and their distances from the nearest girl’s primary school. Figure 7 shows three insets of Figure 6 representing dif-ferent patterns of distributions. The star symbol represents the population settlements and its color shows their distance from nearest school (in case of Figure 5 from boy’s primary schools and Figure 6 & 7 from girl’s primary schools). Note that these maps also included those middle and high schools, which have a primary section. The star label displays the out-of-school popu-lation of the 5-14 years of age-group (on the left side of the label), and the total population of same age group (on the right side of the label).
The distribution of out-of-school children of the 5-14 years age-groups exhibit several patterns. The 66.5 percent of the total out-of-school children (1120 girls and 901 boys out of 3041 out-of-school children) were living at a distance of half kilometre from the main settlements, the remaining 33.5 percent (630 girls and 390 boys) were living in scattered locations away from the main settlements (see Table 3 and 4).
Discussion
The central objective of this article was to examine the po-tential for combining spatial data analysis with the school map-ping activity and identifying the potential school sites at the lo-cal level by mapping and analyzing the inequalities in access to and the distribution of existing schools based on the reliable baseline data. The results reveal that the population living in this UC is distributed within the mouza boundaries with consider-able distances from the mouza’s main settlement and from each other and this distribution varies from mouza to mouza. Prior to discussing the significance of the research findings, some limita-tions need to be addressed.
The interviewers were assigned the inhabitants and or/ por-tion of the main settlements closest (including their own sites) to their living sites for this survey for three reasons: to reduce travel cost; their familiarity with the survey area in terms of the local customs and culture; and flexible working hours. This might have influenced the survey outcomes, but these effects would be minimal because the questionnaire used for this study is simple and straight forward. An additional limitation is that the clusters with less than five households were grouped with other sites or groups of sites which might affect the results based on nearest distance.
This study reveals that the basic education facilities are not equally accessible to the rural populations in this region, espe-
Table 3: The distance from nearest girl’s primary school.
Table 4: The distance from nearest boy’s primary school.
cially for those persons living among scattered inhabitants. This outcome is similar to the findings of the following studies that examine access to schools. Research based on 1991 Pakistan In-tegrated Household Survey (PIHS) presented data that showed that 21 percent of rural girls and 9 percent of rural boys aged 7 to 14 years do not have an appropriate school available within a one kilometre buffer (Sathar and Lloyd 1994, 103-134), and an-other research carried out in Egypt, found that girls’ enrolment dropped off sharply when schools were located more than 1.5 kilometre away (Rugh 2000). To achieve the millennium devel-opment goals, specifically education for all (EFA) and universal primary education (UPE), it is important to consider out-of-school children regardless of their living places in the planning process.
This study, based on spatial and non-spatial baseline data, demonstrates the improvement in measuring the distance to school by analyzing the existing inequalities in access and distri-bution of existing schools, which is useful in identifying the new school sites in rural areas particularly in scattered settlements. Our results regarding out-of-school children living within a half kilometre from main settlements with schools , support the findings of research conducted in 21 rural areas in low-income countries by Filmer (2004) that efforts should focus on commu-nity awareness, social mobilization, and quality of schooling. Moreover, for the reasons of safety and security, most of par-
ents were reluctant to let their daughters walk long distances to school (Rugh 2000), and girls participation may also be affected by the inadequacy of facilities in existing schools. In rural Pun-jab 22.2 percent of the girls public schools do not have drinking water, and 51.4 percent do not have electricity (Federal Bureau of Statistics (FBS) 2006), and in our study area there was two girls public schools (1 primary and 1 middle) having no electric-ity and three public schools (2 primary and 1 middle) having no toilets facilities, are also potential factors. The results pro-vide some practical guidelines for the identification of locations where schools could be opened (see Figure 7). Figure 7A shows the distribution of out-of-school girls of the 5-14 years of age-group. Based on the distances from nearest girl’s primary school and potential enrollment present in the settlements new schools can be opened here. Figure 7B and C present the situation where it is difficult to identify new sites for schooling because of more scattered population.
AcknowledgementWe would like to thank the following individuals and in-
stitutions for their generous assistance and support; Takumi Koide, from Japan International Cooperation Agency (JICA), Muhammad Alam, Maleeha Mengal, Farhat Rafique, and Rabia Alvi from Department of Sociology, University of the Punjab,
Figure 7. Distribution of out-of-school girls of the 5-14 years of age-group and their distances from nearest school having girl’s primary section (A) represents the settlements which form the high need cluster of settlements; suggests new school(s) location (s) (B) and (C) present the situation where it is difficult to plan any new school because of totally scattered population.
GOVERNMENT OF PAKISTAN 2010 Pakistan Millennium Development Goals Report-2010 (Islamabad, Pakistan: Centre for Poverty Re-duction and Social Policy Development)
HANNUM, E. and BUCHMANN, C. 2005 ‘Global educational expansion and socio-economic development: an assessment of findings from the social sciences’ World Development 33 (3) (/3): 333-54
HITE, S.J. 2008 School Mapping and GIS in Education Micro-planning (Paper presented at Directions in Education Planning: a symposium to honour the work of Francoise Caillods, Paris, France)
MEMON, G.R. 2007 ‘Education in Pakistan: the key issues, problems and the new challenges’ Journal of Management and Social Sciences 3 (1): 47-55 (Avdailable at http://www.biztek.edu.pk/downloads/research/jmss_v3_n1/5%20EDUCATION%20IN%20PAKISTAN.pdf)
MINISTRY OF EDUCATION (P&P) WING 2005 Islamic Republic of Paki-stan: Diagnostic Report of Education Statistics (Jointly prepared by the UNESCO Institute for Statistics (UIS) and the National Technical Committee on Educational Statistics Capacity-building. Islamabad, Pakistan: Government of Pakistan)
MITCHELL, J. 2008 ‘How information based planning can flourish where traditional politics reign: an example from Pakistan’ Journal of Education for International Development 3 (2): 1-13
NAQVI, A.A. 2007 A Look at the Spatial Inequality in Pakistan: Case Study of District Sargodha (Paper presented at Mapping Global Inequalities - Beyond Income Inequality, University of California, Santa Cruz)
NATIONAL RECONSTRUCTION BUREAU 2001 Local Government System 2001 in Government of Pakistan [database online] [cited January 05 2011] (Available at from http://www.nrb.gov.pk/local_govern-ment/default.asp)
POPULATION CENSUS OGANIZATION 2000 District Census Report of Khanewal 1998 (Islamabad, Pakistan: Government of Pakistan) 64
RUGH, A. 2000 Starting Now: Strategies for Helping Girls Complete Primary (Washington, DC: Academy for Educational Develop-ment) (Available at http://eric.ed.gov/PDFS/ED462516.pdf)
SATHAR, Z.A. and LLOYD, C.B. 1994 ‘Who gets primary schooling in Paki-stan: inequalities among and within families’ The Pakistan Devel-opment Review 33 (2): 103-34
SHAH, D. 2009 ‘Monitoring the quality of secondary education in the context of decentralization in Pakistan’ Bulletin of Education and Research 31 (1): 1-25
STATISTICS DIVISION 2010 Pakistan Social and Living Standards Mea-surement Survey ([PSLM)]2008-09: Provincial/District. Islam-abad, Pakistan: Federal Bureau of Statistics)
Lahore, and District (Khanewal) & Provincial Literacy & NFBE Department, Punjab.
References AGRICULTURE CENSUS ORGANIZATION 2008 Pakistan 2008 Mouza Sta-
tistics (Lahore, Pakistan: Statistics Division, Government of Paki-stan)
AIKMAN, S. and UNTERHALTER, E. eds. 2005 Beyond Access: Transform-ing Policy and Practice for Gender Equality in Education Oxford, UK: Oxfam Publishing) (Available at http://books.google.ca/books?id=XC1jGwGLiVwC&printsec=frontcover&source=gbs_ge_summary_r&cad=0#v=onepage&q=pakistan&f=false)
ALAM, S.M.K., GARDENER, J. and TARIQ, M. 2008a. Union Council Profil-ing: A Tool for Better Planning & Investment (Faisalabad, Pakistan: City District Government Faisalabad)
ALAM, S.M.K., MEHDI, MS. and KHOKHAR, H.G. 2008b Enabling Join-up Government: Introducing Geographical Information Systems for Improved Planning and Service Delivery (Faisalabad, Pakistan: City District Government of Faisalabad)
ALMAS, A.S., AMJAD, S., RAHIM, C.A., BUTT, M.J. and SHAH, T. 2005 ‘Met-ropolitan growth monitoring and land use classification using geo-spatial techniques’ (Paper presented at ISPRS Workshop on Service and Application of Spatial Data Infrastructure, Hangzhou, China) (Available at http://www.isprs.org/proceedings/XXXVI/4-W6/pa-pers/277-282%20Amjed%20S.%20Almas-A039.pdf)
BASHIR, F. and IKRAM, T. 2003 ‘Implementation of disease early warning system on malaria’ Journal of Medical Sciences (J. Med. Sci.) 3 (3): 227
EMMANUEL, S. and KOSTAS, P. 2008 ‘Google earth and XML: advanced visualization and publishing of geographic information’ in Inter-national Perspectives on maps and the Internet, ed. M.P. Peterson, (Berlin; New York: Springer) (Available at http://library.usask.ca/scripts/remote?URL=http://www.myilibrary.com.cyber.usask.ca?id=121670) 143
FEDERAL BUREAU OF STATISTICS (FBS) 2006 National Education Census 2005 - Punjab [cited January 20 2011] (Available at from http://www.aepam.edu.pk/NEC_Full_Punjab.htm) Table 39
FILMER, D. 2004 If You Build It, Will They Come? School Availability and School Enrollment in 21 Poor Countries (Development Re-search Group, The World Bank, Working Paper 3340)