FAD-Al6i 198 STRATEGIC PERFORMANCE MANAGEMENT EVALUATION FOR THE t/2 NAVY'S SPL.ICE LOCAL AREA NET&JORKS(U) NAVAL POSTGRADUATE SCHOOL MONTEREY CA D D BLANKENSHIP APR 85 UNCLASSIFIED F/G 9/2 U mohEohEohEE EomhEmhhhhEEEEI
Transcript
FAD-Al6i 198 STRATEGIC PERFORMANCE MANAGEMENT EVALUATION FOR THE t/2NAVY'S SPL.ICE LOCAL AREA NET&JORKS(U) NAVAL POSTGRADUATESCHOOL MONTEREY CA D D BLANKENSHIP APR 85
UNCLASSIFIED F/G 9/2 U
mohEohEohEEEomhEmhhhhEEEEI
ma
1111L2 A .6
MICROCOPY RESOLUTION TEST CHART
NATIONAL BUREAU OF STANDARDS- 1963-A
NAVAL POSTGRADUATE SCHOOLMonterey, California
i .4
2f
91%5,! I )85
4ATHESIS
. STRATEGIC PERFORMANCE MANAGEMENT EVALUATIONb FOR THE NAVY'S SPLICE LOCAL AREA NETWORKS
by
e David D. Blankenship
September 1985
Thesis Advisor: Norman F. Schneidewind
CA Approved for public release; distribution is unlimited
IT ~'~'&50461
SECURITY CLASSIFICATION OF THIS PAGE (WINN Dal& SNIa64REPORT DOCUMENTATION PAGE READ INSTRUCTIONS
R D N BEFORE COMPLETING FORM1. 0ER NUMER (32 G . RECIPIENT'S CATALOG NUMBER
4. TITLE (and Subtitle) S. TYPE OF REPORT & PERIOD COVERED
Strategic Performance Management Master's Thesis)Evaluation for the Navy's SPLICE Local September 1985
Area Networks 6. PERFORMING ORG. REPORT NUMBER
i \i .7. AUTHOR(q) 1. CONTRACT OR GRANT NUMER(O)
-David D. Blankenship,. PERFORMING OROANIZATION NAME AND ADDRESS 16. PROGRAM ELEMENT. PROJECT, TASK
AREA & WORK UNIT NUMBERS
Naval Postgraduate SchoolMonterey, CA 93943-5100
11. CONTROLLING OFFICE NAME AND ADDRESS 12. REPORT DATE
Naval Postgraduate School September 1985Monterey, CA 93943-5100 1s. NUMBER OF PAGES
13814. MONITORING AGENCY NAME & ADORESS(Il dIllort f 0rom CentrllingOffo) IS. SECURIT) -LASS. (of this report)
UNCLASSIFIEDISO. DECLASSIFICATION/DOWNGRADING
SCHEDULE
16. DISTRIBUTION STATEMENT (of this Report)
Approved for public release; distribution is unlimited
I. DISTRIBUTION STATEMENT (of the abstract entered I0 Block 20i If different fro Report)
1. SUPPLEMENTARY NOTES
1S. KEY WORoS (Continue on reverse ide ife rcoeeery and dent, by block numbe) Network Performance
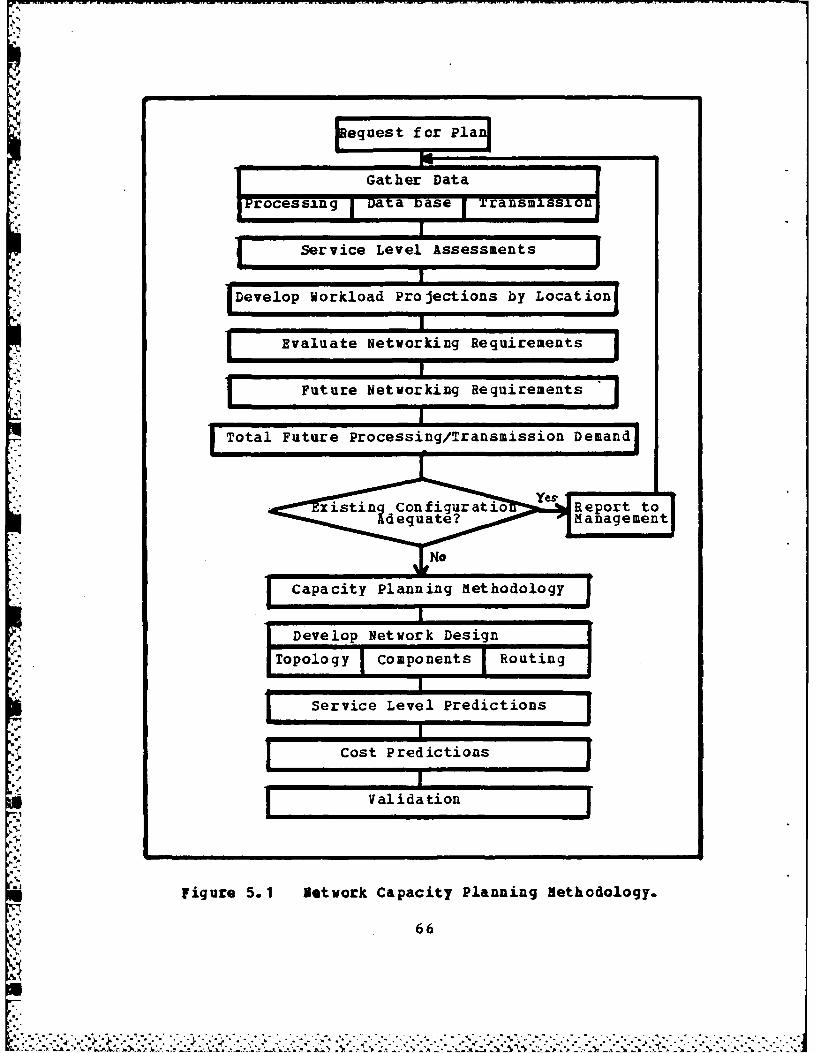
Evaluation, LAN Performance, Network Performance Metrics, StockPoint Logistics Integrated Communication Environment (SPLICE),Supply Networks, Computer Performance Tools, Internetworking,Capacity -Planning, Hyperchannel, Tandem Computers, Defense DataNetwork (DDN), Distributed Network Performance20. ABSTRACT (Continue on revers* ilde If neceoemry and identify by block number)
--'This thesis investigates those aspects of network performanceevaluation thought to pertain specifically to strategic performancemanagement evaluation of the Navy's Stock Point Logistics Inte-grated Communications Environment (SPLICE) local area networks atstock point and inventory control point sites. Background isprovided concerning the SPLICE Project, strategic management, com-
*puter performance evaluation tools, computer and local area net-work performance metrics and performance evaluation (Continued)
DD I o..PM 1473 EDITION OF I NOV03 IS OBSOLETES 'N 0102- LF. 014- 6601 1 SECURITY CLASSIFICATION OF THIS PAGE (111n Deo Wne.ed)
SCURNITY CLASSiFICATION OF THIS PAGE MhM DMe XMM04
ABSTRACT (Continued)
"methodology, capacity planning, the SPLICE LAN Communnicationssubnetwork hardware and software, and internetworking of SPLICELAN's via the Defense Data Network (DDN). These topics, rele-vant case studies, and observations of one SPLICE LAN siteare used to arrive at implications and recommendations applicablefor improving future generic SPLICE LAN planning and performance.
J/
. -
L, ,... . .. . . . . .
" odesa:,.,o,d i or
Lll
2 SECURITY CLASSIICATIOW OF THIS PAGru t m Daft 1te )
|p
Approved for public release; distribution is unlimited.
Strategic Perfocmance danaqement Evaluation for the NIVY's
SPLICE Local Area Networks
by
David D. B nkenshiLieutenant Commander, U.19. Navy
The contention that technology continually outdistances
methodology is nowhere more accurately reflected than in the
struggle by industry, government, and nonprofit institutions
to get managerial control of local area network (LAN)
technology. In LAN's a merging of hardware, software, and
., cosmuvications technclogies has occurred and spawned new
problems for the owning organization in how to optimize and
provide for the evolution of a network so that benefits of
hybrid technology can be reaped as a conscious effort rather
than by accident. The issues at hand now include the
merging and maturing of managerial skill along with ournewly found technologies. During the same period when LAN
technology was developing, strategic planning in management
was being introduced formally as a way to not only provide
sound decision-making for the current issues, but to
anticipate any future environments and decision points aswell. Management often has little time for formal planning.
I he Navy's Stock Point Logistics. Integrated
Communications Environment (SPLICE) project for the blaval
Supply Systems Command (NAVSUP) is an appropriate context to
address these observations within the public sector. This
phased plan to intrcduce policies and standards for future
networking needs at multiple internetworked sites can
continue to produce organizational benefits if some
additional effort is expended now. This effort involves
constantly assessing the past and present performance and
anticipating the future workloads, technologies,constraints, and other factors in a total effort to provide
9
direction for the organization's network assets. At each
SPLICE site a management team, consisting as determined by
proper authority, of several appropriate members or as
little as one dedicated person can play a crucial role in
helping to avoid bad decisions, contribute to satisfied
productive users at all levels, and get the most out of
budgeted public funds. There is hardly a major corporation
today without a performance evaluation division, or in more
familiar terms, a capacity planning group. Bank of America
represents a company with a transaction and online query
envircnment as well as batch applications. In many ways
that example is similar to the Navy's SPLICE system. This
organization has a vice president in charge of capacity
planning and separate divisions in charge of capacity
planning for their TANDEM and their IBM systems. Personnel
in these divisions are in addition to the programming and
operations personnel. This illustrates how much value they
place upon strategic performance evaluation in the form of
capacity planning for information systems.
The Navy has, like industry, centralized this type of
effort and made new application implementations, major
hardware and software decisions, and performance studies
from afar augmented by assistance visits to actual sites.
Unfortunately, the Navy has many more SPLICE sites than most
industries have computer installations, except perhaps for
giants such as IBM. We do not fault this centralized
approach. Rather, it is felt that a resident point of
contact familiar with the particular hardware and software
installation, the people, and the nature of that site'ssupply business can significantly assist in the success of
centralized policy and standards and of the site's supply
issicn.
Each SPLICE node management team, because of the
uniqueness of each node, must be able to not only measure
10
• . ~ ;--2--.
its own network performance, but to reach tuning, sizing,
and capacity and configuration decisions for the future by
interpreting those measurements. In practice,. the Fleet
-aterial Support Office (FMSO) conducts performance criteria
and standards studies of each new application and an initialon-site performance evaluation at each SPLICE site. Local
SPLICE node management should desire integral involvement in
this process of establishing such a baseline of performance
for their locally run applications. This performance
evaluation experience gained while working with FMSO support
groups can be valuable in assessing any future network or
on-site modifications potentially affecting that particular
SPLICE site.
In time as applications vary and as user demands
accelerate, an crganized ongoing methodology of
strategically interpreting SPLICE monitored performance data
will te essential in creating a historical data base, or at
least a consistently documented approach to network
performance management. Such a methodology can assist
management of each SPLICE node in ensuring that SPLICE
performance indeed matches the goals and objectives of the
Navy's supply mission for SPLICE. It further seems logical
that there should be some performance interpretation
activities common to all SPLICE nodes and thereby applicable
to any generic SPLICE node. This thesis addresses those
potentially common computer network performance
interpretation issues and suggests performance management
guidelines which we believe to be relevant to the management
of any SPLICE LAS node.
B. SEECIFIC THESIS OBJECTIVES
The primary objective of this thesis is to stimulate
thought on how managers might usefully interpret local area
11
computer network performance data within the context of the
organization's strategic plans and for the following
purposes:
1. To improve network perfcrmance
2, To predict performance levels
3. To establish realistic performance standards andgoals
4. To enhance network resources utilization
5. To assist capacity planning and configurationmanagement decisions
Subsidiary research areas in support of this primary
objective comprise the body of the remainder of this thesis.
Additional issues to consider include the following:
1. The more deceptively simple decisions of whichperformance parameters to measure and interpret;
2. Current computer versus network qualitative andquantitative performance measurement concepts;
3. Consideration of ways in which internetworking SPLICELAN nodes via the Defense Data Network JDDN) or otherlong-haul network will affect individual nodeperformance.
4. Overlay of strategic management onto the LANmanagerial environment.
Investigating these areas leads to questions of how to actu-
ally interpret network performance data assuming we know
what data to gather and how to gather it. This question
relates more directly to the primary thesis objective while
remaining subsidiary areas support details of accomplisiing
this cverall objective.
C. RESEARCH JUSTIFICATION
The case for strategic network performance management of
SPLICE nodes is perhaps clearer than for such an activity in
general. There exists a considerable body of professional
literature on individual computer system ,oaitoring.
Evaluating the performance of an entire local area networkof multiple processors, data paths, and connectivity through
12
|
telecommunications interfaces and protocols is much more
difficult and less understood. Even less well-explored are
the strategic management implications of such evaluated
performance once it is obtained. Previous longterm gaidance
has primarily been accomplished on an ad hoc basis tailored
to individual network situations. Despite the diversity of
networks, there is a need for a generalized approach to
strategically manage network performance so appropriate
network resources are fully utilized and so management can
retain a controlling as opposed to a reactive pcsition.
Beneficiaries of this research include not only the SPLICE
., operations and technical support managers, supply center ADP
department heads, FESO, and NAYSUP, but anyone desiring
current research information cn guidelines for performance
management of LAN's.
D. SCOPE AND ETHODOLOGY OF THE RESEARCH
This thesis has been narrowed in scope to necessarily
strike a balance between conveying managerial guidelines and
providing an essential technical foundation to the reader.
This research is specifically limited in scope to applyinq
concerts of strategic management and computer and known
network performance evaluation techniques to operations of a
generic SPLICE LAN. Various classes of network performarce
parameters will be discussed.
The following will not be covered:
1. Real-time operational network management
2. Performance tuning procedures or equipment
3. Casualty monitoring
4. Algorithms for processing or optimizing networkrouting directories
5. Excessive technical details of piotocolconsiderations
6. Detailed software techn.cal aspects beyond thoseneeded in management implications of performance data
13
7. Details of the Navy supply system or its currentpolicies or specific ADE transactions
8. sophisticated mathematical treatment of performanceissues (gueueing theory, modeling, etc.) User needsor procedures.
The emphasis is on long-term managerial interpretation of a
variety of performance aspects in SPLICE.
The research involved a review of available
NAVSUP/FMSO/Tanden Computer Corporation/Defense
Communications Agency (DCA)/Federal Data Corporation (FDC)
literature; an extensive survey of academic and professional
book and article literature concerning performance of
computer systems, networks systems, and network management
issues; and on-site observation of a SPLICE LAN
configuration at Naval Supply Center, Oakland, California
with interviews of management responsible for implementing,
operating, and evaluating SPLICE at that site. tnformation
collected and conclusions drawn are primarily a result of
exposure to primary and secondary source publications
already mentioned, impressions from telephone or in-person
interviews, and one on-site observation experience of two
days in duration.
E. ASSUMPTIONS AND CAVEATS
.The following series of assumptions and caveats have
been made in producing this research effort:
1. It is assumed that tools and techniques of assessingindividual performance for computer systemscomponents can be applied to a degree to local areanetworks and their components. The element o.synergy here will vary with the network and furtherresearch is needed.
2. References to quantitative specifics are forillustrative purposes only and make no attempt toimply a unique way of specifyinq user performancearamters. Any performance figures cited are
likewise indicative of no particular SPLICE 3ite orof any computer manufacturer. Such computations,?raphs, or figures an4 accompanying discussions areto assist the reader in assim lating necessary factsto participate in a decision identification process.
14
3. All discussions of performance parametersperformance evaluation, and capacity planning wvlirelate to the communications subnetwork elements of aSPLICE node (terminals, TANDEM FEP ' s, andHYPERchannel) and to the DDN influence on SPLICEperformance. Specifically excluded are the SPLICEmainframes, mass storage devices and the peripheralsfor FER's. This is not to say that theqe componentsare unimportant to performance evaluation. Ratherthey will receive "black-box" treatment here. The
*PEP peripherals are simply considered a subset of theFEP in providing service.
4. The assumption is made that strategic maragemRentperformance can be applied to various aspects ofcommunications network performance evaluation.
5. Comments here address an installed, running systemand not analysis or design issues.
6. This thesis aims at~applying a narrow portion ofnetwork management, i.e. uerformance evaluation andplanning, to SPLICE evolu ion in the iuture. Theresearch results do not provide a cookbook of do'sand don't's.
Ile mission of the Naval Supply Systems Command (NAVSUP)
is to provide effective logistics support to Naval fleet and
shore commands [Ref. 1: p. I ]o NAVSUP formally initiated
the Stock Point Logistics Integrated Communications
Envircnment (SPLICE) through a tasking letter to Fleet
Material Support Office (FMSO) on August 16, 1978 (Ref. 2:-
p. 1-11. The project had been informally discussed since
1977. The Department of the Navy Code 041 (O,.NAV-041)
became the project sponsor. NAVSUP initiated SPLICE as a
long-range four-phased project with the intent of augmenting
the existing Navy Stock Point and Inventory Ccntrol Point
(ICP) automatic data processing (ADP) facilities that
support the Uniform Automated Data Processing System--Stock
Points (UADkS--SP).
This augmentation was directed at the expanding problem
of an unstandardized proliferation of unique hardware and
software solutions to various new projects planned at
numerous sites under (UADPS--SP), tae projected ADP growth,
and tte need for state-of-the-art technical capabilities.
Such unique soLutions created the need for specialized
hardware and software UADPS--SP interfaces from each Lew
project multiplied in effect by the number of uniquely
configured UADPS--SP sites. The UADPS-SP hardware,
primarily the Burroughs medium Size
(B--3500/37-0/4700/800/4900) System at most sites, could
not support multiple int . aces, projected increased service
volumes, interactive processing requirements, and
teleccommunications functions simultaneously without a
16
significant redesign effort. There is an 8 to 10-year
long-range plan to replace all ADP equipment according to
NAVSUP [Bef. 1: p. 1). This plan is the Stock Point ADP
- Replacement (SPAR) Project. SPLICE was to be one of the
three shorter-term solutions using as much off-the-shelf
capability as possible. SPLICE was to provide an effective
and efficient standardized environment for absorbing
communications workload from mainframe resources thus
freeing then to handle increased applications volume, to
support large scale interactive processing, and to serve
networking requirements. Tvo other changes were to
accompany this acquisition: replacement of older Burroughs
mainframes with newer ones and replacement of outdated
magnetic tape and disk drives [Ref. I.- p. 1].
SPLICE is now progressing with implementation,
predominantly as individual unconnected nodes. The ultimate
-.7. goal is to consolidate both local and long distance
communications into a single integrated network using theDDN as a backbone (Ref. 1: p. 2]. The
"foreground-background" processing concept of SPLICE is to
be iaplemented at stock point sites using the Tandem
Corporation minicomputer hardware and software suite with
additional software supplied by FHSO. The initial field
i. *system prototype training and installation occurred at Navy
Regional Data Automation Command (NARDAC) Jacksonville,
" Florida in July, 1984 thru January, 1985 [Ref. 1: p. 4]. A
benchmark test is to be used according to plan [Ref. 1: p.19] as the acceptance test for additional configurations
which are ordered with sufficient' components for the site
worklcads specified in the response document of the selected
contractor [Ref. 3: pp. 9-1 to 9-198]. Local area network
(LAN) performance reguirements will likely skew from theoriginal benchmark results because those results were based
' upon nonspecific pseudo-transactions specified in the
17
4.,.
solicitation document [Ref. 4: pp. 70, 71] and which were
likely to be processed at any SPLICE node. The dynamic
character of new supply applications programs and the sheer
volume increase in transactions, particularly interactive
ones, will no doubt alter the current performance character
and perhaps the desired performance requirements as well of
each SPLICE LAN. Certainly, the performance of each SPLICE
LAN will not match benchmark results exactly. Each SPLICE
site, despite the adoption of standardized TANDEM equipment,will remaiz somewhat unique in terms of applications and
transactions mixes and in some mainframe and peripheral
hardware as well as in geographic dissimilarities.
According to System Decision Paper III (SDPIII) [Ref. 1: p.
9], the ICP's presented a particular problem since they were
IBM-supported and required TANDEM SNA software support in
order to eventually be included in the SPLICE network. Forthese and similar reasons, all subsequent discussions will
focus on considerations and actions from the viewpoint of
management at any given SPLICE node.
B. SPLICE FUNCTIONAL AND CONTROL SUBSYSTEMS
The SPLICE concept was conceived to enhance the Navy's
ability to continue both online interactive and batch supplyorder and communications processing through the advantages
of internetworking LAN resources. The SPLICE functional
requirements [Ref. 2] outlined the designs which were to be
implemented by the system specifications [Ref. 5]. Because
the SPLICE project has been ongoing since 1977 and is
currently still in implementation stages, it is possible
that numerous changes and modifications have transpired in
hardware and software. The SDPIII [Ref. 1: p. 4] states
that functional intent has remained fairly constant.
18
Each SPLICE complex will contain the same modular
software subsystems. This reduces complexity, simplifies
maintenance, and reduces the variety of interfaces (Ref. 2:
p. 3-2]. The functional subsystems of the foreground are
discussed at length in the SPLICE functional description
[Ref. 2: pp. 3-3 to 3-11J. These functions are as follows:1. 9enal Sisysbtes -- three coumonents
whicn provide the terminal iandling, security, andaser process selection
2. Iranstion .o bs j jg __Istem -- eightcompn-ents w nhich provide user entry poins into thevarious transaction processing services of SPLICE
3. Complex 12.9-. COMPutE "ijtwork( {LQC) Contr2§Yu e -- -proie the paysica and logcaLnection to the LCN
4. Site Management Subsystem -- three components whichprovide access tthe- system for the SystemAdministrator, the console operator, and the CRT user
5. ntera fagement Subsytem -- four comonentsw5Ic.H control Imternal roiHnq of all data and files
destined for LCN/Data Communications NetworkDCN)/terminals, interpretation and execution of
command messages, and system monitoring
6. Data Exchance SubsXtm -- three components whichcontrol aa set riles entering and leaving the site,gueue files of backlogged transactions, and siteperipherals
7. it__q Q_ Contro -- two components wnich support thecommunications interface, control, priority, workloadleveling and logging of output tra ic.
The same basic functions somewhat distilled are presented in
Federal Data Corporation's (FDC) contract award in slightly
different names with overlap existing so tnat it is not
possitle to make a one-to-one correspondence. As cited in a
more recent contract award through FDC (Ref. 3: pp. 10, 11.
13] these functions are as follows:
1. lerminal Management,
2. Patch Processing,
3. Data Set Management,
4. Peripheral management,
5. Complex Management, and
6. SPLICE FEP support.
19
C. SPLICE LAN ASCHITECTURE
The configuration architecture for a representative
SPLICE LAN will now be briefly presented. The node referred
to directly or by implication here will resemble Naval
Supply Center Oakland, California more than any other since
that node was visited during the research phase of this
thesis to gain on-site exposure to the site configuration
and environment. The many functions, subsystems, and vendor
equipment capabilities have been explored and reported in
other works, including NAVSUP's own functional and system
specifications documents and research work conducted by
several faculty and graduates during the last three years at
the Naval Postgraduate School in Monterey, California. The
reader is directed to these works for detail beyond the
scope cf this research. Only a brief description of the LAN
configuration will be covered here to set the stage for
later discussions of the SPLICE communications subnetwork
and its performance.Basically, the stock point nodes can be described as a
flow from the user through the communications subnet to the
node mainframe(s), tc the FEP itself, or to internetworked
sites. The online terminals are connected in groups of six
to a common modem which connects to a coaxial cable. The
cable runs to a TANDEM frontend processor which routes
traffic either locally as "pass-through" to the Burroughs
(or ZEN mainframe at ICP's) via a HYPEchannel high speed
local network, processes the traffic as necessary at the
TANDEM processor cluster, or routes the traffic in gateway
fashicn to the DDN. At the ICPes, of course, the terminals
and mainframes may differ; however, the TANDEM fEP will
remain a standard for all SPLICE sites.
20
D. SIVATEGIC PLANING
1. Th Stateg Planning iciln
The views of distinguished writers in the field of
strategic thought best convey a feeling for strategic
thought and process. These will be generously used here to
reduce the amount of material which would otherwise have to
be explained as a background for performance evaluation. In
the case of SPLICE or any other LAN management, a plan is
essential simply because of the investment at stake and
because managers can no longer make their way without some
external knowledge of the environment affecting their
decisions. It is ncteworthy that NAVSUP has, after the
SPLICE project inception, approved a Strateqic PlanningDocument [Ref. 6] for the SPLICE organizational strategic
plan. Hadford aptly put it this way:
"Despite intuitive capabilities of successful managers,the increasing complexity of their environments placesincreasing demands upon them. It is more difficult toencure all necessary factors are included in a strategicplan unless a basic structure is adhered to keyond mereintuition." [Ref. 7: p. ix]
According to Radford, the aim of strategic management is as
follows:
". o . to ensure present and future activities of anorganization are ap priately matched to environmentalconditions under which the organization operates . ..to select future activity and action courses for theorganization which will result in a high degree ofachievement of objectives.#' [ef. 7: p.4]
The process described by Henry Fayol is as follows:
": (a) visualizing possible future situations inwhich the organization concerned might be involved, (b)placing these situations in an order of preferencerelative to the objectives of the or anization, and (c)considering ways in wnich the most preferred of thefuture situations considered can be brought about andthe least preferred avoided." (Ref. 7: p. 1]
* 21
Consider 62 or more separate interconnected SPLICE
LAN's in separate geographic 'areas with increasing volume
usage of increasing numbers of application processed not
only locally, but upon demand at other nodes as well. Add
to that a multi-vendored technology which cannot handle
further expansion and a few irregular budgetary constraints
or regulatory constraints and you have a hostile
envircnment.
2. Strategic plannin Characlerstics
To implement strategic planning within an
organization one must recognize what constitutes strategic
planning, what it can be applied to, and its limitations.
Since the external environment affects the entire
organization, it most probably toucaes all activities of the
organization. Performance evaluation and interpreting that
evaluation for capacity planning are activities needed in a
LAN organization. Radford writes:
. . . strategic planning provides . . . a set ofstrategies and policies that constitute a framework forplanning and decision-making throughout the organization
They are . . . extensions and amplificatiousof the organizational objectives on which Thi(planning) . . . process is based . Thisplanning process must keep in mind (1) the mission ofthe oro'anization, (2) the objectives of theorganizdtion, and (3) values and preferences of theorganization .... "(Ref. 7: p. 4]
This indicates that strategic plans have a way of*communicating organizational objectives to decision makers.
This is a desirable way to communicate performance goals andstandards throughout a SPLICE site. It might be necessary to
remi.nd the reader that an organization's strategic plan may
be dictated from higher authority levels-, but performance
evaluation can still be a relevant part, or even added at
actions, and reporting. Most authors offer very little
about wider reaching aspects involving such concerns as
planning, security, data bases, and performance
interpretation of data gathered about network activity.
.cst publications on network subjects lean heavily
toward design of network topology, issues of optimum design
for the user's needs, protocol issues, and monitoring to
improve current performance. Studies in the area of
capacity planning have been one exception to this short-term
view. Stallings' definition of network performance is as
follows:
"Network management is a broad concept that encompassesthose tasks, .human and automated, hat "support" thecreation, operation, and evolution of a network . . . itis the "glue" or infrastructure of techniques andprocedures that assure the proper operation of asystem." [Ref. 13: p. 326]
He qualifies this definition by indicating that "support"
should not be interpreted to mean the functions or
disciplines involved in controlling development or ongoing
use of a system. However, the words "evolution" and "proper
operation" in the definition certainly seem to imply some
sort of performance assessment and managerial intervention
28
tow.MC.'*'
to ensure the evolution is controlled and in concert with
organizational objectives. For this reason, network
management can be viewed in a much broader scope. This
broader scope will be pursued here.
There is an inconsistency in trying to restrict and
narrow a definition of network management on one hand and
viewing it as a "broad concept" as Stallings has on the
other hand (Ref. 13: p. 328]. This inconsistency can be
seen in the functions Stallings ascribes to network
management:
1. Cperatious --day-to-day operational status of thentDwork including traffic and performance status,active aevices and accounting and illing.
2. Administration --managing the use of the networktaroug- system eneration, passwords controlresqu~ce and ile access management, anAadministerinq an appropriate charge-out system. (Itcan be argued that matters of budgets, personnel andstaffing,- auditing accountingt and training areqeneral mana eBent features. Bu for inclusiveness,Mey are included here with administration.)
3. gaintenane --detection and reporting of problemsthroug H uman or automated means to assure that thenetwork continues to operate.
4. 9onfiouration M -- managenent of the system'sh r -oife cycles and its evolvingconfigration by tracking,, documenting an3contrOllinq chanqes to, sain aining status on, andensuring the con inuing adherence to requirements byall components.
5. Doc u en taion/train~i . --educationalfunctions tr eveloping and maintainingdocumentation.
6. Data base manggment --provide updating and caremanagemeet of toe netork management data Zase.
7. kl -i - providing for ongoing requirementsanajLyss, configuration change, and capacityplanning.
8. security -- protect against prevention and detectionof unauthorized network access.
Clearly some of these functions omit tne disciplines
involved in developing and modifying a system, but do not
omit whatever managerial functions are involved in
controlling network development and evolution. The problem
may be more that semantics. It is difficult to say when
29
Stallings' Unetwork management" ends and strategic
interpretati:n of phases and outputs of that management
process begins. While the first three functions above
comprise the responsibilities of the Network Control Center
(NCC), we believe, the NCC's role, like the definition of
network management, can be extended. The MCC's role should
include aspects of security and even porticns of
configuration management in a short-term sense. Stallings
elaborates on the functions of the NCC which be depicts as
primarily operational or maintenance in nature:
configuration functions, monitoring functions, and fault
isolation. The monitoring functions of an NCC can be
further decomposed into performance measurement (gathering
data),. performance analysis (data reduction and
presentation), and synthetic traffic generation (observing
the network under a hypothetical load). In these activities
lie scme sources of the performance data we seek to evaluate
throughout the network's life cycle.
The four performance evaluation objectives Ferrari
describes are very similar to those of Borovits and Neumann.
Each author implies that performance evaluation of a system
is necessary throughout the life cycle, and not merely after
it is installed. The perpetual objectives outlined by all
three author groups above and characterized in Ferrari's
terms [Ref. 9: pp. 2, 31 are these:1. Procurement --This includes all evaluation problems
assoed-with a choice of a system or componentsamong alternatives which matc es the conceivedworkload.
2. Improvement -This includes any performanceevai Ei problems which occur in existingoperational systems.
13 3. "ApYPlant ag -- This objective refers to thepdelt~on o.wen the current system capacity willbecome insufficient to process tne required workloadat a given level of performance and thus requiremodular or complete replacement.
4. Design -- This includes any performance problemsasgociated with designing an appropriate system.
30
,
The names of the phases vary, but the essence of the
cycle is captured by all the authors. The four areas of
evaluation are referred to by Morris and Both [Ref. 14: p.
10] as phases. They are named Procurement, Installation,
Operation, and Transition. while Norris and Both's
"Procurement" and "Transition" are easily identified as
Ferrari's "Procurement" and "Design", respectirely, Ferrari
has nc parallel for Norris and Roth's "Installation". An
argument can be made that this represents a genuine phase
although a relatively short one. Morris and Both then lump
Ferrari's "Improvement" and "Capacity Planning" into the
single "Operations" phase.
Of particular relevance to this thesis is the
application of performance evaluation to the SPLICE context
within a broad definition of network management. Emphasis
is uFon the improvement and capacity planning objectives
stemming from interpretations of those three components of
performance monitoring cited above. The mcnitoring
functions will be assumed here to be complete and available.
It is the interpretation of reduced data from monitoring and
from the results of application of performance tools and
techniques which we will concern ourselves with here.
B. NE PERFORANCE'?
As stated by Abrams (Ref. 15: p. 313]. most research
study has focused upon the individual performance of
components of computer and communications networks such as
computers themselves, disk drives, high speed data channels,software programs, network switches, and so on rather than
functioning networks in toto. Three salient trends have
caused a surge in the need for accurate, even reliably
approximate, methods of estimating the overall performance
of a network. The Auerbach Management Series (Ref. 16: p.
1] mentions the following trends.-
31
L:%
1. the rapidly maturing network technologies,
2. the demands that upper level management and the usersare placing upon information systems management toachieve some means of evaluating anad predictingnetwork performance, and
3. the recognition that there As an important linkbetween user productivity and system performance.There should be no obstacle to building anunderstandina. of network performance based uponrevious stu ies of discrete components. In fact
this move frcm a micro to a more dynamic anasynergistic macro level can be undertaken with al1ttle less apprehensica since modification to ordirect use of tools and methods used in componentstudies may hold promise for network use.
Another reason for the desire to assess performance ofsystems is cost. Even in nonprofit or government situations
where costs may be perceived as secondary to mission, that
concern of management seeking the best cost-performance
ratio possible is still present. Any information systems
manager, even if not concerned in the near term withpossible replacement of equipment,
will nevertheless, seek to get as much benefit as possible
out of currently installed hardware and software. In the
context of SPLICE, one of the main purposes of measurement
is to aid in the evaluation of service provided to the
terminal user. Here the link between system performance and
user productivity becomes evident.
C. VEA! SHOULD BE KAlSURID?
Before any system's performance zan be correctly
evaluated, there must be some agreement upon what entity we
are attempting to take measurements upon and what aspects of
the entity are necessary to measure and interpret. In the
absence of agreement about the specific measures to make, at
least we need some rational approach to justify what we
measure or to explain deviation from any accepted set of
standards. In computer performance, such things as paging
time for batch mode and response time for online mode,
percent of cpu utilization, component utilization,
availability and reliability are of interest. Some or noneof these may be pertinent to a particular network. There is
currently no standardized set of performance metrics for
networks. For that matter, there are no universal standards
for computer performance standards either. Ferrari (Ref. 9:
pp. 11-33] lists and describes some more commonly accepted
ones.
Computer or network performance personnel attempting
performance comparisons between LAN architectures or seeking
to develop a pecformance evaluation program are often
frustrated and certainly hampered by lack of standardized
metrics. Assuming that standardized metrics are necessary,
there are at least three problems which emerge immediately
according to Amer and Goel (Ref. 17: pp. 195-196]. These
are the following:
1. Performance metrics are not always defined in aprecise unambiguous way. In tact they havegenerally been iuconsistently de ined, thuspreventing users from specifying their requirementsprecisely and unambiguously.
2. There is often no distinction between user-orientedand network -oriented paramenters.
3. while it is acknowledged that song parameters willhave meaning only for certain technologies,topologies, or protocols, every effort should be madeto make performance metrics as independent of suchassociations as possible. Without such independentlydefined metrics efforts to correlate studiesperfored on LAN'S or to compare tae performance otdifferent LAN topologies will continue to bedifficult.
Fcur metric attributes allegedly desirable are claimedby Amer and Goel to apply to topology independent metrics;
however, the simplicity of these attributes does not prevent
them frcm applying to particular topologies and protocolssuch as by rollcall or CSMA networks. The four attributes
these two authors describe (Ref. 17: p. 196] are as follows:
1. .se Q.jji io_ -- metrics should describeperformance characteristics relevant to the networkneeds of users without measuring user perfcrmance.
33
SC
*' User orientation refers to the metric which describesperformance of service to the end user while usereffect describes the effect of user interaction witha specific network.
2. simplicity --in order for users to precisely anduWanDigulosly define their performance requirementsthey pust be able to clearly understand andcommunicate definitions of metrics.
3. Minimal. overad --metrics should be measureablevitnout imposing an excessive amount of overhead onthe system. For this reason, bit-level metrics maybe impractical, especially in a LAN environment, andof lit tle benefit to a user.
4. Comprehgnsive -metrics should encompass all aspects7o performance significant to data communicationsusers.
As previously alluded to, even when a standardized set
of metrics has been accepted there will be other measurable
aspects particular only to one topology, for instance, which
users or management will desire to quantify and study.
Therefore, the four attributes above must be balanced by two
additional factors mentioned by Ferrari (Ref. 9: pp. 9-10]
as follows: (1) The projected type of information required
by management may dictate which performance measurement
parameters are necessary. This may be required in spite of
the best intentions to standardize metrics. (2) The type of
network technology being monitored may bias or otherwise
restirct accurate performance metrics or may even make it
useless to gather data on one metric for a particular LAN
technology which is vital to another.
A few pertinent examples serve to illustrate these two
factors. An interoffice automation and broad service
spectrum LAN in a major corporation might be valued for its
availability and reliability from a user standpoint, wile
an interstate bank supporting hundreds of automatic teiler
machines (ATM's) in LAN's may be more concerned with
customers. The management of SPLICE LAN's may be much more
concerned with interactive terminal productivity and require
that throughput and minimum network delay for the user be
34
the primary parameters of concern. Transfer rate is another
metric which might be of concern for file transfer and batch
mode operations in a conmunications net.
More on specific network metrics and SPLICE network
evaluation will be covered in Chapters IV and V,
respectively. For now the subject of network performance
metrics has only been introduced.
Published articles in recent years have referred to
loosely defined parameters of indices coming into some
general acceptance as worthy of measuring. The ultimate
decision will, of course, reside with the organization base
upon its perceived needs. Whatever the position vith regard
to any universally accepted standard, the important issue is
that an organization adopt some standards as a basis for
trend analysis and to relieve confusion. As one mightguess, new technologies coming into the network arena andthe merging of technologies such as will be seen in theintegrated services data network (ISDN) concept where voice,
digital, azd video data may be transported over a common
medium will complicate the case for metrics and perhaps make
it even a more vital issue.
D. HCI DO WE BEASURE 01 EVALUATE PERFORAINCE?
1. QjL~J." Z u .ce ZIEwIato .T,...s i_ general
Many of the tools and lessons of computer
performance evaluation (CPE) should not be ignored in
attempting to estimate network performance evaluation (NPE).
Ideally, important metrics should calculable from existing
hardware and software data collection
systeus/tools/techniques already available to a particular
site. This may not be practical and special tools may be
necessary, even vendor's. Whether calculations based on
data gathering alone are sufficient for properly assessing
35
• . . ' .
network performance behavior is an issue best debated
elsewhere. For now, as a matter of background we are
concerned vith CPE. Morris and Roth [Ref. 14: p. 2] see CPE
as the application of special tools, techniques, and
analytical methods to improve the efficiency or productivity
of existing or planned computer installations. Where and
how we measure are largely dependent upon which type of
tool is used. There are nine generally recognized CPEtools/techniques which will also be considered for use in
some way for network performance evaluation, either singly
or in combination. Morris and Roth [Ref. 14: p. 6] view CPE
tools as fitting into two categories.
1. measurement or
2. predictive
A brief description of each tol or technique and advantages
and disadvantages can be found in Appendix B.While it may be restated later, the importance of
not relying on any si.igle tool universally cannot beoverstated. Morris and Roth's [Ref. 14: p. 10] life cycle
phases for systems and the tcols appropriate for tasks in
4 each Fhase bear this out. So cue tool is a panacea, nor can
any tcol be applied at random to every situation. The tools
employed must fit the case. Some suggestions for which
tools might be appropriate for SPLICE appear in Chapter IV.
The reader should realize that in heterogeneousLAN's such as SPLICE where there are many diverse components
observing the definition of a local network and its three
classes: (1) local area network (LAN), (2) high speedlocal network, and (3) computerized branch exchange (CBX).
Refer to Appendix A in order to discern differences in the
three. Each has different technology, physical design, use,
advantages/disadvantages, and performance behavior. The
emphasis here, of ccurse, is upon packet switched LANOsII employing bus architectures since SPLICE LAN's have bus-type
topolcgy. SPLICE LAN's in fact have both terminal-to-
processor buses and processor-to-processor buses-
A key point is that LAN's are gomug_ t gns networks to
which computers, terminals, and other data terminal
equipment (DTE) devices are connected in order to satisfy
some functional needs at a desired level of performance.
The discriminating point in any local network is that thenetwork is a ccmmunications network interconnecting various
distributed computing resources. However, both
communications and computing resources generally work
together in fulfilling the functional needs of users. The
concept of translating logical functional needs (or modules)
most cften specified in requirements analysis into a design
in the form of selected LAN characteristics is a borrowed
concept [Ref. 20: p. 3]. Assuming that there are limits to
efficiency of operating procedures, the functional
characteristics which users require (needs) along with the
• "size and nature of the workload imposed determine the user's
choice of LAN characteristics. In turn, this choice of LAN
4. plus the workload nature and size, determine levels of
performance. The interrelationship of functional needs, the
size and nature of workload, and the choice of LAN
characteristics and their determination of levels of2 performance is illustrated in figure 4. 1
Performance evaluation describes to what level of* satisfaction a user's functional needs are fulfilled. For
9.' 41
*1II
ofWor kl oad
Fithe Basic PerformanceFunctional of FunctionsNeeds
LANI i Chara cte ristics
Figure 4. I Elements Determining Levels of Performance.
this reason it is critical that the performance question ofhow well the function must be completed be addressed in
early user requirements analysis and particularly in the
case of networks where there exists multiplicity of
interfaces in hardware and software. Once a particular LAN
is selected, the levels of performance to be achieved for
certain workload demands, such as interactive or high volume
traffic, are fairly predetermined. Therefore, some concept
of this desired level of performance required to satisfy a
functional need must be conceived concurrently with
functional needs. This may sound circular, but it is
actually in keeping with a soundly established principle of
systems design where the outputs (levels of performance of
some functions) are defined and designed before all the
inputs are (the character of functions, the workload nature
and size, the LAN characteristics). As functional needs
change or as workload increases or becomes unpredictable,
the lack of a performance evaluation effort will deny an
organization knowledge of what its network levels of
42
performance are. Rajaraman supports a similar view of
factors affecting performance in LANS. He says:
#$There are three major factors that affect theperformance of the network. They are: (i) the
- - characteristics-of -the-jobs submitted by users,- Iii)operational characteristics of the system configuration,and 4 iii) network interface characteristics." ?Ref. 21:p. . ]
Workload accounts for his first characteristic and LANcharacteristics encompasses the latter two factors.
B. DIFFERENCES IN COMPUTER ID LAN PERFORMANCE
The differences in computer or computer network
performance and local area network performance are not
readily apparent if one views all of these simply assystems. The macro view aggravates the ability to
distinguish since the tools and techniques applied tocomputer performance evaluation can likewise be used to
assess network performance- The differences can be
summarized by thinking about the elements or components
functioning in each system. In single computer performance
situations the elements interacting, such as the CPU, the
input/output channels, the peripheral devices and so on, aregenerally unique. The uniqueness begins to disappear whenthe focus is shifted to a computer network where some
redundancy of functional components appears as clusters ofsimilar components ccmmunicate. Actually, this is not
strictly correct since computer networks primarily supportcommunication among the cpu components alone rather than
communication among different functional components inseparate clusters. This cpu activity is also not restricted
to a local area in all cases. In local area networks we seemore specialized groupings of resources (groups of cpu's,
groups of terminals, groupings of communications subnet
(3
devices, etc.) redundantly spread over the network. Here
the specializations observed in the components of a single
computer are replicated in a local area network. we see in
LAN's the attributes of a high-speed single computer, but
distribute.d with both specialization and redundancy
occurring.
A final analogy might help. If one considers a computer
as representing a single-celled organism with various
functioning components working to sustain the cell, then a
computer network might be viewed as a simple colony of
multiple similar single-celled organisms functioning
together in a symbiotic relationship where some do "batch"
jobs some do "data-base" and so on. The local area network
analogy is described by a small multi-celled organism where
the cells are very specialized and they must ccmmunicate
through many interfaces to sustain the organism. In
addition, consider that SPLICE LAN's do contain a local
computer network within them. It is part of the local area
network as defined previously.
The impact of this for performance in local areanetworks is that there are complex interfaces, an often
higher volume of activity generated by components of the
same functional type, a greater dependence on
communications, and a more prevalent occurrence of the human
element. These observations support the conclusion that
while some performance parameters and behaviors may be
common to computers, computer networks, and local area
networks, there are behaviors and concerns unique to the
LAN's as well. The commonness supports the earlier
assertion that CPE tools apply while the uniqueness implies
these tools or perhaps others should be applied in other
aspects of the entire network. The uniqueness inperformance behavior is further narrowed when one chooses a
specific LAN to carry out.desired functions.
44
,,-.[,-.
C. LAN CHAACTERISTICS HITCH DETERNKINE PERFORRANCE BOUNDS
-here are general categorical descriptions of LAN's just
as with any system. Beyond procedural and operating
- adjustments which can affect performance, ultimate style and*'' bounds for perfcrsance are established by which choices
within each category are selected for a LAN. One source
. (Ref. 22: p. 16] classifies local network design issues as
either configuration cr protocol ones and visualizes network
performance as highly dependent upon each of four basic
elements, including transmission medium, a control
mechanism, the interfaces, the protocols, and the autualiateraction of these.
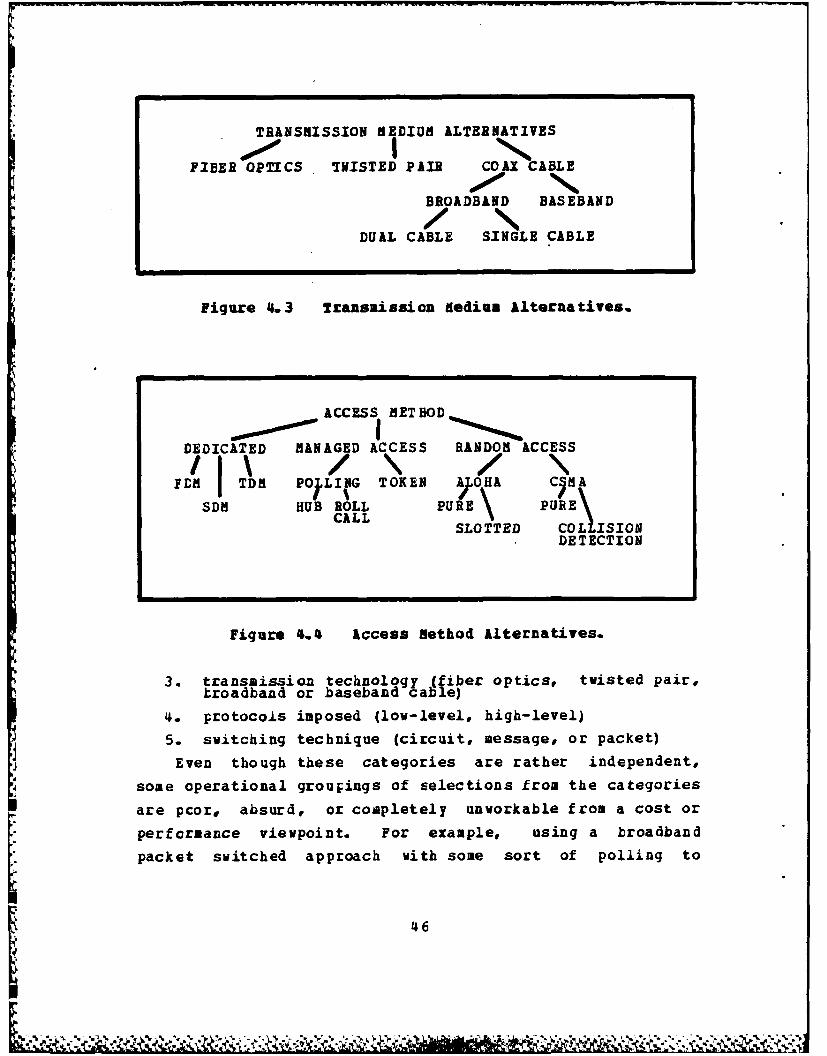
Scue choices existing among LAN technologies are
illustrated in Figures 4.2, 4.3, and 4.4
LIN ARCHITECTURES
BUS TREE RING HYBRID
CENTRAL DISTRIBUTEDCONTROL CONTROL
Figure 4.2 Architecture Alternatives.
I.-
. Terms relevant to this study are defined in Appendix A. Thechoices exist in the following categories:
.. 1. topology, or architecture (bus, tree, ring, hybrid)
2. access method (dedicated according to time orfrequency separation, pclling, or random access)
5. switching technique (circuit, message, or packet)
Even though these categories are rather independent,
some operational groupings of selections from the categories
are pcor, absurd, or conpletely unworkable from a cost or
performance viewpoint. For example, using a broadband
packet switched approach with some sort of polling to
46
connect a few relatively low data rate devices together
would hardly be cost justified. Likewise, to transmit video
or integrated digital and analog information over a
twisted-pair, random access network would prove disastrous.
[(ef. 23: pp. 35-36]A specific turnarcund situation existing with LAN's yet
not observed in long-haul networks concerns protocols. Dale
Way states:
"The igportamce of control (protocol) software.fin long-h4u. slower data rate networks) . . . is minorin determining the throughput performance of thenetwork. The data rate of the link is most often thelimiting factor in actual throughput of data from userto computer, or vice versa. The 9600 bps or even 56000bps rates are slow in comparison to computer rates usedin software protocol execution ....... now thesituation (with LAN's) . . . is reversed. Thelink is so fast the protoqols cannot keep up. Thismakes the healtn and efficiency of protocol softwarecritical to LAN systems." (Ref. 24: p. 79]
One must realize that perfcrmance alone is not the sole
motive or consideration in the design of many experimental
networks. Such is the case for the Cambridge ring, for
instance, which had much more communication bandwidth than
initially required, and usage of ring slots was not" -Poptimized. more data bit space was available in each slot
than was used. (Ref. 25" p. 111]
The selection of a LAN can extend beyond issues of
performance or involve tradeoffs in performance as Kee
states:
"Other networking techniques show similar features, witha tradeoff having been made at some stage in theirdevelopment between cost, ease of implementation, datatransmission rate, error rate and intended method of use. .. criteria used to evaluate performancecoala well be different . the network maybe needed to serve a very large population of terminalsand personal work stations where raw data transfer speedis unimportant but where a low network delay and theability to support a a number of userssimultaneously are paramount.$$ [Ref. 25: p. 111]
-~ '47
sea
Bailey states:
its (a LIM's) construction can be optimized tolower costs .... However, not all of the system'sperformance measurements can be optimizedsimultaneously." [Ref. 26: pp. 207-2081
Watson, of Lawrence Livermore Labs, points out that in
additicn to pure LAN characteristics that:
the network traffic properties of message size,rate, and distribution have a considerable effect onnet ork performance and that performance is also verydep ndent on the mutual interaction of the traffic theconfiguration, and the protocols." [Ref. 27: p. 51]
So, we can see that just as the model introduced earlier
depicts, the actual performance from a network involves LAN
characteristics and more, such as workloads.
D. CXRKLOAD CHARACTERIZATION IFFECTS PERFORINICE BOUNDS
Although trying tc characterize and test representative
workloads is more appropriately a step conducted in capacity
planning, some mention of workload is necessary as it
relates to network performance. Specifying workload on a
system helps determine which performance parameters should
be measured and what trends should be watched.
Workload is simply the total mix of jobs in type,
volume, and timeframe imposed upon a system. No doubt if
the wcrkload imposed upon a system changes its nature or if
the vclume of work dramatically increases in a short time
period, there will be repercussions for performance.
Contention for resources will obviously degrade overall
ability of the LAN to perform its intended functions.
Stallings describes the ,ideal channel utilization" in a
LAN. This description has channel utilization increasing to
accommodate any offeied Icad equal to the full system
48
capacity and then remaining at 100% utilization regardless
of further increases in offered load. He notes that any
overhead or inefficiency will cause the system to fall short
of the ideal. The actual offered load is not the same as
the Anput load of device-generated data put into the
network. Actual cffered load can include nct only
transmissions, but acknowledgements and re transmissions
resulting from errors or collisions. [Ref. 13: p. 235]Wcrkload is, along with LAN technical characteristics, a
contributing factor tc the performance of any LAN. Handling
the workload and distributing it among many users is only
one of several benefits derived from LAN's.
E. ADVANTAGES AND DISADVANTAGES OF LAN'S
A brief word on the advantages and disadvantages of
LAN's is appropriate in discussing performance because if it
is the advantages we are attempting to capitalize upon, then
those are the very areas which management should be
interested in for performance evaluation. Of the five
computer-communtication problems [Ref. 28: p. 2] commonly
recognized, the first three of these are solvable through
LAN's. These five commonly observed problems are asfollows:
1. "The central-_ o proute L ,' p..lem occurs where,.*. severaT mainframes anad peripheral devices are
organized into a coherent set of accessible sharedresources; (While this does not meet the definitionof a LAN previously referred to here and by otherauthors, we have to realize there are differences ofcpinion. it is possible such an arrangement couldmeet the previous LAN definition if resource sharingoccurred and the connectivity was among more thansimply cpu to cpu.)
2. the _al llite r ojptic 1Iob~l where there isan in erconnecton o wide. variety. ofmincomputer-base . equipment and associatedperipherals to a centra- computing facility.
3. The terin. * fqls ." le where there isinterconnecticn or an intelligent or unintelligentterma.nal to a satellite computer or to a mainframefacility.
49
V
4. The standard computer-network Iroblem ofinterconnecting.I the computing equipment of oneorganizaton. throug some single transparentapfoication-nrepenent computer network, such as adeuicated or private packet switching network, tosome other set of computing resources.
* 5. The inter etywk-commug tos Problem linkstogether sev ra]7pand-nt cmputer networks viagateway computers so messages can be exchanged amongnetwor s and often through several intermediatenetworks.
In addition to the basic advantages of resource sharing
and resource variety, distance independence, and desire to
communicate messages, there are several advantages authors
attribute specifically to LAN's. These are the following:
1. System evolution is afforded with impact due toincremental changes under control [Ref. 33: p. 4].
2. Reliability/Availability/Survivability are 4@nhancedwith multiple interconnected systems, dispersedfunctions, and backup capability in the form ofelement redundancy (Bet. 13: p. 4].
3. With some planning customers do not have to be lockedinto a single vendor source. [Ref. 13: p. 4].
4. There is improved response/performance in areas of anorganization where tne service was previousl notavaijable or slower than desired [Ref. 13: p. 4 ].
5. A single terminal can allow a user to tap intomultiple systems. [Ref. 13: p. 4].
6. Equipment can be flexibly located. [Ref. 13: p. 4].
7. Integration of services such as data processing andoffice automation can occur [Ref. 13: p. 4].
8. Fewer data transmission errors than long-haulnetworks [Ref. 29: p. 52].
The disadvantages are noted by Stallings to exist also
[Ref. 1.3: p. 4] and can largely be attributed to poor
planning and subsequent loss of control. Some disadvantages
are tLese:
1. Interoperability of components is not guaranteed, andcompatibility factors such as half or full duplexinq,asynchronous or synchronous transmissions, dataspeed, soft ware/operating system/protocol usage,ASCII or EBSIDIC data coding, etc. must beconsidered.
2. Integrity. and security of data must be evaluatedwhere distributed data bases are employed.
3. Diffiqulty of manalement in enforcing standards or- policies and overall control of data resources is a
problem [Ref. 13: p. 4].
With the knowledge that LAN performance can be expectedto differ somewhat from that of computers or computernetworks, that the selection of a particular LAN capability
interacts with workload demands to determine performance,
and that advantages of LAN's provide some insight into their
performance, we can turn to a discussion of specific networkperformance parameters.
F. LAN PERFORNANCE PARAMETERS (FOR BUS TOPOLOGIES)
1. General Comments
with the preceding general discussions on
standardized performance metrics in mind, a look at details
of suggested LAN performance parameters is very apFropriate.
Traditional performance evaluation has focused upon
around message flow in communications links and the overall
impact upon traffic in the network [Ref. 21: p. 34].
Rajamaran states the following issues with regard to
performance problems in LAN's:
"Two major issues are important here: . i) thecharacteristics of the service to users and Iii) theneeds of the network management . . . (or networkperformance evaluation (NPEY) . . . team. ecause theusers of local networks are mainly within theorganization there is a need to satisfy their demandsuickly . . . the network management team . . . (and anPE team) . . is better able to monitor and take
faster action and exercise Letter control over networkrescurces." [Ref. 21: p. 34]
This dual issue division of network performance coincideswith other authors' views:
"°In a packet switched network environment, networkperformance parameters may be divided into user-orientedand network-criented performance parameters." [Ref. 30:p. 508]
51
h%
Stallings as well cites a user's versus a network analyst's
view on how information about a network workload may be
used:
"The user may want to know the throughput and delaycha~acteristics as a function of . . . the input load.Or if the network is the focus, the analyst may want toknow what the offered load is given the input load."[Ref. 13: p. 235]
While it is inviting to think that all LAN
performance parameters could be categorized into various
identifiable groupings under two major divisions,
"user-oriented" (external metrics) and "network
management-oriented" (internal metrics), the many diverse
categories researchers have attempted and the lack of
standard nomenclature defies any such crisp indexing. The
best that can be achieved is to relate some sample logical
categories of performance parameters for LAN's and describe
the currently defined parameters which particular
researchers have indicated belong in each category. The
variety in what experts feel are important network
performance parameters points to the need for standards as
previcusly argued. It is encouraging that most authors have
tried to observe the user versus network performance views.
A review of performance parameters, indices, and
measurements will be made so that representative ones for
SPLICE LAN's can be chosen and discussed subsequently in a
separate treatment. Again, the reader is referred to the
glossary in Appendix A. Some terms may be described in the
text where essential to the discussion.
2. Detailed. F-er _ Ba-nre _Eaameters
Pajaraman's view (Ref. 21] is chosen first because
it may provide the reader a framework from which to think
about performance terms and their applicability. This
author supports the dual user and network views and further
subdivides these into measurement parameters which can be
arrived at through a study of the job flow and the operation
of the network. These parameters are then used in various
combinations to define four types of performance measures.
This author asserts that parameters should provide
information about limitations of the networks, should
identify bottlenecks, and should be available from data
- gathered or through calculations upon these data. The majorfactors affecting network performance are used to categorize
the measured parameters. There are three categories, the
first of which relates to users and the workload and the
other two relate to network characteristics and management
concerns.
The categories are as follows:
1. Parameters related to job characteristics (user andworkload oriented and determined):
a) Type of job (whether batch, interactive,multi-user, express, graphics, ordevice- specific).
b) Memory requirements of the job.
c) CPU time requirements of the job.
d) I/O time requirements of the job.
e) Job priority.
2. Parameters related to operational characteristics(network-oriented and can usually be set by. theoperating system or by manual operator intervention):
a) Parameters for job queue management (affectsposition of job and progress in queues).
b) Anticipated field length (identifies amount ofmemory required by the job before it can beswapped in and is usually different from usermemory requirements, but not exceeding it).
c) Total number of user jobs in the system.d) maximum field length for main and extended memory.
(Specified by user at job initiation and its valueaffects the job's initiation and further progressin the network.)
3. Parameters related to network interiace(network-oriented and dependent upon network load,machine availability, and interface traffic):
53
- . -- . *. . * . , .
a) Number of users (batch and interactive).
b) Network and mainframe status.
c) File transfer activity in the network..
d) Network resource availability versus requirements.
Four types of performance specified by Rajaraman
[Ref. 21: p. 35] areas each having identifiable indices of
performance are then derived from the above measured
parameters:
1. System Performance (includes average productive time,average throughput time, job throughput efficiency,average job delay time, and backlog ratio).
2. System Compcnent Utilization Measures (cpuu tilization, HYPERcharnel utilization, mass storageutilization).
3. System Interface. Efficiency measures (file transferelficiency and file transfer completion measure).
4. System load (percent of job load by class, abortratio, and abort time ratio).
Rajaraman [Ref. 21: p. 35] then calculated for each
of four performance processors in his system the indices for
each of the four performance areas. A composite measure for
the network is derived from these figures.
This composite value is time sensitive itself sinceit reveals a performance measurement at a given time with a
given wcrkload and system configuration. Trends should be
developed and documented to adequately characterize"typical" performance.
This approach is admirable in its attemft to provide
structure, detail, a multifaceted view of network
performance, and a composite value; however, realize there
are details here pertinent only to some similar networks and
some possible measures may have been omitted. For instance,
there is an emphasis on processor performance here.
HYPERchannel is particular to only some networks and
interfacing measures are somewhat slighted. Protocol,terminal, and communications software accesses are not
addressed.
54
m 4k4g
Another set of authors previously cited in
discussing desirable traits of metrics in general offer an
exhaustive standardized attempt to establish
topology-independent and topology-dependent metrics which
facilitate a comparison between ring and bus networks.
They make no distinction between user and network
parameters. Their work attempted to relate performance
parameters to finite state models of bus and ring networks.
That treatment is too extensive for purposes here. Selected
definitions are included in the glossary of Appendix A. The
discussion will be confined to three categorizations of
performance parameters for bus topologies. [Ref. 17:
pp. 199-207]Under the heading of topology-independent parameters
Amer and Goel [Ref. 17: p. 198] identify four categories of
performance parameters as follows:
1. Time-based metrics, measured in convenient time unitincrements.
2. Rate-based metrics provide relatire measures.
3. Ratio-based metrics involve units of length relatedto time.
4. Count-base metrics are simply multiplicities orfrequencies of ccurrences.
These performance parameter categories are found listed in
the article along with the topology-dependent metrics. This
exhaustive list best represents the metrics which have been
defined, and many of them are referred to by other authors
as well.
Additional detailed metrics suggested by another set
of authors and apparently not duplicated above are found in
[Ref. 30: p. 510). These metrics are not further defined
because the authors did not bother to define them and the
names suggest the meaning. The parameters mentioned by
these authors similar to previously defined parameters
include number of data packets sent, number of duplicated
data packets, and average packet size.
55
In reviewing most of the metrics discussed above, a
commop trait is that most of them are internalperformance-related, microscopic in scope, and perhaps not
revealing much about service levels. Many of them are
possitly hardware configuration dependent. Still they maybe of use to network managers who require this detail.
Reducing a complex set of measurements into a figure of
merit approach might be one way to convert detailed network
metrics into service user metrics [Ref. 31: pp. 9140, 942].
G. mETIORK SYSTEM PEBFORHANCI PARAETZERS
With such detailed but not totally standardized metricsavailable for LAN performance evaluation and management
decision-making, one could easily become bewildered unless
quite familiar with computer, network, and system
performance evaluation in general and unless looking for one
or mcre cf the detailed terms above. The approach can bemore manageable and still prcductive if one concentrates on
descriptive measures primarily related to user service needsand to the telecommunications nature of all LAN's. The
National Bureau of Standards has done some leading work in
attempting to standardize the rating of performance and
defining of terminology. Dana Grubb and Ira Cotton of NBS
emphasize the following points relevant to packet-switched
networks:
o. . . the user needs a set of performance criteria thatenccmpasses both carrier facilities and datacommunications hardware and treats them as a sin lesystem . . . The nine parameters . . . (criteria forassessing how well a system handles informationinterchange from a user's viewpoint) . . a do notrepresent all possible performance criteria, but theyare the most essential factors." [Ref. 32: . 41]
Grubb and Cotton stress the user's interest in onlyexternal manifestations of network performance and that the
56
.4
nine factors are not all independent. Any attempt to
improve one factor may cause degradation in others.
Several representative performance metrics which apply
especially to network users are defined in Appendix A.These. metrics include transfer rate, availability,reliability, accuracy, channel establishment time, network
delay or response time, line turnaround delay, and
transparency. Availability has often been referred to as
the single most significant parameter a user desires Marie
Keifer writing for TELECOMMUNICATIONS magazine says this:
o o multipurpose networks have a better record fordowntime. The downtime record actually improves withincreases in the size of the networ becausetransmissions can continue temporarily on alternativelines until malfunctioning lines are restored ... "(Ref. 34: p. 32]
This assumes, of course, that you have some redundancy of
critical lines or components since all networks are not
constructed with that in mind. Reliability is as critical
for users as availability. Grubb and Cotton [Ref. 35: p.
6-24] describe reliability as a performance metric which
describes an aspect of network performance after it has
accepted a message from a source for delivery. With regard
to response time, Sussenguth cites work done by A. J.
Thadhan:
the productivity of interactive terminal userscan be improved by a factor of almost two when theresponse time is reduced from two or three seconds toless than one-half second." [Ref. 36: p. 886]
The line turnaround delay in half-duplex lines is lessened
somewhat by transmitting in larger blocks of data, according
to Grubb and Cotton [Ref. 35: p. 6-26]. Transparency is
listed not so much as a feasible metric as it is an item of
great importance to users. Further detail will not be
57
pursued here. The important thing to note is that studies
of these parameters, some of which are pertinent to SPLICE,
have already made and could be useful in assessing future
performance evaluation of SPLICE networks.
H. 01HEE NETWORK PERPORlANCE PARARIETERS
To be sure there are other versions of the performance
metric approaches already described. One very interesting
idea concerns a universal flow and capacity index as an
overall measure of network "efficiency". Of all the
research work investigated, this performance measure was the
single one which reflected the most comprehensive view of
netwcrk performance without becoming overcome by details.
It addresses the network management orientation more than a
user's perspective. 7he author of this idea summarized:
"There is no predetermined optimal value of Index I fora network. The purpose of calculating I is to provide abenchmark fr ad usting the network so that a subsequentcalculation of the index would reflect less interchannelvariation. Thus the measurement is a relative onebeing most useful when used to compare differentnetworks or new configurations of the same network. Forinstance, if reconfiguring a network's flow and capacityallccation leads to a lower value of 1, then the networkis more efficient . . . index I yields a simplified viewof a network by tying the multiplicity .of its componentsinto a unitary measure that indicates how effic entlythese components constitute the whole." [Ref. 31: p.173]
The final sentence of the above quotation is germane for
* LAN managers and for future researchers. The reader isencouraged to consult the referenced article for details.
A final source which treats LAN and HSLN performance
topics rather thoroughly is Stallings. Regardless of the
methods chosen to monitor and measure performance or the
metrics chosen to measure, there are three LAN/HSLN regions
of operation of which management must be constantly aware.
These areas outlined by Stallings (Ref. 13: p. 244] are asfollows:
58
1. A reg.on of low delay through the network where thecapacity is more than adequate to handle the loadoff ered.
2. A region of high delay, where the network becomes abottleneck. In this region, relatively more time isspent controlling access to the network and less inactual data transmissicn compared to the low-delayregion.
3. A region of unbounded delay, where the offered loadexceeds the total capacity of the system.
Clearly the third region, saturation, is disastrous and
must be prevented. The seccnd region should be avoided
through careful planning. And some' version cf the first
region should be a clearly defined strategic goalachieveable through sustained performance evaluation of
predefined and standardized network metrics.
I. SELECTION OF PERFORMANCE PARAMETERS IN SPLICE LANI'S
If the avowed system performance requirements of on-line
response times and batch processing throughput are taken as
the gcals (Ref. 4: p. 70], then much of the selection ofperformance parameters in SPLICE is categorically defined.
Such measurements emphasize the importance of communications
aspects and user aspects of SPLICE workloads. This does not
neglect the importance of details of network measurement
since ttese can easily affect the communications and user
qualities of any network. With this in mind the following
suggestions are offered for SPLICE performance metric
selection:
1. Balance selection of user-oriented parameters withnetwork-oriented ones.
2. Because of the inherent uniqueness of each SPLICE LANrealize that some performance metrics must reflectthe local configuration. LAN performance bounds mustte apparent in the choice of metrics.
3. Some parameters may depend upon terminal locationwithin the LAN context or upon SPLICE node locationand priority within the internetworked SPLICE system.
4. Assuming availability and reliability are reqarded asvaluable at some defined levels, the indications arefor SPLICE that those measurements of time and rateare probably most apprcpriate and in line with the
-J
response time and throughput goals of interactive andbatch processing. Ra io- and count-based metricswhile helpful or interesting in a capacity planningsense probably do less for the user and more forthose who want to ccmpare systems or parts ofsystems.
5. In the area of interconneqtion of SPLIC? LkN's withregard to performance metrics, the decision must bemade based upon whether more eaphasis is desired for
acv&cess to other users and network resourcestor n--tu--eise a_ available when LAN and MLHICo.paEl n ae acnleieu o-1t rr~cenhancing i exnetorking of. LAN's via a LHN. (Thiswill be adress.ed again in a later chapter oninternetworking SPLICE.) [Ref. 38: pp. 4-10]
6. Concentration, at least initially, on sinply definedand consistently measured netrics will likely paylarger dividends than trying to obtain a measurementfor everything or in trying to optimize allperformance measurements taken.
7. Regretably in SPLICE's case, the two goals cited aaynoz have the overall network efficiency in mind asuniversal flow and capacity index mentioned might.The goals in SPLICE appear to be more suboptiniza ionones which may necessitate causing other performanceparameters to te neglected.
60
v. EVLUATION &.1. ZNTERPRZZATION 2F SLIC EiZigi!PE~RORK NoC INFR .z gN
I"1 PAPAGLZ AMR COIPIGURATION PLA ig
A. OIU1VIEI
The large investment and operating costs of data
communications have caused a heavy emphasis to be placed on
the advanced planning function. Assuming that we can
adequately gather whatever performance data are desired,
there still remains two essential steps to ensure optimum
use of that data. These are data reduction, or analysis of
the data to appropriately categorize it, and then the
interpretation of this analysis in a strategic sense so that
decisions affecting the modifications and evolution of the
network can be made in concert with organizational needs,
policies, and even constraints (budgets, binding contracts,
specific mandates, etc.). As previously noted, the first
two steps, performance measurement and performance
monitoring belong to the Network Control Center (NCC)
activity as it carries out the operations portion of network
management. The interpretation of this analyzed data.
requires other portions of the network management
responsibility. Those network management responsibilities
of planning and configuration management will be
concentrated upon here and will finally bring us closer to a
* position of being able to understand and to make
recommendations fox strategic network performance
evaluation. Assuming knowledge of the workload can be
obtained or forecast, we then have some basis from waich to
structure performance evaluation activity. St-ndying the
research available on subsystems within SPLICE LAN's such as
61
-V
the 7ANDEE FEP's, the host mainframes, HYPERchannel,
protocols of vendors and of DCA, and terminal
characteristics is one way to orient thinking and gain
experience in directing performance-related questions. The
results of these studies can -assist network performance
evaluators and capacity planners in interpreting monitored
and analyzed data results at SPLICE facilities. Hereafter,
" strategic performance evaluation management will be referred
to as capacity planning. Terplan views CP as one of four
parts of overall "network performance management" [Ref. 18:
P. 59], while Cortada views system performance management as
a separate preceding activity necessary to provide inputs
for capacity planning [Ref. 39: p. 56]. The view chosen
here parallels Cortada and will be that "evaluation" is the
key wcrd differentiating capacity planning from performance
management. Dr. Allen of IBM's Information Systems
management Institute cited Richard Armstrong of IBM as
saying that performance management is a process of
configuring the system to provide satisfactory performance
for current workloads and is cften called "tuning". While
.. this may not be a day-to-day process, it is usually
performed on some discrete frequency basis, and on lelected
components while capacity planning is a long-term ongoing
process of basing decisions to alter network resources upon
performance trends interpreted over time. Lynn Hopewell
points out the following:
*lonq- range planning only makes sense from a totalsystems standpoint . . . long-range planning mustconsider so many broad areas of uncertainty that it canonly be effectively carried out on an overall systemsbasis." [Ref. 40: pp. 562, 564]
Hopevell's discussion of three types of planming in
telecommunications (short, medium, and long-range) imply
that the size, complexity, and interaction of so many
F ,62
*. . . . . . .
subsystems leaves long-range capacity planning as the only
viable alternative.
B. CAPACITY AND CAPICITY PLANNING (CP) IN GENERAL
James I. Cortada describes "system" capacity as a
whole and indicates that it involves measuring user service
requirements, availability, wrkload, and resource ability
to handle demands. Dr. Arnold 0. Allen quotes N. C. Vince
who says:
"Capacity planning is the means whereby one can achievemeaningful forward estimates of the resources neededboth hardware and software relative to the deman&expected to be imposed by tAe workload." [Ref. 4l: p.
Cortada refers to capacity planning in this way:
as a methcdology or as various techniques thatencompass a set of actions a'l geared tc definingworkload characterizations, :recasting workloadscurrent and future performance, and availatility olrescurces." (Ref. 39: p. 55]
Terplan applies capacity planning to networks as follows:
"Network capacity planning is the process of determiningthe optimal network required to meet future serviceneeds, It is based on data on network performancetraffic flow resource utilization, and estimate&growth." (Ref. 18: p. 59]
Note that in this retwork version of CP, that network
performance is a condition preceding the process of CP and
upon which CP heavily depends. It is necessary to realize,
too, that no system performs at 100% capacity and that
capacity of the computer(s) is only a part of the system
. benefits. Among the direct ones is that it usually fits in
with the desire to reduce costs and optimize the network
assets. Its overriding objective is to raise utilization of
existing resources across the entire system and to determine
the need for more. Frequently, 10% of the applications
occupy 50 of the resources. If desired this is
permissible, but as applications grow in size and number,
provision for the smaller applications must be made as well.
Capacity planning also prevents panic planning issued in
response to crises and resulting in often disastrous
decision-making. It primarily assists management in
understanding and dealing with change often imposed by a
combination of controlable and uncontrolable events. In
that light it provides management a means of explaining
change to higher authorities in a way which is perceived as
more reassuringly under control. [Ref. 39: p. 62]
Byproducts include that CP merges with
organizational strategic plans, increases the stability of
the system and the organization, and provides the workforce
with an element of leadership. This can cast the CP and
perhaps the entire DP staff in a more-creditable light.
Effective CP will accumulate a data base of situations and
solutions which can prove of immense aid in helping to reach
future semi-structured situations. Lastly, during tae
operational phase of the life cycle, CP serves to help delay
the day when an entire system or subsystem must be replaced,
and in the transition phase it gives advance warning of when
saturation will be reached. [ef. 14: p. 14-15]
64J"I 42
3. Th caact Planning Process
a. General Description
Capacity planning (CP) is an iterative, ongoing
process if it is to be successful. Terplan [Ref. 18: p. 61]
describes capacity planning as consisting of the following
five steps:
1. Workload characterization
2. Service-level assessment
3. Workload projection
4. Evaluating network requirements
5. Future network assessment
A network capacity planning methodology
presented in Figure Terplan is as depicted by Terplan
[Ref. 18: p. 79].
Capacity planning pertains to all portions of
the network, including cpue's, data bases, protocols,
interfaces, data buses, frontend processors, terminals,
operating or control programs, and any other network
resource. Good CP involves understanding even non-network
resources, such as software or hardware monitors and
accounting data packages which require some system overhead
to operate, impact upon performance and, therefore, capacity
planning.
Seldom does network performance change rapidly;
however, management often attempts to implement actions
posed by decisions without consulting users and, in some
drastic cases [Ref. 39,42: pp. 53, 50], without a plan. CPrequires a committment by top management to support it.
Participants in CP studies can include a variety of members
as well as seasoned experienced staff. DP technical staff,
operations personnel, user community representatives
application development staffs, and data processing
management all have a place in CP.
65
Id L7
f
Gather Data
" rocessing Data base ransmisso
Service Level Assessments
Develop Workload Projections by Location
Evaluate Networking Requirements
Future Networking Requirements
Total Future Processing/Transmission Demand
Jxistinq ConfiguratioReport tohe euate? Manage ment
Capacity Planning Methodology
Develop Network DesignTopology Components Routing
= Service Meel Predictions
-I. cost Predictions
Validation
Figure 5.1 Network Capacity Planning methodology.
66
mi o° .. Q °w~ • ~ m. °- .. .• •o- -.- -,. .. - . . . , .w o . . .,°. o ol, m • .o o o. . ". . ° 4
The types of questions addressed in CP studies
can involve a limitless range of concerns. Examples are
these:
,. o1. How much excess capacity should be maintained forabsorbing surge capacity or unexpected applications?
2. What will be the impact on response time by adding acertain number of additional terminals?
3. What will be the impact on system performance ofadding/modifying an application?
4. To what degree should components be fault tolerant or.. + redundancy en gineered?
5. How will performance degrade if a specific data* g-athering or event measuring package is applied to
the system?
6. Is performance different if applying the t package atonly certain points in the network or a a certainfrequency of application?
7. Will adding additional eguipipent degrade the DPdepartment's capability to service existing users?
8. What are the effects of a new protocol?
9. When should cpu capacity be expanded?
10. Will a configuration change be necessary toaccommodate a new technology without degradingservice?
11. When will additional peripherals he needed?4 -. Additional memory?
The manager engaged in CP generally has one of
these choices: (1) take no action to see if his system
absorbs the new load, (2) alter some aspect of the hardware
configuration, (3) alter some aspect of software, or (4)
alter/institute operating procedures. Before selecting an
alternative, however, the performance calculation problem
stated as follows by a. P. Buzin must be resolved:
-" . given a description of a system's hardwaresoftware, and workloads determine how the system willoperate. $pecifically &etermine throujhput, responsetimes, utilizations, and so on." (Ref. 3: p. 347]
Although this was written in a computer-only context, its
systems orientation and use of system performance terms
67
,'..o
*.. ~-
already mentioned by Grubb and Cotton seem appropriate for
LAN's. Solving the performance calculation problem involves
discerning which tool or combination of tools is appropriate
for a particular LAN given the constraints of that tool.
Then the tools are applied to predict performance.
Interpretations of the results then lead to CP decisions.
As you can see, the workload is a key factor.
Such of the information the performance evaluation person or
team requires involves external factors which are unknown
unless management provides them. This is a critical point
of managerial support and involvement in CP. These factors
* include ones such as number of employees in the
organization, organization budget, number of new projects
started or applications anticipated, and current and
previcus success in meeting the service requirements
demanded.
b. Workload Characterization and Evolution
As with tools and techniques of measuring
performance, the term "workload" will be borrowed from the
CPE wcrld. workload is simply the mix and frequency of job
or resource demands imposed upcn a system and requiring some
commitment of network resources. Characterizing the
worklcad is the first and a critical step in successful
capacity planning. Most research work in describing
worklcads has been relative tc computer systems and mostly
for existing systems where test generation and sampling of
worklcad has been easier than in systems which are being
developed or are in planning. Although much of SPLICE's
software and hardware is in place with the workload
demonstrated in representative benchmark tests, the system
is nct yet a complete SPLICE network system, and the actual
total local and internetwork load can only be estimated.
Strategic planners will tell you that long-rangE predictions
68
are generally less precise than short-range ones because
information relied upon for long-term decisions is often
less accurate and less precise. Accuracy may deviate up to
a 50% level for a five-year period [Ref. 44: p. 119]. For
this reason the workload today most certainly will not
remain static in most organizations. There is no indication
that SPLICE LAN's will be any different and most supply
demands have yet to shrink.
There are three steps necessary to fully
characterize existing workloads: : (1) understand past
worklcads, (2) display present workload elements versus
resources demanded to get a resulting program/transaction
catalog, and finally (3) correlate business elements (number
of items processed, number of tasks required, number of
files updated, number of users logged on, etc.) to resource
demand (for cpu demand, line time demand, etc.). To
understand past workloads requires an analysis of deadline
requirements (completion time for jobs, sessions, and
transactions), the application cycles (cycle of running
application subsystems such as online and batch in SPLICE)
daily cycles (sequence of jots, transactions, and work
sessicns by shifts and work centers), and service
requirements (availability, accuracy, response time, etc.).
The second step can be accomplished in a variety of ways,
but it is frequency of resource use and other patterns which
are helpful. The third step can serve as a good basis !orpredicting future workloads. Usage of measurement tools
previously mentioned such as hardware, software, and even
network monitors now available along with accounting dataresults, communications software data extraction, and
application monitors such as software optimizers can all be
useful in characterizing workload by resource demand.
[Ref. 18: pp. 61-631
69
*1. - - - - - --- - -__- -'
In contrast, Ferrari characterizes workload by
type description instead of by behavior as Terplan has. The
description seems less useful for evaluative CP and more
.-useful in measurement, prediction, and comparison of
performance studies. He discusses the advantages and
disadvantages of his real, synthetic, and artificial
worklcads. The synthetic workload is divided into natural
and hybrid subsets. The natural synthetic wcrkload is asubset of basic components in the real workload, whereas the
hybrid synthetic workload is a mixture of real and
constructed components. The natural synthetic load is our
familiar benchmark. (Ref. 9: p. 53]
c. Service Level Values
Service level values are constraints in
optimizing a network and are based upon standards,
requirements, and cost restraints. Service level values
percentages or quantities based on service level parameters
such as availability of the entire system response time on
terminals, turnaround time on batch jobs, and accuracy.
Calculation of these can be very subjective, but an exampleof accuracy in terms cf residual error rate (RER) was given
in chapter III. Dr. Allen of IBM says service leveldeterrination is the most difficult part of capacity
planning and is not done well unless general planning is
done well. [Ref. 41: p. 324]
d. Workloads Projection
Workloads projection is also difficult at best.With present workloads, resource demands can be predictedfairly accurately from sensed growth of business elements or
units. However, growth oi future business elements and thusdemand is not as easily predicted for new workloads, and it
becomes more difficult the longer into the future the
70
projection stretches. New workloads can include software
software conversion, improvements through application
tuning, latent applications (designed and programmed but not
yet in production), and new applications. Help from users
is critical in accurately predicting new applications.
Frequency of execution, pattern of the frequency, and future
resource demand expressed in Natural Forecast Uni-ts (NFU's)are all necessary. NFUls are the business elements, such as
number of employees which can be potentially logged on
simultaneously in a given time period. The key is to find a
business-related unit that correlates well with a resource
demand and to find a way to convert NFU's into resource
demand units. An example is conversion of number of
employees logged on (NFU) into cpu or access line usage
(resource demand). Data for NFU's can be obtained from
organization plans, business elements expected in the past,
user interviews, records of numbers of application units for
certain time periods, and consideration of similarities with
resource demands made by other applications. [Ref. 18,44:
pp. 64-65, 123-124]
Workload projection must employ some means of
categorizing work or jobs just as supply installations have
online transactions, batch jobs, and in the future queries
from outside installations. In order to be able to
determine how an application impacts the LAN in terms of
resources usage, we have to classify applications. MoAr
defines a major application as one which uses at least 1% of
the total system's resources. The largest application can
typically consume 20 to 30% cf overall system resources,
other major applications another 15 to 20% with the second
largest using about 10%, five or six applications also
qualifying as major applications, system overhead taking as
much as 20 to 25%, and two remaining categories, minor
71
.o- j
applications and non-application usage, consume the rest.'
[Ref. 44: p. 120]
This discussion of resource utilizationaccording to application might be particularly relevant toNavy Supply Stock Points and Inventory Control Points wherethere are several major applications possibly runningconcurrently. Work in identifying how combinations ofapplications use network resources may 'prove fruitful in
capacity decisions.
Workloads exhibit changes according to Mohr[Ref. 44: pp. 121-122] in their nature beyond just anassociation with particular applications. Workloads displayan aggregate trend behavior generally in one of four ways:
1. BAonotonic incr_!s where workloads grow at a steadyrate. The increases reflect increases in usertopulation or in numbers of transactions. This ishe most co mmonly rojected workload and clearly
applies to the SPLICE LAN situation.
2. brup hanss represent sudden changes ordiscontinuities in workload or resource usaqe levelsalmost always caused by external factors. These arethe 9hanges of wttich to beware. They can be causedby installaticn of additional terminals (resourcedrain), abbreviated procedures allowing users to bemore productive (resource drain or relief) fasterhardware (resource relief), or transition of a majorsystem from test stage to full implementation(resource drain).
3. i ltory chaes are periodic changes in systemsor-kioad to regularly observed variations in the
business environment. There are periods of growthand contracticn of workloads due to seasonaloperational, or other influences which seem to buildand decay. Although no references cite it, this is aprime example of a need for contingency capacity andalso typifies some installations, such as at the endof a fiscal year.
4. Random chan.g~syrepresent daily variability inworkload _auf-b random business processes. Theyalso result in random performance measurements whichreally do not reveal controllable information forplanning.
'These figures offered by Mohr were not substantiated byany particular study or reference.
72
Si,,o
-S. ' . o .
'A graFhical view of these workload behaviors is shown in
figure 5.2 [Ref. 44: pp. 121-122].
Monotonic
Abrupt
Oscillatory
• • g Random
Figure 5.2 Types of Uorkload Changes.
J. Mohr states in sumgary:
"Only monotoniq and abrupt changes must be projected.hile oscillations and tbe randomness of the workloadmust te recoqnized, they do not represent long-term
4 " ,growth." [Ref. 44: p. 122]
N 73
The import for SPLICE here seems to be that most
of its workloads fall into the first two categories thus
making workload projection a critical part of capacity
planning. Some oscillatory and random workloads are a
factor and serve as an argument for developing some
contingency and surge capacity beyond that for abrupt
changes. This is addressed in the SPLICE solicitation
document (Ref. 4: pp. C-72, C-73] under "system resiliency".
Basically, this calls for a capability to withstand workload
variations without interruption to normal loads, and excess
capacity of at least 20% with an online response time
increase of no more than a factor of 2.0. Provision for
returning to a non-saturated condition from a saturated one
must te automatic and within five seconds. This latter one
may be hard to meet as SPLICE grows without planning ahead
for such saturation ccnditions.
In the workload projection step of capacity
planning there is one hidden factor necessitating caution.
Man y times available performance data reflects an
installation's capacity rather than its true workload. The
missing parts of the workload are Mohr's (Ref. 4: p. 122]
-jlatj workloads. These are the workloads which are not
submitted to the system due to some constraint, but if the
constraint were removed according to Allen this additional
work would appear. This is similar to a subliminal process
which is dormant or not possible until the means to satisfy
it exists at which time it surfaces. This should sound
cauticn to anyone seeking to project future workloads on the
basis of only past history and projections for new
applications. Past history data only reflects that
capacities are established only to be outgrown and often
before anticipated. This only reveals that the workload
estimates were in error originally. This latent workload is
not to be confused with surge or random events and should be
accounted for in capacity planning.
74
Most CP efforts have used regression analysis
and past historical data trends. Since analysis is based
upon historical data, any approach using it has deficiencies
similar to the approach of simply relying on previous data
[Ref. 44: p. 1231. Current trends indicate the use of some
type of forecasting unit such as the NFU above to estimate
resouice demands. .lchr has proposed an approach involving
the use of IBM's Business Systems Planning (BSP) and
structured analysis techniques to project workloads for new
systems. He states:
"of . (the approach) . . . provides two major factorsthat -wll influence the workload projgctions. BSPprovides a definition of new systems, and the structured.analysis provides a description of existing processesand data flows. The work cad projection problem thendissolves into processes and volumes of data flows , . .the structured analysis approach can be used as thebasis for the projections." [Ref. 44: p. 126]
Some principles of workload projection which are
offered by Mohr [fRef. 4: pp. 120-121] include the
follouing:
1. Each major application should be treated individuallyand detailed projections should eventually beprovided for them. Less precision is necessar inworkload projection for a new network or applicationunder design. However, the workload s ould berefined.
2. Workload projection should be at the proper level ofprecision and appropriate level of detail. That is,major applications which use more network resourcesmust have accurate projection.
3. Since large numbers of minor applications cangenerally be grouped according to common resourceusage, a common workload growth factor should beattainable
e. Evaluating Network Requirements
This step emphasizes the transmission demandwaile workload projection comments above relate mostly to
processing requirements. This demand is caused by growing
traffic and addition of new locations. In internetworking
product is their overall design to encourage networking.rheir experience in this area and a history of satisfiedcustomers speaks favorably. [Bef. 47: pp. 106-107]
1. Processor Performance
As for performance details and capacity
considerations, the new TXP 32-bit addressable version
84
claims to be 20% faster (a 12mHz clock rate resulting in83.3 as microinstruction cycle time as opposed to 100 ns
time in Nonstop IZ machines), to provide two to three times
greater transaction throughput depending upon the
application mix, and to be 2.4 times faster in accessing
from main memory than the current Nonstop II. [Ref. 48: pp.1- 11
The TIP was designed primarily to increase
transaction throughput and further optimize on-line
transaction processing. what incremental improvement can be
achieved by adding TIP processors to a TIP system is not
certain, but is probably linear, such that two processors do
twice the work of one, four do twice the work of two, and so
on. The TIP processor is capable of "pipelining" or
instruction overlap to allow concurrent instruction
processing in each cp, advantage of faster register-access
time as opposed to the slower memory-access time [Ref. 46:
pp. 2-4, 2-5].
One clear advantage of the TANDEM system is its
built-in redundancy. For instance, the GUARDIAN operating
system is redundantly resident in each individual processor
and has both "fail-safe,, and "fail-sort" capabilites
required by the SPLICE functional requirements (Ref. 2: pp.
3 to 15]. That is, a "fail-safe" situation is one backed up
by the operating system continuing to direct processing
utilizing alternate resources. When alternate resources are
not available, "fail-sof t" operation is pursued where
degraded operations continue. Because all TANDEM cpu's do
not share main memory, any cpu failure does not allow such a
malfunction to contaminate any memory but its own.
Several Tandem improvements will no doubt impact
upon network performance as system upgrades are made.
TANDIE's incorporation of the 6100 Communications Subsystem
(CSS) with its two dual-ported, programmable I/O Ccntrollers
WWI 85
called Communications Interface Units (CIU's) is a design
improvement aimed at removing dependence upon a hardware
communications controller. The preious hardware
contrcilers could fail and rewuired manual intervention to
select a backup and get the system running -again. Data
communications movement functions were previously carried
out through a hardware controller component and a separatesoftware component residing in the central processor and
Zcompeting for processing time witA other TANDEM software.
Now the 6100 CSS serves to offload much of the line protocol
management and other teleprocessing control functions fromthe TANDEM miniconputer software communications processes.
As Tandem explains (Bef. 49: pp. 1-2, 1-3], this allowscommunications processes to attend to their primary job of
attending to processing data transfers for the entire LAN.Although shared memory devices might be faster than the
• . systems being placed in operation, the TANDEM system
communicating through messages appears to be adequately
capable of handling large PEP and query loads on a daily
basis despite casualties. This combination of high
availability and support for reasonably high response times
is an example of a sound subjective management decision
fitting the desired performance needs of the organization.
c. Networking Limitations
Limitations foreseen for the processors as a
link in the SPLICE communications network are few. Further
processor advances may, at some later date, necessitateimprovement of the 13 Mbps Dynabus which interconnects
TANDEM processors in a cluster. One potential capacity
design point is that as the SPLICE environment grows, there
are two growth areas assuming a large number of processors
might be required at each of several nodes with each node
having perhaps several satellite processing sites. The
8f
first is overall SPLICE internetwork growth. The EXPANDsoftware extension of the GUARDIAN operating system and
unspecified communications connections can be used to
connect up to 255 packet message nodes of 16 processors each
(total of 4080 cpu's in a network). This is presumably the
wide area network expansion version. This is not to saythat cther long-haul software protocols could not be used.
But use of EXPAND may limit the ability of a node to talkonly to other nodes using EXPAND. The other growth area is
locally. For intensive high speed processing in a local
area network, up to 14 clusters of 16 processors each (totalof 224 processors) at no more than 1000 meters between
clusters can be connected by the 6700 Fiber Optic Extension(FOX). This is an extension of the Dynabus architecture andprovides up to 4 megabytes per second data flow. The
network is a ring network. EXPAND software is required forthis cption also. Long-haul EXPAND nodes and LAN FOX nodesappear no different tc a user (Refs. 46,50: pp. 3-8, 3-9,
3-10; 3-1 to 3-5. 4-2 4-1].
Of course, there is a limit to the traffic a
16-processor per node can handle. Handling all of theinternetworking communications FEP duties, local querytraffic, and some applications processing may pose a future
overload situation. Cne alternative may be to use processor
clusters as described above and to employ one -luster as a
dedicated communications cluster for all the other mainframeand jcb processing minicomputex clusters.
d. The FEP Concept in a Case Experiment
In a final defense of the SPLICE FEP's, one FEPand host processor interface configuration experiment
revealed that the central host could normally perform all
the telecommunications functions faster than an FEP, but %as
not necessarily the most cost effective. Using central host
87
=.
processing power for telecommunications functions is
expensive just to achieve less delay in responses. In the
experiment the central host was assumed to be twice a's fast
as the PEP. In tests of four configurations representing
different sharing distributions of telecommunications
functions between the host and the PEP, the configuration
which resulted in the overall least delay was configuration
I. In this case the central host was saddled with all
telecommunications functions of network control, gueueing
control, line handling, and editing while the PEP only had
to handle I/O transfer of messages. In configurations I and
II (where network controlling was added to I/O transfer of
messages) the saturation from increasing throughput occurred
in the channel indicating that the PEP and host had split
the telecommunications duties. In configurations III and
IV, the PEP was gradually given the gueueing and then the
editing functions, thus degrading response times further.
The FEP was, in these two configurations, at the saturation
point. The ability to modularly add PEP power and grow wita
the communications subnet workload can be a solution for
;. that situation. [Ref. 51: pp. 215, 216, 227-229]
The design of the experiment suggests an
alternative which can be considered for SPLICE nodes when
host processing is at a minimum and communications
processing is near saturation. This alternative is to find
a way to dynamically allow the host to share
telecommunications function loads with the PEP. This may
more gore fully utilize processing capability and delay the
need for procuring additional FEP's. Being able to operate
near to saturation without actually doing so and still being
able to process the workload is a suitable goal.
88
A. -**-:
2. HYPERchannel
a. General
Each SPLICE LAN contains a local computer
network as previously indicated. As stated by Carson and
Formam:
If ainterprocessor communication can apply morestress to a network than can terminal-processorcommunication." [Ref. 52: p. 92]
Until HYPEchannel, some advances were made in servicing the
terminal network, but no similar efforts were made to
enhance central site activity so it could keep ahead of
burgeoning traffic. Use of a HYPERchannel bus developed by
Network Systems Corporation in 1975 has been one approach to
dealing with the bottlenecks which developed when trying to
locally interconnect heterogeneous hosts, FEP's and storage
units in one highspeed local area network configuration
(HSLN). This was the first commercially available local
computer network architecture. Standard computer channels
and 1/O control systems just do not have the flexibility to
deal with such bottlenecks. The standard channels and I/O
control systems were designed from stand alone computer I/O
and became insufficient as more data handling devices were
attached to a configuration. [Ref. 53: p. 262]HYPEIchannel is a taseband networking product of
both hardware and software components operating through a
multidrop (up to 64 drop points) coaxial cable and providing
for data transfer rates of up to 50 million bits per second.
HYPERchannel is a site data channel as opposed to a computer
data channel. The coaxial cable has no active elements, and
an adapter failure does not affect operation cf the trunk.
Operational connections are in service up to 3000 feet long,
to off-load local network communications functions from the
host as much as possible. This complements the TANDEM FEP
concept already discussed. The real key to HYPERchannel
performance- is buried in the adapters used tc interface
various manufacturers' processor and peripheral units to the
HYPERchannel. The approach explained by Franta and Heath
[Ref. 54: pp. 249-253] was to implement the bottom two
layers of a protocol environment in the adapters with tour
categcries of protocols: (1) trunk selection, (2) trunk
access, (3) adapter-adapter virtual circuit , and (4)
host-adapter, host-host, and host-device This required each
adapter to have both memory-and intelligence. The heart of
the adapter is the microprocessor which consists of a
channel interface unique to the attached manufacturer's
equipuert cn one end, four (expandable to eight) kilobytes
of data and one kilobyte of control in a central buffer, and
a trunk control logic unit on the HYPERchannel connection
side capable of attaching to up to four separate
HYPERchannel trunks. Only one trunk is used at a time. The
others provide backups and allow additional traffic flow.
[Refs. 53,55: pp. 262-264, 50-51]
The first link-level protocol layer allows open
and immediate accessibility to the bus for lightly loaded
situations and gradually converts to a prioritized ordering
of station adapters on the bus as the load increases. Wait
flip-flop devices prevent higher priority adapters from
dominating the trunk. This trunk access protoccl is carriersense multiple access with prioritized staggered delays for
assisting in collision avoidance rather than collision
detection as in as in ETHERNET. This protocol is carried
through four mechanisms called (1) transmitter disable, (2)
fixed delay, (3) n-delay, and (4) end-delay. This protocol
is timer derived and is fully distributed throughout the
90
network. In multitrunk configurations there is also a trunk
selection protocol which senses the trunks in succession,
searching for a nonbusy one.- (Refs. 54,53: pp. 249, 252;
26 1]
The second level protocol is executed in the
adapter's microprocessor where the third type of protocol,
virtual circuit establishment, is attempted between two
communicationg adapters for the purpose of exchanging a
frame sequence. A cpu submits a short request message to
its cwn adapter in an effort to have it reserve its own
adapter and initiate a request to reserve the receiving
station's adapter for data transmission to follow. When a
reservation request is refused, a binary exponential backoff
time algorithm activates as with ETHERNET transmission
attempts following a collision in that medium. The effect
of the transmitting adapter reserving itself is to prevent
transmissions from other adapter stations until it releases
itself and the receiving station adapter. The fourth
protocol type, host-adapter protocols, are simply used by
hosts to make function reguests of particular adapter
staticns. (Refs. 53,54: pp. 249-253, 264]
This is no more than a working overview of
HYPERchannel. A more complete treatment of operational
details, the protocols, and experimental performance
evidence is best obtained in the reference by Franta and
Heath.
HYPERchannel is currently the fastest data
highway available that has also had extensive research
performed on its protocols and general characteristics. It
is is quite a bit faster than ETHERNET (50 Mbps compared to
10 Mtps), but ETHERNET is designed for a LAN of up to 100
devices connected over less than a couple of kilometers.
HYPERchannel on the other hand links fewer, closer, and
higher data rate mini- and mainframes together. This
difference makes it difficult to compare them.
91
_" "_O"
b. HYPERchannel Performance
By now quite a few studies have taken place on
HYPERchannel performance characteristics; however, many of
them have deviated from accurate HYPERchannel operation
because of what Franta and Heath call reasons of:
mathematical t ractability, for lack ofunderstanding of HYPERchannel operation, or because ofalterations to HYPERchannel adapters after modeldevelopment." [Ref. 54: p. 253]
Significant studies of HYPERchannel by Lawrence Livermore
National Laboratory and the University of Minnesota
confirmed some disturbing thoughts, some of which Stallings
summarizes in his text.
Franta and Heath found that performance appeared
to degrade when contention occurs resulting in more
collisions. This result was qualified in that difference in
performance between the enabled and the disabled wait
flip-flops (WFF's) diminished as the data length per frame
sequence increased or as the number of node pairs increased.
A higher throughput was achieved for data frame sequences
than for message-only transmissions. These results coincide
with cther network findings that there is generally less
contention and more throughput when transmissions are longer
or packet size is larger. Both factors help to prevent the
apparent idle medium caused by long propagation delays when
two ready stations far apart sense an idle line and who
- simultaneously then both proceed to transmit with a
resulting collision.
There was also less queueing. delay for data
sequences than for the same throughput of message-only
transmissions. The enabled WFF's were actually less fair in
allocating trunks among adapters than when the WFF's were
disaBled. A modification in end delay corrected this in
92
tests. They determined that throughput, in consonance with
Stallings' ideal model, does not deteriorate as load
increases. They also discovered that the access scheme does
not provide a prioritized trunk access as expected.
Interaction of access, trunk selection, and virtual circuit
protocols sometimes affected adapter performance by allowing
second priority adapters to gain trunk access frequently
even at high loads and interferred with the highest priority
adapter's ability to use its scheduled transmission time.
This is without question the most significant finding of
this group for SPLICE managers. If the Burroughs or the
TANDEM FEP were the highest priority adapters on the
HYPERchannel, performance of the entire network could be
affected. [Ref. 54: pp. 253-259]
The Lawrence Livermore group was interested in
whether interaction of node placement and ccntention
mechanisms affected performance. While the reader must
refer to the referenced article fcr an accurate description
of the assumptions and conditions for the experiments
conducted on both HYPERchannel and ETHERNET-like mediums,
their results should be of interest to SPLICE managers and
capacity planning personnel. Performance was observed to
degrade drastically at high loads. This condition was
explained by a shortcoming of the level two protocol ofHYPERchannel where high loads cause a condition approaching
deadlcck. The nodes wishing to transmit keep ther.- own
adapters out of circulation, and other nodes attempting to
establish connections with these nodes do likewise. The
result is no one can receive, and adapters are mostly in
standby waiting for resources to free up so they can
transmit. Deadlock does not occur because postponement
periods where a node cannot receive time-out after some
maximum wait and the node is returned to circulation.
Degradation was also found to be serious when a remote node
93
was added to the channel. This is not surprising because
HYPERchannel is very sensitive to the successive timed
sequences in the trunk access protocol. It would follow
that an aberrant propagation delay time caused by a remote
node would affect performance. They also found that the
HYPERchannel contention scheme was superior to the ETHERNET
CSMA scheme in terms of stability, or in how well it
recovers from an unstable situation of queues developing as
a result of an overload. The HYPERchannel at medium to high
loads is able to eliminate collisions better than CSMA. The
schemes were similar, however, when the remote node and the
overload were imposed simultaneously.
* 3. Terminal "c &gs and ger in,& UqC
Although a great deal of attention has been given to
the central portions of the communications subnetwork in
SPLICE, a very user-critical portion is the terminal access
for the on-line interacitve users. This subject sbould not
be slighted, but will necessarily be treated briefly here
simply because the type of terminal and range of terminal
hook-up to the network can be of such great variety. NSC
Oakland's case will be cited as an example.
At the current time NSC Oakland has both Burroughs
synchronous and asynchronous terminals and TANDEM
synchronous terminals. Terminals are arranged six to a
shared modem on a coaxial line access from the TANCEM FEP.
Federal Data Corporation, one of the contractors in SPLICE,
recommended no more than eight terminals ever be connected
to such a single drop point. Earlier, FMSO recommendations
for using multiplexers to interface terminals to the system
ran into operational difficulties during tests. There are
20 tc 30 Burroughs asynchronous two-wire direct (TDI)terminals which join the system in a slightly different way.
They are point-to-point connected to a terminal concentrator
94
which is connected directly to a B874 miniprocessor used as
an FER for the Burroughs interactive traffic. The
possibility still exists for pass-through traffic from 30
synchronous TANDEM terminals and approximately 320 to 330
synchronous Burroughs terminals which access the Burroughs
mainframe indirectly via the 6100 CSS subsystem of the
TANDEM processors, the TANDEM processors, and the
HYPERchannel. The intent has been to gradually move the
bulk of the terminals from the Burroughs over to the TANDEM
processors as soon as file replication and download of the
major applications to the TANDEM from the Burroughs is
complete. Despite the fact that transaction ledger on disk
(TLOD) files and the recently completed file replication to
the TANDEM system for some of the major applications has
occurred, the pass-through traffic is still necessary in
some cases. [Refs. 56,57,58]
No performance difficulties have yet been
encountered, but the system terminals are not yet accessing
all applications nor are they attempting to access other
SPLICE nodes since the internetworking features of SPLICE
have not been implemented . Two possible concerns with the
multidrop system could surface as the workload increases
with time. First, any connections other than very short
bursty ones (such as complicated internetwork ones reguiring
virtual circuit connection) are likely to cause performance
degradation in terminal response times. There is no offered
solution to this, however, consideration could be given to
prioritizing terminals in certain stock transaction areas
and varying the type of hook-up to the system based upon the
primary type of traffic handled. An initial short baseline
monitcring period to establish traffic loads on each
terminal is suggested once significant SPLICE implementation
is complete. In this eftort may be found some way to trace
an individual transaction to discoverr how to individualize
95
f -
AD-ARig 198 STRATEGIC PERFORMANCE MANAGEMENT EVALUATION FOR THE '2 iNAVY'S SPLICE LOCAL AREA NETWORKS(U) NAVAL POSTGRADUATESCHOOL MONTEREY CA 0 D BLANKENSHIP APR 85
UNCLASSIFIED F/G 9/2
Lmmm
w
S161.41111_L
MICROCOPY RESOLUTION TEST CHART
NATIONAL BUREAU OF STANDARDS-1963-A"3
performance for transactions. According to one source at
the operational level (Ref. 57] there is no way to trace agiven transaction. Second, the lack of fault-tolerance inthis design perhaps for economy reasons makes the terminalaccess very susceptible to modem difficulties and to singlecoaxial cable damage. Another opossibility to relieveline
contention is to allow terminals to amass blocks of similar
transactions to different files in buffers prior totransmission and allow the terminals to sort out a
transmission scheme among themselves while the users
continue to work.
Conclusions applicable to SPLICE seem to emerge from
other studies. One study [Ref. 59: pp. 881-901] done by the
Michigan university system's MERIT network directors
illustrates the conclusion. Although this is a wide area
network example rather than a single LAN or internetworked
system as SPLICE will be, it is interesting to note that
MERIT terminal usage over a ten-year period steadily
increased and gradually occupied more network resources than
any other form of processing. The reader is referred to-
Pawlita's article (Ref. 60: pp. 532, 533] on traffic
measurements in data networks for additional possible
implications for SPLICE in terminal issues. Some
implications Pawlita [Ref. 60: pp. 532, 533] offers include
the f cllowing:
a) 11. . . medium speed dialog terminals have theirown characteristic traffic patterns. nappropriate question is what is that pattern forBurroughs and TANDEM terminals in SPLICE LAN's?)
b) traffic is extremely bursty . . °
C) uniformly small numbers of input characters, butvarying numbers of output charcters ..
d) strong influence of system applications onterminal perfcrmance . . .
e) different "randomness- of individual userinteraction sequences ... "
96
4. Protoco.Qls
The subject of protocols has recently been a major
stumbling block in SPLICE's progress both in terms of
determining which protocols best meet current and
anticipated future service needs and due to externally
levied SECDEF DDN policy and DDN subscriber requirements.
While efforts to ameliorate the situation are showing
encouraging signs, cther networks no doubt share similar
predicaments, and there is more to do to improve protocol
performance. One future challenge of measurement and
performance personnel alike is that of protocol performance
measurement. In SPLICE, for example, there is no way
currently to compare the performance of TANDEM's EXPAND
software protocol with DCA's Internet protocol without
actually running both in side-ky-side parallel systems. The
results would probably be misleading even if the test werefeasitle because the two protocols do not necessarily
perform exactly the same services. This inability to
measure protocol performance and, especially the cooperation
of several cooperating layers of protocols, is an aspect ofsoftware performance evaluation worthy of investigation
[Ref. 60- p. 533].
17
/.
.1,. 9 7
-i.
VI. INI3DhETWORKING U J JkG
A. CIERVIEN
Internetworking SPLICE LAN's for the time being is
receiving less priority as each node location attempts to
soundly establish its local operations first. Nevertheless,
as SPLICE LANes rapidly come online, there will be growing
pressures to consumate the internetworked SPLICE concept.
This chapter is divided into two sections. The firstwill deal with internetworking issues, including connection
of SPLICE LAN's via the DDN. The objective is not to become
suamerged in technical details many of which are unavailable
now anyuay. The primary motive will be to suggest those
internetworking issues which may affect SPLICE LANperformance. The difficulties lie in the planned decision
by NAVSUP (Ref. 2: p. 2-2] to implement internetvorking via
the UiNDER Corporation vendor protocols, EXPAND and
TRANSFER, while the Secretary of Defense (SECDEF) policy
(Ref. 61: p. 60] stipulates that all DOD ADP systems anddata networks will become Defense Data Network (DDN)
subscribers. The latter policy implies that subscribersmust use the DDN suite of protocols in order to be fully
intercperable with other subscribers and even with other
SPLICF LAN's interfaced to DDN. Subscribers wishing to use* some other iorm of long-haul communications must obtain a
waiver from SECDEF. SPLICE is currently in this positionwith NAVSOP [Ref. 621 intending tc follow a phased
implementation projected to be complete by 1988.
"he second part of this chapter will relate ten years of
44 documented experience by a Michigan university system
98
- ' - , - '
S '-
network. This network is not actually a LAN nor a long-haul
network in the sense DDN is, but it does have lessons for
SPLICE in the maturing of interactive and batch processing
in a network.
B. GENERAL ITERNTEORKING PERFOREANCE ISSUES
1. PRotocols and Interconnection
Internetworking of heterogeneous LAN's via a
long-haul network (LHN) manifests different performance
concerns than merely one LAN with all its components. The
connection point of each LAN tc the LHN is a gateway used to
connect all hosts in a given LAN to the LHN instead of
connecting each LAN host individually. The reader is
referred to Stallings' text for LAN characteristics
(Ref. 13: pp. 3. 66-69, 74-96], to Rosnerls text for LHN
characteristics (Ref. 19], and to Schneidevindts [ef. 38:p. 3] comparison of the features of the two (LAN's and
LHN's).
Internetworking involves, connecting interface
devices such as repeaters, bridges, and gateways. Note that
a repeater is an internetworking device for connecting
homogeneous LAN's at the physical level and bridges performsimilar functions, except with more power and serve to
connect LAN's which are not contiguous. Gateways, in
contrast, connect noncontiguous heterogeneous LAN's. By
such interconnecting of LAN's via a gateway and a LHN, all
-C the advantages of a single LAN are simply multiplied;
however, there are prices to pay in terms of tradeoffs in
performance, complexity, and costs. In general, LHN's
connecting LAN's have slower data rates, higher error rates,
and involve distance and routing problems. Complexity is
introduced by LHN topology, numbers of subscribers, number
of interfaces involved, and the resulting need fcr complex
"" 99
d LA r
protocols and the overhead subscribing LAN's experience in
handling these protocols in order to communicate with other
LAN's. Complexity of interfaces and protocols drives the
hardware and software costs. For these and other reasons
sore than one author has argued for keeping the number of
interfaces low and keeping them simple. Sometimes this just
is not possible. The need for simple efficient LAN service,
the need to internetwork with other LAIs. and the need for
compatibility between LAN and IHN at their interface becomes
a problem analogous to the one of performance parameter
selection in that all needs cannot be optimally satisfied
simultaneously. There exist tradeoffs.
The problems arise when the LHN's existence precedes
that cf the LAN, or vice versa. In the former case the LAN
must be designed from the beginning with the protocols in
mind which will support the range of functionality desired.
If the LAN were designed with no thought to its eventual
interconnection with other LAN's, the protocols may be
inadequate in necessary generality for internetworking
functions even though they may be quite good within the LAN
itself. Performance of internetworking processes would
suffer later as more interfaces are required either for
additional protocols cr for protocol conversions. On the
other hand, a LAN designed only for the function of
connecting hosts to a LHN might sacrifice some LAN
performance due to the LHN ;rotocol overhead which will
exist in the intra-LAN traffic as well. In either case a
second set of protocols generally becomes necessary. It isthis Frctocol proliferation which is undesirable individual
and interconnected LAN's. [Ref. 22: p. 32]
The effect of differences in LAN's and LHN's on
interface complexity is well illustrated in the following
principle:
100
lil
-. .
"The more a local network is designed. to increase theeffectiveness of intra-local networl communication, themore the cost of the interface to a long-distancenetwork increases and the more the effectiveness ofinter-local network ccamunication decreases."Ref. 38: p. 3]
As pointed out by the same author, the sane two
choices enumerated above exist. That is, the choice is
either a LAN tailored to local user needs and a complex,
expensive interface to the LH1, or LAN compatibility with
the LHN protocols at the expense of some overhead and
performance degradation in the LAN. He cites that the
tendency is still to design LAN's for long-term local
effectiveness and make the one-time sunk high cost for the
necessary LAN-LHN interface. The three possible approachesto the interconnection problem cited by Schneidewind reveal
* a series of tradeoffs. The n approach
emphasizing the ability of a user to access other users and
resources implies a need for only the lower three
International Standards Organization (ISO) model levels of
connection for LAN/LHN compatibility physically and
electrically. This approach provides physical connection,but it may fall short of providing all the services needed.
The network services apy_ ach emphasizes compatibility ofthe LAN and LHN at higher ISO levels. This approach
achieves user services needed, but it may result inintra-LAN performance inefficiencies. The P o
functions approach attempts tc please everybody by having
one essential set of protocols for the LAN's and another
compatible set for the LHN. The result is a need for acomplex and often expensive LAk-LHN interface involving
protocol translation. In actual fact the author urges*deliberate consideration of an appropriate combination of
all three approaches to achieve "an effective
interconnection". (Ref. 38: pp. 4-6, 10]
101
.. 7 'LZ
•a
2. Uhe In2L Z etQworkina Lat a
All the issues of internetworking are generally
manifest in the gateway between the LANIs and the LHN.
Gateways view the connected LAN's simply as "hosts"
connected to the LHN.
The burden of internetworking is clearly placed upon
the interfacing gateway between the LAN and the connecting
LHN. Such an interface, where virtually all traffic flows
between (both into and out of) the LAN and the LHN is
certain to be a point of congestion. The FEP or other form
of connection of the LAN to the LHN also absorbs a share of
the load. Clark observes that several LAN's [Ref. 22: p.
33] or satellite LAN's, are connected by bridges in a
subnetwork arrangement, the load on the gateway is more
severe The connection issues cf the lover three ISO model
layers, such as speed matching, protocol compatibility,
buffering needs, difference in maximum packet size allowable
between LAN and IHN and the consequent need for
fragmentation of messages, need to maintain virtual circuits
when reguired, flow control, and so on, are all factors
which affect the gateway's ability to sort and move traffic
efficiently. The more load in terms of volume and in terms
of complexity and transformation processes required, the
more LAN management can expect internetwork performance to
be affected. When a gateway services multiple LAN
subscribers to the LHN service, the performance degradation
can compound. This degradation causes new problems such as
needs for priorities, computing capacity and expense of the
gateways, and dissatisfied users.
In short, authorities are seeing the LHN "highway"
and its gateway "entrance ramp" as the bottlenecks for
internetworking, at least from the viewpoints of LA% asers
who are getting used to much faster local service. One
"At this time it is not clear whether the gateway canassume the entire respqnsibility for augmenting a localnetwor . . with the functions required forcommunication through a long-haul network." [Ref. 22:p. 33]
Another anthcr writing on internetworking implies
that with the two types of packet switching networks,
point-to-point networks and packet switching data networks
(PSDN), there may be alternatives to relieve the gateway
congestion. One alternative is to use point-to-poinz
connections for bulk file transfers where high volume rapid
data rates occur even if infrequently. The question here is
are the costs of dedicated lines or adherence to a window
schedule of usage for several subscribers preferable to the
delay in using a PSDN (LHN)? Another alternative and
technology challenge is the construction of super
multipurpose gateways that can handle the loads and even
afford some excess capacity for surges. A final alternative
is to build lower-cost specialized gateways or offload some
of the gateway functions onto the subscriber LAN hosts or at
.least to a host FEP. [Ref. 63: pp. 80f, 80J]
C. INTERZETUOEKING PERFORMANCE ISSUES FOR SPLICE
All the preceding issues of internetworking and the
associated performance characteristics likely to result are
*issues for SPLICE as well. Bather than burden the reader at
this point with more performance metric details,
"performance" will now collectively refer to all metrics of
interest, such as response delay, availability, throughput,
etc. NAVSUP intends [Ref. 1: p. 19] to use DDN as a
*. backbone to serve SPLICE stock point nodes and SPLICE
inventory control points (ICP) nodes. The internetworking
issues in this plan involve policy as well as technical
anticipates that SPLICE managements can potentially lookforward to added subscribers, new types of traffic,additional DDN nodes, and priority schemes affecting their
operations as legitimate subscribers [Refs. 61,64: pp. 5,
7]. This is inevitable since the majority of DDN traffic
DDN [8f. 61: pp. 2, 3] expects to be unclassified and to
use the MILNET branch of the unclassified segment as opposed
to the ARPANET research branch. Higher priority users will
no doubt inflict upon SPLICE performance, but hopefully, on
an infrequent basis. Perhaps some supply traffic could be
considered of a higher priority than the more routine supply
traffic and arguments made for assigning functional sive
organizational priorities on DDN. This might require remote
contrcls at gateways by the DDN network monitoring stations,
prearranged agreements and access procedures to alter
priorities, or even real-time communications between the
SPLICE LAN sites and the DDN monitoring stations.
rEN casualties and delivery or transmission errors while
remote are still possible. The misdelivery error rate is
remote at an estimated probability of 5.5 X 10⁻¹² while the
probability of an undetected error is even more remote at
4.2 X 10-le. The analogy for the undetected error rate is
that at a steady 24-hour-a-day rate one bit error might be
undetected every one million years. Retransmission backup
provides for this unlikely occurrence. Should
internetworking capability may degrade only slightly. DDN
advertises 99.30% availability for single-homed subscribers.
SPLICE sites desiring a higher availability can achieve up
to 99.99% by dual-homing. That is, obtain more than one
access link to DDN (Refs. 61,64: pp. 5v 6; 6, 7].
All internetworking and associated SPLICE performance
issues are not tied to DDN-SELICE factors alone. One of
immediate concern is the potential capability of a single
106
. ..
critical SPLICE node to become overwhelmed with query or
other traffic. The aggregate SPLICE management must deal
with this issue. One built-in control at the current time,
at least for single-homed SPLICE nodes, is that the SPLICE
LAN can process and handle traffic faster than DDN can
deliver it. Unless the local traffic were also heavy or
unless a SPLICE LAN had multiple incoming LHN lines, the DDN
and its gateway can effectively serve in a pressure-
reducing role. Attention to SPLICE node criticality and its
placement with respect to DDN access.
A closing issue in internetworking of SPLICE LAN's via
DDN ccncerns coordination. There are many instances when
direct communications between SPLICE LAN and DDN authorities
may be impossible over the DDN channels. Some form of LAN
monitoring site-to-DDN monitoring site communicaticn would
be mutually beneficial to both parties and moreso to SPLICE.
D. CASE STUDY OF THE MERIT NETNORK
Fcr an example of network usage statistics reflecting
gradual maturity of a network over a ten-year period, the
reader is referred to Aupperle's article "Merit's
Evolution--Statistically Speaking" in IE _Tansactions on
Computers (Ref. 59: pp. 881-902] which describes the Merit
network among some of Michigan's universities. This network
is not the same in geographic scale, number of nodes, or use
or FEE's as anticipated with SPLICE. Merit has 282 terminal
parts and only 5 remote batch entry sites. Although Meritis more a wide area net instead of internetworked LAN's as
SPLICE will be, some of the same trends and conclusions may
be pertinent.
In the Merit network, five networx measurement
statistics were gathered on a monthly basis over the
There were four types of access to the network mentioned by
Aupperle (Ref. 59: pp. 884, 885# 887], including both batch
and interactive terminal services:
1. Host-to-host interactive requires a user (or a userprogram) establish a connection from a local host toa selected remote host. The resources at the remotehost that are made available by the network connec-tion are the same as those available through aterminal directly attached to that host.
a) Classic interactive among two or more networkhost.
b) Enhanced interactive where data bases from onehost can be used by another host.
c) File transfer allowing data to be copied from onehost tc another.
d) Interprocess communication where programs can runon one or more host computers concurrently.
2. Direct terminal access allowing direct dialing intothe netwrok from a terminal and accessIng a remotehost without gcing through a local host.
3. External access allows 32 external users to accessMerit through an .X25 link and GTE Telenet as opposedto entering via a network host.
4. Network batch service allows a user to submit a jobat any network host. Establishing any connectionsfor transmitting the job and for retrieving anyoutput is done by the Network Batch Service.a) Remote job entry allows batch job to be submitted
either in card deck form or from a terminal.
b) Batch file transfer allows data to be copied fromone host to another.
The overall general picture gained from this study was
that the network grew and changed. All curve trends, except
the number of megabytes of characters, increased steadily
and began a levelling off period only for the last year and
a half of the period. Trends such as an initially constant,
but later increasing value of packets per connection, a move
rapidly increasing value of kilobytes per connection, and a
bimodal time per connection are explained as a stabilization
108
process in the mix of network connect types over time.
Batch and terminal access tend to affect these figures
oppositely. The number of batch-type connections with short
average connect times and large packet- and
byte-per-connection transmission rates was observed to
decrease while the number of terminal connections with
longer connect times and lower data rates increased
significantly. 7hese terminals account for the increased
connect time trends, while batch work accounts for the
increase in kilobytes per connection and packets per
connection. [Ref. 59: pp. 889-893]
One notable fact about packet size is that in this study
it remained almost constant throughout the ten-year period
and under varying operational conditions. [Ref. 59: p. 890]
Specific usage varied by host nodes and according to
connection types. The variance in the host nodes usage may
hold no significance for SPLICE except to illustrate that
each SPLICE node will likewise establish its own usage
character. Terminal connection type dominated Merit.
Terminal access surpassed external access in average Connect
times possibly because of cost. This indicates that without
some incentives to make good use of terminal time, it will
be used as available. This assertion coincides with earlier
comments concerning latent workloads and may have
implications for user behavior and even necessity of
charge-out schemes.
The Merit network has the network attributes of remote
access and resource sharing, but is not a load a
(distributing a load among the several network computers) or
a Process-sharinq (allowing processes to migrate throughout
a network and use resources as needed) network by design.
With Merit users must still know where specific resources
are in the network, how to access then, and how to use them.
This implies a lack of transparency for users in satisfying
109
La
their needs. User-scheduled load-sharing, consequently,
does not account for much of the network traffic even though
the capability is there. This could be a parallel argument
for much more transparency in SPLICE to maximize resource
use. Most ot Merit's usage increase was attributable to the
direct terminal and external services indicating that most
user networking needs were rather simple. Analysis of user
needs and behavior, if undertaken beforehand, may have
predicted these usage trends. [Ref. 59: pp 894, 898, 900]
The Merit study author warns of generalizing too much
about Merit data as applicable to other networks. While
very little work related to response performance was
accomplished in the Merit study, the experience indicated
that for interactive computing sessions the network did not
introduce noticeable additional response delays. This may
*. be explained by a built-in form of regulation which Merit
used and SPLICE management may want to emulate. This is
that even though batch and interactive terminal connections
were give equal network priority, each host was limited to
accepting only one batch connection from each other host
while a host could accept interactive connectionsconcurrently. This allowed controlled high data rate batch
traffic to flow without imposing network response delays.
In SPLICE LAN networks where a second and third shift may
operate, the contention for connection time may not be a
Network performance evaluation and capacity planning are
critical elements of any organizational strategic plan and
should be intergrated into that plan. Like other
organizational elements of the plan, performance evaluation
can be approached and viewed as an expression of one way in
which the organization can achieve declared strategic
obj ectives.
Capacity planning should be an ongoing continuous effort
with flexibility to provide insight into subsystem
performance and needs and overall network performance and
needs.
Definition and use of some form of standardized, useful,
and understandable network performance metrics are
suggested. As SPLICE internetworking becomes a reality, the
need for standards common to all sites will be manifest.
Additional local standards which are necessary for the local
area networks or which are local application-dependent may
also te required.
Performance was addressed early in the SPLICE
procurement phase, but has seemingly taken a backseat in the
implementation phase. Before entering the long-term
operational phase is a good time to inculcate performance
standards and thinking.
At least parttime dedicated personnel assets above andbeyond FHSO teams or vendor support is suggested as a
vehicle for continuity, and no one better than a resident
with the evolutionary observation, documentation, and varied
k evaluation skills can provide that continuity. Even as much
as one person can make a difference.
111
Management commitment to strategic performance
evaluation must exist. Less will only waste the efforts of
any network performance evaluation personnel assigned and
detract from the credence given by employees to the overall
strategic plan for the organization.
Draw upon parallels in computer performance evaluationexperience and knowledge and upon vendors for guidance in
network performance evaluation.
Adopt DDN protocols to the maximum extent possible.
112
I
GLOSSARY OP TIRES AND ABBRBVZATOIlS
This appendix includes selected terms and abbreviations
related to the subject of network performance evaluation and
referred to elsewhere in the thesis text. The glossary is
included as a quick reference for the reader and to prevent
the distraction of cumbersome definitions within the text.
The pattern of presentation will be to list the term as
commonly defined by one or more authors.
1. Accuracy -- "The correctness and completepess of theinf t-ion accepted by the receiving termainal
-. Defined in ANSI 13. .. Re idual Error Rate(RER) is defined as the ratio of the sum of (1)erroneous information characters accepted by thereceiving terminal (CeL, (2) information characterstransmitted by the sen ing terminal configuration butno delivered to the receiving terminal configurationICuk, and . .. b°. (3) information characters acce tedin auplicate by the receiving tqrmsnal configurationwhich were not ittended for duplication (Cd) . . . tothe total number of information characters containedin the source data (Ct) . [Ref. 32: p. 13]
2. osnchrg.ous -- "A forp of communicatind wher eachtransitte character has self-contain.d beginningand ending indications, individual characters canbe transmitted at arbitrary times." (Ref. 19: p.355]
3. Avajiabilitv.-- "o the proportion of selectedtime interval durini which the information path iscapable of performing its assigned datacommunications function . . . expressed as apercentage." (Ref. 32: . S3] -- ". ... theproportion of time when the system is available foruse, that is runs ng9mally. one measure *smean time between failures (MTBF}." CRf 10: p. b]"N. "- - the percentage of the total time d aurinwhich the system is at the disposal of the users.[Ref. 9: p. 12]
4. Ba on -- "Transmission of signals withoutmoduatione . digital signals (1's and 0's1 areipserted irectly onto the cable as voltage pulses.Tne entire spectrum of the cable is consumed by thesignal. This scheme does not allowfrequency-division multiplexing." [Ref. 13: p. 351]
* 113
-~~~~~I -- lis*-,.*..l. .
5. Bottleneck -- "* a limitation of systemperformance due to the inadequacy of a hardware orsoftware component or of the systemas organization .. . The term . . is sometimes used to indicate thecatmponent or part of the system that causes theb9t leneck o .hen the service requests for agiven component exceed in frequency and intensity theservice capacity of that component, the conditionsfor the appearance of a bottleneck arise." [Ref. 9:pp. 281-242]
6. Bradand - "use of coaxial catle forpoiding data transfer by means of- analog orradio-frequency signals. Digital signals are passedthrough a modem and transmitted over one or thefrequency bands of the cable." [Ref. 13: p. 351]
7. Bridqe- "A device that links two homceneouspalnXE-switched local networks. It accepts allpackets from each network addressed to devices on theother, buffers them, and retransmits them to theother network." [Ref. 13: p. 351]
8. Bus - "A topology in which stations are attached toa sOared tr ansmission medium. . The transmissionmedium is a linear cable; transmissions propagate thelength of the medium, and are received by allstations." (Ref. 13: p 352]
9. ' -- "the maximum theoretical value that
Ile roughput of a system can reach." [Ref. 9: p12] -- to. . quantity of information processing donein a unit of time under a balanced load . . ."[Ref. 10: p. 51 -- ". amount of bandwidthoriqinally allocated to a channel." [Ref. 37: p.171]
10. Carrie § e .Ultip~. Access JC§SA) -- "A mediumaccess1 confre% t ec nigue" fr multiple-access
transmission media. A station wishing to transmitfirst senses the medium and transmits only if themedium is idle." [Ref. 13: p. 352]
11. agir Sens:g fCl *son4e_%,-- (CSMIA.c, -- 01 refinement or S-in fl nicna station ceases transmission if it detects acollision." [Ref. 13: p. 352]
12. Channel -- "A path along which signals can be sentconnects the message source with the message
sink." [Ref. 8: p. 180J
13. Channel Ca acity (tcpology-depepdent) -- "Themaximum speed oEthe channel in it per sec deendson the transmission medium and the electronics at thetransmitting/receiving ends). Generall, . . . thetheoretical limit as defined by vendor . .[Ref. 17: p. 207]
114
14. 1 Iratio-based) .- Nihe ratio of1. akcienfltiraqnf. ony tervalsrati°ato anm 0 the PacketTransmission Intervals and Packet TransmissionDelays. Retransmissions are not included ..[Ref. 17: p. 202]
15. monta _e . t~e time toa aMIIXIUntgEgzi-Y toa called terminal. It
includes any dialing mechanism or protocol layerprocedures and time required b tre network tocomplete the connection." [Ref. 35: p. 6-25]
16. Channel. Idle nt al (time-based) _-- ".... periodf]om end or a lacPt aTransmission Interval until thez4rst transmission attempt starts not necessarily thetime period between transmissions as the transmission
19] ay end in collision . . . . " [Ref. 17: p.
17. Channel _ (topology-dependent) . -- "The len thor xne c an rom one end to the other." [Ref. 17:p. 2o07]
18. c . switching -- "A form of switched networkta rovides an end-to-end _path between userendpoints under the control of te network switches.Often called channel switching." [Ref. 19: p. 3561-- "A method of communication in which a dedicatedcommunications path is established between twodevices through one or more intermediate switchingnodes. UnliKe. packet switching, digital data aresent as a continuous stream of bits. Bandwidth isguaranteed and delay is limited to propagation time
." (Ref. 13: p. 352]
19. Cllision - "A condition in which two packets arebeing transmitted over a medium at the same time.Their interference makes both unintelligible."(Ref. 13: p. 352]
20. CgQisin QSunt (count-based - "The number ofcoI..s'ons a packet of any type encounters beforebeing transmit ted." [Ref. 17: p. 206]
21. Computerized kAnc . alge AC X) -- "A localnetworK se on he d4gl a ri-e branch exchangearchitecture. Provides an integrated voice/dataswitching service." (Ref. 13: p. 352]
22. F el2 ,,"[.. the throughput as measured on thatcmannel." (Ref. 37: p. 171]
23. Gatea. - "A device that connects two systems,especialy if the systems use different protocols.for example a gateway is needed to connect twoindependent local netwotks, or to connect a localnetwork to a long-haul network." t ef. 13: p. 353]
a"d . e gateway may relormat the data asnecessary an a so may participate in error and flov
control protocols. Used to connect LAN's employingdifferent protocols and to connect LAN's to public
. data networks." [Ref. 8: p. 190]
24. Host -- "A computer attached to a network providingprimarily services such as computation, data baseaccess or special programs . . ." Ref. 8: p. 191]-- $he collection of hardware an software whichattaches to a network and uses that network toprovide interprocess communication and userservices." [Ref. 13: p. .353]
25. ".EighS 1.9 L l j etwork ( SLE) -- "A local networkd esigne to. proviae- Kngr throughput .betweenexpensive, high- speed devices such as mainframesand mass storage devices." [Rel. 13: p. 353]
26. Interface -- 11. A shared boundary defined by commonphysical interconnecticn characteristics signalcharacteristicS, and meanings of interchangedsignals. 2. A device or equipment makininteroperation of t0wo systems possible; . . . . .shared logical boun arv between two softwarecomponents." (Ref. 8: p. 192]
27. race Count (count-based) -- "The number ofinterface c-nnected to a channel." [Ref. 17:207"]'p.
28. "1I to Interfacl Communication Delay(tim-- d) = "Thti7-mrrm wh en a ac et is Mayto be transmitted at a sender inter ace until thepacket has been comm lunicated to the receiverinterface." [Ref. 17: p. 199]
29. Internetworking -- "Communication among devicesacross mu.LtipIe networks." [Ref. 13: p. 354]
30. .jj.e tnarounid delay - -... the time required byha -u p iex circuits to reversQ the direction ortjansmis.sion. " (Full duplex lines have permanentvirtual links and no such turnaround delay.Transmitting in lar er blocks of data can lessen thisparameter's effect.? Elef. 35: p. 6-26]
31. Load Balancin_ -- "A s stem is balanced when itsw'oroa i evenly dis ributed among all of theavailable resources." [Ref. 45: pp. B-I, B-3]
32. Local Aria Ntwoks -- "A general-purpose localn-Mi-k I at can serve a variety of devices."[Ref. 13: p. 354]
33. loopback test - "A test in which signals are loopedfrom 1Te .- Zenter through a data set or loopbackswitch and back to the test center for measurement."[Ref. 8: p. 194]
"- 116
34. MaliMPc- lqnt( topol ogy-dependent) -"The
max p Len gth7 o a pacet that *can betraosmitte 4/received over the channel by an interfacelimited by software as tell as hardwareconsiderations." CRef. 17: p. 2 07
35. H svichinu -- "A switching technigue using a.message st re -forvard system. No dedicated pathis esablished. . each message cortains adestnatou address andis passed from source todestination through intermediate nodes. At eachnode the entire message is received, stored briefly,and then passed .on to the next node." (Ref. 13: p.354]
36. e - ". w the time required for amessage to transmitted from a source and acceptedat the designated sink (destination)." CRef. 35: p.6-25 ]
37. Network Power (ratio-basedl -- "The ratio throughputto average Station-to-Station Packet Delay .reflects how fair a network is to different users. "(Ref. 17: p. 202]
38. Offered . rnn_ l fi* -- "At ana instant thetoxal numberopacKexsfn the interlaces vaihing tobe transmitted. The packet that is being transmittedat Uat instant is not counted . . . This metricdepends on the fuffers at the interface." [Ref. 17:p. 206]
39. gffpmed Load . the total number of packetsoftered tohe network." (Denoted by the letter"G".) [Ref. 13: p. 235]
40. Packet -- "A group of bits that includes data Slussource and destination addresses." [Ref. 13: p. 355]
41. Rugket Sw& -- "A method of transmittingmessages tnrough a commun Iations network in whichlong messages are subdivided into short packets.Packets are then transmitted as in messageswitching." [Ref. 13: p. 355]
42. 1* kt Tr~amsission c.uat (count-based) - "Thenuaer oftf.es a pacTeW is transmitted (originalplus duplicate transmissions) before it iscommunica ted. Redundant transmissions are notincluded." CRef. 14: p. 206]
43. ZiAet Transmis0 e4ax _ (time-based) -- "The timefrom When a pacKe is ready to be transmitted in aninterface until the start of transmission."[Bef. 17: p.200]
44. RIBI i n QZ Iger va (time-based) - "TheimeZ rom WEen a trasmission begins on a channel
117
N
until a packet has been fully transmitted."[Ref. 17: p. 200]
45. Protocol - "A set of rules governing the exchangeor data between two entities." [Ref. 13 355]
46. Relative Netcrk Throuqhput (ratio-based) -- "Forthe same UzIered Inannel Traffic, the ratio ofIhroughjut of network 1 to Throughput of network 2."[Ref. 7 p. 2033
47. Reliablity -- ,. , the likelihood tht atelecommunIcations fac1lity will remain operationaluntil until the information transfer has beensuccessfully completed . describes theperformance of a system after it has accepted amessaqe from a source for delivery." [Ref. 35:p.6-2. ]
48. ResDonse Tize -- (same as network delay) [Ref. 35:pe b- 3* W. the time interval between theinstant he inputting of a command to an interactivesystem terminates and the instant the correspcndingrey begins to appear at the terminal." leer 9: p..11] -- ',... the time that the operator must wait tobegin a transaction after completing the previousone." [Ref. 16: p. 2]
49. Stability (time-based) -- "If the number oftransnitt.1na interfaces (and . . . stations) . . . isallowed to increase without bound, then a channel is• it . stable if the station to Station Dela stayswithin' as, where X may depend on the num er ofinterfaces. Throughput must be anondecreasinq functionf* offered channel traffic forthe channel to remain stable." (Ref. 17: p. 198]
50. Station to Station I essagS_elI (time-based)"7e tinero7Vwhen a message originates at a stationuntil the message is assemaled successfully at thereceiver station." (Ref. 17: p. 201]
51. aiQU to2 Station fIgket Deljf (time-based -- "Thet ie- fromwn--paq e-origina es at a station untilthat pacKet is received at the destination station."(Ref. 17: p. 201]
52. §Ynchrouo us - " form of communications wherecla-tr bits are sent in a continuous stream,with the beginning of one contiguous with the end ofthe preceding cne . . . requires the receiver tomaintain synchronism to a master timing signal."[Ref. 19: p.301j
*53. hrouhput -- "The number of packets communicated on.*"t~ an~e--I, per unit time." [Ref. 17: p. 204] --S.. its value may be expressed in many ways:number of transactions processed per unit of time,. . . (Ref. 9: p. 12]
118
54. Thghput Law - ... system throughput is eguaJ.to tne utliYtion of cnly device, divided by thedemand for that device." (Ref. 45: p. 5-3]
55. Topolg - "Ihe structure, consisting of paths andP.stcae , that provides the communicationsinterconnection among nodes of a network." [Ref. 13:p. 356]
56. ansfer . . . the rate of the number ofinformaion Wits accepted by the receiving terminalconfiguration durina single information transferphase . . to he duration of the infcrmationtransfer phase." [Ref. 35: p. 6-22]
57. ransmission medm -- "The physical path betweentransmitters an receivers in a communicationsnetwork." [Ref. 13: p. 357]
58. Iransparency - "In data communications, the abilityta transmit arbitrary information, including controlcharacters which will be received as data." [Ref. 8:p. 20*4] -- ". . . describes the absence cf code orprocedural constraints imposed on the informationprocessing by the communications system." [Ref. 35:p. 6-261
59. User ChaAel Zhroua ult irate-based) -- "The totalnumer- of bytes in al transmissions from aninterface per second . . . includes synchronizationand check-sum byteso Bytes . involved incollisions are not counted . ." [Ref. 17: p. 205]
60. se Qhanel Ut ion (ratio-based) -- "The ratioox User anni TOUghput and Channel Capacity."[Ref. 17: p.203]
61. Use Inform4ation hroughput (rate-based) - "Thetotal n-umer o-fihformation Z tes communicated from astation per second." [Ref. 17: p. 205]
62. _lE L~Lqatj_ .tization (ratio-based)- "The
ratio o userIn ormafIon Throughput tc ChannelCapacity." (Ref. 17: p. 203]
charged-out system. These programs are a rich source of
information for most performance improvement projects and
could be used to document trend usage in support of capacity
planning decisions. Some version of these programs is
nearly always included in a procurement package and
considered somewhat "free". [Ref. 14: pp. 2-3]
Accounting data packages do have some limitaticns. Very
few if any such single package can provide data in every
combination and about every parameter desired. They use
computing resources in proportion to the amount of work they
perform. When such packages are used only for sampling of
data for performance and management studies, fror 2 to 5%overhead is imposed on the system. If features of the
package are engaged, however, the overhead can range upwards
to as high as 30% or more. The typical overhead level for a
comprehensive package used for CPE purposes is around 10%.Accounting data packages are not for serial-only computers
where a data collection routine along with an application
program would pose a severe processing burden. However,
multiprogramming environments (batch, teleprocessing, and
mixed batch-teleprocessing) can benefit in varying degrees.
" Accounting data systems are test used with batch systemsbecause of consistent batch system behavior which is
primarily computer-oriented. Such packages are difficult to
use with teleprocessing systems because of the influence of
the unpredictable human user element and the decreased
visibility of teleprocessing activity. Much of
teleprocessing activity is simply generated by software and
hardware which is outside the confines of the computer(s)
having the resident accounting data package. Another
difiiculty with teleprocessing systems and accounting data
gathering is the need to time stamp gathered data to note
-' when resource usage occurred unlike the mere data gathering
in simple CPE systems. Additional code added to perform
121
7-t _°7
this timing notation is acre overhead unneeded when
nonitoring activity is heaviest. Another tradeoff is thatsystems with less comprehensive data gathering packaged
generally require augmenting software or hardware
monitoring. [Ref. 14: pp. 58-60, 72].
The advantages and experience with acccunting data
continue to make them a more comfortable approach for many
organizations. The length of experience, familiarity, and
influence of vendors accounts for the reliance of many CPE
teams upon accounting data packages. Such data is
considered [Ref. 14: p. 69]. representative, acceptable,
and available. Data reports from such packages are widely
used by installation managers, programmers, and CPE groups
as well. This breadth of exposure is not quite so easily
facilitated with other perfcrmance evaluation tools or
techniques where expertise must usually intervene to produce
interpretable results. Another positive sign for
teleprocessing environments such as SPLICE specifically is
that the next level of sophistication in accounting data
packages above comprehensive packages is being perfected.
This is the trace or trace-driven system, where
noncontinuous tracing, or sampling, of data is done in
reasonably short time periods. Such data sampled in an
interactive environament could be the types of inquiries or
updates made by a user terminal or cluster of terminals in a
short time trace or even the user(s) demand for various
hardware or other resources in a similarly short time
period. Of course, it would again be for management to
determine the length of such a period. (Ref. 1 : p. 61]Perhaps the most attractive advantage of accounting data
is that it can point to areas where another tool can be used
to narrow in on a problem, such as to identify target
programs or components for examination by monitors, totailor simulation inputs, or to characterize workloads for
122
*, '
benchuarking. These other uses will become apparent as the
other tools are discussed.
C0 SFTUARE NONITORS
A fourth CPE tool is (4) software monitors. These are
also measurement type tools. They are specialized sets of
software code integrated into the computer's operating
system and used to collect statistical information about the
distribution of activity caused by execution of any
particular application programs or routines or about use of
all or parts of the hardware configuration by the software.Software monitors are event-driven, time-driven, or a
combination, and sampling techniques are. used to control
their operation. Event-driven monitors work by means ofjos or c c state. Hooks are recognizableinstructions inserted into the operating or control program
to cause a set of data to be gathered whenever the hook isencountered. A change of state occurs whenever one type of
computer activity stops and another begins. Hooks and
changes of state ate the events that cause the monitor to
operate according to some specified sampling frequency.
Time-driven monitors examine a particular activity andcollect a predefined data set by using a clock to interrupt
processing at fixed intervals. most successful monitors use
a combination. Time-driven techniques are used for frequent
short-lived activities and event-driven for less frequent
longer events. [Ref. 14: pp. 76, 78]
There are three categories of monitors which include
optimizers as well to be discussed shortly. These are
Application Program Analyzers (APA's), Control Program
Analyzers (CPA's), and Equipment Usage Analyzers (EUA's).
EUAts are most like accounting data packages since they
gather data on amount and distribution of work for various
123
system components of a configuration program by program and
as a complete system. EU&'s simply can get a greater level
of detail. These tools differ from accounting data
reduction programs in that software monitors can collect a
finer level of detail by examining step-by-step execution of
coded instructions. Like accounting packages, software
monitors are commercially available, but primarily only for
a narrow range of manufacturers and mostly for large
mainframes. Software monitors are very system-dependent.
Since these tools are incorporated into the operating
system, some contend that in seeking the performance of an
application there is no resulting overhead. Others disagree
that any additional software is overhead. (Ref. 14: p. 78]
A brief note on strengths and limitations of software
monitors includes the software optimizers since both are
programs. The advantages of software monitors include that
as prcgrams they are easy to install and use, that they are
relatively inexpensive, that they can collect unusually
detailed information, and that the commercial varieties come
normally with maintenance iupport experience of a vendor and
may have other features such as special reports.
Limitations include that they consume computer resources,
may produce misleading results when a sample is not large
enough, are system and language dependent, and can collect
only information accessible through software instructions.
[Ref. 14: pp. 89-92]
There have been cases of user-developed monitors causing
nearly 100% overhead. One survey [Ref. 14: p. 79] reported,
though, that users were more satisfied with software
monitcrs than any other CPE tool.
Most established CPE groups seldom find a need for more
than accounting data and periodic software monitoring, any
additional software becomes overhead.
124
D. PDOGRAN OPTIIXZ-uS
A subset of accounting packages and software monitors
and likewise falling into the measurement category of CPE
tools is the (5) program optimizer. These are specialized
sets of code usually written in the language of the program
to be optimized and compiled with the application program to
collect information on execution characteristics of only
that particular program when it is run with test data.
Program "optimizer,, is a slight misnomer because these code
sets do not optimize programs. Rather they produce reports
that indicate to programmers what parts of application
programs might be improved to decrease running time or
computer resource usage. Optimizers, unlike accounting data
packages and software monitors, can collect information such
as parts of a program which are not used or are seldom used.
These tools can assist in pinpointing efficiency. Since
they are compiled with the application program, they are
compiler dependent while accounting packages and softwaremonitors are more system dependent. These tools also impose
some overhead upon the system. Program optimizers are
primarily event-driven. Their strengths and limitationsrevolve around their nature as programs discussed above
under software monitors. [Ref. l4: p. 4]
E. HABDVARE 805IORS
A tool which is more difficult to use because the usermust be familiar with the architectural details of the
system to be monitored and because oi the voluminous data it
can produce is the (6) hardware monitor. This equipment ismore of a traditional measurement category tool since it is
a piece of electronic equipment attached to the internal
circuitry of the system to be monitored for sensing changes
of state at these connection points. Information is
125
recorded or displayed on the number and duration cf events
occurring at each connection point. The information is
saved for later reduction by a specialized software program.
Such hardware monitors are called basi monito and are
system independent as long as the connection points of
interest are known for a particular brand of computer or
and special register adapters to enlarge the monitor
capability for simultaneous measurement of large numbers of
signals. Reports are produced which cover many combinations
of the physically monitored signals that seen like larger
numbers of basic signals. These monitors are also system
independent, but require a much more detailed knowledge of
the systems architecture monitored. The most recent
evolution has been Utelnc M1Jl. Ns that communicate
with the programs executing within the computer to control
the information collected by the monitor. These monitors
are system dependent, and the monitor must virtually
reproduce the monitored system's architecture so operations
can be recognized as they occur. Generally, these tools are
rather passive and truly monitor without perturting the
device monitored. (Ref. 14: pp. 4-6]Hardware monitors are in general nct for CPE beginners.
They reguire a great deal of systems knowledge, training and
practice, and an understanding of the nature of the workload
on the system for results to have any meaning. These tools
are usually a last resort, but can be productively used in
the hands of skilled technicians, especially when the
information to be obtained is invisible to a software
aonitcr. [ef. 14: p. 113]
Strengths of hardware monitors are not as significant as
limitations. First, there is no way to correlate data
collected with specific programs executed. Second, some
contrcl program functions often cannot be tracked. Third,
126
MEN
connection of such a monitor sometimes involves proprietary
permission of the computer manufacturer. Fourth, training
and experience are a must. Fifth, connecting such a "black
box" can be a disrupting ordeal. Lastly, the costs do not
stop at leasing, renting, or purchasing the. monitor. The
data must be reduced and lots of time is absorbed.
F. BINCHARKS
As previously mentioned, the use of (7) benchmarks as a
tool was a primary means of evaluating the hardware and
softuare combinations of vendors competing for the SPLICE
project. A benchmark is the term implying a standard for
comparison or a point of reference for other products or
activities similar to the one chosen to serve as the
benchmark. Benchmarks in the computing and network sense
are programs or sets of programs used to represent a real
workload in operation on an existing computer system or a
workload planned to be in operation on an existing or
proposed system. Benchmarks are useful for validating or
verifying the results of other CPE tools. Benchmarks are
difficult to classify as measurement or predictive tools
because they have characteristics of both. They are
measurement in the sense that they reguire a system to
exist, and they are predictive in the sense that they are
used to estimate the future impact of a present decision.
[Ref. 14: p. 61
In this light benchmarks can be described as a strategic
tooi for determining if a system fits the established
oLjectives of the organization. However, benchmarks are
used to validate the impact of operational or procedural
changes as well as in procurement situations such as SPLICE.
Benchmarks have the advantages of thoroughness, of more
prediction than any of the other methods, and of encouraging
127
a common criteria or standards approach to performance
evaluation. They also have the disadvantages of high cost,
of being very time consuming activities, of the requirementfor portable software which can be taken off one system and
put onto another, of the requirement-that benchmarks must be
accurate representaticns of workload, and various external
factors. The external factors include the need for human
intervention, the occurrence of program bugs, and the
possibility of equipment failure during a run. (Ref. 14:
rpo 132-133]
Despite the efforts of FMSC and contractors to benchmark
the TANDEM systems, one author feels online systems do not
lend themselves well to benchmarking. Cortada states:
". . they are easiest to do with batch loads, butnealy impossible with online systems.,, [Ref. 39: pp.79-Go'J
It remains to be seen when the SPLICE LAN's are fully
operational if the online benchmarked SPLICE results were an
adequate estimate of real workload. Overhead is not anissue with this tool because any alleged overhead is
actually some aspect of the test workload benchmark itself.
G. SIMULATION
Another aid to Ferformance evaluators is actually atechnique rather than a tool. The technigue of (8)simulation does not require the existence of a system for
making direct measurements. Simulation uses logical models
"" of a system, concept, or operation to examine its behavior
over time. The purpose is to estimate what the measurements
would be if the simulated system were to be measured
directly. If the simulated system does exist, actual
measurements can be used to improve simulation models and
12a
Ja. - .
results. The models mentioned are programs executed on"host" computers which are computer systems other than the
-one being simulated which is the "target" system.
Simulations are used to obtain experimental data'for insight
into a system. Simulation is normally used in conjunction
with other CPE tools and techniques. Simulation is most
useful when the system is in the design phase, is not
installed, is not available, when other tools are not
available or cannot be used, and when analytical models are
insufficient. (Ref. 14: pp. 135. 136, 138, 140]
major advantages of simulation include that it can be
. used with large, complex, and difficult problems. It
enables management to make decisions easier by revealing
important elements of a problem along with alternative
solutions. It is a limited technique in that it is
expensive, time-consuming, and can result in misleading
results if the models are not validated thoroughly. In
these aspects it highly resembles benchmarking. Simulation
also introduces personnel problems since experienced
simulation personnel are creative and independent and evendifficult to manage in addition to the isolated "ivory
tower" image co-workers ascribe to them. (ef. 14: p. 140]
H. UCDBLING
The last tool to be discussed is (9) modeling. Modeling
is the creation and exercise of mathematical descriptions(models) of portions of the system as it should operate if
implemented. It is very similar to the simulation
definition minus the "over time". Analytical models aresets of matnematical equations whose independent variables(inputs) produce a single set of dependent variables(outputs). The main difference in the two is that analytic
models are deterministic where the same inputs will produce
129
repeatable outputs while a simulation is nondeterministic
and produces a range of results or outputs for any set of
inputs. modeling is definitely a predictive tool and is
often considered a subset of simulation. Modeling is,
however, a discipline in its own right, and the computer
field like others has its own specific modeling tools. In
CPE the tools are computer program packages that model
computer systems. There are also computer modeling
languages. Language tools are used when more detailed shorttime span problems are studied, and computer program package
tools are used when overall systems activities amounting up
to an hcur or more are under examination. (Ref. 14: p. 7].
Modeling has unique power and advantages. Analytical
modeling has proven to be very useful in analyzing online,
transaction-oriented systems difficult to analyze with
simulaticn or other analysis methods. This may be
economically effective for SPLICE use. It is particularly
useful for estimating where bottlenecks will occur in a
configuration. It provides an overall structure to guide a
CPE group logically from one problem area to another, and itprovides a deeper understanding of an entire system.
Furthermore, as opposed to being an instrument to assist in
problem solving like the other tools, modeling is a way of
directly solving a problem by allowing a total system or
part of a system to be examined before making a major
commitment to a system acquisition or modification.
[Ref. 14: pp. 7-8]
The real advantages of analytic models are that they can
generally be created in a short time, applied quickly, have
no programming language limitations, consume relatively
little computer tine, are easily understood, and areessential when it is too expensive, too time-consuming, or
too dangerous to experiment on the real system. There is no
overhead issue since a model does not require an existing
130
system. This measurement tool does not get in the way ofthe task.
Despite the positive features of analytic modeling,
there are some limitations. Pirst of all, modeling may not
be practical for studying a system which is notdeterministic and, hence, validation of the model against
actual measurements may be impossible. Secondly, when toomany changes must be made to the independent variables in
order to validate the model, perhaps the system is too
complex for modeling. Thirdly, whenever elaborate models
are created, a thorough knowledge of gueueing theory is
generally required unless a good commercial package that
handles this can be obtained. Lastly, specific networkmodeling tools are not yet generally available [Ref. 18: p.
81]. Do not confuse these with network systems analyzers.
Despite the limitations, however, IBM's Systems Management
Institute stresses use of analytic queueing models in
Chris Bailey writing for Electroni Des ign lagazine
asserts :
"The best. modeling approaches are based on a combinationof analytical and simulation technigues." [Ref. 26: p.206]
It might be of some interest that research in the use ofpetri nets for modeling systems which have events occurring
concurrently but with constraints on the concurrence,
precedence, or frequency of the occurrences and in the
performance evaluation of distributed systems are available.
Use of this modeling technique has shown some utility in
discovering overloads on a system, peak workloads, and
bottlenecks. [Ref. 66,: p. 223, 83]67
131
IST OF RIPFRENCES
1'. Naval S l Systems Command, k Point Logistics
2. Navy Fleet Material Support Office PESO Document No.F94L0001-9260 :D-S01B, jLICE FunctionalILert , March 14, 1983.
3. Automatic Data Processinq Selection Office, ContractNo. N66032-84;-D-0.002• , I _ Co _to ____ a __a
CoQgr , November 17--i9 3. - de D
4. Automatic Data Processing Selectin .Office, ContractNo. N66032-82-0007, " .- 5-011-9-ciat ion DocumentA Proigj~ect 80-8 ., Marc Docu--. -
5. Navy Fleet &Wterial Support Office, FSO Document No.F94L0-O01-92 0 SS-SU01C, SPLICZ Ugtm Secification,January 16, 1984.
6. Naval Supply Systems Command NAVSUP) SPLICEStrategic Plannj n_ Pocument, by RVSUP (6ode SPL7ICFPICE --Po~e-f fice, oVctob5er 1, 1984.
7. Hadford K .0 Mtff ian A I 9 BAk.ti aIk-- d fieston uPulis ing C0. .•In.• 1
8. Katzan, H. j ._,_§ Guide j o CarnegiePress, Inc., 19 3.
9. Ferrari, D., Serazzi G and Zeigner A., MeasurementnoTning ofc§iG y's t,13M. __ o& C u n_.t.s, Fren ice-H-a-II7=n
10. Borovits, I. and Neumann, S., oputeN S.temsjg.r.j..m.nce Evamat*; .q u .t~t _.!riN";'.'QU: Crtr 1,es9 eeise e_ a e_ a n doss,-Lexingfton oos, S.
11. Machlin R N. "Managing a Local Area Network",T!IECOMAUNICATIE, v. 18, no. 11, November 1984.
12. Fitzpatricx, H. "A Cure for Trial-and-Error NetworkManagement", Tgjt&OMMUNATIONS, January 1985.
13. Stal.ings, W,. _"lf QiN Aa Lno dc ion,Macmillan Publishing 0oa;any, 1V'.
132
14. Morris M. F. and Roth P. F., r Pe o nce
15. Abrams° • M. D, "A New Approach to PerformanceEvaluaLion of Couputer Networks" Compater Networkin,edited by R. P. Blanc and I. W. Cotton ro I"E -Pte,1976.
16. HolbbD., $"Neasuring Systems Performance", Auerbach
e s 80 P rocessing _Aanement, No. 5=---UTa
17. Amer, P. D. and Goel A. K., "Performance Metrics forBus and Token-Ring Local Area Networks, Journ ofTelecomunicatigns Networks, v. 2, no. 2, 19 .
18. Terplan, K., "Network Capacity Planning", Journal ofCapacity Managesent, v. 2, no. 1, 1983.
19. Rcsner, R. D ; gwitcbinci TomorrowsCommungcations TO,, i1. pp., -- et ie- LearningPublications, avision cf Wadsworth, Inc., 1982.
20. Fleet Material Support Office, Report No. NPS54-82-003, FunctionalDesin of a o al Area Networkfor t - tt 35 oqjsjls- - -_ l -Communications nvlronment, by . Schne-dewind oNaval Postgraduate ScWooI, December 1982.
21. Rajaraman, M. K., "Performance Measures for a LocalNetwork", Performance vauation Rvievw, v. 12, no. 2,Spring-Summer 1NU4 ,°
22. Clark D. f., Poqran K. T., and Reed, D. P., "AnIntroduction tc Local Area Networks", Tuoral onL-QQ1 Cmitr Networks, CQAjPCK F.All d 5Ji nurr and H. k. freman -f-nstitute oElectrical and Electronics Engineers (IEEE), November1978.
23. Frank, H "Broadband versus Baseband Local areaNetworks", jEE ZONQIjLCAZIONS, v. 17, no. 3, March1983.
24. Way, D E. "Managinq a LAN", TELECOMMUNICATIONS, v.18, no: 1, anuary 1984.
,..*-25. Kee, K. C. E. lntF- to 1ica U%4 _ompter etworks&,John Wiley & Sons,Inc., i*
.9,
26. Bailey, Chris, "Special Series on System Integration",*p" Le jroi Des1Q , May 12, 1983.
1.
L
~133
27. Watson, W. B., "Configuration-Dependent Performance ofa Prioritized CSM& Broadcast Network", COMPUTE, v.14, no. 2, February 1981.
28. Franta N R. and Chlamtac, I., Local Networks.Lexington Books, D. C. Heath and Co., 1I-- -
29. Abrams i D., "Observations on Operating a Local AreaNetworkf", CMPUTER, May 1985.
30. Dhas, C. R. and Konangi V. K., "PerformanceParameters for a Packet. Switched Network", U 1985Phoenix Confege n m a Qu Cm_.mun--4tions,M arch 0-27 5 .
31. Abrams, M. D. and Treu, S.,. "A Methodology forInteractive Com puter Service Measurement",CommunigAlions of the AC.M, v. 20, no. 12, December1977. -
32. National Bureau of Standards Technical Note 882,Crtria for the .ecrman Evaiaton. of DataLo zncatohs 3Zvices Ior com_ uLtejNYFUks , bY-1-GbUUIDE ana. ton,-Septemoer 175.
33. Wiigins . "Intelligent Networking",
TELWCoNsAUNICATIOM, v. 17, no. 1, January 1983.
34. Keifer, ., "Network Nana ement". TE __4UNICATIONS,v. 18, no. 1, January 196.
35. Grubb D. S. and Cotton I. W., "Rating Perfcrmance",Camutr Networks: A lutorial, 3rd. edition, editdbd. D. Abraas, B. P. BI 7nd I. W. Cotton, 1980.
36. Sussenguth, E. H., "Progress in Computer Networks",Irformation Prjcessing '83, edited by R. E. A. 4asonzo Pro d1 o tK- IFIP 9th World ComputerCongress (Paris, France), September 1983.
37. Johnson, J I., "Universal Flow and Capacity IndexGives Picture of Network Efficiency", DATACOMMU!;fCATIONS, February 1985.
38. Schneidewind, N. F "Internetconnecting LocalNetworks to Long-Ditance Networks", CCMPUTER,September 1983.
39. Cortada, J. W., Maja ji DE Hardae: Capacit*Planniag, Cost Justifica on, ~a11_ aLi, i tnergxeasurement, JoKnn w1ey Z ons, T n I.
40. Hopewell,L., "Management Planning in the Dataom nca ns Environment", AFS Conference
Proceedings of Natioaal goper 9gnlence v-3
134
41. Allen, A. 0., "Capacity Planning for Management",Pro ns of the 1983 Coputer 3easuremetn Group
Interaionat ionerenEce Dec- e- --6--9-- -3--
42. Leach, 3. R., "Installation and Management of a ModernC communications Network", Proceedin s of the 1982Computer leasurement Gru r A -rz inal--on-re_e,
43. Buzin J. P. "Use of Models for Capacity Planning"Computr Performance Evaluation users Group (CEUG}T4TA. Meetn ediied W -e--aEreeTor U. 3.Z-e-rtmin f5- Ccmmerce, lational Bureau of Standards,October 1978.
44. Mohr, J. M., "Projecting Workloads for New Systems: AManagement Introduction", Journal of CapacityManagement, v. 2, no. 1984.
45. Tandem Computers Incorporated, Tandem Nonstop (T)Systems XJA_[ gser's Manual, December ITU3.-
46. Tandem Computers Incorporated, Part No. 82003 COO,Inroducton to Tanj oSy ste , December 1983.
47. Datapro Research Corporation, Report No. M11-822-101,Tandem Nonsto Ssm September 1983.
48. Tandem Computers Incorporated, Report No. 109001-0983,Tande Aoato Sfistem, 3a:wkeArchitecture,
49. Tandem Colputers Incorpcrated, Part No. 82373 AOO,Utroductlon to the Tandem .100 CcmmunicationsSusysteNm,-Dec eizer-1*983.
50. Tandem Computers Incorpcrated, Part No. 82311 BOO,Introguction L. Tandem at Communio tgns, December
51. Abdou, E., "Performance Analysis of Front-End and HostProcessor Interface Configurations", Pe r.aune ofComputer Instalations, edited by D. Ferrari, UPS.
52. Carson, J. H. and Forman, E. H. "Analysis of LocalArea Network Performance", iE 1981 Compute rNetworking, 1981.
53. Thornton J E "Overview oi HYPERchannel", COmPCONURING '79 bisi 2 Papers, March 1979.
54. Franta, W. R. and Heath, J. R., "Measurement andAnalysis of HYPERchannel Networks lNga NSLJ AMPUTZ, v. C-33, no. 3, Marc-
135
*55. ThorntonJ. E. and Christensen, G. s. "HYPP.RchannelNetwork inks". COMPUZIE , September 19M~.
56. Conservation with Mr. M~rs MHiller of Naval SupplyCenter (NSC), Oakland; California on July 1, 1985.
57. Tel.ihone conversation with rs Dottie Rogers of.4 Nava Spl Center (NSC), Oaksland Caiona o'1September 16 85.alfrnao
58. Telephone conversation with Mr. Bruce Alchorn of NavalSUPWl Center (NSC) * Oakland, California on September
9,95.
59. Auppe; 1.. E. If. "erit's Evolution--StatisticallySpeaking",* 1M RANSCI Qj CO!PUER§ v. C-32,no. 10, Octo er 198l3.
60. Pawlita, P. Pf. "Traffic measurements in DataNetwor~s, Recent Measurements Results and SomeImplicatlons", IEEE ZEANSACTIMN U. =1UI&TOS v.CC 29, no. 4, ,Aprl T99WT?
61. Defense Communications Agency, P-efense RAta Network
62. Naval Telecomunications Command Letter 2070: Ser.N5/7639 to Chief of Naval operations, Sub~ ect:Defense Dat Network (p)d_4I~er Esjgg. July 5,
63. VonTaube B "Interne vorkinq: Connecting LAN's",
TIELECOM1H5 NICAHICNS, v. 18, no. 10, 1984..
64. Defense Communications Agency, D2egensiq &t p j~tvq~
65. Opel C. E., Network Managaemnt 4~ SPICE. ComiteINetwvork, HS Thssavalt2 r~ae5hoL'Monteirey. Califcrnia, December 1982.
66. Peterson, J. L "Petri Nets", goptn Urvey, v.9, no. 3, Septernter 1977.
67. Han, V " Performance Evaluation with Petri Nets"1
MDe partme Tox Cmmerce, National Bureau of Standards,October 1978.
136
INITIAL DISTRIBUTION LIST
No. Copies
1. Defense Technical Information Center 2Cameron StatiqnAlexandria, Virginia 22304-6145
2. Sauperintendent 2Ittn: Library Code 01'2Naval Postgrauate SchoolMonterey, California 93943-5100
3. Computer Technology Programs, Code 37Naval Postgraduate SchoolMonterey, California 93943-5100
4. Erofessor Ncrman F. SchneidewindCode 54SsAdministrative Sciences DepartmentNaval Postqraduate SchoolMonterey, California 93943-5100
5. LCDR Barry A. FrewCode 54FWAdministrative Sciences DepartmentNaval Postqraduate SchoolMonterey, California 93943-5100
6. CcmmanderNaval Supply Systems CommandAttn: CDR ana fuller, SC, USN (SUP 043)Washington, DC 20376
7. Commandin q OfficerNavy Fleet Material Support OfficeAttn: LCDh Ron Nichols, SC, USN (Code 9RL)5450 Carlisle Pikef. 0. Box 2010
echanicsburg, Pennsylvania 17055-0787
8. rirectorCefense Communications Agency8th & South Courthouse RoadsWashington, DC 20305
9. Commanding OfficerNavy Ships Parts Control Center
0. ox. 2020Kechanicsburg, Pennsylvania 17055
. 10. Commanding OfficerNaval Supply Ce ntgrOakland, Callifornia 94625
11. ICDE David D. Blankenship, USN*. Computer Technology Programs, Code 371
Naval Postgraduate ScnoolMonterey, California 93943-5100
137
12. ICDR Jonathan B. Schmidt, USIExecutive OfficerUSS O*CALLAHAN (IF 105 19zPO San Francisco, Calitornia 96674
13. ICDR Stephen K. Carr, SC, USKNavy Management Systems Support OfficeNaval Air $tatignNorfolk, Virginia 23511-6694
14. CommanderNaval SupplIy Systems Commandhttn; CDR arden Goss, SC, USK (SUP 0472)lashington, DC 20376
15. CcamanderNaval Supply Systems Commandattn: Ms. Linda Hatthews (SUP 0451)Washington, DC 20376