1 23 Food Security The Science, Sociology and Economics of Food Production and Access to Food ISSN 1876-4517 Food Sec. DOI 10.1007/s12571-012-0173-4 The socioeconomics of food crop production and climate change vulnerability: a global scale quantitative analysis of how grain crops are sensitive to drought Elisabeth Simelton, Evan D. G. Fraser, Mette Termansen, Tim G. Benton, Simon N. Gosling, Andrew South, Nigel W. Arnell, Andrew J. Challinor, et al.
Transcript
1 23
Food SecurityThe Science, Sociology and Economicsof Food Production and Access to Food ISSN 1876-4517 Food Sec.DOI 10.1007/s12571-012-0173-4
The socioeconomics of food crop productionand climate change vulnerability: a globalscale quantitative analysis of how graincrops are sensitive to drought
Elisabeth Simelton, Evan D. G. Fraser,Mette Termansen, Tim G. Benton,Simon N. Gosling, Andrew South, NigelW. Arnell, Andrew J. Challinor, et al.
1 23
Your article is protected by copyright and
all rights are held exclusively by Springer
Science + Business Media B.V. & International
Society for Plant Pathology. This e-offprint is
for personal use only and shall not be self-
archived in electronic repositories. If you
wish to self-archive your work, please use the
accepted author’s version for posting to your
own website or your institution’s repository.
You may further deposit the accepted author’s
version on a funder’s repository at a funder’s
request, provided it is not made publicly
available until 12 months after publication.
ORIGINAL PAPER
The socioeconomics of food crop production and climatechange vulnerability: a global scale quantitative analysisof how grain crops are sensitive to drought
Elisabeth Simelton & Evan D. G. Fraser &
Mette Termansen & Tim G. Benton & Simon N. Gosling &
Andrew South & Nigel W. Arnell & Andrew J. Challinor &
Andrew J. Dougill & Piers M. Forster
Received: 25 June 2011 /Accepted: 14 February 2012# Springer Science+Business Media B.V. & International Society for Plant Pathology 2012
Abstract Many studies warn that climate change may un-dermine global food security. Much work on this topicfocuses on modelling crop-weather interactions but thesemodels do not generally account for the ways in whichsocio-economic factors influence how harvests are affectedby weather. To address this gap, this paper uses a quantita-tive harvest vulnerability index based on annual soil mois-ture and grain production data as the dependent variable in aLinear Mixed Effects model with national scale socio-economic data as independent variables for the period1990–2005. Results show that rice, wheat and maize
production in middle income countries were especially vul-nerable to droughts. By contrast, harvests in countries withhigher investments in agriculture (e.g. higher amounts offertilizer use) were less vulnerable to drought. In terms ofdifferences between the world’s major grain crops, fac-tors that made rice and wheat crops vulnerable todrought were quite consistent, while those of maize cropsvaried considerably depending on the type of region. This islikely due to the fact that maize is produced under verydifferent conditions worldwide. One recommendation forreducing drought vulnerability risks is coordinated
Electronic supplementary material The online version of this article(doi:10.1007/s12571-012-0173-4) contains supplementary material,which is available to authorized users.
E. Simelton (*) : E. D. G. Fraser :M. Termansen :A. J. DougillSchool of Earth and Environment, University of Leeds,Leeds, UK LS2 9JTe-mail: [email protected]
E. SimeltonWorld Agroforestry Centre (ICRAF),Ha Noi, Viet Nam
E. D. G. FraserDepartment of Geography, College of Human and Applied SocialSciences, University of Guelph,Guelph, ON, Canada
M. TermansenDepartment of Environmental Science, University of Aarhus,Roskilde, Denmark
T. G. BentonFaculty of Biological Sciences, University of Leeds,Leeds, UK
S. N. GoslingSchool of Geography, University of Nottingham,Nottingham, UK
A. SouthCentre for Environment, Fisheries & Aquaculture Science,Dorset, UK
N. W. ArnellWalker Institute, Department of Meteorology,University of Reading,Reading, UK
A. J. Challinor : P. M. ForsterInstitute for Climate and Atmospheric Science, School of Earthand Environment, University of Leeds,Leeds, UK
According to a range of policy and scientific figures, globalfood security is challenged by many factors includingpopulation growth, water scarcity, increased demand forlivestock products and high energy costs, as well asclimate change. These challenges represent a “perfectstorm” of problems (Beddington 2009) which can beexpected to trigger public unrest and international conflictunless food production is boosted by approximately70% by 2050 (UK Government 2011). Of particularconcern on a global scale is the effect that climatechange may have. While estimates vary, most crop andclimate modellers agree that climate change will reduceglobal cereal production due to a combination of heatand water stress caused by higher temperatures andlonger droughts.
While these projections suggest that farmers will facesignificant environmental constraints, much can be learntfrom the way that large-scale droughts affected harvests inthe recent past (Mishra and Singh 2010). In particular, alarge body of work demonstrates how the socio-economiccontext of farming can have huge effects on farmers’ capac-ity to maintain harvests in years with climatic stress (IPCC2007; Ericksen et al. 2011). For instance, Fraser (2007)showed that social, institutional and agro-ecological factorscan make food systems vulnerable to even small droughts.Similarly, other studies specifically demonstrate how insti-tutional factors can promote or undermine farming systemsthat are resilient to environmental challenges (Devereux2009; Fraser and Stringer 2009). For example, the work ofPatt and Gwata (2002) showed that when farmers in ruralAfrica attended workshops with weather forecasters theywere better able to maintain harvests during droughts thanfarmers who had not been to these workshops.
There is a challenge, however, in that most of theresearch that has explored how socio-economic factorshelp (or inhibit) whether farmers can adapt to droughtstends to be small scale, authored by social scientists,and qualitative. This contrasts with the large scale,usually quantitative and natural science based modellingwork that shows global food security is threatened (e.g.Foley et al. 2011). As a result, a range of scientists aretrying to bridge the gap between the natural-sciencedominated work on the impact of climate change on
crop growth, and the social-science dominated work thatlooks at socio-economic barriers to farmer adaptation.
This interdisciplinary research agenda is illustrated by arecent study published by Challinor et al. (2010) where acrop model was used to simulate the effect of climatechange on north east China’s wheat production under dif-ferent adaptation scenarios. Under “no adaptation”, climatechange was projected to cause between 20 and 30% of thewheat crops to “fail” over the 21st century. However, whenthe socio-economic parameters of the model were changedto simulate different farm management scenarios, they dis-covered that the effect of climate change dropped dramati-cally. This exercise was an important step towards moreinsightful inclusions of socio-economic conditions in larger-scale crop-modelling. However, much remains unknownabout what socio-economic conditions might lead to differentharvest outcomes.
The need for more quantitative analysis on the contextualfactors that make harvests vulnerable to climate change isalso demonstrated by recent studies that use a mixture ofsocio-economic and environmental variables to “map vul-nerability”, thereby attempting to identify where food pro-duction (or other aspects of food security and sustainablelivelihoods) is vulnerable to climate change. A brief sampleof this body of work includes Pandey et al. (2011) who builtan adaptive capacity index using a series of socio-economicvariables to evaluate water resource system vulnerability inNepal. Gbetibouo and Ringler (2009) developed a sub-national vulnerability framework to explore climate vul-nerability in South Africa. The report of Ericksen et al.(2011) is probably the most ambitious of these studies:this team of researchers used a large number of datasets and a huge range of indicators to present a numberof vulnerability maps for the global tropics. In each ofthe studies just cited, factors such as GDP, rural popu-lation density and access to water were included invulnerability assessments. However, in each of thesepieces of research, the relation between these variablesand vulnerability is assumed to be constant regardless ofthe social, ecological or political contexts.
The purpose of this paper, therefore, is to help contributeto our understanding of how socio-economic factors andclimatic conditions interact to create vulnerability. In partic-ular, we analyse global data sets to identify what socio-economic factors are significant in making cereal crop pro-duction vulnerable to drought. Ultimately, our goal is toprovide preliminary answers to three questions: (1) Wherein the globe is cereal production most vulnerable todrought? (2) What are some of the underlying socio-economic conditions that make harvests vulnerable todrought? (3) What implications might these results havefor policies aiming to enhance adaptive capacity in orderto ensure food security?
E. Simelton et al.
Author's personal copy
Methods
Background and approach
In terms of our broad methodological approach, our defini-tion of vulnerability builds on work by Fraser (2007) andFraser et al. (2011), which proposes that the vulnerability ofan agricultural system to adverse weather can be observedwhen relatively small weather anomalies have dispropor-tionately large impacts on crop production. One reason forthis may be that underlying socio-economic factors couldhave inhibited adaptation. Such “vulnerable” cases may becontrasted with situations where large weather anomaliesseem to have caused little production loss. In these cases,Fraser et al. (2011) hypothesize that underlying socio-economic factors may have enhanced adaptive strategies,therefore, buffering harvests from the effects of adverseweather. This definition and approach relates to the earlierwork of the IPCC (2001) that defines vulnerability as afunction of exposure, impact and adaptive capacity but takesa step forward from the IPCC’s definition by using data toidentify and quantify the way that the socio-economic con-text of farming may either enhance or reduce adaptivecapacity (thereby affecting overall vulnerability).
To operationalize this approach to vulnerability, we be-gan by using global data sets to (1) identify regions in theworld that have been exposed to drought over the past20 years; (2) identify which of these regions had poorharvests and which had abundant harvests during thesedroughts; (3) combine step 1 and 2 to quantify vulnerability:where low vulnerability cases are defined as those areas thathad good harvests despite having major droughts and highvulnerability cases are those where harvests were low despitethere only being minor droughts; (4) use statistical analysis todetermine what socio-economic factors were significant inexplaining trends in vulnerability.
In conducting these steps, we built on the foundation laidby Brooks et al. (2005) who used statistical methods toidentify national indicators of climate vulnerability.However, in this research, we employed a well establishedmethodological framework that has already been used toidentify the characteristics of vulnerability in case studies thatwere on a much smaller scale in Ghana (Antwi-Agyei et al.2011); Ethiopia (Fraser 2007) and China (Fraser et al. 2008and Simelton et al. 2009). These studies concluded that farminputs and variables, representing land, labour or capital,were associated with vulnerability to drought (Fraser etal. 2008; Simelton et al. 2009).
For the purpose of the current paper, two furthermethodological advances have been made to this body ofwork. First, the drought index is based on soil moisture insteadof rainfall to account for the capacity of soils to buffervariation in rainfall. Secondly, linear mixed-effects models are
used to describe crop-drought vulnerability on a national scaleas a function of specific socio-economic conditions. In ouropinion, this is a considerable advance as it accounts fordifferent agro-ecological zones, types of governance and in-come levels. While analyses at this scale are by necessitycrude, this work provides important steps towards understand-ing how combined socio-economic and environmentalchanges influence food production.
The paper proceeds by first outlining the available data(Background and approach), then justifying the methodsand describing the methodological steps undertaken to derivethe vulnerability index (Data and data preparation) and thenoutlines the data analysis procedures (Method for calculatingthe vulnerability index).
Data and data preparation
Soil moisture data
In the hydrological literature, there are dozens of indicesproposed for estimating drought (e.g. Mishra and Singh2010). For this study, the choice of a drought index wasgoverned by our need for data that was global, countryscale, and had annual resolution. Furthermore, while pub-lished hydrological and vulnerability studies in the pastoften use rainfall data (e.g. Fraser et al. 2008; Simelton etal. 2009; Lobell and Field 2007), it was decided that for thisstudy, soil moisture would be more appropriate as itaccounts for rainfall, soil moisture storage and to someextent temperature (Mishra and Singh 2010).
Monthly soil moisture data was obtained from an estab-lished global hydrological model, Mac-PDM.09 (Arnell1999; Gosling and Arnell 2011; Gosling et al. 2010). Mac-PDM.09 was driven with 0.5°×0.5°gridded monthly CRUTS3 meteorological inputs for the period 1989/90 to 2004/05. A gridded map of the earth’s landmass was used to selectonly those grid cells that had >1% of the land base devotedto producing rice, wheat or corn (Leff et al. 2004). At first, a10%-limit was used but this resulted in many countriesappearing with no agricultural land. The 1%-limit thusrepresents both intensively cultivated regions and moreextensively cultivated areas.
For each selected grid cell, the soil moisture was accu-mulated for a growing period from October of one yearthrough to October the following year. These griddedtime-series were then averaged to one national time-series(see Drought Index below) to match the national levelharvest data. The selection of the October to October periodis crude but was deliberately chosen for three reasons. First,results from Lobell and Field (2007) demonstrate thatempirical/statistical model results were insensitive tochoice of growing season months. More specifically,Lobell and Field ultimately defined a `global growing
Socioeconomics of grain crops vulnerability to drought
Author's personal copy
season' for each crop based on the continuous monthswithin the growing seasons for the major growingregions, using the same landuse data as was used inour study (Leff et al. 2004). Furthermore, we tested anumber of different combinations of months to calculatesoil moisture but found that this had little effect on theoverall results (thus confirming Lobell and Fields’ workthat showed their results were insensitive to the selection ofgrowing season months). Secondly, there is a significantdisagreement in the literature on the most relevant timeperiod for assessing drought with different studies recom-mending different lengths of drought-periods. For example,soil moisture fluctuates so much in tropical areas that droughtsmay emerge and dissipate in less than six months, whiledroughts may take over twelve months to emerge in parts ofsemi-arid Sub-Saharan Africa and in high northern latitudes(Erigayama et al. 2009). Third, working with national annualharvest data makes it impossible to account for doublecropping, hence, the period October to October was chosen torepresent a uniform growing season that captures bothnorthern and southern growing seasons in one calculationand to ensure that only the long lasting droughts werecaptured (hence our approach was conservative from amethodological perspective).
With regards to the use of simulated versus observed soilmoisture, while there are a number of regional datasets ofobserved soil moisture (e.g. Hollinger and Isard 1994), thereis no spatially coherent global observation database of soilmoisture that covers a long (several years) historic period atannual or monthly resolution. Although monitoring fromsatellites allows for large spatial coverage, data collectedin this way only captures soil water storage that is limited tothe uppermost soil layer and to areas free of densevegetation cover (Wagner et al. 2003). It is often arguedthat these limitations have hampered efforts to improvephysical representation of soil moisture in global hydro-logical models (Nijssen et al. 2001). To this end, weused soil moisture simulations from a global hydrolog-ical model and must note that these results have not beenvalidated. However, the hydrological response of the modelhas been validated and it has been shown that it simulates wellthe global pattern of runoff (Gosling and Arnell 2011).Moreover, a recent global hydrological model inter-comparison exercise (Haddeland et al. 2011) showed thatthe model applied here performs as well as other globalhydrological models in terms of simulating runoff,snowfall, and potential evapotranspiration at the globalscale (the analysis did not cover soil moisture).Therefore, while lack of data availability has precludedvalidation of simulated soil moisture, the model doessimulate the global hydrological cycle robustly. So, and incommon with other recent assessments that have required soilmoisture data for exploring droughts at the global scale, this
analysis applied soil moisture from a global hydrologi-cal model (Corzo Perez et al. 2011; Sheffield et al.2009).
Crop production data
National level crop production data was obtained for rice,wheat and maize harvests from the United Nations Food andAgriculture Organization’s FAOSTAT online database (FAO2008) for each year between 1986 and 2005.
Socio-economic data
To analyse the socio-economic factors that explain droughtimpacts on harvests the following data were used:
(1) To test hypotheses that access to farm inputs explainstrends in harvest vulnerability, national socio-economicdata was downloaded from a number of onlinedatabases (EarthTrends 2008; FAO 2008; TheWorld Bank Group 2008). Six continuous variableswere selected to represent access to land, labour,and capital based farm inputs (see Table 1). Ascrop specific annual irrigation data are not avail-able we did not include this variable. Similarly,incomplete time series and comparatively slow-moving indicators were excluded, such as educa-tion, Gini-coefficient, and investment in agriculturalresearch.
(2) Each country was grouped based on its average income,type of governance and key agro-environmentalzone. Each of these three indicators has four levels.The income groupings follow the World Bank’sclassification of average GDP per capita in 2008:low income, lower middle income, upper middle,or high income (World Bank 2009). Governancecategories were taken from the Economist IntelligenceUnit’s 2008 assessment that divides countries intoauthoritarian regimes, hybrid regimes, flawed democra-cies or full democracies (The Economist 2009).Finally, countries were categorized as belonging toone of Köppen’s climate zones (Kottek et al. 2006)based on whether the largest share of the croplandarea fell into tropical, arid, temperate or cold cli-mate conditions. (Note: the choice of using the Köppenclassification system was deliberate because thisclassification is still used as a basis for spatial aggrega-tion in hydrological modelling (e.g. Haddeland et al.2011) and observation studies (e.g. McMahon et al.2007). As the simulated global soil moisture data in ouranalysis was from a global hydrological model, we de-cided to use the same baseline data that is most commonin this field of scholarship.)
E. Simelton et al.
Author's personal copy
Data quality and data preparation
The lack of complete high quality socio-economic time-seriesdata is well acknowledged in the literature. The UnitedNations databases are the only ones available that have time-series data of agricultural and socio-economic indicators.However, data quality varies as countries may use differentapproaches for compiling and reporting data (Hafner 2003;Rudel et al. 2009). These limitations influenced the selectionof variables. For instance, only data from the past 16 years wasused because the data quality for many developing countries isassumed to have improved over time, and with many newstates emerging around 1990 this period marks a new era.Hence, analysing older data may not contribute further to theunderstanding of current vulnerability. However, the numberof meteorological stations included in the CRU-data setdeclined after the 1980s, which is a particular limitation foranalysis of sub-Saharan Africa where stations are alreadysparsely distributed (Conway et al. 2009). In addition, theinvestigated period is limited to years before 2005 due toavailable climate data (for more details see “Explaining thevulnerability of crops to drought”).
Even by restricting the analysis to 16 years, datasets stillhad occasional missing values. These were replaced usingspline interpolation procedure in R statistical software,whereby a locally weighted regression produces a smoothshape in the vicinity of the missing data and the missing
value is estimated from this function (Crawley 2007). Datapoints that were missing from either the beginning or end ofthe time series were replaced by linear back-/forecastedvalues when fewer than four years were missing and nomore than one extrapolated data point exceeded the ob-served data range.
All variables were log-transformed to reduce heterosce-dasticy and the influence of extreme values.
Method for calculating the vulnerability index
To bring these data together and evaluate how differentsocio-economic factors affect the vulnerability of cerealcrops to drought, we followed an approach developed pre-viously to analyse the relationship between food securityand drought (Fraser 2007; Fraser et al. 2008; Simelton et al.2009). Briefly, this work defines climate vulnerability asarising when food production, is (1) exposed to changingclimatic conditions; (2) limited in its ability to adapt to theseconditions; and (3) sensitive to these changes (IPCC 2001).Building on this approach, the study presented here con-ceptualises vulnerability in terms of “exposure to climaticevents”, measured in this paper as drought severity (theDrought Index, DI), versus the “impact of the drought”,measured in terms of crop production losses (the CropFailure Index, CFI). Cases where relatively severe droughtsare not associated with significant crop losses are considered
Table 1 Explanatory variables used in the linear mixed-effects models for vulnerability to drought
a The Economist 2009, b Kottek et al. 2006, cWorld Bank 2009, d EarthTrends 2008, e FAO 2008, f The World Bank Group 2008
Socioeconomics of grain crops vulnerability to drought
Author's personal copy
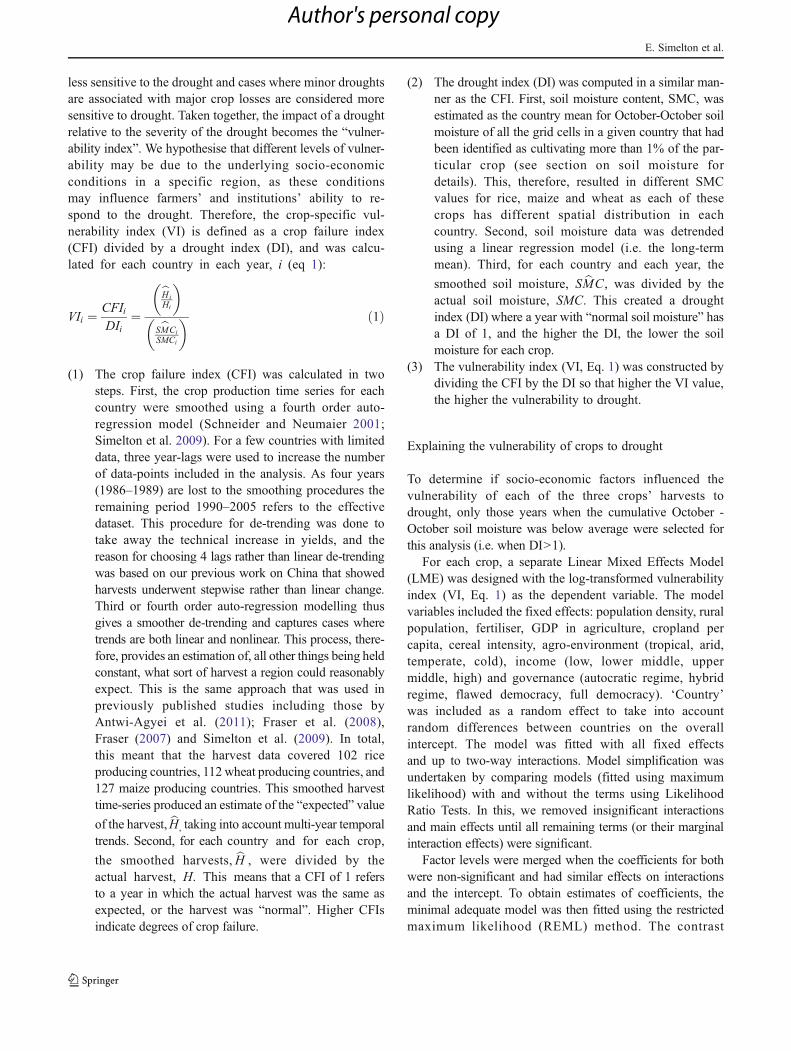
less sensitive to the drought and cases where minor droughtsare associated with major crop losses are considered moresensitive to drought. Taken together, the impact of a droughtrelative to the severity of the drought becomes the “vulner-ability index”. We hypothesise that different levels of vulner-ability may be due to the underlying socio-economicconditions in a specific region, as these conditionsmay influence farmers’ and institutions’ ability to re-spond to the drought. Therefore, the crop-specific vul-nerability index (VI) is defined as a crop failure index(CFI) divided by a drought index (DI), and was calcu-lated for each country in each year, i (eq 1):
VIi ¼ CFIiDIi
¼bHiHi
� �
SbMCiSMCi
� � ð1Þ
(1) The crop failure index (CFI) was calculated in twosteps. First, the crop production time series for eachcountry were smoothed using a fourth order auto-regression model (Schneider and Neumaier 2001;Simelton et al. 2009). For a few countries with limiteddata, three year-lags were used to increase the numberof data-points included in the analysis. As four years(1986–1989) are lost to the smoothing procedures theremaining period 1990–2005 refers to the effectivedataset. This procedure for de-trending was done totake away the technical increase in yields, and thereason for choosing 4 lags rather than linear de-trendingwas based on our previous work on China that showedharvests underwent stepwise rather than linear change.Third or fourth order auto-regression modelling thusgives a smoother de-trending and captures cases wheretrends are both linear and nonlinear. This process, there-fore, provides an estimation of, all other things being heldconstant, what sort of harvest a region could reasonablyexpect. This is the same approach that was used inpreviously published studies including those byAntwi-Agyei et al. (2011); Fraser et al. (2008),Fraser (2007) and Simelton et al. (2009). In total,this meant that the harvest data covered 102 riceproducing countries, 112 wheat producing countries, and127 maize producing countries. This smoothed harvesttime-series produced an estimate of the “expected” value
of the harvest, bH, taking into account multi-year temporaltrends. Second, for each country and for each crop,
the smoothed harvests, bH , were divided by theactual harvest, H. This means that a CFI of 1 refersto a year in which the actual harvest was the same asexpected, or the harvest was “normal”. Higher CFIsindicate degrees of crop failure.
(2) The drought index (DI) was computed in a similar man-ner as the CFI. First, soil moisture content, SMC, wasestimated as the country mean for October-October soilmoisture of all the grid cells in a given country that hadbeen identified as cultivating more than 1% of the par-ticular crop (see section on soil moisture fordetails). This, therefore, resulted in different SMCvalues for rice, maize and wheat as each of thesecrops has different spatial distribution in eachcountry. Second, soil moisture data was detrendedusing a linear regression model (i.e. the long-termmean). Third, for each country and each year, the
smoothed soil moisture, S bMC, was divided by theactual soil moisture, SMC. This created a droughtindex (DI) where a year with “normal soil moisture” hasa DI of 1, and the higher the DI, the lower the soilmoisture for each crop.
(3) The vulnerability index (VI, Eq. 1) was constructed bydividing the CFI by the DI so that higher the VI value,the higher the vulnerability to drought.
Explaining the vulnerability of crops to drought
To determine if socio-economic factors influenced thevulnerability of each of the three crops’ harvests todrought, only those years when the cumulative October -October soil moisture was below average were selected forthis analysis (i.e. when DI>1).
For each crop, a separate Linear Mixed Effects Model(LME) was designed with the log-transformed vulnerabilityindex (VI, Eq. 1) as the dependent variable. The modelvariables included the fixed effects: population density, ruralpopulation, fertiliser, GDP in agriculture, cropland percapita, cereal intensity, agro-environment (tropical, arid,temperate, cold), income (low, lower middle, uppermiddle, high) and governance (autocratic regime, hybridregime, flawed democracy, full democracy). ‘Country’was included as a random effect to take into accountrandom differences between countries on the overallintercept. The model was fitted with all fixed effectsand up to two-way interactions. Model simplification wasundertaken by comparing models (fitted using maximumlikelihood) with and without the terms using LikelihoodRatio Tests. In this, we removed insignificant interactionsand main effects until all remaining terms (or their marginalinteraction effects) were significant.
Factor levels were merged when the coefficients for bothwere non-significant and had similar effects on interactionsand the intercept. To obtain estimates of coefficients, theminimal adequate model was then fitted using the restrictedmaximum likelihood (REML) method. The contrast
E. Simelton et al.
Author's personal copy
coefficients for each factor and group interactions add up tozero. The models were tested for heteroscedasticy.Autocorrelation in residuals was not considered a problemas only the years with DI>1 were used, hence the time seriesare incomplete. ‘Year’ was included as a factor but was non-significant for each of the crops. Statistical analyses andmapping were carried out in R using the “LME” and “rworld-map” packages.
Limitations of the study
Global-scale analyses, such as that conducted here, areinevitably undertaken within the constraints and limita-tions of available global climate, agricultural and socio-economic data. These data pose serious challenges on thenature of the analysis and the robustness of the results.Nevertheless, while these limitations must be acknowledged,this type of work is still worth undertaking. Other academicsseem similarly inspired to use existing datasets and see whatcan be learned from them (e.g. see Nelson et al. 2010 andHazell and Wood 2007). This is particularly an issue whendealing with data from developing countries. For exam-ple, sometimes there are gaps in the climate time series,or the time series may be short in length. To someextent, the Regional Workshop Programme run by theWMO Global Climate Observing System (GCOS) isseeking to address this for climate data. However, thisshould not preclude any type of analysis that requiresdata at the global-scale. As a result, in our analysis, weconsistently used the highest quality data that was avail-able. For instance, in terms of climate data, we appliedthe CRU-TS3 gridded observational dataset. This has beenwidely used in previous climate-impact assessments (Xu et al.2010; Gosling and Arnell 2011; Thorne 2011). However, wedo acknowledge that the relationships we define are con-tingent upon the reliability of the data.
In addition to the general issue posed by data quality,there are three specific limitations of this study.
1. This study only accounts for one single stressor,drought, without considering other factors that mightaffect yield such as heat or cold spells. After carefulconsideration of a range of options, it was decided thatsoil moisture would be the most appropriate metric forthe crops that are considered in our study. While extrahydrometeorological variables could have been included(e.g. precipitation, temperature, relative humidity), thiswould have likely resulted in severe model over-parameterisation. Moreover, the soil moisture was froma global hydrological model that had been forced withclimate data that included temperature, precipitation,wind speed, and relative humidity. To this end, several
of the explanatory hydrometeorological variables thatcould have been included separately, are in fact inherentlyconsidered through the application of simulated soilmoisture, which itself was used for computation of thedrought index.
2. The omission of irrigation in this study is unfortunatebut unavoidable because global scale irrigation data arelimited in terms of seasonal availability of irrigation,what crop was irrigated and quality of data (See Siebertet al. 2005; Thenkabail et al. 2008). In most cases, thereare no annual time-series data on irrigation, hencethere is no way of knowing what share of theharvest gain/loss was due to irrigation. Moreover,80% of the world’s irrigated areas are found in afew countries in Asia where relatively few data areavailable (Thenkabail et al. 2008).
3. The spatial scale of this analysis means that manycontextual factors that influence vulnerability cannotbe covered. Data aggregated at national level do notcapture the variability at sub-national scales. The cropfailure index is likely to be biased towards the moreproductive regions of a country, while the drought indexis based on the location of meteorological stations andthe explaining socioeconomic variables represent thewhole country. The compatibility of the three scalestherefore vary by country. Furthermore, only finer scalesub-national studies can identify what regions contrib-ute to national food insecurity in the event of droughts(Antwi-Agyei et al. 2011; Conway and Schipper 2011;Simelton et al. 2009), and the role of temporal lageffects of adaptive measures. While it is argued that adiversity of adaptation strategies is going to make peo-ple less vulnerable to climate change, finer resolutioncontextual studies are needed to identify those strategies(Fazey et al. 2010). The six variables used in this study,therefore, can only be seen as proxies of different effectsin different contexts.
Results
First, we report on the geographical distribution of vulner-ability to drought and show what types of countries are morevulnerable and where they are located. Second, the LMEmodels of vulnerability to drought for rice, wheat and maizeare presented.
Geographic distribution of vulnerability to drought by crop,income, governance and agro-environmental group
The average vulnerability index during years with belownormal rainfall and during the growing season for rice,
Socioeconomics of grain crops vulnerability to drought
Author's personal copy
wheat and maize are shown in Fig. 1a–c. These maps pointout a couple of possible regions of particular concern forglobal food production: southern, eastern and northwestAfrica and some former Soviet Union-states along theborders of Europe and central Asia.
In terms of the characteristics of different countries withdifferent levels of vulnerability, the following results standout (see Fig. 2 for additional details):
1. In terms of climate, tropical agro-environments had thelowest mean vulnerability index across all three crops.The most vulnerable crops were rice and wheat in coldcountries and maize in arid agro-environments. Thehigh standard deviation of the vulnerability index forarid zones suggests great variation between years andcountries within this group.
2. For governance, countries with authoritarian and flawedregimes had the overall highest average vulnerability.
3. For income levels, the two middle income groups werethe most vulnerable.
In terms of crop-specific results, the following observationsstand out:
1. In terms of vulnerability of rice production to drought,authoritarian and cold agro-environments had the high-est mean vulnerability score while hybrid regimes andlow income countries had the lowest mean vulnerability.
2. For wheat production, flawed democracies and coldagro-environments had the highest mean vulnerabilityto drought, while low income countries had the lowestvulnerability.
3. For maize production, flawed democracies and lowerand upper middle income countries had the highestmean vulnerability to drought, while tropical agro-environments and full democracies had the lowest vul-nerability score.
More details on the interactions between variables andthe significance of different variables are available in sup-plementary Table 1 and supplementary Figure 1.
Linear mixed-effects models of vulnerability to drought forrice, wheat and maize production
Table 2 shows the detailed coefficients for the linear mixed-effects models with interactions between variables in thetwo right hand columns. The Supplementary Table 1 sum-marises the overall significant effects of the linear mixed-effects models. In particular, the following socio-economicfactors were identified as significant in explaining trends inrice, wheat and maize harvest vulnerability to drought:
1. For rice, the overall effect of the amount of GDPgenerated by a country’s agricultural sector and the
agroenvironment were both significant in reducingvulnerability to drought (Table 2a). The way thatagroenvironment affected vulnerability varied withthe intensity of cereal cultivation, i.e. the share ofcereal crops of the total harvested area. Althoughdrought vulnerability of rice was highest in coldclimates, cereal intensity had a significant effect onreducing vulnerability to drought in cold countries.As expected, drought vulnerability was lowest in thetropics where the effect of cereal intensity on vul-nerability was negligible (these interactions are in-dicated in the bottom rows and last column ofTable 2a).
2. For wheat production, the amount of GDP generated bya country’s agricultural sector was significant in reduc-ing vulnerability to drought. The exact nature of thiseffect, however, depended on the government type andagro-ecological zone. Autocratic regimes had the high-est vulnerability, while GDP significantly reduced vul-nerability in these countries and in arid countries(Table 2b).
3. For maize production, a large number of significanteffects and interactions were observed, including fertil-iser use, GDP in agriculture, the size of rural population,intensity of cereal cultivation and governance. Maizeharvests were most vulnerable to drought in in flaweddemocracies and in low income countries. In flaweddemocracies, cereal intensity was associated with asignficant reduction in vulnerability. In low incomecountries, GDP reduced vulnerability while in hybridregimes, GDP increased vulnerability and rural popula-tions reduced vulnerability (Table 2c).
Governance interaction effects with GDP in agriculturewere complex in the case of maize. For example, Fig. 3demonstrates that, if all other variables are kept constant, anincrease in GDP from agriculture typically results in re-duced vulnerability (main effect). Furthermore, in flawedand full democracies, vulnerability starts at a higher levelwith the steepest slope of reduced vulnerability in full de-mocracies. For flawed democracies and autocratic regimes,there is no significant difference from the overall meanrelationship with GDP. Vulnerability in hybrid regimes, incontrast, starts at lower levels but show a significant in-crease with increasing GDP in agriculture. The situationwas less complex for rice as governance style was insignif-icant for drought vulnerability outcomes. For wheat, highdrought vulnerability in autocratic regimes was reducedthrough GDP (for wheat and rice see Table 2a and b).
�Fig. 1 Mean vulnerability to drought 1990–2005 for a rice, b wheat,and c maize production. Vulnerability to drought is low (high) whencrop failures are small (big) despite a major (minor) drought, indicatedby colours from green to red
E. Simelton et al.
Author's personal copy
Socioeconomics of grain crops vulnerability to drought
Author's personal copy
In summary, average vulnerability to drought increasedprogressively by latitude, from tropical, arid, temperate tocold; peaked in middle income countries and in flaweddemocracies. For maize in particular, GDP in agriculturein combination with other factors, was significantly associatedwith vulnerability to drought in both low income countries(where GDP generally reduces vulnerability) and hybridregimes (where it increases vulnerability).
Discussion
This paper provides partial answers to three empiricalquestions: (1) Where in the globe is cereal production mostvulnerable to drought? (2) What are some of the underlyingsocio-economic conditions that contribute to harvestvulnerability to drought? (3) What implications mightthese results have for policies aiming to enhance adaptivecapacity in order to ensure food security?
Where is cereal production most vulnerable to drought?
Average vulnerability to drought was comparatively high inkey wheat and maize producing regions, e.g. Central Asiaand Southern Africa (Fig. 1a–c) and comparatively low intropical agro-environments, in countries with low incomelevels, and in hybrid regimes (such as Cambodia, Guatemalaand Ghana). The low vulnerability in the tropics may berelated to ample water supply. In contrast, the highest meanvulnerability to drought is found in cold agro-environments,middle income level countries, and flawed democraciessuch as the Ukraine and Moldova where droughts, some-times in combination with cold spells, are well documented,(e.g. USDA 2004) and where vulnerability may have been
exacerbated by the collapse of the Soviet Union thatdestroyed many agricultural institutions (FAO 2003; Ohno2009). The high vulnerability of cold countries may also bedue to the fact that grain cultivation in higher latitudes iscloser to the ecological margins tolerated by these crops. Inaddition, high latitude countries have predominantly rainfedagriculture while key grain cultivation areas in regions atlow latitudes are typically irrigated (OECD-FAO 2009;Siebert et al. 2005). For example, Asia has nearly 80% ofthe world’s irrigated areas, and this is dominated by China(33%, a key area is North China Plain) and India (28%, inparticular northern and west central parts), while Southeastand Central Asian countries have smaller shares (1–3%each), especially Pakistan, Russia, Thailand, Bangladesh,Kazakhstan, Myanmar, Uzbekistan and Viet Nam (see:Thenkabail et al. 2008, p 32). However, this type of irriga-tion map does not separate irrigation supply into seasonalityor specify by crop nor does it reflect the actual access towater. For example, in the case of China, the impacts ofirrigation and droughts vary with provinces and dependmore on investments and institutional arrangements(Simelton et al. 2009; Simelton 2011). Nevertheless, it indi-cates regions where irrigation overlaps with some of the lowvulnerability areas shown in this study and suggests regionswhere vulnerability to drought could be lower than our mapsindicate.
What are some of the underlying socio-economic conditionsthat contribute to harvest vulnerability to drought?
Overall, our results show that high levels of GDP in agri-culture (rice, wheat and maize), cereal intensity (rice) andfertiliser use (maize) are associated with lower vulnerabilityto drought (Table 2). As these may be proxy indicators for
Fig. 2 Mean vulnerability todrought (VI) for all three cropstogether and separately, by (1)agro-environment, (2) gover-nance and (3) income levelgroupings. For mean values,significant differences betweengroups and total number seesupplementary table 1 and forbox plot distributions for thisgraph see supplementaryfigure 1
E. Simelton et al.
Author's personal copy
Table 2 Coefficients for linear mixed effects models of vulnerability to drought for a) rice, b) wheat and c) maize production
Value Standard Error DF t-value p-value Overallintercept
Slope modifiedby interaction
a) Rice
Intercept 2.614 0.170 525 15.383 <0.001
GDP in agriculture −0.054 0.027 525 −1.998 0.046 2.561
Socioeconomics of grain crops vulnerability to drought
Author's personal copy
the relative importance of agriculture in a country’s economyand the capital resources available to farmers, one interpreta-tion of these results is that financial capital is significant inenhancing adaptive capacity. Many large-scale, high-impactdroughts are associated with ENSO and other predictableweather phenomena (Chen et al. 2002; Mishra and Singh2010). Therefore, investment in seasonal weather forecastingmay help farmers prepare for soil moisture deficits (Chen et al.2002; Patt and Gwata 2002).
The findings also reflect the complexity of maize pro-duction, which is grown under very diverse circumstancesacross the world. For example, our results show that higherlevels of GDP in agriculture were associated with reducedmaize vulnerability in low income countries but increasedvulnerability in hybrid regimes. Moreover, large rural pop-ulations are significantly associated with reduced maizevulnerability in hybrid regimes. Several of the countriesidentified as hybrid regimes underwent structural
Table 2 (continued)
Value Standard Error DF t-value p-value Overallintercept
Fig. 3 Main effect andinteraction effects of GDP fromagriculture on vulnerability todrought for maize productionwhen all other variables arekept constant
E. Simelton et al.
Author's personal copy
adjustment programs and trade liberalization policies in the1980s that had significant impacts on agriculture, land use,and labour (FAO 2003). These changes may have had theeffect of reducing traditional drought coping strategies mak-ing harvests more vulnerable to drought. More specifically,it may be that farmers in this category of country still rely onlabour-intensive agricultural management but that labourwas not available because it had been drawn away to urbanor industrial sectors of the economy. Similarly, the highvulnerability observed in middle income countries may bebecause agricultural modernisation is not yet fully imple-mented in such regions and this makes it difficult forfarmers to adapt to changes in weather alongside othersocietal changes (see Fraser and Stringer 2009 for anexample of this taken from Romanian history).
One of the most striking results of this research is thatvulnerability to drought is lower in both rich and poorcountries than for the middle income countries. We notesimilarities to what is referred to as middle-income trap inthe macro economic literature (Ohno 2009). In these cases,failures to modernize the agricultural sector to meet newquality standards as the country moves from low to middleincome, may impact on drought vulnerability. Similar obser-vations have been indicated in studies that create future foodsecurity scenarios (Nelson et al. 2010). From this we hy-pothesize that the low vulnerability of the poorest countriesmay be because farmers in these countries are still usingtraditional farming practices and have well-established ad-aptation strategies, such as mixing traditional and hybridseeds (for examples from southern Africa see Stringer etal. 2009). These trends further reflect how the roles ofnatural, human, social, financial and physical capitals foradaptation shift as farming systems continuosly adapt, anddepend on spatial scale (Verchot et al. 2007). For example,the high income countries may have low vulnerability be-cause they may have ample financial reserves with which toadapt, such as by investing in seasonal weather forecasting.The middle income countries, however, may neither havethe financial investment nor traditional coping strategies inplace. Moreover, many of these countries are undergoingmarket and trade liberalisation reforms with variable success(Ohno 2009). The generally low vulnerability in China andViet Nam as compared to large parts of the former SovietUnion may partly be explained by investments in agriculturedevelopment and slower institutional changes (FAO 2003).Thus, this study shows one important difference between therole of governance status and income levels: among thetransitioning countries, governance (rather than income level)has a key role for avoiding drought vulnerability in stateswhere agriculture plays an important role for GDP as well asdomestic food security, i.e. China, India, Viet Nam. Althoughit is possible to quantitatively derive similarities in droughtvulnerability among categories of countries, the discussion
also builds on the results from a largely qualitative and case-based body of literature (e.g. see: Fraser et al. 2011).
What implications might these results have for policiesaiming to enhance adaptive capacity in order to ensure foodsecurity?
In the 1960s, between 5 and 10% of the world’s grain pro-ducing regions were affected by drought. Since then, this areahas more than doubled and today between 15 and 25% ofgrain fields are suffering from water deficits (Li et al. 2009).Many expect this trend to continue under climate change(Foley et al. 2011) and if this happens, understanding theunderlying socio-economic factors that enhance or reducevulnerability to drought becomes ever more important.
Results presented here provide some insight into the sortsof policy that may help farmers adapt. In particular, byhighlighting the socio-economic factors that influence whygrain production is vulnerable to drought we can infer howdifferent types of policy may affect drought vulnerability indifferent types of region. For instance, the results presentedin Fig. 3 suggest that boosting a country’s GDP from agri-culture can help reduce the vulnerability of grain harvests todrought. In particular, this study suggests that this strategywill have the most effect in countries with autocratic gov-ernments but may actually cause vulnerability in what theEconomists Intelligence Unit describes as “hybrid regimes”.Similarly, a number of potential policy implications emergefrom the results presented in Fig. 2. This figure, suggeststhat if a poor country grows richer then farmers may becomemore vulnerable to drought before becoming less vulnerable atthe highest income levels. While this conclusion needs to betaken cautiously, if the observation is confirmed in other re-search (notably from other scales such as at district-level withincountries), then policymakers need to be aware that promotingeconomic growth in low income countries may increasedrought vulnerability. The implication of this work is thatpolicies to boost economic growth need to be coordinated withmulti-level adaptation strategies including land use and agri-cultural extension policies to promote water-saving farmingpractices. If such institutional support is unpredictable then ourresults suggest that harvests may be especially vulnerable tothe “double exposure” of economic/political and climatic un-certainty (Eakin 2005; O’Brien and Leichenko 2000).
Seen in this light, the current crisis of food price inflation(2007–2011) provides us with two important lessons. First,natural hazards, including droughts, can trigger problemsthat spread and multiply. For instance, the Russian droughtsin the summer of 2010 destroyed about 25% of Russia’swheat harvest. This prompted an export ban that may havecontributed to destabilizing political regimes in NorthernAfrica (Fraser and Rimas 2011). Therefore, we must ac-knowledge that an inability to adapt to drought can cause
Socioeconomics of grain crops vulnerability to drought
Author's personal copy
far reaching consequences for our global food system.Second, while we have little control over when, where orhow severe droughts will be, policy makers do have someinfluence on whether or not farmers have access to the toolsthey need to anticipate and adapt to drought, such as throughdrought tolerant seed varieties, early warning systems, fundsfor irrigation or subsidized labour.
Conclusion
To fully address the implications that climate change may haveon future food security an enhanced understanding of howsocio-economic conditions increase or reduce the vulnerabilityof key food crops to drought is necessary. To help address thisneed, the study presented here has attempted to use nationallevel data to identify what factors were significant in influenc-ing the way that drought affected cereal harvests between 1990and 2005. The key conclusion is that the socio-economicfactors that increase or decrease the vulnerability of cerealcrops to drought vary, depending on the type of cereal andthe type of region. For instance, countries with small popula-tions and wealthy economies had lower average vulnerabilityto drought and upper middle income countries were morevulnerable than both low and high income countries.Furthermore, ‘authoritarian’ and ‘flawed’ democracies weremore vulnerable than ‘hybrid regimes’ and ‘full democracies’.Since many of the world’s countries are in economic transitionand depend on self-sufficiency in grain for growing popula-tions, one implication of this research is that maintainingagricultural support institutions is an important step in reducingvulnerability to droughts and enhancing national food security.
This paper however needs to close with a strong caveat.Rather than seeing these empirical observations as definitive,they should be viewed as building on the conclusions of alargely qualitative and case study based body of literaturewhich demonstrates that the impact of extreme weather iscontingent on local contextual factors. Our paper provides apreliminary quantification and a refined set of hypotheses ofwhat these contextual factors might be at the national level. Asglobal scale data improves in quality, resolution and complete-ness researchers may be able to piece together a more compre-hensive understanding of the interactions between changes inenvironmental challenges and human societies’ ability to cope.
Acknowledgements Wewould like to thank Jami Dixon for collectingdata, and Esben Almquist and Alexander Walther for their Matlab scripts.This research was funded by grants from: the Natural EnvironmentResearch Council (NERC) under the QUEST programme (grant numberNE/E001890/1); the Rural Economy and Land Use Programme which isa collaboration between the Economic and Social Research Council(ESRC), the Biotechnology and Biological Sciences Research Council(BBSRC); and the Centre for Climate Change Economic and Policy,which is funded by the Economics and Social Research Council. Weare grateful to two anonymous reviewers for their constructive comments.
References
Antwi-Agyei, P., Fraser, E. D. G., Dougill, A., Stringer, L., &Simelton, E. (2011). Mapping food system vulnerability todrought using rainfall, yield and socioeconomic data for Ghana.Applied Geography, 32, 324–334.
Arnell, N. W. (1999). A simple water balance model for the simulationof streamflow over a large geographic domain. Journal ofHydrology, 217, 314–335. doi:10.1016/S0022-1694(99)00023-2.
Beddington, J. (2009). Food, energy, water and the climate: A perfectstorm of global events? Government Office for Science. Full textavailable at: http://www.bis.gov.uk/assets/bispartners/goscience/docs/p/perfect-storm-paper.pdf.
Brooks, N., Adger, N. W., & Kelly, M. P. (2005). The determinants ofvulnerability and adaptive capacity at the national level and theimplications for adaptation. Global Environmental Change PartA, 15(2), 151–163.
Challinor, A. J., Simelton, E. S., Fraser, E. D., Hemming, D., Collins,M. (2010). Increased crop failure due to climate change:assessing adaptation options using models and socio-economic datafor wheat in China.Environmental Research Letters, 5, doi:10.1088/1748-9326/5/3/034012.
Chen, C. C., McCarl, B., & Hill, H. (2002). Agricultural value ofENSO information under alternative phase definition. ClimaticChange, 54, 305–325.
Conway, D., Persechino, A., Ardoin-Bardin, S., Hamandawana, H.,Dieulin, C., & Mahe, G. (2009). Rainfall and water resourcesvariability in sub-Saharan Africa during the 20th century. Journalof Hydrometeorology, 10, 41–59. doi:10.1175/2008JHM1004.1.
Conway, D., & Schipper L. E. F. (2011). Adaptation to climate changein Africa: Challenges and opportunities identified from Ethiopia.Global Environmental Change, 21, 227–237.
Corzo Perez, G. A., van Huijgevoort, M. H. J., Voß, F., & van Lanen,H. A. J. (2011). On the spatio-temporal analysis of hydrologicaldroughts from global hydrological models. Hydrology and EarthSystem Sciences, 15, 2963–2978.
Crawley, M. J. (2007). The R Book. Chichester: Wiley.Devereux, S. (2009). Why does famine persist in Africa? Food
Security, 1, 25–35.Eakin, H. (2005). Institutional change, climate risk, and rural vulner-
ability: cases from Central Mexico. World Development, 33(11),1923–1938.
EarthTrends (2008). The environmental information portal. WorldResources Institute. http://earthtrends.wri.org/searchable_db/index.php?theme04.
Ericksen, P. et al. (2011). Mapping hotspots of climate change and foodinsecurity in the global tropics. Copenhagen: CGIAR ResearchProgram onClimate Change, Agriculture and Food Security (CCAFS).
Erigayama, N., Smakhtin, V., & Gamage, N. (2009). Mapping droughtpatterns and impacts: a global perspective. Colombo: InternationalWater Management Institute.
FAO (2003). Trade reforms and food security. Conceptualizing thelinkages, Commodity Policies and Projections Service, Commoditiesand Trade Division. Rome, Italy. 296pp.
FAO (2008). FAOSTAT Online database. Food and AgricultureOrganization of the UnitedNations. http://faostat.fao.org/default.aspx.
Fazey, I., Gamarra, J. G. P., Fischer, J., Reed, M. S., Stringer, L. C., &Christie, M. (2010). Adaptation strategies for reducing vulnera-bility to future environmental change. Frontiers in Ecology andthe Environment, 8(8), 414–422. doi:10.1890/080215.
Foley, J. A., et al. (2011). Solutions for a cultivated planet. Nature.doi:10.1038/nature10452.
Fraser, E. (2007). Travelling in antique lands: Studying past famines tounderstand present vulnerabilities to climate change. ClimateChange, 83, 495–514.
Fraser, E. D. G., Rimas, A. (2011). The psychology of food riots. ForeignAffairs, January 30, http://www.foreignaffairs.com/articles/67338/evan-fraser-and-andrew-rimas/the-psychology-of-food-riots.
Fraser, E. D. G., & Stringer, L. C. (2009). Explaining agriculturalcollapse: macro-forces, micro-crises and the emergence of landuse vulnerability in southern Romania. Global EnvironmentalChange, 19(1), 45–53.
Fraser, E. D. G., et al. (2008). Quantifying socioeconomic characteristicsof drought-sensitive regions: evidence from Chinese provincial ag-ricultural data. Comptes Rendus Geoscience, 340(9–10), 679–688.
Fraser, E. D. G, Dougill, A. J., Hubacek, K., Quinn, C. H., Sendzimir,J., Termansen, M. (2011). Assessing vulnerability, resilience andadaptive capacity to climate change in arid/semi-arid social eco-logical systems. Ecology and Society 16(3), Art. 3.
Gbetibouo, G., Ringler, C. (2009). Mapping South African farmingsector vulnerability to climate change and variability: A subnationalassessment. IFPRI Discussion Paper 885. International Food PolicyResearch Institute Washington, DC.
Gosling, S. N., & Arnell, N. W. (2011). Simulating current global riverrunoff with a global hydrological model: model revisions, validation,and sensitivity analysis. Hydrological Processes, 25, 1129–1145.
Gosling, S. N., Bretherton, D., Haines, K., Arnell, N. W. (2010). Globalhydrology modelling and uncertainty: running multiple ensembleswith a campus grid. Philosophical Transactions of the Royal SocietyA, 368, 4005–4021. doi: 10.1098/rsta.2010.0164.
Haddeland, I., et al. (2011). Multimodel estimate of the global terres-trial water balance: setup and first results. Journal ofHydrometeorology, 12, 869–884.
Hafner, S. (2003). Trends in maize, rice, and wheat yields for 188nations over the past 40 years: a prevalence of linear growth.Agriculture, Ecosystems and Environment, 97, 275–283.
Hazell, P., & Wood, S. (2007). Drivers of change in global agriculture.Philosophical Transactions of the Royal Society B. doi:10.1098/rstb.2007.2166.
Hollinger, S. E., & Isard, S. A. (1994). A soil moisture climatology ofIllinois. Journal of Climate, 7, 822–833.
IPCC (2001). Glossary, Fourth Assessment Report, Working Group 2.Intergovernmental Panel on Climate Change. Cambridge, UnitedKingdom and New York, NY, USA: Cambridge University Press.http://www.ipcc.ch/pdf/glossary/ar4-wg2.pdf
IPCC. (2007). Contribution of Working Group II to the FourthAssessment Report of the Intergovernmental Panel on ClimateChange. Cambridge: Cambridge University Press.
Kottek,M., Grieser, J., Beck, C., Rudolf, B., &Rubel, F. (2006).WorldMapof the Köppen-Geiger climate classification updated.MeteorologischeZeitschrift, 15(3), 259–263. doi:10.1127/0941-2948/2006/0130.
Leff, B., Ramankutty, N., Foley, J. A. (2004). Geographic distributionof major crops across the world. Global Biogeochemical Cycles18, GB 1009.
Li, Y. P., Ye, W., Wang, M., & Yan, X. D. (2009). Climate change anddrought: a risk assessment of crop-yield impacts. ClimateResearch, 39, 31–46.
Lobell, B. D., & Field, C. B. (2007). Global scale climate-crop yieldrelationships and the impacts of recent warming. EnvironmentalResearch Letters, 2, 014002.
McMahon, T. A., Peel, M. C., Vogel, R. M., & Pegram, G. G. S.(2007). Global streamflows—Part 3: Country and climate zonecharacteristics. Journal of Hydrology, 347, 272–291.
Mishra, A. K., & Singh, V. P. (2010). A review of drought concepts.Journal of Hydrology, 391(1–2), 202–216.
Nelson, G., et al. (2010). Food security, farming, and climate change to2050: Scenarios, results, policy options. IFPRI. Washington DC.155 pp http://www.ifpri.org/sites/default/files/publications/rr172.pdf.
Nijssen, B., Schnur, R., & Lettenmaier, D. P. (2001). Global retrospectiveestimation of soil moisture using the variable infiltration capacityland surface model, 1980–93. Journal of Climate, 14, 1790–1808.
O’Brien, K., & Leichenko, R. M. (2000). Double exposure: assessingthe impacts of climate change within the context of economicglobalization. Global Environmental Change, 10, 221–232.
OECD-FAO (2009). OECD-FAO Agricultural outlook Highlights No1Feb 2009. OECD/FAO.
Ohno, K. (2009). Avoiding the middle-income trap: renovating indus-trial policy formulatoin in Vietnam. ASEAN Economic Bulletin,26(1), 25–43.
Pandey, V. P., Babel, M. S., Shrestha, S., & Kazama, F. (2011). Aframework to assess adaptive capacity of the water resources systemin Nepalese river basins. Ecological Indicators, 11(2), 480–488.
Patt, A., & Gwata, C. (2002). Effective seasonal climate forecastapplications: examining constraints for subsistence farmers inZimbabwe. Global Environmental Change, 12(3), 185–195.
Rudel, T. K., et al. (2009). Agricultural intensification and changes incultivated areas, 1970–2005. Proceedings of the NationalAcademy of Sciences of the United States of America, 106(49),20675–20680. doi:10.1073/pnas.0812540106.
Schneider, T., & Neumaier, A. (2001). Algorithm 808: ARfit—AMatlab package for the estimation of parameters and eigenmodesof multivariate autoregressive models. ACM Transactions onMathematical Software, 27(1), 58–65.
Siebert, S., Doll, P., Hoogeveen, J., Faures, J.M., Frenken, K., & Feick, S.(2005). Development and validation of the global map of irrigationareas. Hydrology and Earth System Sciences, 9, 535–547.
Sheffield, J., Andreadis, K. M., Wood, E. F., & Lettenmaier, D. P. (2009).Global and continental drought in the second half of the TwentiethCentury: severity-area-duration analysis and temporal variability oflarge-scale events. Journal of Climate, 22, 1962–1981.
Simelton, E., Fraser, E. D. G., Termansen, M., Forster, P. M., & Dougill,A. J. (2009). Typologies of crop-drought vulnerability: an empiricalanalysis of the socio-economic factors that influence the sensitivityand resilience to drought of three major food crops in China (1961–2001). Environmental Science and Policy, 12(4), 438–452.
Simelton, E. (2011). Food self-sufficiency and natural hazards inChina. Food Security, 3(1), 35–52.
Stringer, L. C., Dyer, J. C., Reed, M. S., Dougill, A. J., Twyman, C., &Mkwanbisi, D. (2009). Adaptations to climate change, droughtand desertification: local insights to enhance policy in southernAfrica. Enironmental Science and Policy, 12, 748–765.
The Economist (2009). The Economist Intelligence Unit’s Index ofDemocracy 2008. http://graphics.eiu.com/PDF/Democracy%20Index%202008.pdf.
Thenkabail, P. S., et al. (2008). A Global Irrigated Area Map (GIAM)Using remote sensing at the end of the last millennium. Colombi.Sri Lanka: International Water Management Institute. 63 pp.http://www.iwmigiam.org/info/gmi-doc/GIAM-world-book.pdf.
The World Bank Group (2008). World Development Indicators Onlinedatabase. http://data.worldbank.org/indicator
Thorne, R. (2011). Uncertainty in the impacts of projected climate changeon the hydrology of a subarctic environment: Liard River Basin.Hydrological and Earth System Sciences, 15, 1483–1492.
Government, U. K. (2011). Global food and farming futures. London:Foresight Government of the United Kingdom.
USDA (2004). Ukraine: Average harvest prospects for winter grains,production estimates and crop assessment division, foreign agri-cultural service. United States Department of Agriculture.
Verchot, L. V., et al. (2007). Climate change: linking adaptation andmitigation through agroforestry. Mitigation and AdaptationStrategies for Global Change. doi:10.1007/s11027-007-9105-6.
Wagner,W., Scipal, K., Pathe, C., Gerten, D., Lucht,W., Rudolf, B. (2003).Evaluation of the agreement between first global remotely sensed soilmoisture data with model and precipitation data, Journal ofGeophysical Research, 108(D19), 4611, doi:10.1029/2003JD003663.
World Bank (2009). Country classification 2008. http://go.worldbank.org/K2CKM78CC0.
Socioeconomics of grain crops vulnerability to drought
Xu, H., Taylor, R. G., Kingston, D. G., Jiang, T., Thompson, J. R., &Todd, M. C. (2010). Hydrological modeling of River Xiangxiusing SWAT2005: a comparison of model parameterizations usingstation and gridded meteorological observations. QuaternaryInternational, 226, 54–59.
Elisabeth Simelton is a geogra-pher with interest in impacts of,and adaptation to, climate andeconomic change in the fieldsof agriculture and food security.She specialises in SouthernAfrica and East and SoutheastAsia. Between 2007-2011 shewas a research fellow at the Sus-tainability Research Institute,University of Leeds and is a vis-iting researcher at the Centre forClimate Change Economics andPolicy. Currently, she is based atthe World Agroforestry Centre
in Viet Nam. There, her research focuses on environmental and socio-economic trade-offs for multi-functional land uses, in particular theimportance of household food security for enrolling in payment forenvironmental services schemes.
Evan Fraser holds the CanadaResearch Chair in Global Hu-man Security in the Departmentof Geography, University ofGuelph, Canada. Between 2003and 2010 he worked at theSchool of Earth and Environ-ment, University of Leeds, UK.He is an interdisciplinary socialscientist with expertise in foodsystems, food security and theimpact of climate change onfood production. In addition toacademic writing, he is also theauthor of two popular science
books on food, the environment and sustainability, one of which,Empires of Food: Feast Famine and the Rise and Fall of Civilizations,co-authored with Andrew Rimas, reached the finals in the James BeardWriting and Literature Award in 2010.
Mette Termansen obtained herPhD from the University ofYork, UK, in EnvironmentalEconomics, working on spatio-temporal modelling approachesto forest economics in order toenable environmental interac-tions to be taken into account.After working as a research fel-low at York, she took up a posi-tion as Lecturer and later onSenior Lecturer in EcologicalEconomics at the SustainabilityResearch Institute at Leeds. In2009 she was appointed Profes-
sor in Environmental Economics at the Department of Policy Analysis,Aarhus University, Denmark. Her main research areas are in integratedecological economic modelling and ecosystems services valuation. Shehas worked on a range of environmental issues related to modelling ofland use. These include land use and climate change impacts on speciesdistribution patterns, quantification of adaptation capacity to climatechange in agriculture, recreation modelling, and evaluation of policyschemes for land use in order improve water quality.
Tim Benton is Professor of Pop-ulation Ecology at the Instituteof Integrative and ComparativeBiology and Chair of Africa Col-lege at the University of Leeds.His primary research areas arebiodiversity and populationmanagement under scenarios ofenvironmental change and theecology of agricultural land. Heworks in the field and uses mod-el species in the laboratory inorder to elucidate fundamentalbiological mechanisms fromwhich he develops statistical
models. Much of his work concerns understanding systems.
E. Simelton et al.
Author's personal copy
Simon Gosling’s main interestsare in understanding the impactsof climate change on natural andhuman systems and bridging theboundary between physical sci-ence and impact and policy-related areas. Much of his cur-rent research investigates thepotential impact of climatechange on global- and catchment-scale hydrology and water resour-ces. Simon is interested in un-de r s t and ing how ave r ageconditions and extremes (floodsand droughts) might be affected
by climate change. He applies a variety of climate and hydrologicalnumerical models to achieve this. Simon also has strong interests inmodeling the relationship between climate and human health; specifical-ly, on the association between extreme temperature events (heat wavesand cold snaps) and temperature-related mortality. A key elementthroughout his research is exploring the inherent uncertainties of theimpact of climate change projections, due for instance, to uncertaintiesassociated with the current state of science on the modelling of climate,hydrology and health.
Andy South is a biologist withan interest in the communicationof global information, particular-ly about climate change. As apart of the NERC QUEST proj-ect he developed the open-source software ‘rworldmap’ forcreating maps in R. The aim is toprovide a free software tool thatcan be used across disciplines toproduce maps of gridded andcountry level information.
Professor Nigel Arnell is theDirector of the Walker Insti-tute for Climate Change Re-search and is Professor ofClimate System Science inthe Department of Meteorolo-gy at the University of Read-ing. His research focuses onthe impacts of climate changeon river flows, water resourcesand their management. A leadauthor in the second, third andfourth Intergovernmental Panelon Climate Change assess-ments, he has also contributed
to the Stern Review of the Economics of Climate Change.
Andy Challinor is a Professor atthe Institute for Climate and At-mospheric Science at the Uni-versity of Leeds. He is also aTheme Leader for ‘Adaptationpathways under progressive cli-mate change’ under the Chal-lenge Programme on ClimateChange, Agriculture and FoodSecurity (CCAFS). His careergoal is to contribute to theknowledge base that strengthensthe food security and health ofpopulations vulnerable to cli-mate variability and environ-
mental change. His research focuses principally on using climatemodelling and process studies to understand food production and foodsecurity, treatments of uncertainty and managing risk, and climate-resilient pathways and adaptation. He is a Lead Author on the ‘FoodProduction Systems and Food Security’ chapter of the forthcomingFifth Assessment report of the IPCC.
Andrew Dougill is an appliedenvironmental researcher whohas developed a range of inte-grated approaches for combininglocal and scientific knowledge inassessment of dryland degrada-tion. His work has focused onSouthern Africa and routes toensure that pastoral and mixed-farming communities are in-volved in projects to assess deg-rada t ion problems and todevelop management and policysolutions for these. His recentwork is funded by the ESRC
Centre for Climate Change Economics and Policy investigating waysto ‘close the loop’ between climate science, development practice andpolicy interactions in dryland agro-ecological systems. He is currentlyProfessor of Environmental Sustainability and Head of the School ofEarth and Environment at the University of Leeds.
Piers Forster is a Professor ofphysical climate change in theSchool of Earth and Environ-ment at the University of Leeds.His research group, based in theInstitute for Climate and Atmo-spheric Science, is activelyexpanding research into under-standing various climate feed-backs, using a range of climatemodels. His research includesthe investigation of cloud modi-fication by contrails, sea sprayand aerosols from volcanoes.
Socioeconomics of grain crops vulnerability to drought