i School of Engineering and Energy ENG450 – Final Year Engineering Internship “A report submitted to the School of Electrical, Energy and Process Engineering, Murdoch University in partial fulfilment of the requirements for the degree of Bachelor of Engineering” Prepared by Oliver Yeudall Student No. 30386559 Unit Coordinator Professor Parisa Bahri Academic Supervisor Dr. Gareth Lee Industry Supervisor Clifford Lang Submitted 14-11-2008
Transcript
i
School of Engineering and Energy
ENG450 – Final Year Engineering Internship
“A report submitted to the School of Electrical, Energy and Process Engineering, Murdoch
University in partial fulfilment of the requirements for the degree of Bachelor of
Engineering”
Prepared by
Oliver Yeudall
Student No. 30386559
Unit Coordinator
Professor Parisa Bahri
Academic Supervisor
Dr. Gareth Lee
Industry Supervisor
Clifford Lang
Submitted
14-11-2008
ii
ABSTRACT
This is the final report for ENG450 – Final Year Engineering Internship as undertaken by
Oliver Yeudall. The specific internship was performed at ISS Group Australia Pty Ltd from
the 4th of August until the 21st of November, 2008 where a variety of projects were worked
on, providing experience for future careers in industry. Projects included work internally,
with Fortescue Metals Group and BHP Billiton. The role of Industry Supervisor was filled
by Clifford Lang (previously Warren Jones) and the position of Academic Supervisor was
filled by Dr. Gareth Lee. Unit Coordinator was Professor Parisa Bahri.
iii
ACKNOWLEDGEMENTS
The author would like to thank Murdoch University for organising the internship program, especially Professor Parisa Bahri for running the program, and Gareth Lee for acting as
academic supervisor on the project. From ISS Group the author would like to thank Frank Zenke for permitting the final year internship to occur at the company, Clifford Lang for
acting as industry supervisor, John Knight for providing training services, and Warren
Jones for previously acting as industry supervisor. Finally the author would like to thank
the staff at ISS Group for assistance performing the internship.
Chapter 1 - ISS Group Pty. Ltd. ......................................................................................................................... 2
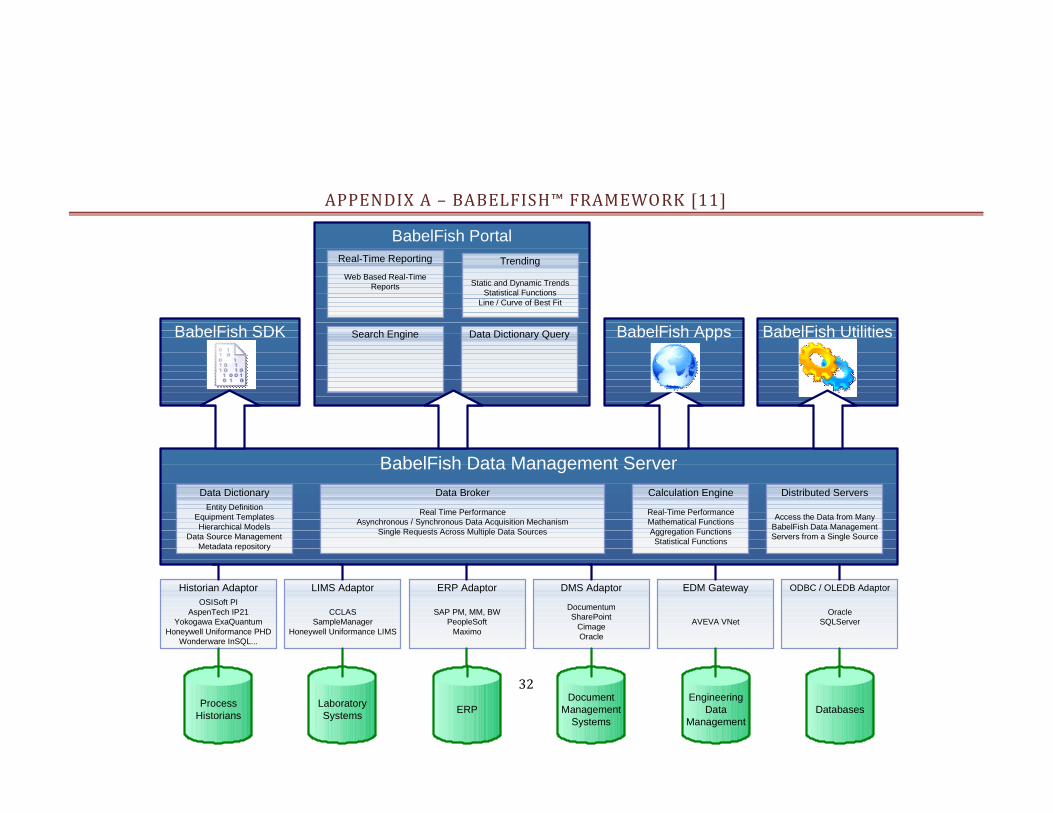
Appendix A – BabelFish™ Framework ....................................................................................................... 32
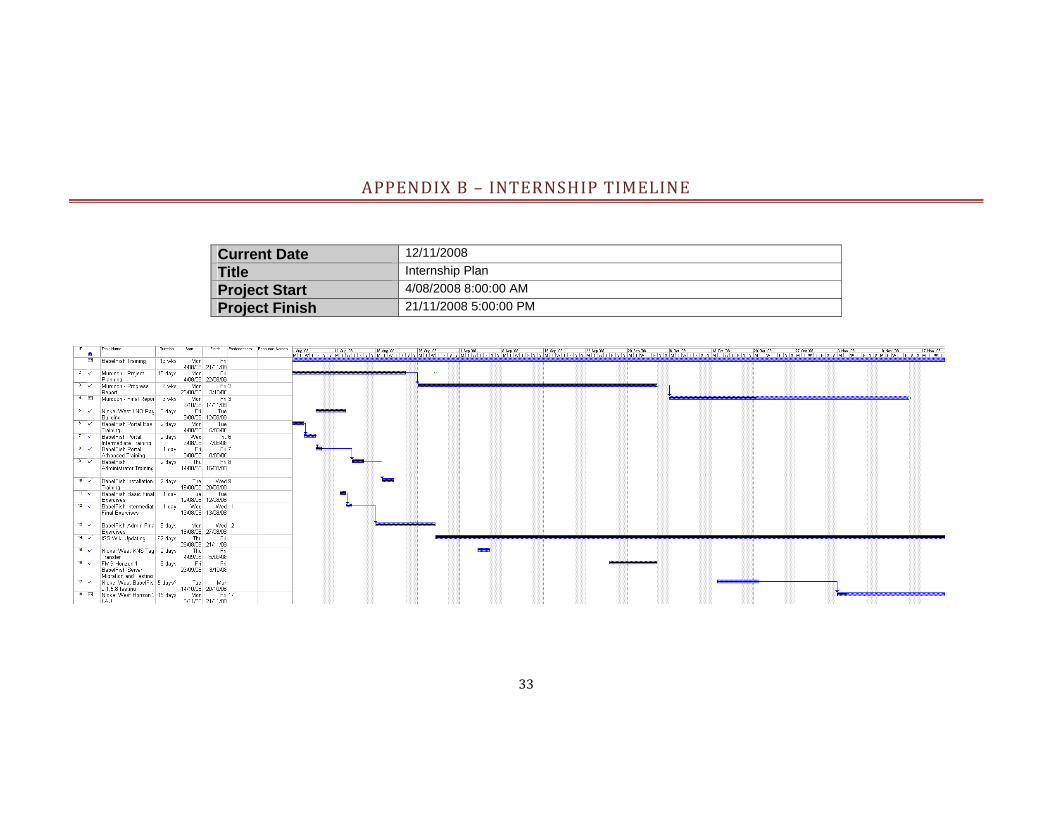
Appendix B – Internship Timeline .............................................................................................................. 33
1
INTRODUCTION
This is the final report for ENG450 - Final Year Internship. The internship was undertaken
to finalise studies at Murdoch University for a degree in Industrial Computer Systems
Engineering and Instrumentation and Control Systems Engineering. This specific
internship was undertaken at ISS Group Pty. Ltd., where duties were assigned providing
experience as a Product Specialist. Over the course of the internship, a variety of activities
were experienced, both technical and process related. This provided a range of valuable
job skills which would be able to applied in future positions, both with ISS Group and
industry in general.
Initially a period of training was needed to train in the use of ISS Group’s flagship product
BabelFish™, including its related components. Due to the size of the system training was
ongoing throughout the duration of the internship, much of it through practical exercises
and contract work.
Parallel to initial training in BabelFish, a project was organised which required the use of
mathematics training obtained through studies at Murdoch University. In order to fully
demonstrate the graphing functionality of BabelFish™ Portal, a project was organised with
the goal of deriving a series of pump curves. These would be used for various purposes by
ISS Group such as training, sales and general documentation.
Once ISS Group was satisfied that a sufficient amount of training had been given, work was
permitted on active projects. These projects involved interacting with clients on-site, such
as BHP Billiton and Fortescue Metals Group, and working towards solutions using the
BabelFish™ product package.
2
CHAPTER 1 - ISS GROUP PTY. LTD.
ISS Group was formed in 1995 by Shane Attwell and floated on the Australian Securities
Exchange in 2004 [1]. They are a software company which develops and supports
industrial software solutions with a focus on Mining and the Oil & Gas sectors of industry.
Current clients include corporations such as BHP Billiton, Woodside and Shell. ISS’s
flagship product is BabelFish™, a data integration and visualisation package which
enhances operational management capabilities. ISS also supports BabelFish™ after it has
been installed in an operation, consistently improving on the program’s architecture.
The internship which was taken at ISS Group was based around the position of ‘Product
Specialist’. This was a position within the Client Services department, the main roles of
which were to interact with clients and support the product as installed in the field. This
covers both technical and business related skills such as design, troubleshooting, product
testing and general documentation.
3
CHAPTER 2 - BABELFISH™
BabelFish™ is a framework encompassing many sub-programs. It is a data visualization
and management tool for industrial businesses who need to manage large numbers of
assets in an easy to understand format. Because it runs as a web service, people can view
information on remote sites without the need for client-side installations, reducing setup
complexity. It can be used to:
• Monitor field and well equipment
• Track, trend and optimise production
• Manage Asset Integrity
• Monitor activities against operational, environmental, safety and corporate
guidelines.
• Monitor operational activities against Corporate Key Performance Indicators
(KPIs)[2].
It is currently used by many major entities such as BHP Billiton, Santos, Woodside, BP, Rio
Tinto and Saudi Aramco to oversee their global operations.
BabelFish™ and its related components are arranged as shown in Appendix A. In order to
understand how BabelFish™ interacts with established processes, each component must
be discussed in turn.
BabelFish™ Portal
Portal is a web-enabled software application and acts as the integration layer of the
BabelFish™ framework. It can be utilised by general users, where unspecialised personnel
are able to view online performance data obtained from multiple site historians. No client
side installation is required and can be accessed through most web browsers. An example
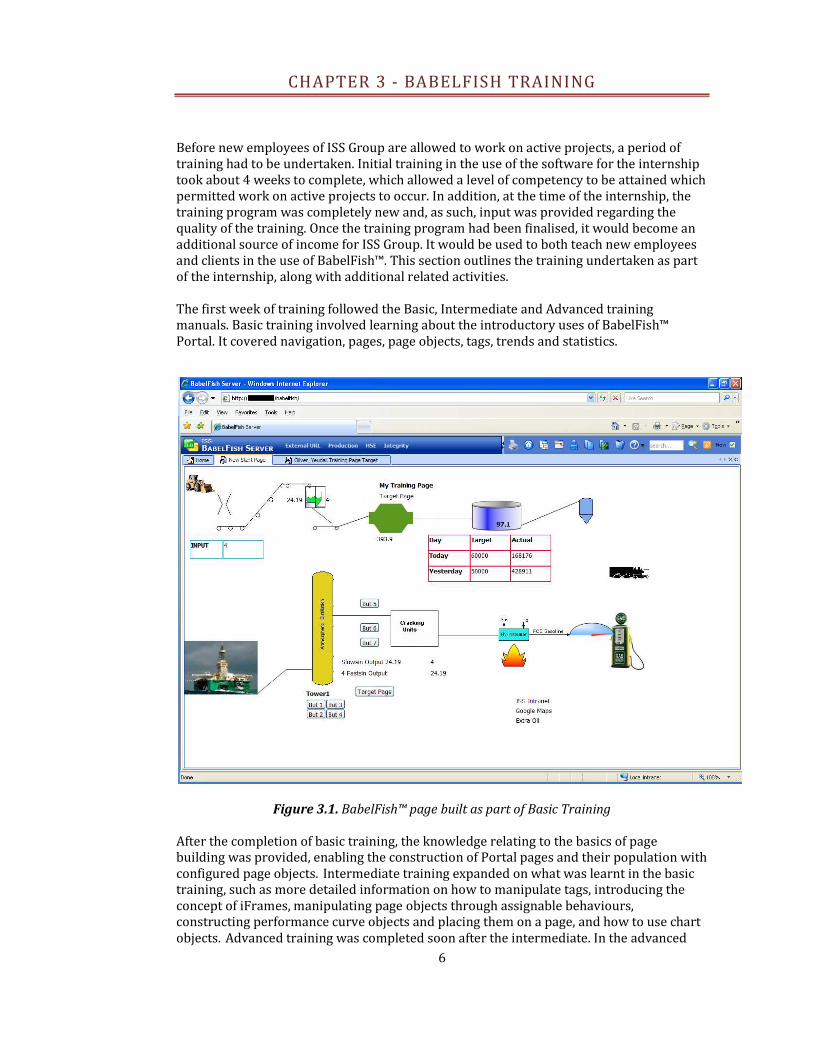
of Portal can be seen in Figure 3.1, where information is displayed related to the initial
training procedure.
BabelFish™ Data Management Server (DMS)
The core of the BabelFish™ framework is the Data Management Server. It acts as a single
point where all of a company’s data sources are collated and organised into useful
information to then be displayed in Portal. It has three main components, which are Data
Broker, Data Dictionary and Calculation Engine.
All data sources connect to the DMS through Data Broker. Data Broker provides the single
connection point where multiple data sources attach via adaptors. It is a simple solution
for the problem of Enterprise Data Integration.
Data Source and Tag information are stored in the Data Dictionary, a hierarchical
reference structure which categorises operation assets into one location. It is a powerful
tool with many different abilities such as:
• Automated fetching of new data sources
• Asset templating
• Procedurally generated pages
4
and many more which reduce development costs for clients when setting up and updating
the framework.
Calculation Engine provides numerical analysis capabilities for BabelFish™. It has a library
of various functions which can use both single-point and historical data sources.
BabelFish™ Software Developers Kit (SDK)
A .NET programming library which enables external development of BabelFish™
applications.
Adaptors
A major strength of BabelFish™ is that it is able to communicate with a wide variety of
data sources. Like BabelFish’s namesake [3], it allows information from multiple types of
source to be translated into a single format. To quote Douglas Adams [3], “if you stick a
BabelFish in your ear you can instantly understand anything said to you in any form of
language.” Data sources which BabelFish™ has adaptors for include [4]:
• Honeywell PHD
• PI
• Exaquantum
• IP21
• Relational (e.g. Oracle)
• SAP
• Maximo
• ODBC/OLEDB
• Web Services
Applications
Along with the basic installation, there are several additional applications produced by ISS
Group and additional third parties which are used to enhance the overall functionality of
BabelFish™.
SOAP – Microsoft product used for various .NET web services. Pre-requisite for the
operation of BabelFish™
Chart FX – Produced by Software FX and is used for advanced charting within Portal.
Operations Daily Reporting System (ODR) – Collates production data from available data
sources and presents them within Portal for operator approval. Includes abnormal
condition checking abilities and is required for some other applications.
Event Monitor – Application used for monitoring of data conditions in BabelFish. When
certain events occur, it is able to notify relevant personnel (Email and SMS), raise work
orders and launch other applications.
A-Plus – ‘Asset and Production Loss Utilisation System’. Records and classifies all asset
downtime events automatically in a hierarchical structure for easy viewing by operators.
5
Utilities
As part of the basic installation, there are several utility programs which have been
produced by ISS. They are used for various functions such as configuring BabelFish™ and
debugging. These include:
ISS Enterprise Manager – Administration utility used to manage the Data Dictionary, task
scheduler and additional applications. It is used for all setups of BabelFish™ to manage the
system at multiple levels, including general Portal administration, debugging and plugin
configuration.
Mercury – Logger program used for displaying messages from MS Message Queue. Aids in
debugging application and communication issues.
6
CHAPTER 3 - BABELFISH TRAINING
Before new employees of ISS Group are allowed to work on active projects, a period of
training had to be undertaken. Initial training in the use of the software for the internship
took about 4 weeks to complete, which allowed a level of competency to be attained which
permitted work on active projects to occur. In addition, at the time of the internship, the
training program was completely new and, as such, input was provided regarding the
quality of the training. Once the training program had been finalised, it would become an
additional source of income for ISS Group. It would be used to both teach new employees
and clients in the use of BabelFish™. This section outlines the training undertaken as part
of the internship, along with additional related activities.
The first week of training followed the Basic, Intermediate and Advanced training manuals. Basic training involved learning about the introductory uses of BabelFish™
Portal. It covered navigation, pages, page objects, tags, trends and statistics.
Figure 3.1. BabelFish™ page built as part of Basic Training
After the completion of basic training, the knowledge relating to the basics of page building was provided, enabling the construction of Portal pages and their population with
configured page objects. Intermediate training expanded on what was learnt in the basic training, such as more detailed information on how to manipulate tags, introducing the
concept of iFrames, manipulating page objects through assignable behaviours, constructing performance curve objects and placing them on a page, and how to use chart
objects. Advanced training was completed soon after the intermediate. In the advanced
7
training, three major areas were covered; embedding SQL queries on a Portal page,
embedding XML on a Portal page, and setting up a combo box to reference both SQL and
XML statements to retrieve information from a database.
Once the three initial training programs were completed, a series of exercises related to
each level of training were performed. These were assessed to gauge the prowess of those
who undertook the training and to finalise the completion of each training level. They
involved creating a series of pages related to a well installation which had three oil wells
and three gas wells. Pages created and populated for the exercises include a home page
showing the field, two pages showing the gas/oil wells and their position in operation, and
individual pages for each well.
The next level was the administrator training. Administration in BabelFish™ covered many
different areas. These include security, Portal configuration, data source configuration, publishing, page configuration/backup and debugging functions. Unlike the first three
levels, initially it was not self-paced. A day’s training session was undertaken, followed by
a period of experimentation to fully grasp the system after the session. Administrator
training involved learning how to configure, manage and troubleshoot the BabelFish™
framework. This not only included Portal, but the Data Dictionary and how it relates to the
bigger picture.
Installation of a BabelFish™ server was another important training exercise performed by
new employees of ISS Group. Version 2.1.3.6 of BabelFish™ was provided, which was installed on virtual machines as part of the training. 2.1.3.6 is an old version which
requires manual configuration of many computer settings in addition to separately installed programs in order to work properly [5]. Much of the installation procedure is
handled by the base installer in newer versions of BabelFish™, however performing the process manually provided additional experience which would not have been gained
through the automatic installation. Part of the installation required setting up a pair of SQL databases used to store Data Dictionary and Portal reference data. Performing this
enabled a greater understanding of how the elements in BabelFish™ interact and how to
manually edit them if the need arises.
Like the first three levels, administration training also required the completion of a series of exercises to assess knowledge of the BabelFish™ framework. The exercises expanded on
what was achieved in the basic/intermediate exercises by using the Data Dictionary to create templates for oil and gas wells, defining the properties, attributes and relevant
renderers. Each well was assigned the relevant template and had their attributes defined via the use of calculated entities to simulate an external data source. In Portal the
templates were used to create templated pages, which populated a base page with the
relevant properties/attributes for the well being accessed without the need to create
individual pages for each well.
8
CHAPTER 4 - INTERNAL WIKI
To assist the client services and support staff with client assistance, an internal wiki is
available which contains common issue resolutions. It is updated on a regular basis to
enable efficient error resolution by staff.
Throughout the internship period, several issues were discovered which were resolved.
After each had been resolved, both the issues and results were then added to the wiki
database for future reference. One of these issues was discovered during the installation
training, caused by SOAP services being configured incorrectly. This page was used as a
reference when working at Fortescue Metals Group in a later project.
One job related to the wiki was migration of its pages to a new server. A new software
package had been implemented at ISS Group which would enable clients to remotely
access wiki pages, raise new issues and provide feedback on the process. Because the two
wikis were run using different software packages, pages could not be migrated
automatically. As a result the migration had to be performed manually by copying and
pasting articles from the old wiki software into the new wiki software. Certain articles in
the wiki were not appropriate for client access, so they were placed in special sections in
the new software.
9
CHAPTER 5 - SAMPLE PERFORMANCE CURVES
The aim of this project was to assist ISS employees with performance curve
documentation/demonstration.
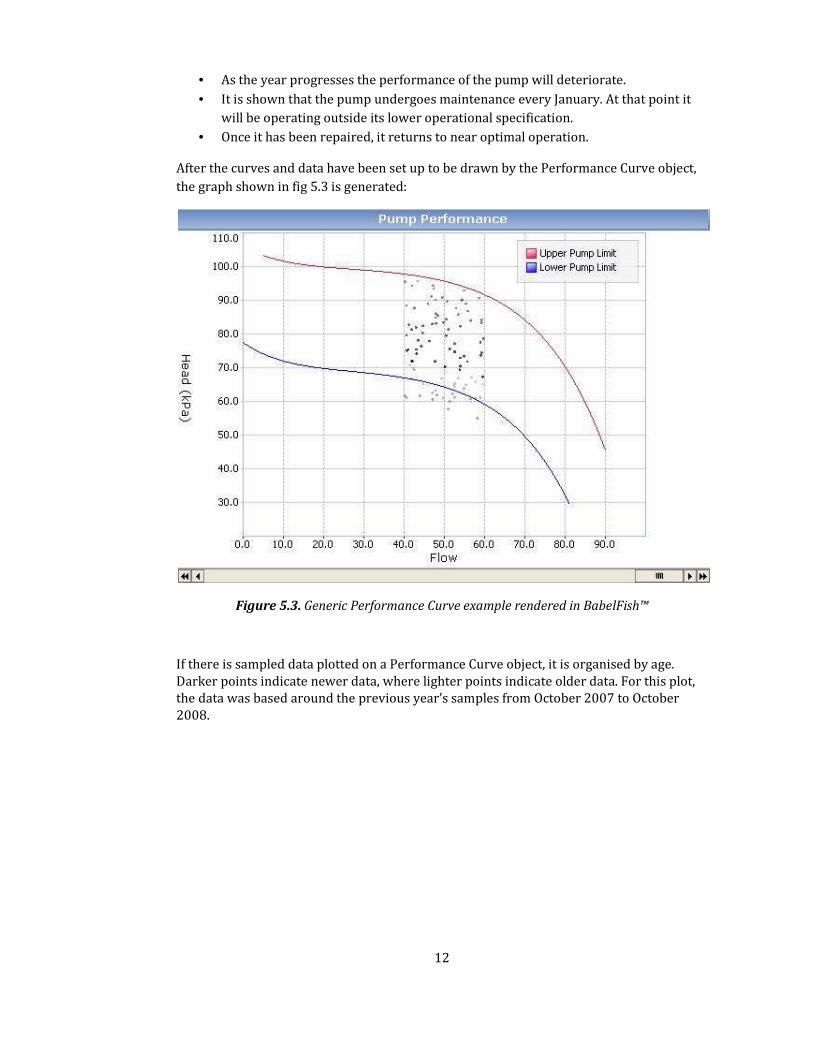
Performance Curves are page objects in BabelFish which allow the display of sampled data
against the specified performance of that unit. This unit may be anything with a
performance curve such as pumps and separators. In order to set up the object for
situations such as training, client demonstrations or job tenders, several sample curves
needed to be created. Four sets of sample curves were created, which were each based on
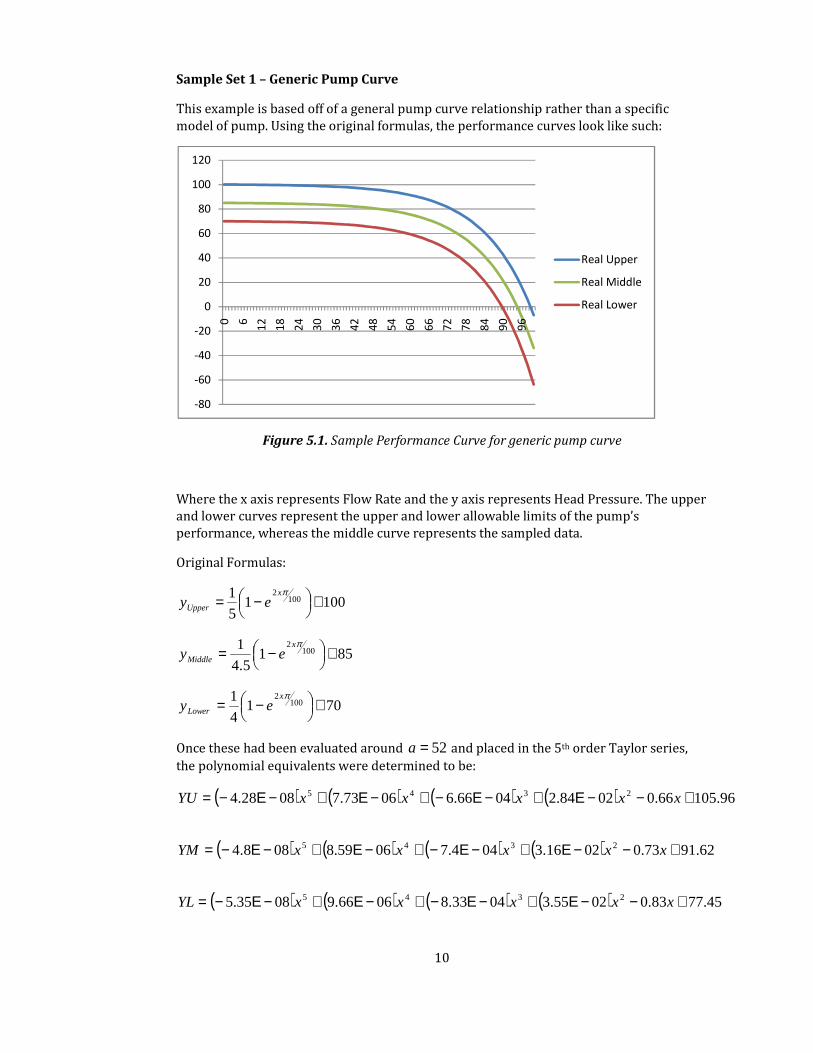
real world examples.
1. Set one was a general pump curve (Head vs. Flow) with upper and lower
performance limits.
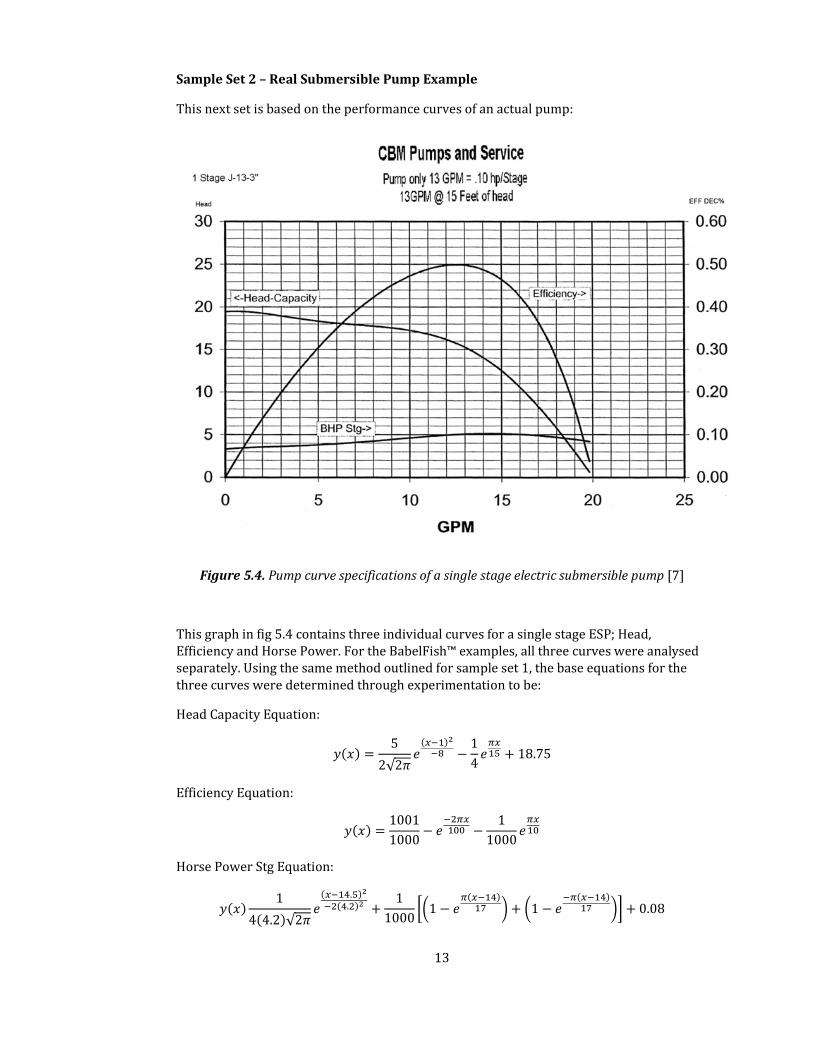
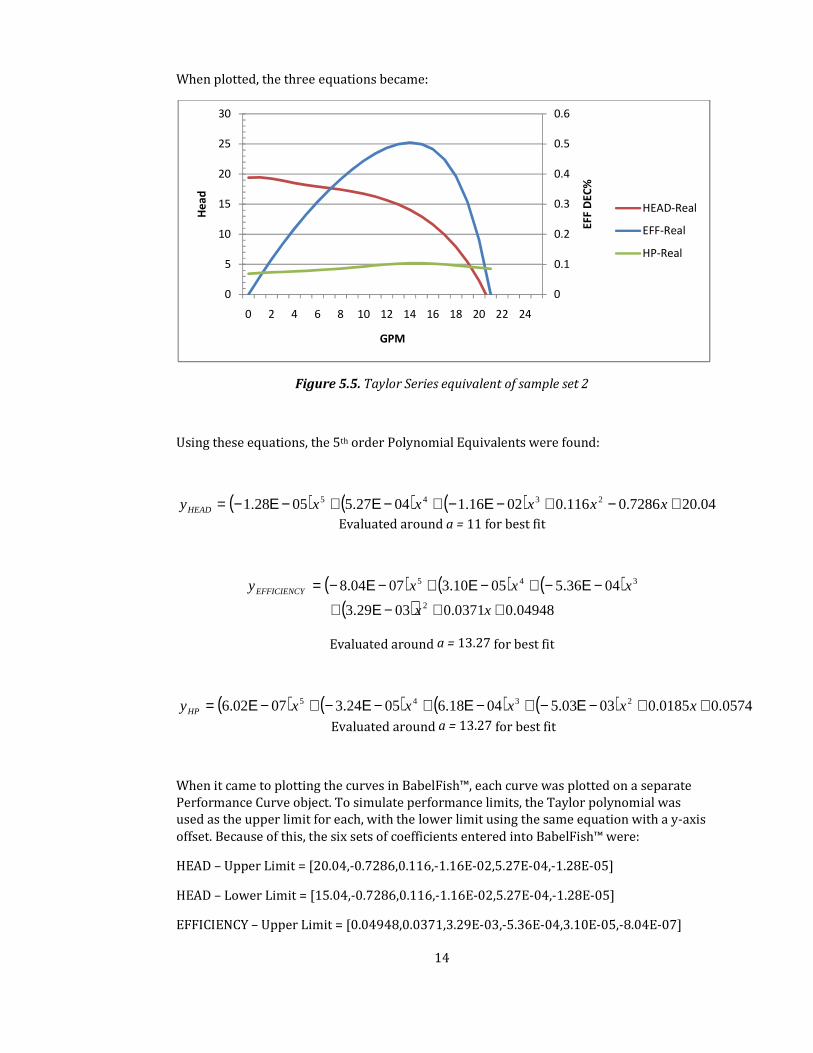
2. The second set was based on the specifications for a single stage pump. This set
had three individual curves for Head, Pump Efficiency and Horse Power.
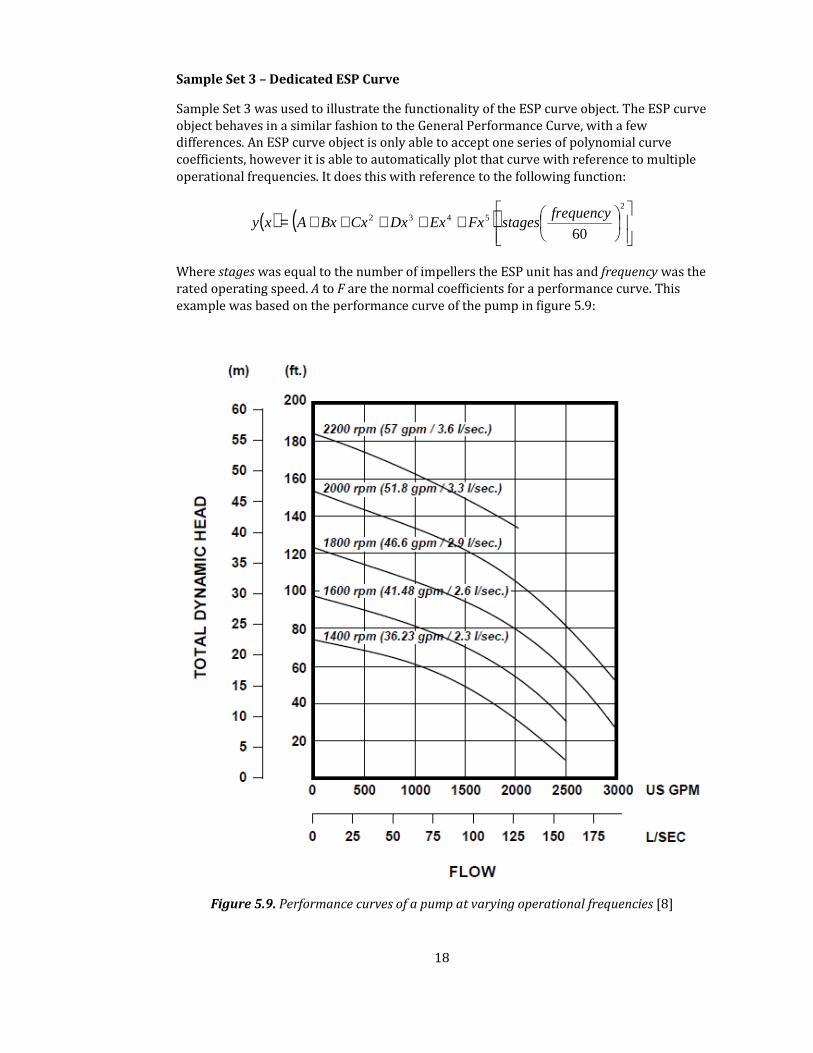
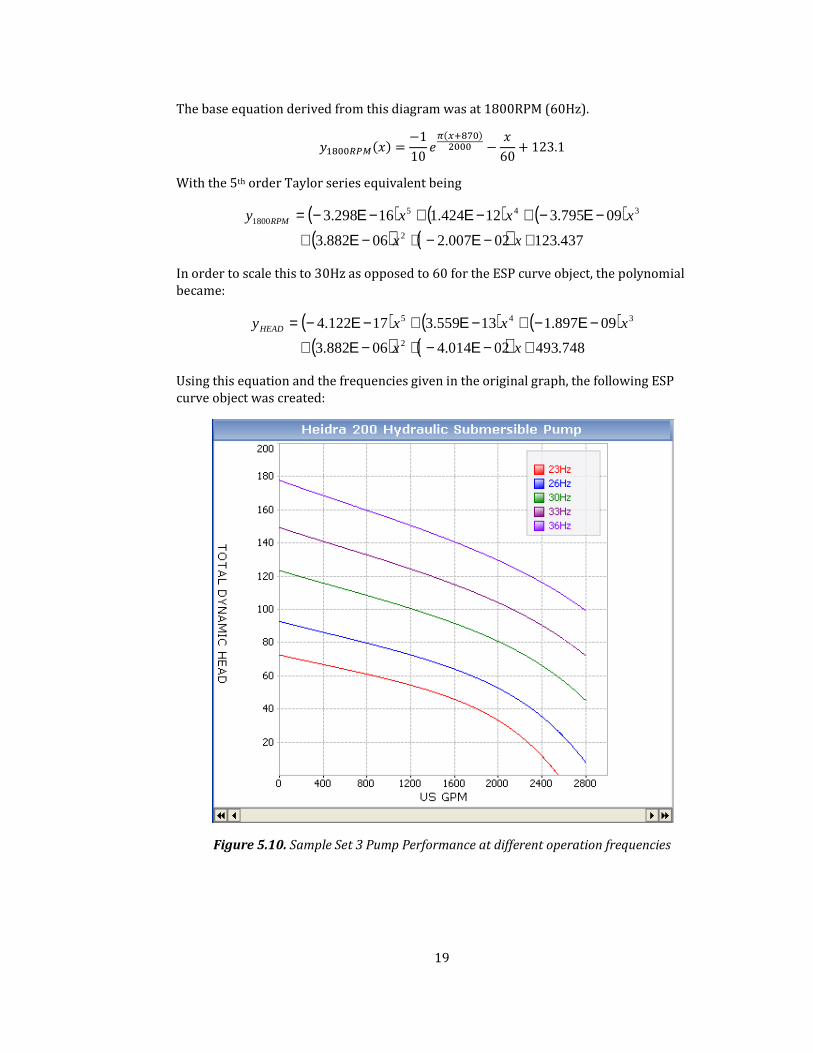
3. Similar to the previous set, the third curve set was with reference to a real pump. It
was created to demonstrate the use of the ESP Curve settings within the
Performance Curve object.
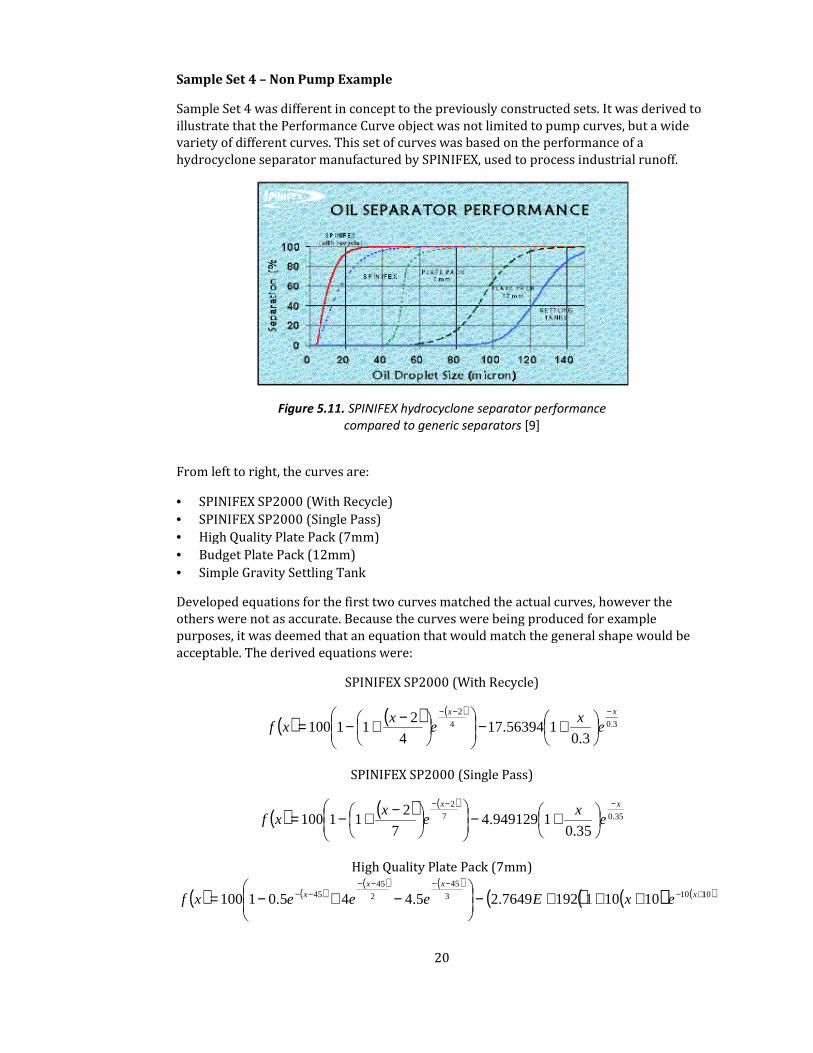
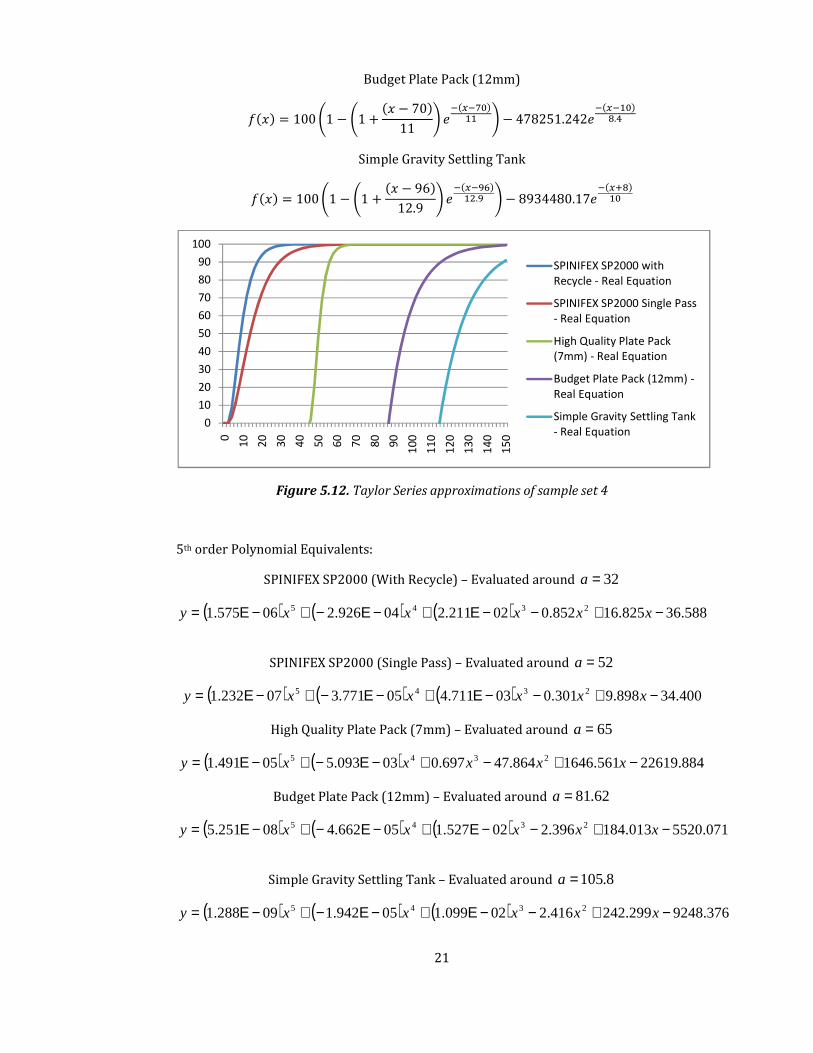
4. The final set was derived from the performance of a hydrocyclone separator to
demonstrate that pumps were not the only process unit which could use the
performance curve object.
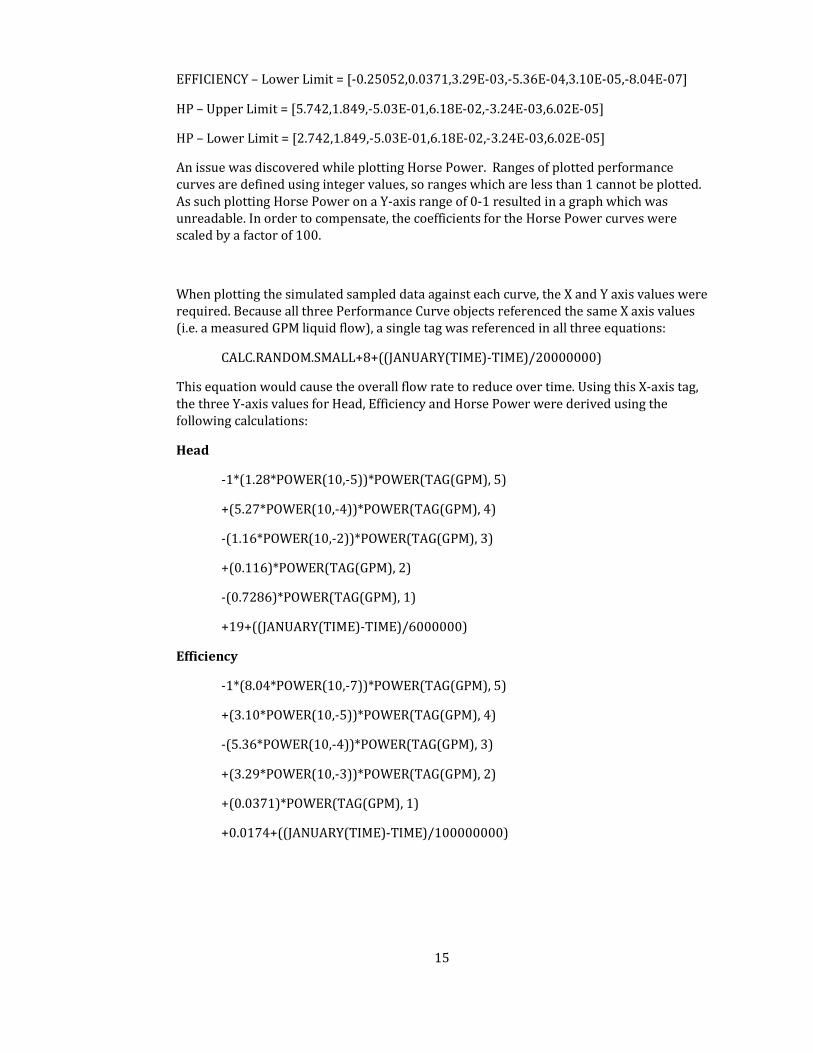
In order to enter formulas for each curve into BabelFish’s performance curve object, six
numeric values have to be placed in the format:
�, �, �, �, �, �
Where the letters are the coefficients of:
�� � � � �� �� �� ��
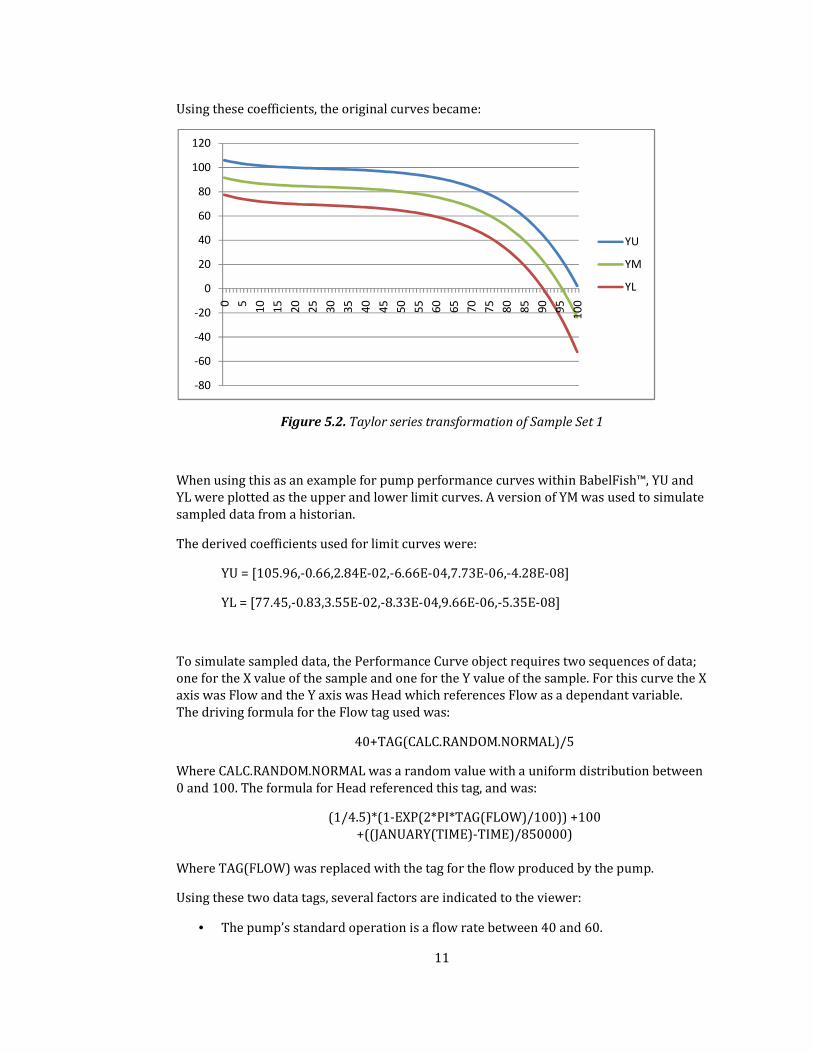
Which is the format required by BabelFish™ to plot curves. The general process for deriving
each of the curves began by finding a formula ( )xy which matched the shape of the original
curve. Next the formula was manipulated to fit into the fifth order Taylor series [6]:
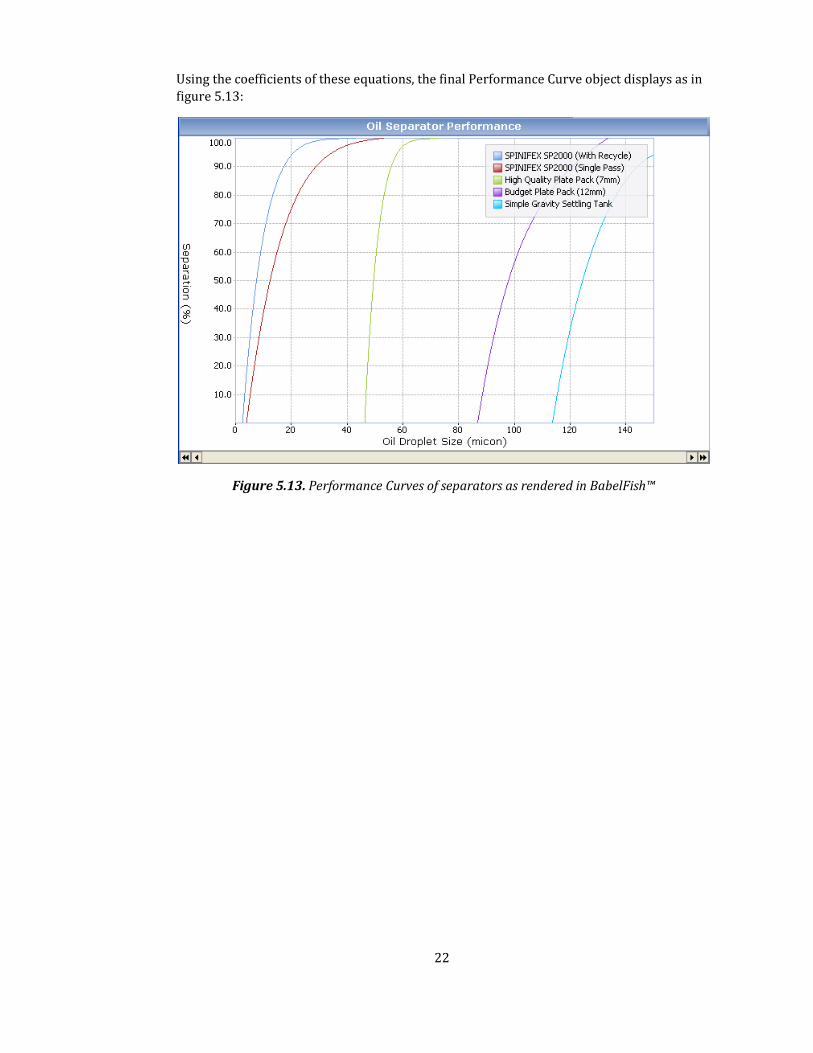
Using the coefficients of these equations, the final Performance Curve object displays as in
figure 5.13:
Figure 5.13. Performance Curves of separators as rendered in BabelFish™
23
CHAPTER 6 - BHP BILLITON ; NICKEL WEST
Nickel West is one of ISS Group’s major projects. BabelFish™ is used to collate data from all
five of its operation sites situated in various locations in Western Australia, to be used by
the corporate headquarters back in Perth. Part of the activities taken as part of the
internship involved working on BHP Billiton’s Nickel West initiative, initially as a training
exercise but later in a support role for the installed systems.
Training
As a training exercise, a reconstruction of the BabelFish™ setup of the Leinster Nickel
Operation’s (LNO) installation was requested as per the Detailed Design Document for
Horizon 1 of the project [10]. The basic page layouts were provided, with the key task
being to populate each with calculated tags. In the actual system, the tags represent
references to LNO’s PHD data historian. Because of this the task was to simulate the process with calculated tags using the same names as the tags in the actual system. If the
original tag was a measured process variable, the driving formula would be:
( )DeviationDeviationRANDOMMean +−+ ,
This would mean the outputted value of the tag would deviate from the mean by a random
number between Deviation− and Deviation+ . The mean was selected based on
information provided in the Detailed Design Document, where images of the final product
were used as a basis for each mean. If the original tag was a Boolean status indicator, then the equation would be:
)0,1,)10(( xRANDOMIF >
This would generate a random number between 0 and 10. If that number was greater thanx , the output would be 1, else 0. x could be any number between 0 and 10, chosen to vary
the weighting of each outcome.
After all the main training was completed, permission was given to apply that knowledge
to projects relating to the actual Nickel West setup.
Tag Transfer
During the fifth week of work at ISS, a project was participated in involving the manual
transfer of tags between a testing server and a production server. During this procedure, a
bug was discovered which prevented all the tags on a given portal page to display. It was
discovered that the error was caused in two situations; when there were too many tags of
a certain type (limits on values) or faulty data source references. This error was passed on
to the development team for inclusion in a future patch.
Horizon 1 - BabelFish™ 2.1.5 Site Acceptance Testing (SAT)
There are several versions of BabelFish™ in use with the setup at Nickel West using 2.1.3,
an older version of the software. Version 2.1.5 is the latest release and as a result Nickel
West requested an upgrade. Because Nickel West is the first client to have the latest
version, test procedures needed to be defined. Version 2.1.5 was installed on a
development server and configured to retrieve data from site historians in the same
manner as the production server. All the Portal pages were also exported to the
development server. SAT would be performed on the development server to make sure
24
that 2.1.5 was ready for deployment on the production server. Testing involved several
distinct stages which are summerised below.
BabelFish™ Installation Verification
Confirming that the core elements of BabelFish™ and relevant web-services were working.
Involved following the general procedure outlined in the BabelFish™ Installation Guide
[5].
Applications/Adaptors Installation Verification
Confirming that the applications and adaptors used at Nickel West worked with the new
version of BabelFish™.
Global Security Settings
Ensuring that the global security settings were the same on the development server as on
the production server.
Performance
Assessing the overall performance of BabelFish™ 2.1.5 as a web-service. This consisted of
such tests as access time, load testing and infinite loop handling.
Page Display
Validating that Nickel West pages on the new version of BabelFish™ displayed the same as
the old version.
Page Tag Assignments
Checking that the tags used and referenced on each Nickel West page were the same in
both versions, including tags assigned to embedded trends, status indicators and level
indicators.
Page Conditions
Making sure that all discrete-state indicators changed status when their driving tags were
returning specific values from historians.
Site Security Settings
Confirming that the user group permissions worked correctly under version 2.1.5 for each
Nickel West site.
Entity Assignment
Validating that all site entities were returning the same data as on the old version of
BabelFish™.
Each of these sets required the construction of a variety of test cases. These began with
testing the higher level sections, like the BabelFish™ core program, then moving on to
more export validation style tests to confirm the proper export of pages from the old
server. These tests were created and performed manually by ISS Client Services using Test
Director at the request of BHP Billiton.
25
Horizon 2 – Loss Asset Utilisation
An addition to the base upgrade of BabelFish™, an expansion of the actual system was
requested by BHP Billiton. This involved upgrades to existing pages, new pages/templated
pages and entity hierarchies. Activities undertaken included preparation for Factory
Acceptance Testing (FAT), troubleshooting server issues and assisting in the development
of the Detailed Design Document. This project had not reached completion by the
submission date, however it is scheduled to continue up to and beyond the end of the
internship time period (21st of November).
26
CHAPTER 7 - FORTESCUE METALS GROUP LTD.
One of ISS Group’s major clients is Fortescue Metals Group (FMG). FMG uses BabelFish™ to
oversee its West Australian operations. As an internship project, with the assistance of ISS
personnel on-site, a BabelFish™ server migration was performed. This involved setting up
BabelFish™ and all the components relevant to this system on a new production server,
with all the settings and configuration data stored in a separate SQL database. This was
performed over a period beginning on Friday the 26th of September until Friday the 3rd of
October with time billable to FMG. Installation of the software was performed under the
supervision of FMG’s System Administrator, Michael Pryor.
Installation
The SQL database for BabelFish™ is kept on a separate server to BabelFish™ itself to
increase overall system performance. Before work on the project had commenced, the SQL
database had already been migrated to a new server by Michael Pryor.
Installation and configuration of the relevant software was performed according to the
procedure outlined by Product Consultant Andrew Chew. Because the install was based on
an existing server, the installation involved more steps than a standard install. These
additional steps included:
• Copying/modifying configuration files from the old production server to the new
production server.
• Running scripts to update connection parameters for plug-ins and BabelFish™
adaptors.
• Copying custom VML (Vector Markup Language) and XML code which has been
developed specifically for FMG.
• Setting up appropriate DSN connections.
• Configuring additional applications used within Portal for use on the new server.
Testing
Once the main installation procedure had been completed, the project moved on to the
testing phase before the new server could be commissioned. This involved following the
Quality Assurance procedures set down by ISS to properly validate a fresh BabelFish™
installation [5].
After verifying the installation of BabelFish™, all the individual Portal pages had to be
tested to make sure that all links worked correctly, all the tags displayed properly, and all
the tags showed the same data as on the old production server. This also verified the
correct install and configuration of the adaptors and plug-ins, many of which were used to
generate page objects.
While performing these tests several issues with the BabelFish™ install were discovered
and are listed below.
Issue 1
In order for web users to access BabelFish™ Portal (as hosted on the web server), the
reference SQL databases are required to have specific database owner names and
passwords. When the SQL database was copied from the old SQL server to the new one, all
27
the owner passwords had reset. This caused a variety of problems when attempting to
access Portal with a web browser. Depending on which combination of passwords were
incorrect, various errors were returned by Internet Explorer, such as “This page cannot be
displayed”, “You do not have permission to view this page” and “Service Unavailable”.
In addition to the SQL database security settings, certain folders on the BabelFish™ server
are required to have custom access permissions in order to allow the BabelFish™ software
to function. Once these permissions were properly set up access to the BabelFish™ server
through a web browser was enabled, solving many other related issues.
Issue 2
In Portal, entity hierarchies from the Data Dictionary can be accessed by a user through
the Plant Hierarchy Tree toolbox. Entities cannot be modified in this view, however they
can be used for general reference and page building purposes. After the installation the
Plant Hierarchy Tree was unable to be displayed, returning the error “Input string was not
in a correct format”. It was discovered that this error could be caused by two potential
problems:
• The config file for the BabelFish™ Data Dictionary points to the machine name
instead of ‘localhost’.
• An improper installation of SOAP services
As SOAP services had been left out of the original installation, that was deemed to be the
issue. After installing SOAP the Plant Hierarchy Tree was able to be accessed by Portal
users.
Issue 3
One of the verification tests to be performed on a BabelFish™ server is to access the URL
http://[server_name]/BFDD and follow three hyperlinks. Each hyperlink runs a query
which tests the web services connection to the BabelFish™ Database. When these tests
were run, an error was returned stating “Expected input string of type xml but returned
html”. This issue was solved by the installation of SOAP services, however it has also been
known to occur when the improper xml parsers have been installed.
28
CONCLUSION
This was the Final Report for ENG 450 – Final Year Engineering Internship. Much was
learnt throughout the internship period, both technical and business process related. A
variety of projects were worked on, ranging from initial training to testing, which provided
a wide range of experience for future careers in industry. Projects worked on as part of the
internship were outlined and the main details of which were discussed.
29
GLOSSARY
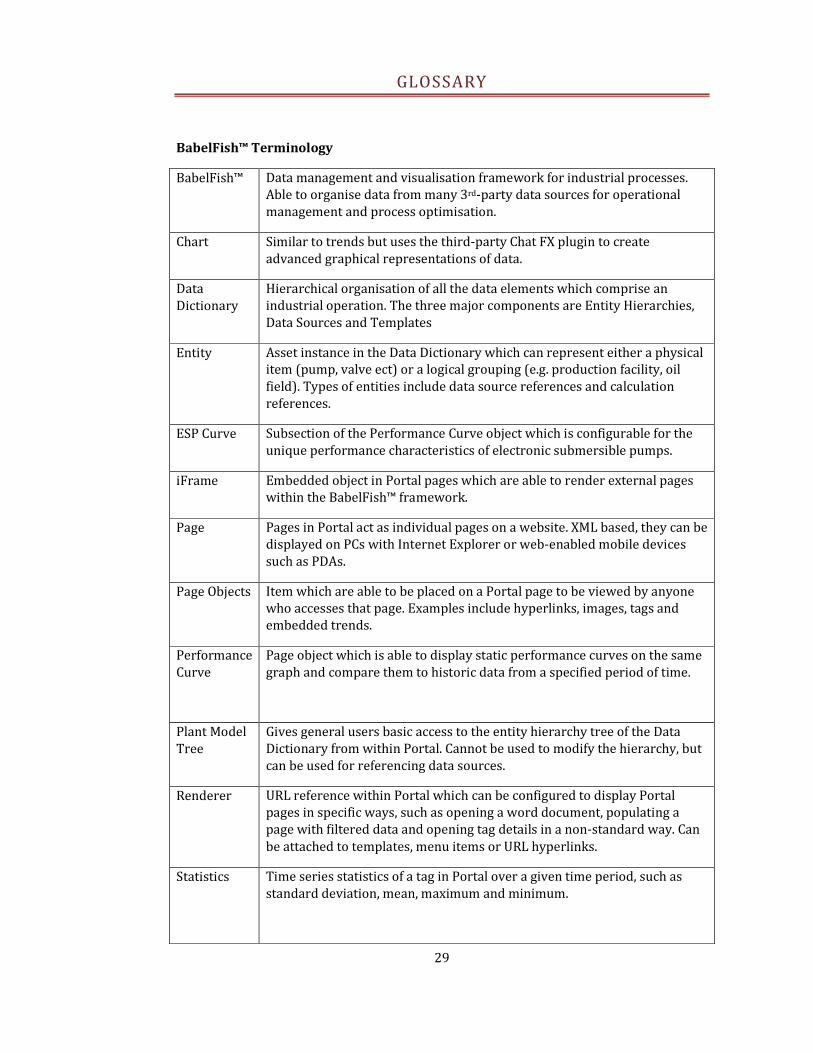
BabelFish™ Terminology
BabelFish™ Data management and visualisation framework for industrial processes.
Able to organise data from many 3rd-party data sources for operational
management and process optimisation.
Chart Similar to trends but uses the third-party Chat FX plugin to create
advanced graphical representations of data.
Data
Dictionary
Hierarchical organisation of all the data elements which comprise an
industrial operation. The three major components are Entity Hierarchies,
Data Sources and Templates
Entity Asset instance in the Data Dictionary which can represent either a physical
item (pump, valve ect) or a logical grouping (e.g. production facility, oil
field). Types of entities include data source references and calculation
references.
ESP Curve Subsection of the Performance Curve object which is configurable for the
unique performance characteristics of electronic submersible pumps.
iFrame Embedded object in Portal pages which are able to render external pages
within the BabelFish™ framework.
Page Pages in Portal act as individual pages on a website. XML based, they can be
displayed on PCs with Internet Explorer or web-enabled mobile devices
such as PDAs.
Page Objects Item which are able to be placed on a Portal page to be viewed by anyone
who accesses that page. Examples include hyperlinks, images, tags and
embedded trends.
Performance
Curve
Page object which is able to display static performance curves on the same
graph and compare them to historic data from a specified period of time.
Plant Model
Tree
Gives general users basic access to the entity hierarchy tree of the Data
Dictionary from within Portal. Cannot be used to modify the hierarchy, but
can be used for referencing data sources.
Renderer URL reference within Portal which can be configured to display Portal
pages in specific ways, such as opening a word document, populating a
page with filtered data and opening tag details in a non-standard way. Can
be attached to templates, menu items or URL hyperlinks.
Statistics Time series statistics of a tag in Portal over a given time period, such as
standard deviation, mean, maximum and minimum.
30
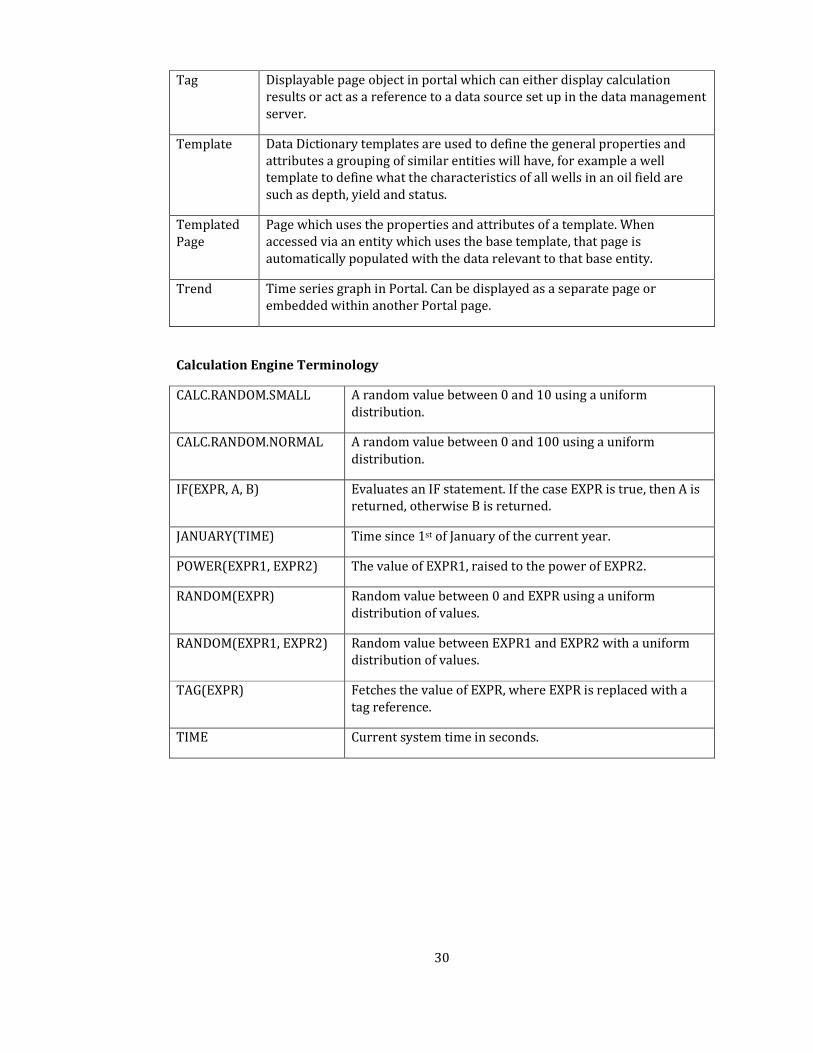
Tag Displayable page object in portal which can either display calculation
results or act as a reference to a data source set up in the data management
server.
Template Data Dictionary templates are used to define the general properties and
attributes a grouping of similar entities will have, for example a well
template to define what the characteristics of all wells in an oil field are
such as depth, yield and status.
Templated
Page
Page which uses the properties and attributes of a template. When
accessed via an entity which uses the base template, that page is
automatically populated with the data relevant to that base entity.
Trend Time series graph in Portal. Can be displayed as a separate page or
embedded within another Portal page.
Calculation Engine Terminology
CALC.RANDOM.SMALL A random value between 0 and 10 using a uniform
distribution.
CALC.RANDOM.NORMAL A random value between 0 and 100 using a uniform
distribution.
IF(EXPR, A, B) Evaluates an IF statement. If the case EXPR is true, then A is
returned, otherwise B is returned.
JANUARY(TIME) Time since 1st of January of the current year.
POWER(EXPR1, EXPR2) The value of EXPR1, raised to the power of EXPR2.
RANDOM(EXPR) Random value between 0 and EXPR using a uniform
distribution of values.
RANDOM(EXPR1, EXPR2) Random value between EXPR1 and EXPR2 with a uniform
distribution of values.
TAG(EXPR) Fetches the value of EXPR, where EXPR is replaced with a
tag reference.
TIME Current system time in seconds.
31
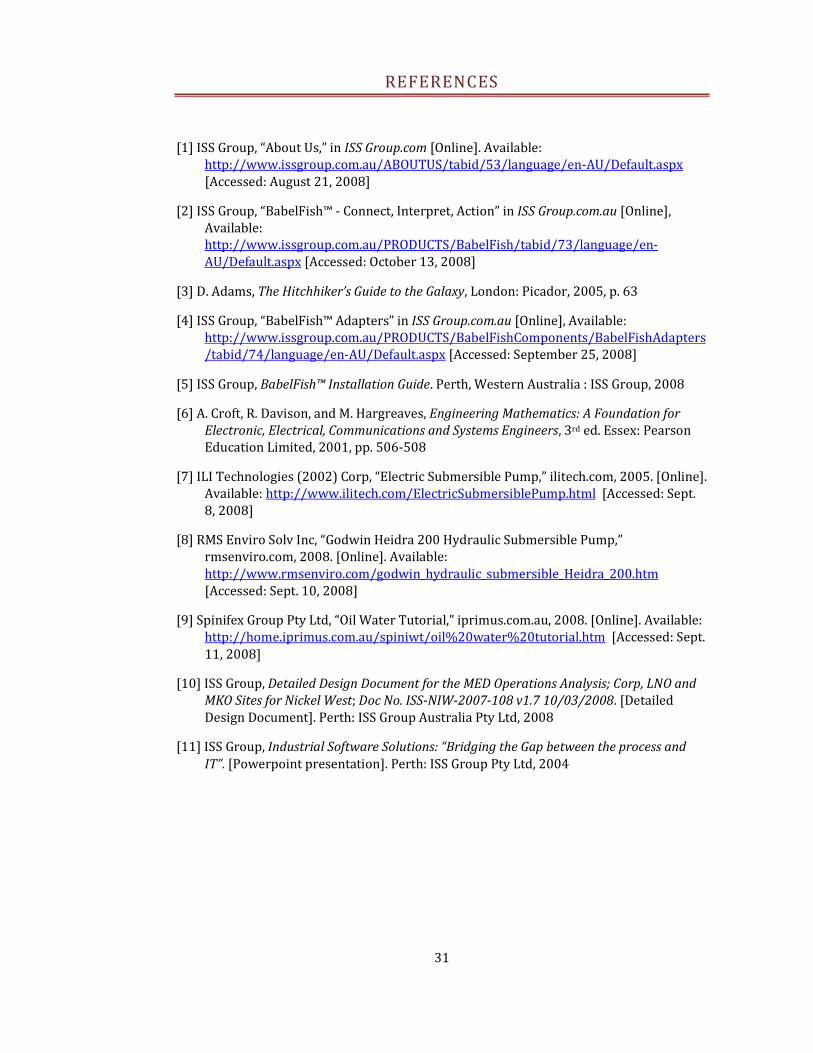
REFERENCES
[1] ISS Group, “About Us,” in ISS Group.com [Online]. Available: