REACT-1 round 12 report: resurgence of SARS-CoV-2 infections in England associated with increased frequency of the Delta variant Steven Riley 1,2, *, Haowei Wang 1,2 , Oliver Eales 1,2 , David Haw 1,2 , Caroline E. Walters 1,2 , Kylie E. C. Ainslie 1,2,3 , Christina Atchison 1 , Claudio Fronterre 4 , Peter J. Diggle 4 , Andrew J. Page 5 , Sophie J. Prosolek 5 , Alexander J. Trotter 5 , Thanh Le Viet 5 , Nabil-Fareed Alikhan 5 , Leigh M Jackson 6 , Catherine Ludden 7 , The COVID-19 Genomics UK (COG-UK) Consortium 8,# , Deborah Ashby 1 , Christl A. Donnelly 1,2,9 , Graham Cooke 10,11,12 , Wendy Barclay 10 , Helen Ward 1,11,12 , Ara Darzi 11,12,13 , Paul Elliott 1,11,12,14,15,16 * 1 School of Public Health, Imperial College London, UK 2 MRC Centre for Global infectious Disease Analysis and Abdul Latif Jameel Institute for Disease and Emergency Analytics, Imperial College London, UK 3 Centre for Infectious Disease Control, National Institute for Public Health and the Environment, Bilthoven, The Netherlands 4 CHICAS, Lancaster Medical School, Lancaster University, UK and Health Data Research, UK 5 Quadram Institute, Norwich, UK 6 Medical School, University of Exeter, UK 7 Department of Medicine, University of Cambridge, UK 8 https://www.cogconsortium.uk 9 Department of Statistics, University of Oxford, UK 10 Department of Infectious Disease, Imperial College London, UK 11 Imperial College Healthcare NHS Trust, UK 12 National Institute for Health Research Imperial Biomedical Research Centre, UK 13 Institute of Global Health Innovation at Imperial College London, UK 14 MRC Centre for Environment and Health, School of Public Health, Imperial College London, UK 15 Health Data Research (HDR) UK London at Imperial College 16 UK Dementia Research Institute at Imperial College *Corresponding authors: Steven Riley and Paul Elliott, [email protected], [email protected], School of Public Health, Imperial College London, Norfolk Place, London, W2 1PG # Full list of consortium names and affiliations is provided as a supporting document 1
Transcript
REACT-1 round 12 report: resurgence of SARS-CoV-2 infections in Englandassociated with increased frequency of the Delta variant
Steven Riley1,2,*, Haowei Wang1,2, Oliver Eales1,2, David Haw1,2, Caroline E. Walters1,2, KylieE. C. Ainslie1,2,3, Christina Atchison1, Claudio Fronterre4, Peter J. Diggle4, Andrew J. Page5,Sophie J. Prosolek5, Alexander J. Trotter5, Thanh Le Viet5, Nabil-Fareed Alikhan5, Leigh MJackson6, Catherine Ludden7, The COVID-19 Genomics UK (COG-UK) Consortium8,#,Deborah Ashby1, Christl A. Donnelly1,2,9, Graham Cooke10,11,12, Wendy Barclay10, HelenWard1,11,12, Ara Darzi11,12,13, Paul Elliott1,11,12,14,15,16 *
1 School of Public Health, Imperial College London, UK
2 MRC Centre for Global infectious Disease Analysis and Abdul Latif Jameel Institute forDisease and Emergency Analytics, Imperial College London, UK
3 Centre for Infectious Disease Control, National Institute for Public Health and theEnvironment, Bilthoven, The Netherlands
4 CHICAS, Lancaster Medical School, Lancaster University, UK and Health Data Research,UK
5 Quadram Institute, Norwich, UK
6 Medical School, University of Exeter, UK
7 Department of Medicine, University of Cambridge, UK
8 https://www.cogconsortium.uk
9 Department of Statistics, University of Oxford, UK
10 Department of Infectious Disease, Imperial College London, UK
11 Imperial College Healthcare NHS Trust, UK
12 National Institute for Health Research Imperial Biomedical Research Centre, UK
13 Institute of Global Health Innovation at Imperial College London, UK
14 MRC Centre for Environment and Health, School of Public Health, Imperial CollegeLondon, UK
15 Health Data Research (HDR) UK London at Imperial College
16 UK Dementia Research Institute at Imperial College
*Corresponding authors: Steven Riley and Paul Elliott, [email protected],[email protected], School of Public Health, Imperial College London, Norfolk Place,London, W2 1PG
# Full list of consortium names and affiliations is provided as a supporting document
1
Abstract
Background
England entered a third national lockdown from 6 January 2021 due to the COVID-19pandemic. Despite a successful vaccine rollout during the first half of 2021, cases andhospitalisations have started to increase since the end of May as the SARS-CoV-2 Delta(B.1.617.2) variant increases in frequency. The final step of relaxation of COVID-19restrictions in England has been delayed from 21 June to 19 July 2021.
Methods
The REal-time Assessment of Community Transmision-1 (REACT-1) study measures theprevalence of swab-positivity among random samples of the population of England. Round12 of REACT-1 obtained self-administered swab collections from participants from 20 May2021 to 7 June 2021; results are compared with those for round 11, in which swabs werecollected from 15 April to 3 May 2021.
Results
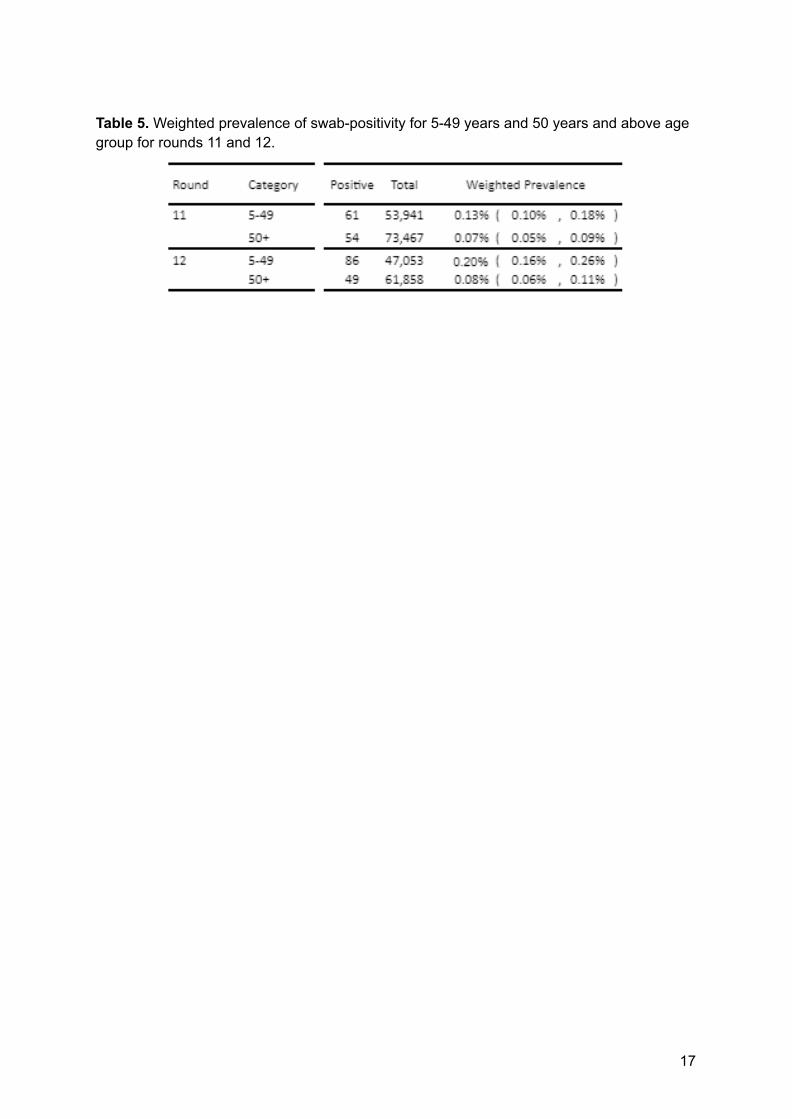
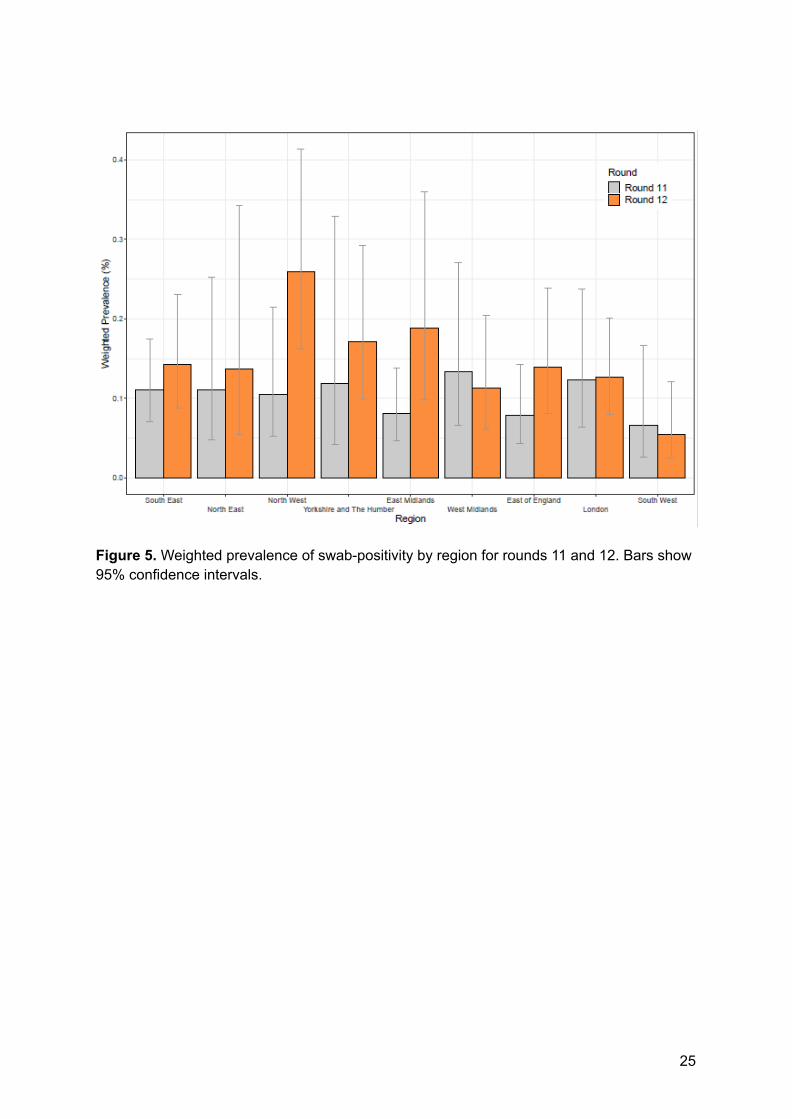
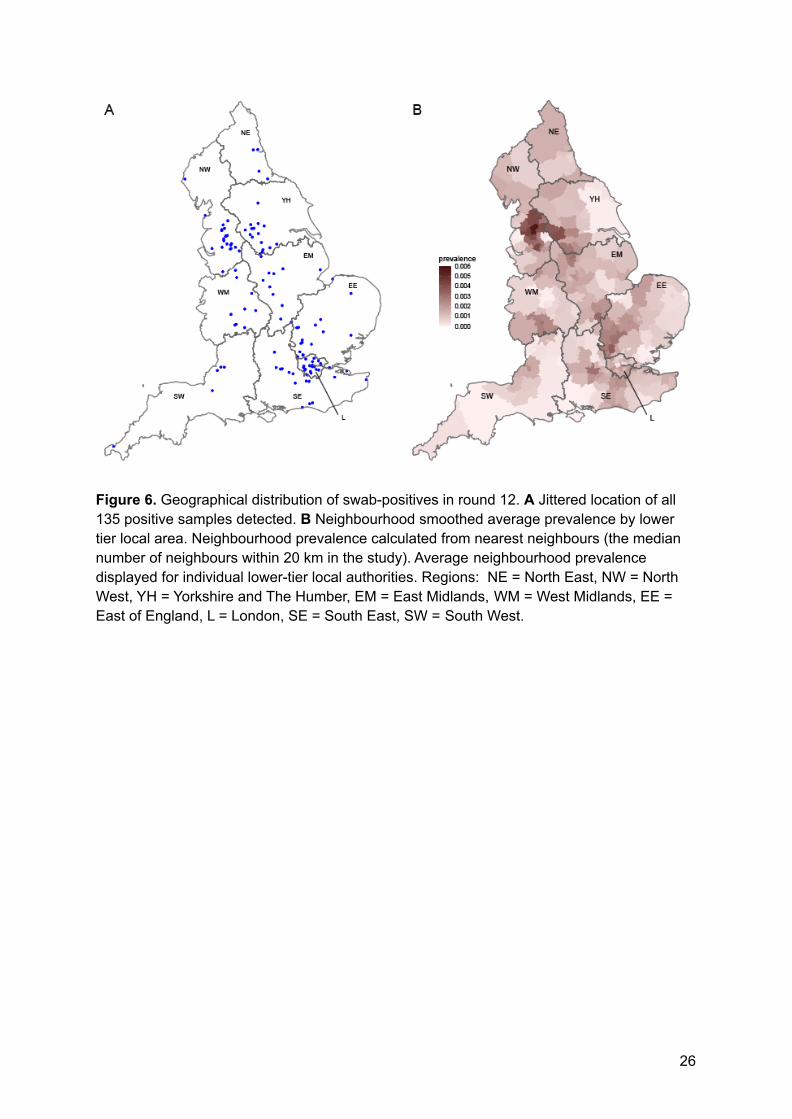
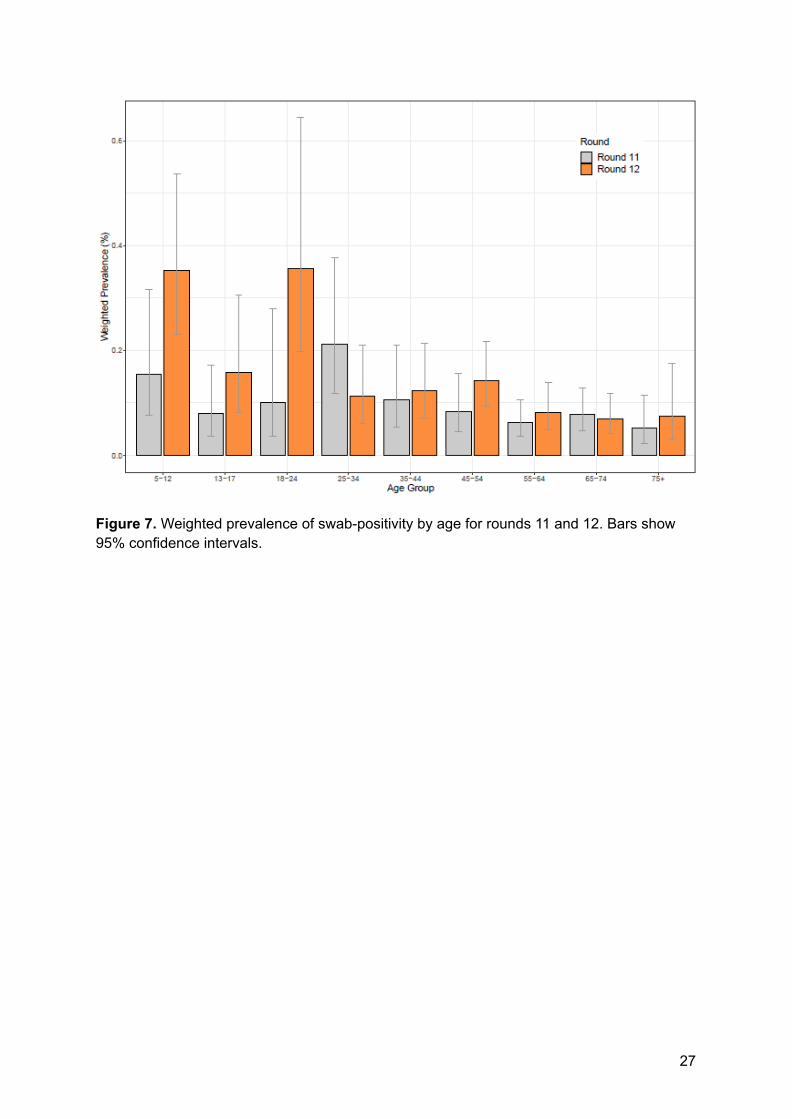
Between rounds 11 and 12, national prevalence increased from 0.10% (0.08%, 0.13%) to0.15% (0.12%, 0.18%). During round 12, we detected exponential growth with a doublingtime of 11 (7.1, 23) days and an R number of 1.44 (1.20, 1.73). The highest prevalence wasfound in the North West at 0.26% (0.16%, 0.41%) compared to 0.05% (0.02%, 0.12%) in theSouth West. In the North West, the locations of positive samples suggested a cluster inGreater Manchester and the east Lancashire area. Prevalence in those aged 5-49 was 2.5times higher at 0.20% (0.16%, 0.26%) compared with those aged 50 years and above at0.08% (0.06%, 0.11%). At the beginning of February 2021, the link between infection ratesand hospitalisations and deaths started to weaken, although in late April 2021, infectionrates and hospital admissions started to reconverge. When split by age, the weakened linkbetween infection rates and hospitalisations at ages 65 years and above was maintained,while the trends converged below the age of 65 years. The majority of the infections in theyounger group occurred in the unvaccinated population or those without a stated vaccinehistory. We observed the rapid replacement of the Alpha (B.1.1.7) variant of SARS-CoV-2with the Delta variant during the period covered by rounds 11 and 12 of the study.
Discussion
The extent to which exponential growth continues, or slows down as a consequence of thecontinued rapid roll-out of the vaccination programme, including to young adults, requiresclose monitoring. Data on community prevalence are vital to track the course of the epidemicand inform ongoing decisions about the timing of further lifting of restrictions in England.
2
Introduction
The global distribution of COVID-19 cases and deaths is being driven by the emergence of
more transmissible variants [1], variation in levels of population immunity obtained either
from infection or vaccination [2], and by the degree of physical, social and workplace mixing
[3]. Since late December 2020, in England, a successful vaccination campaign [4] has
substantially increased population immunity while the gradual easing of the third national
lockdown has led to an increase in social mixing [5]. Since the end of April 2021, the Delta
(B.1.617.2) variant, first identified in India, has been replacing the Alpha (B.1.1.7) variant,
first identified in the UK [6], in routinely collected genomic data [7], and case numbers and
hospitalisations have started to rise [8]. These factors informed the decision to implement a
four-week delay in the final stage of easing lockdown restrictions in England from 21 June to
19 July [9].
Here we report results from the twelfth round of the REal-time Assessment of Community
Transmission-1 study (REACT-1) involving a random sample of the population of England.
We invited named individuals to provide a throat and nose swab for RT-PCR testing for
SARS-CoV-2 virus, and to answer an online questionnaire [10,11]. In round 12 we obtained
self-administered swab collections from participants from 20 May 2021 to 7 June 2021. We
compare these results to those from round 11 of REACT-1, in which swabs were collected
from 15 April to 3 May 2021.
Results
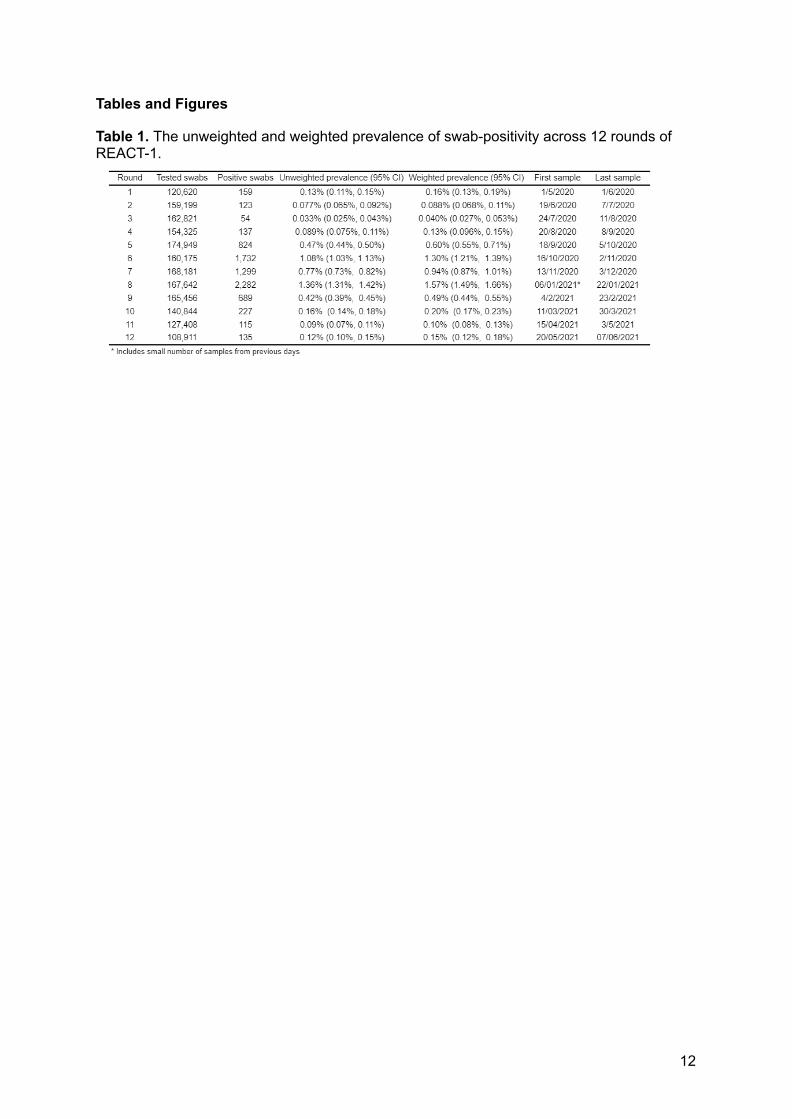
In round 12 we obtained 135 positives overall from 108,911 valid swabs giving a weighted
prevalence of 0.15% (0.12%, 0.18%) (Table 1). This compares with weighted prevalence in
round 11 of 0.10% (0.08%, 0.13%).
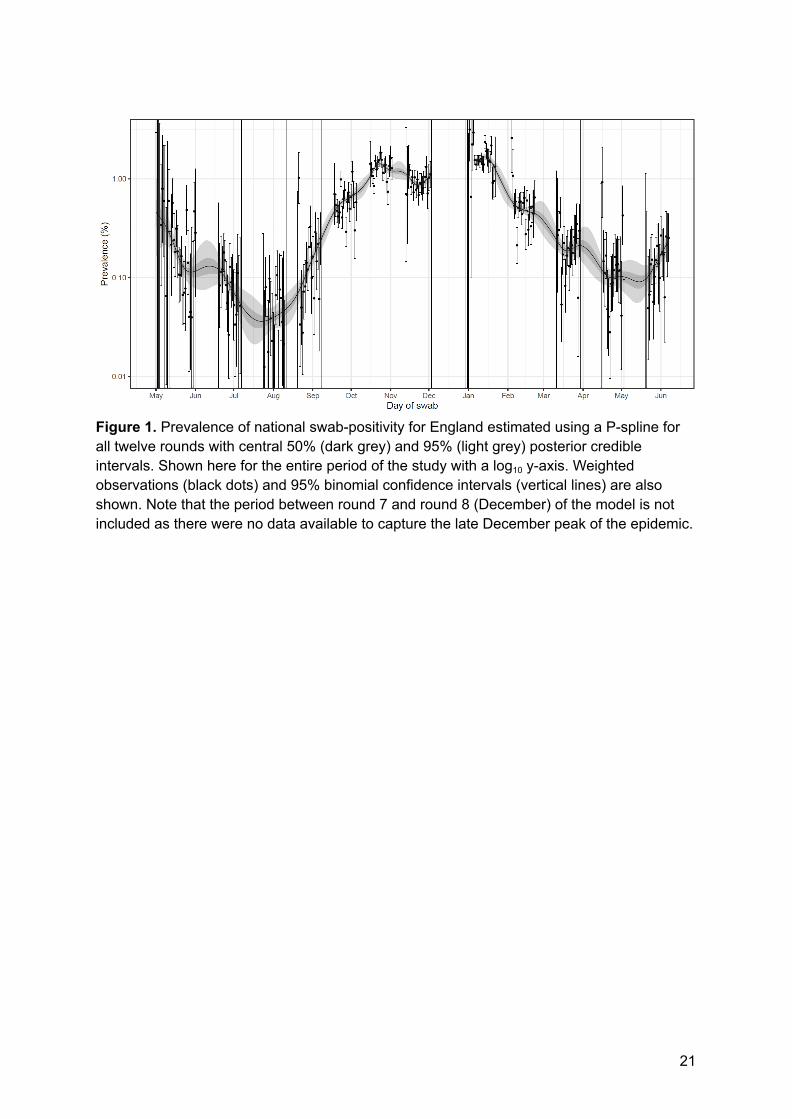
We saw exponential growth in the proportion of swabs that were positive during round 12
(Figure 1). Using constant growth rate models we found strong evidence for a recent
increase in R during round 12: R was 1.44 (1.20, 1.73) with >99% probability that R > 1
(Table 2) and with a doubling time of 11 (7.1, 23) days; the rate of growth was slightly lower
with use of a P-spline model (Figure 2). From round 11 to round 12, R was 1.07 (1.03, 1.12).
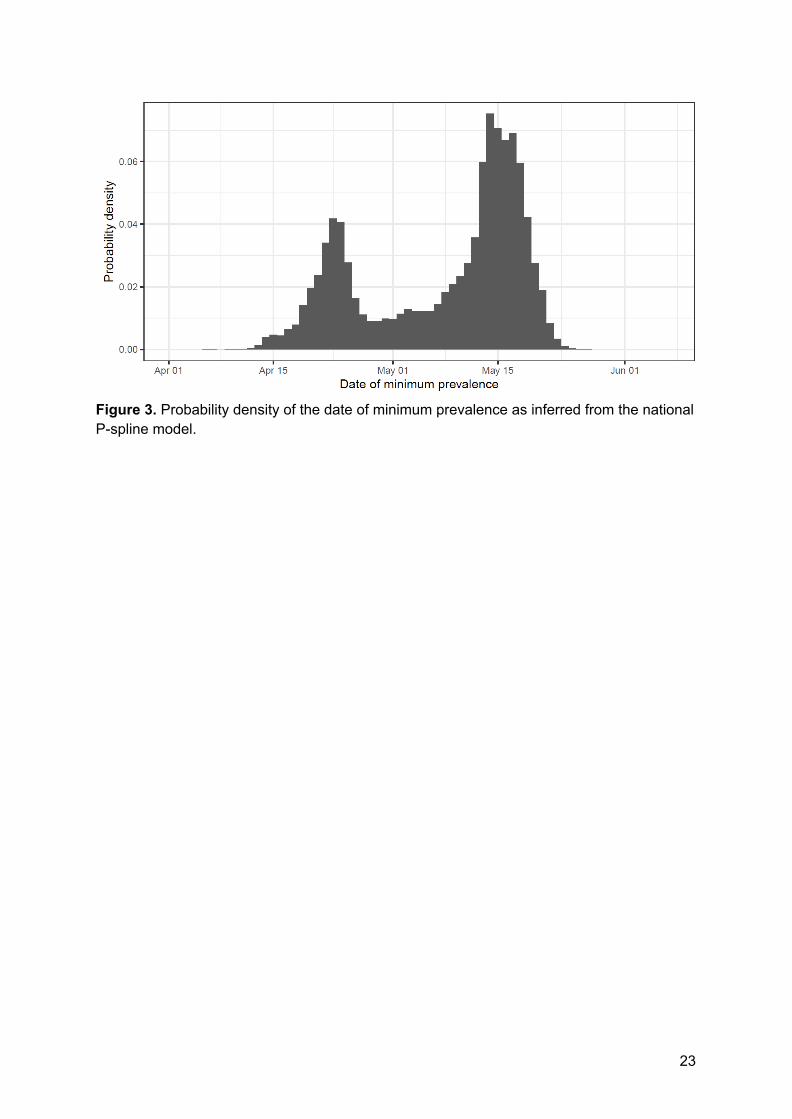
After previously documented declines in swab positivity in England [12] we estimate a
turning point on or around 13 May (18 April, 21 May) after which prevalence started to
increase (Figure 1, Figure 3).
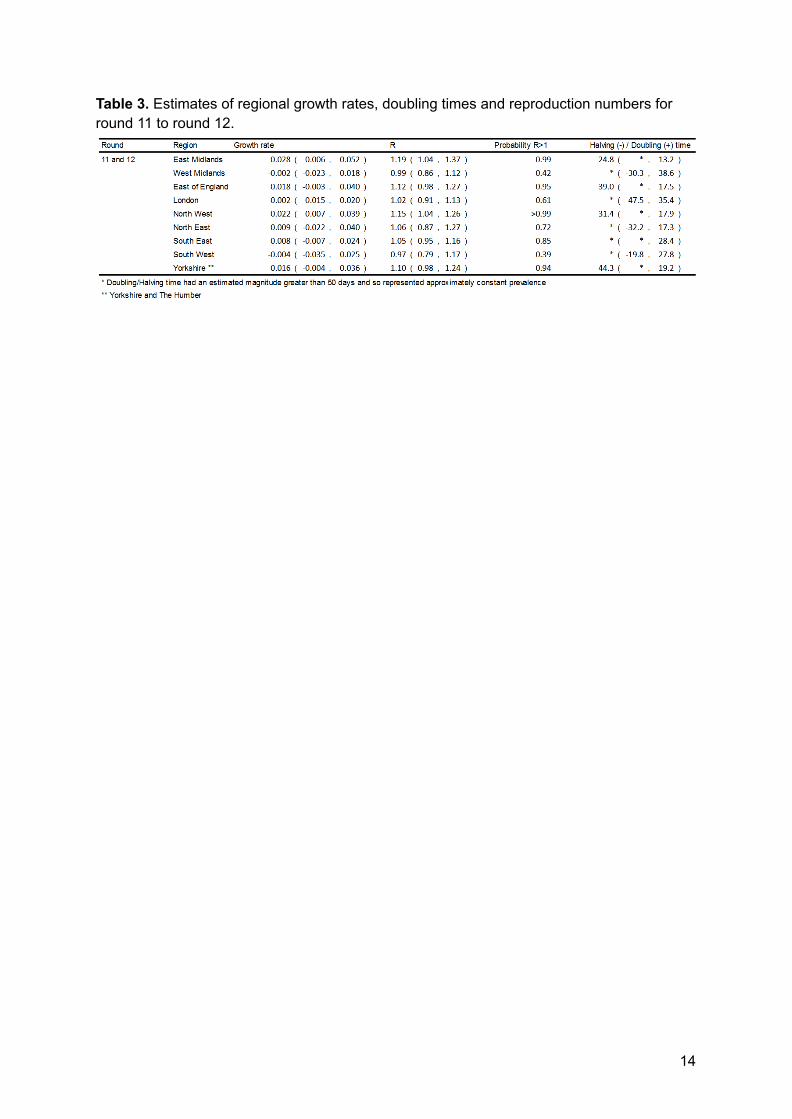
Regional R between rounds 11 and 12 was above one with probability ≥95% in the North
West, East Midlands and East of England (Table 3). For other regions, there was no strong
2. Coronavirus Pandemic (COVID-19). In: Our World in Data [Internet]. [cited 6 Apr 2021].Available: https://ourworldindata.org/
3. Zheng Q, Jones FK, Leavitt SV, Ung L, Labrique AB, Peters DH, et al. HIT-COVID, aglobal database tracking public health interventions to COVID-19. Sci Data. 2020;7:286.
4. Pritchard E, Matthews PC, Stoesser N, Eyre DW, Gethings O, Vihta K-D, et al. Impact ofvaccination on new SARS-CoV-2 infections in the United Kingdom. Nat Med. 2021.doi:10.1038/s41591-021-01410-w
5. UK Government. Prime Minister sets out roadmap to cautiously ease lockdownrestrictions. In: GOV.UK [Internet]. [cited 3 Feb 2021]. Available:https://www.gov.uk/government/news/prime-minister-sets-out-roadmap-to-cautiously-ease-lockdown-restrictions
6. Volz E, Mishra S, Chand M, Barrett JC, Johnson R, Geidelberg L, et al. Assessingtransmissibility of SARS-CoV-2 lineage B.1.1.7 in England. Nature. 2021.
7. Public Health England (PHE). PHE: Investigation of novel SARS-CoV-2 variants ofconcern (England) - Technical briefing 13. 2021 May. Available:https://www.gov.uk/government/publications/phe-investigaton-of-novel-sars-cov-2-variants-of-concern-england-technical-briefing-13-27-may-2021
8. UK Government. UK government Covid-19 dashboard. In: UK government Covid-19dashboard [Internet]. Available: https://coronavirus.data.gov.uk/
9. Uk Government. Vaccination programme accelerated as Step 4 is paused. In: gov.uk[Internet]. 14 Jun 2021 [cited 15 Jun 2021]. Available:https://www.gov.uk/government/news/vaccination-programme-accelerated-as-step-4-is-paused
10. Riley S, Atchison C, Ashby D, Donnelly CA, Barclay W, Cooke G, et al. REal-timeAssessment of Community Transmission (REACT) of SARS-CoV-2 virus: Studyprotocol. Wellcome Open Research. 2020. p. 200.doi:10.12688/wellcomeopenres.16228.1
11. Riley S, Ainslie KEC, Eales O, Walters CE, Wang H, Atchison C, et al. Resurgence ofSARS-CoV-2: Detection by community viral surveillance. Science. 2021;372: 990–995.
12. Riley S, Haw DJ, Walters CE, Wang H, Eales O, Ainslie KEC, et al. REACT-1 round 11report: low prevalence of SARS-CoV-2 infection in the community prior to the third stepof the English roadmap out of lockdown. medRxiv. 2021. Available:https://www.medrxiv.org/content/10.1101/2021.05.13.21257144v1.abstract
13. Public Health England. SARS-CoV-2 variants of concern and variants underinvestigation in England: Technical briefing 15. 2021 Nov.
14. Uk Government. COVID-19 vaccination: a guide to phase 2 of the programme. In:gov.uk [Internet]. 14 Jun 2021 [cited 16 Jun 2021]. Available:https://www.gov.uk/government/publications/covid-19-vaccination-guide-for-older-adults/covid-19-vaccination-a-guide-to-phase-2-of-the-programme
15. Public Health England. Vaccines highly effective against B.1.617.2 variant after 2 doses.In: GOV.UK [Internet]. 22 May 2021 [cited 16 Jun 2021]. Available:https://www.gov.uk/government/news/vaccines-highly-effective-against-b-1-617-2-variant-after-2-doses
16. Uk Government. Further measures in additional areas to tackle Delta (B1.617.2) variant.In: gov.uk [Internet]. 6 Aug 2021 [cited 16 Jun 2021]. Available:https://www.gov.uk/government/news/further-measures-in-additional-areas-to-tackle-delta-b16172-variant
17. Ward H, Atchison C, Whitaker M, Ainslie KEC, Elliott J, Okell L, et al. SARS-CoV-2antibody prevalence in England following the first peak of the pandemic. Nat Commun.2021;12: 905.
18. Office for National Statistics. Deaths involving COVID-19 by local area andsocioeconomic deprivation: deaths occurring between 1 March and 31 July 2020. 2020Aug. Available:https://www.ons.gov.uk/peoplepopulationandcommunity/birthsdeathsandmarriages/deaths/bulletins/deathsinvolvingcovid19bylocalareasanddeprivation/deathsoccurringbetween1marchand31july2020
19. Baker DJ, Aydin A, Le-Viet T, Kay GL, Rudder S, de Oliveira Martins L, et al. CoronaHiT:high-throughput sequencing of SARS-CoV-2 genomes. Genome Med. 2021;13: 21.
20. A Nextflow pipeline for running the ARTIC network’s field bioinformatics tools. In: Github[Internet]. Available: https://github.com/connor-lab/ncov2019-artic-nf
21. Phylogenetic Assignment of Named Global Outbreak LINeages. In: Github [Internet].Available: https://github.com/cov-lineages/pangolin
Data availability
Supporting data for tables and figures are available either: in this spreadsheet; or in the
inst/extdata directory of this GitHub R package. Assembled/consensus genomes are
available from GISAID subject to minimum quality control criteria. Raw reads are available
from European Nucleotide Archive (ENA). All genomes, phylogenetic trees, and basic
metadata are available from the COG-UK consortium website
(https://www.cogconsortium.uk).
Declaration of interests
We declare no competing interests.
Funding
The study was funded by the Department of Health and Social Care in England. Sequencing
was provided through funding from COG-UK.
Acknowledgements
SR, CAD acknowledge support: MRC Centre for Global Infectious Disease Analysis,
National Institute for Health Research (NIHR) Health Protection Research Unit (HPRU),
Wellcome Trust (200861/Z/16/Z, 200187/Z/15/Z), and Centres for Disease Control and
Prevention (US, U01CK0005-01-02). NFA was supported by the Quadram Institute
Bioscience BBSRC funded Core Capability Grant (project number BB/CCG1860/1). GC is
supported by an NIHR Professorship. HW acknowledges support from an NIHR Senior
Investigator Award and the Wellcome Trust (205456/Z/16/Z). PE is Director of the MRC
Centre for Environment and Health (MR/L01341X/1, MR/S019669/1). PE acknowledges
support from Health Data Research UK (HDR UK); the NIHR Imperial Biomedical Research
Centre; NIHR HPRUs in Chemical and Radiation Threats and Hazards, and Environmental
Exposures and Health; the British Heart Foundation Centre for Research Excellence at
Imperial College London (RE/18/4/34215); and the UK Dementia Research Institute at
Imperial (MC_PC_17114). We thank The Huo Family Foundation for their support of our
work on COVID-19. Quadram authors gratefully acknowledge the support of the
Table 1. The unweighted and weighted prevalence of swab-positivity across 12 rounds ofREACT-1.
12
Table 2. Estimates of national growth rates, doubling times and reproduction numbers forround 12, and round 11 to round 12.
13
Table 3. Estimates of regional growth rates, doubling times and reproduction numbers forround 11 to round 12.
14
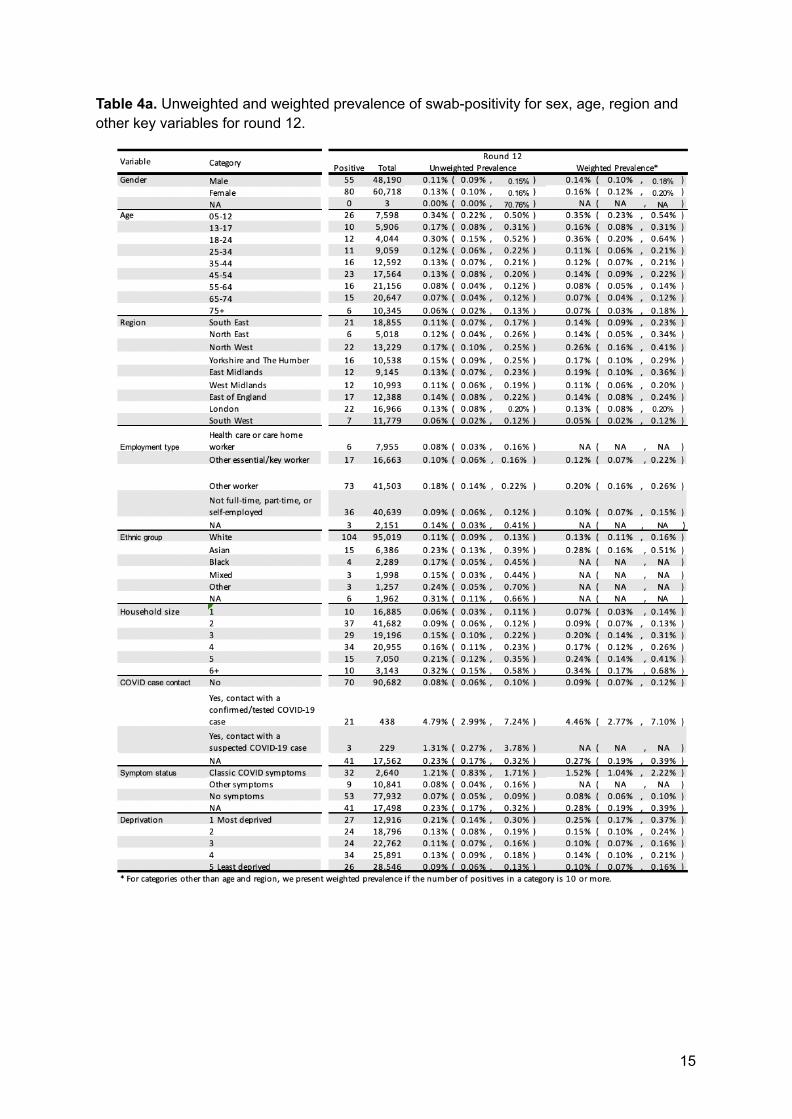
Table 4a. Unweighted and weighted prevalence of swab-positivity for sex, age, region andother key variables for round 12.
15
Table 4b. Unweighted and weighted prevalence of swab-positivity for sex, age, region andother key variables for round 11.
16
Table 5. Weighted prevalence of swab-positivity for 5-49 years and 50 years and above agegroup for rounds 11 and 12.
17
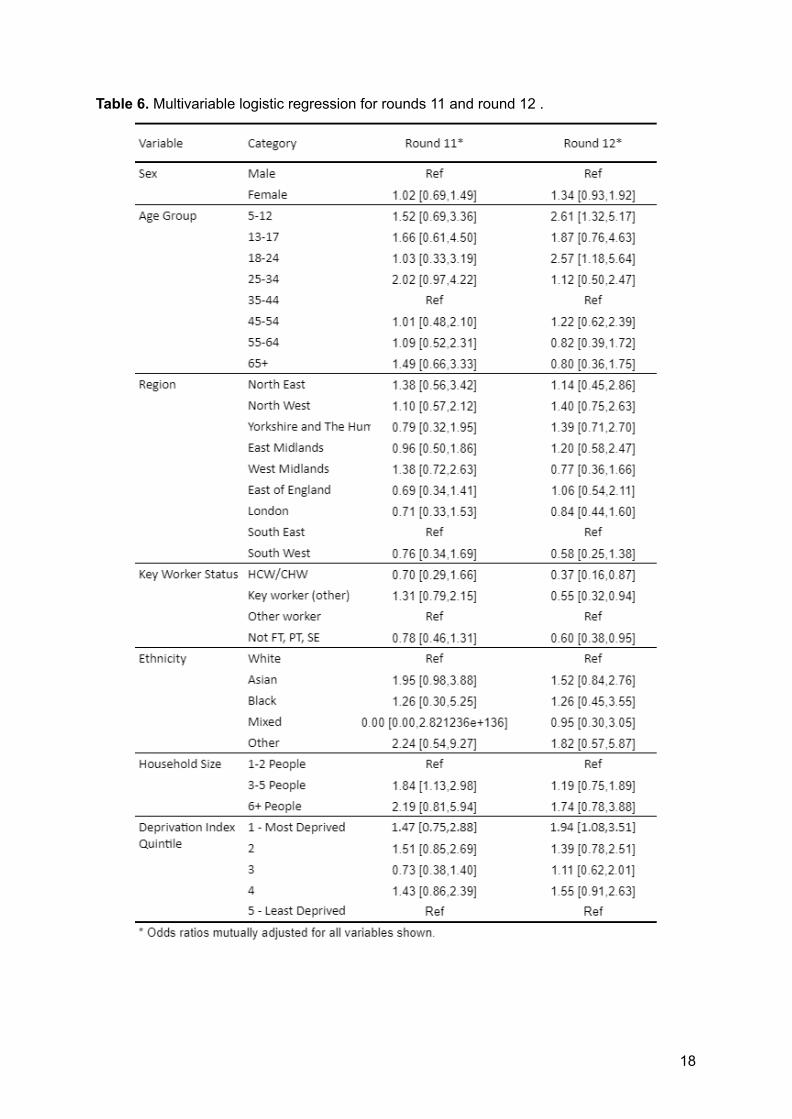
Table 6. Multivariable logistic regression for rounds 11 and round 12 .
18
Table 7. Prevalence of infection for younger and older age groups by self-reported vaccinestatus.
19
Table 8. Percentage of variants from positive samples for which a lineage could beaccurately assessed.
20
Figure 1. Prevalence of national swab-positivity for England estimated using a P-spline forall twelve rounds with central 50% (dark grey) and 95% (light grey) posterior credibleintervals. Shown here for the entire period of the study with a log10 y-axis. Weightedobservations (black dots) and 95% binomial confidence intervals (vertical lines) are alsoshown. Note that the period between round 7 and round 8 (December) of the model is notincluded as there were no data available to capture the late December peak of the epidemic.
21
Figure 2. Comparison of the P-spline model and exponential model fit to round 12 only.Prevalence of national swab-positivity for England estimated using a P-spline for all twelverounds with central 50% (dark grey) and 95% (light grey) posterior credible intervals. Shownhere for rounds 11 and 12 with a log10 y-axis. Prevalence of national swab-positivity forEngland estimated using an exponential model for round 12 (red) and 95% credible intervals(light red). Weighted observations (black dots) and 95% binomial confidence intervals(vertical lines) are also shown.
22
Figure 3. Probability density of the date of minimum prevalence as inferred from the nationalP-spline model.
23
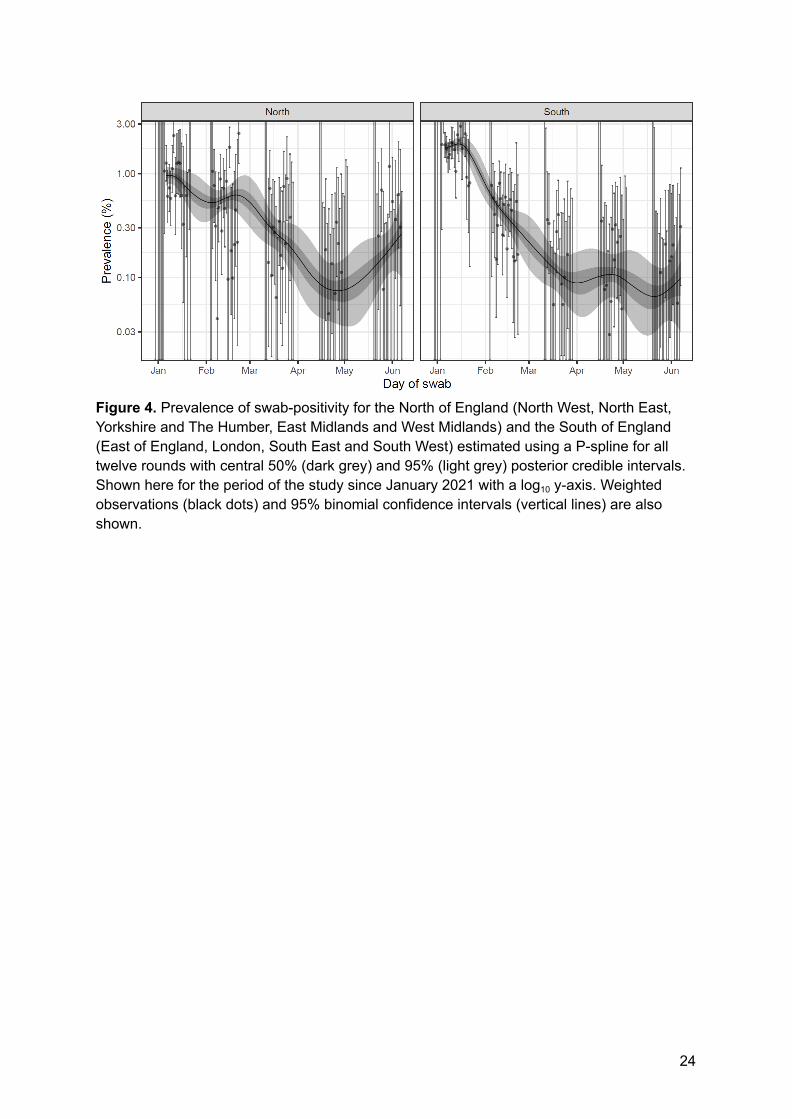
Figure 4. Prevalence of swab-positivity for the North of England (North West, North East,Yorkshire and The Humber, East Midlands and West Midlands) and the South of England(East of England, London, South East and South West) estimated using a P-spline for alltwelve rounds with central 50% (dark grey) and 95% (light grey) posterior credible intervals.Shown here for the period of the study since January 2021 with a log10 y-axis. Weightedobservations (black dots) and 95% binomial confidence intervals (vertical lines) are alsoshown.
24
Figure 5. Weighted prevalence of swab-positivity by region for rounds 11 and 12. Bars show95% confidence intervals.
25
Figure 6. Geographical distribution of swab-positives in round 12. A Jittered location of all135 positive samples detected. B Neighbourhood smoothed average prevalence by lowertier local area. Neighbourhood prevalence calculated from nearest neighbours (the mediannumber of neighbours within 20 km in the study). Average neighbourhood prevalencedisplayed for individual lower-tier local authorities. Regions: NE = North East, NW = NorthWest, YH = Yorkshire and The Humber, EM = East Midlands, WM = West Midlands, EE =East of England, L = London, SE = South East, SW = South West.
26
Figure 7. Weighted prevalence of swab-positivity by age for rounds 11 and 12. Bars show95% confidence intervals.
27
Figure 8. Prevalence of swab-positivity for those aged under 50 and those aged 50 andover estimated using a P-spline for all twelve rounds with central 50% (dark grey) and 95%(light grey) posterior credible intervals. Shown here for the period of the study since Januarywith a log10 y-axis.
28
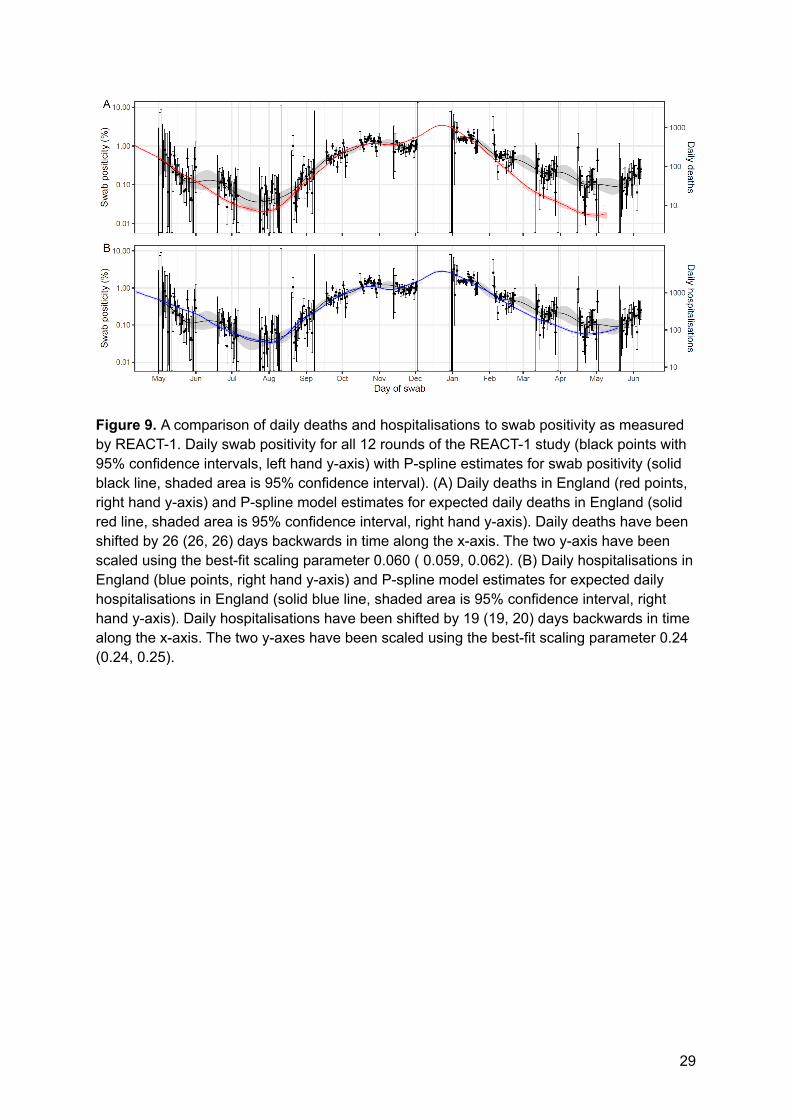
Figure 9. A comparison of daily deaths and hospitalisations to swab positivity as measuredby REACT-1. Daily swab positivity for all 12 rounds of the REACT-1 study (black points with95% confidence intervals, left hand y-axis) with P-spline estimates for swab positivity (solidblack line, shaded area is 95% confidence interval). (A) Daily deaths in England (red points,right hand y-axis) and P-spline model estimates for expected daily deaths in England (solidred line, shaded area is 95% confidence interval, right hand y-axis). Daily deaths have beenshifted by 26 (26, 26) days backwards in time along the x-axis. The two y-axis have beenscaled using the best-fit scaling parameter 0.060 ( 0.059, 0.062). (B) Daily hospitalisations inEngland (blue points, right hand y-axis) and P-spline model estimates for expected dailyhospitalisations in England (solid blue line, shaded area is 95% confidence interval, righthand y-axis). Daily hospitalisations have been shifted by 19 (19, 20) days backwards in timealong the x-axis. The two y-axes have been scaled using the best-fit scaling parameter 0.24(0.24, 0.25).
29
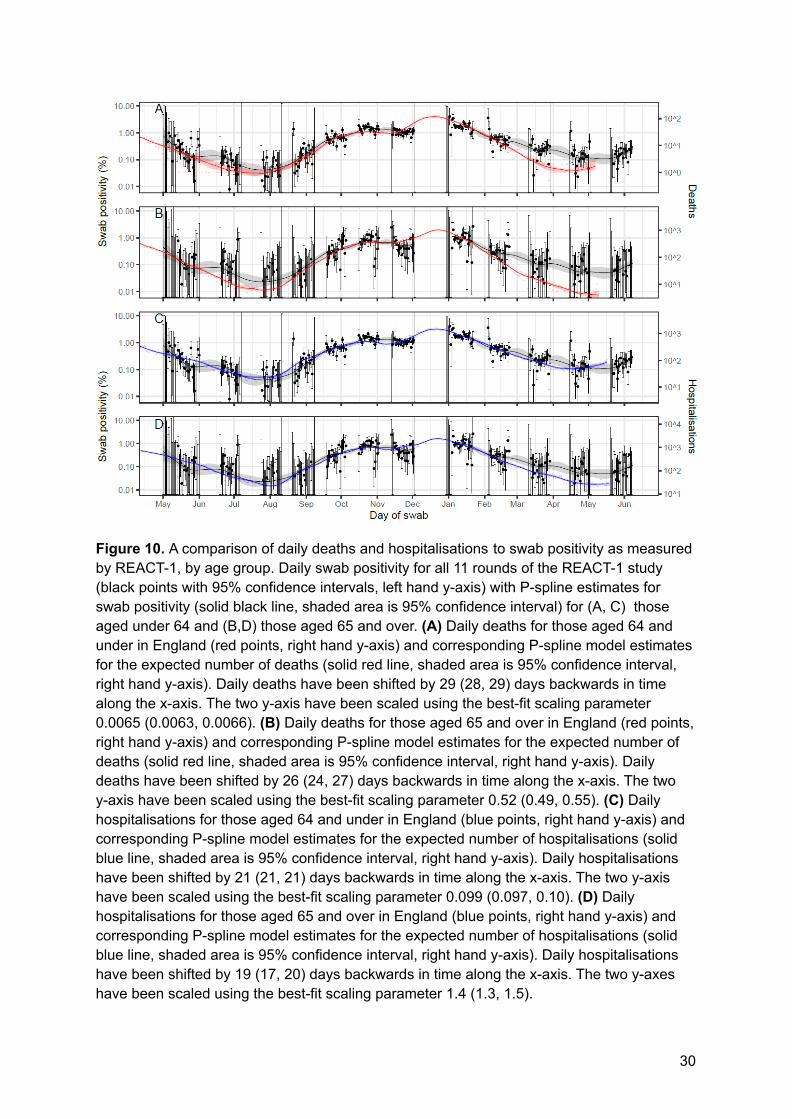
Figure 10. A comparison of daily deaths and hospitalisations to swab positivity as measuredby REACT-1, by age group. Daily swab positivity for all 11 rounds of the REACT-1 study(black points with 95% confidence intervals, left hand y-axis) with P-spline estimates forswab positivity (solid black line, shaded area is 95% confidence interval) for (A, C) thoseaged under 64 and (B,D) those aged 65 and over. (A) Daily deaths for those aged 64 andunder in England (red points, right hand y-axis) and corresponding P-spline model estimatesfor the expected number of deaths (solid red line, shaded area is 95% confidence interval,right hand y-axis). Daily deaths have been shifted by 29 (28, 29) days backwards in timealong the x-axis. The two y-axis have been scaled using the best-fit scaling parameter0.0065 (0.0063, 0.0066). (B) Daily deaths for those aged 65 and over in England (red points,right hand y-axis) and corresponding P-spline model estimates for the expected number ofdeaths (solid red line, shaded area is 95% confidence interval, right hand y-axis). Dailydeaths have been shifted by 26 (24, 27) days backwards in time along the x-axis. The twoy-axis have been scaled using the best-fit scaling parameter 0.52 (0.49, 0.55). (C) Dailyhospitalisations for those aged 64 and under in England (blue points, right hand y-axis) andcorresponding P-spline model estimates for the expected number of hospitalisations (solidblue line, shaded area is 95% confidence interval, right hand y-axis). Daily hospitalisationshave been shifted by 21 (21, 21) days backwards in time along the x-axis. The two y-axishave been scaled using the best-fit scaling parameter 0.099 (0.097, 0.10). (D) Dailyhospitalisations for those aged 65 and over in England (blue points, right hand y-axis) andcorresponding P-spline model estimates for the expected number of hospitalisations (solidblue line, shaded area is 95% confidence interval, right hand y-axis). Daily hospitalisationshave been shifted by 19 (17, 20) days backwards in time along the x-axis. The two y-axeshave been scaled using the best-fit scaling parameter 1.4 (1.3, 1.5).
30
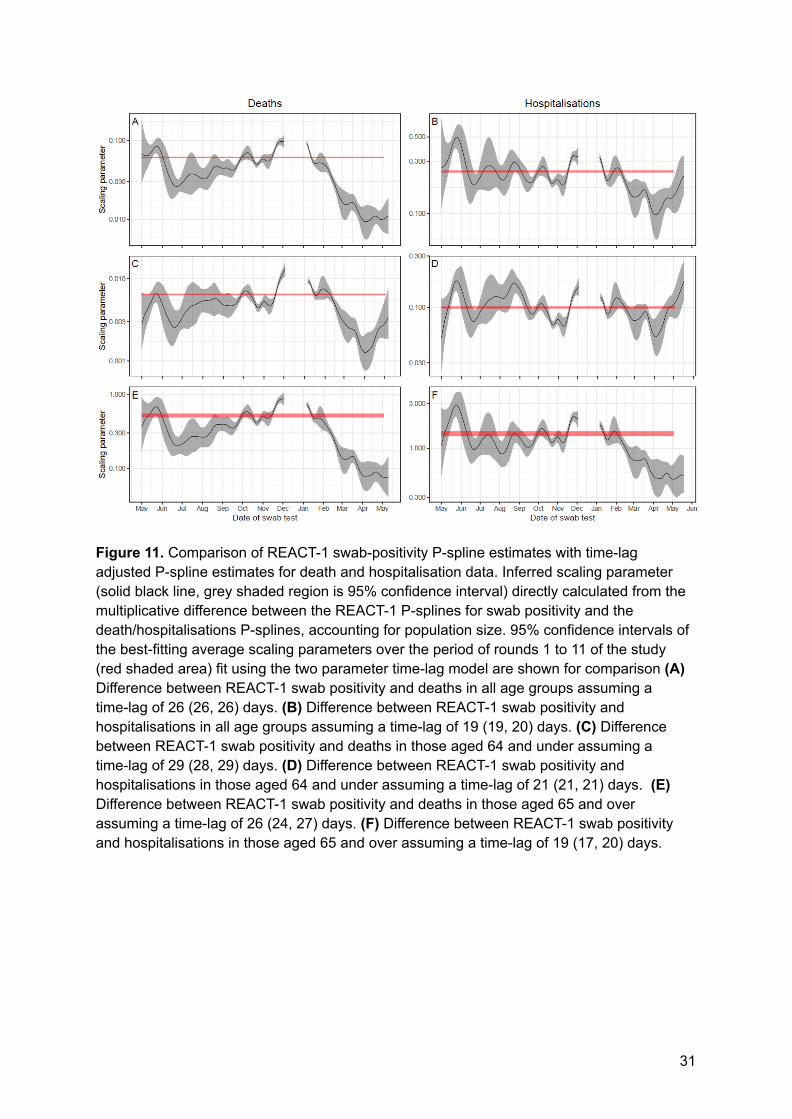
Figure 11. Comparison of REACT-1 swab-positivity P-spline estimates with time-lagadjusted P-spline estimates for death and hospitalisation data. Inferred scaling parameter(solid black line, grey shaded region is 95% confidence interval) directly calculated from themultiplicative difference between the REACT-1 P-splines for swab positivity and thedeath/hospitalisations P-splines, accounting for population size. 95% confidence intervals ofthe best-fitting average scaling parameters over the period of rounds 1 to 11 of the study(red shaded area) fit using the two parameter time-lag model are shown for comparison (A)Difference between REACT-1 swab positivity and deaths in all age groups assuming atime-lag of 26 (26, 26) days. (B) Difference between REACT-1 swab positivity andhospitalisations in all age groups assuming a time-lag of 19 (19, 20) days. (C) Differencebetween REACT-1 swab positivity and deaths in those aged 64 and under assuming atime-lag of 29 (28, 29) days. (D) Difference between REACT-1 swab positivity andhospitalisations in those aged 64 and under assuming a time-lag of 21 (21, 21) days. (E)Difference between REACT-1 swab positivity and deaths in those aged 65 and overassuming a time-lag of 26 (24, 27) days. (F) Difference between REACT-1 swab positivityand hospitalisations in those aged 65 and over assuming a time-lag of 19 (17, 20) days.
31
Figure 12. Plot of the proportion of Delta variant (B.1.617.2), among sequenced virussamples. Error bars show the 95% binomial confidence interval for each daily proportioncalculation. Shaded region shows best-fit Bayesian logistic regression model with 95%credible interval.
32
Figure 13. Jittered locations of positive samples for which sequencing could reliablydetermine lineages for rounds 11 (n=26) and 12 (n=46): B.1.1.7, Alpha; B.1.617.2, Delta.Regions: NE = North East, NW = North West, YH = Yorkshire and The Humber, EM = EastMidlands, WM = West Midlands, EE = East of England, L = London, SE = South East, SW =South West.