Page 1
International Journal on Studies in Education (IJonSE) is affiliated with the International Society for
Technology, Education, and Science (ISTES).
www.ijonse.net
School Student Academic Performance in
Nepal: An Analysis Using the School
Education Exam (SEE) Results
Yogendra Chapagain
Nepal Open University, Nepal
To cite this article:
Chapagain, Y. (2021). School student academic performance in Nepal: An analysis using the
School Education Exam (SEE) results. International Journal on Studies in Education
(IJonSE), 3(1), 22-36.
International Journal on Studies in Education (IJonSE) is a peer-reviewed scholarly online journal. This
article may be used for research, teaching, and private study purposes. Authors alone are responsible for the
contents of their articles. The journal owns the copyright of the articles. The publisher shall not be liable for
any loss, actions, claims, proceedings, demand, or costs or damages whatsoever or howsoever caused arising
directly or indirectly in connection with or arising out of the use of the research material. All authors are
requested to disclose any actual or potential conflict of interest including any financial, personal or other
relationships with other people or organizations regarding the submitted work.
This work is licensed under a Creative Commons Attribution-NonCommercial-ShareAlike 4.0 International License.
Page 2
International Journal on Studies in Education
Vol3, No 1, 22-36, 2021 ISSN: 2690-7909
22
School Student Academic Performance in Nepal: An Analysis Using the
School Education Exam (SEE) Results
Yogendra Chapagain
Article Info Abstract Article History Received:
2020
Student academic performance is the most important indicator of educational
development in every nation. The main purpose of this study was to analyze the
academic performance of the grade 10 students in terms of their overall
performance and its relationship with socio-demographic factors through the use
of a quantitative research method. A total of 541 students (341 community and
200 private students) from seven local governments in the Dhankuta district were
randomly selected to collect the data related to their socio-demographic
characteristics and subject-wise score using a data collection template. The data
were descriptively and inferentially analyzed in the support of SPSS. The key
findings of the study revealed that the performance of most of all community
school students (66%) is under a satisfactory level than private and they (85%)
are very poor in Mathematics subjects than others. This study also concluded that
there is also a wider gap in student performance between theory and practical
subjects. Students from municipal government and Bramin/Chetri ethnic groups
are doing better performance than others. The study finally, found that school
type, local government type, nature of examination, and age & ethnicity of
students make a significant difference in student achievement whereas gender
does not.
Accepted:
2020
Keywords
Student performance
Community and private School
School Education Exam
SEE result Socio-demographic
Introduction
There is a growing body of study on student performance around the world, especially focused on factors
affecting student performance. The topic is exciting even more interesting among researchers, policymakers,
educational planners, and program practitioners in developing countries, where the student academic
performance is very poor (Thapa, 2015; Shahzadi & Ahmad, 2011). However, there has been an inadequate
study on the issue of identifying the level of student performance from the perspective of subject-wise, nature,
of course, type of school, and type of local government, and socio-demographic variables such as age, gender,
and ethnicity in the context of new federal government system in Nepal.
Student academic performance is one of the key indicators of quality education (Joy, 2013; Lee et al., 2013;
Shatzer et al., 2013). It is argued that student academic performance has been considered as an output of the
learning process and its quality (World Bank, 2018). Student academic performance is related to the level of
performance in terms of learning based knowledge, skills, and experience in line with learning objectives of the
curriculum (Levpuscek & Zupancic, 2008; Nemeth & Long, 2012). Many scholars claim that student
performance is the overall net result of their cognitive and non-cognitive attributes as well as the socio-cultural
context where the learning activities take place (Lee & Stankov, 2016; Liem & Tan, 2019). Thus, student
performance is the level of proficiency attained in academic work or as formally acquired knowledge in school
subjects, which is often represented by the percentage of marks obtained by students in examinations. Thus, we
cannot neglect the value of academic performance anywhere in the world because it links with social value and
means for a successful life in the future (Insah et. al, 2018).
Regarding the level of student academic performance, many reports show that student academic performance is
not satisfactory in the global context. The World Bank (2018) states that a large number of schoolchildren do
not have basic skills like simple transaction processes, simple community hoarding boards/announcements, or
understanding bus schedules in the world. The World Bank further presents shreds of evidence of low students'
academic performance of the different nations. Similarly, the 5th Asia-Pacific Meeting on Education 2030 also
highlights that maximum school children do have basic literacy and numeracy skills in the Asia region
(UNESCO Asia-Pacific, 2020).
Page 3
International Journal on Studies in Education (IJonSE)
23
In the context of Nepal as well, the report of the National Assessment of Student Achievement (NASA) shows
that the learning performance of students is decreasing year by year and currently it is less than 50 percent
(ERO, 2019). The report further presents evidence that student performance of grades 3, 5, and 8 students is at a
low level. In the examination of the grade 10 School Education Exam (SEE) in the academic year 2018, a large
number of students scored below 2.0 GPA out of 4 (MoEST, 2019). Moreover, there is also a gap in students'
performance between the community and private schools in Nepal. In the examination of SEE 2018, 4 percent
of students of community schools obtained GPA 3:20 to 4 whereas 40.84 % of students of private schools obtain
the same grade (Dixit, 2019). She further claims that students from private schools have done outstanding
performance than community schools. Thapa (2015) also found that students from private schools in Nepal have
performed better than similar students from community schools in the grade 10 examination. These shreds of
evidence show that school students' performance is not at a good level.
The level of student academic performance is affected by a series of factors including socio-demographic factors
(Waters & Marzano, 2006). Many reports and studies conclude that there is a significant relationship between
socio-demographic factors and students' performances in the global context (Henderson, 1988; Shumox &
Lomax, 2000). However, in Nepal, there are no studies that examined the grade 10 SEE students from
inferentially testing the relationship between students’ performance and student-related variables such as age,
gender, ethnicity, type of school, and type of local government that manages school level education in their
areas and descriptively presenting the overall school education examination result in terms of local government
type as well. Therefore, this study attempts to fulfill the gap in the literature by analyzing the result of grade 10
SEE students of the academic year 2020 from the approach of not only descriptive but also inferential.
This study will be helpful for the local, province, and central government for developing policy, guidelines for
the improvement of school education with a new innovative improvement program in new the provision of new
federal government and letter grading system. This study will also be a millstone to examine and revisit the
policy of the school education examination system and newly introduced policy on SEE administration in the
context of COVID that provisioned the school to conduct grade 10 School Education Examination (SEE) and
submit the final score of students to the central government through district office (EDCU) for the approval of
score and result publication. Keeping this above-mentioned discussion, this study answers the two research
questions; what is the level of student academic performance of grade 10 SEE students in terms of the type of
school, type of local government, nature of examination system, and students factors (age, gender, and
ethnicity?, and Is there a significant difference in student achievement due to of the type of school, type of local
government, nature of examination system, and students factors (age, gender, and ethnicity)?
The purpose of the study is two folds: first, to describe the grade 10- SEE student academic performance in
terms of the type of school (public & private), type of local government (rural municipality & municipality),
nature of examination (theoretical & practical), gender (male & female), age ( right age (14 years) and & above
right age), ethnicity (Bramin, Chhetri, Dalit &Janajati) and second, to examine the relationship between SEE
student academic performance and socio-demographic factors such as type of school (public & private), type of
local government (rural municipality & municipality), nature of examination (theoretical & practical), gender
(male & female), age ( right age (14 years) and & above right age), ethnicity (Bramin, Chhetri, Dalit &Janajati).
Literature Review
Understanding Student Performance: Multiple Perspectives
Unequal differences in student performance are not a new phenomenon in the world as old as a formal schooling
system. These differences in learning are based on various student-related, school-related, policy-related, and
parents related factors. So, disparities in learning have attracted many researchers, thinkers, and philosophers.
The school of behaviorist thought advocates the view that environmental factors are the major responsible
factors for student performance (Zhou & Brown, 2015). This view indicates that student performance is related
to performing their behavior in the school context and responding to their behaviors. Student learning is the
interaction between students and their external environment, and so, student performance is based on external
variables such as reinforcement, learning environment, and practice (Kelly, 2012). This school of thought
ignores the value of intelligence and cognitive power in learning and takes the learning as a passive process only
(Matlin, 1994).
On the other hand, the school of cognitive suggests the view that student learning is based on innate mental
processes and intelligence (Bowles & Gintis, 2002). This view focuses that learning is the active process of
Page 4
Chapagain
24
constructing new knowledge through the process of reorganization of previous knowledge. Thus student
performance is taken as a process where a student is an intelligent person and he/she can construct new
knowledge based on the receiving experience and information. However, this school of thought does not focus
on the value of social interaction, support in learning, interaction and tools of instruction, and many cultural
backgrounds of the students (Zhou & Brown, 2015).
Similarly, other different theories and models have also advocated different perspectives on students'
performance. For stance, the socio-cultural theory of Vgotsky (1978) advocates that students learning depends
on the quantity and quality of interpersonal & social interaction process, cultural differences, and tools or code
of instruction whereas the theory of cultural reproduction of Bourdieu (1973) states that school does not only
reproduce cultural content and value of elite group but also symbolically impose to the non-elite group. The
theory of cultural deprivation, on another side advocates, that elite and lower class group school children are
doing poor performance due to their insufficient cultural resources (Deutsch, 1967). In addition to that, the
theory of family effect states that student performance is related to their family background and factors
(Coleman et al., 1966). The theory of school effectiveness similarly, states that students' performance depends
on the school's overall effectiveness and leadership (Edmond, 1979). Likewise, the theory of differential
treatment also indicates that student performance varies due to the unequal treatment in the teaching and
learning process in terms of the fund, teaching and learning materials, and teacher quality, teaching and learning
facilitation practices, and school management and leadership (Fuller, 1986). Thus, the above-mentioned
different theories show that school student performance is not only a matter of individual student but also the
social, cultural, contextual, economic, and political subject.
Socio-demographic Factors and Student Performance
Many research studies claim that there is a significant relationship between socio-demographic factors of the
students and their academic performance (Casanova et al., 2005; Mathema & Bista, 2006). Age is one of the
significant socio-demographic factors that affect student performance (Baba et al., 2013; Pesta et al., 2016;
Schreiber et al., 2017, Benner, et al., 2016). But some studies claim that age does not significantly affect student
performance (Momanyi et al. 2015). Similarly, some scholars claim that gender affects the student performance
(Keith et al., 2006; Cole & Espinoza, 2008; Jaeger & Eagan, 2007; Huang et al., 2000; Schreiber et al, 2017) but
others few research studies have shown that students learning does not vary due to the gender of students (Kaur,
et. al., 2010; Olanipekun, 2015). In addition to age and gender, many studies claim that the ethnicity of the
students does powerfully affect their academic performance (Lee, 2007; Jobbis, 2014; Maestri, 2017; Kingdon
& Cassen, 2010). Student performance also varies due to the type of school (Mathema & Bista, 2006; Thapa,
2015; ERO, 2019; Newhouse & Beegle, 2006). But, Harry (2016) claims that type of school does not make a
difference in student achievement. In above mentioned contradictory view of different scholars, this paper test
the claims of different scholars in terms of age, gender, the ethnicity of students and type of school that students
are studying, and the type of local government that governs the school of selected students.
School Education Provision and Practice in Nepal: Community and Private School
Nepal government has currently implemented the provision of two levels of school education in the formal
education system: first, basic education that starts from the Early Child Development (ECD) program to grade 8,
and second, secondary education that starts from grades 9 to 12 (MoEST, 2018). In Nepal, school education
typically begins at the age of 3-4 years through ECD education and ends at the age of sixteen with grade 12.
This is a new provision of the school education system that replaced the concept of the school education system
form grade one to ten. According to the Education Act (1971), there is a provision of two types of schools in
Nepal: community school and private school. The act further clearly defines the community school as a school
that receives governmental funds after its approval.
On the other hand, a private school is defined as the school that does not receive any funds from any
government after approval from the government. It denotes that community schools are running with the support
of the governmental fund, services, and program but private schools are managing schools from their fee paid by
students. Despite the difference in fund source and medium of language instruction, both schools are using the
same curriculum throughout the school education (Mathema & Bista, 2007). As per the data of MoEST (2019),
there are 27704 (80%) community schools and 6787 (20%) private schools in Nepal. Despite the lack of funds
and technical support from the government, the number of private schools has drastically increased after 1990
and has attracted a significant number of students (Neupane, et al. 2018). Altogether 34491 schools are being
Page 5
International Journal on Studies in Education (IJonSE)
25
managed by 753 local governments in Nepal after devolving power and jurisdiction on the school education
system by new constitution promulgated in 2015. This devolution took place in Nepal after six decades of a
highly centralized education system. Based on the changes in managing school education, the Local
Government Operating Act (2017) has provisioned 23 rights for managing school education in coordination
with the province and state government.
School Education Examination (SEE) in Nepal
The School Education Examination (SEE), traditionally called School Leaving Examination (SLC) is equivalent
to grade 10 in Nepal. This is an annual examination system and it has been conducted at the national level.
Nepal government started to conduct this examination since 1934 (NEB, 2020). The SEE is the most important
examination in Nepal from different perspectives. First, the SEE has been taken as the output level of school
education and one of the key quality indicators of both community and private schools (Bhatta, 2005). Second,
this examination is credential and prerequisites for entering higher education and any job employment and
professional growth after entering the government jobs as well (Mathema & Bista, 2006; Thapa, 2015). Third,
the SEE examination result also powerfully influences the policymaker, government actor, program
implementation practitioners, and school-level stakeholders to revisit the way of pedagogical practices that
adopted in the past (Singh, 2004). Based on these importances, the result of SEE has drawn high attention to
policymakers, planners, school stakeholders, parents, supervisors, journalists, and the entire nation. Therefore,
the performance of students in the SEE has been a matter of great concern to all in Nepal.
Course Nature and Grading System
SEE examination consists of six compulsory subjects with two elective subjects chosen by the student. The
mandatory subjects are English, Nepali, Math, Science, Social Studies and Environment, Population, and Heath
(NEB, 2020). The total score for each subject is 100. Regarding the nature of examination, 5 major subjects
(English, Nepali, Science and Social Studies and Environment, Population & Heath) have both practice and
theory examination that consists of 25 % practical and 75 % theoretical examinations but Math subject has only
theoretical (NEB, 2020). This examination has been evaluated in the letter grading system since 2015. Before
2015, this examination was based on a percentage system. All studies conducted in the past are only related to a
percentage grading system but this study is a first and new study that analyzes SEE results from the letter
grading system. The letter grading system of grade 10 = SEE has been provisioned in nine levels as presented in
Table 2.
Table 1.Grading System in SEE in Nepal
SN Grade Letter Grade Description
1 3.65-400 A+ Outstanding
2 3.25-3.65 A- Excellent
3 2.80-3.25 B+ Very Good
4 2.40-2.80 B- Good
5 2.00-2.40 C+ Satisfactory
6 1.60-2.00 C- Acceptable
7 1.20-1.60 D+ Partially Acceptable
8 0-80-1.20 D Insufficient
9 0.0-0.80 E Very Insufficient
Source: Curriculum Development Center (CDC) Nepal. (2014).
Change of SEE Process in the Context of COVID Pandemic in 2020
SEE is the national level examination and annually conducted in March in Nepal. As a regular plan, grade 10-
SEE had been scheduled for its administration with all necessary preparation such as developing and
distributing question set and answer paper, appointing an exam supervisor, and many more. But, the
examination had been postponed due to lockdown caused by COVID -19 as per the decision of the government.
To address the postponed examination from an alternative way, the government of Nepal decided to collect
students' scores of grade 10 SEE students from the final examination that had conducted by schools before the
SEE exam in every year, in a certain format through releasing Evaluation, Publication, and Approval Guideline
Page 6
Chapagain
26
of Grade 10- SEE Students (NEB, 2020). The guideline has provisioned a committee having three members:
headteacher, class teacher, and senior teacher of the school to approve the score of students of the final
examination. The final examination of grade 10 had conducted by the school themselves in their school before
the SEE examination. The guideline further suggests school to submit students' scores to EDCU and EDCU has
been requested to review and approve the school data. Under this process, the Nepal government has already
published the result of grade 10 SEE students and this study used this data in sample areas with the approval.
The Trend of SEE Result in Nepal
The result of SLC now called SEE in Nepal is not satisfactory. The failure is more common than success in the
SLC examination in the percentage evaluation system and overall SLC result status is around 45 percentage
only (Mathema & Bista, 2006; MoEST, 2019; Thapa, 2015). After the letter grading system as well, student
performance is not satisfactory as presented in Table 2.
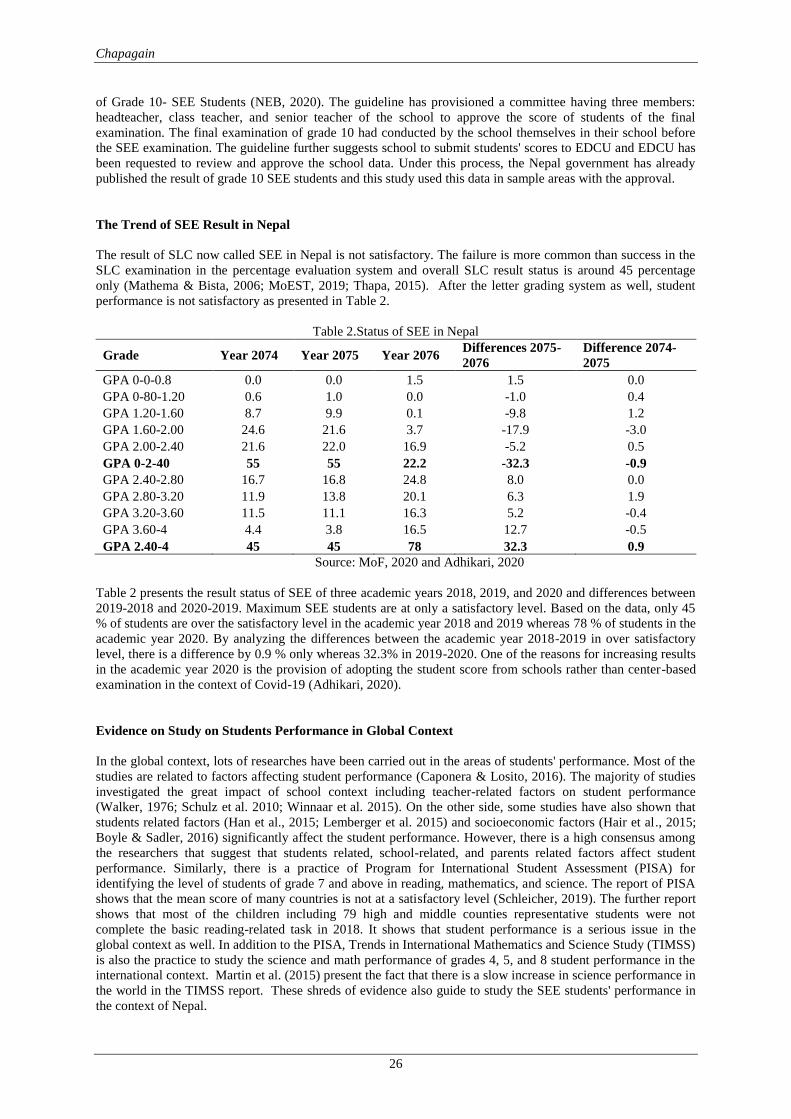
Table 2.Status of SEE in Nepal
Grade Year 2074 Year 2075 Year 2076 Differences 2075-
2076
Difference 2074-
2075
GPA 0-0-0.8 0.0 0.0 1.5 1.5 0.0
GPA 0-80-1.20 0.6 1.0 0.0 -1.0 0.4
GPA 1.20-1.60 8.7 9.9 0.1 -9.8 1.2
GPA 1.60-2.00 24.6 21.6 3.7 -17.9 -3.0
GPA 2.00-2.40 21.6 22.0 16.9 -5.2 0.5
GPA 0-2-40 55 55 22.2 -32.3 -0.9
GPA 2.40-2.80 16.7 16.8 24.8 8.0 0.0
GPA 2.80-3.20 11.9 13.8 20.1 6.3 1.9
GPA 3.20-3.60 11.5 11.1 16.3 5.2 -0.4
GPA 3.60-4 4.4 3.8 16.5 12.7 -0.5
GPA 2.40-4 45 45 78 32.3 0.9
Source: MoF, 2020 and Adhikari, 2020
Table 2 presents the result status of SEE of three academic years 2018, 2019, and 2020 and differences between
2019-2018 and 2020-2019. Maximum SEE students are at only a satisfactory level. Based on the data, only 45
% of students are over the satisfactory level in the academic year 2018 and 2019 whereas 78 % of students in the
academic year 2020. By analyzing the differences between the academic year 2018-2019 in over satisfactory
level, there is a difference by 0.9 % only whereas 32.3% in 2019-2020. One of the reasons for increasing results
in the academic year 2020 is the provision of adopting the student score from schools rather than center-based
examination in the context of Covid-19 (Adhikari, 2020).
Evidence on Study on Students Performance in Global Context
In the global context, lots of researches have been carried out in the areas of students' performance. Most of the
studies are related to factors affecting student performance (Caponera & Losito, 2016). The majority of studies
investigated the great impact of school context including teacher-related factors on student performance
(Walker, 1976; Schulz et al. 2010; Winnaar et al. 2015). On the other side, some studies have also shown that
students related factors (Han et al., 2015; Lemberger et al. 2015) and socioeconomic factors (Hair et al., 2015;
Boyle & Sadler, 2016) significantly affect the student performance. However, there is a high consensus among
the researchers that suggest that students related, school-related, and parents related factors affect student
performance. Similarly, there is a practice of Program for International Student Assessment (PISA) for
identifying the level of students of grade 7 and above in reading, mathematics, and science. The report of PISA
shows that the mean score of many countries is not at a satisfactory level (Schleicher, 2019). The further report
shows that most of the children including 79 high and middle counties representative students were not
complete the basic reading-related task in 2018. It shows that student performance is a serious issue in the
global context as well. In addition to the PISA, Trends in International Mathematics and Science Study (TIMSS)
is also the practice to study the science and math performance of grades 4, 5, and 8 student performance in the
international context. Martin et al. (2015) present the fact that there is a slow increase in science performance in
the world in the TIMSS report. These shreds of evidence also guide to study the SEE students' performance in
the context of Nepal.
Page 7
International Journal on Studies in Education (IJonSE)
27
Evidence on Study on Students Performance in Nepal
There are a handful of studies on student performance in Nepal. The New ERA (1995) conducted a study in
primary schools of eight districts and found that there is a positive relationship between parental education &
regularity of students' and students' performance whereas a negative relationship between gender & time spent
in household activities and students performance. The METCON (1995), similarly also found that distance
between student home and their school affects student performance.
Another study conducted by CERID (2002a) also found that cost per student and school condition affect the
school student performance. Shrestha (2014) also conducted a study in high and low performing schools and
found the school environment plays a significant role in high performing schools. Another study conducted by
the Rural Development Society (2017) also found similar findings that school initiative plays an important role
in student performance. In these areas, CERID (2002b) also conducted a study related to the areas of
determining factors for student performance and found that time spent by the teachers in the classroom highly
affects student performance.
The above-mentioned studies are based on the data collected from primary school and related to exploring
factors influencing student performance only. To analyze the student performance achievement score, EDSC
(1997, 1999, 2001, 2003) collected the student performance data from schools through random sampling and
multiple regression approaches and found the unavailability of students textbook and distance of schools from
district education office significantly affect the student performance. These studies also showed that students'
performance in grades 3 and 5 was very poor. Subedi (2004) also presented the fact that the performance of
grades 9 and 10 students was below 50 % and there is a great impact of classroom size, the availability, and use
of resources on student performance.
Similarly, Bhatta (2005) conducted a large scale study to explore the determinates of SLC/SEE student
performance using ordinary least square (OLS) and logistic regressions and found that there is a minimal gap in
students performance between public and private schools and the performance of both schools is affected by
students, teachers, and community factors. In the history of Nepal, Mathema and Bista (2006) conducted a first
in-depth a large scale based study to study on SLC/SEE student performance from the perspective of finding
causes of poor performance and found that incidence of poor performance or underperformance is common in
SLC examination in all subjects and overall grade. The study also shows that are serious disparities in student
performance in terms of gender, school type, geographical location, and language group, and socio-economic
status of the parents. After the establishment of the Education Review Office, under the Ministry of Education,
National Assessment of Students Performance (NASA) was also conducted in grade 3, 5, and 8 in different
academic years from 2011 to 2019 and the reports show that student performance is under preference level in all
grades and socio-demographic factors play the significant role students performance (ERO, 2019).
This above-mentioned evidence is insufficient in terms of study areas, study population and study nature, study
purpose in the context of the letter grading system, and newly implemented three types of the government
system and decentralizing power & rights on managing school education from central to local government.
Therefore, this paper contributes to the areas of research on student performance of secondary level students by
describing the level of grade 10-SEE student performance and examining the relationship between students'
factors and their student performance. Moreover, the finding of this paper directly supports policymaker to
revisit the policy of school education examination revised model and secondary education teaching and learning
practice.
Method
A quantitative research design was adapted to analyze the student academic performance for drawing the
generalizable findings from the large size samples of students at one point in time (Creswell, 2012).
Participants
The participants were Grade 10 SEE students of community and private school of Dhankuta district in province
one, Nepal. The total study population was 2748 grade 10 SEE students. The total population has been presented
in Table 3.
Page 8
Chapagain
28
Table 3. Number of Study Population and Participants
Name of Local Government
No of Total SEE Students No of Participants for the Study
Community
School
Private
School Total
Community
School
Private
School Total
Dhankuta Municipality 445 306 751 64 155 219
Mahalaxmi Municipality 398 0 398 58 0 58
Pakhribas Municipality 274 46 320 40 23 63
Chhatharjorpati Rural
Municipality 266 43 309 38 22 60
Sahidbhumi Rural
Municipality 367 0 367 53 0 53
Sagurigadhi Rural
Municipality 330 0 330 48 0 48
Chaubise Rural
Municipality 273 0 273 40 0 40
Total 2353 395 2748 341 200 541
Sampling Strategies
After preparing the sample frame, the sample size was determined by the formula of Yamane (1976). As per
calculation using the formula, 541 students (314 community school students and 200 private school students)
were selected through stratified random sampling with disproportional allocation method as per the total number
of schools available in the respective seven local governments in the support of Excel.
Instrument
To collect the data, the data collection tool entitled 'Information of Compiled Score of Students from Final
Evaluation-SEE Grade 10' developed and used by NEB for approving grade 10 results in Nepal in the academic
year 2076 was used. The tool was divided into two parts. The first part was designed to obtain information
related to grade 10 SEE students and their school, like gender, ethnicity, and date of birth of students and type of
school, location of school under local government. The next part of the tool was designed to obtain subject wise
final scores of the students in both theory and practical. Moreover, the researcher with the permission and
approval of the Unit Chief of EDCU collected the data as per the data collection tool and sample list.
Results
Description of Academic Performance Level of Grade 10 Students
This section descriptively presents the level of student performance of grade 10 SEE students in terms of the
type of school, type of subjects, type of local government and gender, ethnicity & age in Table 4-7. Table 4
contains the percentage of students who achieved different grades in terms of the type of school in the area of
the overall grade, theory subject, and practical subject. The table shows that overall, 57 % of students have
achieved the 2.40 – 4 GPA. It indicates that maximum grade 10 SEE students have received a good level in an
overall context. But by comparing the level of community and private school, only 34% percent of students of
community schools have received the GPA 2.40 – 4.00 out of 4 whereas 97 % of the students from the private
school received. It indicates that the performance of maximum community school students is under a good level
and also shows that there is a wider gap in the performance of community and private school students in the
SEE exam.
Table 4 also describes the fact that 54 % of students have not achieved good performance in theory subject in
terms of overall status whereas 99 % of students achieve good performance in practical subjects. Similarly, 78
% of students of community school students have achieved below good level i.e. 2.40 GPA in theory subject
whereas 86 % of students of private school students have achieved over a good level. But, there is a similarity in
practical subjects where almost all students from both types of schools have received good performance. Thus, it
Page 9
International Journal on Studies in Education (IJonSE)
29
indicates that there is a wider gap in the performance of theory subjects and practical subjects and the
performance level of a community school in theory subject is very poor.
Table 4. Performance Level of Students based on School Type
Areas Sub-Area Level B- to A+ Level C+ to E
Overall
Total 57 43
Theory 46 54
Practical 99 1
Community School
Total 34 66
Theory 22 78
Practical 99 1
Private School
Total 97 3
Theory 86 15
Practical 100 0
Table 5 also descriptively presents the level of student performance in terms of local government type that
governs school education up to the secondary level. The table shows that 67 % of students of municipal local
government achieved an over satisfactory level i.e. 2.40-4.00 GPA whereas 42 % of students of rural municipal
local government only achieved level one. By comparing the theory and practical subjects, 56 % of students
from municipal local government and 28 % from rural municipal local government achieved over a good level
i.e. 2.40-4.00. But, all most all students from both types of government achieved a good level in practical
subjects. Thus, it describes that the performance level of students of municipal local government is better than
rural municipal local government.
Table 5. Performance Level of Students based on Local Government Type
Areas Sub-Area Level B- to A+ Level C+ to E
Municipal Local
Government
Total 67 33
Theory 56 44
Practical 100 0
Rural Municipal Local
Government
Total 42 58
Theory 28 72
Practical 98 2
Table 6 similarly presents the fact the level of student' performance at grade 10 examination in terms of subject
type and school type. The table presents the fact that 60 % of students did not achieve a satisfactory level
performance in Mathematics subject whereas the maximum students got good level performance in Nepali,
English, Science, and Social. In addition to that, the performance level of students in Nepal is better than in
other subjects.
Table 6. Performance Level of Students based on Subject Type and School Type
Areas Sub-Area Level B- to A+ Level C+ to E
Total
English 58 42
Nepali 66 34
Math 40 60
Science 58 42
Social 61 39
Community
English 34 66
Nepali 49 51
Math 15 85
Science 35 65
Social 40 60
Private
English 100 0
Nepali 95 5
Math 82 18
Science 96 4
Social 96 5
Page 10
Chapagain
30
By comparing the community and private school, maximum students from community school did not achieve a
good level i.e. 2.40-4.00 GPA in all major five subjects i.e. English, Nepali, Math, Science, and Social whereas
maximum students from private schools achieved a good level in all those subjects. Community school students
are doing better in Nepali subjects than other subjects whereas in English subjects by private school students.
The lowest percentage of students achieved a good level in Mathematics subject in both types of schools. But,
there is a wider gap in the performance level of Mathematics as well. Thus, this describes that community
school student performance level in English, Nepali, Math, Science, and Social is very and maximum students
from both types of school are very poor in Mathematics than other subjects.
Table 7 also descriptively presents the level of student performance based on social-demographic variable age,
gender, and ethnicity. The table presents that 66 % of students aged 14 years achieved over a satisfactory level
i.e. 2.00-2.40 GPA. Similarly, the table also presents the fact that the performance of girls is better than boys
because 59 % of girls achieved an over satisfactory factory level whereas 56 % of boys only achieved the same
level. But, there is a minor gap in student achievement between boys and girls. The table further shows that the
performance level of Brahmin/Chhetri is better than other ethnic background students as 73 % of
Brahmin/Chhetri students achieved a good performance level i.e. 2.40-4.00 GPA. Thus, this table shows 3 facts:
firstly, 14 years aged students are doing better than over-aged students i.e. over 14 years. Second, girls are doing
better in grade 10 examinations than boys in not a wider gap. Third, students from the Brahmin/Chhetri ethnic
group are doing better than other ethnic background students.
Table 7. Performance Level of Students based on Age, Gender, and Ethnicity
Areas Sub-Area Level B- to A+ Level C+ to E
Age
14 years 66 34
15-20 years 54 46
20 years above 20 80
Gender Boys 56 44
Girs 59 41
Ethnicity
Bramin/Chhetri 73 27
Janajati 52 48
Dalit 45 55
Others 59 41
Student Performance Differences from Age, Gender, Ethnicity, School and Local Government
This section inferentially presents the result of the relationship between student performance and other socio-
demographic variables in Table 8 to 12. Table 8 answers the research question: is there a significant difference
between the mean score of boys and girls, community school and private school, and municipal local
government & rural municipal local government in SEE result?
Table 8 tests the research hypothesis: there is a significant difference in the student performance of community
school and private school. 'Equal variances assumed' has been considered due to the f value = 7.508 and p-value
= 0.006 under Levine's test for equality of variances. The table presents t value = -21.368, df = 539 and p-value
= .000 which is less than 0.05. It implies that the research hypothesis is rejected. It implies that there is a
difference in the mean score of community school and private school in the School Education Examination
(SEE). Thus, school type makes a difference in school student performance.
Table 8 also tests the answers to the research question: is there a significant difference between student
performance scores of municipal government and rural municipal government? Due to f value = 18. 349 and p-
value = .000, 'Equal variances not assumed' has been considered. Based on this consideration, t value = 6.664, df
= 488.257 and p-value = .000 which is less than 0.05. It implies that the research hypothesis is rejected i.e. there
is a difference in performance due to the type of local government. Thus, the type of local government makes a
difference in student performance. Table 8 similarly presents the test result of the research hypothesis i.e. there
is no significant difference between the performance of boys and girls. As per the F value = 0.004 and P-value =
0.953 under Levine's test for equality of variances, t value has been considered as per 'Equal variances not
assumed'. By considering this, this table presents t value = -1.143, df = 538.950 and p-value = 0.254. It table
shows the fact that p-value = 0.254 is higher than 0.05 and it implies that the research hypothesis is retained.
That's why; this analysis claims that gender does not make a difference in the performance of students.
Page 11
International Journal on Studies in Education (IJonSE)
31
Table 8. Inferential Analysis of Difference on Students' Performance in terms of Gender, School Type, and
Local Government Type
Indicator Levene's Test for
Equality of Variances F Sig. t df Sig. (2-tailed)
School
Type
Equal variances
assumed
7.508 .006 -21.368 539 .000
Equal variances not
assumed
-22.771 497.096 .000
Local
Level
Equal variances
assumed
18.349 .000 6.320 539 .000
Equal variances not
assumed
6.664 488.257 .000
Gender Equal variances
assumed
.004 .953 -1.143 539 .254
Equal variances not
assumed
-1.143 538.950 .254
Table 9 inferentially presents the result of two hypotheses: there is no significant difference in student
performance due to their age and there is a significant difference in the performance of students across the
ethnic background. From the perspective of ethnicity and student performance, Table 9 presents p-value = .000
which is less than 0.05. So, it indicates that there is a significant difference in the performance of students due to
differences in their ethnic identity. Similarly, Table 9 also presents a p-value = 0.001 which is less than 0.005
and it implies that the hypothesis is rejected. It shows that there is a difference in student performance due to
their age. Thus, the age and ethnicity of the students make a difference in school student performance.
Table 9. Inferential Analysis of Difference in Students' Performance in terms of Ethnicity and Age
Indicator Sum of Squares df Mean Square F Sig.
Ethnicity 61.722 3 20.574 8.255 .000
Age 34.820 2 17.410 6.861 .001
Based on the differences presented in Table 9, multiple comparisons through the Tukey table have been
presented in Table 10. The table shows that the p-value of the group (Bramin/Chhetri and Janajati) and the p-
value of the group (14 years and 15-20 years students) are lower than 0.05. So, it implies that students from the
group of Brahmin/Chhetri and Janajati and a group of 14 years and 15-20 years students are doing better than
other groups of students.
Table 10. Multiple Comparisons of Differences on Student Performance as per Ethnicity and Age Group
Indicator Mean Difference (I-J) Std. Error Sig.
Ethnicity
(Brahmin/Chhetri)
.72401* .15916 .000
Age ( 14 years and 15-20
years students)
.47351* .14931 .005
Table 11 also tests the hypothesis: there is no significant difference in the mean score of the theoretical subject
and practical subjects. Table 11 presents that t value = -45.673, df = 540 and p-value = .000 which is less than
0.005. So, the research hypothesis is rejected and implies that there is a significant difference between the mean
score of practical subjects and theoretical subjects.
Table 11. Inferential Analysis of Difference on Students' Performance in terms of Nature of Examination
Indicator t df Sig. (2-tailed)
Pair of Theory and Practical Subject Score -45.673 540 .000
Thus, there is a significant difference in school student performance due to their type of school, type of local
government that governs schools, nature of examination, age, and ethnicity. But gender does not make a
difference in student performance.
Page 12
Chapagain
32
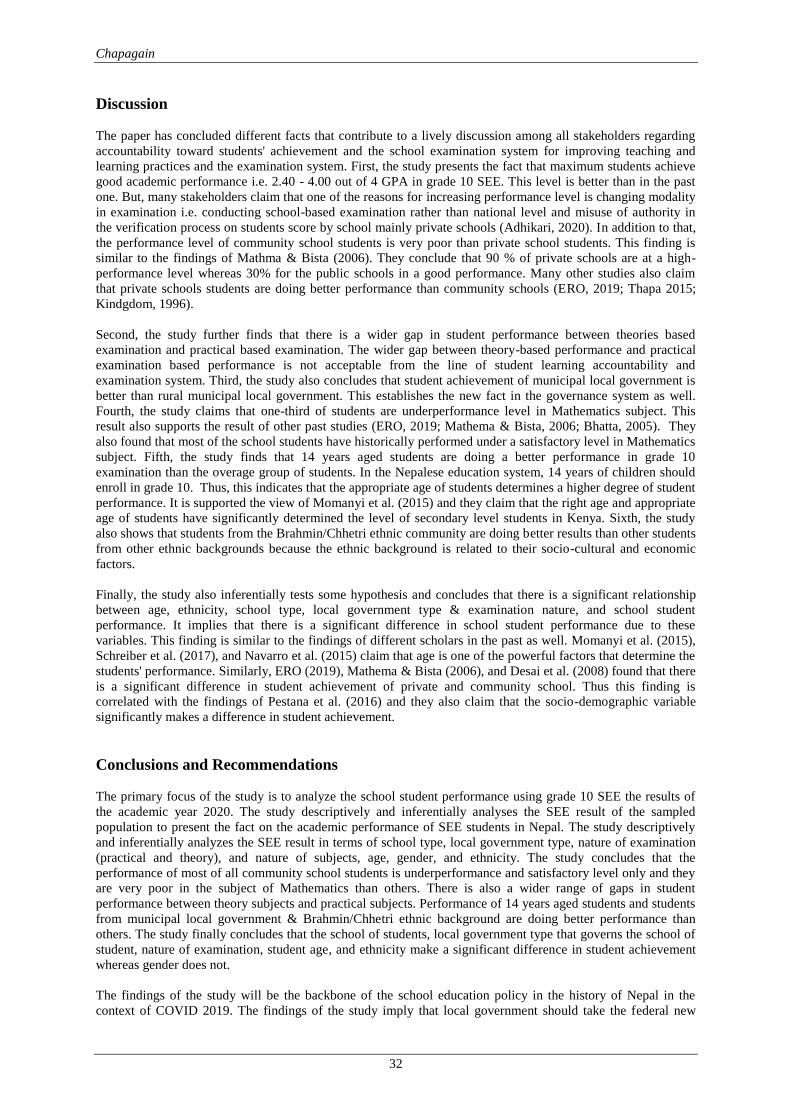
Discussion
The paper has concluded different facts that contribute to a lively discussion among all stakeholders regarding
accountability toward students' achievement and the school examination system for improving teaching and
learning practices and the examination system. First, the study presents the fact that maximum students achieve
good academic performance i.e. 2.40 - 4.00 out of 4 GPA in grade 10 SEE. This level is better than in the past
one. But, many stakeholders claim that one of the reasons for increasing performance level is changing modality
in examination i.e. conducting school-based examination rather than national level and misuse of authority in
the verification process on students score by school mainly private schools (Adhikari, 2020). In addition to that,
the performance level of community school students is very poor than private school students. This finding is
similar to the findings of Mathma & Bista (2006). They conclude that 90 % of private schools are at a high-
performance level whereas 30% for the public schools in a good performance. Many other studies also claim
that private schools students are doing better performance than community schools (ERO, 2019; Thapa 2015;
Kindgdom, 1996).
Second, the study further finds that there is a wider gap in student performance between theories based
examination and practical based examination. The wider gap between theory-based performance and practical
examination based performance is not acceptable from the line of student learning accountability and
examination system. Third, the study also concludes that student achievement of municipal local government is
better than rural municipal local government. This establishes the new fact in the governance system as well.
Fourth, the study claims that one-third of students are underperformance level in Mathematics subject. This
result also supports the result of other past studies (ERO, 2019; Mathema & Bista, 2006; Bhatta, 2005). They
also found that most of the school students have historically performed under a satisfactory level in Mathematics
subject. Fifth, the study finds that 14 years aged students are doing a better performance in grade 10
examination than the overage group of students. In the Nepalese education system, 14 years of children should
enroll in grade 10. Thus, this indicates that the appropriate age of students determines a higher degree of student
performance. It is supported the view of Momanyi et al. (2015) and they claim that the right age and appropriate
age of students have significantly determined the level of secondary level students in Kenya. Sixth, the study
also shows that students from the Brahmin/Chhetri ethnic community are doing better results than other students
from other ethnic backgrounds because the ethnic background is related to their socio-cultural and economic
factors.
Finally, the study also inferentially tests some hypothesis and concludes that there is a significant relationship
between age, ethnicity, school type, local government type & examination nature, and school student
performance. It implies that there is a significant difference in school student performance due to these
variables. This finding is similar to the findings of different scholars in the past as well. Momanyi et al. (2015),
Schreiber et al. (2017), and Navarro et al. (2015) claim that age is one of the powerful factors that determine the
students' performance. Similarly, ERO (2019), Mathema & Bista (2006), and Desai et al. (2008) found that there
is a significant difference in student achievement of private and community school. Thus this finding is
correlated with the findings of Pestana et al. (2016) and they also claim that the socio-demographic variable
significantly makes a difference in student achievement.
Conclusions and Recommendations
The primary focus of the study is to analyze the school student performance using grade 10 SEE the results of
the academic year 2020. The study descriptively and inferentially analyses the SEE result of the sampled
population to present the fact on the academic performance of SEE students in Nepal. The study descriptively
and inferentially analyzes the SEE result in terms of school type, local government type, nature of examination
(practical and theory), and nature of subjects, age, gender, and ethnicity. The study concludes that the
performance of most of all community school students is underperformance and satisfactory level only and they
are very poor in the subject of Mathematics than others. There is also a wider range of gaps in student
performance between theory subjects and practical subjects. Performance of 14 years aged students and students
from municipal local government & Brahmin/Chhetri ethnic background are doing better performance than
others. The study finally concludes that the school of students, local government type that governs the school of
student, nature of examination, student age, and ethnicity make a significant difference in student achievement
whereas gender does not.
The findings of the study will be the backbone of the school education policy in the history of Nepal in the
context of COVID 2019. The findings of the study imply that local government should take the federal new
Page 13
International Journal on Studies in Education (IJonSE)
33
structural model of governance an opportunity to bring the wider changes in school education through
formulating new policy related to the school education learning reform movement at public schools. It equally
recommends bringing changes in the school examination and verification system as well. This finding also
recommends revisiting the policy on student marking system in the practical exam as well because there is a
wider gap in performance in theory and practical subjects. Similarly, this study recommends the government to
focus on rural municipal government schools than municipal government in delivering educational resources
because rural municipal students are at a satisfactory level only. Thus, this study supports all governments to
develop and revisit the policy, guidelines related to school level teaching and learning practices, and school
examination systems.
Acknowledgments
The author is grateful to Mrs. Mohan Rai, Under Secretary, Ministry of Education, Science, and Technology for
her valuable help in collecting data from the sampled population.
References
Adhikari, P. (2020). Abuse of Rights in Evaluation. Gorkhapatra Daily.
https://old.gorkhapatraonline.com/epaper/view?paper=gorkhapatra&today=2020-08-26
Baba, I., Aliata M. I., & Patric, B. A. (2013). Demographic Factors and Students’ Academic Achievement in
Tertiary Institutions in Ghana: A study of Wa Polytechnic. Journal of Education and Practice, 4(20), 76-
80. https://www.iiste.org/Journals/index.php/JEP/article/view/7903
Benner, A. D., Boyle, A. E., & Sadler, S. (2016). Parental involvement and adolescents’ educational success:
The roles of prior achievement and socioeconomic status. Journal of Youth Adolescence, 45(1),1053–
1064. 10.1007/s10964-016-0431-4
Bhatta, S. D. (2004). A Descriptive Analysis of the Disparities in School Performance in the SLC Exams. SLC
Study Report # 1. Kathmandu, Nepal: The Education Sector Advisory Team, Ministry of Education and
Sports.
Bourdieu, P. (1973). Cultural Reproduction and Social Reproduction. In R. Brown (Ed.) Knowledge, Education,
and Cultural Change,56-68. https://edu301s2011.files.wordpress.com/2011/02/cultural-reproduction-
and-social-reproduction.pdf
Bowles, S. & Gintis, H. (2002). Schooling in Capitalist America Revisited. Sociology of Education, 75(1), 1-18.
10.2307/3090251
Caponera, E. & Losito.B. (2016). Context factors and student achievement in the IEA studies: evidence
from TIMSS. Large-scale Assess Education, 4(12), 1-22. 10.1186/s40536-016-0030-6.
Casanova F. P., Linares, M. C. G, Torre, M. J. & Carpio, M. (2005). Influence of family and socio‐demographic
variables on students with low academic achievement. Journal of Educational Psychology, 25(4), 423-
435. doi.org/10.1080/01443410500041888
CDC. (2014). Secondary Education Curriculum.https://lib.moecdc.gov.np/elibrary/pages/view.php?ref=567&k=
CERID. (2002a). School Effectiveness Study in Nepal: A Synthesis of Indicators. Formative research project
study report 5. Research Center for Educational Innovation and Development.
CERID. (2002b). Effective Classroom Teaching/learning – Phase 1: Classroom Delivery. Formative research
project study report 4. Kathmandu: Research Center for Educational Innovation and Development.
Cole, D. & Espinoza, A. (2008). Examining the Academic Success of Latino Students in Science Technology
Engineering and Mathematics (STEM) Majors. Journal of College Student Development, 49(4), 285-300.
10.1353/csd.0.0018
Coleman, J., et al. (1966). Equality of Educational Opportunity. Equity and Excellence, 6(5), 19-28.
doi.org/10.1080/0020486680060504
Creswell, J. W. (2012). Educational Research: Planning, Conducting, and Evaluating Quantitative and
Qualitative Research (4th
Ed.). PHI Learning.
Desai, S., A. Dubey, R. Vanneman, & R. Banerji. (2009). Private Schooling in India: A New Educational
Landscape. India Policy Forum, 5(1), 1-58.
Deutsch, M. (1967). The Disadvantaged Child. New York: Basic Books.
Dixit, S. (2019). Seeing through SEE Results. Setopati. https://en.setopati.com/view/149213
Edmonds, R. (1979). Effective Schools for the Urban Poor. Educational Leadership, 37(1), 15-28.
http://www.midwayisd.org/cms/lib/TX01000662/Centricity/Domain/8/2.%20Edmonds%20Effective%20
Schools%20Movement.pdf
Page 14
Chapagain
34
EDSC. (1997). National Assessment of Grade 3 Students. A report submitted to the Ministry of Education and
Sports. Educational and Developmental Service Center
EDSC. (1999). National Assessment of Grade 5 Students. A report submitted to the Academy for
Education and Sports. Educational and Developmental Service Center
EDSC. (2003). National Assessment of Grade 5 Students. A report submitted to the Research and Development
Section of the Department of Education, Ministry of Education and Sports. Educational and
Developmental Service Center
EDSC. (2001). National Assessment of Grade 3 Students. A report submitted to the Research and Development
Section of the Department of Education, Ministry of Education and Sports. Educational and
Developmental Service Center.
Education Act-1972. (2017). 9th
Amendment. The Law Commission. http://www.lawcommission.gov.np/np/
ERO. (2019). National Assessment of Student Achievement, 2018: Main Report.http://ero.gov.np/category/10
Fuller, B. (1986). Raising School Quality in Developing Countries: What Investments Boost Learning. The
World Bank. https://eric.ed.gov/?id=ED296920
Hair, N. L., Hanson, J. L., Wolfe, B. L., &Pollak, S. D. (2015). Association of child poverty, brain development,
and academic achievement. JAMA Pediatrics, 169(1), 22–29.
https://jamanetwork.com/journals/jamapediatrics/fullarticle/2381542
Han, S. Y., Capraro, R. M., & Capraro, M. M. (2015). How science, technology, engineering, and mathematics
(STEM) project-based learning (PBL) affects high, middle, and low achievers differently: The impact of
student factors on achievement. International Journal of Science and Mathematics Education. 1-25.
10.1007/s10763- 014- 9526- 0
Harry, L. (2016). The Effects of School Type on Academic Performance-Evidence from the Secondary Entrance
Assessment Exam in Trinidad. ERIC. https://eric.ed.gov/?id=ED586316
Henderson, A. T. (1988). Good news: An ecologically balanced approach to academic improvement.
Educational Horizons, 66(2), 60-67. 10.2307/42925895
Huang, G., Taddese, N., & Walter, E. (2000). Entry and persistence of Women and Minorities in college science
and engineering education: Research and Development Reports.
https://files.eric.ed.gov/fulltext/ED566411.pdf
Insah, B; Mumuni, A; & Patrick, B. (2018). Demographic Factors and Students' Academic Achievement in
Tertiary Institutions in Ghana: A study of Wa Polytechnic. Journal of Education and practice, 4(20), 76-
80.https://www.iiste.org/Journals/index.php/JEP/article/view/7903
Jaeger A. J. & Eagan M. K. (2007).Exploring the Value of Emotional Intelligence: A Means to Improve
Academic Performance.NASPA Journal, 44(3), 512-53.10.2202/0027-6014.1834
Jobbins, D. (2014 March 28). Ethnicity has the greatest impact on degree grades: Report. University World
News.https://www.universityworldnews.com/post.php?story=20140329102323216#:~:text=The%20an
alysis%20shows%20a%20significant,tuition%20fees%20from%202012%2D13.
Joy, T. H. E. (2013). Conceptual Framework of Teachers’ Competence In Relation To Students’ Academic
Achievement. International Journal of Networks and Systems, 2(3), 15-20.
http://warse.org/pdfs/2013/ijns01232013.pdf
Kaur , K., Chung, H. T. & Lee, N. (2010) Correlates of Academic Achievement for Master of Education
Students at Open University Malaysia. [Paper Presentation]. 6th Pan-Common wealth Forum on Open
Learning, 24th
- 28th
November 2010, Kochi, India. http://eprints.oum.edu.my/480/
Keith, P. M., Byerly, C., Floerchinger, H., Pence, E. & Thornberg, E. (2006). Deficit and resilience perspectives
on performance and campus comfort of adult students. College Student Journal, 40 (3), 546- 556.
https://pdfs.semanticscholar.org/9a7e/1be9f2fc9468557ddde26a4bdbd93c019588.pdf?_ga=2.40394858.9
54059579.1599281388-181216952.1585046901.
Kelly, J. (2012). Learning Theories. The Peak Performance Center.
http://thepeakperformancecenter.com/educational-learning/learning/theories/
Kingdon, G. & Robert Cassen, R. (2010). Ethnicity and low achievement in English schools.British Educational
Research Journal, 36(3), 403-431. http://www.jstor.com/stable/27823617
Kingdon, G. (1996). The Quality and Efficiency of Public and Private Education: A Case Study of Urban India.
Oxford Bulletin of Economics and Statistics, 58(1): 57 – 82. 10.1111/j.14680084.1996.mp58001004.x
Lee, H. (2007). The Effects of School Racial and Ethnic Composition on Academic Achievement During
Adolescence. The Journal of Negro Education, 76(2),154-172. www.jstor.org/stable/40034554?seq=1
Lee, J., & Stankov, L. (2016). Non-cognitive psychological processes and academic achievement. Rutledge
Lee, J., Liu, X., Amo, L. C., & Wang, W. L. (2013). Multilevel Linkages between State Standards, Teacher
Standards, and Student Achievement: Testing External versus Internal Standards-Based Education
Models. Educational Policy, 28(6), 780–811. http://doi.org/10.1177/0895904813475708
Lemberger, M., E., Selig, J. P., Bowers, H., & Rogers, J. E. (2015). Effects of the student success skills program
on executive functioning skills, feelings of connectedness, and academic achievement in a predominantly
Page 15
International Journal on Studies in Education (IJonSE)
35
Hispanic, low-income middle school district. Journal of Counseling Development, 93(1), 25- 37.
doi:10.1002/j.1556-6676.2015.00178.x
Levpuscek, M. P., & Zupancic, M. (2008). Math Achievement in Early.Journal of Early Adolescence, 20(10),
1–30. http://doi.org/10.1177/0272431608324189
Liem, G. A. D., & Tan, S. H. (2019). Asian education miracles: In search of socio-cultural and psychological
explanations. New York: Rutledge
Local Government Operating Act. (2017). The Law Commission.
http://www.chainpurmun.gov.np/en/content/local-government-operation-act-2074-0
Maestri, V. (2017) Can ethnic diversity have a positive effect on school achievement? Education Economics,
25(3), 290-303, DOI: 10.1080/09645292.2016.1238879
Martin, M. O.; Mullis, I. V. S.; Foy, P. & Hooper, M. (2015). TIMSS 2015 International Results in Science.
TIMSS & PIRLS.
http://timssandpirls.bc.edu/timss2015/international-results/wpcontent/uploads/filebase/full%20pdfs/T15-
International-Results-in-Science-Grade-8.pdf
Mathema, K.B. & Bista M.M. (2006). Study on Student Performance in SLC. Ministry of Education: Research
Report. https://www.moe.gov.np/assets/uploads/files/SLC_Report_Main_English.pdf
Matlin, M.W. (1994). Cognition. Harcourt Brace College Publishers.
METCON. (1995). BPEP Strategy for Remote Areas.METCON Consultants.
MoEST. (2018). School Structure in Nepal. Educational Information.
EDUCATION%20GOVERNANCE%20AT%20LOCAL%20GOVERNMENTS%20IN%20NEPAL.pdf
MOEST.(2019). High-Level National Education Commission Report.
https://www.academia.edu/38190989/Nepal_High_Level_National_Education_Commission_Report_201
9_for_reforming_higher_education_and_school_level_education
MOF. (2020). Economic Survey 2018/19: Annual Report.
https://mof.gov.np/uploads/document/file/Economic_Survey_2076-77.pdf
Momanyi, J. M.; Too, J. & Simiyu, C. (2015). Effect of Students’ Age on Academic Motivation and Academic
Performance among High School Students in Kenya. Asian Journal of Education and e-Learning 3(5),
337-342. https://ajouronline.com/index.php/AJEEL/article/view/3130
Navarro, J. J.; Rubio, J. G.; and Olivers, P. R. (2015).The Relative Age Effect and Its Influence on Academic
Performance.PLOS ONE, 10(10) 1-18. DOI:10.1371/journal.pone.0141895
NEB. (2020). Evaluation, Publication, and Approval Guideline of Grade 10- SEE Students.
https://www.see.gov.np/
Nemeth, J., & Long, J. G. (2012). Assessing Learning Outcomes in U.S. Planning Studio Courses. Journal of
Planning Education and Research, 32(4), 476–490.1177/0739456X12453740
Neupane, P., Pokharel, T., Dhungana, H., Poudyal, T., Ghimire, I.P., Gupta, A. & Poudel A. (2018). Political
Economy Analysis of Emerging Education Governance at Local Level in Nepal.Lalitpur: Nepal
Administrative Staff College and The Asia Foundation.
https://nasc.org.np/sites/default/files/POLITICAL%20ECONOMY%20ANALYSIS%20OF%20EMERG
ING%20EDUCATION%20GOVERNANCE%20AT%20LOCAL%20GOVERNMENTS%20IN%20
NEPAL.pdf
New ERA. (1995). BPEP Achievement Study. New ERA.
Newhouse, D. & Beegle, K. (2006). The Effect of School Type on Academic Achievement: Evidence from
Indonesia. The Journal of Human Resources, 41(3),529-557. www.jstor.org/stable/40057268?seq=1
Olanipekun, S. S. (2015). Analysis of Students’ Academic Performance in General English in Kwara State
College of Education (Tech.), Lafiagi, Nigeria. Open Access Library Journal, 2(2), 1-7.
http://dx.doi.org/10.4236/oalib.1101262
Pestanaa, L., Duarteb, J. & Coutinhob, E. (2016). Socio-demographic variables determine the academic
performance of Adolescents. [Conference Paper].2nd International Conference on Health and Health
Psychology. http://dx.doi.org/10.15405/epsbs.2016.07.02.19
Rural Development Society Chabahil & Molung Foundation. (2017). A Study on Factors of Student Learning
Achievements and Dynamics for Better Learning Conditions: A case study of selected schools. A report
submitted to the Ministry of Education Nepal.
https://www.doe.gov.np/assets/uploads/files/632761d93738aa7abd6159bc9f642c33.pdf
Schleicher, A. (2019). PISA 2018: Insight and Interpretations. OECD.
https://www.oecd.org/pisa/PISA%202018%20Insights%20and%20Interpretations%20FINAL%20PDF.p
df
Schreiber, D.; Agomate, J. C.; & Oddi, B. (2017). The Impact of Demographic Influences on academic
Performance and Student Satisfaction with Learning as Related to Self-Esteem, Self-Efficacy, and
Cultural Adaptability within the Context of the Military. International Journal of Learning, Teaching,
and Educational Research, 16(4), 67-90. https://www.ijlter.org/index.php/ijlter/article/download/903/pdf
Page 16
Chapagain
36
Schulz, W., Ainley, J., Fraillon, J., Kerr, D., & Losito, B. (2010). ICCS 2009 international report: Civic
knowledge, attitudes, and engagement among lower-secondary school students in 38 countries.
Amsterdam: International Association for the Evaluation of Educational Achievement (IEA).
https://heefa.net/files/ICCS_2009_International_Report.pdf
Shahzadi, E., and Ahmad, Z. (2011). A study on the academic performance of university students.[Conference
paper].8th
International Conference on Recent Advances in Statistics. 10.13140/2.1.3949.3126
Shatzer, R. H., Caldarella, P., Hallam, P. R., & Brown, B. L. (2013). Comparing the effects of instructional and
transformational leadership on student achievement: Implications for practice, Educational
Management Administration & Leadership, 42(4), 445–459. 10.1177/1741143213502192
Shrestha, K. N. (2014). Genuine Efforts for Quality in some Community Schools Some case studies. Report
submitted to the Ministry of Education.
Shumox, L., & Lomax, R. (2001). Parental efficacy: Predictor of parenting behavior and adolescent outcomes.
Parenting, 2(2): 127-150. 10.1207/S15327922PAR0202_03
Singh, G. B. (2004). A Comparative Study of School Leaving Examinations in SAARC Countries. SLC Study
Report # 2, Kathmandu: The Education Sector Advisory Team, Ministry of Education, and Sports.
Subedi, B. R. (2004). Predicting Student Achievement: A Multilevel Analysis of Classrooms and Schools.
Journal of Education and Development, 21(1), 19 – 32.
https://www.cerid.org/?s=pub&a=download&id=65cf876c6a7dc7c242b958995e46fb4f
Thapa, A. (2015). Community and private school performance in Nepal: An Analysis Using the SLC
Examination. Education Economics, 23(1), 47-62. 10.1080/09645292.2012.738809
Thapa, A. (2015). Community and private school performance in Nepal: An Analysis Using the SLC
Examination. Education Economics, 23(1), 47-62. https://doi.org/10.1080/09645292.2012.738809
UNESCO Asia-Pacific (2020).The 5th
Asia-Pacific Meeting on Education 2030 (APMED2030) Proceedings.
https://apa.sdg4education2030.org/index.php/node/424
Vygotsky, L. (1978). Interaction between learning and development.Readings on the development of children,
23(3), 34-41. https://www.oerafrica.org/sites/default/files/L%20%26%20L%20reader_section%20one-
reading_4.pdf
Walker, D. A. (1976). The IEA six subject survey: An empirical study of education in twenty-one countries.
Amsterdam: International Association for the Evaluation of Educational Achievement (IEA).
Waters, T. J., & Marzano, R. J. 2006. School district leadership that works: The effect of superintendent
leadership on student achievement. Mid-Continent Research for Education and Learning, 5(9), 135-156.
https://files.eric.ed.gov/fulltext/ED494270.pdf
Winnaar, L. D., Frempong, G., &Blignaut, R. (2015). Understanding school effects in South Africa using
multilevel analysis: Findings from TIMSS 2011. Journal of Research in Educational Psychology, 13(1),
151–170. doi:10.14204/ejrep.38.16036
World Bank (2018). Learning to Realize to Education's promise.
https://www.worldbank.org/en/communityation/wdr2018
Yamane, T. (1967). Statistics: An Introductory Analysis (2nd
Ed.). Harper and Row.
https://www.gbv.de/dms/zbw/252560191.pdf
Zhou, M., & Brown, D. (2015). Educational Learning Theories (2nd
Ed.). Education Open Textbook.
https://oer.galileo.usg.edu/cgi/viewcontent.cgi?article=1000&context=education-textbooks
Author Information Yogendra Chapagain
https://orcid.org/0000-0001-5178-3197
Nepal Open University
Faculty of Social Science and Education
Manbhawan, Lalitpur
Kathmandu
Nepal
Contact e-mail: [email protected]