Page 1
Computational Synthesis for
Scientific Experimentation
Siu-wai Leung
TH
E
U N I V E R S
I TY
OF
ED I N B U
RG
H
Doctor of Philosophy
Centre for Intelligent Systems and their Applications
School of Informatics
University of Edinburgh
2007
Page 3
Abstract
This thesis presents a new use of computational synthesis for scientific experi-
mentation, particularly synthesis from parameterisable experiment protocols. An
experiment protocol, in addition to its own specific materials and methods, can
incorporate modular protocols and can be made modular to be used by other
protocols. Two synthesised Web-based experiments for cognitive science were
conducted to demonstrate the practicality of experiment synthesis - obtaining
significant scientific results. Our conceptual model of experiment protocols as
specifications (in a logic programming style) leads us to use conditional rewriting
techniques for logic program synthesis in synthesising experiment setups from ex-
periment protocols. A method of conditional rewriting and stepwise refinement of
an abstract experiment protocol is specified using grammars with optional feature
structures. Specific rewrite rule conditions including selective mappings between
feature structures of protocols determine whether and how protocol rewriting is
performed. Following simple grammars, the setups of the exemplified experi-
ments were synthesised, including Websites as materials, experiment procedures
as methods, and cognitive tests as protocol modules. Two synthesised cognitive
science experiments on causal perception and design preference were conducted
to test the effects of rhetorical (temporal and causal) and modal (tabular and
graphical) presentation of information. In the causal perception experiment, the
test subjects could not differentiate the effects of temporal and causal rhetorics
in presenting aviation accident information. However, their ratings on causality
based on the covariation between potential causes and consequences gave evidence
for a better agreement with the Power PC theory of causal perception (compared
to the others assessed and still under dispute) in aviation accident reporting (a
different test scenario). In the design preference experiment, more people prefer
graphical to tabular presentation. Despite the high preference for graphical pre-
sentation, the given tabular presentation was generally rated to be easier than
graphical presentation to interpret, especially for those who score below aver-
age in the visualisation and analogy-making tests. This piece of evidence helps
generate a hypothesis relating design preferences to specific cognitive abilities.
Without the use of computational synthesis, the experiment setups and scientific
results would be impractical to obtain.
iii
Page 4
Acknowledgements
I am grateful to Dave Robertson, my supervisor, for his encouragement, guid-
ance, insights, patience, and support throughout my PhD study. I would not have
started my PhD study without his encouragement. I would not enjoy academic
research so much during this period of study without his insightful advice and
helpful guidance. Without his great amount of patience and support, I could not
have survived from various difficulties and finished my thesis.
I thank all the persons, including my parents, my brothers, my fellow PhD
students, my fellow researchers in Edinburgh (or around me through Internet),
my current and former colleagues/co-workers (particularly office mates), and my
other friends, who have been giving me valuable advice, sharing with me their
experience, and turning my life tribulations into grateful joys.
I thank my wife Ivy and son Ian, who have sacrificed so much for me to study.
Parts of this work has been supported by EPSRC grant GR/M98302 for re-
search on Communicating Knowledge about Accidents from Synthesized Web-
sites.
iv
Page 5
Declaration
I declare that this thesis was composed by myself, that the work contained herein
is my own except where explicitly stated otherwise in the text, and that this work
has not been submitted for any other degree or professional qualification except
as specified.
(Siu-wai Leung)
v
Page 7
Table of Contents
1 Introduction 1
1.1 Problems in Scientific Experimentation . . . . . . . . . . . . . . . 2
1.2 Computational Synthesis of Experiments . . . . . . . . . . . . . . 3
1.2.1 Advantages of Experiment Synthesis . . . . . . . . . . . . 4
1.2.2 Synthesis from Experiment Protocols . . . . . . . . . . . . 5
1.2.3 Synthesis of Experiments . . . . . . . . . . . . . . . . . . . 5
1.3 Exploring Experiment Synthesis . . . . . . . . . . . . . . . . . . . 6
1.3.1 Pure Computational Experiments . . . . . . . . . . . . . . 6
1.3.2 Web-based Experiments in Cognitive Science . . . . . . . . 7
1.4 Scope of the Work . . . . . . . . . . . . . . . . . . . . . . . . . . 8
1.5 Computing Environment . . . . . . . . . . . . . . . . . . . . . . . 9
1.6 Organisation of this Thesis . . . . . . . . . . . . . . . . . . . . . . 9
2 Scientific Experimentation 11
2.1 Anything Goes but Experimentation . . . . . . . . . . . . . . . . 11
2.2 Reproducibility of Experiments . . . . . . . . . . . . . . . . . . . 15
2.2.1 Kinds of Reproducibility . . . . . . . . . . . . . . . . . . . 16
2.2.2 Reproducibility Indicates Reliability . . . . . . . . . . . . 16
2.3 Reproducibility Through Protocols . . . . . . . . . . . . . . . . . 17
2.3.1 Protocols for Specifications . . . . . . . . . . . . . . . . . . 17
2.3.2 Protocols for Material Reproducibility . . . . . . . . . . . 19
2.4 Experiment Synthesis Through Protocols . . . . . . . . . . . . . . 19
2.5 Towards Lab-on-the-Web . . . . . . . . . . . . . . . . . . . . . . . 20
2.6 Chapter Summary . . . . . . . . . . . . . . . . . . . . . . . . . . 21
vii
Page 8
3 Morganic Grammars 23
3.1 Cognitive Schemas and Grammars . . . . . . . . . . . . . . . . . . 23
3.2 Integrating Knowledge Representations . . . . . . . . . . . . . . . 25
3.2.1 Frames . . . . . . . . . . . . . . . . . . . . . . . . . . . . . 25
3.2.2 Typed Feature Structures . . . . . . . . . . . . . . . . . . 26
3.2.3 Formal Concept Analysis . . . . . . . . . . . . . . . . . . . 27
3.3 Morganic Grammars . . . . . . . . . . . . . . . . . . . . . . . . . 27
3.3.1 Morgans are Grammatical Categories . . . . . . . . . . . . 29
3.3.2 Definition of Morganic Grammars . . . . . . . . . . . . . . 29
3.3.3 Attribute Structures of Morgans . . . . . . . . . . . . . . . 30
3.3.4 Morganic Grammar Rules . . . . . . . . . . . . . . . . . . 31
3.3.5 Prolog Syntax of Morganic Grammar Rules . . . . . . . . 32
3.4 Chapter Summary . . . . . . . . . . . . . . . . . . . . . . . . . . 32
4 Website Synthesis 33
4.1 Computational Synthesis of Websites . . . . . . . . . . . . . . . . 34
4.2 Website Design Model . . . . . . . . . . . . . . . . . . . . . . . . 35
4.3 Simple Website Interface Model . . . . . . . . . . . . . . . . . . . 36
4.3.1 Structure Refinement . . . . . . . . . . . . . . . . . . . . . 37
4.3.2 Navigation Synthesis . . . . . . . . . . . . . . . . . . . . . 37
4.3.3 Visualisation Synthesis . . . . . . . . . . . . . . . . . . . . 38
4.3.4 Features of SWiM . . . . . . . . . . . . . . . . . . . . . . . 39
4.4 Rewriting for Website Synthesis . . . . . . . . . . . . . . . . . . . 40
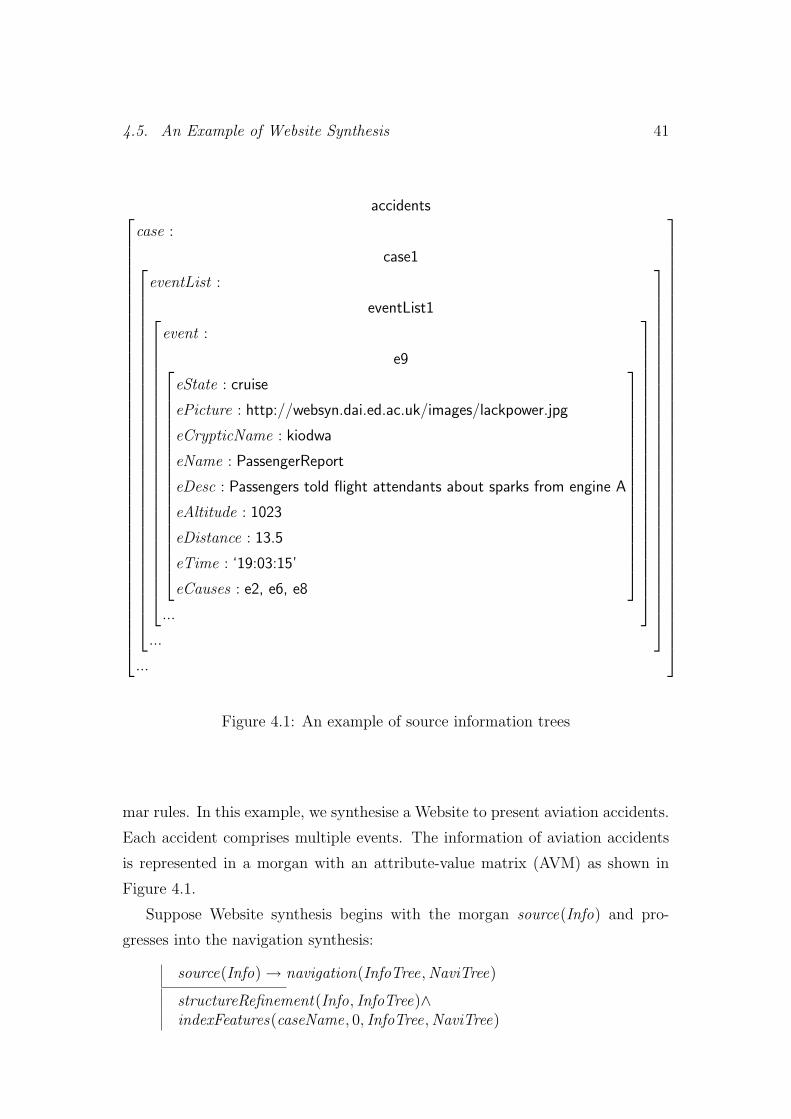
4.5 An Example of Website Synthesis . . . . . . . . . . . . . . . . . . 40
4.6 Chapter Summary . . . . . . . . . . . . . . . . . . . . . . . . . . 45
5 Experiment Synthesis 47
5.1 A Grammar for Experiment Synthesis . . . . . . . . . . . . . . . . 48
5.2 Computational Synthesis of Experiments . . . . . . . . . . . . . . 49
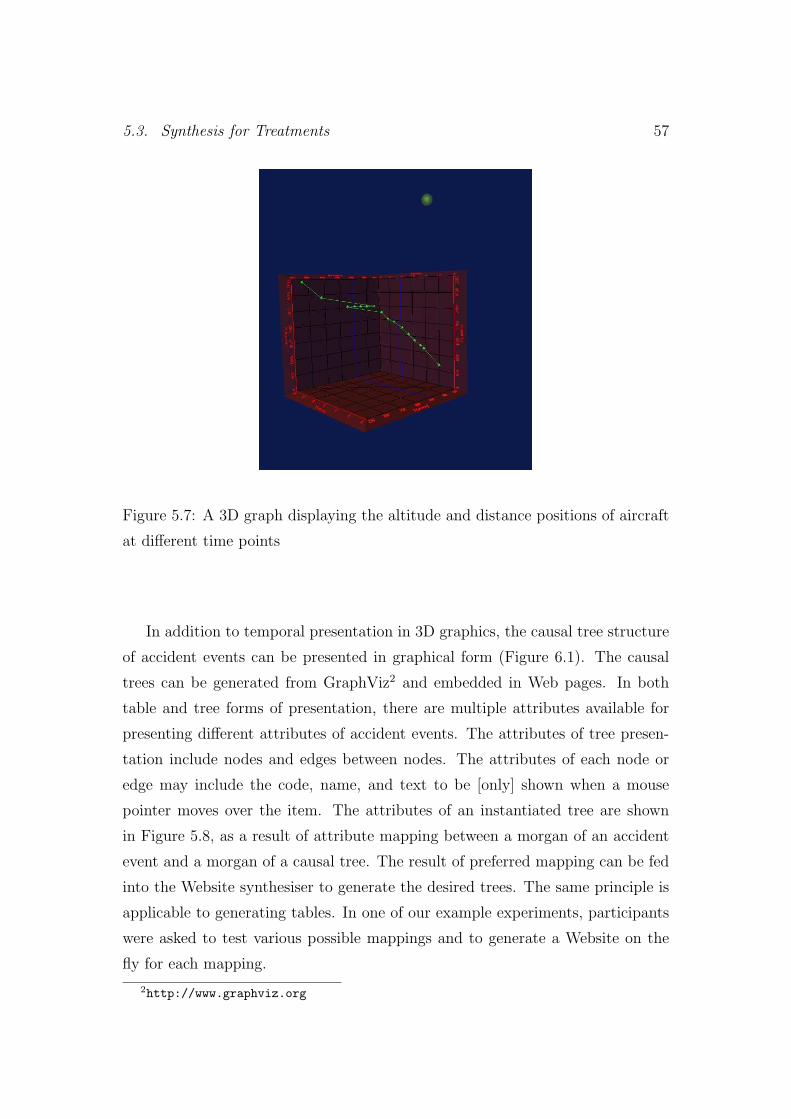
5.3 Synthesis for Treatments . . . . . . . . . . . . . . . . . . . . . . . 53
5.3.1 Rhetorics in Presenting Information . . . . . . . . . . . . . 54
5.3.2 Technical Terminology . . . . . . . . . . . . . . . . . . . . 58
5.3.3 Cause-effect Covariations . . . . . . . . . . . . . . . . . . . 58
5.4 Experiment Units . . . . . . . . . . . . . . . . . . . . . . . . . . . 59
viii
Page 9
5.5 Data Collection . . . . . . . . . . . . . . . . . . . . . . . . . . . . 59
5.6 Reusable Parts of Experiments . . . . . . . . . . . . . . . . . . . . 60
5.7 Synthetic Web-based Experiments . . . . . . . . . . . . . . . . . . 60
5.8 Chapter Summary . . . . . . . . . . . . . . . . . . . . . . . . . . 61
6 Synthesised Experiment 1: Causal Perception 63
6.1 Causal Perception Models . . . . . . . . . . . . . . . . . . . . . . 64
6.2 Factors Affecting Causal Perception . . . . . . . . . . . . . . . . . 65
6.3 Objectives and Hypotheses . . . . . . . . . . . . . . . . . . . . . . 65
6.4 Methods . . . . . . . . . . . . . . . . . . . . . . . . . . . . . . . . 66
6.4.1 Participants . . . . . . . . . . . . . . . . . . . . . . . . . . 66
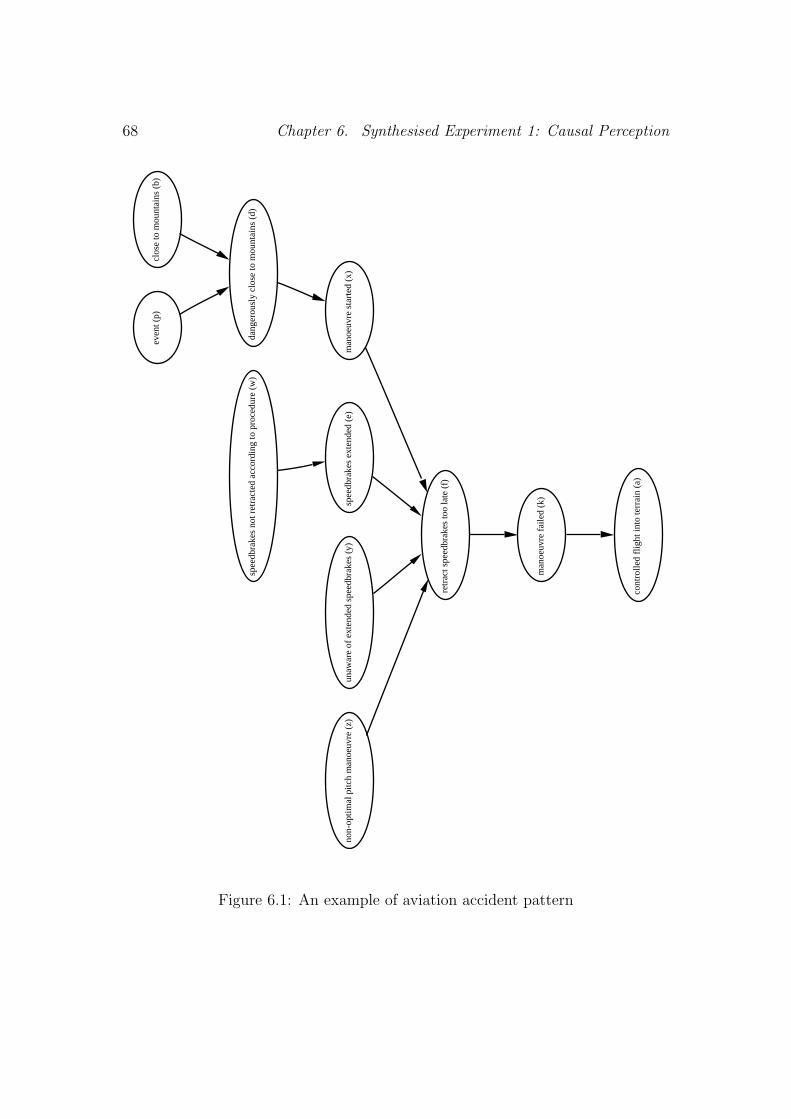
6.4.2 Generating Websites . . . . . . . . . . . . . . . . . . . . . 67
6.4.3 Experiment Design . . . . . . . . . . . . . . . . . . . . . . 69
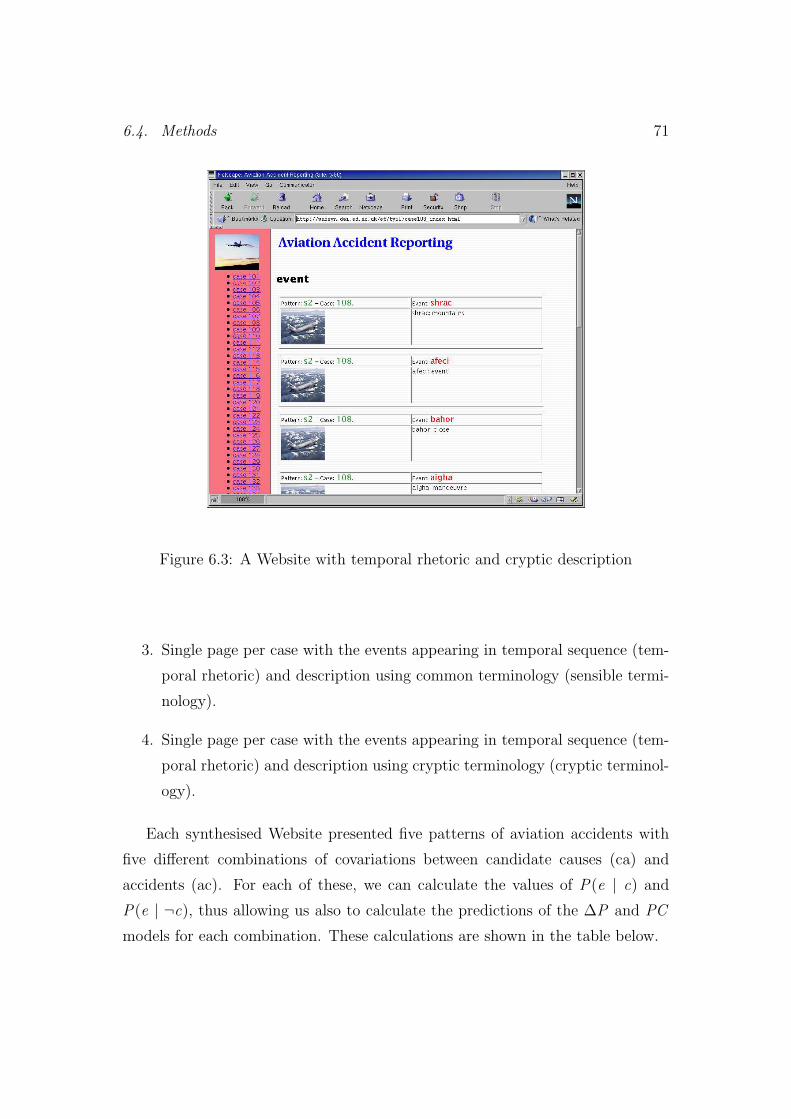
6.4.4 Rhetorics of presentation . . . . . . . . . . . . . . . . . . . 70
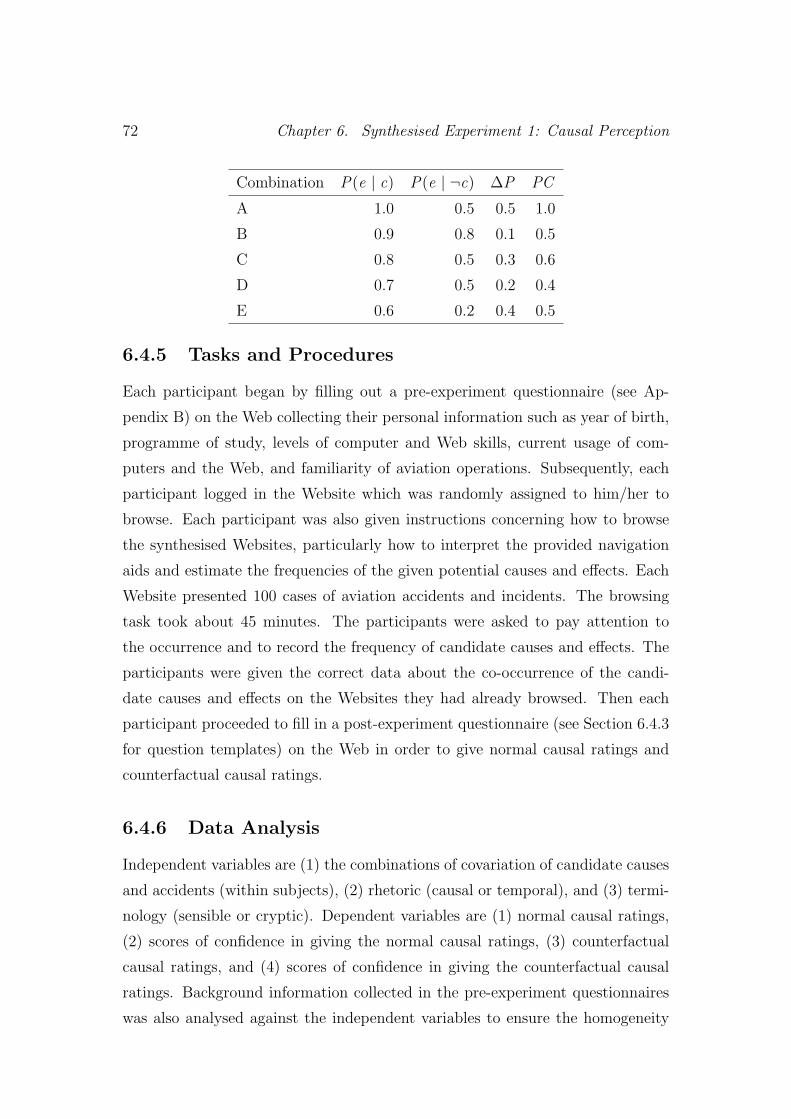
6.4.5 Tasks and Procedures . . . . . . . . . . . . . . . . . . . . 72
6.4.6 Data Analysis . . . . . . . . . . . . . . . . . . . . . . . . . 72
6.5 Results . . . . . . . . . . . . . . . . . . . . . . . . . . . . . . . . . 73
6.5.1 No significance in the background among groups . . . . . . 73
6.5.2 No significance in rhetorics and terminology factors . . . . 73
6.5.3 Significant difference between normal and counterfactual
ratings . . . . . . . . . . . . . . . . . . . . . . . . . . . . . 74
6.5.4 Normal causal ratings were closer to PC . . . . . . . . . . 74
6.6 Discussion . . . . . . . . . . . . . . . . . . . . . . . . . . . . . . . 75
6.7 Chapter Summary . . . . . . . . . . . . . . . . . . . . . . . . . . 77
7 Synthesised Experiment 2: Preferences and Cognitive Factors 79
7.1 Introduction . . . . . . . . . . . . . . . . . . . . . . . . . . . . . . 79
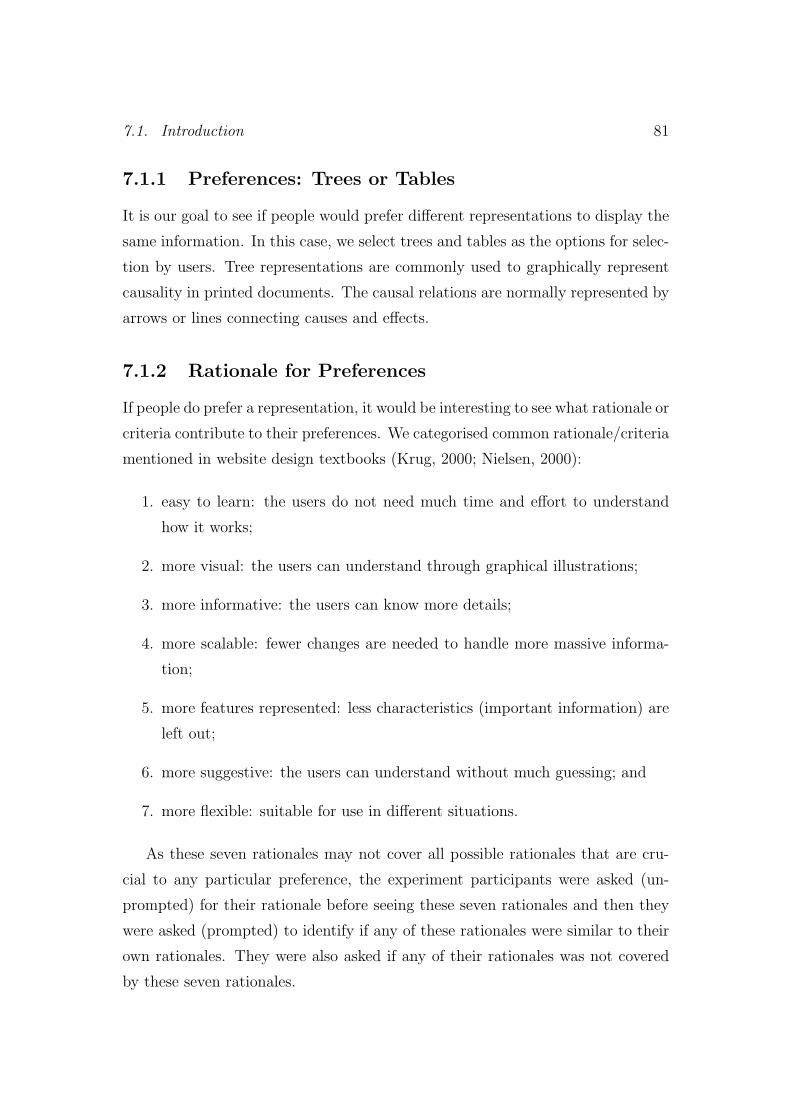
7.1.1 Preferences: Trees or Tables . . . . . . . . . . . . . . . . . 81
7.1.2 Rationale for Preferences . . . . . . . . . . . . . . . . . . . 81
7.1.3 Cognitive Tests . . . . . . . . . . . . . . . . . . . . . . . . 82
7.2 Objectives of the Experiment . . . . . . . . . . . . . . . . . . . . 82
7.3 Materials and Methods . . . . . . . . . . . . . . . . . . . . . . . . 82
7.3.1 Participants . . . . . . . . . . . . . . . . . . . . . . . . . . 82
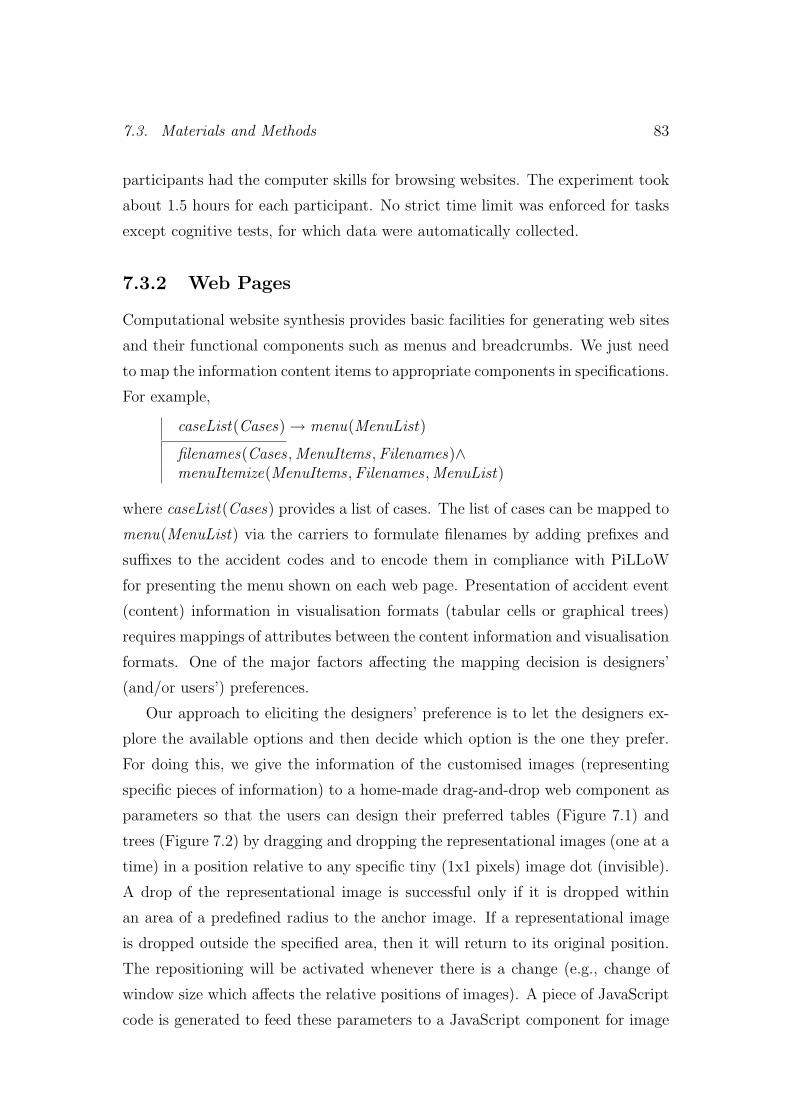
7.3.2 Web Pages . . . . . . . . . . . . . . . . . . . . . . . . . . . 83
ix
Page 10
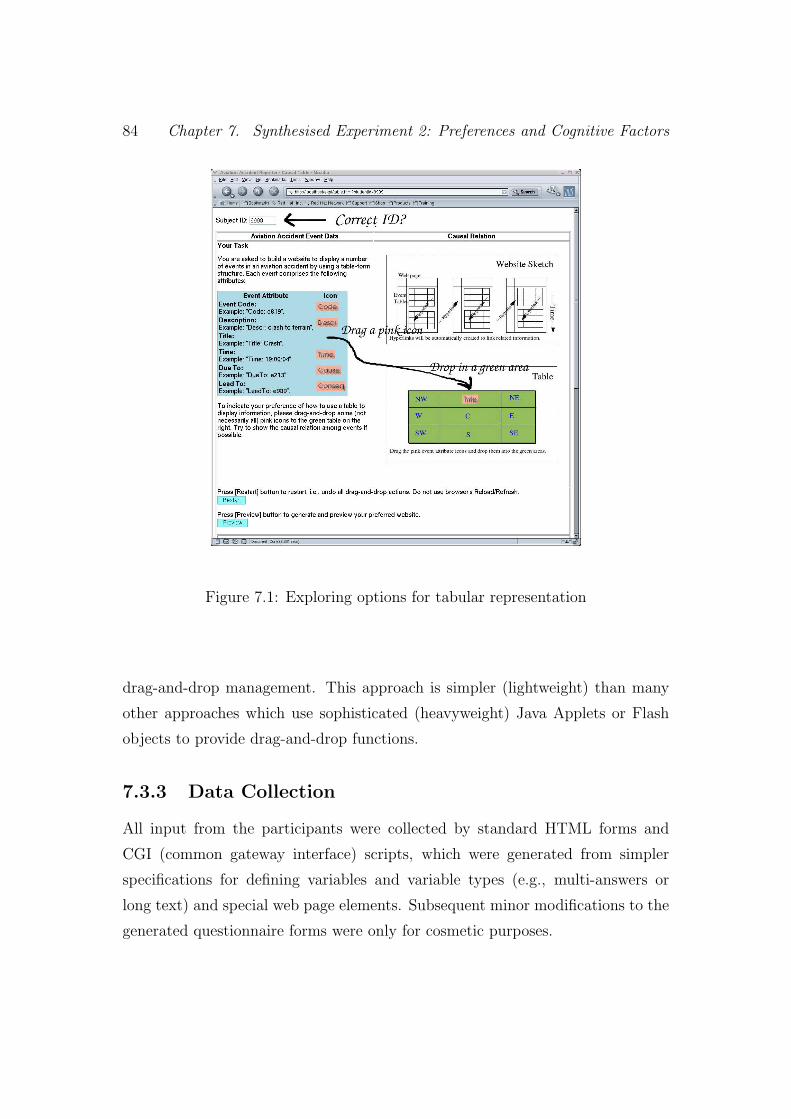
7.3.3 Data Collection . . . . . . . . . . . . . . . . . . . . . . . . 84
7.3.4 Tree and Table Generators . . . . . . . . . . . . . . . . . . 85
7.3.5 Tasks . . . . . . . . . . . . . . . . . . . . . . . . . . . . . . 85
7.3.6 Data Analysis . . . . . . . . . . . . . . . . . . . . . . . . . 86
7.4 Results . . . . . . . . . . . . . . . . . . . . . . . . . . . . . . . . . 87
7.4.1 Background of Participants . . . . . . . . . . . . . . . . . 87
7.4.2 Preferences . . . . . . . . . . . . . . . . . . . . . . . . . . 87
7.4.3 Rationales . . . . . . . . . . . . . . . . . . . . . . . . . . . 88
7.4.4 Cognitive Tests . . . . . . . . . . . . . . . . . . . . . . . . 88
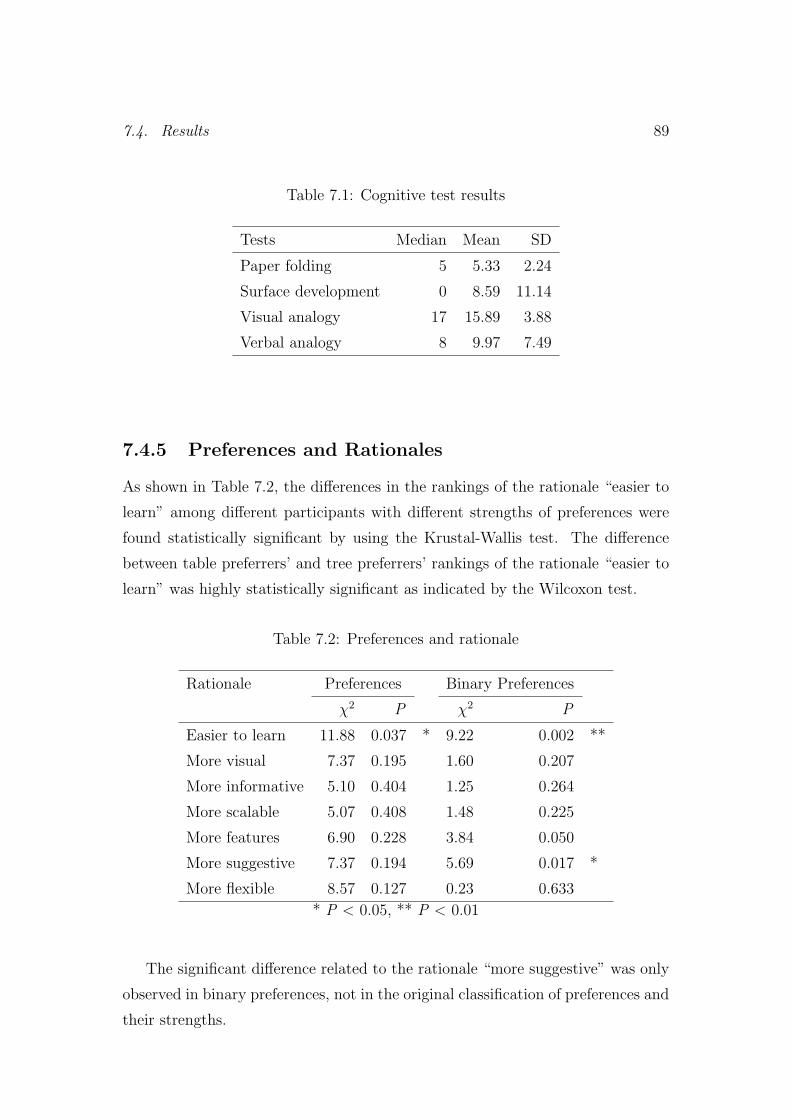
7.4.5 Preferences and Rationales . . . . . . . . . . . . . . . . . . 89
7.4.6 Preferences and Cognitive Tests . . . . . . . . . . . . . . . 90
7.4.7 Rationale and Cognitive Tests . . . . . . . . . . . . . . . . 90
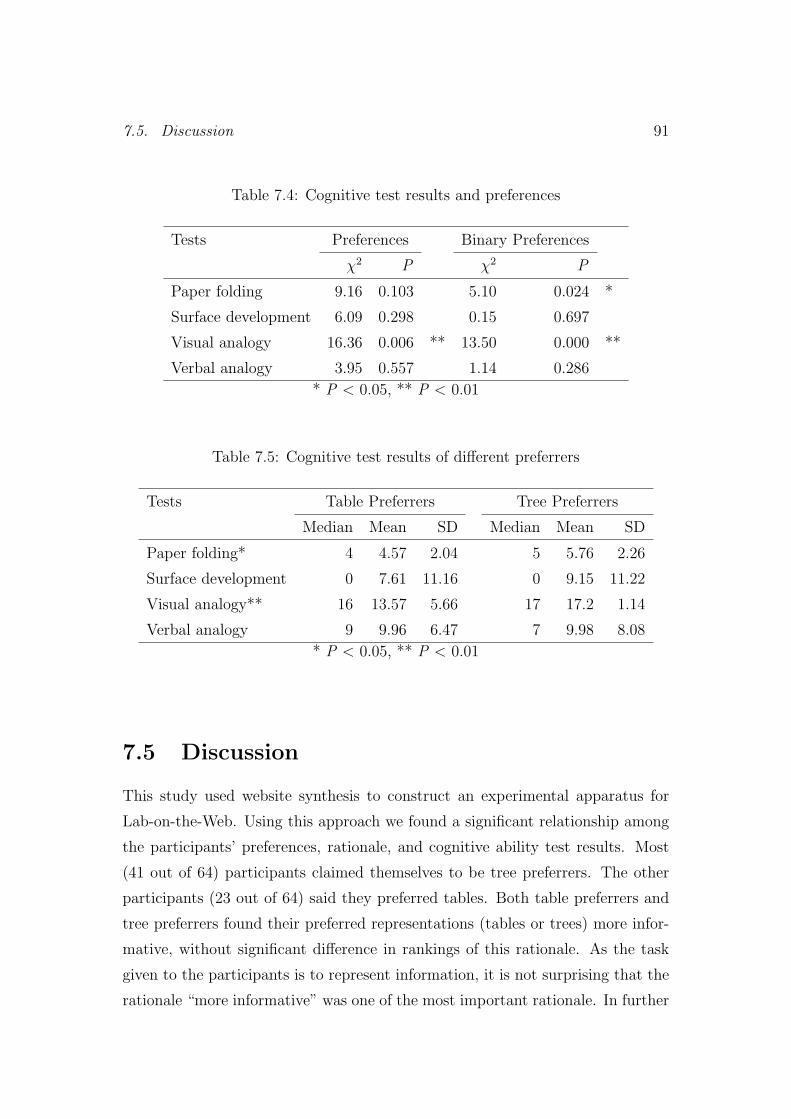
7.5 Discussion . . . . . . . . . . . . . . . . . . . . . . . . . . . . . . . 91
7.6 Chapter Summary . . . . . . . . . . . . . . . . . . . . . . . . . . 94
8 Significance and Further Work 95
8.1 Contributions . . . . . . . . . . . . . . . . . . . . . . . . . . . . . 96
8.1.1 Knowledge Representation . . . . . . . . . . . . . . . . . . 96
8.1.2 Website Synthesis . . . . . . . . . . . . . . . . . . . . . . . 96
8.1.3 Experiment Synthesis . . . . . . . . . . . . . . . . . . . . . 96
8.1.4 Causal Perception Experiment . . . . . . . . . . . . . . . . 96
8.1.5 Design Preference Experiment . . . . . . . . . . . . . . . . 97
8.2 Broader Significance . . . . . . . . . . . . . . . . . . . . . . . . . 97
8.2.1 Facilitating Scientific Experimentation . . . . . . . . . . . 97
8.2.2 Enabling Technology for Lab-on-the-Web . . . . . . . . . . 98
8.3 Further Work . . . . . . . . . . . . . . . . . . . . . . . . . . . . . 99
8.3.1 Formalising Morganic Grammars . . . . . . . . . . . . . . 99
8.3.2 Experimenting with Rewriting Approaches . . . . . . . . . 99
8.3.3 Supporting Hypothesis Formulation . . . . . . . . . . . . . 100
8.3.4 Extending Hypotheses for Further Experiments . . . . . . 100
8.3.5 Communicating for Coordinated Experimentation . . . . . 100
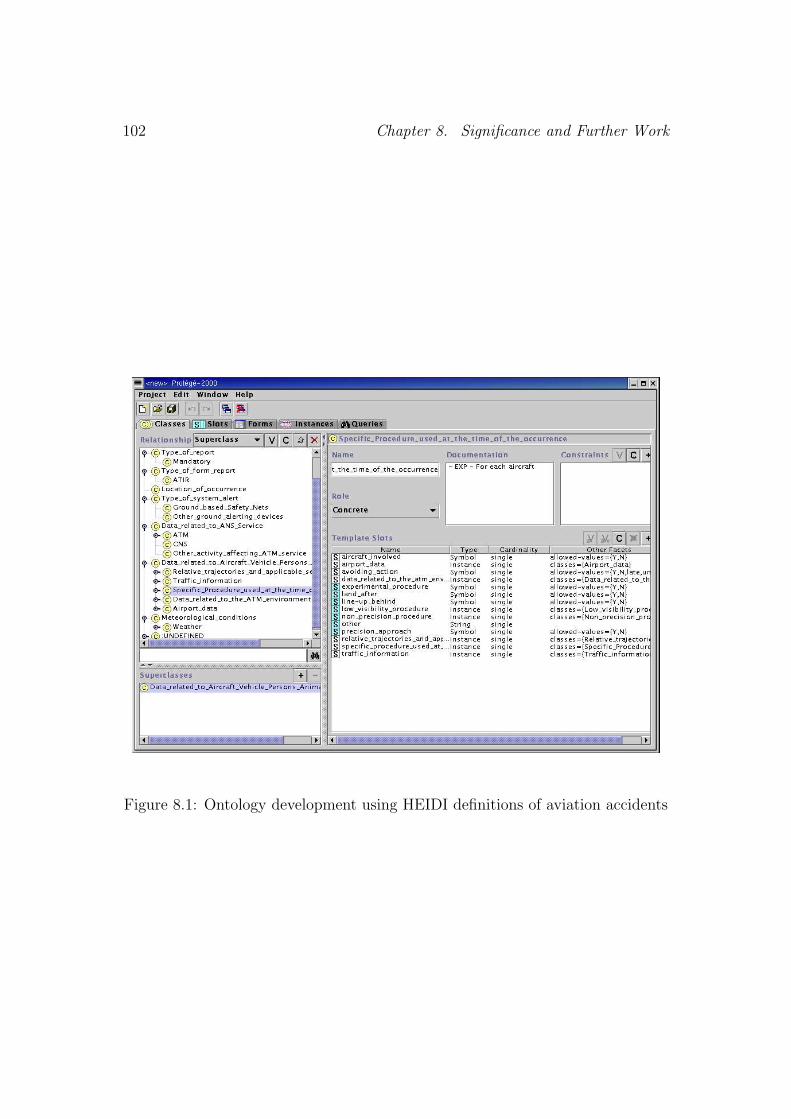
8.3.6 Developing Ontologies of Websites and Experiments . . . . 101
8.3.7 Sketching for High Fidelity Website Prototypes . . . . . . 101
8.4 Concluding Remarks . . . . . . . . . . . . . . . . . . . . . . . . . 103
x
Page 11
A Prolog Code for Rewriting 105
B Pre-Experiment Questionnaire 107
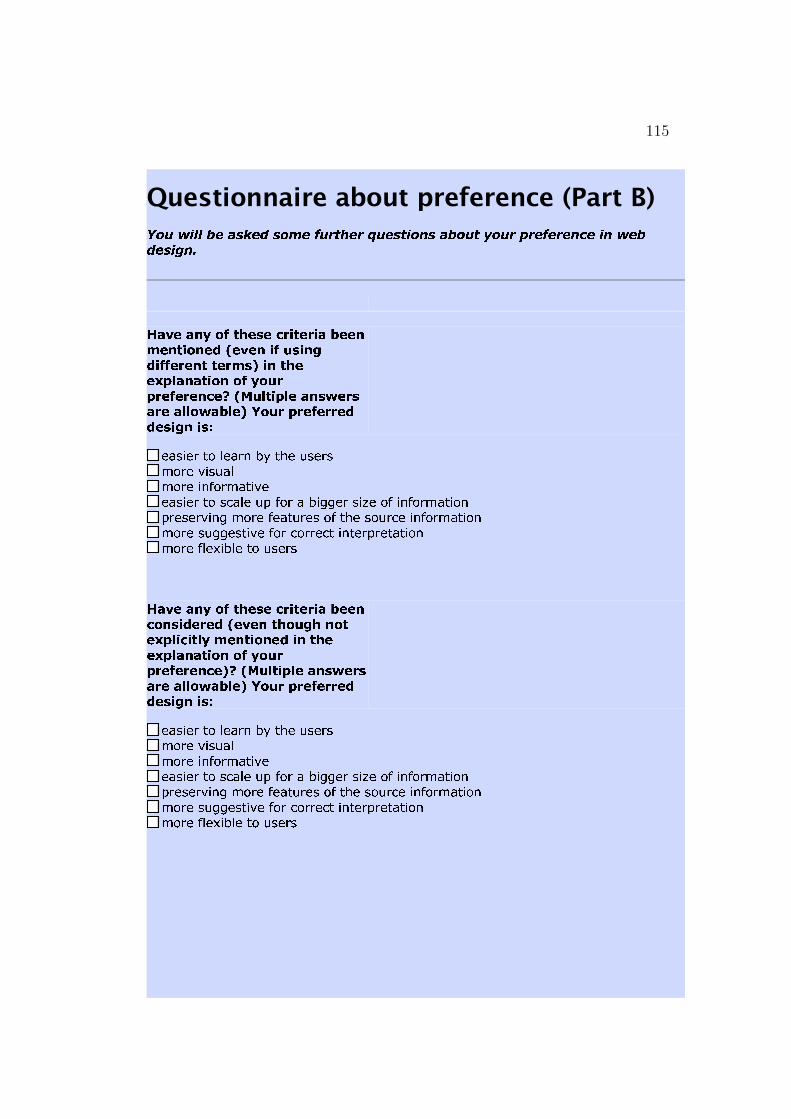
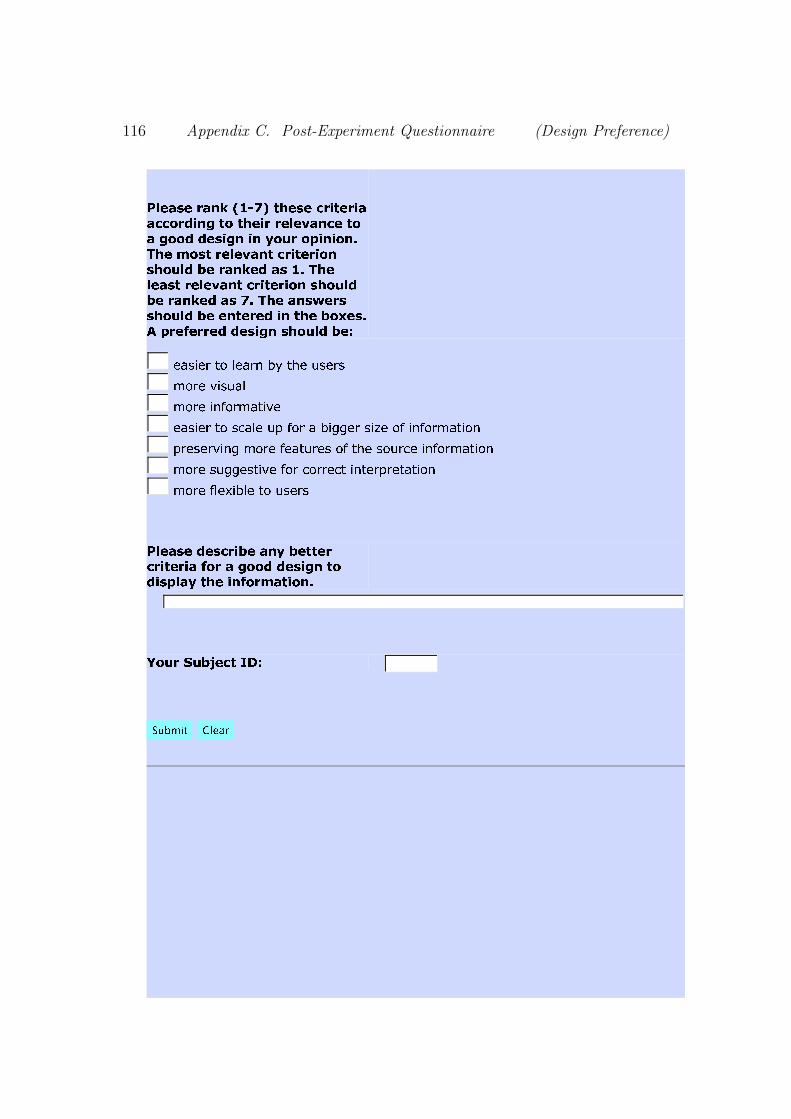
C Post-Experiment Questionnaire
(Design Preference) 113
Bibliography 117
xi
Page 13
Chapter 1
Introduction
Science tries to produce plausible representations of the world under investigation.
The plausibility of the representation is judged with respect to reality (by realists),
consensus (by relativists), and/or usefulness (by pragmatists). The investigation
is usually conducted under strict control according to reliable scientific practices.
Probably the most reliable scientific practice is experimentation, which places the
hypotheses (e.g., testable theories, knowledge, and beliefs) before the tribunal of
experience, i.e., controllable, sharable, and replicable observations. However,
even though science employs experimentation, technical solutions to issues such
as reproducibility, generalisability, reliability, and causality are not yet readily
available.
This thesis presents a new use of computational synthesis for scientific exper-
imentation, particularly synthesis from parameterisable experiment protocols, in
order to facilitate synthetic experiments which may help improve the generalis-
ability and thus reliability of science. It also presents two experiments synthesised
to test established theories of causal perception and to test the correlation be-
tween cognitive factors and design preference. Causal perception serves as a cog-
nitive basis for science. The causal perception experiment explored in this thesis
is a Web-based experiment making use of computational synthesis. The design
preference experiment reuses the Website synthesiser in the causal perception
experiment to generate preferred Websites on the fly.
This chapter gives an overview of this thesis; in particular the motivation for
using computational synthesis to facilitate cognitive science experiments.
1
Page 14
2 Chapter 1. Introduction
1.1 Problems in Scientific Experimentation
Science usually describes categories (universals) rather than individuals (partic-
ulars / specifics). While we can only study individuals (particulars / specifics),
generalisation from some individuals (particulars / specifics) to categories (univer-
sals) is necessary. Scientific experimentation produces reliable evidence for testing
hypotheses/theory and facilitating the generation of new hypotheses. However,
due to resource constraints, it is difficult to conduct experiments that can avoid
sampling errors. Without proper sampling, it is unreasonable to claim that the
sample represents the target population. The experiment findings are thus diffi-
cult to generalise. For the notorious problem of induction (as discussed by David
Hume1), experiments with limited samples can only falsify hypotheses (Popper,
1959) rather than confirm hypotheses. Particular setups and instruments based
on specific theories may not enable unbiased (theory-free) observations in testing
hypotheses. With its interventive nature, experimentation is supposed to be more
reliable than simple observations. However, the intervention of experiments can
only isolate confounding factors for better observation of covariation. It does not
guarantee causality findings, which are only subjectively perceived through causal
perception based on covariation. There may be uncontrollable factors affecting
the experiments; thus, experiment findings may need replication to ensure their
reliability. Some local experiment practices may be difficult to transfer to other
laboratories, especially those that require tacit knowledge (Sahdra and Thagard,
2003); thus, replication may not be easy. Even if the experiment findings were
reliable, they are subject to expert evaluation (e.g., peer reviews), coherence with
other evidence, and argumentation before acceptance by the scientific community.
Sometimes, the beliefs of the experts in addition to the experiment findings influ-
ence the acceptance of some hypotheses or theories. Personal preference, social
forces, and political influences may change the perception of the experiment find-
ings. Rhetoric often is useful in argumentation for or against greater acceptance
of particular theories. Thus theory-laden experiments can be considered as part
of the scientific argument to resolve disagreements and justify the reliability of
hypothesis testing. While a hypothesis/theory is only a tentative explanation,
the life spans of experiment findings as well as contextual experimental informa-
1http://www.etext.leeds.ac.uk/hume/ehu/ehupbsb.htm
Page 15
1.2. Computational Synthesis of Experiments 3
tion (such as experiment protocols) last longer because they should make sense
(be explainable somehow) in new theories. Experiments help develop and extend
the representational capacities of science (e.g., through novel or improved instru-
ments) but the high cost of scientific experimentation hinders full scale testing of
hypotheses/theories. Improvement in the effectiveness, efficiency, and economy
of experimentation thus helps improve scientific research.
A basic element in ensuring the reliability of experimental results is to do
further experiments in the same, similar, and coherently broader or deeper ways.
Extensive and systematic experimentation is desirable as it introduces more con-
straints and criteria in testing plausible theories (Haack, 1995, 2004). However,
experiments are expensive to design, prepare, and perform. Experiments are not
easy to set up for the first time and they are not easily reproducible for later
verification and modification. This thesis uses computational synthesis to facili-
tate experimentation. Particularly, the experiments presented in this thesis use
Web materials that are very difficult and tedious to prepare if we do not use
computational synthesis. This is an example for how technology helps improve
science.
1.2 Computational Synthesis of Experiments
Despite the fact that informatics has provided some solutions to support scientific
experimentation, particularly for laboratory management and instrument control,
little attention is paid to the synthesis of experiments. Laboratory information
management systems (LIMS), including laboratory workflow management sys-
tems, statistical experiment design systems, etc., provide scientists with the tools
to manage experiment data, operate specific instruments, and monitor progress.
Domain-specific programming or scripting languages are available for setting up
laboratory instruments. For example, an instrument scripting language may be
used to control a specific instrument. Web scripting languages control the Web
environment for Web-based experiments. It is desirable to have a single/unified
declarative knowledge representation for scientific experimentation, which would
enable computational synthesis of experiments based on various conceptual mod-
els such as purposes, processes, functions, structures, components, etc. Hence
Page 16
4 Chapter 1. Introduction
in this thesis we develop a grammar-like rule syntax for knowledge representa-
tion/specification, and to demonstrate that important parts of experiments can
be computationally synthesised.
1.2.1 Advantages of Experiment Synthesis
Computational synthesis of experiments provides two main advantages, higher
productivity and better reproducibility, compared to the manual synthesis of
experiments. These features tend to increase the quantity and quality of evidence
obtained from experimentation in science.
1.2.1.1 Higher Productivity
Computational synthesis expedites scientific experimentation by mechanisation
and reusable components, e.g., protocols. The more scientific experimentation
can be expedited, the more new and reliable pieces of evidence could be obtained
to facilitate the formulation and testing of scientific theories. Computational
synthesis can mechanise the synthesis process and gain higher efficiency. With
computational synthesis, scientists may reuse parts of other experiment setups to
simplify the task.
1.2.1.2 Better Reproducibility
To provide reliable evidence, experiments must be reproducible in material re-
alisation, experimental process, and results. Tedious and error-prone tasks in
material realisation and experimental process would make the experimental re-
sults less reproducible. As a technique for mechanisation, computational synthe-
sis is an attractive, though little understood, solution to preparing materials and
conducting experiments.
Reproducibility is crucial in scientific experimentation as it is the basis for
objectivity (non-biasedness), reliability, and generalisability of the findings from
experiments. We tend to believe that our findings are objective if they constantly
appear in reproducible experiments; thus, reproducibility of experiments is re-
garded as evidence for objectiveness. We tend to rule out the possibility that our
findings appear just by chance if they constantly appear in reproducible experi-
Page 17
1.2. Computational Synthesis of Experiments 5
ments; thus, reproducibility of experiments is regarded as evidence for reliability.
We tend to conclude that our findings are generalisable in a group/category if
they constantly appear in the same way in reproducible experiments on differ-
ent members of the group; thus, reproducibility of experiments is regarded as
evidence for generalisability.
1.2.2 Synthesis from Experiment Protocols
Experiment synthesis is a knowledge-intensive task. Computational synthesis of
experiments should acquire as much knowledge as is appropriate to make the
task effective and efficient. On many occasions scientists try to use a component-
based approach to synthesising experiments. Experiment protocols can be viewed
as forms of specification components that can be not only described declaratively
but also encoded in some materials and instruments. Materials for experiments
are prepared according to experiment protocols. Instruments for experiment pro-
tocols are prepared and operated according to experiment protocols. Materi-
als and instruments are often engineered into commercial products for use with
specific experiment protocols. Methods for experiments are then obviously the
experiment protocols of interest.
In our computational synthesis, an experiment protocol is basically a specifi-
cation for a single experiment or one of its components including objectives, spec-
imens (samples), materials, and methods, etc. This is analogous to a declarative
specification for a logic program or one of its components including functions,
inputs, constants and variables, constraints and axioms, etc. Also analogously to
structured refinement is design of declarative specifications, when a single exper-
iment protocol is composed of many smaller experiment protocols, the smaller
protocols may be substituted by alternative functionally equivalent protocols to
supply a similar contribution to the experiment.
1.2.3 Synthesis of Experiments
An hypothesis supported by this thesis is that in some significantly complex ex-
periments, it is natural to use logic programming in synthesising experiments be-
cause of the analogy between experiment protocols and declarative specifications
Page 18
6 Chapter 1. Introduction
of software components in logic programming. Modular experiment protocols
in the form of knowledge components can be used to construct experiments by
structural synthesis.
Knowledge representation is required for experiment synthesis. The knowl-
edge representation can specify processes, functions, structures, and components,
etc. in protocols. We developed a grammar rule syntax for declarative specifi-
cations of the protocols. These protocols are then used to generate generic ex-
periments (e.g., stimuli-response experiments), instruments (e.g., questionnaires,
Websites), and domain-specific information (e.g., aviation accident reports). Re-
finement of an experiment design is achieved when a knowledge component is
rewritten (mapped, reduced, bridged, or refined) to other knowledge components
using grammar rules. These grammar rules represent the design decisions of sci-
entists. If we have a complete set of grammar rules for the experimental domain,
rewriting terminates in a set of materials and setup of the target experiment.
1.3 Exploring Experiment Synthesis
Roughly speaking, there are several kinds of environment for conducting scien-
tific experiments, including those for conducting experiments on computer (in
silico), in laboratory apparatus (in vitro), and in the living organisms (in vivo).
Pure computational experiments are relatively easy to control and affordable to
reproduce. Clinical and psychology experiments on human subjects are difficult
to control and expensive to reproduce.
1.3.1 Pure Computational Experiments
Before and in parallel to this thesis, we did some purely computational experi-
ments in bioinformatics, particularly on DNA language parsing by using multiple
sets of knowledge acquired from scientists and machine learning (Leung, 1993).
In order to render this work significant for publication in the most prestigious
bioinformatics journal (Leung et al., 2001) it was necessary to systematise the
experiment setup that enabled us to conduct a series of new experiments. The
systematisation was done by using specialised gene grammars, which are basically
modular experimental setups and easily recombined hypotheses. The significance
Page 19
1.3. Exploring Experiment Synthesis 7
of this work was due to the discovery of new combinations of knowledge that
yielded surprising parsing results. It inspired similar designs for DNA microarray
experiments (Leung et al., 2004) These computational experiments motivated us
to synthesise more difficult experiments, i.e., cognitive science experiments, as
presented in this thesis.
1.3.2 Web-based Experiments in Cognitive Science
This thesis is about the synthesis of Web-based experiments, which use Websites
as the material and/or instruments for scientific experimentation involving human
subjects. Experiments with human subjects are difficult to reproduce especially
if compromises must be made in experiment setups, such as convenience sampling
rather than random sampling. This issue is common in psychology and cognitive
science experiments. We synthesised two new and non-trivial experiments (in-
cluding causal experiment and correlational experiment) in cognitive science by
using material on aviation accident reporting, in order to evaluate the feasibility
of experiment synthesis.
The aim of the first experiment was to demonstrate the inter-subject regular-
ity (if any) in causal perception and to test some of the current causal perception
theories using a simple psycho-geometrical scale. Causal perception was chosen
as an area of study due to its importance as a cognitive basis for science (Hilton,
2002). Causal perception is the ability to perceive and judge causality from co-
variation information. Experimental results from different laboratories have given
rise to alternative computational theories proposed by corresponding groups of
researchers. These causal perception theories have not been tested in third party
(impartial) laboratories like ours. Our experiment findings also have practical ap-
plication in improving causality information presentation for aviation accident re-
porting. As the aviation accident reports basically convey information about the
causes of aviation accidents, we have to know whether different ways of present-
ing information (so-called rhetorics) would lead the audience to having different
perceptions of the causes of aviation accidents.
The second experiment reused some of the experiment setups of the first
experiment. It aims to discover possible correlation (regularity) between design
preferences and specific cognitive factors, particularly visualisation ability and
Page 20
8 Chapter 1. Introduction
analogy-making ability. Better knowledge about this correlation might improve
the design of aviation accident reporting Websites for target users, who may be
diverse in their preferences and cognitive abilities.
Our broader aim is that these two synthesised experiments for improving avi-
ation accident reporting on the Web may be suggestive of broader use of experi-
ment synthesis in more general domains that require experimentation, including
human-computer interaction, software engineering, and cognitive science.
1.4 Scope of the Work
The main objective of this thesis is to develop a set of basic grammars represent-
ing experiment protocols for Web-based experiments; to synthesise non-trivial
experiments by using the grammars; and to conduct the synthesised experiments
in order to obtain scientific findings. The experiment protocols include the spec-
ification of experiment material and apparatus, i.e., Websites.
More specifically, the objectives of this work are listed as follows:
• To expedite scientific experimentation by computational synthesis;
• To develop the idea of grammars as a possible knowledge representation for
specifying experiment protocols;
• To synthesise Web-based experiments using these grammars;
• To conduct corresponding semi-synthetic cognitive science experiments; and
• To test established causal perception theories and correlation between de-
sign preferences and cognitive factors by these semi-synthetic experiments.
This thesis does not cover the (1) controversies in philosophy of science, includ-
ing causal attribution, (2) creative processes in scientific experimentation such as
hypothesis generation, (3) broad statistical issues such as statistical experiment
design and data analysis, (4) broader organisational issues such as workflows and
dataflows for laboratory management, and (5) technical issues specific only for
local research laboratory practices such as the choice of specific hardware.
Page 21
1.5. Computing Environment 9
1.5 Computing Environment
The present work was mainly done under the following computing environment:
• Computer languages: Prolog (SICStus-Prolog2 and CIAO-Prolog3), Perl4,
PHP5, Javascript6
• Operating system: RedHat / Fedora Linux7
• Web browsers: Mozilla and Firefox8
• Text: LaTeX9, OpenOffice10
• Ontology editor: Protege 200011
• Graphics: Graphviz12, GIMP13
• Statistics: R14
1.6 Organisation of this Thesis
This chapter outlined the main motivation and scope of the present study. The
following chapters will describe the background, specification, mechanism, and
scientific cases for scientific experimentation by computational synthesis.
1. Introduction
This is the present chapter, describing the motivation of the thesis in facil-
itating scientific experimentation by computational synthesis.
2http://www.sics.se/isl/sicstuswww/site/index.html3http://www.clip.dia.fi.upm.es/Software/Ciao4http://www.perl.com5http://www.php.net6http://www.ecma-international.org/publications/standards/Ecma-262.htm7http://fedoraproject.org8http://www.mozilla.org9http://www.latex-project.org
10http://www.openoffice.org11http://protege.stanford.edu12http://www.graphviz.org13http://www.gimp.org14http://www.r-project.org
Page 22
10 Chapter 1. Introduction
2. Scientific Experimentation
This chapter explains some problems of scientific experimentation and po-
tential for computational synthesis to expedite and facilitate experiment
setups.
3. Morganic Grammars
This chapter explains a knowledge representation developed for this thesis.
It integrates some basic features of frames, typed feature structures, for-
mal concept analysis and conditional rewrite rules in order to transfer the
structural knowledge across domains including scientific concepts, experi-
ment concepts, and Website concepts.
4. Website Synthesis
This chapter describes how Website synthesis is done according to a simple
Website model.
5. Experiment Synthesis
This chapter describes how computational synthesis is applicable to setting
up Web-based experiments.
6. Synthesised Experiment 1: Causal Perception
This chapter reports an experiment synthesised in advance computationally
to study causal perception, which is a cognitive basis of scientific investiga-
tion.
7. Synthesised Experiment 2: Preferences and Cognitive Factors
This chapter reports an experiment with Website prototypes synthesised
on-the-fly to correlate the design preference (individual preference) of the
subjects to their cognitive abilities.
8. Significance and Further Work
This chapter summarises the most important and significant findings in the
study of this thesis. It also suggests some possible further work to improve
the current work to facilitate scientific experimentation and development of
Lab-on-the-Web.
Page 23
Chapter 2
Scientific Experimentation
Scientific experimentation is actively controlled investigation, not passive obser-
vation. If possible, all factors affecting the results should ideally be under control
by the investigator so that the causal (or covariational) dependence of the results
on the particular factors can be shown and evaluated. By contrast, some factors
such as the allocation of subjects to treatments in a passive observational study
are not controlled by the investigator. Experimentation is probably the most
reliable method of doing science. Even though science can be compromised by
various flaws, experimentation is still the basic approach to acquiring evidence
for scientists to reason about. Experimentation is so important that a theory
in science may become obsolete but the reliable experiment from which it was
derived may stay to be interpreted by newer theories. The reliability of exper-
imentation is based on the reproducibility of experiments. Reproducibility can
be enhanced by protocol specifications, which opens a possibility for using com-
putational techniques to synthesise parts of experiment setups. This chapter will
briefly describe certain aspects of scientific experimentation as the domain back-
ground of this thesis, particularly the use of protocol specifications in improving
reproducibility of experiments and computational synthesis of experiments.
2.1 Anything Goes but Experimentation
As experimentation aims to study regular covariations, possibly causality, it is
being used not only in pure sciences. Experimentation has been increasingly
used in other fields of research, e.g., artificial intelligence (Gillies, 1996), exper-
11
Page 24
12 Chapter 2. Scientific Experimentation
imental software engineering (Basili et al., 1999; Shull et al., 2004; Do et al.,
2005), experimental mathematics (Borwein and Bailey, 2003), experimental eco-
nomics (Leonard and Fontaine, 2005), education research (Maxwell, 2004), social
experimentation (Campbell and Russo, 1999), and experimental marketing sci-
ence (Patzer, 1996). Hence, experimentation as a scientific method is crucial to
many fields of rigorous research.
A traditional experimentation approach (Coolican, 1990), as advocated by
Francis Bacon, is based on inductive reasoning about data and comprises the
following tasks:
• observation and data collection;
• hypothesis generation (or theory revision) to explain observation;
• experiments to test hypotheses;
• formulation of a theory;
• testing of this theory; and
• prediction by using the theory.
David Hume1 suggested a regularity view of causation comprising three crite-
ria for judging causality:
• Spatiotemporal Contiguity
The cause and the effect are adjacent in time and space.
• Temporal Priority
The cause happens before the effect.
• Necessary Connection
There must be a conjoint perception between cause and effect for grounding
causal inference, e.g., observing constant conjunction and covariation.
To improve causal induction from observation, John Stuart Mill2 proposed
specific methods of verification, namely the methods of (1) difference, (2) agree-
ment, (3) difference and agreement, (4) concomitant variation, and (5) residues.
1http://www.etext.leeds.ac.uk/hume/ehu/ehupbsb.htm2http://www.la.utexas.edu/research/poltheory/mill/sol
Page 25
2.1. Anything Goes but Experimentation 13
Suppose we have a list of factors (candidate causes) found in one case where an
effect occurs and not found in another case where no such effect occurs.
• Method of difference
If the only difference is the presence of a single factor in the cases where
the effect occurs, we can hypothesise that this factor would be the cause of
the effect.
• Method of agreement
If there is a single factor in all cases where the effect occurs, we can hy-
pothesise that this factor would be the cause of the effect.
• Method of difference and agreement
If methods of difference and agreement are applicable, then we can hypoth-
esise that this factor would be the cause of the effect.
• Method of concomitant variation
If we find a certain property of the effect covariates with a factor common
to the cases where the effect occurs, we can hypothesise that this factor
would be a cause of the effect.
• Method of residues
If all factors except a specific factor are believed to be the causes for all
the effects except one specific effect, then we can hypothesise that this
exceptional factor would be the cause of this exceptional effect.
Mill’s methods are applicable to causal attribution, the nature of which re-
mains to be ascertained, for experiments and observations (White, 2000). They
have inspired many cognitive models of causal induction (Hilton, 2002). Re-
cent cognitive models (Penn and Povinelli, 2007) are probabilistic forms of Mill’s
methods. These models are formulated using a contingency table (Figure 2.1), in
which there are four cells to show the conditional probability data of occurrence
(e+) and non-occurrence (e−) of event (effect) e under the presence (c+) and ab-
sence (c−) of a certain condition (cause) c. Like other scientific hypotheses, these
models are subject to experimental research. As yet, there is no consensus among
different laboratories about these models based on the same tabular formulation
Page 26
14 Chapter 2. Scientific Experimentation
e+ e−
c+ P(e+ | c+) P(e− | c+)
c− P(e+ | c−) P(e− | c−)
Figure 2.1: Causal perception from a contingency table
and no third party experimental results obtained by an independent laboratory.
Hence, we tested them in a synthetic experiment (Chapter 6).
Experimentation manipulates conditions (intervention) so that we can evalu-
ate the causal relationship between the c and e. Experimentation aims to ensure
that:
• (1) the change of c (or its value) is entirely due to the intervention, and
• (2) the intervention changes e (or its value), if at all, only through changing
c (or its value).
Condition (1) makes sure that the change of c does not have other causes
(other than the intervention). The condition (2) makes sure that the change
of e does not have the causes other than the change of c (and its possible ef-
fects) (Woodward, 2003).
Being human and humble (and criticised by David Hume), induction is no
longer thought to be absolutely reliable. From limited evidence, only experi-
mental falsification of hypotheses is possible and experimental confirmation is
impossible (Popper, 1959). Nevertheless, as science is often interested in study-
ing a general category of objects, not individual objects, we have to use inductive
inference to generate hypotheses and admit the not-yet-falsified hypotheses as
tentative theories, which may later be revised or overruled. To improve reliabil-
ity in inferring the target category of subjects (population), statistical sampling
techniques were introduced to improve the inductive approach. Randomisation
of treatment application to subjects was introduced to avoid bias in experiment
design.
Page 27
2.2. Reproducibility of Experiments 15
There are non-technological concerns about the reliability of scientific meth-
ods. Scientific research cannot escape from the distortion by social interac-
tions (Barnes et al., 1996) among scientists and other people in the society. Ex-
perimentation can be biased by research paradigms, research programmes, and
research traditions. Even though new theories appear and looks better, paradigm
shifts (Kuhn, 1962) would be difficult without crisis of the old paradigm to moti-
vate scientists to consider a radical change. A research programme supporting a
set of theories is interacting (or even fighting) with other research programmes.
When a single theory is defeated, the whole research programme will be desperate
to try to remedy, e.g., by replacing that single theory with a stronger one (Lakatos,
1977). Research traditions are even more resistant because research programmes
can be removed while the research traditions remain (Laudan, 1978). To an ex-
treme, one would even think that anything goes (Feyerabend, 1978) and there
seems no reliable scientific method. Experiments and their instruments are con-
structed according to theories; thus, the experiments are theory-laden and would
not be absolutely objective. These are negative views about science. We pos-
itively think that scientists need to understand the limits of current scientific
methods, but they have to use their best-so-far scientific method, i.e., experimen-
tation, as the last resort. Science still makes progress by rigorous experimenta-
tion.
2.2 Reproducibility of Experiments
Pragmatic and naturalistic research into scientific experimentation itself is being
revived by philosophical (Haack, 2004; Godfrey-Smith, 2003) and informatics ef-
forts (e.g., eScience). Despite all the previously mentioned theoretical difficulties,
we take the view that reproducibility of experiments is a basis (or manifesta-
tion) of credibility, reliability, objectivity (non-biasedness or inter-subjectivity)
and generalisability. As mentioned, even if a theory fails, its experimental evi-
dence remains there to support (or to be explained by) new theories. It is highly
desirable that experiments may be reproduced (with revisions if required) under
these new theories. Reproducibility could be demonstrated in repeated, related,
similar, or more remotely analogous domains by modified experiment setups. All
Page 28
16 Chapter 2. Scientific Experimentation
relevant or reproducible experiments provide evidence to solve the puzzles in sci-
ence, much like the clues or constraints for crossword puzzles (Haack, 1995, 2004).
However, experimentation is never easy. And a growing issue for technology is
the extent to which it can make experimentation easier and/or offer new insights
of experimental research. A cornerstone of any such effort is reproducibility. We
will elaborate a little about the importance of reproducibility of experiments and
describe later the use of experiment protocols to enable reproducibility.
2.2.1 Kinds of Reproducibility
There are three kinds of reproducibility in scientific experimentation (Radder,
2003):
• material reproducibility,
• process reproducibility, and
• result reproducibility (or replicability).
All three kinds of reproducibility indicate the reliability of the experiments.
Material reproducibility is about whether the materials and instruments for the
experiments can be reproduced. Process reproducibility is about whether the
procedures can be repeated properly. Result reproducibility is about whether the
same results can be obtained when the experiments have been properly done.
2.2.2 Reproducibility Indicates Reliability
Reproducible materials and processes are crucial to achieve result reproducibil-
ity. Reproducibility of experiments (results) has been regarded as a substitute
for some idealised features of scientific experimentation, including objectivity and
generalisability. We cannot guarantee that experiments reflect reality, regardless
of how convincing the experiments look. However, reproducibility of experiments
gives circumstantial evidence that reality (if any) is being repeatedly found by
experiments. Consistent repeated findings according to a theory may help sci-
entists to formulate or modify a theory (Fugelsang et al., 2004). Due to the
problem of induction, we are not sure whether we can generalise the experiment
Page 29
2.3. Reproducibility Through Protocols 17
results (with limited study cases) to represent the whole category (population).
Reproducibility of experiments, however, would increase our confidence that the
experiment results are generalisable to represent a category to which the studied
cases belong.
Scientists may need to repeat experiments under different contexts. Some may
just examine the experimental setups and procedures and they can ensure whether
the experiments are credible and reliable. They may repeat the experiments in a
slightly or very different context by using similar setups and procedures.
2.3 Reproducibility Through Protocols
Reproducibility needs experiment protocols. These are well-formed experiment
instructions (or recipes) as specifications for conducting experiments (Sahdra and
Thagard, 2003). They provide details for the scientists in the field to understand
and conduct (or reproduce) the experiments. Experiment protocols can exist in
the form of instructions and/or be encoded in instruments/apparatus, which can
be used by different scientists in different laboratories to (re)produce the results.
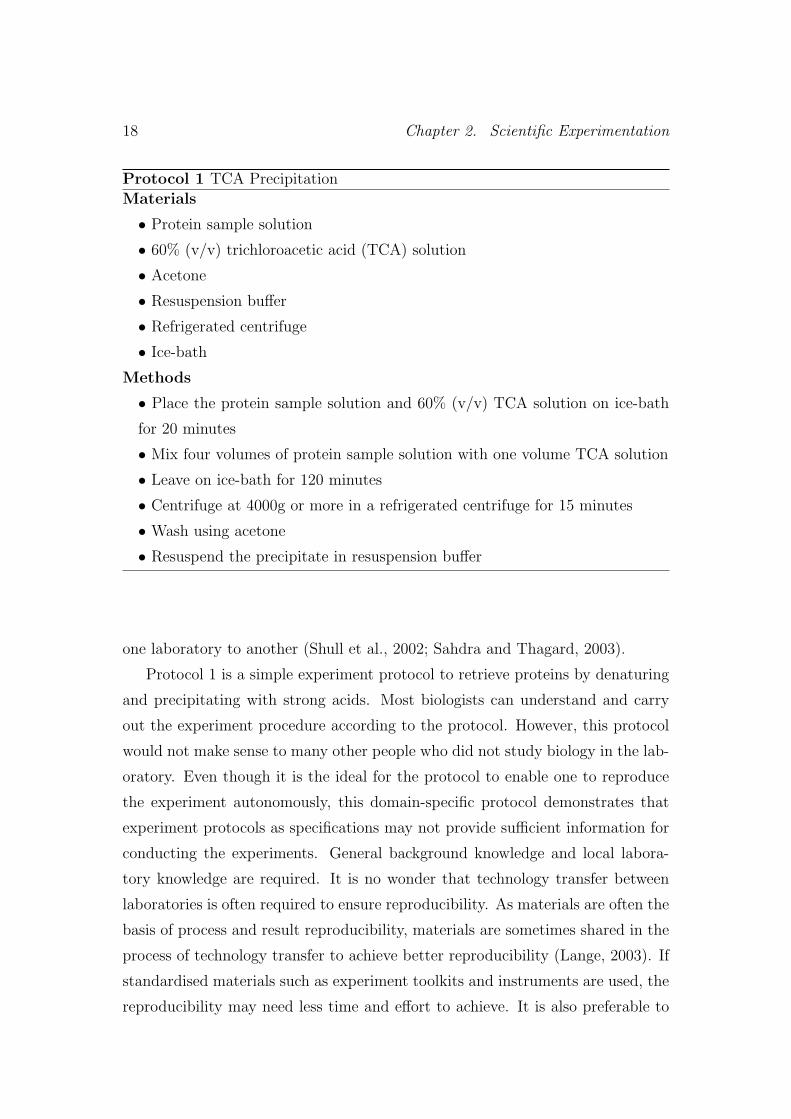
Protocol 1 shows a typical experiment protocol. In addition to its appearance
resembling computer program specifications with variables and procedures, we
describe some features of experiment protocols which would make computational
synthesis of experiments possible.
2.3.1 Protocols for Specifications
Conventional protocols are sharable experiment documentation, e.g., Current
Protocols3 and Cold Spring Harbor Protocols4. The documentation may be in
the form of laboratory manuals, sheets of procedures and technical notes. They
are the concise but adequate specification for how to carry out the experiments
using the required materials, instruments, treatments, data analysis, and/or even
result interpretation guidelines. They are used for standardisation of practices
and knowledge sharing. However, experiment protocols may not express adequate
knowledge for conducting the experiments and thus are difficult to transfer from
3http://www3.interscience.wiley.com/browse/?type=CURRENT PROTOCOL4http://www.cshprotocols.org
Page 30
18 Chapter 2. Scientific Experimentation
Protocol 1 TCA Precipitation
Materials
• Protein sample solution
• 60% (v/v) trichloroacetic acid (TCA) solution
• Acetone
• Resuspension buffer
• Refrigerated centrifuge
• Ice-bath
Methods
• Place the protein sample solution and 60% (v/v) TCA solution on ice-bath
for 20 minutes
• Mix four volumes of protein sample solution with one volume TCA solution
• Leave on ice-bath for 120 minutes
• Centrifuge at 4000g or more in a refrigerated centrifuge for 15 minutes
• Wash using acetone
• Resuspend the precipitate in resuspension buffer
one laboratory to another (Shull et al., 2002; Sahdra and Thagard, 2003).
Protocol 1 is a simple experiment protocol to retrieve proteins by denaturing
and precipitating with strong acids. Most biologists can understand and carry
out the experiment procedure according to the protocol. However, this protocol
would not make sense to many other people who did not study biology in the lab-
oratory. Even though it is the ideal for the protocol to enable one to reproduce
the experiment autonomously, this domain-specific protocol demonstrates that
experiment protocols as specifications may not provide sufficient information for
conducting the experiments. General background knowledge and local labora-
tory knowledge are required. It is no wonder that technology transfer between
laboratories is often required to ensure reproducibility. As materials are often the
basis of process and result reproducibility, materials are sometimes shared in the
process of technology transfer to achieve better reproducibility (Lange, 2003). If
standardised materials such as experiment toolkits and instruments are used, the
reproducibility may need less time and effort to achieve. It is also preferable to
Page 31
2.4. Experiment Synthesis Through Protocols 19
develop parameterisable experiment protocols to enable computational synthesis
and to minimise human intervention and human influence.
2.3.2 Protocols for Material Reproducibility
Experiment protocols can be encoded in some reusable materials or instruments
(e.g., showcards, data collection forms, and software) for material realisation of
the experiments. For instance, there is a cognitive factors testing toolkit includ-
ing instructions, showcards, and data collection forms (French et al., 1963). We
used this toolkit in our experiment on design preference (Chapter 7). New exper-
iments can be easier to plan using reusable protocols. In addition to the reusable
paper-based toolkit, we also reused the Website synthesiser, which was used as
an instrument in our causal perception experiment (Chapter 6), to generate syn-
thetic Web material for a Web-based experiment. In recent years, the Web is
also used to conduct simple canned experiments, e.g., the teaching laboratory
packages for cognitive science (Mizuno, 2004). These are supposed to run teach-
ing experiments repeatedly without modification. It is desirable to automate the
preparation of experiments. However, few methods exist for automated and flex-
ible generation of Web-based experiments, let alone the computational synthesis
using parameterisable experiment protocols based on knowledge representation
formalisms.
2.4 Experiment Synthesis Through Protocols
To plan an experiment, we need to determine the study variables of our hypothe-
ses, target population and samples (subjects or experimental units), treatments,
statistical experiment design, measurements, data analysis, and reporting. Each
of these could be specified in experiment protocols for proper conduct, reduction
of biases/errors, and higher reproducibility (Ioannidis, 2005). A simplified model
of experimentation is described as follows. We formulate our hypotheses based
on research questions. We determine the study variables in our hypotheses, e.g.,
independent variables (causes), dependent variables (effects). We formulate vari-
ous kinds of treatments based on the study variables. The materials, instruments,
and methods for the treatments should be specified. To avoid bias and errors,
Page 32
20 Chapter 2. Scientific Experimentation
we determine our target population and statistical sampling method to select ex-
periment units. We also carry out [statistical] experiment design. Suppose there
are n given experimental units, and v treatments. One treatment is applied to
each experimental unit as specified by the scientists, and then one response Y is
measured on each unit. The data collected from measurements will be subject
to analysis and reporting. If all these experiment elements can be specified in
protocols, experiment planning would be much easier.
2.5 Towards Lab-on-the-Web
To reduce human errors and increase reproducibility of experiment process, highly
automated instruments are desirable. For example, Lab-on-a-Chip5 incorporates
all reagents and processes to conduct experiments. Experimenters need only to
input the experiment parameters (conditions) and apply the samples to the chip.
The chip is processed by a computerised instrument to carry out all required ex-
perimental steps. The results can then be read or printed from the instruments for
further use. It is easy to make an analogy between Lab-on-a-Chip and the Web.
We are hoping to develop some Web-based instruments to conduct experiments
by the Web, i.e., Lab-on-the-Web.
As Web-based experiments are usually done by subjects rather than experi-
menters, the materials provided to the subjects are basically the Websites, which
constitute a major portion of the experiment. For Web-based experiments, com-
putational synthesis mainly synthesises the Websites as the experiment materials
in a way suitable for experimental purposes. As material reproducibility supports
other kinds of reproducibility, the material synthesis of Web-based experiment
should improve their reproducibility. Computational synthesis would have the
following advantages for supporting a future Lab-on-the-Web:
• It synthesises the experiment materials, including instruments;
• It incorporates process into instruments, which will become material; and
• It expedites and facilitates systematic experiments.
5http://www.rsc.org/Publishing/Journals/lc
Page 33
2.6. Chapter Summary 21
From another point of view, most of the materials need to be synthesised
for Lab-on-the-Web. It is difficult to find a single tool to synthesise so many
different materials. We therefore need a wide-spectrum language for knowledge
representation in experiment synthesis. The next chapter will describe our lan-
guage developed for representing this form of diverse knowledge.
2.6 Chapter Summary
Normally the major criticisms of sciences are on the scientific theories rather than
experimentation, which remains the most reliable methodology to produce sci-
entific evidence. New theories should explain old evidence. Experimentation is
methodical and often specified in experiment protocols for communication among
scientists. Hence, reproducibility of experiments can be improved through re-use
of rigorous protocols. For reusability, experiment protocols must be made mod-
ular. This view of experiment protocols leads to our research into experiment
synthesis. The rigour needed to make synthesis possible (even partially in an
automated way) also makes reproducibility possible with minimal human inter-
vention.
Page 35
Chapter 3
Morganic Grammars
Scientific experimentation tests hypotheses in science by using more definite/re-
liable knowledge. This kind of knowledge needs language for its representation.
For computational synthesis of experiments, natural language is still difficult for
computers to process. On the other hand, computational logics are still difficult
for most scientists to grasp. Our ideal knowledge representation is scientifically
significant, technically simple, and practically useful to users, including knowledge
engineers and end users. Scientific significance of knowledge representation helps
mirror the target knowledge. Technical simplicity of knowledge representation en-
ables the users to focus on the knowledge rather than the technical representation.
Practical utility of knowledge representation fulfils the design goals. This chap-
ter describes our knowledge representation, called morganic grammars, aiming
to provide these advantages. Our use of morganic grammars for computational
synthesis is described in later chapters.
3.1 Cognitive Schemas and Grammars
Concepts are structural units of knowledge (Jin, 1983). Their patterns/constructs
for various cognitive activities are called schemas. The term schemas was used
by Aristotle to describe valid syllogism patterns. It was also used to describe the
rules that can accommodate all possible aspects of a concept (Kant, 1787). It
was introduced around 1932 by Frederic Bartlett to experimental psychology to
describe the units of internal knowledge representation of a domain of interaction
between internal and external worlds (Bartlett, 1995). Since then, in cognitive
23
Page 36
24 Chapter 3. Morganic Grammars
psychology, schemas have been thought to be generalised representations of over-
all total situations (Neisser, 1976) as well as informative representations to enable
an agent to act in a coordinated manner over a whole range of analogous situa-
tions (Piaget, 1971). In later cognitive science and artificial intelligence studies,
schemas are treated as a set of inference operations for thinking (Holyoak and
Spellman, 1993), information processing (Hunt, 1989), deductive inference (Fal-
magne and Gonsalves, 1995), pragmatic reasoning (Cheng and Holyoak, 1985)
using causal and regulation schemas (Holyoak and Spellman, 1993), as well as
interpretative patterns of existing knowledge for acquiring new knowledge (Gal-
lagher, 2004). Despite the fact that schemas are commonplace in cognitive psy-
chology experiments, there is no generally agreed computational representation
of schemas. In some cases, they are expressed as production rules (Cheng and
Holyoak, 1985). In other cases, they are treated as a version of predicate cal-
culus (McDermott, 1987) that is simply equivalent to the early work of Marvin
Minsky on frames (Minsky, 1975). So far, they are still regarded as a more flexible
alternative to mental models and mental logics in explaining about human rea-
soning (Holyoak and Morrison, 2005). Specific reasoning schemas include causal
schemas (e.g., prediction, diagnosis, and explanation), regulation schemas (e.g.,
permission, obligation), spatial schemas (e.g., geometry, graph). It is believed
that schemas can be translated from the corresponding natural language repre-
sentation and can be translated into their corresponding logics, e.g., obligation
schemas being translated into denotic logic (Falmagne and Gonsalves, 1995). Our
preference for using schemas over natural language and logics are due to the fact
that schemas are effective ways of representing standard forms of human reason-
ing but less complicated than natural languages (Jurafsky and Martin, 2003) for
computation and less cryptic than more deeply mathematical languages such as
modal logics (Blackburn et al., 2006) to non-logicians.
In searching for the fundamental representation of schemas for computation,
theoretical and practical reasons motivated us to use grammars in representing
schemas. Particularly, we found rewrite rules representing grammars quite suit-
able. A rewrite rule as follows:
ϕ→ ψ
Page 37
3.2. Integrating Knowledge Representations 25
indicates that whenever we encounter the element ϕ, which is to the left of the
arrow →, we can replace it by the element ψ.
Grammars are a schema-like abstraction of language patterns, which can be
coarse-grained to represent overall situations or fine-grained to represent detailed
mechanisms. Some linguists and cognitive scientists believe that some grammars,
i.e., universal grammars, are sharable by all languages (Chomsky, 1980; Smith,
1999) and the language faculty might be [partially] in common with other cog-
nitive abilities (Boeckx, 2006). We do not know whether there are universal
reasoning schemas but grammar rules should be easier to understand than modal
logics. Considering the knowledge we want to represent, the syntax of grammars
is preferable to that of modal logics. We use it in computational synthesis of
Websites (Chapter 4) and experiments (Chapter 5).
3.2 Integrating Knowledge Representations
Besides grammar rule syntax, we will also need some other features to represent
the properties or parameters of the concepts of interest. For example, we need to
represent concepts and their properties, to organise and reason about the concepts
according to their hierarchical relations. Thus, frames, typed feature structures,
frame-based ontology languages, formal concepts (in formal concept analysis) are
relevant to the syntax development of the grammars we need.
3.2.1 Frames
A frame is a data structure as a network of nodes and relations for representing a
stereotyped situation (Minsky, 1975; Sowa, 2000; Brachman and Levesque, 2003).
It was inspired by Bartlett’s idea of schemas (Minsky, 1975). Schematically in
LISP-like syntax, a frame looks like this:
(frame-name
<slot-name1 filler1>
<slot-name2 filler2>
...
)
Page 38
26 Chapter 3. Morganic Grammars
The frame and slot names are atomic symbols; the fillers can be atomic values
(e.g., numbers or text strings) or the names of other frames. There are two types
of frames, individual frames describe instances of generic frames which include
information about a concept hierarchy. Their specific difference in notations, e.g.,
INSTANCE-OF slot for individual frames and IS-A slots for generic frames, can
be found in various AI texts (Brachman and Levesque, 2003). Reasoning about
the relations among frames normally is done with the slots INSTANCE-OF and
IS-A and their filler values.
3.2.2 Typed Feature Structures
Typed feature structures (TFS) use attribute-value matrices (AVM) to specify
features of linguistic categories for possible conceptual inheritance reasoning using
a type hierarchy (Carpenter, 1992). The type hierarchy is basically a finite partial
order 〈Type,v〉. The following is an example of the AVM syntax of typed feature
structures.
sentence
SUBJECT : noun
AGREEMENT : syn[PERSON : X
NUMBER : Y
]
PREDICATE : verb
AGREEMENT : syn[PERSON : X
NUMBER : Y
]
In this notation, each bracketed entry represents a node and the type of node
is indicated at the top of the node. The slots are the features and their values
are written next to them. As indicated in this example, the values of the features
PERSON and NUMBER should have same corresponding values (X and Y) for
agreement. As AVMs can be nested, typed feature structures can be used to
implement grammars for natural language processing (Copestake, 2002).
Page 39
3.3. Morganic Grammars 27
Frames TFS FCA
Object Frame Type Object
Properties Slot Feature Attribute
Values Filler Value Value
Form List AVM Cross-table
Figure 3.1: Comparison of Frames, TFS, and FCA
3.2.3 Formal Concept Analysis
Formal concept analysis (FCA) is a mathematical formalism which formulates
concepts as “objects and attributes” (Ganter and Willie, 1999), similar to a frame
system’s “frames and slots” and typed feature structures’ “types and features”.
The objects and attributes are usually represented by cross-tables. Their charac-
teristics can be compared with those of frames and TFS (Figure 3.1).
FCA also has concept lattices to serve roles similar to a type/frame hierarchy
in other formalisms. Algorithms were developed for generating the FCA lattice.
Figure 3.2 shows an example of a concept lattice generated from a cross-table of
objects and attributes. The attributes of a specific object can be computed by
collecting all attributes located along ascending line paths from the object. The
objects having a particular attribute can be computed by collecting all objects
reachable through descending line paths from the attribute. We would like to
incorporate this simple representation into our grammars so that we can do some
concept data analysis (Carpineto and Romano, 2004) when necessary.
3.3 Morganic Grammars
There are different types of grammar rules to provide sufficient flexibility as
knowledge representation requires (Chomsky, 1980). Grammars can be used to
represent the knowledge other than natural languages. For example, nucleic acids
such as DNA (Leung et al., 2001) can be represented by grammars. Grammars
can be easily maintained as they are modularly and incrementally developed. In
Page 40
28 Chapter 3. Morganic Grammars
OptionsLocation
Direction
Menu
BreadcrumbWizard
Navigation Tools Location Direction Options
Menu ×Breadcrumb × ×Wizard × ×
Figure 3.2: Concept lattice and cross-table.
Page 41
3.3. Morganic Grammars 29
addition, we would like to keep our grammars as simple as possible. Even if
the domain experts do not like to deal with technical details in representations,
they can still learn simple grammar quickly. Domain experts can then work with
knowledge engineers and professional programmers to refine the coarse-grained
simple grammars into the required syntax. Grammars allow us to adopt read-
ily available parameterised knowledge components after specifying those external
components using grammatical categories.
3.3.1 Morgans are Grammatical Categories
In morganic grammars, each morgan is composed of one or more atomic and/or
composite morgans. Thus, a morgan can be as simple as an atom or a huge
compositional object. The term morgan (or m-organ) is after the notions of
modules and organs, especially mental organs (Chomsky, 1980). The prefix m-
denotes morphism or mutation. The root name organ is also known in classics,
e.g., Organon by Aristotle and Novum Organum by Francis Bacon.
A morgan has attributes representing its properties. Such attributes are useful
to specify some parameters of the morgan. Among morgans, there are carriers.
Carriers are responsible for relating or connecting morgans by reductive or trans-
ductive morphisms. Thus, carriers may be thought to be conceptual glue (glia),
e.g., channels, axioms, conditions, constraints, evidence, preference, explanation,
justification, transporters, catalysts, depending upon specific requirements for
conception. Morphisms among morgans are specified by grammar rewrite rules.
Morganic grammars specify how morgans were put together by carriers and
form our representation for conceptual schemas. In our practical applications,
this knowledge representation facilitates the synthesis of Websites and materials
for scientific experimentation.
3.3.2 Definition of Morganic Grammars
The grammars can be described formally. A grammar Γ is denoted by a tuple
〈A,M ,R, S 〉 which consists of a finite set of atomic morgans A, a finite set of
composite morgans M , a finite set of grammar rules R, and a finite set of starting
morgans S as the objects of computational synthesis such that A ∩M = φ and
Page 42
30 Chapter 3. Morganic Grammars
S ⊂ M . A grammar rule r ∈ R is a relation in (A ∪M )∗ of the form
mC−→ m ′
where + means one or more, ∗ means zero or more, m ∈ (A∪M )+, m ′ ∈ (A∪M )∗,
and C is a set of optional carriers under which the grammar rule is applicable. m,
m ′, and C can contain optional attributes and values. At least one grammar rule
has s as the LHS. The language of a grammar L(Γ) is composed of all morgans
that may be derived from an s .
3.3.3 Attribute Structures of Morgans
Attributes (or features) can be introduced into morgans. The morganic attributes
can be specified as the ordinary arguments or parameters, e.g.,
m(v1, v2, ..., vn)
where v1, v2, ..., vn are the values of the attributes assigned to specific positions of
the parameters of the morgan m. We found this kind of simple attribute structure
useful in our applications. However, this way of encoding can be inconvenient
for complicated cases in which only a small subset of numerous attributes are
required and/or the attribute structure is hierarchical. In such cases, one may
prefer using attribute value matrices, i.e., bracketed pairs of attributes and values.
An attribute value matrix of a morgan is shown as follows:
webelement
attr1 : x[y1 : z1
y2 : z2
]
attr2 : val2
...
attrn : valn
This attribute value matrix describes a Web element (webelement). The symbol :
is placed in between each attribute name (e.g., attr2) and its corresponding value
(e.g., val2). The attribute attr1 have sub-attributes which are provided in an
attribute value matrix.
Page 43
3.3. Morganic Grammars 31
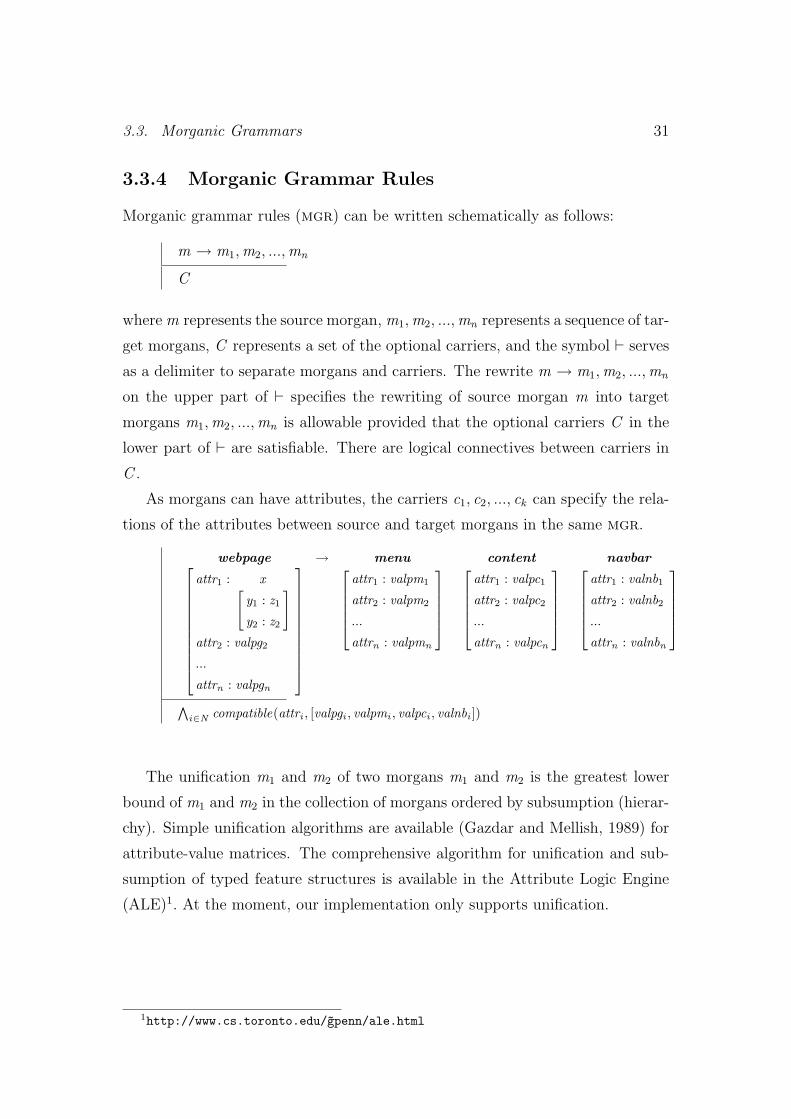
3.3.4 Morganic Grammar Rules
Morganic grammar rules (mgr) can be written schematically as follows:
m → m1,m2, ...,mn
C
where m represents the source morgan, m1,m2, ...,mn represents a sequence of tar-
get morgans, C represents a set of the optional carriers, and the symbol ` serves
as a delimiter to separate morgans and carriers. The rewrite m → m1,m2, ...,mn
on the upper part of ` specifies the rewriting of source morgan m into target
morgans m1,m2, ...,mn is allowable provided that the optional carriers C in the
lower part of ` are satisfiable. There are logical connectives between carriers in
C .
As morgans can have attributes, the carriers c1, c2, ..., ck can specify the rela-
tions of the attributes between source and target morgans in the same mgr.
webpage
attr1 : x[y1 : z1y2 : z2
]
attr2 : valpg2
...
attrn : valpgn
→ menu
attr1 : valpm1
attr2 : valpm2
...
attrn : valpmn
content
attr1 : valpc1
attr2 : valpc2
...
attrn : valpcn
navbar
attr1 : valnb1
attr2 : valnb2
...
attrn : valnbn
∧i∈N compatible(attri , [valpgi , valpmi , valpci , valnbi ])
The unification m1 and m2 of two morgans m1 and m2 is the greatest lower
bound of m1 and m2 in the collection of morgans ordered by subsumption (hierar-
chy). Simple unification algorithms are available (Gazdar and Mellish, 1989) for
attribute-value matrices. The comprehensive algorithm for unification and sub-
sumption of typed feature structures is available in the Attribute Logic Engine
(ALE)1. At the moment, our implementation only supports unification.
1http://www.cs.toronto.edu/~gpenn/ale.html
Page 44
32 Chapter 3. Morganic Grammars
3.3.5 Prolog Syntax of Morganic Grammar Rules
Our software tools for handling morganic grammars were implemented in Prolog.
We can specify a single grammar rule as follows:
% a simple morganic grammar rule
morgan0(X) ---> morgan1(Y), morgan2(Z) :-
carrier1(X,Y),
carrier2(X,Z).
left-hand-side (LHS) category, an arrow symbol (i.e., --->) , one or more right-
hand-side (RHS) categories, and optionally a set of carriers preceded by an :-
symbol. The arrow symbol represents a possible rewriting from the LHS category
morgan0 to the RHS categories morgan1 and morgan2, provided that the carriers
carrier1 and carrier2 are available and satisfiable. The :- operator separates
rewrite part and the carrier part. Each grammar rule completes with a full stop
(i.e., ‘.’).
3.4 Chapter Summary
This chapter proposes morganic grammars, which aim to integrate some features
from other knowledge representation formalisms, as a wide-spectrum language
for computational synthesis of Websites and experiments. Morganic grammars
have morgans, rewrites, and carriers. Morgans incorporate features from frames,
typed feature structures, and formal concepts in formal concept analysis. The
rewrites are under the conditions that carriers are available and satisfiable.
Page 45
Chapter 4
Website Synthesis
Synthesis puts things together to form a new thing for some purpose. For the Lab-
on-the-Web, we need to put experimental materials (and instruments) together
on the Web for scientific experimentation. As long as the target Websites can
be specified, computational synthesis can help generate the target Websites in an
automated manner, and make them modifiable and reusable.
Computational synthesis of Websites has been around for a decade for Web-
site construction and maintenance. As early as 1996, formally specified informa-
tion was being automatically transformed into Websites (Robertson and Agusti,
1999). This type of synthesis uses a specific language and transformation rules
to construct non-trivial Websites. The transformation techniques are basically
the same as those used in program synthesis, in particular structural synthesis,
in which reusable design components are parameterised, configured, and refined
to bridge the gap between problem description and final specification (Cavalcanti
and Robertson, 2000, 2003).
For scientific experimentation, we found we need a more wide-spectrum lan-
guage and knowledge representation so that the high-level specifications of Web-
sites and experiments can be written in the same rule syntax. We incorporate
a grammar-based knowledge representation (i.e., morganic grammars) explicat-
ing a Website design model (our simple Website interface model: SWiM), and
conditional rewriting to conduct Website synthesis. We aim to simplify Website
synthesis so that ordinary Website designers and programmers would find it more
accessible. This chapter describes a possible implementation of Website synthesis
suitable for later scientific experimentation.
33
Page 46
34 Chapter 4. Website Synthesis
4.1 Computational Synthesis of Websites
Computational Website synthesis has been developing to facilitates the construc-
tion and maintenance of Websites and their components. It helps Web developers
and customers cope with technical problems (Leung and Robertson, 2003) such
as:
• Short life cycles from continual re-design;
• Diversified customer preferences;
• Frequent content updates; and
• Reliability assurance.
Theoretical and applied research into software engineering has used program
synthesis (Lowry and Duran, 1989; Czarnecki and Eisenecker, 2000) to generate
customised and optimised intermediates or end-products of software components.
The basic idea of synthesis is to incrementally refine a high-level specification until
an implementation is derived. If a significant level of automation can be achieved,
its advantages are numerous, such as the increase in productivity, cost reduction,
guaranteed consistency, and compliance of standards. We do not elaborate on
these advantages in this thesis. Successful applications of program synthesis in
specific domains are synthesis for ecological models (Robertson et al., 1991) and
astrophysics models (Lowry and Van Baalen, 1997). The limitations of program
synthesis for general use are mainly due to the fact that the existing technologies
are insufficient and/or the acquired domain knowledge is inadequate. To gain
an improvement, we still need to develop better techniques and acquire useful
domains / task-specific knowledge.
From our point of view, Website synthesis would be useful to the Lab-on-the-
Web for at least two reasons:
• the Websites for a single Web-based experiment are often constructed in a
regular and standard way to enhance experimental controls; and
• the Websites for an experiment do not usually require a full set of complex
interactive features but simple regular structures for experimental manipu-
lation.
Page 47
4.2. Website Design Model 35
Therefore, at this stage of development, we ignore the Websites which do not
follow predictable patterns. Such Websites would require custom programming
and they can be as complicated as the most sophisticated programs. We focus on
those Websites in which design decisions are consistently justifiable by explicit
knowledge, i.e., rational Web design. When there are conceptual gaps between
knowledge representations, e.g., between information content and Web design
components, we need grammar rules for mapping to bridge those gaps. Such
grammar rules represent Web design decisions or principles.
There is a search space of rewrites from an initial domain-specific ontology
leading to a detailed Website content description. In simple cases, where there
is exactly one route through this space, we have a fully automatic synthesis pro-
cedure. If there are multiple routes leading to different results, interactions with
human or automated reasoners at choice points or additional problem-specific
constraints are necessary. The final step transforms the final Web content de-
scription into a Website.
4.2 Website Design Model
Website design is highly dependent upon the creativity of individual Website
designers. A popular model for Website design was developed by Jesse James
Garrett (Garrett, 2003), seeing Website design to have five conceptual planes
(layers):
• Surface Plane, specifying the visual design, particularly visualisation (sur-
face realisation) into images and text that we can browse and click on;
• Skeleton Plane, specifying the information design (the interface from the
software aspect including the interface elements to enable interaction with
users), and navigation design (the navigation elements to enable users to
move in the information architecture);
• Structure Plane, specifying the required interaction from the software
aspect and information architecture from the information aspect;
• Scope Plane, specifying functions (feature sets) from the software aspect
and content (information units) from the information aspect; and
Page 48
36 Chapter 4. Website Synthesis
• Strategy Plane, specifying the strategies to arrange the functions and
facilities to meet user needs.
The surface plane is the most concrete one while the strategy plane is the most
abstract one in this model. Each plane depends upon the more concrete planes.
Design decisions for each plane must be aligned well with those above and below.
Plane by plane, the design decisions may become more refined. Although our work
was developed before the publication of this Web design model, this model suits
our ideas of Website synthesis, which requires mapping among different domains
(e.g., planes or layers) by using grammar rewrite rules. The development of these
planes can be made interdependent or moderately independent of one another.
4.3 Simple Website Interface Model
Simple Website Interface Model (SWiM) is our specific model for Website synthe-
sis, rather than a general Website design model. Both SWiM and the Garrett’s
model were developed independently without knowledge of each other’s devel-
opment; thus, any similarity between both models should be due to commonly
observed Website design practices. SWiM divides Website synthesis into two ma-
jor parts, information synthesis and presentation synthesis. SWiM for Website
synthesis is roughly equivalent to the structure, skeleton, and surface planes of
Garrett’s Website design model. Information synthesis is mainly tackling the
issues on structure plane. Presentational synthesis is dealing with the problems
on skeleton and surface planes. Garrett’s model and SWiM share common pat-
terns of tasks in Website design process. However, Garrett’s model is supposed
to cover all design activities while SWiM is a set of minimal concepts to facilitate
the technical construction of Websites by computational synthesis.
The basic approach to synthesis taken in this thesis is to anchor Website syn-
thesis in declarative specifications, preferably in morganic grammars, and sup-
ported by various Website components. At the stage of information synthesis,
source information in a tree structure is transformed into the content information
tree which is suitable for presentation on the target Website. Presentation syn-
thesis comprises navigation synthesis and visualisation synthesis. At the stage
of navigation synthesis, the structural features of the content information were
Page 49
4.3. Simple Website Interface Model 37
identified and extracted to serve as a navigation information tree. In the visu-
alisation synthesis, content information tree and navigation information tree are
visualised by using available Website components. We briefly describe the pro-
cesses of information synthesis, navigation synthesis, and visualisation synthesis
in this section and give some examples in later sections.
4.3.1 Structure Refinement
The Website synthesis according to SWiM begins with a given set of information
units which is in a tree (or linear) structure. Information units serve as the nodes
of the tree. Their hierarchical relationships are represented by links between
nodes in the tree. The tree structure provides a clear and definite structural
relationship among information units. In addition, it is likely to have weaker
relevance among information units that could not be represented in a single tree
structure. This weaker relevance can be recorded as pointers for realisation of
visualisation as hyperlinks.
In many cases, the information tree would require some trimming and splicing
for structure refinement. The refinement is to rearrange the information units
into a [different] tree structure so that users may find the information easier to
access. A simple heuristic for refinement is to put a reasonable amount of related
information in a branch (partition) of the tree. More detailed information can
be given in its sub-branches. The information trees for our example Websites are
small; thus, no special structural refinement is needed except minor refinement
to remove unimportant information units and to group singleton units with other
information units.
4.3.2 Navigation Synthesis
To enable structural navigation of the information units, some indexical items
should be required to provide an overview of the information trees. For instance,
categorical names of some information units would serve as menu items. When a
user selects a menu item, he is requesting to see the specific information units un-
der this category. Navigation synthesis is to collect these indexical items in order
to visualise them later as the navigation facilities such as menus and navigation
Page 50
38 Chapter 4. Website Synthesis
bars. The result of navigation synthesis is a navigation tree.
4.3.3 Visualisation Synthesis
Visualisation synthesis realises the information trees and navigation trees as the
the Web materials for final presentation. We use the Prolog-to-HTML converter
PiLLoW (Cabeza and Hermenegildo, 2001) to generate the final HTML docu-
ments. Before we can feed the information and navigation trees to PiLLoW, we
need to synthesise the layout of the information units and navigation facilities on
the Website. For instance, a simple Web page has a logo, a banner, a menu, a
navigation bar, and a content area. These facilities should be positioned (layout)
on every Web page. Logos and banners are site elements for identities, branding,
and advertising. Menus and navigation bars are navigation elements for overview
and selection of the information. Content areas contain actual information units
to present to the users.
There are two basic types of elements in SWiM for visualisation synthesis,
i.e., tabular cells and unit cells. They form layout grids and place holders (com-
partments) for individual visual components. Each tabular cell contain zero or
more other tabular cells and/or unit cells. Each unit cell can also contain zero or
more tabular cells and/or other unit cells. Operationally, visualisation synthesis
uses available cells to hold information units and Website components, including
text, tables, and/or graphics. For simplicity, a single cell is preferably holding
only one information unit or Website component, which unit or component can
be atomic or composite.
A single cell is simply a place holder of Website components. It has a cell
wall (border) which can be made visible or invisible, thick or thin, and shaded
with colour. A table has rectangular cells (m rows by n columns). To take a
3x3 table as an example, in which there are nine cells, we can arbitrarily name
the central cell as (1) Centre, and then other cells clockwise from top (2) North,
(3) Northeast, (4) East, (5) Southeast, (6) South, (7) Southwest, (8) West, and
(9) Northwest. Each cell may contain zero or more other tabular cells and/or
other types of cells. Any cell may be fused with neighbouring cells to form
bigger cells. The sizes of cells are adjustable although the sizes of the same rows
and columns should be consistent. Each non-empty cell should contain Website
Page 51
4.3. Simple Website Interface Model 39
content or navigational information as well as related Website components for
visual presentation. Our implementation uses tabular cell layout. For instance,
to represent an ordinary home page in a 3x3 table, the Centre cell contains the
content information units. The Northwest cell contains a site logo. The North
cell contains a banner. The West cell contains a menu (table of contents) and
optionally some other services (e.g., search). The South cell contains a navigation
bar. The East cell contains some optional images.
Unit cells under SWiM can be treated like boxes for CSS layout (Griffiths,
2006; Muller, 2007) and layout of multi-column Web pages using CSS stylesheets
is feasible1. As different browers may behave differently, a recent W3C Working
Draft2 was proposed (dated 6 June, 2007) to provide a multi-column model for
page layout using CSS stylesheets. It is expected that multi-column page layout
will become easier after standardisation.
4.3.4 Features of SWiM
SWiM is a way of summarising simple practices of Website construction to provide
Website synthesis with:
• A plausible conceptual framework to partition tasks among information
synthesis, navigation synthesis, and visualisation synthesis, as well as iden-
tifying the gaps between them.
• A simple structural framework to organise the information units in tree
structures, and to facilitate extraction of indexical features of information
units to form navigation (context) trees.
• A layout framework (using tabular cells and unit cells) to organise informa-
tion units and Website components on Web pages.
SWiM has been useful in our experiment synthesis research where the objec-
tive is to build a large number of simple Websites. However, SWiM is not directly
applicable to synthesising complicated Websites without specifiable patterns.
1http://yaml.de2http://www.w3.org/TR/2007/WD-css3-multicol-20070606
Page 52
40 Chapter 4. Website Synthesis
Protocol 2 Rewriting of Morgans
Require: a set of morgans M
Require: a set of morganic grammar rules
for all m ∈ M and m is rewritable do
if m is unifiable with the LHS morgan of a grammar rule then
if all carriers (conditions) of the grammar rule are satisfiable then
unify the attributes of the RHS morgans of the grammar rule with the
attributes of the LHS morgan and carriers
add all RHS morgans to M
end if
end if
end for
return M
4.4 Rewriting for Website Synthesis
Each grammar rule has a single morgan on the left hand side (LHS), which can
be rewritten to the morgans on the right hand side if and only if all carriers (con-
ditions) are satisfiable at the time of rewriting. We can use morganic grammar
rules to specify the source information, the synthesis tasks as suggested in SWiM,
as well as compatible Website components. The rewrite rule interpreter serves as
a Website synthesiser to synthesise Websites. Protocol 2 shows how the synthesis
can be generally done with the rewriting of morgans.
The core Prolog code of the rewrite rule interpreter for Website synthesis is
listed in Appendix A.
4.5 An Example of Website Synthesis
This section exemplifies how Website synthesis works. To specify an overall Web-
site synthesis, we can specify the initial input (an information tree/list), and final
output (a Prolog list of Web elements to be interpreted by PiLLoW for HTML
generation). The intermediates between the initial input and final output can be
specified in separate grammar rules or treated as expanded carriers of the gram-
Page 53
4.5. An Example of Website Synthesis 41
accidents
case :
case1
eventList :
eventList1
event :
e9
eState : cruise
ePicture : http://websyn.dai.ed.ac.uk/images/lackpower.jpg
eCrypticName : kiodwa
eName : PassengerReport
eDesc : Passengers told flight attendants about sparks from engine A
eAltitude : 1023
eDistance : 13.5
eTime : ‘19:03:15’
eCauses : e2, e6, e8
...
...
...
Figure 4.1: An example of source information trees
mar rules. In this example, we synthesise a Website to present aviation accidents.
Each accident comprises multiple events. The information of aviation accidents
is represented in a morgan with an attribute-value matrix (AVM) as shown in
Figure 4.1.
Suppose Website synthesis begins with the morgan source(Info) and pro-
gresses into the navigation synthesis:
source(Info) → navigation(InfoTree,NaviTree)
structureRefinement(Info, InfoTree)∧indexFeatures(caseName, 0, InfoTree,NaviTree)
Page 54
42 Chapter 4. Website Synthesis
where the variable Info is instantiated with the AVM in Figure 4.1. The car-
rier structureRefinement extracts the event information including eName, eState,
caseName, ePicture, eCauses , eDesc and the consequent event. The consequent
event needs computation from the context among events. These pieces of ex-
tracted information are stored in the variable InfoTree. The carrier indexFeatures/4
is responsible for extracting the indexical items from the information tree InfoTree
and creating a navigation tree NaviTree, which is a result of extraction of the at-
tribute caseName (and the attributes at the depth of zero level below). The
indexical extraction collects the values (i.e., category names) of the hierarchical
attributes in the tree. The extraction result [case1, case2, case3, ...] is stored in
NaviTree.
For visualisation, in addition to InfoTree and NaviTree, we also need a logo,
a banner, a menu, and content information in synthesis of a Web page. The logo
and banner are the same across pages and we just need to retrieve them from the
given locations as specified in the following grammar rule:
navigation(InfoTree,NaviTree) →visualisation(Title,TitleImage,LogoImage,Cases ,Content)
logo(LogoImage)∧banner(Title,TitleImage)∧cases(NaviTree,Cases)∧refinement(InfoTree,Content)
The case codes are extracted from NaviTree. In this example, tables are used
to layout the information of individual events. The information about eName,
eState, caseName, ePicture, eCauses , eDesc and the consequence of each event
are put into tabular cells. The events of each accident are presented in a single
Web page. The result of presenting accident events is stored in Content , which
is transformed into a Prolog list in compliance with PiLLoW for subsequent
conversion into HTML.
visualisation(Title,TitleImage,LogoImage,Cases ,Content) →pillowHtml(Dir , SiteContent)
outputDirectory(Dir)∧caseList(Cases ,Menu)∧visualiseSite(Content ,Title,TitleImage,LogoImage,Menu, SiteContent)
The following predicates are the Prolog code of carrier visualiseSite to layout
Page 55
4.5. An Example of Website Synthesis 43
NW: NorthwestNE: Northeast
SW: SouthwestSE: Southeast
NE
West East
NW North
SESouthSW
Centre
Centre
Centre
Figure 4.2: A schematic view of tabular cell layout
pages of this simple Website:
visualiseSite([], _, _, _, _,[]).
visualiseSite([H|T],Title,TitleImage,LogoImage,MainMenu,
[PageContent|OtherContent]):-
visualisePageContent(H,Content),
visualisePage(Title,TitleImage,LogoImage,MainMenu,Content,PageContent),
visualiseSite(T,Title,TitleImage,LogoImage,MainMenu,OtherContent).
visualisePage(Title,TitleImage,LogoImage,MainMenu,Content,PageContent):-
tabularCells(LogoImage,TitleImage, [], [], [], [], [],
itemize(MainMenu), Content, PageContent).
where the arguments of visualisePage are to put different pieces of information
into tabular cells clockwise starting from Northwest (top left) of a 3x3 table.
Multiple Web pages (in HTML) are generated by PiLLoW in the order given in
the Content . The first Web page is named “index.html” and the filenames of
other Web pages are based on accident codes (e.g., case101) so that the menu
items and their hyperlinks can also be consistently generated. Each accident
event is presented in a 3x3 table by visualisePageContent in the same manner
as visualisePage. The schematic pattern of the layout is shown in Figure 4.2.
The result of this example is shown in Figure 4.3.
Page 56
44 Chapter 4. Website Synthesis
Figure 4.3: A synthetic Website
Page 57
4.6. Chapter Summary 45
4.6 Chapter Summary
Website synthesis follows Website design practice. A simple Website interface
model (SWiM) is proposed to describe the tasks of Website synthesis and to sys-
tematise the specification of Website construction by using grammars. Aviation
accident events are used to exemplify how Website synthesis works. During the
development of grammars for Website synthesis, we realised that there are nu-
merous alternatives to present the same information and wondered whether the
presentation formats would affect the perception of causality of accident events
and whether the designers’ preference in selecting presentation formats is related
to their cognitive abilities, such as visualisation and analogy-making. These hy-
potheses are explored in later chapters as our examples for using computational
synthesis in scientific experimentation.
Page 59
Chapter 5
Experiment Synthesis
Formulation of experiments is about how to apply treatments to experiment units
and to measure the responses of experiment units to different treatments (Cox
and Reid, 2000). Treatments are stimuli, each of which is to be given to a par-
ticular experiment unit. Experiment units are the subjects (e.g., participants,
patients, animals, crops, and raw material) to receive treatments. Responses are
the measurable criteria after, and supposed to be effected by, treatments. Sta-
tistical experiment design (Cox and Reid, 2000; Grafen and Hails, 2002; Shadish
et al., 2002; Montgomery, 2005; Ryan, 2007) has provided statistical methods to
optimise the use of resources and to avoid errors and biases in the formulation
of experiments. Software toolkits for collecting and processing experimental data
are widely available and catalogued1, particularly paper-based and Web-based
interviewing (Birnbaum, 2004; Mizuno, 2004; Skitka and Sargis, 2006). Rather
than pursuing statistical experiment design and Web-based interviewing, our ap-
proach to experiment synthesis is to explore how the Web is interfaced with or
used as an instrument in compliance with experiment protocols and in connec-
tion with hypotheses, treatments, experiment units, and responses, This chapter
will describe and exemplify how we [partially] synthesised cognitive science ex-
periments, which serve as severe tests for applying computational synthesis to
non-computational experiments. The conduct and results of actual experiments
will be described in the next two chapters.
1http://www.asc.org.uk/Register/index.htm
47
Page 60
48 Chapter 5. Experiment Synthesis
Protocol 3 An experimental research script
• Formulate hypotheses
• Design experimental methods : variables and statistical design
• Obtain available materials and measures
• Construct experimental materials and measures
• Obtain research assistants
• Pilot test procedures and measures
• Refine experiment based on pilot results
• Obtain participants (experiment units)
• Data collection
• Code and organise data
• Data analysis
• Determine if hypotheses were supported
5.1 A Grammar for Experiment Synthesis
Most books and papers teaching experimental research cover similar ideas, i.e., hy-
pothesis generation, experiment design, data collection, and data analysis. These
ideas may be used to formulate experimental research. An empirical study (Her-
shey et al., 1996, 2006) showed that researchers describe common steps (script /
protocol) in their research. Forty nine psychology professors were recruited from
major academic institutions and each was asked to list about twenty actions or
steps that characterise his / her experimental research work. Consensual steps in
between the hypothesis generation and data analysis were shown in Protocol 3 as
a composite research script. This indicates that the interviewed researchers agree
very much about important steps in experimental research. The steps in bold-
face are commonly discussed in various textbooks of experimental methods (Cox
and Reid, 2000; Grafen and Hails, 2002; Shadish et al., 2002; Montgomery, 2005;
Leong and Austin, 2006; Ryan, 2007). The steps in italic typeface are the ones
which could make use of computational synthesis. These possibly computational
steps may form a grammar for a simple pattern of experiment synthesis:
Page 61
5.2. Computational Synthesis of Experiments 49
e(E ) → t(T ), b(B), u(U ), a(A), r(R), d(D)
carriers(E ,T ,B ,U ,A,R,D)∧(T ∪ B ∪ U ∪ A ∪ R ∪ D) ⊆ E
where e stands for the protocol specification of experiment with some specific
attributes (E ), t stands for the protocol specification of treatments with some
specific attributes (T ), b stands for the protocol specification regarding the mea-
surements of background (or controlled background) conditions with some spe-
cific attributes (B), u stands for the protocol specification about experiment
units with some specific attributes (U ), a stands for the protocol specification
about allocation (assignment) of treatments t to experiment units u with some
specific attributes (A), r stands for the protocol specification regarding the mea-
surements of responses with some specific attributes (R), and d stands for the
protocol specification of data analysis with some specific attributes (D). All at-
tributes should satisfy the carriers which put all protocol specifications together
for experimentation.
At the present stage of development, our grammars do not prescribe a conti-
nuity for total synthesis of experiments. Many of the steps of transformation de-
scribed by the grammars still need experimenters to add materials and procedures
(e.g., instruments) as given components to fill the gaps. Different experimenters
may develop their grammars to suit specific kinds of experiments.
5.2 Computational Synthesis of Experiments
Formulated hypotheses are theoretical constructs of the scientific inquiry of inter-
est. They must be further formalised into variables for experimentation. To use
these variables for manual or computational synthesis of experiments, we can de-
velop an initial specification and then refine/elaborate it to build an experiment.
An example for such initial specifications is given in Figure 5.1. Some indepen-
dent variables are operationalised as treatments (including experiment controls).
Dependent variables are the responses of the experiment units to be observed and
measured. Given the experiment units and treatments, one treatment is applied
to each unit and one response is measured on each unit so that the effects of the
treatments on the units can be estimated (Cox and Reid, 2000).
Page 62
50 Chapter 5. Experiment Synthesis
Sophisticated experiments can be too complicated to fully specify. However,
partial specifications would be feasible even when no total synthesis of experiment
has been achieved. In Chapters 6 and 7 we describe two experiments. The ex-
periment in Chapter 6 is specified using the simple morgan of Figure 5.1 to start
the synthesis of an experiment, which aims to investigate whether and how the
independent variables (i.e., (1) the covariation of aviation accident events, (2) the
arrangement of events in causal or temporal orders, and (3) the events presented
in sensible or cryptic terminology) would affect the perception of causality in the
presented aviation accident events, i.e., the dependent variable. The experiment
specification provides information about independent variables, dependent vari-
ables, background variables, experiment unit variables, and treatment variables.
Independent variables, together with the treatment variable, are considered in
formulating individual conditions for treatments. Dependent variables are the
responses to be measured before, during, and/or after the treatments. Back-
ground variables describe controlled and/or non-manipulative conditions which
should not affect the dependent variables although present in the experiment.
Background variables are sometimes measured before, during, and/or after the
experiment to rule out confounding errors. Experiment unit variables describe
the experiment units, i.e., the subjects, being sampled, treated and measured.
Individual parts of experiment synthesis need partial information about the
experiment as a whole. As prescribed in the grammar for experiment synthesis,
we can distribute the required subset of full information into separate morgans,
e.g., treatments (Figure 5.2), background measurement (Figure 5.3), response
measurement (Figure 5.4). It would be preferable that each part of experiment
synthesis is conducted according to each subunit morgan. For example, indepen-
dent variables are used to synthesise treatments. Measurements of background
conditions are used to synthesise something required for data collection of con-
ditions and background information. Dependent variables are used to synthesise
response measurement as a part of data collection. These parts of synthesis for
Web experiments can be realised by using Web-based materials, including instru-
ments, as components.
Page 63
5.2. Computational Synthesis of Experiments 51
experimentSpec
independentVariables
rhetorics
varType : categorical
varLevels : causal , temporal
varUse : moderating
varTreatment : independent
terminology
varType : categorical
varLevels : sensible, cryptic
varUse : moderating
varTreatment : independent
covariation
varType : categorical
varLevels : c1...c5
varUse : causal
varTreatment : repeatedMeasure
dependentVariables
causalRatings
varType : interval
varLevels : 0...100
varUse : measurement
backgroundVariables
bV1
varType : ordinal
varLevels : 1...7
varUse : measurement
... bVn
varType : ordinal
varLevels : 1...7
varUse : measurement
experimentUnits
unitType : humanSubjects
samplingMethod : convenience
sampleSize : 40
treatmentAllocation[assignment : randomised
]
Figure 5.1: An example morgan as a starting material for experiment synthesis
Page 64
52 Chapter 5. Experiment Synthesis
treatments
independentVariables
rhetorics
varType : categorical
varLevels : causal , temporal
varUse : moderating
varTreatment : independent
terminology
varType : categorical
varLevels : sensible, cryptic
varUse : moderating
varTreatment : independent
covariation
varType : categorical
varLevels : c1...c5
varUse : causal
varTreatment : repeatedMeasure
Figure 5.2: An example morgan for synthesising treatments
background
backgroundVariables
bV1
varType : ordinal
varLevels : 1...7
varUse : measurement
... bVn
varType : ordinal
varLevels : 1...7
varUse : measurement
Figure 5.3: An example morgan for background measurements
Page 65
5.3. Synthesis for Treatments 53
response
dependentVariables
causalRatings
varType : interval
varLevels : 0...100
varUse : measurement
Figure 5.4: An example morgan for response measurements
5.3 Synthesis for Treatments
Treatments are the stimuli or conditions given or applied to experiment units
(e.g., participants) so that the responses of the experiment units to different
treatments can be measured in the experiment. The materials for treatments
in Web experiments are basically Websites or Web documents suitable for the
domain for testing in experiments. As aviation accident reporting requires high
accuracy and efficiency in presenting and perceiving causal relationship among
all relevant accident events, we used the domain of aviation accident reporting
in our experiments for testing the perception of causality (Chapter 6) and the
preference in selecting presentation formats (Chapter 7). For synthesising Web
materials for the example experiments, we arranged aviation accident events as
the given information in specific ways to serve as treatments. All accidents be-
longing to a treatment for an experiment unit (participant) were presented on
a single Website. Events of an aviation accident were presented on one or more
Web pages. The events were presented in English language in natural (although
occasionally technical) language. The participants can browse the assigned Web-
site and access each of given aviation accidents by using the Website’s main menu.
They can also follow individual events according to the presentation order or by
using the available hyperlinks on each Web page. The synthesis of the Websites
and Web pages are as described in Chapter 4. An example Web page generated
for this treatment is shown in Figure 4.3. Here we can focus on the synthesis
Page 66
54 Chapter 5. Experiment Synthesis
of different treatments, which are presented as the central content area of the
synthesised Web pages.
treatments(VarTypeList) → webinfo(ContentList)
factorialDesign(VarTypeList ,GroupTreatmentList)∧givenInfo(Info)∧groupTreatment(GroupTreatmentList , Info,ContentList)
where treatments(VarTypeList) represents the treatment specifications such as
shown in Figure 5.2, factorialDesign(VarTypeList ,GroupTreatmentList) repre-
sents the experiment design layout, givenInfo(Info) represents the Web content
information (i.e., aviation accident events in our example) given for synthesising
the Websites as treatments, groupTreatment(GroupTreatmentList , Info,ContentList)
represents a high level goal to arrange the given Web content information, accord-
ing to each treatment group specification, into Website content for all treatment
groups. Specific arrangements of the given information are made by respective
instruments.
Each event was presented in a table (box), which was divided into cells to dis-
play the information of event names, event description, pictorial icons indicating
the flight positions (e.g., climb, cruise, and land), etc. An example event (named
“e”) is specified in Figure 5.5, in which the attributes eName and eCrypticName
are respectively meaningful and cryptic terms for the event (allowing experi-
ments with and without meaningful terms for events). The attributes eAltitude
and eDIstance indicate the altitude of the plane from sea level and distance of
the plane from destination airport. The attribute eTime indicates the time of
the event.
5.3.1 Rhetorics in Presenting Information
The same source information can be presented in different ways and certain ways
are more effective or efficient to achieve our communication goals. This is where
rhetoric is important. The Web as an instrument can help model the information
and knowledge to comply with rhetorics. For example, we can present aviation
accident events. We can present the events in temporal sequence rather than the
given causal tree structure. We can present the events according to the posi-
tions of aircraft at different time points. We can present the events in graphical
Page 67
5.3. Synthesis for Treatments 55
accidentEvents
e
eState : cruise
ePicture : http://websyn.dai.ed.ac.uk/images/lackpower.jpg
eCrypticName : kiodwa
eName : PassengerReport
eDesc : Passengers told flight attendants about sparks from engine A
eAltitude : 1023
eDistance : 13.5
eTime : ‘19:03:15’
...
Figure 5.5: An example morgan for specifying an aviation accident event
% cause(+EventList, +Consequence)
cause([p,i], h).
cause([h], g).
cause([y,z,e,g], d).
cause([w], e).
cause([d], b).
cause([b], a).
Figure 5.6: An example causal structure of aviation accident events
Page 68
56 Chapter 5. Experiment Synthesis
trees or text tables. These rhetorics of presentation were tested in our example
experiments to exemplify experiment synthesis.
5.3.1.1 Tabular Presentations
A temporal sequence of the events can be generated by sorting according to the
given attribute eTime. Possible causal structures of the events of an aviation
accident were given and can be represented in a hierarchical structure as shown
in Figure 5.6. In our example, the events in temporal order were linearly presented
on a Web page. The causal structure of the events required multiple Web pages
to be presented with each Web page presenting the events that happened at the
same time slot. Each presented event had hyperlinks to link to its candidate
causes and likely consequences, which could be on the same or a different Web
page, thus allowing the causal structure from Figure 5.6 to be navigated.
5.3.1.2 Graphical Presentations
As the information about the time, altitude, and distance (from runway) is avail-
able, it is possible to visualise the position of aircraft in a graph, e.g., X-axis as
time, Y-axis as altitude, and Z-axis as the distance from runway. Before we can
generate this graph, we put these pieces of information together into a table from
relevant events by a simple facility based on a temporal logic interpreter. To get
information from events as specified in Figure 5.5, we use the following rule:
events(EventList) → table(AircraftPositions)
collection([eTime, eAltitude, eDistance],EventList ,AircraftPositions)
Suppose we have only three different time points at which altitude and distance
from runway were known then the pairs of values for the instantiated table pro-
viding position information in terms of time, mean sea level, and nautical miles
might be:
table([(’10:15:05’,1023,13.5),(’10:42:20’,876,9.25),(’10:49:42’,833,6.25)])
These data can be used to generate a graph to visualise the positions of aircraft
in different time points or events. An example graph with more information is
shown in Figure 5.7.
Page 69
5.3. Synthesis for Treatments 57
Figure 5.7: A 3D graph displaying the altitude and distance positions of aircraft
at different time points
In addition to temporal presentation in 3D graphics, the causal tree structure
of accident events can be presented in graphical form (Figure 6.1). The causal
trees can be generated from GraphViz2 and embedded in Web pages. In both
table and tree forms of presentation, there are multiple attributes available for
presenting different attributes of accident events. The attributes of tree presen-
tation include nodes and edges between nodes. The attributes of each node or
edge may include the code, name, and text to be [only] shown when a mouse
pointer moves over the item. The attributes of an instantiated tree are shown
in Figure 5.8, as a result of attribute mapping between a morgan of an accident
event and a morgan of a causal tree. The result of preferred mapping can be fed
into the Website synthesiser to generate the desired trees. The same principle is
applicable to generating tables. In one of our example experiments, participants
were asked to test various possible mappings and to generate a Website on the
fly for each mapping.
2http://www.graphviz.org
Page 70
58 Chapter 5. Experiment Synthesis
tree-graph
tree
node1[nodeName : PassengerObservation
nodeMouseOver : Passengers saw sparks from engine A
]
...
edge1
edgeName : PassengerReport
edgeMouseOver : Passengers told flight attendants about sparks from engine A
nodeFrom : node1
nodeTo : node2
Figure 5.8: An example morgan for specifying an aviation accident event
5.3.2 Technical Terminology
To control for differences of prior knowledge among the participants about avi-
ation accidents, in one of our experiments, we used meaningful description for
accident reports or cryptic (fragmentary and not informative) description in sep-
arate treatment groups.
5.3.3 Cause-effect Covariations
To generate fictitious accidents, we follow the causal tree structures of real avi-
ation accidents. The same structure may represent accidents and non-accidents
(given that events happened to avoid accidents). By using the causal trees and a
given frequency of a cause causing accidents, information about multiple fictitious
accidents can be generated and presented on Web pages.
Page 71
5.4. Experiment Units 59
experimentUnits
unitType : humanSubjects
samplingMethod : convenience
sampleSize : 40
Figure 5.9: An example morgan for experiment units
5.4 Experiment Units
The basic information for specifying experiment units are as shown in Figure 5.9.
According to the information of this example morgan, experimenters need to find
40 human subjects as recruited by means of convenience (non-random) sampling.
Experiment units are seldom synthesisable. In cognitive science, experiment units
are usually human subjects, who are not the objects of experiment synthesis. We
recruited student volunteers in the university for cash rewards in one experiment.
We also asked students in a course module to participate in another experiment
as one of their laboratory sessions, during which the participants as experiment
units were randomly assigned treatments.
5.5 Data Collection
As questionnaire generators are readily available as our instruments, we did not
synthesise questionnaires using our Website synthesiser. Questions were hand-
crafted and fed into a questionnaire generator toolkit (modsurvey3) to obtain
Web questionnaires for data collection. There are thousands of standardised
questionnaires and response tests, e.g., Test in Print4 and ETS Test Collection
Catalogue5, available as instruments in psychology and cognitive science. Of
course, most cognitive scientists still cannot find suitable tests for their creative
3http://www.modsurvey.org4http://www.unl.edu/buros5http://ets.org
Page 72
60 Chapter 5. Experiment Synthesis
experiments.
For measuring the background variables such as the knowledge of participants
about computer and aviation accidents, we need a questionnaire to be filled in by
participants before the experiment. We found and modified a sample question-
naire for computer background knowledge from a questionnaire generator toolkit
(modsurvey). We also add a few questions about the participants’ knowledge
about aviation accidents. The measurement of background variables like these
aims to ensure there is no significant background differences among different
treatment groups. The pre-experiment questionnaire for measuring background
variables is shown in Appendix B.
For measuring the response variables concerning simple causal perception in
our example experiment, we follow the question formats used in the causal percep-
tion experiments published by other experimenters. For measuring counterfactual
causal perception, we just change the question wordings to be counterfactual (see
the response measurement questionnaire in Appendix C).
5.6 Reusable Parts of Experiments
Reusability of the experiment components should be high in similar laboratories
conducting related research. The most obvious reusable parts of experiments are
published test toolkits (instruments). We did two experiments of different kinds
(causal vs. correlational) and with different objectives. The first experiment is
to present accident events on Websites to test the causal perception of partici-
pants. The second experiment is to allow participants to try different possible
mappings between information and presentations (tables or trees). Despite these
differences, they share the same Website synthesiser and presentation mechanism
of the aviation accident events.
5.7 Synthetic Web-based Experiments
For Web-based experimentation, we can use synthetic Web materials as instru-
ments to model knowledge, provide working knowledge, and/or conduct mea-
surements. As the synthesis process is repeatable and the modifications can be
Page 73
5.8. Chapter Summary 61
done at a higher level, the advantages of using synthesised Websites in Web-based
experiments are:
• saving time and effort of the experiment (often the key to enabling it) ;
• maintaining Website consistency throughout the experiment;
• reproducing the experiment;
• facilitating the modifications of the experiment after pilot tests; and
• modifying the Websites for other experiments.
The example experiments as described in the next two chapters demonstrate
some of these advantages.
5.8 Chapter Summary
This chapter demonstrates a use of experiment synthesis in constructing experi-
ments. Experiment synthesis starts with specifications of important parameters
and proceeds by using parameterisable components as the instruments for ex-
perimentation. Under the paradigm of the Lab-on-the-Web as we envisaged,
such instruments are interfaced with or actually are the Web-based materials.
Physical instruments interfaced with the Web are controlled by appropriate pa-
rameters of experiments. Web-based materials can be organised and visualised by
using Website synthesis techniques in accordance with the specified parameters.
With Website synthesis techniques, experiment synthesis should make Web-based
experiments easier to construct, conduct, reproduce, modify, and extend. To
demonstrate the use of experiment synthesis in non-computational experiments,
we will use it for non-trivial cognitive science experiments in the next two chap-
ters. The first one is a causal experiment and the second one is a correlational
experiment.
Page 75
Chapter 6
Synthesised Experiment 1:
Causal Perception
Our aim is to demonstrate computational synthesis of Web-based experiments
in undertaking experimentation on (1) causal perception which is seen to be a
cognitive basis of science (Hilton, 2002) and (2) representation mapping (design)
where cognitive science should contribute (Stary and Peschl, 1998). This chapter
describes the experiment on causal perception and the next chapter will explore
the experiment on representation mapping, particularly the correlation between
some cognitive factors (visualisation and analogy-making) and the mapping (de-
sign) preference for two different modalities of presentation formats (tables and
graphics).
The experiment on causal perception aims to test different causal perception
theories in the application of aviation accident reporting. In addition to the
normal causal perception, the participants were also prompted for their counter-
factual causal ratings. The rhetorics and modality may influence the effective-
ness (e.g., accuracy and completeness), efficiency (e.g., resources for achieving
goals), and satisfaction (e.g, comfort and acceptability) of the presentation. As
we are not sure whether rhetorics (e.g., the patterns of presentation sequences)
and modality (e.g., the perceptual forms of the presented material for stimulus)
of presentation would affect people’s causal perception (or their confidence) of
aviation accident reports, we also introduced these two factors.
63
Page 76
64 Chapter 6. Synthesised Experiment 1: Causal Perception
6.1 Causal Perception Models
Causal perception is an old philosophical issue (as briefly described in Chapter 2)
and more recently became an area of active research in cognitive science (Hilton,
2002). Some hypotheses have been proposed to describe the relationship between
the perception of causal relations and the covariation information, which can be
formulated by using the terms in the following contingency table.
Effect occurs
Candidate cause Yes (e+) No (e−)
Present (c+) c+e+ c+e−
Absent (c−) c−e+ c−e−
The hypotheses of causal perception we tested are, first, the Contingency
model (see for example (Cheng and Novick, 1990)) which predicts a measure,
∆P , of the extent to which a candidate cause, c, and an effect, e, are perceived
to covary according to the equation:
∆P = P(e | c)− P(e | ¬c)
= (c+e+/(c+e+ + c+e−))− (c−e+/(c−e+ + c−e−))
where P(e | c) is the probability of e given that c occurs and P(e | ¬c) is the
probability of e given that c does not occur. ∆P is often called contingency or
contrast.
The second hypotheses of causal perception is the Probabilistic Contrast (PC)
model, so called the Power PC model (compared to the contingency model in
(Glymour, 2001; Lien and Cheng, 2000)), as defined below:
PC = ∆P/[1− P(e | ¬c)] = ∆P/[1− c−e+/(c−e+ + c−e−)]
where PC is the generative power of c with respect to e.
There is no consensus over which model is more approximate to describe the
regularity of causal perception in general. For our own application in aviation
accident reporting, we aim to test which causal perception model would be more
applicable.
Page 77
6.2. Factors Affecting Causal Perception 65
6.2 Factors Affecting Causal Perception
Our two causal perception models take into account only the main contributing
factor, i.e., covariation information of candidate causes and effects. Other factors
such as how the causal information is presented may affect the causal percep-
tion are not considered. Recent studies such as those on the interaction between
multiple causal cues (Lovibond et al., 2003), the correlation of beliefs and causal
perception (Fugelsang and Thompson, 2000, 2001, 2003; Fugelsang et al., 2006),
the cause-effect delays in time (Buehner and May, 2003), the agreement between
counterfactual and factual thinking (Mandel, 2003), familiarity and imageability
of the candidate causes and effects (Fugelsang et al., 2006), and the difference
in the question wordings for probing the causal ratings (White, 2003) show that
many complex factors can legitimately be introduced. Most of these factors were
uncontrolled in the past experiments, so experimentally it would ideally be nec-
essary to determine whether the causal perception would be affected by some of
the factors other than covariation information of candidate causes and effects.
6.3 Objectives and Hypotheses
For aviation accident reporting, the ways to present accident information on
Websites might influence perception of the causes of accidents. We would like to
find:
• which causal perception model as described in Section 6.1 is the closest
approximation to the observed perception under our specific scenarios –
aviation accident reporting on Websites;
• any correlation between the normal and counterfactual causal perception
ratings; and
• whether the observed perception ratings are influenced by factors other
than covariation information of candidate causes and effects, e.g., temporal
/ causal rhetorics and sensible / obscure terms.
We shall consider two different forms of rhetoric: a strongly causal rhetoric in
which the causal links between events (known from the accident patterns used to
Page 78
66 Chapter 6. Synthesised Experiment 1: Causal Perception
generate the sites) are emphasised as hyperlinks between events; and a temporal
rhetoric in which the sequence of events for each accident is shown and causal links
are mentioned but not emphasised. To determine the effect of subjects using their
own background knowledge of aviation accidents, we generate sites for some of the
experiments using event descriptions meaningful to aviation (such as “speedbrake
extended”) and for other experiments we generate the same causal description
but with cryptic names unrecognisable in the aviation domain.
These models give different predictions of the causal strength associated with
a cause and an event. For instance, if the probability of an event given that a
cause occurs (P(e | c)) is 0.9 and the probability of the event given that the cause
does not occur (P(e | ¬c)) is 0.8 then contingency model predicts the strength
of causation to be 0.1 while power PC predicts 0.5. By setting up Websites
describing sets of accidents with known P(e | c) and P(e | ¬c), which is very
time consuming to do by hand, we can assess the predictive power of these two
models by comparing their predictions to those observed from human subjects
who have browsed those sites.
The null hypotheses in the experiments described below are:
1. Causal perception of aviation accidents is random and does not follow any
causal model.
2. Causal perception of accidents would not be affected by different styles of
the information being presented.
3. Normal causal ratings are the same as counterfactual causal ratings.
4. Confidence scores in giving both normal and counterfactual causal ratings
are the same.
6.4 Methods
6.4.1 Participants
The participants were 47 undergraduate students of the University of Edinburgh,
taking the Artificial Intelligence module as one of the three constituents of their
Page 79
6.4. Methods 67
first year of study. The experiment was run in Semester 2 during the experi-
mental methodology module of the course. The course attracted students from
a broad variety of science and engineering disciplines (also including psychology
and linguistics degrees). Their computer training in the course modules earlier in
the year should have equipped them with basic computer skills and are familiar
with Web browsing. The participants were allocated to four different groups in
a random sequence of four group numbers.
6.4.2 Generating Websites
We generated different Websites (one for each participant) containing 100 acci-
dent cases from the same accident patterns. The Websites in this experiment
were synthesised via the automated process described in Chapters 4 and 5. The
synthesiser can be parameterised by the rhetorical and terminological style and
could also be set to generate a sample of accident cases with the combinations
of covariations shown in the table of the previous section. These samples were
generated from standard patterns of aviation accident culled from the literature.
Five patterns of aviation accident information having the same causal struc-
ture were randomly assigned to the five combinations of covariation of candidate
causes and accidents. This avoided the influence of specific accident informa-
tion content on the causal perception test. The diagram of Figure 6.1 shows an
example pattern of aviation accident information:
This aviation accident information was used to synthesise the experimental
Websites. As an additional measure, the hyperlinks of each synthesised Website
were automatically checked for errors such as dead links, raising our confidence
(although of course not guaranteeing) that our synthesiser had worked reliably.
Every Website was thus guaranteed to be unique in terms of the settings of
rhetoric, terminology, and the order of presenting cases.
Page 80
68 Chapter 6. Synthesised Experiment 1: Causal Perception
man
oeuv
re f
aile
d (k
)
cont
rolle
d fl
ight
into
terr
ain
(a)
retr
act s
peed
brak
es to
o la
te (
f)
non-
optim
al p
itch
man
oeuv
re (
z)un
awar
e of
ext
ende
d sp
eedb
rake
s (y
)sp
eedb
rake
s ex
tend
ed (
e)
man
oeuv
re s
tart
ed (
x)
spee
dbra
kes
not r
etra
cted
acc
ordi
ng to
pro
cedu
re (
w)
dang
erou
sly
clos
e to
mou
ntai
ns (
d)
even
t (p)
clos
e to
mou
ntai
ns (
b)
Figure 6.1: An example of aviation accident pattern
Page 81
6.4. Methods 69
6.4.3 Experiment Design
The dependent variables were normal causal ratings and counterfactual causal
ratings. The values of normal causal rating and counterfactual causal rating were
expressed on a scale between 0 and 100. The wording of the question to probe
normal causal rating was as follows, where AccidentCategory describes a type of
accident and EventName describes a type of event:
“Out of each 100 flights without an accident [AccidentCategory], howmany might have had an accident [AccidentCategory] if [EventName]had occurred? (0-100)”
The wording of the question to probe the counterfactual causal rating was as
follows:
“Out of each 100 flights with an accident [AccidentCategory], howmany might not have had an accident [AccidentCategory] if [Event-Name] did not occur? (0-100)”
The participants were also asked to rate their confidence in giving their normal
causal rating and counterfactual causal rating. These confidence ratings were
acquired using a 7-point scale.
The independent variables are positive covariation frequency P(e | c) and
negative covariation frequency P(e | ¬c), where e is an accident (effect) and c is
each candidate cause. The corresponding versions of the ∆P and PC models are
described in Section 6.1.
Other independent variables are rhetoric and terminology. The only two pos-
sible choices of rhetoric are causal and temporal. Using causal rhetoric ensures
that the events in each aviation incident described by a site are arranged using
causal relations, i.e., an event is caused by another event and may lead to zero or
more other events (Figure 6.2). Using temporal rhetoric ensures that the events
in each aviation incident described by a site are arranged simply according to
their temporal sequence, i.e., two adjacent events on display may not have causal
relationship (Figure 6.3). The two possible choices of description are sensible
and cryptic. Choosing sensible description ensures that each event is described
using an English phrase which is normally used to describe such an event when
reporting an incident (Figure 6.2). Choosing cryptic description ensures that the
Page 82
70 Chapter 6. Synthesised Experiment 1: Causal Perception
Figure 6.2: A Website with causal rhetoric and normal technical description
events are described using arbitrary terms which are meaningless as far as avia-
tion incidents are concerned (Figure 6.3). The cryptic description was used as a
check that our human subjects were not using pre-conceptions of description to
influence their causal judgement.
6.4.4 Rhetorics of presentation
Each synthesised Website as the apparatus of this experiment presented the avi-
ation accident information in one of the following styles:
1. Multiple pages per case with hyperlinks indicating causal relations of the
events (causal rhetoric) and description using common terminology (sensible
terminology).
2. Multiple pages per case with hyperlinks indicating causal relations of the
events (causal rhetoric) and description using cryptic terminology (cryptic
terminology).
Page 83
6.4. Methods 71
Figure 6.3: A Website with temporal rhetoric and cryptic description
3. Single page per case with the events appearing in temporal sequence (tem-
poral rhetoric) and description using common terminology (sensible termi-
nology).
4. Single page per case with the events appearing in temporal sequence (tem-
poral rhetoric) and description using cryptic terminology (cryptic terminol-
ogy).
Each synthesised Website presented five patterns of aviation accidents with
five different combinations of covariations between candidate causes (ca) and
accidents (ac). For each of these, we can calculate the values of P(e | c) and
P(e | ¬c), thus allowing us also to calculate the predictions of the ∆P and PC
models for each combination. These calculations are shown in the table below.
Page 84
72 Chapter 6. Synthesised Experiment 1: Causal Perception
Combination P(e | c) P(e | ¬c) ∆P PC
A 1.0 0.5 0.5 1.0
B 0.9 0.8 0.1 0.5
C 0.8 0.5 0.3 0.6
D 0.7 0.5 0.2 0.4
E 0.6 0.2 0.4 0.5
6.4.5 Tasks and Procedures
Each participant began by filling out a pre-experiment questionnaire (see Ap-
pendix B) on the Web collecting their personal information such as year of birth,
programme of study, levels of computer and Web skills, current usage of com-
puters and the Web, and familiarity of aviation operations. Subsequently, each
participant logged in the Website which was randomly assigned to him/her to
browse. Each participant was also given instructions concerning how to browse
the synthesised Websites, particularly how to interpret the provided navigation
aids and estimate the frequencies of the given potential causes and effects. Each
Website presented 100 cases of aviation accidents and incidents. The browsing
task took about 45 minutes. The participants were asked to pay attention to
the occurrence and to record the frequency of candidate causes and effects. The
participants were given the correct data about the co-occurrence of the candi-
date causes and effects on the Websites they had already browsed. Then each
participant proceeded to fill in a post-experiment questionnaire (see Section 6.4.3
for question templates) on the Web in order to give normal causal ratings and
counterfactual causal ratings.
6.4.6 Data Analysis
Independent variables are (1) the combinations of covariation of candidate causes
and accidents (within subjects), (2) rhetoric (causal or temporal), and (3) termi-
nology (sensible or cryptic). Dependent variables are (1) normal causal ratings,
(2) scores of confidence in giving the normal causal ratings, (3) counterfactual
causal ratings, and (4) scores of confidence in giving the counterfactual causal
ratings. Background information collected in the pre-experiment questionnaires
was also analysed against the independent variables to ensure the homogeneity
Page 85
6.5. Results 73
of participants among rhetoric and terminology groups of treatment. The data
were analysed by the Student’s t-test, the analysis of variance (ANOVA), Krustal-
Wallis test, and linear regression, using R1 statistical software (R Development
Core Team, 2007). P values less than 0.05 were considered statistically significant.
6.5 Results
We summarise the results of the experiment in this section and will discuss them
in Section 6.6.
6.5.1 No significance in the background among groups
Our pre-experiment questionnaire was intended to detect imbalance in the social
or technical background of the participants. There was no significant differ-
ence detectable by ANOVA and Krustal-Wallis tests in all answers to the pre-
experiment questionnaire among the participants in different treatment groups.
Hence, no significant bias due to the background of the participants was found
among the different groups.
6.5.2 No significance in rhetorics and terminology factors
Using a post-experiment questionnaire (see Section 6.4.3 for question templates),
we asked the participants of different treatment groups for estimates of normal
causal ratings and counterfactual causal ratings. No significant differences in
normal and counterfactual causal ratings were found by ANOVA among different
treatment groups. In addition, there was also no significant difference detected
by ANOVA among different groups in the confidence scores when the participants
gave their normal and counterfactual causal ratings. It appears that the tested
rhetoric and terminology factors are not likely to be significant influential factors
affecting normal and counterfactual causal perception in this experiment.
1http://www.r-project.org
Page 86
74 Chapter 6. Synthesised Experiment 1: Causal Perception
6.5.3 Significant difference between normal and counter-
factual ratings
There was a highly significant difference (t=9.69, P < 0.001) and no correlation
(r 2 = 0.04, P < 0.001) between normal and counterfactual causal ratings given
to the same scenarios. There was a highly significant difference in the confidence
scores given by the participants to their own corresponding normal and coun-
terfactual causal ratings (t = 5.48, P < 0.001). However, the confidence scores
given to normal causal ratings are correlated with those given to counterfactual
causal ratings (r 2=0.62, P < 0.001). Confidence in normal causal ratings was
higher than that in counterfactual ratings, even though both kinds of confidence
were highly correlated.
6.5.4 Normal causal ratings were closer to PC
The median and mean normal causal ratings were well predicted by the Power PC
model of causal perception as shown in Table 6.1, in which the first two columns
show the theoretical causal ratings as ∆P and PC .
Table 6.1: Causal ratings
Models Normal Counterfactual
∆P PC Median Mean SD Median Mean SD
0.5 1.0 0.9 0.72 0.29 0.40 0.40 0.20
0.1 0.5 0.5 0.56 0.28 0.25 0.30 0.20
0.3 0.6 0.6 0.57 0.20 0.38 0.40 0.18
0.2 0.4 0.4 0.48 0.20 0.33 0.39 0.18
0.4 0.5 0.5 0.48 0.16 0.40 0.42 0.26
There was a significant difference (t = 3.80, P < 0.001) between the root-
mean-square distances (RMSDs) of normal causal ratings to the theoretical ∆P
and PC . The RMSDs with a mean of 0.11 and a standard deviation (SD) of
0.04 between the normal causal ratings and theoretical PC was less than the
RMSDs with a mean of 0.15 and a SD of 0.06 between the normal causal ratings
and theoretical ∆P . This indicates that the normal causal ratings are closer to
Page 87
6.6. Discussion 75
PC than ∆P . By contrast, the counterfactual causal ratings had a statistically
significant difference (t = 6.35, P < 0.001) and were closer to ∆P (mean = 0.10,
SD = 0.04) than PC (mean = 0.16, SD = 0.04) in terms of RMSDs.
6.6 Discussion
The results of this experiment support the view that the normal causal ratings
are closer to PC than ∆P . The present study is (1) the first test result reported
by independent research, which did not aim to test its own model against others’
models of causal perception; (2) the first causal perception test conducted for the
application domain of aviation accident reporting; (3) the first causal perception
test conducted with moderating factors of rhetoric (causal and temporal rhetoric)
and terminology (sensible and cryptic terminology); and (4) the first study using
synthetic Websites as the experimental apparatus.
This experiment was designed to test causal perception models under differ-
ent conditions. Its results showed that the normal causal ratings given by the
participants in this experiment were more accurately predicted by the Power PC
model (PC ) than the contingency model (∆P) of causal perception. As rhetoric
(causal and temporal) and terminology (sensible and cryptic) factors did not sig-
nificantly affect the causal ratings, it appears that covariation information of the
candidate causes and effects is a much more important factor affecting the causal
ratings.
The counterfactual causal ratings were significantly different from the normal
causal ratings. This indicates that counterfactual causal perception might be
different from normal causal perception as prompted by different question word-
ings. While normal (factual) and counterfactual causal perception agree with
each other (Mandel, 2003), the counterfactual causal ratings were closer to ∆P in
this experiment. The confidence scores in giving both normal and counterfactual
causal ratings are well-correlated. This indicates that the normal and counterfac-
tual causal perception are roughly the same in suggesting the presence of possible
causal links but different in the causal strength estimation. However, we could
not suggest a definite relationship (1) between normal and counterfactual causal
perception, and (2) counterfactual causal perception and the contingency model.
Page 88
76 Chapter 6. Synthesised Experiment 1: Causal Perception
Further experiments would be required to delineate the relationship between nor-
mal and counterfactual causal perception. For instance, it would be interesting to
investigate whether the difference is subject to expert knowledge and experience
in the application domain.
After we did our experiment, we found one more applicable hypothesis, namely
the evidential evaluation (EE) model (White, 2002), under which causal percep-
tion is a function of the proportion of relevant instances of contingency informa-
tion that are evaluated as confirmatory for the candidate cause. The EE model
proposed a pCI rule as follows:
pCI = (c+e+ + c−e− − c+e− − c−e+)/(c+e+ + c+e− + c−e+ + c−e−)
Coincidentally, the pCI values under our experiment conditions are exactly
the same as ∆P values. Further experiments would be required to include pCI
for comparison under various cause-effect covariation conditions.
With the small sample size of this experiment, we could not rule out any effect
of the causal/temporal rhetoric and sensible/cryptic terminology on the causal
perception even though no significance was found. We believe that the rhetoric
and terminology should provide useful information to influence causal perception
or reasoning. Further investigation with a large sample would be necessary to
determine the roles (if any) and strengths of the rhetorics and terminologies in
causal perception.
For efficiency of browsing and finding the candidate causes and effects, the
synthetic Websites in this experiment did not include full accident information.
Once some factors affecting the causal perception have been determined, fur-
ther experiments with more realistic aviation accident reporting Websites may
be performed.
In addition to scientific significance, this experiment demonstrates a techno-
logical significance in using computational synthesis for scientific experimenta-
tion. The materials in this experiment were synthesised computationally accord-
ing to the experiment specification. Computational synthesis enabled the exper-
imenters to synthesise highly controllable and specific knowledge-based content
configuration (see Section 6.4.4) of Websites for each participant to meet the
requirements of scientific experimentation. This experiment required a Website
Page 89
6.7. Chapter Summary 77
describing 100 accident reports (with multiple pages per report depending on the
style of view) for each of the 47 participants, and each Website had to be con-
sistent in its structure with an underlying model of causality and rhetorics. This
task would not be practical without using computational synthesis. We could not
cost-effectively make so many individual Websites by hand and it would be hard
to guarantee compliance with the underlying causal model. It is not practical to
make this experiment work manually at this scale. It would be impossible man-
ually for this experiment to scale up or be reproduced in many possible ways.
If we did not use computational synthesis, the most applicable tools would be
Web-based experiment toolkits and Web content management systems. How-
ever, Web-based experiment toolkits just use a single manually created Website
to present various stimuli. A Web content management system only provides a
single pattern for Website architecture. That means we have to develop a specific
Website content management system to meet the experiment requirement. De-
veloping the required system is a huge software project and would not be easily
affordable. Thus, computational synthesis is a practical solution for experiment
synthesis.
6.7 Chapter Summary
The experiment reported in this chapter indicates a closer relationship between
normal causal ratings and the Power PC model. It also suggests interesting
differences between normal and counterfactual causal ratings, which might be
closer to ∆P . Further cognitive science research should be conducted by using
similar synthetic Websites to formulate more appropriate models for normal and
counterfactual causal perception. This experiment would have been impractical
without using computational synthesis.
Page 91
Chapter 7
Synthesised Experiment 2:
Preferences and Cognitive Factors
7.1 Introduction
The manner of external representation (or presentation) could affect our way of
working with the internal representation (mentally) and our understanding of
the information (Zhang, 1997b), e.g., in cockpit information displays for avia-
tion (Zhang, 1997a), but few results on graphical external representation can be
generalised (Scaife and Rogers, 1996).
One problem affecting all websites is that there is no reliable, general and
abstract method for predicting the effect of presentation rhetorics and modality
on understanding of the information. To improve knowledge communication, we
should investigate how sensitive people might be to differences in the way we
construct our websites. It would be useful to conduct experiments quickly to
compare different models of interpretation of information of a specific domain in
particular cases. There may be certain styles of presentation or navigation that
are generally demanded by users and can either hinder or support users’ ability
to interpret the information.
Tabular and graphical representations are common in constructing visual ar-
guments (Oestermeier and Hesse, 2000) and presenting relational data (especially
quantitative data) (Zhang, 1996). Visualisation of aviation accident events gener-
ally use causal trees to represent the causal relations but there are few empirical
79
Page 92
80 Chapter 7. Synthesised Experiment 2: Preferences and Cognitive Factors
studies on both preference and perception of causality visualisation. Specifically,
we investigate users’ preferences for information visualisation styles and their
perception of causality as required by aviation accident reporting. As the web is
one of the main channels for publishing information of aviation accidents, it is
desirable to know about how people would prefer the causal relations in accident
events to be presented in a website and how they perceive this causality. The
user preference data are useful in the design and re-design of Websites. To elicit
preferences from people, it is useful to have multiple designs for selection and
study the rationale of their design decisions. Automated website synthesis saves
time and effort in building websites for such designs.
Few models and theories are available to address computational website de-
sign. However, if we view websites as a form of information visualisation, we can
borrow some findings from automated diagram design (Kamps, 1999) to serve as
our experiment hypotheses. Some systems for automated diagram design have
incorporated text to enhance user understanding of graphical visualisation (Mit-
tal et al., 1996). This kind of multimodal visualisation should be applicable to
website design. Expressiveness and effectiveness of graphical languages as pro-
posed by Mackinlay (Mackinlay, 1986) are influential to later diagram visuali-
sation models. Since then, source information characteristics (Roth and Mattis,
1990), user-defined task specification (Casner, 1991), and user-defined layout pref-
erences (Mittal et al., 1996) were introduced into various models for automated
diagram design.
This experiment aims to elicit preferences of designers or users about visu-
alisation patterns, particularly the preferences for tables and trees in visualising
causality information. The participants were given interactive tree and table
generators so that they could explore some different ways of presenting causality
information in tables and trees as the visualisation formats. The participants
gave their preference ratings for the available designs, as well as their rationale
(criteria) for their design decisions. The participants were also asked to take four
cognitive tests, which focus on the aspects of visualisation and analogy-making.
The relationships among preference ratings, rationale, and the results of cognitive
tests were studied.
Page 93
7.1. Introduction 81
7.1.1 Preferences: Trees or Tables
It is our goal to see if people would prefer different representations to display the
same information. In this case, we select trees and tables as the options for selec-
tion by users. Tree representations are commonly used to graphically represent
causality in printed documents. The causal relations are normally represented by
arrows or lines connecting causes and effects.
7.1.2 Rationale for Preferences
If people do prefer a representation, it would be interesting to see what rationale or
criteria contribute to their preferences. We categorised common rationale/criteria
mentioned in website design textbooks (Krug, 2000; Nielsen, 2000):
1. easy to learn: the users do not need much time and effort to understand
how it works;
2. more visual: the users can understand through graphical illustrations;
3. more informative: the users can know more details;
4. more scalable: fewer changes are needed to handle more massive informa-
tion;
5. more features represented: less characteristics (important information) are
left out;
6. more suggestive: the users can understand without much guessing; and
7. more flexible: suitable for use in different situations.
As these seven rationales may not cover all possible rationales that are cru-
cial to any particular preference, the experiment participants were asked (un-
prompted) for their rationale before seeing these seven rationales and then they
were asked (prompted) to identify if any of these rationales were similar to their
own rationales. They were also asked if any of their rationales was not covered
by these seven rationales.
Page 94
82 Chapter 7. Synthesised Experiment 2: Preferences and Cognitive Factors
7.1.3 Cognitive Tests
Software designs should reduce users’ cognitive load (Detienne, 2002).We hy-
pothesise that participants prefer one design to other designs partially because
the preferred design suits their cognitive abilities. If this is true, the cognitive
abilities of the participants should be related to their preferences. The rela-
tionships among preferences of trees or tables, the cognitive test results of the
participants, and rationale for their preferences were studied in this experiment.
As it is impossible to test numerous cognitive factors in a single experiment, the
participants were only tested on cognitive styles / abilities of visualisation and
analogy-making, which we guessed were related to visual representations.
7.2 Objectives of the Experiment
The main objectives of this experiment are as follows:
1. To see if there is any different preference for tables or trees in representing
the given information;
2. To see if different preferences are based on different priority in criteria/ra-
tionale;
3. To see if the preferences are related to the cognitive test results; and
4. To see if the importance ratings of design criteria/rationale are related to
cognitive test results.
7.3 Materials and Methods
7.3.1 Participants
Sixty four students from the University of Edinburgh participated in the exper-
iment and received cash (GBP 10) as a reward. They were randomly assigned
to one of the two groups according to a pre-generated random sequence. Each
group had 32 participants. The treatments of these two groups differ in the order
of using table and tree design generators (or simply called designers). All of the
Page 95
7.3. Materials and Methods 83
participants had the computer skills for browsing websites. The experiment took
about 1.5 hours for each participant. No strict time limit was enforced for tasks
except cognitive tests, for which data were automatically collected.
7.3.2 Web Pages
Computational website synthesis provides basic facilities for generating web sites
and their functional components such as menus and breadcrumbs. We just need
to map the information content items to appropriate components in specifications.
For example,
caseList(Cases) → menu(MenuList)
filenames(Cases ,MenuItems ,Filenames)∧menuItemize(MenuItems ,Filenames ,MenuList)
where caseList(Cases) provides a list of cases. The list of cases can be mapped to
menu(MenuList) via the carriers to formulate filenames by adding prefixes and
suffixes to the accident codes and to encode them in compliance with PiLLoW
for presenting the menu shown on each web page. Presentation of accident event
(content) information in visualisation formats (tabular cells or graphical trees)
requires mappings of attributes between the content information and visualisation
formats. One of the major factors affecting the mapping decision is designers’
(and/or users’) preferences.
Our approach to eliciting the designers’ preference is to let the designers ex-
plore the available options and then decide which option is the one they prefer.
For doing this, we give the information of the customised images (representing
specific pieces of information) to a home-made drag-and-drop web component as
parameters so that the users can design their preferred tables (Figure 7.1) and
trees (Figure 7.2) by dragging and dropping the representational images (one at a
time) in a position relative to any specific tiny (1x1 pixels) image dot (invisible).
A drop of the representational image is successful only if it is dropped within
an area of a predefined radius to the anchor image. If a representational image
is dropped outside the specified area, then it will return to its original position.
The repositioning will be activated whenever there is a change (e.g., change of
window size which affects the relative positions of images). A piece of JavaScript
code is generated to feed these parameters to a JavaScript component for image
Page 96
84 Chapter 7. Synthesised Experiment 2: Preferences and Cognitive Factors
Figure 7.1: Exploring options for tabular representation
drag-and-drop management. This approach is simpler (lightweight) than many
other approaches which use sophisticated (heavyweight) Java Applets or Flash
objects to provide drag-and-drop functions.
7.3.3 Data Collection
All input from the participants were collected by standard HTML forms and
CGI (common gateway interface) scripts, which were generated from simpler
specifications for defining variables and variable types (e.g., multi-answers or
long text) and special web page elements. Subsequent minor modifications to the
generated questionnaire forms were only for cosmetic purposes.
Page 97
7.3. Materials and Methods 85
Figure 7.2: Exploring options for tree form representation
7.3.4 Tree and Table Generators
The trees and tables were generated on-the-fly and viewable in a separate window
of the Web browser together with other basic website navigation facilities, e.g.,
menus and hyperlinks. The tables were generated as standard HTML tables while
the trees were generated as DOT diagram specifications for final image rendering
by GraphViz1 on the server side before sending to the client side.
7.3.5 Tasks
Each participant filled in a pre-experiment questionnaire (Appendix B) which col-
lected background information such as their familiarity with the Web and aviation
operations. Then the participants used table and tree designers to express their
preferences between tables and trees in representing a given structure of causality
1http://www.graphviz.org
Page 98
86 Chapter 7. Synthesised Experiment 2: Preferences and Cognitive Factors
information. The order of using table and tree designers were randomly assigned.
Participants assigned to Group A used the tree designer first and then the ta-
ble designer while those in Group B used the table designer first and then the
tree designer. In the designers, the participants used a customised drag-and-drop
facility to design their preferred table and tree patterns. The participants sub-
mitted their preferred visualisation patterns as tables or trees. Their rationale for
their preferred visualisation pattern were collected by a two-part post-experiment
questionnaire. Part A of the questionnaire collected their rationale as the open-
ended answers and their preference ratings of table and tree visualisation. Part
B of the questionnaire collected their ratings of the importance against seven
common preference criteria/rationale. The participants also took timed cognitive
tests, including two (paper folding and surface development) visualisation tests
and two (visual and verbal) analogy-making tests. The visualisation tests were
licensed from the Educational Testing Services of the USA, as provided in a kit of
factor-referenced cognitive tests (Ekstrom et al., 1976). The visual analogy puz-
zles were the same as those selected by Thomas Evans (Evans, 1987) in his study
of visual analogy problems. The verbal analogy test was the sample questions of
the Miller Analogy Test2 (MAT).
7.3.6 Data Analysis
Variables include (1) preference of tables or trees, (2) importance ratings of pref-
erence criteria/rationale, and (3) results of cognitive tests. They were analysed
by Wilcoxon test, Krustal-Wallis test, and Kendall rank correlation test using R3
statistical software (R Development Core Team, 2007) and its µStat package4. P
values less than 0.05 were considered statistically significant.
2http://www.milleranalogies.com3http://www.r-project.org4http://mustat.rockefeller.edu
Page 99
7.4. Results 87
7.4 Results
7.4.1 Background of Participants
There was no significant difference in any background variable between two groups
of participants as measured by the pre-experiment questionnaire (Appendix B)
and analysed by Student’s t-test and Wilcoxon test.
7.4.2 Preferences
Preferences were obtained from the preference ratings about participants’ pref-
erences between tables and trees as the representation of the given information.
The participants rated the strength of their preferences as:
1. strong table preference,
2. moderate table preference,
3. marginal table preference,
4. marginal tree preference,
5. moderate tree preference, and
6. strong tree preference.
Based on the types of preferred representations, binary classification gives two
categories of participants:
• table preferrers, and
• tree preferrers.
The number of participants under these classifications of preferences were counted
as follows:
Page 100
88 Chapter 7. Synthesised Experiment 2: Preferences and Cognitive Factors
Preferences Binary Class. Count
Strong table Table 3
Moderate table Table 14
Marginal table Table 6
Marginal tree Tree 6
Moderate tree Tree 15
Strong tree Tree 20
23 participants preferred tables and 41 participants preferred trees.
7.4.3 Rationales
Seven rationales/criteria were given to the participants to rank using the numbers
1-7. Rank 1 is the most important rationale or criteria in their preference decision.
Rank 7 is the least important one. The summary statistics including median,
mean, and standard deviation (SD) of the overall ranking on the common design
criteria/rationale is as follows:
Rationale Median Mean SD
Easier to learn 3 3.09 2.01
More visual 4 4.06 1.78
More informative 2 2.78 1.86
More scalable 5 4.90 1.42
More features 5 4.86 1.90
More suggestive 4 3.98 2.00
More flexible 5 4.86 1.78
This overall result indicates that the participants found “more informative”
and “easier to learn” as the most important two rationales for their preference
decisions. “More visual” and “more suggestive” were moderately important.
7.4.4 Cognitive Tests
The summary statistics of the test results are as shown in Table 7.1.
The test of surface development visualisation seemed to be difficult to some
participants. The median of the result was 0 and its standard deviation was high.
Page 101
7.4. Results 89
Table 7.1: Cognitive test results
Tests Median Mean SD
Paper folding 5 5.33 2.24
Surface development 0 8.59 11.14
Visual analogy 17 15.89 3.88
Verbal analogy 8 9.97 7.49
7.4.5 Preferences and Rationales
As shown in Table 7.2, the differences in the rankings of the rationale “easier to
learn” among different participants with different strengths of preferences were
found statistically significant by using the Krustal-Wallis test. The difference
between table preferrers’ and tree preferrers’ rankings of the rationale “easier to
learn” was highly statistically significant as indicated by the Wilcoxon test.
Table 7.2: Preferences and rationale
Rationale Preferences Binary Preferences
χ2 P χ2 P
Easier to learn 11.88 0.037 * 9.22 0.002 **
More visual 7.37 0.195 1.60 0.207
More informative 5.10 0.404 1.25 0.264
More scalable 5.07 0.408 1.48 0.225
More features 6.90 0.228 3.84 0.050
More suggestive 7.37 0.194 5.69 0.017 *
More flexible 8.57 0.127 0.23 0.633
* P < 0.05, ** P < 0.01
The significant difference related to the rationale “more suggestive” was only
observed in binary preferences, not in the original classification of preferences and
their strengths.
Page 102
90 Chapter 7. Synthesised Experiment 2: Preferences and Cognitive Factors
Table 7.3 showed the median rankings of rationale for preferences. Table
preferrers found the criterion “easier to learn” to the most important rationale
while the tree preferrers did not.
Table 7.3: Rankings of rationale by different preferrers
Rationale Table Preferrers Tree Preferrers
Median Mean SD Median Mean SD
Easier to learn 1 2.13 1.74 4 3.63 1.96
More visual 3 3.74 1.79 4 4.24 1.79
More informative 3 3.04 1.99 2 2.63 1.80
More scalable 4 4.65 1.27 5 5.00 1.50
More features 6 5.65 0.98 5 4.42 2.14
More suggestive 5 4.78 1.86 3 3.54 1.94
More flexible 5 5.04 1.64 5 4.76 1.87
7.4.6 Preferences and Cognitive Tests
The relationship between the results of visual analogy test and preferences (and
binary preferences) and was highly significant (P < 0.01) according to the Kruskal-
Wallis test (and Wilcoxon test), as shown in Table 7.4. It was highly significant
(P < 0.01) that the participants who performed better in the visual analogy test
preferred trees (Table 7.5).
7.4.7 Rationale and Cognitive Tests
The correlation between the importance rankings of rationale (”easier to learn”
and “more suggestive”) and the result rankings of cognitive tests are statistically
significant (Table 7.6) according to Kendall’s rank correlation test.
The statistically significant rank correlations coefficient (τ) ranged between
around 0.201 - 0.263, which are only low to moderate in strength.
Page 103
7.5. Discussion 91
Table 7.4: Cognitive test results and preferences
Tests Preferences Binary Preferences
χ2 P χ2 P
Paper folding 9.16 0.103 5.10 0.024 *
Surface development 6.09 0.298 0.15 0.697
Visual analogy 16.36 0.006 ** 13.50 0.000 **
Verbal analogy 3.95 0.557 1.14 0.286
* P < 0.05, ** P < 0.01
Table 7.5: Cognitive test results of different preferrers
Tests Table Preferrers Tree Preferrers
Median Mean SD Median Mean SD
Paper folding* 4 4.57 2.04 5 5.76 2.26
Surface development 0 7.61 11.16 0 9.15 11.22
Visual analogy** 16 13.57 5.66 17 17.2 1.14
Verbal analogy 9 9.96 6.47 7 9.98 8.08
* P < 0.05, ** P < 0.01
7.5 Discussion
This study used website synthesis to construct an experimental apparatus for
Lab-on-the-Web. Using this approach we found a significant relationship among
the participants’ preferences, rationale, and cognitive ability test results. Most
(41 out of 64) participants claimed themselves to be tree preferrers. The other
participants (23 out of 64) said they preferred tables. Both table preferrers and
tree preferrers found their preferred representations (tables or trees) more infor-
mative, without significant difference in rankings of this rationale. As the task
given to the participants is to represent information, it is not surprising that the
rationale “more informative” was one of the most important rationale. In further
Page 104
92 Chapter 7. Synthesised Experiment 2: Preferences and Cognitive Factors
Table 7.6: Correlation between rationale and cognitive test results
Tests Easier to learn More suggestive
τ P τ P
Paper folding 0.203 0.039 * -0.050 0.608
Surface development 0.173 0.088 -0.070 0.484
Visual analogy 0.263 0.008 ** -0.201 0.040 *
Verbal analogy 0.006 0.948 0.058 0.532
* P < 0.05, ** P < 0.01
studies, it would be interesting to test whether the participants find the same
rationale justifiable for their preferences when they are given different goals or
under different conditions. This might give us more insights into how different
preferrers perceive information.
To table preferrers, the rationale “easier to learn” was more important than
“more informative”. The rationale “easier to learn” was ranked as the most im-
portant by 13 out of 23 table preferrers, but not so important by tree preferrers.
Tree preferrers ranked the rationale “more suggestive” significantly higher than
the table preferrers did. To table preferrers, tables seemed to be easier to learn
than trees. To tree preferrers, trees were more suggestive than tables. These dis-
crepancies in rationale ranking indicate a perception difference between different
preferrers in perceiving the given tables and trees.
Tree preferrers performed better than table preferrers in some tests of cognitive
factors, particularly the paper folding visualisation test and visual analogy test.
There was no significant difference between table preferrers and tree preferrers in
their performance in other cognitive tests including the surface development vi-
sualisation test and the verbal analogy test. It is plausible that the interpretation
of tree representations requires specific cognitive capabilities such as visualisation
and visual analogy-making; thus, those who do not feel comfortable with these
tasks would prefer tables and highly rank the rationale “easier to learn” for their
table preference.
Page 105
7.5. Discussion 93
Among all participants, there is a statistically significant low-to-moderate
rank correlation between the rankings of the rationale “easier to learn” and the
results of visual analogy test and paper folding visualisation test. The low-to-
moderate rank correlation indicates that the participants who performed better
in such two cognitive tests ranked the rationale “easier to learn” to be less im-
portant. At similar correlation strength, the participants who performed better
in visual analogy test ranked the rationale “more suggestive” to be more impor-
tant. It seems that the visualisation and visual analogy-making abilities of the
participants might play a role in their preferences for tables and trees. Possibly
(although we cannot prove this), table preferrers lack sufficient cognitive capa-
bility to interpret graphical representations like trees; thus, they prefer tables as
they are easier to learn. Tree preferrers would feel more comfortable in mak-
ing visual analogy and find graphical representations like trees suggestive. As
indicated by the low to moderate strengths of correlation in these results, it is
probable that other factors (and other cognitive factors) may be also relevant
to the participants’ preferences. Further studies are required to delineate these
relationships.
In addition to the scientific findings, this experiment demonstrated the techno-
logical significance of computational synthesis in enabling scientific experiments.
This experiment re-used a Website synthesiser (used in the experiment described
in Chapter 6) to generate Websites on the fly so that the designers/users can ex-
plore the design space (see Section 7.3.2). Without using a Website synthesiser,
this experiment would not be possible. Other than computational synthesis, the
most relevant tool is Web content management system but it does not meet the
requirement of this experiment. Apart from its high cost, there is no Web content
management system so flexible as our our Website synthesiser in accepting infor-
mation mappings. This makes Web content management systems inapplicable to
our experiment. Thus, computational synthesis is the only available solution for
this experiment.
Page 106
94 Chapter 7. Synthesised Experiment 2: Preferences and Cognitive Factors
7.6 Chapter Summary
The experiment reported in this chapter found significant relationships between
the participants’ design preference, rationale, and cognitive test performance.
This work also exemplifies the use of a Website synthesiser as an essential instru-
ment enabling the participants to explore different possible designs, which were
generated on the fly, before they selected their preferred designs. Computational
synthesis made this experiment possible.
Page 107
Chapter 8
Significance and Further Work
This thesis presents a new use of computational synthesis for scientific experimen-
tation, particularly synthesis from parameterisable components. We developed
a grammar formalism to integrate useful knowledge representations for specify-
ing the computational synthesis of (1) Websites according to our Simple Web-
site Interface Model (SWiM) and (2) Web-based experiments according to a re-
search script formulated from published empirical psychology research. To test
the method, we used it to obtain scientific findings in novel experiments using
synthetic Websites. This allowed us to conduct the first extensive tests of causal
perception theories on the Web. We also used the Website synthesiser as an in-
strument to allow participants to generate Websites on-the-fly and to find their
own preferred design of Websites to present aviation accident events. Their design
preferences were found to be moderately related to specific cognitive factors in-
cluding visualisation and visual analogy-making. These Web-based experiments,
due to the large amount of labour in constructing a wide variety of Websites,
would not be feasible without using computational synthesis. This chapter sum-
marises the major results and contributions of current research, as well as their
broader significance for computational synthesis, particularly of Websites and
experiments, in scientific experimentation.
95
Page 108
96 Chapter 8. Significance and Further Work
8.1 Contributions
8.1.1 Knowledge Representation
Our style of computational synthesis makes use of an integrative grammar for-
malism (morganic grammars) as described in Chapter 3. Morganic grammars
provide (1) grammatical categories (morgans) with frame-like attribute-value ma-
trices, (2) carriers to specify bridging the conceptual gaps between morgans, and
(3) conditional rewriting.
8.1.2 Website Synthesis
A Simple Website Interface Model (SWiM) was proposed (Chapter 4) to provide
conceptual, structural, and layout frameworks for overall grammatical develop-
ment of Website synthesis. With the framework of SWiM summarising suitable
Website design practices for computational synthesis, Website synthesis should
be easy to learn by Website designers and programmers.
8.1.3 Experiment Synthesis
As a wide-spectrum language, morganic grammars are useful to represent exper-
iments and their materials/instruments. For experiment synthesis, we follow a
result (a research script) from empirical psychology research into how scientists
formulate their experimental research. According to this research script, we can
specify and synthesise computational parts of experiments, particularly specifying
experimental parameters and Web-based materials for experimental treatments
(Chapter 5).
8.1.4 Causal Perception Experiment
We used computational synthesis of Websites and experiments to approach an
important issue of cognitive science, i.e., causal perception based on the covaria-
tion of the information about cause candidates and effects (Chapter 6). By using
aviation accident reporting as a test domain, we found that covariation of the
information is more influential than the rhetorics (e.g., temporal or causal order
Page 109
8.2. Broader Significance 97
in presentation of events) and understandability (e.g., whether the technical ter-
minology is cryptic) to the perception of causality between cause candidates and
effects (accidents). The experiment results (causal ratings) are close to the pre-
dicted results by PowerPC theory. Without Website synthesis, this experiment
would not be affordable in time and effort to provide the necessary combinatoric
Website features. In addition to the scientific significance of this experiment to
cognitive science, this experiment inspired us to develop computational synthesis
for Web-based experiments. It also demonstrated the technological significance of
computational synthesis in making the experiments like this one highly practical
and easily affordable.
8.1.5 Design Preference Experiment
Tables and graphs are two major formats of information presentation, including
the presentation on the Websites. The selection between these two formats is
often subject to the preferences of designers and users. Rationales might explain
a little (but not much) about the subjective preferences. Therefore we seek un-
derstanding from cognitive science. We found significant differences in cognitive
factors (including visualisation and visual analogy-making abilities) between ta-
ble and graphic tree preferrers. The differences in these cognitive factors provide
a possible reason to explain the subjective preferences. Further research into the
relationship between cognitive factors and design preferences would be fruitful.
Without a Website synthesiser, the participants would not be able to explore dif-
ferent mappings between source information and presentation formats. Thus, in
addition to the scientific significance of this experiment to cognitive science, this
experiment demonstrated the technological significance of computational synthe-
sis in making the experiments like this one possible.
8.2 Broader Significance
8.2.1 Facilitating Scientific Experimentation
The present work provides arguments for the necessity of experiment synthesis in
scientific research and evidence for the feasibility of a specific style of experiment
Page 110
98 Chapter 8. Significance and Further Work
synthesis, thus pioneering research into computational synthesis of Web-based ex-
periments. Our use of synthetic Websites and experiments obtained new scientific
findings about the cognitive features of causal perception and design preference.
Synthetic Websites and experiments are more affordable than the Websites
and experiments manually constructed. Morganic grammars provide a more sys-
tematic approach than conventional Web scripting to generate Websites. As
science relies on experimentation to make progress (see Chapter 2), our results in
Website synthesis and experiment synthesis are encouraging to scientists who are
able by this means to do more experiments in a more affordable and systematic
manner. As synthetic experiments are more affordable and formally specified,
reproducibility of the experiments would be easier to achieve.
Following our method, before and during experiment synthesis, scientists must
first find suitable and affordable instruments and experiment toolkits, which are
readily available materials specially designed for experimental purposes. Even if
there are some suitable and affordable instruments and toolkits, it would still be
difficult for scientists to find all required facilities for their creative experiments.
They may need to formulate their own experiments by modifying and recombining
components of past experiments. In special cases, scientists need to invent and
construct their own experiment facilities to meet the experiment requirements.
Morganic grammars may be useful to integrate various components such as hy-
potheses (theoretical constructs), treatments, measurements, experiment units,
experiment design, and data analysis. All these would facilitate experiment syn-
thesis to create new or to reproduce/reuse the materials and protocols of the
experiments already synthesised.
8.2.2 Enabling Technology for Lab-on-the-Web
Ideally an experiment specification based on the initial morgan (e.g., Figure 5.1)
would be used to construct new instruments or setting parameters to control
readily available instruments for treatments, controls, and measurements. In-
struments are essential to experiment synthesis in the Lab-on-the-Web. These
instruments can then be used to model knowledge, provide working knowledge,
and/or conduct measurements (Baird, 2003). The instruments that model knowl-
edge facilitate denotation, demonstration, and/or interpretation of the knowledge.
Page 111
8.3. Further Work 99
The instruments that provide working knowledge perform or exhibit phenomena,
for which there is no adequate theoretical knowledge, regularity, and reliability.
The instruments that conduct measurements collect the data required by exper-
iments. It is expected that the instruments available in the Lab-on-the-Web are
supplied through the Web or are part of the Web itself. The Web can thus serve
as a versatile experimental instrument.
8.3 Further Work
Much more work than this thesis is to be done to facilitate scientific experimen-
tation and to develop Lab-on-the-Web. This section describes some ideas for
improving and then extending the current work.
8.3.1 Formalising Morganic Grammars
Morganic grammars were developed as a pragmatic, integrative knowledge rep-
resentation for representing the transformation rules for Website synthesis and
experiment synthesis. There is overlap between our style of knowledge repre-
sentation and other styles, for example feature-based unification grammars using
attribute-value matrices and conditional rewrites using explicit rewrite rules. For-
malisation of morganic grammars may clarify the differences between morganic
grammars and other knowledge representations, e.g., other grammar formalisms
(including DCGs) and frames/object-oriented representations. The results may
also suggest what kinds of concepts should be better represented by morgans,
rewrites, or carriers.
8.3.2 Experimenting with Rewriting Approaches
We have not yet tried different strategies for rewriting grammar rules. It would
be nice to explore and evaluate different rewriting strategies in formulating Web-
sites and experiments. In addition to pure synthesis, we can experiment with
combined parsing and generation to automate experimentation based on the hy-
potheses specified in grammar rules. This would enable cycles of automated
experimentation as an active learning process.
Page 112
100 Chapter 8. Significance and Further Work
8.3.3 Supporting Hypothesis Formulation
Hypothesis generation is mysterious and it seems there is no promising theory
to help automate it. In psychology, William McGuire has been working on find-
ing heuristics for hypothesis generation (McGuire, 1997). For teaching graduate
students, he also developed a structured (and probably the most sophisticated
so far) questionnaire / worksheet to facilitate hypothesis generation (McGuire,
2004b) and theory construction (McGuire, 2004a). Interestingly, the syntax of
his basic, abstract notation is:
IV → DV
IV → MV
MV → DV
where IV is independent variables, MV is mediating variables, and DV is depen-
dent variables. His notations resemble grammar rules. Morganic grammars may
be useful to specify the parameters (features) to facilitate his theoretical system
of hypothesis generation.
8.3.4 Extending Hypotheses for Further Experiments
Like most of the published psychology and cognitive science experiments, we could
not conduct random sampling with a larger population of subjects. We should
conduct similar (not necessarily the same) experiments to extend our experiments
for understanding causal perception and design preference. For example, we have
not yet investigated whether temporal and causal rhetorics in graphics form would
affect causal perception. We have not yet tested many other cognitive factors
which might be also related to design preference. It would be even better to
use morganic grammars to generate systematic hypotheses and test McGuire’s
heuristics for hypothesis generation.
8.3.5 Communicating for Coordinated Experimentation
We cannot individually do numerous [even if synthetic or computational] exper-
iments using only our personal limited resources and expertise. Collaboration
is necessary for better research. Experiment synthesis alone does not expedite
experimentation in collaborative research. A substantial collaborative research
Page 113
8.3. Further Work 101
project may run extensive experiments which require different resources and ex-
pertise. A single specialised laboratory in the collaborative research may only run
a small number of synthetic experiments. To make a significant contribution to
science, the experiment hypotheses and results must be communicated for coor-
dinated experimentation. Compatible formal languages to support collaborative
knowledge sharing are now being made available, for example the Lightweight
Coordination Calculus (LCC) from the OpenKnowledge1 project might be used
to facilitate coordination among laboratories.
8.3.6 Developing Ontologies of Websites and Experiments
Few ontologies are readily available for use because of the high cost in development
and maintenance of ontologies. In the early stages of our research we developed
an ontology of aviation accident reporting by using Protege 2000 based on the
Harmonisation of European Incident Definition (HEIDI) database schemas. The
ontology, which turned out not to be essential to current research, is as shown
in Figure 8.1. We still believe that, despite the high cost, a more fully devel-
oped ontology of aviation accidents and an ontology of Websites would expedite
the synthesis of aviation accident Websites. Another ontology we would like to
develop through collaboration is an ontology of cognitive science experiments.
As far as we know, there is one for bioinformatics experiments (Soldatova et al.,
2006) but it is not yet widely used. In our experiments, we only have the basic
parameters (variables) for specification. Other aspects such as the instruments
(and their parameters) and data analysis are unavailable. Although the develop-
ment of these kinds of ontologies is now a huge consensual task, it may become
more feasible if many people participate via collaborative development tools.
8.3.7 Sketching for High Fidelity Website Prototypes
Sketching is thought helpful for developing design ideas. For Website design,
a prototyping tool DENIM2 allowing designers to sketch for Website design is
available. It would be interesting to integrate the conceptual models of DENIM
and SWiM. We might be able to apply Website synthesis to rapid prototyping
1http://www.openk.org2http://dub.washington.edu/projects/denim
Page 114
102 Chapter 8. Significance and Further Work
Figure 8.1: Ontology development using HEIDI definitions of aviation accidents
Page 115
8.4. Concluding Remarks 103
of DENIM. Hopefully, designers sketch their preferred Website as a low-fidelity
prototype using a tool like DENIM and then produce high-fidelity prototypes
immediately using Website synthesis.
8.4 Concluding Remarks
The research described in this thesis contributes to our understanding of com-
putational synthesis of Websites and experiments, by which we obtained new
scientific findings. It has a broader significance in facilitating scientific experi-
mentation and enabling the development of Lab-on-the-Web, in which the Web
serves as an experimental instrument and/or interface with various kinds of in-
struments. It also stimulates some plausible ideas for further research into related
areas.
Page 117
Appendix A
Prolog Code for Rewriting
exhaustiveRewrite(Type, Term, FinalTerm) :-
nonvar(Term),
canRewrite(Type, Term), !,
applyRewrite(Type, Term, NewTerm),
exhaustiveRewrite(Type, NewTerm, FinalTerm).
exhaustiveRewrite(Type, Term, FinalTerm) :-
\+ atomic(Term), nonvar(Term),
Term =.. [F|Args], !,
exhaustiveRewriteArgs(Type, Args, FinalArgs),
FinalTerm =.. [F|FinalArgs].
exhaustiveRewrite(_, Term, Term).
exhaustiveRewriteArgs(Type, [Term|T], [NewTerm|R]) :-
exhaustiveRewrite(Type, Term, NewTerm),
exhaustiveRewriteArgs(Type, T, R).
exhaustiveRewriteArgs(_, [], []).
canRewrite(Type, Term) :-
applyRewrite(Type, Term, _).
applyRewrite(Condition, Term, NewTerm) :-
PredCall =.. [Condition, Term, NewTerm], !,
call(PredCall).
105
Page 119
Appendix B
Pre-Experiment Questionnaire
This Appendix contains a pre-experiment questionnaire, which was used in the
first task of the participants in both causal perception experiment (Chapter 6)
and design preference experiment (Chapter 7). This questionnaire aims to get
some ideas about the background experience of participants in using computer
and understanding aviation accidents.
107
Page 120
108 Appendix B. Pre-Experiment Questionnaire
Page 122
110 Appendix B. Pre-Experiment Questionnaire
Page 125
Appendix C
Post-Experiment Questionnaire
(Design Preference)
This Appendix contains Parts A and B of the questionnaire used in design pref-
erence experiment (Chapter 7) after the participants explored different possible
designs. The participants answered the questions of Part A before reading Part
B. This questionnaire asks about the participants’ preference and rationale in
selecting forms of design (tables or trees).
113
Page 126
114 Appendix C. Post-Experiment Questionnaire (Design Preference)
Page 128
116 Appendix C. Post-Experiment Questionnaire (Design Preference)
Page 129
Bibliography
Baird, D. (2003). Thing knowledge: outline of a materialist theory of knowledge.
In Radder, H., editor, The Philosophy of Scientific Experimentation, chapter 3,
pages 39–67. University of Chicago Press.
Barnes, B., Bloor, D., and Henry, J. (1996). Scientific Knowledge: A Sociological
Analysis. The University of Chicago Press.
Bartlett, F. (1995). Remembering: A Study in Experimental and Social Psychol-
ogy. Cambridge University Press, 2nd revised edition.
Basili, V., Shull, F., and Lanubile, F. (1999). Building knowledge through families
of experiments. IEEE Transaction on Software Engineering, 25(4):456–473.
Birnbaum, M. (2004). Human research and data collection via the internet.
Annual Review of Psychology, 55:803–832.
Blackburn, P., van Benthem, J., and Wolter, F., editors (2006). Handbook of
Modal Logic. Studies in Logc and Practical Reasoning. Elsevier.
Boeckx, C. (2006). Generative grammars and modern cognitive science. Journal
of Cognitive Science, 6(1):45–54.
Borwein, J. and Bailey, D. (2003). Mathematics by Experiment: Plausible Rea-
soning in the 21st Century. AK Peters.
Brachman, R. and Levesque, H. (2003). Knowledge Representation and Reason-
ing. Morgan Kaufmann.
Buehner, M. and May, J. (2003). Rethinking temporal contiguity and the judge-
ment of causality: Effects of prior knowledge, experience, and reinforcement
117
Page 130
118 Bibliography
procedure. The Quarterly Journal of Experimental Psychology, 56A(5):865–
890.
Cabeza, D. and Hermenegildo, M. (2001). Distributed WWW programming using
(Ciao-)Prolog and the PiLLoW library. Theory and Practice of Logic Program-
ming, 1(3):251–282.
Campbell, D. and Russo, M. (1999). Social Experimentation. Sage Publications.
Carpenter, B. (1992). The Logic of Typed Feature Structures. Cambridge Univer-
sity Press.
Carpineto, C. and Romano, G. (2004). Concept Data Analysis. John Wiley &
Sons.
Casner, S. (1991). A task-analytic approach to the automated design of graphic
presentations. ACM Transactions on Graphics, 10(2):111–151.
Cavalcanti, J. and Robertson, D. (2000). Synthesis of Web sites from higher level
descriptions. In The Third Workshop on Web Engineering, Amsterdam, The
Netherlands.
Cavalcanti, J. and Robertson, D. (2003). Web site synthesis based on computa-
tional logic. Knowledge and Information Systems, 5(3):263–287.
Cheng, P. and Holyoak, K. (1985). Pragmatic reasoning schemas. Cognitive
Psychology, 17:391–416.
Cheng, P. and Novick, L. (1990). A probabilistic contrast model of causal induc-
tion. Journal of Personality and Social Psychology, 58:545–567.
Chomsky, N. (1980). Rules and Representations. Columbia University Press.
Coolican, H. (1990). Research Methods and Statistics in Psychology. Hodder and
Stoughton.
Copestake, A. (2002). Implementing Typed Feature Structure Grammars. Center
for the Study of Language and Information.
Page 131
Bibliography 119
Cox, D. and Reid, N. (2000). The Theory of the Design of Experiments, volume 86
of Monographs on Statistics and Applied Probability. Chapman and Hall/CRC.
Czarnecki, K. and Eisenecker, U. (2000). Generative Programming: Methods,
Tools, and Applications. Addison-Wesley.
Detienne, F. (2002). Software Design – Cognitive Aspects. Springer-Verlag. I.
Do, H., Elbaum, S., and Rothermel, G. (2005). Supporting controlled experi-
mentation with testing techniques: an infrastructure and its potential impact.
Empirical Software Engineering, 10:405–435.
Ekstrom, R., French, J., and Harmon, H. (1976). Manual for kit of factor-
referenced cognitive tests. Educational Testing Service.
Evans, T. (1987). A heuristic program to solve geometric-analogy problems. In
Readings in computer vision. Morgan Kaufmann.
Falmagne, R. and Gonsalves, J. (1995). Deductive inference. Annual Reviews of
Psychology, 46:525–559.
Feyerabend, P. (1978). Against Method. Verso.
French, J., Ekstrom, R., and Price, L. (1963). Kit of Reference Tests for Cognitive
Factors. Educational Testing Services.
Fugelsang, J., Stein, C., Green, A., and Dunbar, K. (2004). Theory and data in-
teractions of the scientific mind: evidence from the molecular and the cognitive
laboratory. Canadian Journal of Experimental Psychology, 58(2):86–95.
Fugelsang, J. and Thompson, V. (2000). Strategy selection in causal reason-
ing: when beliefs and covariation collide. Canadian Journal of Experimental
Psychology, 54(1):15–32.
Fugelsang, J. and Thompson, V. (2001). Belief-based and covariation-based
cues affect causal discounting. Canadian Journal of Experimental Psychology,
55(1):70–76.
Page 132
120 Bibliography
Fugelsang, J. and Thompson, V. (2003). A dual-process model of belief and
evidence interactions in causal reasoning. Memory & Cognition, 31(5):800–
815.
Fugelsang, J., Thompson, V., and Dunbar, K. (2006). Examining the represen-
tation of causal knowledge. Thinking & Reasoning, 12(1):1–30.
Gallagher, S. (2004). Hermeneutics and the cognitive sciences. Journal of Con-
sciousness Studies, 11(10-11):162–174.
Ganter, B. and Willie, R. (1999). Formal Concept Analysis - Mathematical Foun-
dations. Springer-Verlag.
Garrett, J. (2003). The Elements of User Experience. New Riders.
Gazdar, G. and Mellish, C. (1989). Natural Language Processing in Prolog.
Addison-Wesley.
Gillies, D. (1996). Artificial Intelligence and Scientific Method. Oxford University
Press.
Glymour, C. (2001). The Mind’s Arrows: Bayes Nets and Graphical Models in
Psychology. MIT Press. ISBN 0262072203.
Godfrey-Smith, P. (2003). Theory and Reality. The University of Chicago Press.
Grafen, A. and Hails, R. (2002). Modern Statistics for the Life Sciences. Oxford
University Press.
Griffiths, P. (2006). HTML Dog: The Best Practice Guide to HTML and CSS.
New Riders.
Haack, S. (1995). Evidence and Inquiry. Blackwell.
Haack, S. (2004). Defending Science – Within Reason. Prometheus Books.
Hershey, D., Jacobs-Lawson, J., and Wilson, T. (2006). Research as a script.
In Leong, F. and Austin, J., editors, The Psychology Research Handbook. Sage
Publications.
Page 133
Bibliography 121
Hershey, D., Wilson, T., and Mitchell-Copeland, J. (1996). Conception of the
psychological research process: script variation as a function of training and
experience. Current Psychology, 14:293–312.
Hilton, D. (2002). Thinking about causality: pragmatic, social, and scientific
rationality. In Carruthers, P., Stich, S., and Siegal, M., editors, The Cognitive
Basis of Science, chapter 11, pages 211–231. Cambridge University Press.
Holyoak, K. and Morrison, R., editors (2005). The Cambridge Handbook of Think-
ing and Reasoning. Cambridge University Press.
Holyoak, K. and Spellman, B. (1993). Thinking. Annual Reviews of Psychology,
44:265–315.
Hunt, E. (1989). Cognitive science: definition, status, and questions. Annual
Reviews of Psychology, 40:603–629.
Ioannidis, J. (2005). Why most published research findings are false. PLoS
Medicine, 2(8):e124.
Jin, Y. (1983). On Knowledge. Commercial Press (China).
Jurafsky, D. and Martin, J. (2003). Speech and Language Processing: An Intro-
duction to Natural Language Processing, Computational Linguistics and Speech
Recognition. Prentice-Hall.
Kamps, T. (1999). Diagram Design. Springer-Verlag.
Krug, S. (2000). Don’t Make Me Think: A Common Sense Approach to Web
Usability. New Riders.
Kuhn, T. (1962). The Structure of Scientific Revolutions. University of Chicago
Press.
Lakatos, I. (1977). The Methodology of Scientific Research Programmes. Cam-
bridge University Press.
Lange, R. (2003). Technology as basis and object of experimental practices. In
Radder, H., editor, The Philosophy of Scientific Experimentation, chapter 6,
pages 119–137. University of Chicago Press.
Page 134
122 Bibliography
Laudan, J. (1978). Progress and Its Problems: Towards a Theory of Scientific
Growth. University of California Press.
Leonard, R. and Fontaine, P., editors (2005). The Experiment in the History of
Economics. Routledge.
Leong, F. and Austin, J., editors (2006). The Psychology Research Handbook.
Sage Publications, 2nd edition.
Leung, S. (1993). Basic Gene Grammars and DNA-Chartparser. Master’s thesis,
Department of Artificial Intelligence, University of Edinburgh.
Leung, S., Mellish, C., and Robertson, D. (2001). Basic Gene Grammars and
DNA-ChartParser for language processing of Escherichia coli promoter DNA
sequences. Bioinformatics, 17(3):226–236.
Leung, S. and Robertson, D. (2003). Automated website synthesis. In Linux
Developers’ Conference, Edinburgh, United Kingdom.
Leung, S., Zhang, Y., Robertson, D., and Shaw, P. (2004). A computational
linguistics approach to representation and reasoning of DNA microarray ex-
periments – with applications in medicinal plant and formulation authentica-
tion (poster). In Intelligent Systems for Molecular Biology, Glasgow, United
Kingdom.
Lien, Y. and Cheng, P. (2000). Distinguishing genuine from spurious cause: a
coherence hypothesis. Cognitive Psychology, 40:87–137.
Lovibond, P., Been, S., Mitchell, C., Bouton, M., and Frohardt, R. (2003). For-
ward and backward blocking of causal judgement is enhanced by additivity of
effect magnitude. Memory & Cognition, 31(1):133–142.
Lowry, M. and Duran, R. (1989). Knowledge-based software engineering. In
The Handbook of Artificial Intelligence, volume IV, chapter 20, pages 241–322.
Prentice-Hall.
Lowry, M. and Van Baalen, J. (1997). Meta-amphion: synthesis of efficient
domain-specific program synthesis systems. Automated Software Engineering,
4:199–241.
Page 135
Bibliography 123
Mackinlay, J. (1986). Automatic Design of Graphical Presentations. PhD thesis,
Computer Science Department, Stanford University.
Mandel, D. (2003). Effect of counterfactual and factual thinking on causal judge-
ments. Thinking and Reasoning, 9(3):245–265.
Maxwell, J. (2004). Causal explanation, qualitative research, and scientific inquiry
in education. Educational Researcher, 33(2):3–11.
McDermott, D. (1987). Logic, problem solving, and deduction. Annual Reviews
of Computer Science, 2:187–229.
McGuire, W. (1997). Creative hypothesis generating in psychology: some useful
heuristics. Annual Reviews of Psychology, 48:1–30.
McGuire, W. (2004a). A perspectivist approach to theory construction. Person-
ality and Social Psychology Review, 8(2):173–182.
McGuire, W. (2004b). Perspectivist worksheets for generating a program of re-
search. In Jost, J., Banaji, M., and Prentice, D., editors, Perspectivism in
Social Psychology, pages 319–322. American Psychological Association.
Minsky, M. (1975). A framework for representing knowledge. In Winston, P.,
editor, The Psychology of Computer Vision. McGraw-Hill.
Mittal, V., Roth, S., Moore, J., Mattis, J., and Carenini, G. (1996). Generating
explanatory captions for information graphics. In Proceeedings of the Interna-
tional Joint Conference on Artificial Intelligence, volume 2, Montreal, Canada.
Mizuno, R. (2004). Laboratory (Web-based) Experiments on Basic Cognitive Psy-
chology. Nakanishiya (Japan).
Montgomery, D. (2005). Design and Analysis of Experiments. John Wiley &
Sons, 6th edition.
Muller, P. (2007). Little Boxes: Webseiten gestalten mit CSS. Markt+Technik
Verlag.
Neisser, U. (1976). Cognition and Reality: Principles and Implications of Cogni-
tive Psychology. WH Freeman.
Page 136
124 Bibliography
Nielsen, J. (2000). Designing Web Usability: The Practice of Simplicity. New
Riders.
Oestermeier, U. and Hesse, F. (2000). Verbal and visual causal arguments. Cog-
nition, 75:65–104.
Patzer, G. (1996). Experiment Research Methodology in Marketing: Types and
Applications. Greenwood Press.
Penn, D. and Povinelli, D. (2007). Causal cognition in human and nonhuman
animals: a comparative, critical review. Annual Review of Psychology, 58:97–
118.
Piaget, J. (1971). Biology and Knowledge: An Essay on the Relations Between
Organic Regulations and Cognitive Processes. University of Chicago Press.
Popper, K. (1959). The Logic of Scientific Discovery. Routledge, 2002 edition.
R Development Core Team (2007). R: A Language and Environment for Statis-
tical Computing. R Foundation for Statistical Computing, Vienna, Austria.
Radder, H. (2003). Technology and theory in experimental science. In Radder,
H., editor, Philosophy of Scientific Experimentation, chapter 8, pages 152–173.
University of Chicago Press.
Robertson, D. and Agusti, J. (1999). Software Blueprints: Lightweight Uses of
Logic in Conceptual Modelling. Addison Wesley/ACM Press.
Robertson, D., Bundy, A., Muetzelfeldt, R., Haggith, M., and Uschold, M. (1991).
Eco-Logic: Logic-Based Approaches to Ecological Modelling. MIT Press.
Roth, S. and Mattis, J. (1990). Data characterization for graphic presentation.
In Conference on Human Factors in Computing Systems (CHI).
Ryan, T. (2007). Modern Experimental Design. John Wiley & Sons.
Sahdra, B. and Thagard, P. (2003). Procedural knowledge in molecular biology.
Philosophical Psychology, 16(4):477–498.
Page 137
Bibliography 125
Scaife, M. and Rogers, Y. (1996). External cognition: how do graphical represen-
tations work? International Journal of Human-Computer Studies, 45:185–213.
Shadish, W., Cook, T., and Campbell, D. (2002). Experimental and Quasi-
Experimental Designs for Generalized Causal Inference. Hougton Mifflin.
Shull, F., Basili, V., Carver, J., Maldonado, J., Travassos, G., Mendonca, M., and
Fabbri, S. (2002). Replicating software engineering experiments: addressing the
tacit knowledge problem. In Proceedings of the 2002 International Symposium
on Empirical Software Engineering, pages 7–16.
Shull, F., Mendonca, M., Basili, V., Carver, J., Maldonado, J., Fabbri, J., Travas-
sos, G., and Ferreira, M. (2004). Knwoledge-sharing issues in experimental soft-
ware engineering. Empirical Software Engineering: An International Journal,
9(1):111–137.
Skitka, L. and Sargis, E. (2006). The internet as psychology laboratory. Annual
Review of Psychology, 57:529–555.
Smith, N. (1999). Chomsky: Ideas and Ideals. Cambridge University Press.
Soldatova, L., Clare, A., Sparkes, A., and King, R. (2006). An ontology for a
robot scientist. Bioinformatics, 22(14):464–471.
Sowa, J. (2000). Knowledge Representation: Logical, Philosophical, and Compu-
tational Foundations. Brooks/Cole.
Stary, C. and Peschl, M. (1998). Representation still matters: cognitive en-
gineering and user interface design. Behaviour and Information Technology,
17(6):338–360.
White, P. (2000). Causal attribution and Mill’s methods of experimental inquiry:
past, present and prospect. British Journal of Social Psychology, 19:429–447.
White, P. (2002). Perceiving a strong causal relation in a weak contingency:
further investigation of the evidential evaluation model of causal judgement.
The Quarterly Journal of Experimental Psychology, 55A(1):97–114.
Page 138
126 Bibliography
White, P. (2003). Causal judgement as evaluation of evidence: the use of con-
firmatory and disconfirmatory information. The Quarterly Journal of Experi-
mental Psychology, 56A(3):491–513.
Woodward, J. (2003). Experimentation, causal inference, and instrumental re-
alism. In Radder, H., editor, The Philosophy of Scientific Experimentation,
chapter 5, pages 87–118. University of Chicago Press.
Zhang, J. (1996). A representational analysis of relational information displays.
International Journal of Human-Computer Studies, 45(1):59–74.
Zhang, J. (1997a). Distributed representations as a principle for the analysis of
cockpit information displays. The International Journal of Aviation Psychol-
ogy, 7(2):105–121.
Zhang, J. (1997b). The nature of external representations in problem solving.
Cognitive Science, 21(2):179–217.