1 of 105 Michigan PFAS 2019 Scientific and Policy Assessment for Addressing Per- and Polyfluoroalkyl Substances (PFAS) in Drinking Water Anna Reade, Ph.D. Staff Scientist Natural Resources Defense Council Tracy Quinn, P.E. Senior Policy Analyst Natural Resources Defense Council Judith S. Schreiber, Ph.D. Schreiber Scientific, LLC Contributing Author Risk Assessment and Toxicology March 15, 2019
Transcript
1 of 105
Michigan PFAS 2019
Scientific and Policy Assessment for Addressing Per- and
Polyfluoroalkyl Substances (PFAS) in Drinking Water
Box 10: Maximum Contaminant Level Goals for Carcinogens ................................................... 61
Box 11: Regulating Classes in Tap Water - The PCB Precedent ................................................. 64
5 of 105
EXECUTIVE SUMMARY
Over the past few decades per- and poly-fluoroalkyl substances (PFAS) contamination has
grown into a serious global health threat. PFAS are a large class of several thousand chemically-
related synthetic chemicals that are widely used for their water- and oil-repellant properties in a
variety of industrial processes and consumer goods. A defining feature of PFAS is their carbon-
fluorine bonds, which impart high thermal stability and resistance to degradation. PFAS are also
highly mobile in the environment and many have been found to bioaccumulate, or build up, in
humans and animals. People are concurrently exposed to dozens of PFAS chemicals daily
through their drinking water, food, air, indoor dust, carpets, furniture, personal care products, and
clothing. As a result, PFAS are now present throughout our environment and in the bodies of
virtually all Americans.
PFAS are associated with many serious health effects such as cancer, hormone disruption, liver
and kidney damage, developmental and reproductive harm, changes in serum lipid levels, and
immune system toxicity - some of which occur at extremely low levels of exposure.
Additionally, because PFAS are chemically related, they may have additive or synergistic effects
on target biological systems within our bodies.
Despite the known health impacts and known contamination in people’s homes and in the
environment, no enforceable national drinking water standards have been set. The few, mostly
non-enforceable, advisories or guidelines that do exist at the federal and state levels are mainly
for perfluorooctanoic acid (PFOA) and perfluorooctane sulfonic acid (PFOS). PFOA and PFOS
are the most extensively studied PFAS to-date and, as such, their toxicity has been well
characterized in humans and animal models. Although the database for other PFAS is not as
robust as for PFOA and PFOS, evidence is growing quickly that indicates they collectively pose
similar threats to human health and the environment, often at exceedingly low doses. These
toxicity data, combined with concerns over their similar environmental mobility and persistence
and widespread human and environmental exposure, have led independent scientists and other
health professionals from around the globe to express concern about the continued and
increasing production and release of PFAS.
Michigan is currently facing a PFAS contamination crisis. In response to growing concern over
PFAS contamination in the state, Michigan has performed extensive testing for certain PFAS.
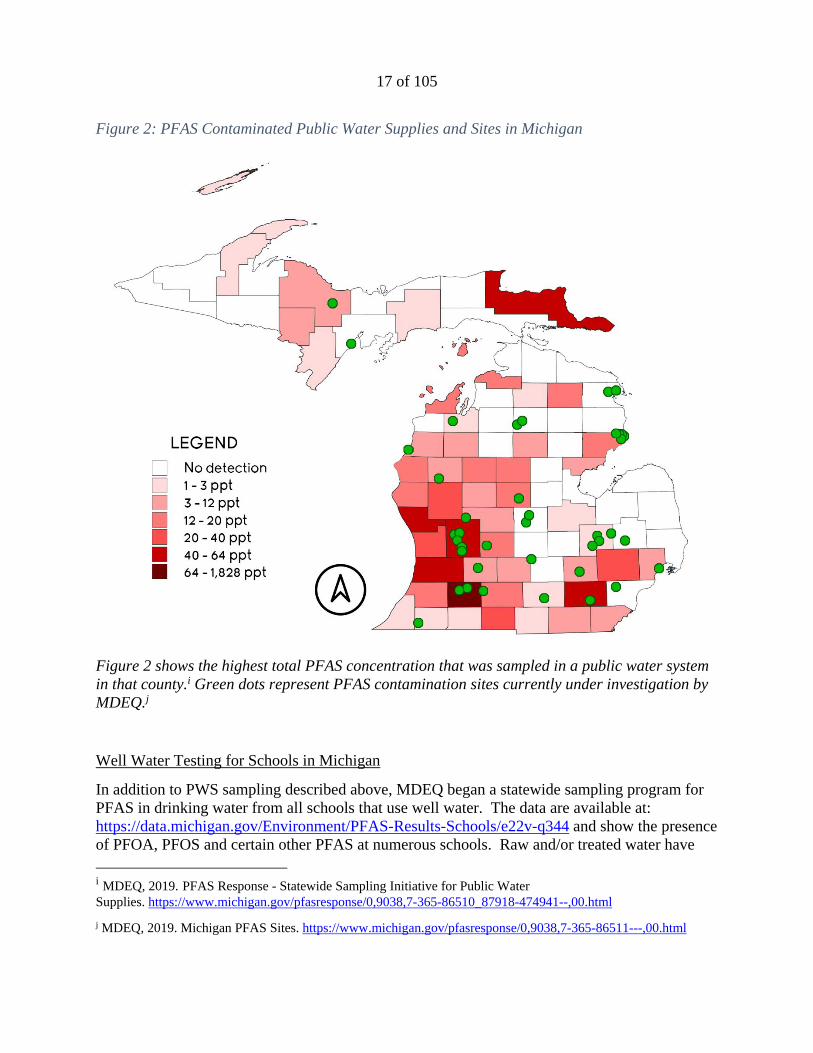
The data show that PFAS have been detected in more than 100 public water systems. As of
February 26, 2019, at least 162 unique samples from water systems tested positive for at least
one tested PFAS contaminant, with concentrations ranging from 2 to 1,828 parts per trillion
(ppt). However, small private water systems and private wells not serving schools are not tested
under the state’s program. Therefore, the full extent of Michigan’s PFAS contamination crisis is
still unclear.
The purpose of this report is to provide relevant scientific information which will help Michigan
make informed decisions about how to protect its citizens. This report discusses the most critical
health effects known to be associated with PFAS, the risk of additive/synergistic effects from
concurrent exposure to multiple PFAS, existing or proposed standards and advisories, and
6 of 105
detection and treatment technologies available. Special attention has been given to comparing
and analyzing existing or proposed standards and advisories, from which our recommendations
arise. For this analysis, we focused on PFOA and PFOS, and two additional PFAS,
perfluorononanoic acid (PNFA), and perfluorohexane sulfonic acid (PFHxS), because the
Agency for Toxic Substances and Disease Registry has generated minimal risk levels for all four.
GenX chemicals, used as a replacement for PFOA, were also analyzed in this report, as their
toxicity was recently assessed by the US Environmental Protection Agency (EPA).
Our analysis of current literature and standards/advisories for PFOA, PFOS, PFNA, PFHxS, and
GenX show that existing standards and advisories are not health protective. Importantly,
Michigan’s PFAS Science Advisory Panel also concludes that, “the research supports the
potential for health effects resulting from long term exposure to drinking water with
concentrations below 70 ppt” (the EPA’s lifetime health advisory for PFOA and PFOS). If
toxicity assessments were based on the most sensitive health effect, protective of the most
vulnerable population, and fully acknowledged uncertainties in the toxicity assessment process,
maximum contaminant level goals (MCLGs)a, which are to be set at a level fully protective of
human health, would range from 0 to 2 ppt for drinking water. As technology for detection and
water treatment do not currently allow for the complete removal of PFAS from drinking water,
maximum contaminant levels (MCLs)b for PFOA, PFOS, PFNA, PFHxS, and GenX should be
based on the best detection and treatment technologies available. Our review of detection and
treatment capabilities suggests, a combined MCL of 2 ppt is feasible for PFOA, PFOS, PFNA,
and PFHxS, with a separate MCL of 5 ppt for GenX.
However, we conclude that setting a MCLG of zero for the class is needed to provide an
adequate margin of safety to protect public health from a class of chemicals that is characterized
by extreme persistence, high mobility, and is associated with a multitude of different types of
toxicity at very low levels of exposure. If only a handful of PFAS are regulated, there will be
swift regrettable substitution with other, similarly toxic PFAS - creating an ongoing problem
where addressing one chemical at a time incentivizes the use of other toxic chemicals and we fail
to establish effective safeguards to limit this growing class of dangerous chemicals.
The problems with PFAS as a class are highlighted by the fact that many complex PFAS have
the potential to break down into less complex perfluoroalkyl acids (PFAAs), a subgroup of PFAS
that includes PFOA and PFOS, for which there are substantial known health risks. These
problems are compounded by the fact that the production of certain PFAS, such as
fluoropolymers, requires the use of PFAAs in their manufacture. This use increases total PFAA
a An MCLG is the maximum level of a contaminant in drinking water at which no known or anticipated adverse
effect on the health of persons would occur, allowing an adequate margin of safety. MCLGs are non-enforceable
health goals and consider only public health and not the limits of detection and treatment technology effectiveness. b An MCL is the legal threshold of the amount of a chemical that is allowed in public water systems under the Safe
Drinking Water Act. An MCL is based on the concentration established by its corresponding MCLG, but may be
adjusted up for feasibility reasons, reflecting difficulties in measuring small quantities of a contaminant, or a lack of
available, adequate treatment technologies.
7 of 105
contamination and exposure through industrial discharge, as was seen with the production of
Teflon®, as well as through impurities in PFAS-containing products.
At present, there is no single methodology for isolating, identifying, and quantifying all PFAS
compounds in drinking water. We recommend that the state explore an analytical method, such
as total oxidizable precursor assay (TOPA)c, or combination of methods, that can be used as a
surrogate for total PFAS. Until a comprehensive analytical method has been approved to
quantify PFAS compounds as a class, we recommend reverse osmosis, or other treatment method
at least as effective as reverse osmosis, as a treatment technique – an enforceable treatment
procedure to ensure contamination control - for public water supplies. Reverse osmosis is the
preferred treatment technology because it has been demonstrated to effectively remove a broad
range of PFAS compounds, it is the most robust technology for protecting against unidentified
contaminants, and it does not require frequent change out of treatment media or release elevated
concentrations of pollutants after media is spent. We recommend Michigan evaluate the safest
disposal method for high-strength waste streams and spent/used membranes, and that disposal
require full destruction of PFAS compounds before entering the environment.
In summary, this report finds that the current available scientific evidence supports the
need for:
1) comprehensive testing of drinking water;
2) a maximum contaminant level goal of zero for total PFAS;
3) a combined maximum contaminant level of 2 parts per trillion (ppt) for PFOA, PFOS,
PFNA, and PFHxS, and a maximum contaminant level of 5 ppt for GenX; and
4) the setting of a Treatment Technique – an enforceable treatment procedure to ensure
contamination control – for the PFAS class based on the best available detection and
treatment technologies.
c TOPA estimates the full array of potential polyfluoroalkyl acid (PFAA) precursors in a sample. TOPA replicates
what micro-organisms in the environment would achieve after many years by rapidly converting precursors into
PFAAs such as PFOA, using a hydroxyl radical-based chemical oxidation method.
8 of 105
INTRODUCTION
Per- and poly-fluoroalkyl substances (PFAS) are synthetic chemicals that are widely used in a
variety of industrial processes and consumer goods. The carbon-fluorine bonds in PFAS impart
high thermal stability and resistance to degradation. While useful chemicals, PFAS are highly
resistant to environmental degradation and persist in the environment. As a result, PFAS are now
present throughout our environment and in the bodies of virtually all people.
PFAS have been associated with a wide variety of adverse health effects including cancer,
hormone disruption, liver damage, developmental harm, and immune system toxicity - some of
which occur at extremely low levels of exposure. PFAS are widely prevalent in drinking water
sources across the country, including in Michigan. Consequently, there is an urgent need to take
action to address this growing health threat. Yet, there are still no enforceable regulations for
PFAS in drinking water at the federal level, and very few regulations addressing PFAS in
drinking water at the state level.
In response to Michigan’s PFAS contamination crisis in its drinking water, this report provides a
summary of relevant scientific information on PFAS, including information on PFAS exposure,
their effects on human health, and how existing or proposed standards and advisories have been
developed. Based on this information, we make recommendations on how Michigan can protect
the health of its citizens by addressing PFAS contamination in its drinking water.
This report is organized into six parts: Part I is an introduction to the PFAS class of chemicals.
Part II provides an overview of the widespread presence of PFAS in drinking water and in
people. Part III discusses the health risks associated with PFAS exposure. Part IV compares and
analyzes existing health thresholds set or recommended for levels of certain PFAS (PFOA,
PFOS, PFNA, PFHxS and GenX chemicalsd). Part V provides an overview of
detection/analytical methods and treatment technologies for PFAS removal from water. Part VI
offers conclusions and recommendations on how Michigan can address PFAS contamination in
its drinking water.
PART I: WHAT ARE PFAS
PFAS are a large class of synthetic fluorochemicals that are widely used for their water- and oil-
repellant properties. PFAS can be found in consumer products such as non-stick cookware,
clothing, leather, upholstery, and carpets; in paints, adhesives, waxes and polishes; in aqueous
d As explained by the U.S. Environmental Protection Agency, “GenX is a trade name for a processing aid
technology developed by DuPont (now Chemours). In 2008, EPA received new chemical notices under the Toxic
Substance Control Act from DuPont (which is now Chemours) for two chemical substances that are part of the
GenX process (Hexafluoropropylene oxide (HFPO) dimer acid and the ammonium salt of HFPO dimer acid).” See
EPA, GenX Chemicals Studies, available online at https://www.epa.gov/pfas/genx-chemicals-studies, visited
been sampled for PFOA, PFOS and certain PFAS at 461 schools and 150 childcare centers/Head
Start programs. As of February 26, 2019, at least 28 schools tested positive for PFOA and PFOS
in drinking water, with concentrations ranging from 2 ppt to 119 ppt, and 60 schools tested
positive for total PFAS (of the PFAS contaminants tested), with concentrations ranging from 2 to
182 ppt. These results are of particular concern, as schools serve drinking water to the most
vulnerable populations – children and women who are pregnant or of child-bearing age.
The above data show that there is a serious PFAS contamination crisis affecting Michigan.
However, gaps in our knowledge remain. Private water systems serving no more than 25 people,
and having no more than 15 service connections, and most private wells, are not tested under the
state’s program. Site investigations performed by MDEQ show significant contamination not
always reflected by PWS data. For example, although here are there are two contamination sites
in Alpena county, no detections were reported for PWS within the county. Furthermore, in Iosco
county there was one detection at 14 ppt for total PFAS, however there are 7 contamination sites
within the Oscoda community in Iosco county. For groundwater in Oscoda, 51% (373/736) of
samples had combined levels of PFOA and PFOS between detection levels and EPA’s health
advisory level of 70 ppt and 36% (268/736) of samples tested above 70 ppt. Further rounds of
testing should be performed to account for testing variability and to ensure no additional
discharges of PFAS are occurring. Additionally, the state should offer drinking water testing of
private water systems and private wells in or proximate to areas where elevated PFAS levels
have been identified, in addition to the school wells already tested under the program.
Furthermore, at present, the state only publicly reports concentrations for PFOA and PFOS
combined and for total PFAS detected in drinking water systems; MDEQ should publicly report
unique values for detected levels of all tested PFAS.
Biomonitoring in Michigan
Although drinking contaminated water has been found to result in elevated blood serum
concentrations, blood serum monitoring results are not available which relate Michigan drinking
water levels of PFAS with blood serum levels in people. A newly planned study may provide
information to help fill this need. In November 2018, the Michigan Department of Health and
Human Services and the Kent County Health Department announced it would be conducting
blood testing for up to 800 people in the Kent County area where many drinking water sources
are contaminated.43 The sampling effort will evaluate drinking water sources and participant
blood samples for suite of 24 PFAS. These results will be compared to blood serum
concentration averages in people not exposed to these sources. Invited study participants began
providing blood samples beginning in December 2018. A report of the results will not be
available until roughly a year from now, although some sampling results will be available in two
to four months. A similar study is being considered for the Parchment, MI area.
There have been some isolated reports of PFAS in the blood of people in Michigan. Wood TV
reported that exceptionally high blood serum concentrations were found in several individuals in
areas where drinking water is known to be contaminated.44 For example, a child was reported to
19 of 105
have a blood serum level of 484,000 ppt PFAS, and a woman was reported to have 5 million
ppt.44 The specific PFAS identified were not provided. Both live near Wolverine’s former
tannery site in Rockford, MI.
PART III: HEALTH RISKS ASSOCIATED WITH EXPOSURE TO PFAS
There is a sufficiently robust body of scientific research to evaluate the adverse health effects of
several PFAS, with the most highly studied being PFOA, PFOS, PFNA and PFHxS. Both human
studies and animal studies should be used to evaluate adverse effects of chemical exposures (see
Box 8 for further discussion). Animal and human studies show similar adverse effects and cancer
risks.
Due to the structural similarity and the co-occurrence of PFOA and PFOS in the environment
and in people, public health protection and guidance usually address both PFOA and PFOS. In
June 2018, minimal risk levels were also generated by the Agency for Toxic Substances and
Disease Registry (ATSDR) for PFNA and PFHxS, which are chemically related and often co-
occur with PFOA and PFOS.5 In November of 2018, the EPA released human health toxicity
values (reference doses) for PFBS and hexafluoropropylene oxide (HFPO) dimer acid and its
ammonium salt, also known as GenX chemicals.23,24 PFBS is a replacement chemical for PFOS
and GenX is a replacement technology for PFOA, and both were found to be associated with a
variety of adverse health effects. Considerably less information is available for the larger group
of PFAS, however, as stated above, due to the structural similarity of these contaminants, it is
expected that many PFAS will have similar health effects. 2,13,14
Several reviews of the scientific literature on the health effects associated with PFAS exposure
have recently been published.1,2,5,14,15,45,46,47 ATSDR has performed the most recent and
comprehensive review. This review is summarized below, as an overview of health effects
associated with PFAS exposure. This summary is followed by sections that discuss in further
detail cancer risk and two of the most common and sensitive health effects for PFAS,
development harm and immunotoxicity. Understanding these health effects is particularly
important to determining how to best protect the public from PFAS contamination.
ATSDR Draft Toxicological Profile for Perfluoroalkyls
ATSDR performs risk assessment and evaluation of chemicals as part of the U.S. Centers for
Disease Control and Prevention (CDC). ATSDR released a draft Toxicological Profile for
Perfluoroalkyls in June 2018.5 The toxicological profile on perfluoroalkyl compounds included
the suite of chemicals in that group that have been measured in the blood serum collected as part
of the NHANES 2003-2004 survey, and other monitoring studies. The 14 perfluoroalkyl
compounds included in the toxicological profile are:
Perfluorobutyric acid (PFBA, CAS 375-22-4)
20 of 105
Perfluorohexanoic acid (PFHxA, CAS 307-24-4)
Perfluoroheptanoic acid (PFHpA, CAS 375-85-9)
Perfluorooctanoic acid (PFOA, CAS 335-67-1)
Perfluorononanoic acid (PFNA, CAS 375-95-1)
Perfluorodecanoic acid (PFDeA, CAS 335-76-2)
Perfluoroundecanoic acid (PFUA, CAS 2058-94-8)
Perfluorododecanoic acid (PFDoA, CAS 307-55-1)
Perfluorobutane sulfonic acid (PFBS, CAS 375-73-5)
Perfluorohexane sulfonic acid (PFHxS, CAS 355-46-4)
Perfluorooctane sulfonic acid (PFOS, CAS 1763-23-1)
Perfluorooctane sulfonamide (PFOSA, CAS 754-91-6)
2-(N-Methyl-perfluorooctane sulfonamide) acetic acid (Me-PFOSA-AcOH, CAS 2355-31)
2-(N-Ethyl-perfluorooctane sulfonamide) acetic acid (Et-PFOSA-AcOH, CAS 2991-50-6)
ATSDR provided an exhaustive assessment of these 14 PFAS in their Toxicological Profile for
Perfluoroalkyls. Their assessment found that there is consistent association between PFAS
exposure and several health outcomes. The table (Table 3) below summarizes health effects
ATSDR found linked to the 14 PFAS reviewed in the profile.
Table 3: Summary of ATSDR’s Findings on Health Effects from PFAS Exposure
Immune
e.g. decreased
antibody response,
decreased
response to
vaccines,
increased risk of
asthma diagnosis
Developmental &
Reproductive
e.g. pregnancy-induced
hypertension/pre-
eclampsia, decreased
fertility, small decreases
in birth weight,
developmental toxicity
Lipids
e.g. increases in
serum lipids,
particularly total
cholesterol and low-
density lipoprotein
Liver
e.g. increases
in serum
enzymes and
decreases in
serum
bilirubin
levels
Endocrine
e.g. increased
risk of thyroid
disease,
endocrine
disruption
Body
Weight
e.g. decreased
body weight
Blood
e.g. decreased red
blood cell count,
decreased
hemoglobin and
hematocrit levels
PFOA
PFOS
PFHxS
PFNA
PFDeA
PFDoA
PFUA
PFHxA
PFBA
PFBS
Table 3 summarizes ATSDR’s findings on the associations between PFAS exposure and health
outcomes in human and animal studies (not an exhaustive list of health outcomes).
21 of 105
ATSDR determined that there was sufficient data to support generating minimal risk levels for
PFOA, PFOS, PFNA, and PFHxS. Our maximum contaminant level recommendations are, in
part, based on these minimal risk levels, which is discussed in Part III of this report.
Cancer Risks from PFOA, PFOS, PFNA, PFHxS, and GenX Exposure
Chemical exposures that contribute to an increase in cancer risk have a significant impact on
public health. As the National Cancer Institute states, “the years of life lost due to premature
deaths, the economic burden due to lost productivity and the costs associated with illness and
therapy, and the long-term effects of cancer and its treatment on the quality of life of survivors
take a toll at a population level.”48
Toxicological studies in humans and animals have found associations between increased cancer
risk and PFOA and PFOS exposure, and several authoritative bodies have made findings on their
carcinogenic potential. PFNA, PFHxS, and GenX are less well studied, however, their chemical
similarity to PFOA and PFOS and the data that is available suggests that there is reason to be
concerned about increased cancer risk.
PFOA and PFOS
Carcinogens are chemicals that cause cancer. The C8 Science Panelk has identified PFOA as a
probable carcinogen15, and the International Agency for Research on Cancer (IARC) has
classified PFOA as a possible49 carcinogen. The EPA Science Advisory Board and the EPA
Office of Water have concluded that PFOA and PFOS demonstrate likely50 or suggestive3
evidence of carcinogenic potential, respectively.
From 2005-2013 the C8 Science Panel determined blood levels and collected health information
from communities in the Mid-Ohio Valley that had been potentially affected by the release of
PFOA emitted from a DuPont plant since the 1950s.15,51,52 They then assessed the links between
PFOA exposure and a number of diseases. Based on epidemiologic and other data available to
the C8 Science Panel, they concluded that there is a probable link between exposure to PFOA
and testicular and kidney cancer (as well as high cholesterol, ulcerative colitis, thyroid disease
and pregnancy-induced hypertension). Because these studies relied largely on a survivor cohort,
results regarding associations with PFOA may be biased toward the null (i.e. a greater chance of
failing to identify an association) for highly aggressive cancers like pancreatic, lung and kidney
cancers, which should not be ruled out based on this study. These studies also found weak
associations between Non-Hodgkin lymphoma and ovarian and prostate cancers.
k The C8 Science Panel was established as a result of a class action lawsuit against DuPont and charged with
assessing probable links between PFOA (also called C8) exposure and disease in communities near the DuPont
Washington Works plant in Parkersburg, West Virginia.
22 of 105
IARC, the specialized cancer agency of the World Health Organization, has classified PFOA as
“possibly carcinogenic to humans” (Group 2B) based on limited evidence that PFOA causes
testicular and renal cancer, and limited evidence in experimental animals.”49 IARC considers
human, animal, and mechanistic data in making its determinations of evidence for cancer risk to
humans. The human data considered by IARC in making this determination included increases in
cancer among highly exposed members of the C8 Health Project study population51,52 discussed
above, and among workers in the DuPont Washington Work plant in Parkersburg, WV.53
Researchers studied the mortality of 5,791 workers at the DuPont chemical plant in Parkersburg,
West Virginia from 1952-2008. The authors found exposure-response relationships with PFOA
for chronic renal disease, both malignant and non-malignant.53
The EPA Office of Water concluded that there is suggestive evidence of carcinogenic potential
of PFOA in humans.3 This conclusion was based on Leydig cell testicular tumors in rats, and the
reported probable link to testicular and renal tumors among the members of the C8 Health
Project. EPA also concluded that there is suggestive evidence of carcinogenic potential of PFOS
in humans based on liver and thyroid adenomas observed in a chronic rat bioassay.28,54
Cancers other than kidney and testicular cancer have also shown positive associations in studies
of occupational exposure, though they have not reached statistical significance. One study
reported a non-significant positive association between PFOA and prostate cancer in employees
of DuPont in West Virginia.55 Another study reported modestly elevated risk of prostate and
bladder cancer in employees of 3M in Minnesota.56
Two small studies of the Inuit population in Greenland found significantly increased risk of
breast cancer associated with certain PFAS, including PFOA and PFOS,57 and a greater elevated
odds ratio for breast cancer in women with both high PFAS levels and specific genetic variations
that affect levels of hormones such as estrogens.58 A later, larger study evaluated the association
between PFAS serum levels in pregnant Danish women and the risk of premenopausal breast
cancer.59 This study did not find convincing evidence establishing a causal link between PFAS
exposures and increased risk of breast cancer 10 to 15 years later. These data suggest the need
for further research on this topic, especially considering the effects PFAS exposure can have on
mammary gland development (see Box 6).
While there have been some studies that do not support a relationship between PFAS exposure
and cancer, those studies have notable limitations. For example, New York State Department of
Health (NYSDOH) conducted an evaluation of cancer occurrence in the Hoosick Falls
population where residents’ blood serum median levels were 23,500 ppt.60 In that study, no
relationship was found between PFOA exposure and testicular, kidney, prostate or bladder
cancer. However, studies of community exposures have inherent limitations and are difficult to
evaluate in low number populations. As noted by NYSDOH, limitations of this study include
small population and incomplete inclusion of the potentially exposed populations.
PFNA, PFHxS, and GenX
23 of 105
PFNA and PFHxS have been studied to a lesser degree than PFOA and PFOS. One study
reported a significantly higher risk for prostate cancer among subjects with a hereditary risk and
blood serum PFHxS levels above the median, finding a significant odds ratio of 4.4 (1.7-12).61
An increased, though non-significant, odds ratio of 2.1 (1.2-6.0) was also reported among
subjects with a hereditary risk for prostate cancer and blood serum PFNA levels above the
median.
Researchers evaluated participants in the C8 Health studies for associations between PFNA and
PFHxS and elevated serum levels of prostate-specific antigen, a biomarker that can be used to
screen for prostate cancer.62,63 Their findings were non-significant, however, one limitation with
this study is that changes in prostate-specific antigen levels are not exclusively due to cancer but
can also be attributed to other factors such as prostate inflammation, urinary retention, local
trauma and increase in age.
In EPA’s draft toxicity assessment of GenX, the EPA determined that “there is Suggestive
Evidence of Carcinogenic Potential of oral exposure to GenX chemicals in humans, based on the
female hepatocellular adenomas and hepatocellular carcinomas and male combined pancreatic
acinar adenomas and carcinomas [in rats].”23 The EPA also notes that evidence suggest that
mice are more sensitive to the effects of GenX than rats, and that a lack of data evaluating cancer
in mice is a database deficiency. There are currently no studies evaluating cancer risk from GenX
exposure in humans.
Further research is needed to understand the relationship between PFOA and PFOS exposure and
various cancers other than kidney and testicular cancer, such as prostate, bladder, ovarian and
breast cancer, which have limited, but suggestive evidence for association with PFAS exposure.
Additionally, more research is needed to understand the carcinogenic potential of other PFAS,
which, due to similar chemical characteristics to PFOA and PFOS, are likely to also increase the
risk for certain cancers.
Risks to Fetal Development and the Young
Developing infants and children are particularly susceptible to the impacts of exposure to toxic
chemicals. The impacts of PFAS exposure on fetal development and the young have been
studied in both humans and animals. These studies find similar and profound adverse health
effects.
Since infants and children consume more water per body weight than adults, their exposures may
be higher than adults in communities with PFAS in drinking water. In addition, the young may
also be more sensitive to the effects of PFAS due to their immature developing immune system,
and rapid body growth during development.1,5,64,65,66 Exposure to PFAS before birth or in early
childhood may result in decreased birth weight, decreased immune responses, and hormonal
effects later in life.
24 of 105
Recent literature has identified developmental effects of significance from exposure to PFAS.
For a review of effects on children from PFAS exposure, sixty-four studies were evaluated for
six categories of health outcome: immunity, infection, asthma, cardio-metabolic,
neurodevelopmental/attention, thyroid, renal, and puberty onset.66 The review found evidence of
later age at menarche (menstruation), effects on renal function and lipid serum levels, and
immunotoxicity (asthma and altered vaccine response).
A particularly significant developmental effect linked to PFAS exposure is alterations to
mammary gland development. Prenatal exposure of mice to PFOA results in delays in mammary
gland development in offspring of treated females, including reduced ductal elongation and
branching, delays in timing and density of terminal end buds (developmental structures
important for forming proper mammary gland ductal structure), and decreases in mammary
epithelial growth.67,68,69 These studies found that PFOA-induced effects on mammary tissue
occur at extremely low doses - much lower than effects on liver weight. Due to the low-dose
sensitivity of mammary glands to PFOA in mice, a no-observable adverse effect level for
mammary gland developmental delays could not be determined. In other words, the studies
found that all dose levels were associated with effects on mammary gland development. (see Box
6 for a discussion on the biological relevance of altered mammary gland development)
Risk to Immune System Function
Evidence from both animal and human studies suggest that the immune system is also highly
sensitive to PFAS exposure. For instance, immunotoxicity is currently the most sensitive health
endpoint identified for PFOS exposure and occurs at doses at least an order of magnitude less
than other health endpoints. As documented in the ATSDR profile, both animal and
epidemiology studies provide strong evidence linking PFAS exposure to immunotoxic effects.5
The strongest evidence of the PFAS-associated immunotoxicity in humans comes from
epidemiology studies finding associations evaluating the antibody response to vaccines.5
Associations have been found for PFOA, PFOS, PFHxS, and PFDeA; with limited evidence for
PFNA, PFUA, and PFDoA. Increases in asthma diagnosis and effects on autoimmunity,
specifically ulcerative colitis, have also been linked to PFAS exposure. Animal studies suggest
the immune system is a highly sensitive target of PFAS-induced toxicity; observed effects
include impaired responses to T-cell dependent antigens, impaired response to infectious disease,
decreases in spleen and thymus weights, and in the number of thymic and splenic
lymphocytes.5,23
25 of 105
The immunotoxic effects of PFAS could
have significant detrimental impacts on
public health. For example, PFAS is
associated with reduced antibody titer
rise in response to vaccines,5,70 resulting
in increased risk of not attaining the
antibody level needed to provide long-
term protection from serious diseases
such as measles, mumps, rubella, tetanus
and diphtheria. PFAS can also be
transferred to fetuses in utero, and to
infants via breast milk71 or PFAS-
contaminated infant formula, which
presents a particular hazard to the
adaptive immune system during this
critical window of development. As noted
by the Michigan PFAS Science Advisory
Panel, “the developing immune system is
especially sensitive to environmental
stressors… Disruption of immune
development is likely to have broader
impacts than the antibody changes that
are directly measured in these studies
and may have long lasting
consequences.”26
Short-chain PFAS
Short-chain PFAS (less than six or seven carbons, depending on the PFAS subclass) have been
introduced as ‘safer’ alternatives due to their supposed shorter half-lives in humans, but little
research is publicly available on the toxic effects related to exposure, retention, and persistence.
The evidence that does exist suggests short-chain PFAS are associated with similar adverse
health effects as the long-chain, legacy PFAS that they have replaced.72,73 Importantly, short-
chain PFAS are still highly persistent and are even more mobile in the environment than long-
chain PFAS.74
Some short-chain PFAS are not detected frequently or detected at low levels in human blood;
therefore, some industry groups have claimed that short-chain PFAS are readily eliminated from
the body. However, recent research does not support this conclusion. Short-chain PFAS are
found to accumulate in
In 2016, the National Toxicology Program
conducted a systematic review to evaluate
immunotoxicity data on PFOA and PFOS. It
concluded that both are presumed to constitute
immune hazards to humans based on a high level
of evidence that they suppress antibody response
in animal studies and a moderate level of evidence
from studies in humans. They also identified
additional evidence linking PFOA exposure to
reduced infectious disease resistance, increased
hypersensitivity-related outcomes, and increased
autoimmune disease incidence (human studies),
and PFOS exposure to suppressed disease
resistance and lowered immune cell activity
(animal studies).70
In 2018, the Michigan PFAS Science Advisory
Panel recommended adding immunologic effects
to the list of health conditions of concern,
“particularly those that arise during prenatal
exposure and childhood…based on strong
toxicologic findings and supporting epidemiologic
evidence.”26
Box 1: Immunotoxicity of PFOA, PFOS
26 of 105
interior organs, some at concentrations
that are higher than long-chain PFAS,
such as PFOA and PFOS.81 As Dr.
Philippe Grandjean pointed out in his
testimony to the Michigan State
Legislature, “Given the inability to
assess organ concentrations in clinical
studies, our understanding of the health
risks associated with the short-chained
compounds is extremely limited.”
Biomonitoring programs are currently
exploring other forms of media, such as
urine, as more appropriate measures of
short-chain PFAS exposure and
retention.
Additionally, developing science on
short-chain PFAS metabolism indicates,
“that some fluorinated alternatives have
similar or higher toxic potency than
their predecessors when correcting for
differences in toxicokinetics [rate a
chemical enters the body, is
metabolized, and excreted]”.73 The rate a
chemical will enter the body and the
process of excretion and metabolism in
the body may in fact be an inadequate
measure of health threats to humans from chemicals with chronic exposure. The widespread use
of short-chain PFAS in commerce and their persistence in the environment could lead to chronic
exposures in people. Researchers find:
“Considering that the exposure to short-chain PFAAs is unlikely to be stopped shortly, there
will be increasing continuous and poorly reversible environmental background
concentrations of short-chain PFAAs. Consequently, organisms and humans will be
permanently exposed to short-chain PFAAs, resulting in continuous and poorly reversible
internal concentrations. The poorly reversible internal concentrations in organisms are
caused by the persistence of short-chain PFAAs and their continuous presence in the
environment. Therefore, the organismal elimination efficiencies are of secondary
relevance.”72
Finally, it is important to acknowledge that exposure to short-chain and other replacement PFAS,
is happening on top of a pre-existing health burden from historically used, long-chain PFAS, as
discussed further in the following section.
Box 2: Persistence, Mobility, and Toxicity
The German Environment Agency has shifted the
classification of emissions, registered under
REACH, to specific intrinsic properties that
indicate a hazard to sources of drinking water.75
These properties include persistence (P) in the
environment, mobility (M) in the aquatic
environment, and toxicity (T) (PMT). Substances
that are considered very persistent in the
environment (vP) and very mobile in the aquatic
environment (vM), regardless of their toxicity, must
also be considered, due to their increased
probability of reaching and accumulating in sources
of drinking water.76 Because very short chain PFAS
are volatile and can be dispersed far from areas of
direct exposure,77,78 recent efforts have shifted the
focus toward mobility as a key chemical parameter
of concern, moving from the established criteria
persistent (P), bioaccumulative (B), and toxic (T)
(PBT) toward PMT.75,79 This new criteria has
prompted the designation of PFAS substances as
posing an “equivalent level of concern” under
REACH, thereby prompting the need for a new
paradigm for chemical assessment and
authorization.80
27 of 105
Additive and Synergistic Effects of Exposure to Multiple PFAS
Importantly, exposures to PFAS do no occur in isolation. Biomonitoring studies demonstrate that
Americans have chronic exposure to multiple PFAS chemicals throughout their lifetimes. CDC’s
national biomonitoring studies, NHANES, reveal that nearly every American has PFOS, PFOA,
PFHxS and PFNA detected in their blood stream, including young children.6 At least eight other
PFAS are detected in blood serum by NHANES studies: MeFOSAA, PFDeA, PFUA, PFHpA,
PFBS, FOSA, EtFOSAA, PFDoA, and PFHpA.6 Most other PFAS chemicals are not routinely
included in biomonitoring studies. As mentioned previously, alternative methods in
biomonitoring suggest that humans are being exposed to new and unidentified PFAS.30,31
Multiple PFAS are found in drinking water, food, dust, personal care products and a variety of
different environmental media. In drinking water PFOA, PFOS, PFNA, PFHxS, PFBS, PFHpA
(measured in UCMR3), and other PFAS are often found in conjunction.7 Food contact materials
and packaging in the United States has shown detectable levels of PFOA, PFHxS, PFDA,
PFHpA, PFDoA, PFHxA, PFBA, PFPeA, PFUA, PFOS and 8:2 FTOH,82 and likely contain
other unknown PFAS. A single consumer product such as carpet, clothing, outdoor gear, or
dental floss can contain up to nine different identifiable PFAS compounds83 along with other
undetermined PFAS. Samples of dust collected throughout homes and offices have shown high
concentrations of 8:2 FTOH, PFDA, PFHpA, PFNA, 10:2 FTOH, PFDoA and PFTeDA with
detection frequencies over 70%.84
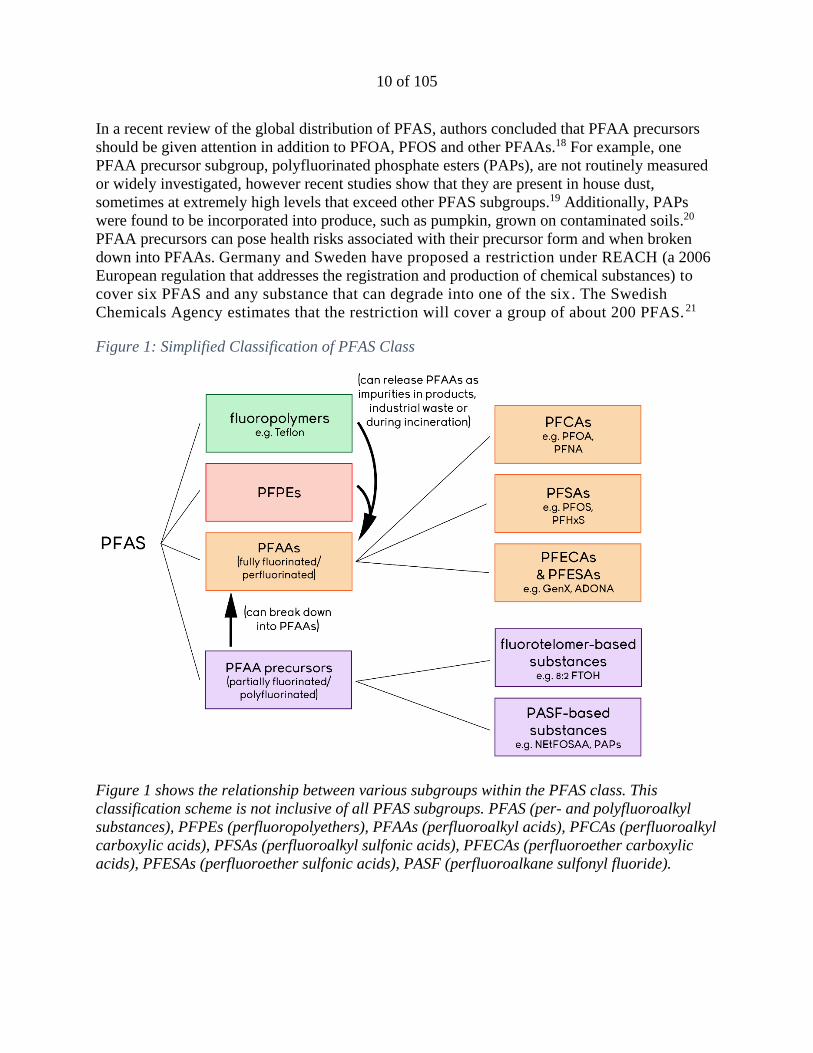
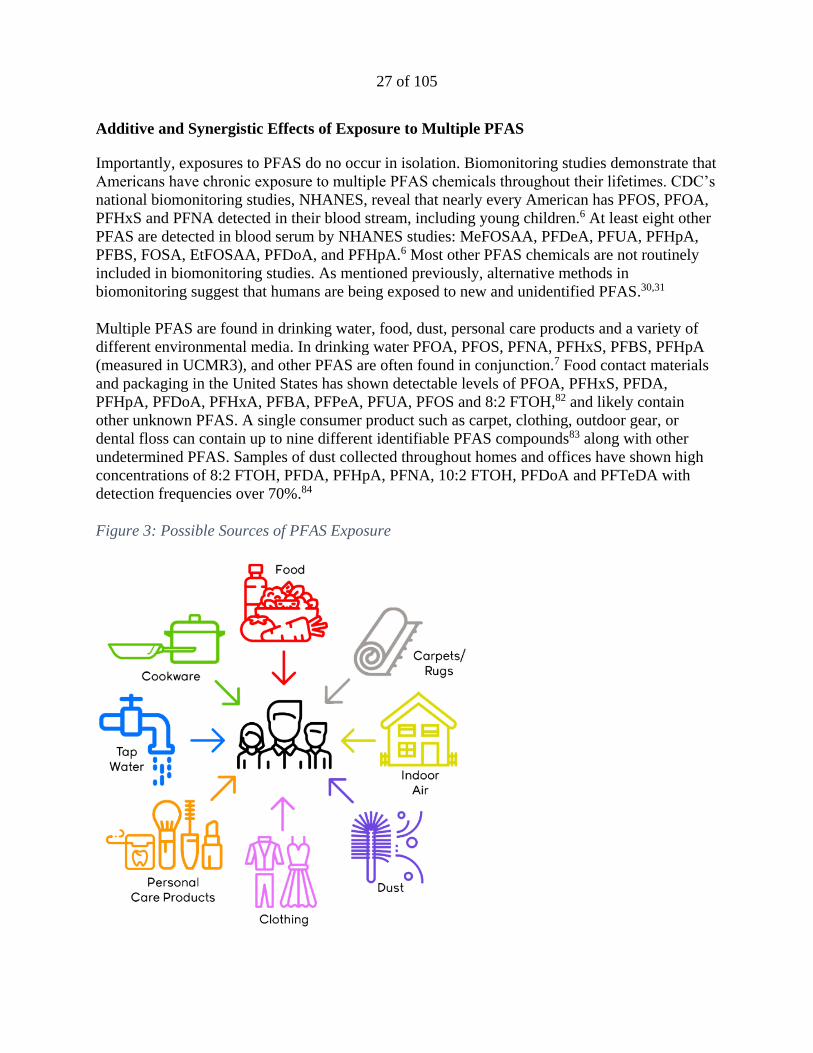
Figure 3: Possible Sources of PFAS Exposure
28 of 105
Figure 3 shows the most common pathways of PFAS exposure for humans. PFAS can be found in
people’s bodies as a result of exposure from multiple environmental sources. l,m
Therefore, risk and safety assessments cannot assume that exposures occur in isolation. A person
is concurrently exposed to dozens of PFAS chemicals daily, and their exposures extend
throughout their lifetimes. Health evaluations should consider the impacts of multiple PFAS
chemicals that target the same body systems regardless of detailed knowledge of the underlying
mechanism of action. Because PFAS are chemically related, they may have additive or
synergistic effects on target systems. An additive effect is when the combined effect of multiple
chemicals is the sum of each of the chemicals’ effects alone. A synergistic effect is caused when
concurrent exposure to multiple chemicals results in effects that are greater than the sum of each
of the chemicals’ effects alone. For example, many PFAS have been associated with
immunological effects. Exposure to a mixture of PFAS could result in adverse effects on the
immune system that represents the total dose of all PFAS in the mixture or even greater adverse
effects than predicted by summing the dose of all PFAS in the mixture.
PART IV: COMPARISON AND ANALYSIS OF EXISTING HEALTH THRESHOLDS
A number of regulatory and non-regulatory health-based thresholds have been developed for
PFAS (mainly PFOA and PFOS) by both federal and state agencies. The data used, and decisions
made by these agencies are discussed in this section.
Health advisories issued by the EPA are non-enforceable and non-regulatory. Health advisories
provide technical information to state agencies and other public health officials on health effects,
analytical methodologies, and treatment technologies associated with drinking water
contamination.
Guidance values are state-specific values – used, for example, by the Minnesota Department of
Health to evaluate potential human health risks from exposures to chemicals in groundwater –
that are non-enforceable goals, benchmarks, or indicators of potential concern. There are three
types of guidance values used by Minnesota, health risk limits which are guidance values that
have been adopted, and health-based values and risk assessment advice which provide technical
guidance but have not yet been formally adopted. In Minnesota, the state develops guidance
values by considering health impacts to the most sensitive and most exposed populations across
all stages of human development.
Notification levels are state-specific values. California’s Division of Drinking Water, for
example, has established advisory levels for chemicals in drinking water that lack maximum
l ATSDR, 2018. Agency for Toxic Substances and Disease Registry. Toxicological Profile for Perfluoroalkyls. Draft
for Public Comment, June 2018. m Guo, Z, et al., 2009. Perfluorocarboxylic acid content in 116 articles of commerce. Research Triangle Park, NC:
US Environmental Protection Agency
29 of 105
contaminant levels (MCLs, see below). When these chemicals are detected at concentrations
greater than their notification levels, state actions include consumer notification and, for larger
exceedances, removal of the source water from the drinking water supply.
EPA defines a Reference dose (RfD) as “an estimate (with uncertainty spanning perhaps an
order of magnitude) of a daily exposure to the human population (including sensitive subgroups)
that is likely to be without an appreciable risk of deleterious effects during a lifetime. The RfD is
generally expressed in units of milligrams per kilogram of bodyweight per day (mg/kg/day).”85
A minimal risk level (MRL) is an estimate made by ATSDR of the daily human total exposure
to a hazardous substance that is likely to be without appreciable risk of adverse noncancer health
effects over a specified route, including routes other than drinking water exposure, and a
specified duration of exposure. MRLs serve as screening tools to help public officials decide
where to look more closely and identify contaminants of concern at hazardous waste sites. Like
EPA’s health advisories, MRLs do not carry regulatory weight by requiring agency-initiated
cleanup or setting of action or maximum contaminant levels. MRLs are based on noncancer
effects only. These MRLs can be used, similar to reference doses, to generate maximum
contaminant level goals for drinking water.
A maximum contaminant level goal (MCLG) is the maximum level of a contaminant in
drinking water at which no known or anticipated adverse effect on the health of persons would
occur, allowing an adequate margin of safety. When determining a MCLG under the federal Safe
Drinking Water Act, the EPA considers adverse health risk to sensitive subpopulations, such as
infants, children, the elderly, those with compromised immune systems and chronic diseases.
MCLGs are non-enforceable health goals and consider only public health and not the limits of
detection and treatment technology effectiveness. Therefore, they sometimes are set at levels
which water systems cannot meet because of technological limitations.
A maximum contaminant level (MCL) is the legal threshold of the amount of a chemical that
is allowed in public water systems under the federal Safe Drinking Water Act. A MCL is based
on the concentration established by its corresponding MCLG but may be adjusted for feasibility
reasons, reflecting difficulties in measuring small quantities of a contaminant, or a lack of
available, adequate treatment technologies. The MCL is an enforceable standard and exceedance
of the MCL requires water systems to take certain steps, including providing public education,
notifying consumers, and adjusting treatment or making structural changes or repairs to come
into compliance with the standard for public health protection.
Current or proposed state and federal health thresholds for PFOA and PFOS in drinking water
range from 10 ppt to 70 ppt and higher. Although the health thresholds for PFOA and PFOS in
drinking water vary, the thresholds cluster at low ppt levels, orders of magnitude lower than
thresholds set for many other environmental contaminants. The thresholds are based on adverse
health effects, such as developmental effects and cancer risks, and health authorities uniformly
acknowledge the serious concerns related to exposure from consuming PFOA and/or PFOS
contaminated drinking water. The selection of critical endpoints to use, uncertainty factors to
30 of 105
apply, and estimates of exposure parameters are the major determinants for the variation in the
concentrations developed as thresholds. However, none of the federal and state assessments
dispute that very serious adverse health effects are associated with exposure to PFOA and PFOS
at very low levels of exposure.
The generation of health thresholds by various agencies for PFOA, PFOS, PFNA, PFHxS, and
GenX chemicals are summarized and compared in Tables 4-7 and described in further detail
below. Notably, advisories have become more stringent over time as more information becomes
available on the exposure to and toxicity of these chemicals.
31 of 105
Table 4:Selected Thresholds for Drinking Water and/or Groundwater - PFOA
32 of 105
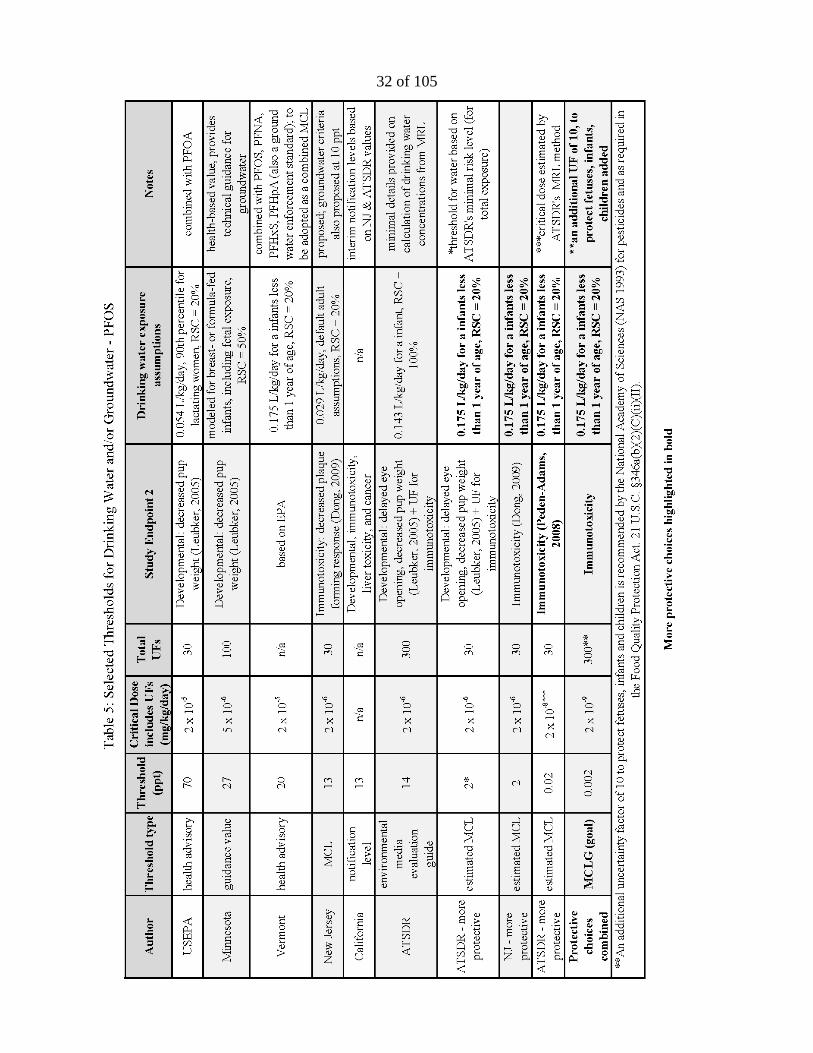
Table 5: Selected Thresholds for Drinking Water and/or Groundwater – PFOS
33 of 105
Table 6: Selected Thresholds for Drinking Water and/or Groundwater – PFNA
34 of 105
Table 7: Selected Thresholds for Drinking Water and/or Groundwater – PFHxS
35 of 105
PFOA
Comparison
In May 2016, the EPA issued a drinking water
health advisory for PFOA of 70 ppt.3 In the
case of co-occurrence of PFOA and PFOS, the
sum of the concentrations is not to exceed 70
ppt. The EPA applied a combined uncertainty
factor of 300 (10 for human variability, 3 for
animal to human toxicodynamic differences,
10 for use of a lowest-observed-adverse-
effect-level (LOAEL) instead of a no-
observed-adverse-effect-level (NOAEL)) on a
LOAEL for decreased bone development in
the fore and hind limbs, in pup mice (both
sexes) and accelerated puberty in male mice89
to generate a reference dose of 2 x 10⁻⁵
mg/kg/day.
The EPA used drinking water intake and body
weight parameters for lactating women in the
calculation of their lifetime health advisory
due to the potential increased susceptibility
during this time window. EPA assumed a
drinking water ingestion rate of 0.054 L/kg-
day, which represents the 90th percentile water
ingestion estimate for a lactating woman,
based on direct and indirect water intake of
community water supply consumers.90 The
EPA also concluded that there are significant
sources of PFOA and PFOS exposure other
than drinking water ingestion. As information
is not available to quantitatively characterize
exposure from all of these different sources,
the EPA used a default relative source
contribution (RSC, discussed in Box 3) of 20% of daily exposure coming from drinking water
and 80% from other sources.
In June 2016, Vermont published a health advisory for combined exposure to PFOA and PFOS
not to exceed 20 ppt based on EPA’s selected developmental effects.91 It also applied combined
uncertainty factors of 300 using EPA’s rationale, however generated a lower health advisory due
to selection of drinking water exposure parameters for a breastfeeding or formula-fed infant.
Breastfeeding and formula-fed infants is a population that drinks the largest volume per body
The use of uncertainty factors (UFs) has a
long history in developing regulatory
standards and guidance for chemicals.
Uncertainty refers to our inability to know all
the adverse effects related to a chemical, often
due to incomplete data. When assessing the
potential for risks to people, toxicology
studies often involve exposing test animals
(generally rats and mice) which are used as a
surrogate for humans.86 A thorough review of
the development and use of science-based
uncertainty factors is provided by the EPA
and National Academy of Sciences.86,87,88
Risk assessment for public health protection
must account not only for what is known
about a chemical’s adverse effects, but also
what is not known about differences between
toxic effects in animals compared to humans;
children compared to adults; differences in
absorption, metabolism and excretion; and
other unknown factors. The selection of
uncertainty factors is designed to account for
the incomplete understanding or availability
of studies upon which toxicity is appraised.
The EPA typically uses factors of 1, 3 (an
approximation of √10), or 10, depending on
the level of uncertainty for each factor.
Box 3: Uncertainty Factors
36 of 105
weight and is the most vulnerable to the toxic
effects of exposure to PFAS. The 95th
\percentile Body Weight Adjusted Water
Intake Rate for the first year of life based on
combined direct and indirect water intake
from community water supplies for
consumers only is 0.175 L/kg-day.90,93
Vermont also used a relative source
contribution from drinking water of 20%.
In August 2018, Minnesota adopted a
guidance value (health risk limit) of 35 ppt
for PFOA in groundwater based the same
critical endpoint as the EPA.94 Minnesota
applied a combined uncertainty factor of 300
including: 10 for human variability, 3 for
animal to human toxicodynamic differences,
3 for use of a LOAEL instead of a NOAEL,
and 3 for database uncertainty. Like
Vermont, Minnesota’s more protective
guidance values are due to the use of
drinking water exposure estimates based on
infants, but also the accounting of a pre-
existing body burden through placental transfer
(Minnesota calculated a placental transfer
factor of 87% based on average cord to
maternal serum concentration ratios).
Minnesota estimated breastmilk
concentrations by applying a breast milk
transfer factor of 5.2%, which is an estimate
of the amount of PFOA that is transferred
from a mother’s serum to her breastmilk. As
serum levels for PFOA are approximately
100 times the concentration in a person’s
drinking water, a breast milk transfer factor
of 5.2% would result in breast milk concentrations approximately 5 times higher than in the
drinking water. However, Minnesota also used a less conservative relative source contribution of
50%, resulting in drinking water values approximately half of EPA’s.
In March 2017, New Jersey derived a recommended MCL in water for PFOA of 14 ppt based on
increased liver weight in rodent studies.95 Previously in 2007, New Jersey issued a preliminary
drinking water guidance level for PFOA of 40 ppt, which was revised in 2016 to a more stringent
level of 14 ppt based on chronic exposure from drinking water for cancer and non-cancer
One important factor that should be considered
when generating a health-protective drinking
water limit for a contaminant is the percentage
of the total allowable dose (RfD or MRL) that
comes from water, versus other exposure
routes. The portion of a total daily dose that
comes from a specific exposure route (such as
drinking water) is represented by a relative
source contribution (RSC).
EPA suggest RSC’s for drinking water range
from 0.2 to 0.8 (20% to 80% coming from
drinking water). In the absence of complete
data, the EPA’s default RSC value is 0.2.
• Studies demonstrate that there are many
other sources of PFAS exposure, including
food and consumer products, though the
relative contribution from each source is
still poorly understood.
• For children, researchers estimated
exposure to PFOA and PFOS from hand-
to-mouth transfer from treated carpets to be
40–60% of the total uptake in infants,
toddlers, and children.92
• Therefore, the RSC from drinking water
for this vulnerable population should not
exceed 0.4 (40%). Importantly, as we do
not understand all the exposure sources for
this population, the default value of 0.2 is
the most protective and recommended.
Box 4: Relative Source Contribution
37 of 105
endpoints. Non-cancer endpoints were derived based on increased liver weight with applied
uncertainty factors of 300 (10 for human variability, 3 for animal to human toxicodynamic
differences, and 10 to protect against more sensitive toxicological effects). The more protective
health threshold is mainly due to the use of an additional uncertainty factor of 10 to protect
against more sensitive toxicological effects (delayed mammary gland development), which is
explained by New Jersey in the following excerpt:
“Delayed mammary gland development from perinatal exposure is the most sensitive
systemic endpoint for PFOA with data appropriate for dose-response modeling. It is a
well-established toxicological effect of PFOA that is considered to be adverse and
relevant to humans for the purposes of risk assessment.
To the knowledge of the Health Effects Subcommittee, an RfD for delayed mammary
gland development has not previously been used as the primary basis for health-based
drinking water concentrations or other human health criteria for environmental
contaminants. Because the use of this endpoint as the basis for human health criteria is a
currently developing topic, the Health Effects Subcommittee decided not to recommend a
Health-based MCL with the RfD for delayed mammary gland development as its primary
basis. However, the occurrence of this and other effects at doses far below those that
cause increased relative liver weight (the endpoint used as the primary basis for the
recommended Health-based MCL) clearly requires application of an uncertainty factor
to protect for these more sensitive effects.”95
The MCL based on cancer endpoints was derived from testicular tumor data from chronic dietary
exposure in rats and also resulted in a MCL of 14 ppt. New Jersey used values for adult drinking
water exposure (0.029 L/kg-day) and a relative source contribution of 20%. In January 2019,
New Jersey announced a proposed specific ground water quality criteria based on the same
reasoning for its proposed MCL, however, since interim ground water criteria are rounded to one
significant figure in New Jersey, the proposed criteria for PFOA is 10 ppt (0.01 µg/L).96
In June 2018, ATSDR generated a MRL for PFOA.5 A MRL exposure scenario of 3 X 10⁻⁶
mg/kg/day was based on a LOAEL of 0.000821 mg/kg/day for neurodevelopmental and skeletal
effects in mice97,98 with an uncertainty factor of 300 (10 for use of a LOAEL instead of a
NOAEL, 3 for extrapolation from animals to humans with dosimetry adjustments, and 10 for
human variability). A MCLG based on ATSDR’s MRL for PFOA would be 11 ppt, using the
same assumptions and parameters the EPA used for calculating their health advisory (based on
lactating mothers), or 3 ppt, using drinking water exposure assumptions based on breastfeeding
and formula-fed infants (see Appendix C for MCLG calculations).
In November 2018 ATSDR posted on its website a webpage entitled “ATSDR’s Minimal
Risk Levels (MRLs) and Environmental Media Evaluation Guides (EMEGs) for PFAS.”99
ATSDR provides the body weights and drinking water intake rates it would use for an
average adult or child (under one year) and lists what the corresponding drinking water
Box 5: ATSDR’s Environmental Media Evaluation Guides
38 of 105
concentrations would be if converted from ATSDR’s proposed MRLs: for an adult 78 ppt for
PFOA, 52 ppt for PFOS, 517 ppt for PFHxS, and 78 ppt for PFNA; and for a child, 21 ppt for
PFOA, 14 ppt for PFOS, 140 ppt for PFHxS, and 21 ppt for PFNA. ATSDR does not provide
any details as to how it derived the values presented on the webpage. However, based on the
information ATSDR did provide, drinking water values, body weight and intake rates, we
were able to calculate the relative source contribution used by ATSDR. According to our
calculations, ATSDR used a relative source contribution of 1, which assumes that 100% of a
person’s exposure comes from drinking water, not 20% or 50%, as all other agencies have
adopted (see Appendix E for calculations).
Studies demonstrate that there are many other sources of PFAS exposure, including food and
consumer products. For example, NHANES demonstrates that greater than 95 percent of
Americans have detectable PFAS in their bodies, however many of these Americans do not
have detectable PFAS in their drinking water. Therefore, the assumption that a person would
be only exposed to PFAS from drinking water is not supported by the scientific literature.
In June 2018, at the request of the California State Water Resources Control Board, the
California Office of Environmental Health Hazard Assessment (OEHHA) recommended an
interim notification level of 14 ppt for PFOA in drinking water.100 The notification level is based
on developmental toxicity, immunotoxicity, liver toxicity, and cancer. OEHHA reviewed
currently available health-based advisory levels and standards, including the documents and
process used by New Jersey to derive its water advisory levels. OEHHA found New Jersey’s
process to be both rigorous and sufficient for establishing an interim notification level for PFOA.
They note that this level is similar to that derived by ATSDR, whose minimal risk level equates
to a drinking water advisory level of 13 ppt for PFOA, as calculated by OEHHA. OEHHA is
currently completing its own derivation of a recommended drinking water notification level for
PFOA.
In December 2018, the New York Drinking Water Quality Council recommended that the New
York Department of Health adopt MCLs of 10 ppt each for PFOA and PFOS.101 Although no
supporting documentation is currently available in relation to this recommendation, the council
notes that these levels “take into consideration the national adult population's "body burden," or
the fact that all adults already have some level of exposure to these and other related chemicals.”
Analysis
Although altered mammary gland development is the most sensitive endpoint for PFOA
exposure,67,68,69 both the EPA and ATSDR did not consider altered mammary gland development
as the critical effect in their toxicity assessment of PFOA.
The EPA excluded the results of the mammary gland findings based on the agency’s view that
the effects were of “unknown biological significance,” concern for variability in the sensitivity
for these effects amongst mice strains,69 the fact that the mode of action for these effects are
39 of 105
unknown, and that mammary gland effects had not been previously used for risk assessment.3
Similarly, ATSDR classified altered mammary gland development as not adverse due to
uncertainty around the effect’s biological significance.
However, experts in the field have concluded that changes in mammary gland growth and
differentiation, including changes in developmental timing, are a health concern.102 Studies have
shown a relationship between altered breast development, lactational deficits and breast cancer
(discussed further in Box 6). Therefore, unless it can be shown that this relationship does not
exist for PFOA, altered mammary gland growth and differentiation should be considered an
adverse health effect of PFOA exposure and the critical endpoint for PFOA.
Box 6: “Is altered mammary development an adverse effect?” Both the EPA and ATSDR did not consider altered mammary gland development as the
critical effect in their toxicity assessment of PFOA. However, in a 2009 a workshop of experts
in mammary gland biology and risk assessment came to the consensus that changes in
mammary gland growth and differentiation, including changes in developmental timing, are a
health concern.102 Altered mammary gland development may lead to difficulty in
breastfeeding and/or an increase in susceptibility to breast cancer later in life.103
Only one animal study has assessed the effects of PFOA exposure on mammary gland growth
and differentiation for multiple generations.68 The authors saw striking morphological
abnormalities in the lactating glands of dams (mothers) chronically exposed to
environmentally relevant levels of PFOA; however, no effects on body weight of their pups
were seen. It is possible that compensatory behavior, such as increased number of nursing
events per day or longer nursing duration per event masked a decreased potential in milk
production by the dams, however the authors did not evaluate these endpoints in the study. It is
also possible that PFOA exposure could increase time to peak milk output through the
reduction in number and density of alveoli available to produce milk.
For human mothers, low-level functional effects on lactation that cause even a short delay in
substantial milk output might result in cessation in breastfeeding before the recommended
time-frame. This is supported by a cohort study that found an inverse correlation between
levels of maternal serum PFOA and duration of breastfeeding.104
Early life exposures to factors that disrupt development may influence susceptibility to
carcinogens later in life. For example, hormone disruption is an important determinant of
breast cancer susceptibility in humans and rodents.105 Proliferating and undifferentiated
structures, such as terminal end buds, display elevated DNA synthesis compared to other
mammary gland structures; which is why terminal end buds are considered the most
vulnerable mammary gland target structure of carcinogen exposure.106 Delays in mammary
gland development would result in a prolonged window of increased vulnerability to
carcinogens. In humans, perturbations to the timing of menarche is linked to breast cancer.107
This further raises the concern that changes in patterns of breast development in U.S. girls
could be contributing to an increased risk of breast cancer or other adult diseases later in
40 of 105
life.108 However, an increase in susceptibility to breast cancer later in life was not explored in
the multigeneration mammary gland development study.68
In general, “developmental delay can reflect an overall detrimental effect of chemical
exposure that lead to growth and developmental deficit in the offspring,” as the Michigan
PFAS Science Advisory Panel states in its discussion of EPA’s choice of reduced bone
ossification as a critical endpoint.26
New Jersey did classify delayed mammary gland development as adverse, though, it stopped
short of using it to generate their MCL for PFOA. However, New Jersey did calculate a reference
dose, 1.1 x 10⁻⁷ mg/kg/day, based on delayed mammary gland development. If this more
protective reference dose were used, the MCLG for PFOA would be less than 1 ppt, regardless of
which population the drinking water parameters are based on (see Appendix D for calculation).
The MCLG would be lowered even further below 1 ppt if an additional uncertainty factor of 10
was applied to ensure adequate protection of fetuses, infants and children, as recommended by
the National Academy of Sciences and as required in the Food Quality Protection Act (see Box
7).
PFOS
Comparison
In May 2016, the EPA issued a drinking water health advisory for PFOS of 70 ppt,28 with the
sum of PFOA and PFOS concentrations not to exceed 70 ppt. The EPA applied combined
uncertainty factors of 30 (10 for human variability, 3 for animal to human toxicodynamic
differences) on a NOAEL of decreased pup weight in a two-generation rat study.109 As with
PFOA, the EPA used drinking water intake and body weight parameters for lactating women and
a relative source contribution of 20%.
As mentioned above, in June 2016 Vermont published a health advisory for total concentrations
of PFOA and PFOS in drinking water at 20 ppt based on EPA’s selected developmental effects
and drinking water exposure parameters for breastfeeding or formula-fed infants.91
In May 2017, Minnesota proposed a groundwater guidance value (health-based value) of 27 ppt
for PFOS based the same critical endpoints as the EPA.110 However, Minnesota applied a larger
combined uncertainty factor than the EPA. Minnesota applied a total uncertainty factor of 100
including: 3 for animal to human toxicodynamic differences, 10 for human variability and an
additional 3 for database uncertainty (based on the need for additional immunotoxicity data).
Minnesota accounted for a pre-existing body burden through a placental transfer factor of 46%,
used drinking water exposure estimates based on infants with an estimated breast milk transfer
factor of 1.3%, and used a relative source contribution of 50%.
41 of 105
In June 2018, New Jersey derived a
recommended MCL in water for PFOS of 13 ppt
for chronic exposure from drinking water based
on immune suppression in mice,112 an endpoint
that is significantly more sensitive than the
endpoint used by EPA.113 New Jersey applied a
combined uncertainty factor of 30 (10 for human
variability and 3 for animal to human
toxicodynamic differences) to an internal
NOAEL of 674 ng/ml of PFOS in animal serum
to generate an human serum target level. This
target level was then multiplied by a clearance
factor to arrive at a reference dose of 1.8 x 10⁻⁶
mg/kg/day. New Jersey used values for adult
drinking water exposure and a relative source
contribution of 20%. Like for PFOA, in January
2019, New Jersey announced a proposed specific
ground water quality criteria based on the same
reasoning for its proposed MCL, however, since
interim ground water criteria are rounded to one
significant figure in New Jersey, the proposed
criteria for PFOS is 10 ppt (0.01 µg/L).114
In June 2018, ATSDR generated a MRL for PFOS based on delayed eye opening and decreased
pup weight109 in rats.5 A MRL exposure scenario of 2 x 10⁻⁶ mg/kg/day was based on a NOAEL
of 0.000515 mg/kg/day using an uncertainty factor of 300 (10 for concern that immunotoxicity
may be a more sensitive endpoint than developmental toxicity, 3 for extrapolation from animals
to humans with dosimetry adjustments, and 10 for human variability). A MCLG based on
ATSDR’s MRL for PFOS would be 7 ppt, using EPA’s drinking water exposure assumptions, or
2 ppt, using drinking water exposure assumptions based on breastfeeding and formula-fed infants
(see Appendix C for MCLG calculations).
In June 2018, at the request of the California State Water Resources Control Board, OEHHA
recommended an interim notification level of 13 ppt for PFOS in drinking water.100 The
notification level is based on the same analysis performed for PFOA, described above. OEHHA
notes that this level is similar to that derived by ATSDR, whose minimal risk level equates to a
drinking water advisory level of 9 ppt for PFOS, as calculated by OEHHA. OEHHA is currently
completing its own derivation of recommended drinking water notification levels for PFOS.
As noted above, a MCL of 10 ppt each for PFOA and PFOS were recommended by the New
York Drinking Water Quality Council.101
Analysis
The National Academy of Sciences has
recommended the use of an additional
uncertainty factor of 10 to ensure
protection of fetuses, infants and children
who often are not sufficiently protected
from toxic chemicals such as pesticides by
the traditional intraspecies (human
variability) uncertainty factor.111 Congress
adopted this requirement in the Food
Quality Protection Act for pesticides in
foods. 21 U.S.C. 346a(b)(2)(C)(ii)(II)
Considering the many health effects linked
to PFAS that affect this vulnerable
population and the substantial data gaps on
exposure and toxicity of these compounds
in complex mixtures, we recommend the
use of this uncertainty factor when deriving
health-protective thresholds for PFAS.
Box 7: Additional Protection for
Fetuses, Infants, and Children
42 of 105
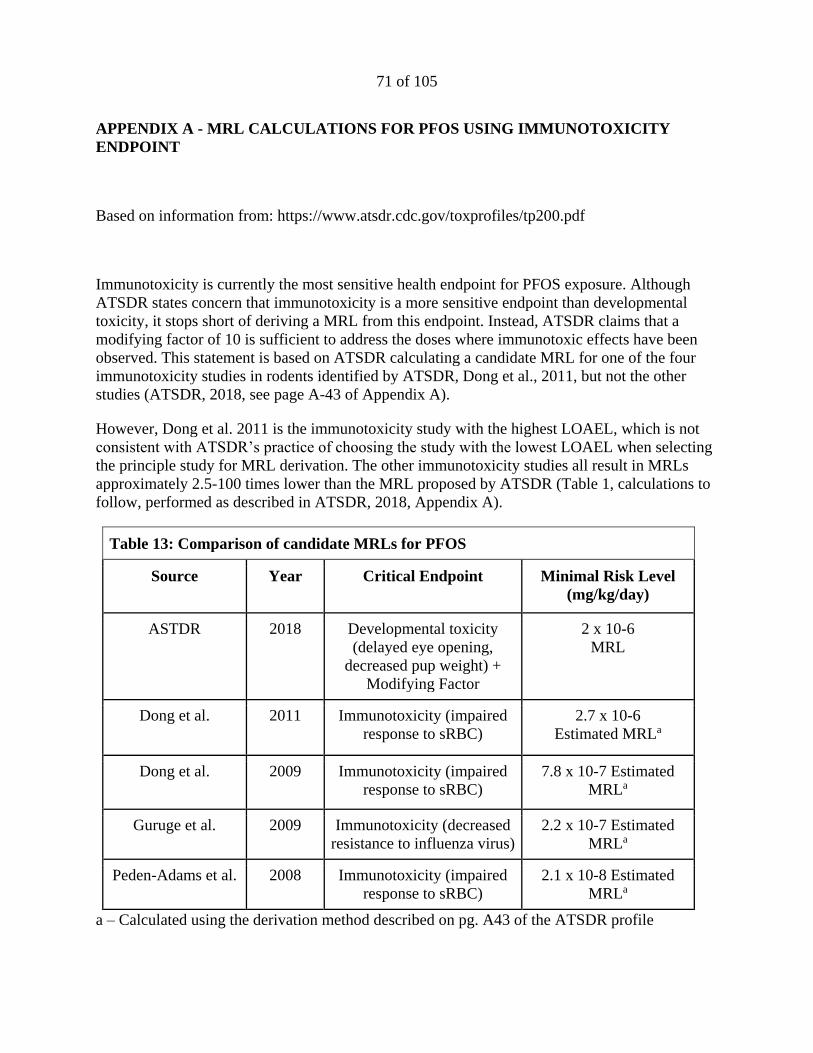
Immunotoxicity is currently the most sensitive health endpoint known for PFOS exposure. As
documented in the ATSDR’s profile, both animal and epidemiology studies provide strong
evidence linking PFOS exposure to immunotoxic effects (decreased antibody response to
vaccines in humans, decreased host resistance to viruses, and suppressed immune response to
antigens in animals). The National Toxicology Program also reviewed the immunotoxicity data
on PFOA and PFOS in 2016 and concluded that both are presumed to constitute immune hazards
to humans70 (discussed further in Box 1).
Again, although immunotoxicity is the most sensitive endpoint for PFOS exposure, the EPA
excluded immune system effects based on uncertainties related to mode of action, variation in
dose effects between studies, differences in sensitivity between males and females, and lack of a
“demonstrated clinically recognizable increased risk of infectious diseases as a consequence of
a diminished vaccine response.”28
ATSDR states concern that immunotoxicity is a more sensitive endpoint than developmental
toxicity; however, it stops short of deriving a MRL from this endpoint. Instead, ATSDR posits
that an additional modifying, or uncertainty factor of 10 is sufficient to address the doses where
immunotoxic effects have been observed. However, this value is only consistent with the
immunotoxicity study with the highest LOAEL.115 The other immunotoxicity studies all result in
MRLs approximately 2.5-100 times lower than those currently calculated (see Appendix A for
MRL derivations). If a MCLG were generated from the most sensitive health endpoint
(immunotoxicity) and from the study with the lowest LOAEL, as is normally done by ATSDR, it
would be less than 1 ppt (see Appendix C for MCLG calculations). The MCLG would be
lowered even further below 1 ppt if an additional uncertainty factor of 10 was applied to ensure
adequate protection of fetuses, infants and children, as recommended by the National Academy
of Sciences and as required in the Food Quality Protection Act. Additionally, a MCLG based on
benchmark dose calculations for immunotoxicity in children would also be approximately 1
ppt.116
New Jersey did select immunotoxicity as its critical health effect, resulting in the lowest
generated reference dose for PFOS. However, the use of adult drinking water assumptions results
in a higher proposed MCL than what we have calculated using estimated MRLs based on
immunotoxicity (see Appendix A and C).n
PFNA
Comparison
n Additionally, there are a couple of differences between New Jersey’s and ATSDR’s approach to generating a
RfD/MRL, including the use of slightly different clearance factors and ATSDR’s use of the trapezoid rule to
estimate a time weighted average serum concentration for the animal point of departure.
43 of 105
In July 2015, New Jersey proposed a MCL for PFNA of 13 ppt for chronic exposure from
drinking water based on increased liver weight in rodents117 with a total uncertainty factor of
1000 (10 for human variability and 3 for animal to human toxicodynamic differences, 10 for less
than chronic exposure duration, and 3 for database uncertainty).118 Extrapolation from animal to
human dose levels were made on the basis of internal serum levels rather than administered dose
and were based on an estimated 200:1 ratio between PFNA serum levels and drinking water
concentration in humans. A chemical-specific relative source contribution of 50% was developed
using the “subtraction” approach. A subtraction approach is used when other sources of exposure
(air, food, consumer product, etc.) can be considered background, and can thus be subtracted
from the total dose to arrive at the allowable limit or dose from drinking water.119 New Jersey
based their calculations on the 2011-12 NHANES biomonitoring data for the 95th percentile
PFNA serum level in the U.S. general population. This MCL was adopted into law in September
2018.120 As of January 2019, this is the only finalized, enforceable drinking water limit for a
PFAS chemical. New Jersey also has a specific ground water quality criteria for PFNA set at 13
ppt, based on its MCL for PFNA.
In July 2018, Vermont updated its drinking water health advisory level to include (based on class
similarity) PFOA, PFOS, PFHxS, PFHpA, and PFNA for a combined total not to exceed 20
ppt.121 Based on its health advisory, Vermont updated its enforceable groundwater standard to
include all 5 PFAS at a combined 20 ppt.122 In January 2019, Vermont announced it will initiate
the process of adopting its health advisory for these five PFAS as an enforceable MCL.123
For PFNA, ATSDR based its assessment on decreased body weight and developmental delays in
mice pups.5,117 A MRL exposure scenario of 3 x 10⁻⁶ mg/kg/day was based on a NOAEL of
0.001 mg/kg/day using an uncertainty factor of 300 (10 for database limitations, 3 for
extrapolation from animals to humans with dosimetry adjustments, and 10 for human
variability).5 A MCLG based on ATSDR’s MRL for PFNA would be 11 ppt, using EPA’s
drinking water exposure assumptions for PFOA and PFOS, or 3 ppt, using drinking water
exposure assumptions based on breastfeeding and formula-fed infants (see Appendix C for
MCLG calculations).
Analysis
Importantly, ATSDR underestimated the half-life of PFNA in humans. In the paper used to
estimate the half-life of PFNA,124 two different half-life values were derived: one of 900 days for
young women and one of 1,570 days for everyone else. Younger women of childbearing age
have additional excretion pathways for PFAS than other populations, including through
breastmilk and menstruation. ATSDR provided no rationale for why the shorter half-life was
selected. The longer half-life represents a larger population with minimal excretion pathways for
PFNA and would result in a more protective MRL value. Importantly, New Jersey’s 200:1
estimated ratio between PFNA serum levels and drinking water concentration in humans is based
on the longer, more representative half-life of 1,570 days.118 When the longer half-life is used,
the resulting MRL is 2 x 10⁻⁶ mg/kg/day (see Appendix B for MRL calculations). A MCLG
based on this more protective MRL for PFNA would be 7 ppt, using EPA’s drinking water
44 of 105
exposure assumptions for PFOA and PFOS, or 2 ppt, using drinking water exposure assumptions
based on breastfeeding and formula-fed infants (see Appendix C for MCLG calculations). The
MCLG would be below 1 ppt if an additional uncertainty factor of 10 was applied to ensure
adequate protection of fetuses, infants and children, as recommended by the National Academy
of Sciences and as required in the Food Quality Protection Act.
PFHxS
Comparison
As mentioned above, Vermont’s drinking water health advisory and its groundwater standard
now includes PFOA, PFOS, PFHxS, PFHpA, and PFNA for a combined total not to exceed 20
ppt and Vermont is now in the process of adopting the advisory as a MCL. 121,123
Minnesota recently recommended using PFOS as surrogate for PFHxS until more data is
available, setting a guidance value (risk assessment advice) of 27 ppt for PFHxS.125
For PFHxS, ATSDR based its assessment on thyroid follicular cell damage in rats.126,127 A MRL
exposure scenario of 2 x 10⁻⁵ mg/kg/day was based on a NOAEL of 0.0047 mg/kg/day using an
uncertainty factor of 300 (10 for database limitations, 3 for extrapolation from animals to
humans with dosimetry adjustments, and 10 for human variability).5 A MCLG based on
ATSDR’s MRL for PFHxS would be 74 ppt, using EPA’s drinking water exposure assumptions
for PFOA and PFOS, or 23 ppt, using drinking water exposure assumptions based on
breastfeeding and formula-fed infants (see Appendix C for MCLG calculations). The MCLG
would be lowered to 2 ppt if an additional uncertainty factor of 10 was applied to ensure
adequate protection of fetuses, infants and children, as recommended by the National Academy
of Sciences and as required in the Food Quality Protection Act.
GenX
Comparison
In 2017, North Carolina set a non-enforceable health goal for the GenX chemical, HFPO dimer
acid, to 140 ppt in drinking water.128 The health goal was based on a reference dose of 1 x 10⁻⁴
mg/kg/day, generated from a NOAEL for liver toxicity in mice (single-cell necrosis in
hepatocytes and correlative increases in liver enzymes) with combined uncertainty factor of 1000
(10 for human variability, 10 for animal to human toxicodynamic differences, 10 for
extrapolating from subchronic to chronic exposure duration). According to North Carolina
Department of Human Health Services, their health goal for GenX is for “the most vulnerable
population – i.e. bottle-fed infants, the population that drinks the largest volume of water per
body weight.”128 The state used drinking water exposure assumptions based on bottle-fed infants
(0.141 L/kg/day) and a relative source contribution of 20%.
45 of 105
In November 2018, the EPA proposed a chronic reference dose of 8 x 10⁻⁵ mg/kg/day for two
GenX chemicals, HFPO dimer acid and its ammonium salt.23 The EPA applied a combined
uncertainty factor of 300 (10 for human variability, 3 for animal to human toxicodynamic
differences, 3 for database limitations, and 3 for extrapolation from subchronic to chronic
exposure duration) on a NOAEL for single-cell necrosis in livers of male mice from a DuPont
study.129 The EPA did not provide drinking water values in their toxicity assessment of GenX
chemicals, however, using EPA’s drinking water exposure assumptions for PFOA and PFOS, a
MCLG would be 296 ppt, or 91 ppt using drinking water exposure assumptions based on
breastfeeding and formula-fed infants (see Appendix F for calculations).
Analysis
The EPA notes that there are the following database deficiencies for GenX chemicals: no human
data from epidemiological studies, limited testing for developmental toxicity and immunological
responses, lack of a full two-generational reproductive toxicity study, and lack of a chronic study
in mice (which appear to be more sensitive to GenX than rats). Additionally, of the studies
considered for the development of the reference dose, only two were published in a peer-
reviewed journal. These are significant limitations in the toxicity data available for GenX, and as
such, an uncertainty factor of 3 is unlikely to be sufficient. Importantly, North Carolina does not
apply an uncertainty factor for database limitations at all. In comparison, ATSDR used an
uncertainty factor of 10 for database limitations for PFNA and PFHxS due to a lack of or limited
testing of developmental and immunological effects, which ATSDR states are two of the most
sensitive PFAS endpoints.5
To extrapolate from animal to human dose, the EPA used the Body Weight3/4 allometric scaling
approach, which is based on body surface area and basal metabolic rate in adults. This approach
does not account for differences in toxicokinetics between animals and humans, which for PFAS
are often vastly different. The Netherland’s National Institute for Public Health and the
Environment (RIVM) determined that although the elimination rates for GenX are faster than
PFOA in animal models, without data in humans, it is not possible to make assumptions on the
toxicokinetics of GenX chemicals in humans.130 Due to the uncertainty from lack of human
toxicokinetic data on GenX chemicals, RIVM calculated and applied an additional uncertainty
factor to account for the potential kinetic difference between animals and humans.
This additional toxicokinetic factor used by RIVM is based on the difference in half-lives
between cynomolgus monkeys and humans for PFOA. A half-life ratio was calculated using a
half-life of 1378 days in humans131 and of 20.9 days in male cynomolgus monkeys132 resulting in
an additional toxicokinetic factor of 66 (1378 / 20.9). This additional uncertainty factor to
account for the potential kinetic difference between animals and humans is an example of an
alternative approach to extrapolating animal doses to human doses for PFAS like GenX that do
not yet have human toxicokinetic data. Considering the limitations of EPA’s scaling approach,
an uncertainty factor of 3 to account for interspecies toxicokinetic differences is likely to be
insufficient.
Finally, North Carolina used an uncertainty factor of 10 to extrapolate from subchronic to
chronic exposure duration, compared to the EPA’s use of an uncertainty factor of 3. The EPA
46 of 105
states that effects for the subchronic study it selected (performed in mice) are consistent with
effects seen for the single chronic study available. However, the chronic study is in rats, a
species that the EPA acknowledges is much less sensitive to the effects of GenX than mice.
Therefore, this logic is not supported by the EPA’s own findings.
If uncertainty factors that properly reflected the deficiencies in toxicity data (database, sub-
chronic to chronic, children’s vulnerability, human variability, animal to human differences)
were used, the combined uncertainty factor could be as high as 100,000, which would result in a
MCLG of less than 1 ppt for GenX chemicals (see Appendix F for calculations). This highlights
the current considerable level of uncertainty in determining a safe level of exposure for GenX
chemicals.
To generate accurate and relevant health thresholds, all toxicological information available
should be evaluated. Epidemiological studies provide direct information on effects of chemical
exposures in people. However, epidemiological data from human health studies are not
always utilized. Human studies should be used in conjunction with animal studies to best
inform risk assessment.
Use of epidemiology data in risk assessment is not a new approach, for example,
epidemiological data was used quantitatively in an EPA evaluation of risk for methylmercury,
as recommended by the National Academy of Sciences.133 The EPA based the oral reference
dose on lasting neurological effects in children exposed during early life.134 In 2018, the
European Food Safety Authority (EFSA) derived health-based guidance values for PFOA and
PFOS based on epidemiological studies.135 EFSA used benchmark modelling of serum levels
to generate daily tolerable intakes (similar to a reference dose, a daily or weekly tolerable
intake is an estimate of the amount of a substance in food or drinking water which can be
consumed over a lifetime without presenting an appreciable risk to health) of 0.8 ng/kg/bw for
PFOA based on increased serum cholesterol in adults and 1.8 ng/kg/bw for PFOS based on
increased serum cholesterol in adults and decrease in antibody response at vaccination in
children. These values are approximately 10-20 times stricter than the reference dose generated
by the EPA, 20 ng/kg/bw.
Another powerful way of using epidemiological data is demonstrated by the Michigan PFAS
Science Advisory Panel’s use of epidemiology data to evaluate the EPA’s health advisory
level of 70 ppt for PFOA and PFOS.26 The Panel estimated that drinking water with 70 ppt of
PFOA over several years would result in serum concentrations around 10,000 ppt in adults and
16,500 ppt among those with higher consumption (such as nursing mother and infants). For
adults, the Panel used a model136 to estimate that 8,000 ppt would result from drinking water
that contained 70 ppt PFOA, which is in addition to 2,000 ppt from background exposures (as
estimated from NHANES national biomonitoring data).
Box 8: Epidemiological Data in Risk Assessment
47 of 105
Conclusions
Differences in the selection of critical endpoints and the application of uncertainty factors have
led to the generation of different health thresholds for PFOA, PFOS, PFNA, PFHxS and GenX
chemicals. Another source of variation in health thresholds comes from differences in exposure
assumptions, such as drinking water intake rate, body weight and relative source contribution
from drinking water. For example, the exposure levels of an average male adult versus a
lactating mother versus a breastfeeding or formula-fed infant vary greatly. For an in-depth
discussion of the main sources of variation in current health thresholds for PFOA and PFOS,
including “managing scientific uncertainty, technical decisions and capacity, and social,
political, and economic influences from involved stakeholders,” see recently published article by
researchers from Whitman College, Silent Spring Institute, and Northeastern University.137
Evidence shows that PFAS exposure poses a high risk to fetuses, infants, children and pregnant
women. There is particular risk for sensitive members of the population from chemicals of such
persistence and clear adverse effects at very low levels of exposure. Decisions made when
developing a health threshold, such as evaluation of data gaps, the selection of uncertainty
factors, and the choice of exposure parameters to use, should be made to be protective of the
most vulnerable populations, particularly developing fetuses, infants, and children.138
Taking into consideration the above information, for
risk assessment we recommend: 1) the use of the
most sensitive health endpoint, regardless of whether
the endpoint has been used in a risk assessment
previously; 2) the use of drinking water exposure
parameters that protect vulnerable populations,
particularly breastfeeding or formula-fed infants; 3)
the use of an additional uncertainty factor of 10 to
protect fetuses, infants and children as recommended
by the National Academy of Sciences111 and as
required in the Food Quality Protection Act (see Box
7); 4) the use of both human and animal data when
assessing the toxicity of a chemical, or group of
A PFOA serum concentration of 10,000 ppt would represent the first quartile in the C8 study
(contaminated community) and the top bracket in epidemiology studies of the general
population. Many health effects have been seen in epidemiology studies at these blood serum
concentrations. The Panel concludes, “…this evaluation places those with chronic exposure
to 70 ppt or higher levels of PFOA in their drinking water well within the range at which
credible associations with health effects were found by the C8 Science Panel studies.”26 In
other words, human data shows that the EPA’s health advisory for PFOA and PFOS is not
health protective.
Fundamentally, exposures to PFAS
occur as mixtures. With individual
PFAS targeting many of the same
biological systems, concurrent
exposures to multiple PFAS likely
have additive or synergistic effects.
Therefore, traditional toxicity
assessments that assume exposures to
a chemical occur in isolation could be
significantly underestimating the real-
world effects of PFAS.
Box 9: Real-World Exposures
48 of 105
chemicals (see Box 8); and 5) the examination of possible additive or synergistic effects from
exposure to mixtures of similar chemicals that target the same biological systems (see Box 9).
PART V: DETECTION/ANALYTICAL METHODS AND TREATMENT
TECHNOLOGIES
As discussed in this section, PFOA, PFOS, PFNA, PFHxS, and GenX chemicals can be reliably
quantified and treated to low levels, therefore, it is feasible for the state to establish strict MCLs
for such PFAS. At present, there is no single methodology for isolating, identifying, and
quantifying all PFAS in drinking water. Until total PFAS can be reliably quantified, the state
should establish a treatment technique for the class of PFAS chemicals.
Analytical Methods for Detecting and Measuring Concentrations of PFAS
When a laboratory measures an chemical, the laboratory often reports the method detection limit
(MDL) and the method reporting limit (also sometimes called the minimum reporting limit or
limit of quantification).42 The MDL is the minimum concentration of a substance that can be
measured and reported with 99% confidence that the chemical is present in a concentration
greater than zero; any concentration measured below the minimum detection limit is considered
non-detect. The method reporting limit is the lowest chemical concentration that meets data
quality objectives that are developed based on the intended use of this method; concentrations
above this limit are considered quantified with statistical rigor. A laboratory may also report the
single laboratory lowest concentration minimum reporting limit (LCMRL), a value between the
method detection and reporting limits, which is the “lowest true concentration for which the
future recovery is predicted to fall, with high confidence (99%), between 50 and 150%
recovery."42 Action levels, such as a MCL, should be set at or above the method reporting limit.
Figure 4: Detection, Quantification and Reporting Limits
Figure 4 shows the relationship between the types of detection and quantification limits for
laboratory testing. The method detection limit (MDL) is the lowest concentration that can be
detected. The lowest concentration minimum reporting limit (LCMRL) is the lowest
concentration that can be quantified and the method reporting limit, also known as the limit of
49 of 105
quantification (LOQ), is the lowest concentration that can be reliably quantified and meets data
quality objectives.o
The detection sensitivity of PFAS varies depending on the method of analysis used to quantify
the results and the laboratory conducting the analysis. Historically, laboratories have used a
liquid chromatography-tandem mass spectrometry method such as EPA Method 537, or a
modified version,139 with quantified reporting limits in the low single-digit ppt range. EPA
Method 537, updated in November 2018 and referred to as Method 537.1, now includes
detection limits ranging from 0.53 to 2.8 ppt for the 18 PFAS compounds included in the updated
testing method.140 In studies where an alternative method is used, researchers were able to
achieve reporting limits below 1 ppt for PFOS, PFNA, and PFHxS. In Europe and Australia,
reporting limits of less than 1 ppt for PFOA have been achieved.141 Prominent laboratories that
provide analytical detection services for PFAS, including at least one used by the state of
Michigan, have already established reporting limits of 2 ppt for at least 17 PFAS compounds
including PFOA, PFOS, PFNA, and PFHxS, and a reporting limit of 5 ppt for GenX, using EPA
Method 537 or Method 537.1; and one company confirms a 2 ppt reporting limit for the
additional PFAS compounds in the updated EPA Method 537.1 will be achievable, except for
GenX, which would typically be reported at 5 ppt, but can be lowered to a 2 ppt with an
alternative analytical method.142
EPA Method 537.1
EPA Method 537.1 is a solid phase extraction (SPE) liquid chromatography/tandem mass
spectrometry (LC/MS/MS) method for the determination of selected PFAS in drinking water.140
This method can be used to quantify 18 PFAS compounds including PFOA, PFOS, PFNA,
PFHxS, and a GenX chemical, HFPO dimer acid. The EPA states that detection limits range
from 0.53 to 1.9 ppt and single laboratory LCMRLs range from 0.53 – 2.7 ppt for PFOA, PFOS,
PFNA, PFHxS, and HFPO-DA. We recommend that, at minimum, the state require the use EPA
Method 537.1 with method reporting limits of 2 ppt, 5 ppt for GenX, when testing for PFAS in
drinking water.
Table 8: Method Reporting Limits from three sources that use EPA Method 537 and/or 537.1
Contaminant CAS Registry
Number
Method Reporting Limits (ppt)
EPA 537.1p UCMR3q Eaton Analyticsr Vista Analyticals
PFOS 1763-23-1 2.7 40 2 2
PFOA 335-67-1 0.82 20 2 2
o Adapted from https://acwi.gov/monitoring/webinars/mpsl_qa_services_intro_rls_012517.pdf p LCMR from https://cfpub.epa.gov/si/si_public_file_download.cfm?p_download_id=537290&Lab=NERL
q https://www.epa.gov/dwucmr/third-unregulated-contaminant-monitoring-rule r http://greensciencepolicy.org/wp-content/uploads/2017/12/Andy_Eaton_UCMR3_PFAS_data.pdf
s http://www.vista-analytical.com/documents/Vista-PFAS-rev3.pdf
Table 10 provides examples of detection and reporting limits achieved by two different
international studies for PFOA, PFOS, PFNA, and PFHxS.
Comprehensive PFAS Assessment Techniques
At present, there is no single methodology for isolating, identifying, and quantifying all PFAS in
drinking water. Current commercial laboratory methodologies are typically able to quantify
u Ericson I, et al., 2009. Levels of Perfluorinated Chemicals in Municipal Drinking Water from Catalonia, Spain:
Public Health Implications. Arch Environ Contam Toxicol 57:631–638 v Gellrich V, et al., 2013. Perfluoroalkyl and polyfluoroalkyl substances (PFASs) in mineral water and tap water. J
Environ Sci Health 48:129–135
52 of 105
between 14 and 31 PFAS compounds and only a very small number of PFAA precursors can be
quantitatively analyzed by commercial laboratories.147 For instance, N-ethyl
perfluorooctanesulfonamidoacetic acid and N-methyl perfluorooctanesulfonamidoacetic acid are
the only two precursors included in EPA Method 537.1. For classes other than PFCAs between
4-14 carbons long and PFSAs that are 4, 6, or 8 carbons long, methodologies are generally not
available outside academic settings.26 The Michigan PFAS Science Advisory Panel summarizes
the advantages and disadvantages of some available analytical methodologies to quantify PFAS
as a class. These are included in Table 11 below (with additional information as cited). 26
We recommend that the state explore an analytical method, or combination of methods, that can
be used as a surrogate for total PFAS. In particular, we recommend the state evaluate alternative
detection methodologies, particularly TOPA, to measure the concentration of non-discrete and
difficult to measure PFAS compounds that are not determined by conventional analytical
methods.
Table 11: Comparison of Various Analytical Approaches to Quantifying PFAS
w https://pfas-1.itrcweb.org/wp-content/uploads/2018/03/pfas_fact_sheet_site_characterization_3_15_18.pdf x https://www.epa.gov/water-research/epa-drinking-water-research-methods y https://www.alsglobal.com/-/media/als/resources/services-and-products/environmental/data-sheets-canada/pfas-by-
top-assay.pdf z https://link.springer.com/article/10.1007/s00216-018-1028-4
Table 11 summarizes advantages and limitations of various analytical approaches to quantifying
PFAS.dd
Treatment
There are a number of treatment options available to public water systems to address PFAS
contamination.
On August 23, 2018, EPA published the results of its efforts to study a variety of technologies
used to remove PFAS from drinking water.148 The EPA’s treatability analysis for PFAS
compounds demonstrates that current treatment technologies can reduce concentrations of
PFOA, PFOS, PFNA, and PFHxS to concentrations below 2 ppt. Full-scale treatment facilities in
the U.S., Europe, and Australia have demonstrated effective removal of PFAS compounds
through a variety of treatment technologies, most successfully with activated carbon or
membrane filtration. The EPA’s treatability analysis did not include data on the treatment of
aa https://www.sciencedirect.com/science/article/pii/0168583X86903812 bb https://www.ncbi.nlm.nih.gov/pmc/articles/PMC5895726/ cc https://www.ncbi.nlm.nih.gov/pmc/articles/PMC5895726/ dd Michigan PFAS Science Advisory Panel, 2018. Scientific Evidence and Recommendations for Managing PFAS