Page 1
Alma Mater Studiorum – Università di Bologna
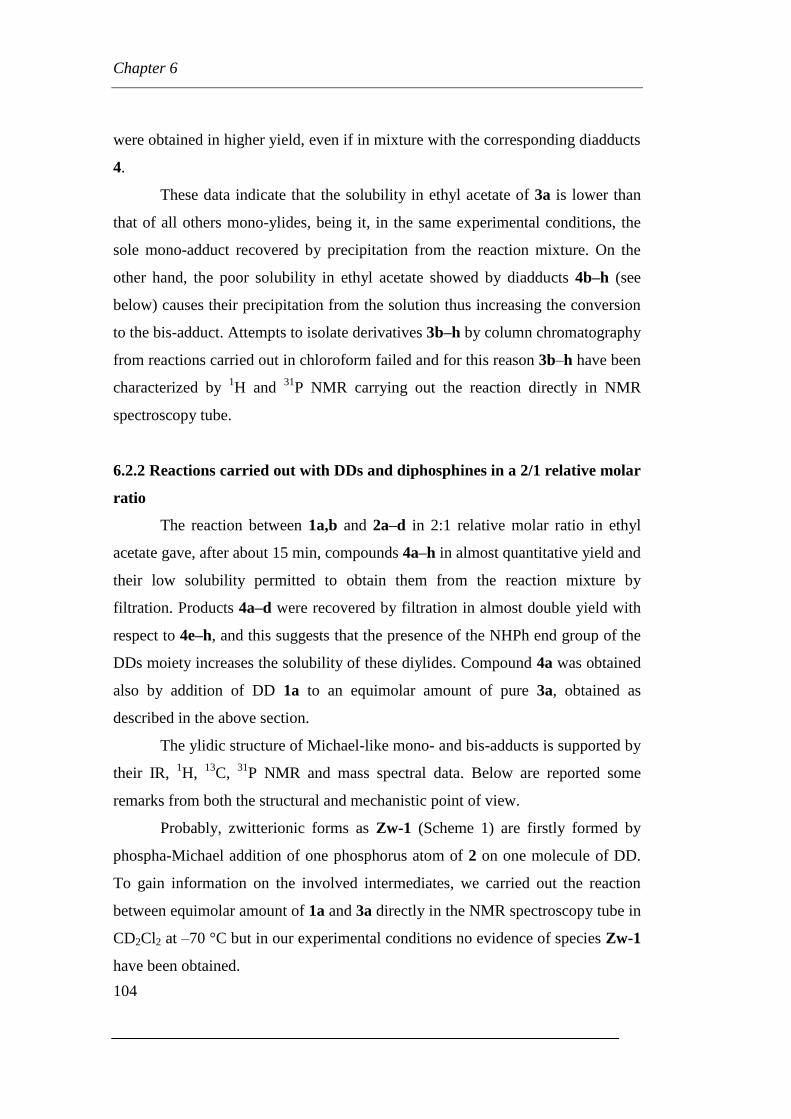
DOTTORATO DI RICERCA IN
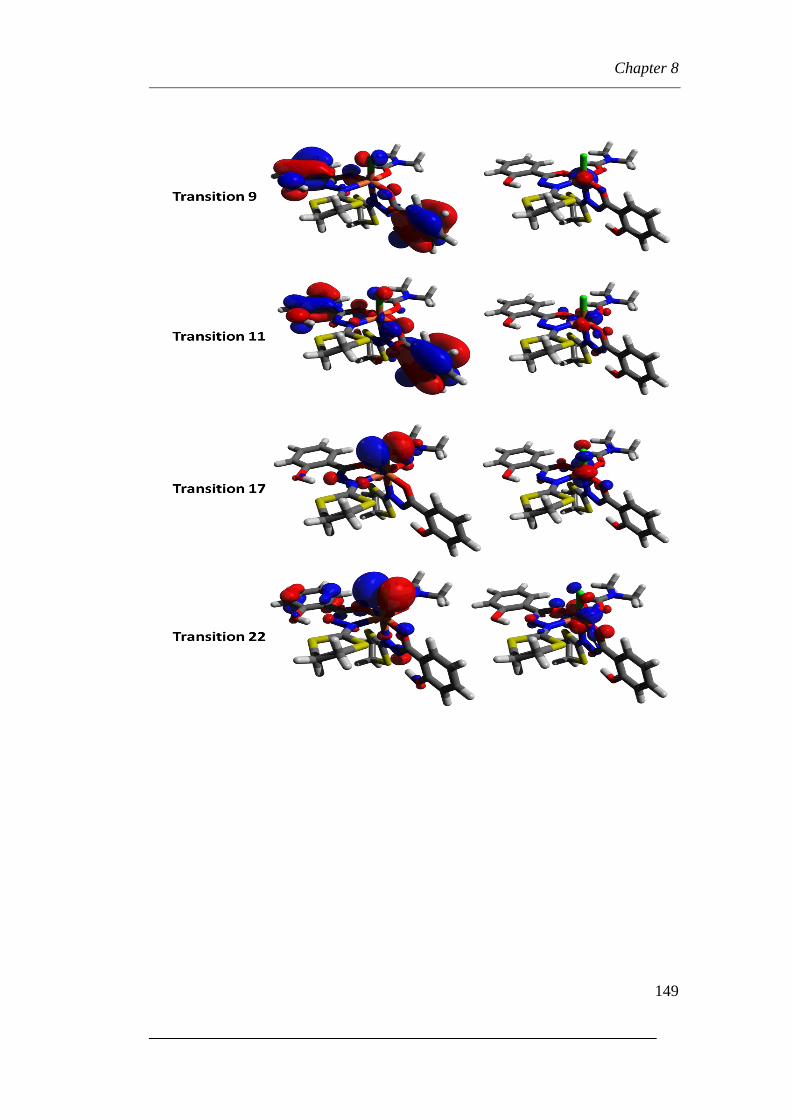
Scienze Chimiche
Ciclo XXV
Settore Concorsuale di afferenza: 03/C1 Settore Scientifico disciplinare: CHIM/06
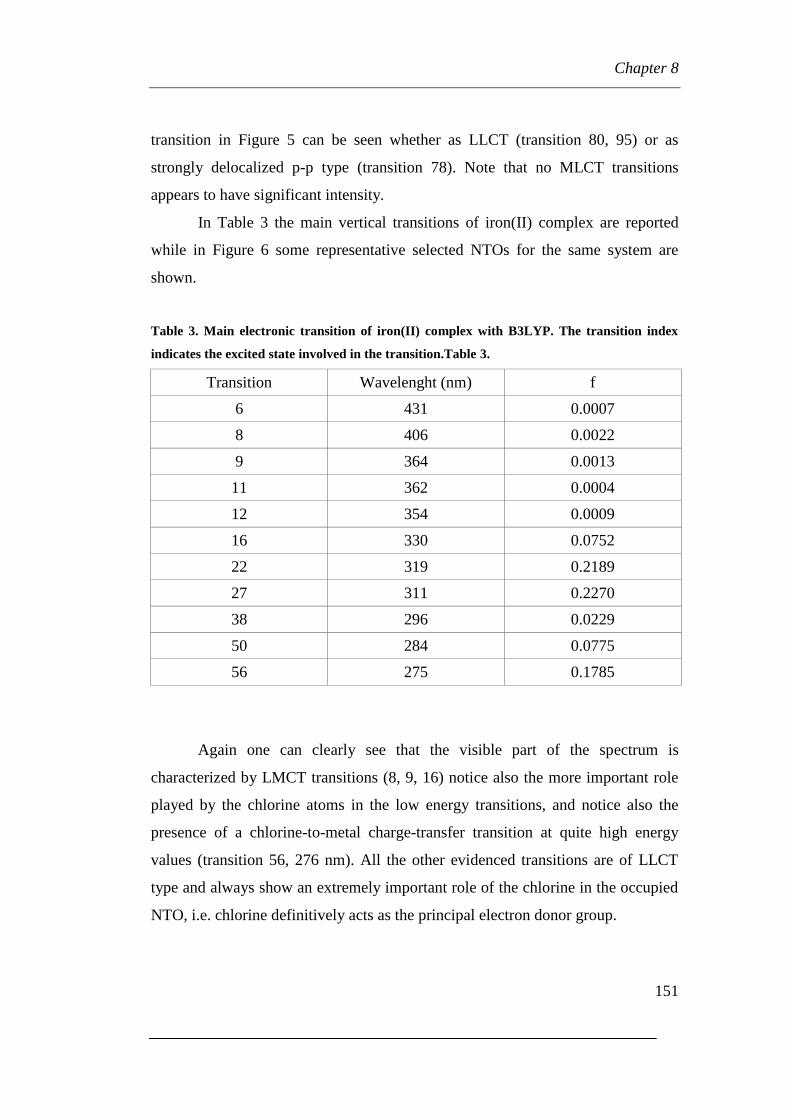
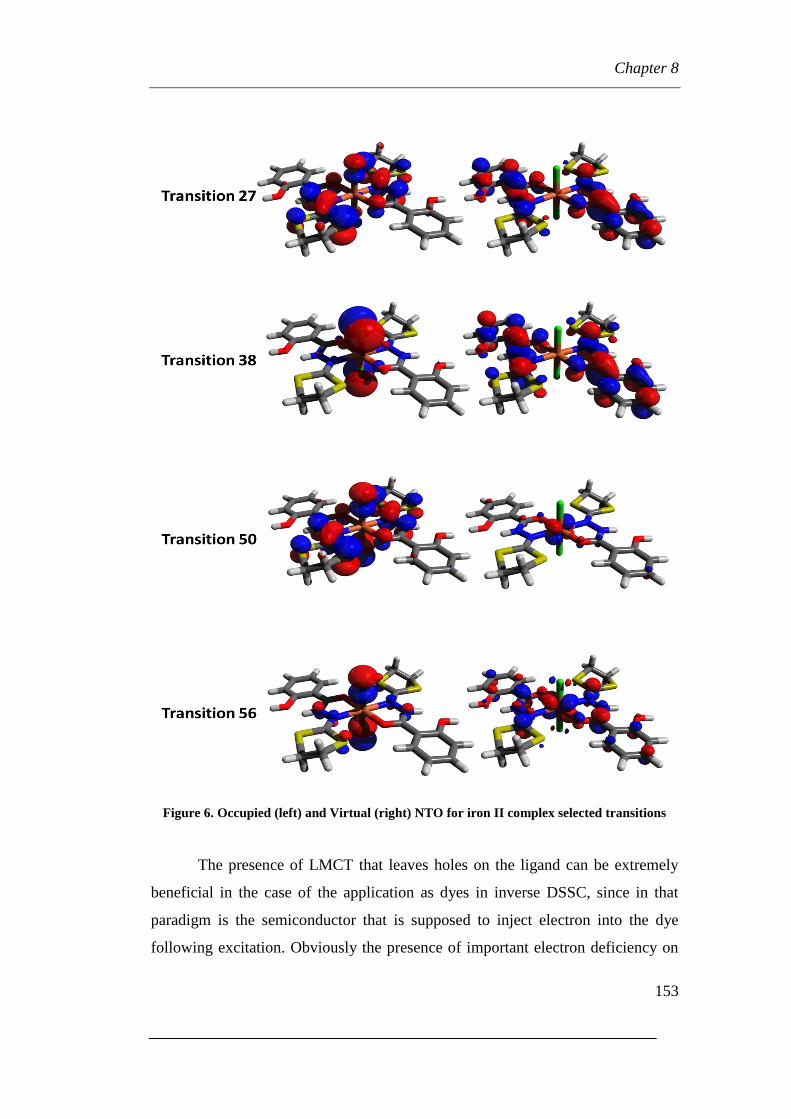
TITOLO TESI
Reactivity of activated electrophiles and nucleophiles: labile intermediates and
properties of the reaction products
Presentata da: Zanna Nicola
Coordinatore Dottorato Relatore
Prof. Adriana Bigi Dott. Carla Boga Co-Relatore Prof.Luciano Forlani
Esame finale anno 2013
Page 3
Table of contents
1
Table of contents
PREFACE
Chapter 1: A general overview on the electrophilic and nucleophilic aromatic
substitution reactions
1.1 Electrophilic Aromatic Substitution Reactions (SEAr)
1.2 Nucleophilic Aromatic Substitution Reaction (SNAr)
Chapter 2: The proton dance in tris(dialkylamino)benzenes
2.1 The interactions of proton with tris(dialkylamino)benzenes
2.1.1 Protonation of symmetric tris(dialkylamino)benzene derivatives
2.1.2 Effect of the temperature’s change
2.1.3 Protonation of asymmetric tris(dialkylamino)benzenes
2.1.4 X-Ray diffraction analysis
2.2 First X-ray structure of the Wheland complex in azo-coupling reaction
Chapter 3: 2,4-dipyrrolidine-1,3-thiazole as a new supernucleophile
3.1 Synthesis and characterization of ultrastable W-M complexes
3.2 A theoretical study on the structure, energetic and properties of the W-M
complexes
3.2.1 Theoretical structures
3.2.2 Energetic Along Reaction’s Pathways and Functional Benchmark
3.2.3 Electronic Properties
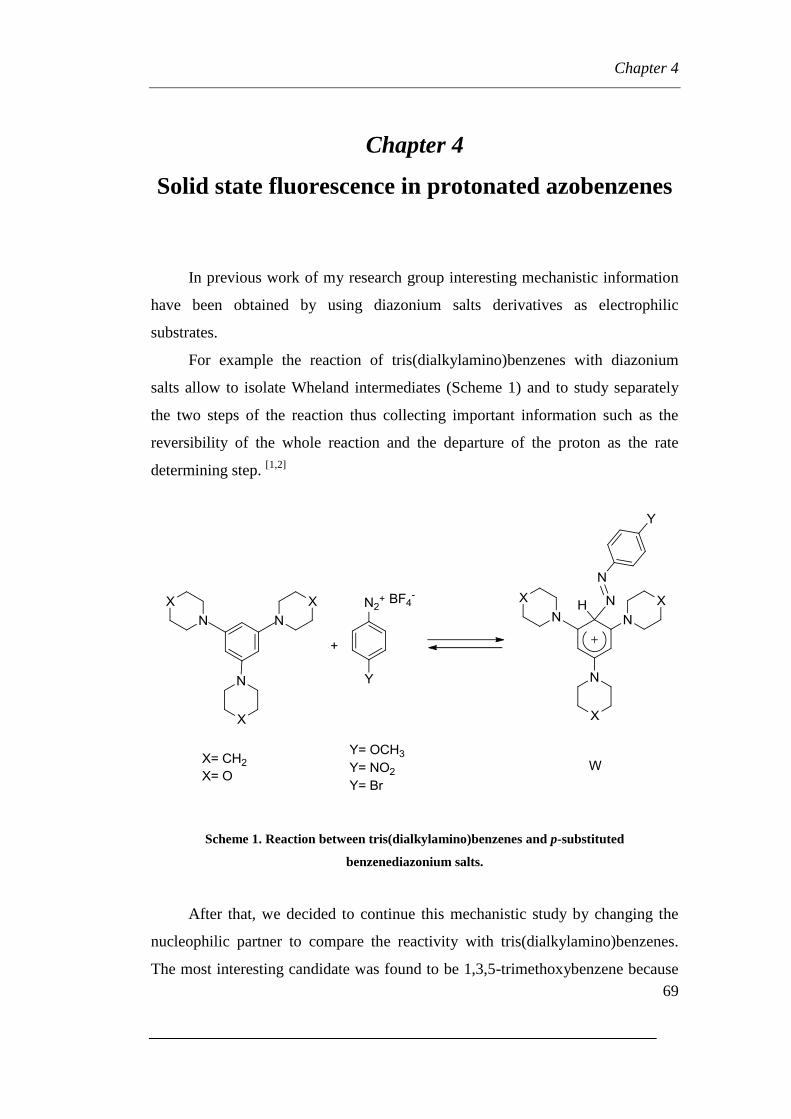
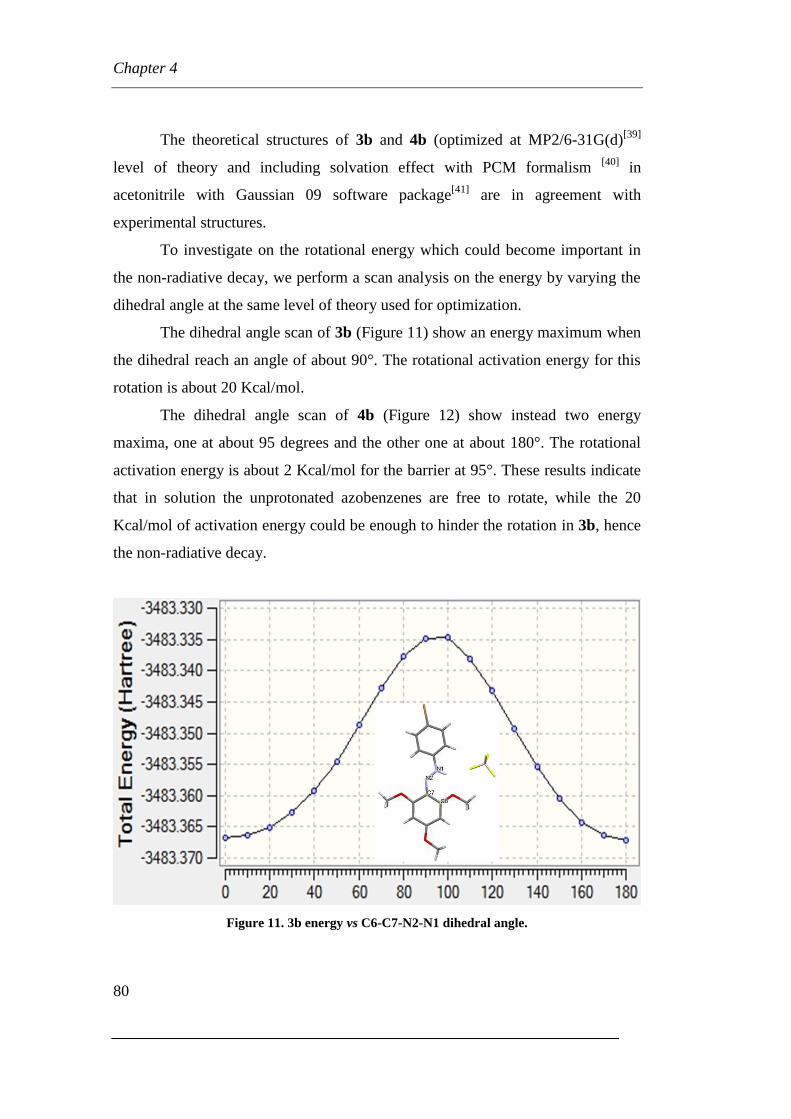
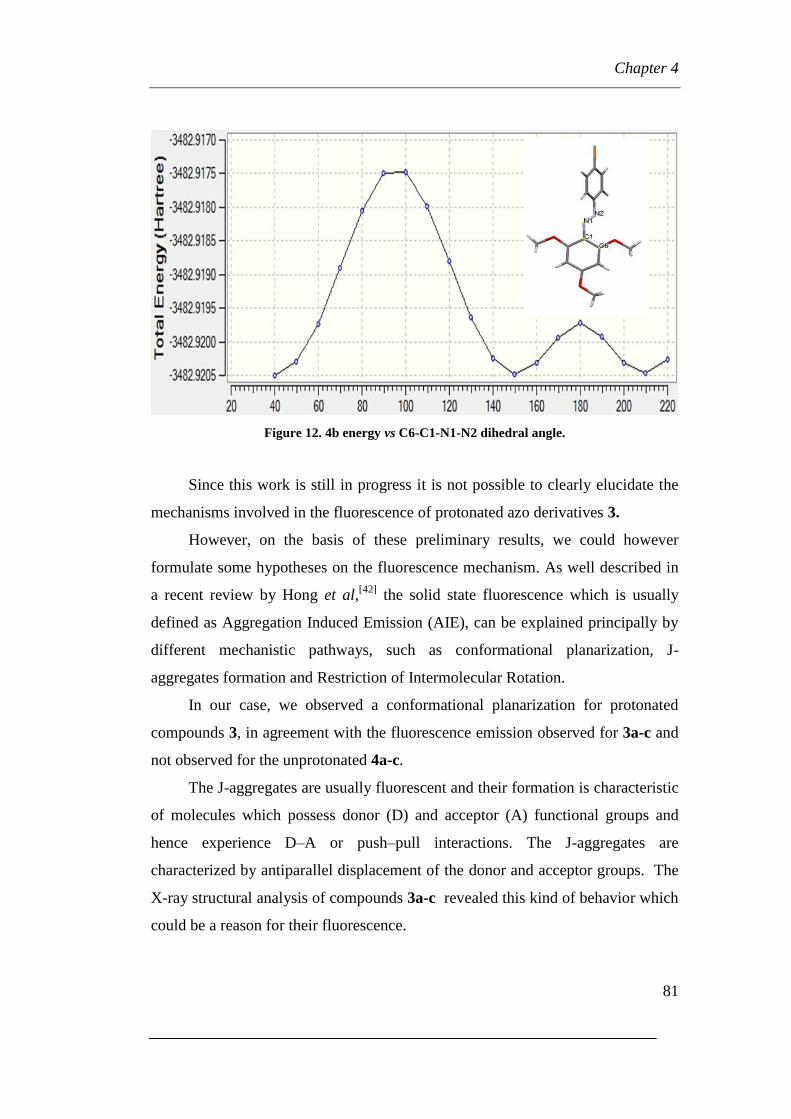
Chapter 4: Solid state fluorescence in protonated azobenzenes
4.1 Coupling reaction of 1,3,5-trimethoxybenzene and diazonium salt
derivatives
4.2 Fluorescence of azobenzene derivatives
4.3 Experimental and theoretical structures of azobenzene derivatives
Page 4
Table of contents
2
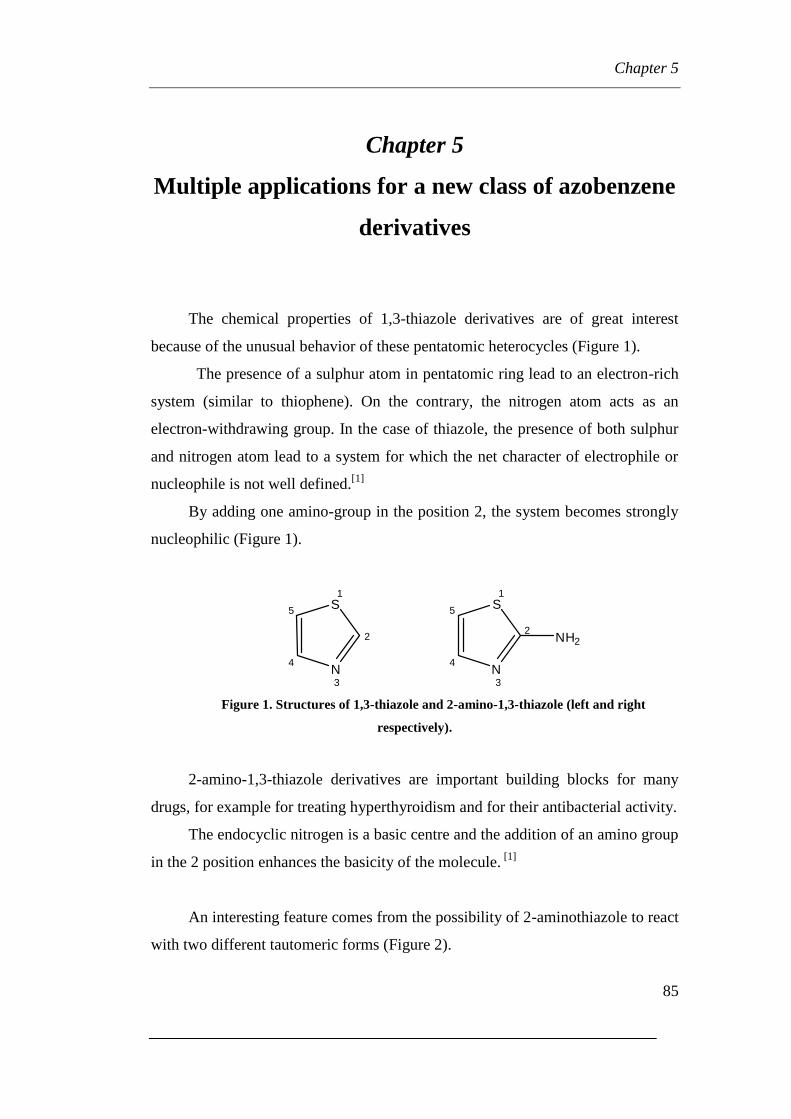
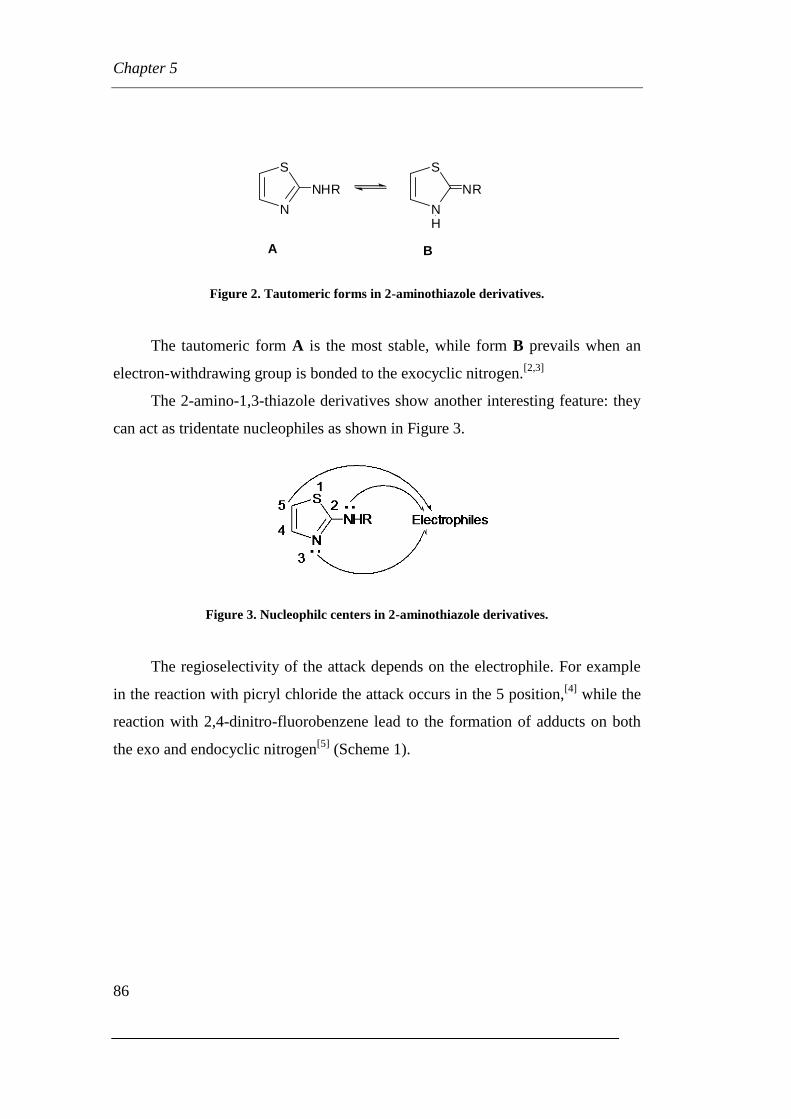
Chapter 5: Multiple applications for a new class of azobenzene derivatives
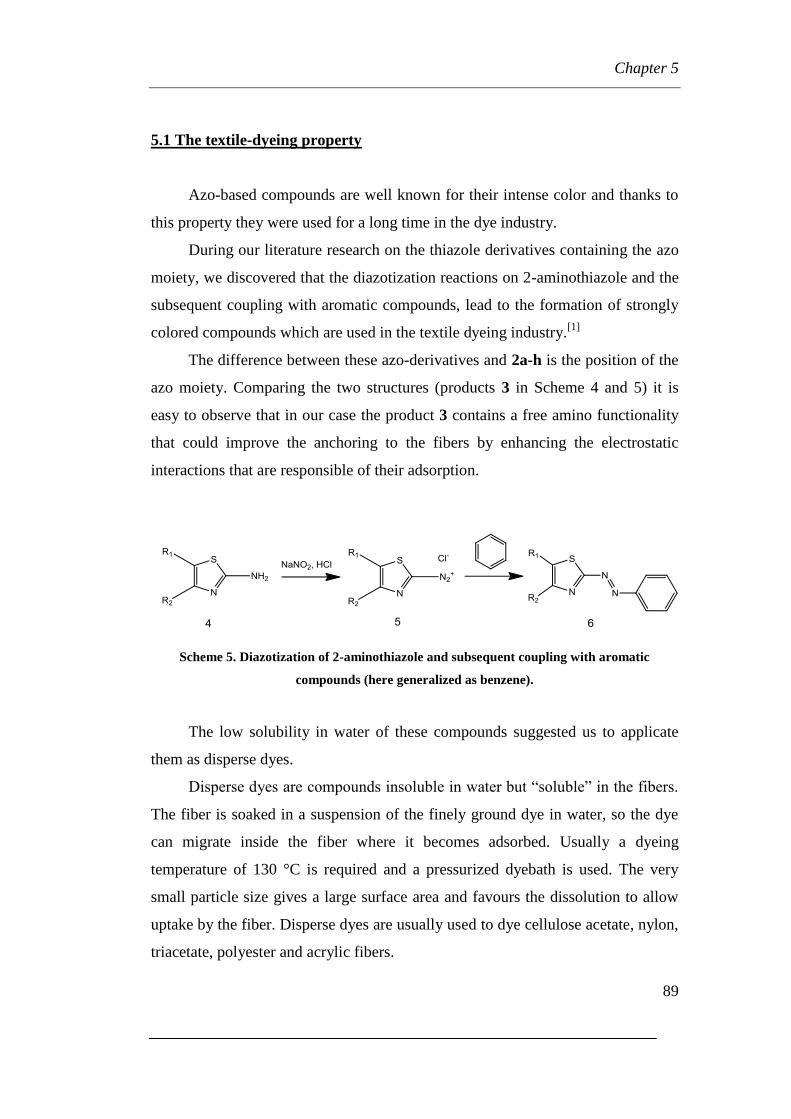
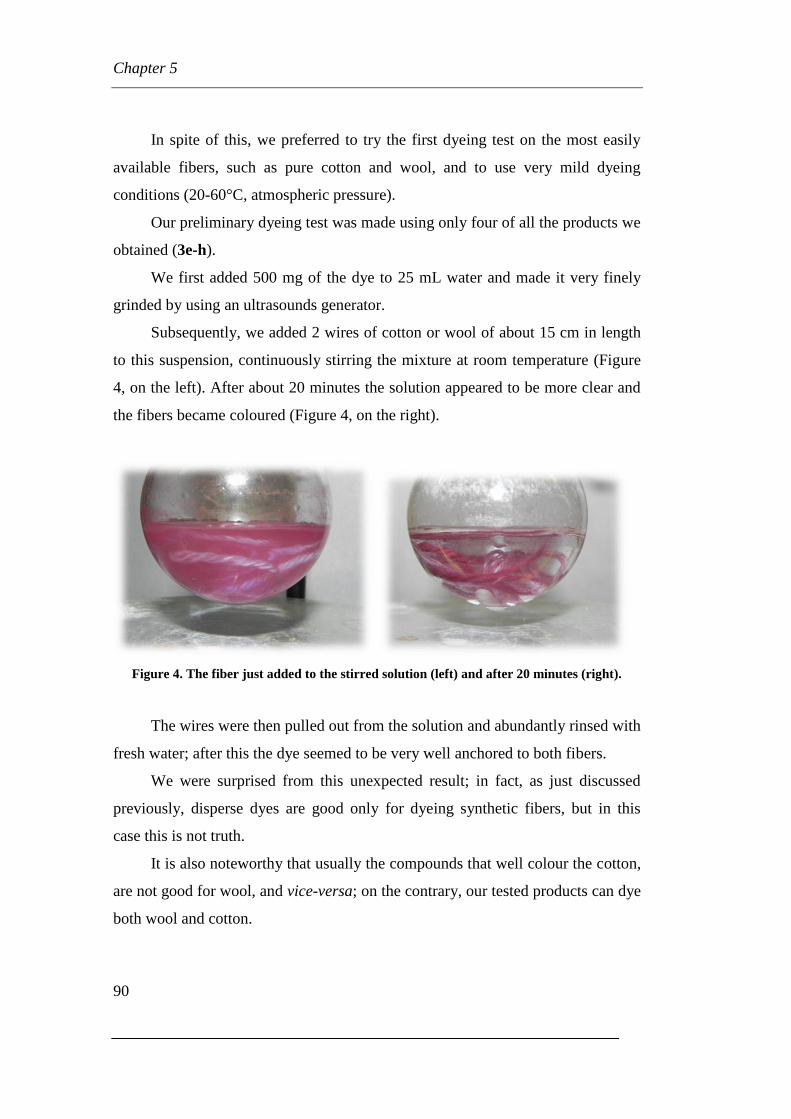
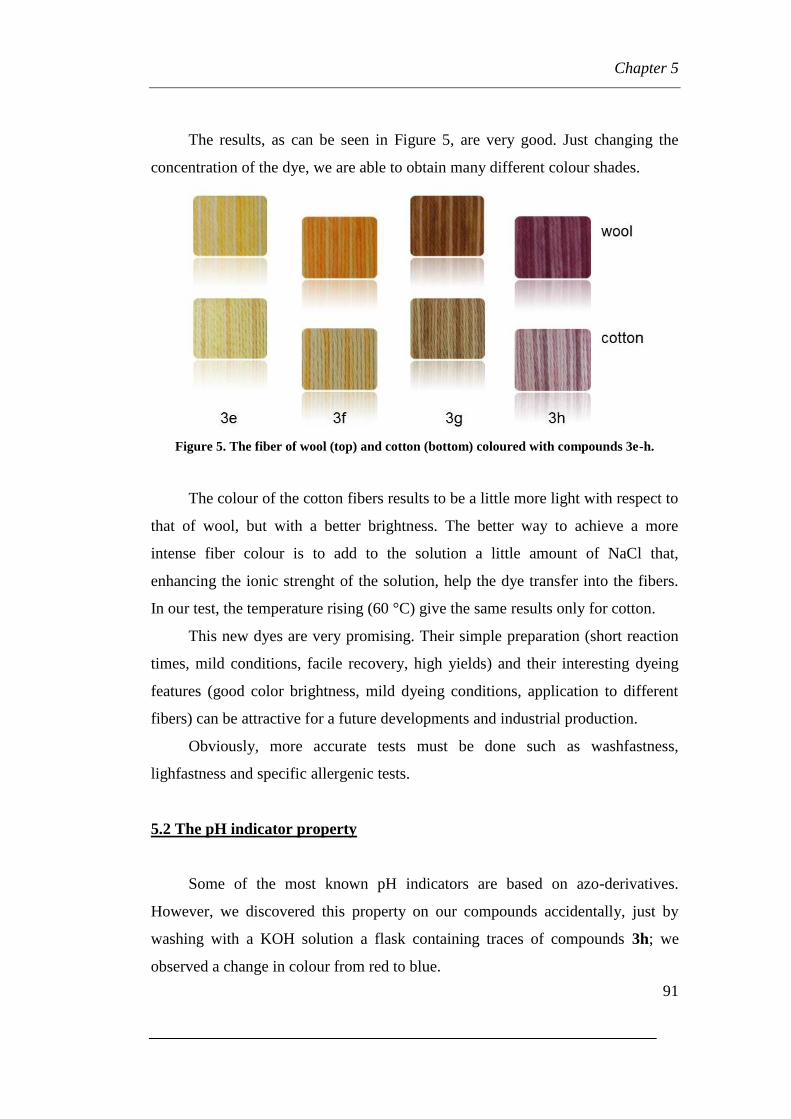
5.1 The textile-dyeing property
5.2 The pH indicator property
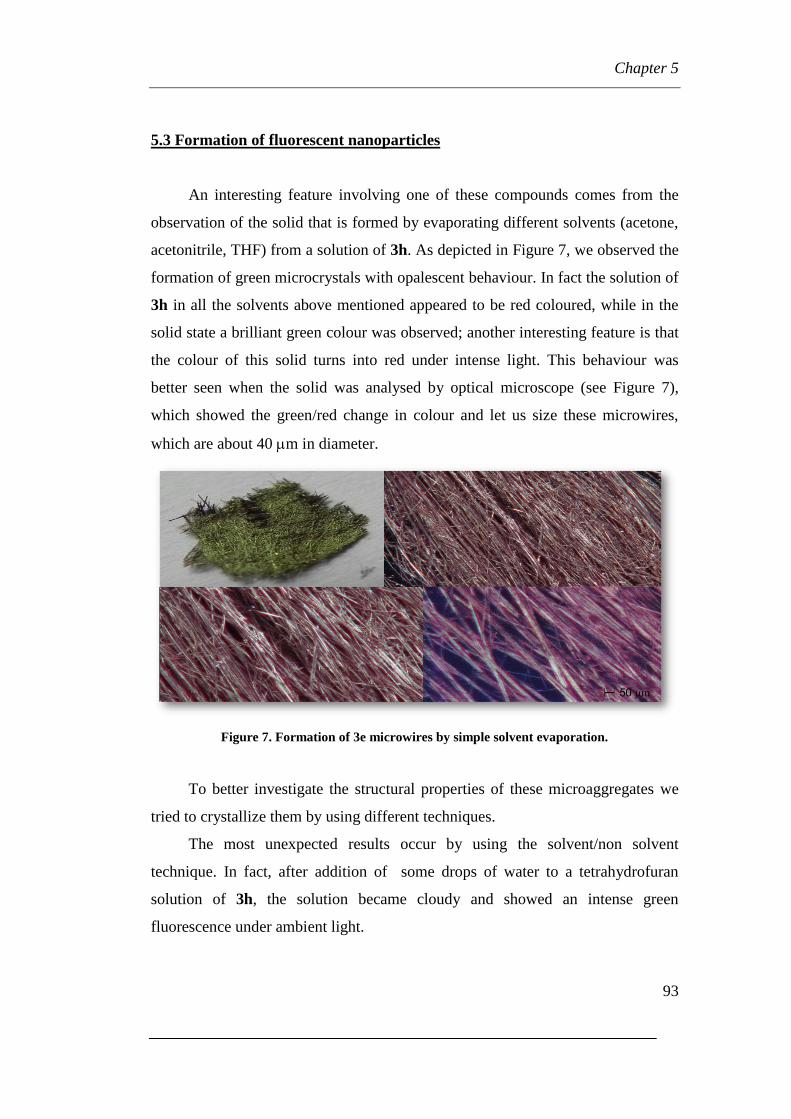
5.3 Formation of fluorescent nanoparticles
5.3.1 Preparation of fluorescent nanoparticles
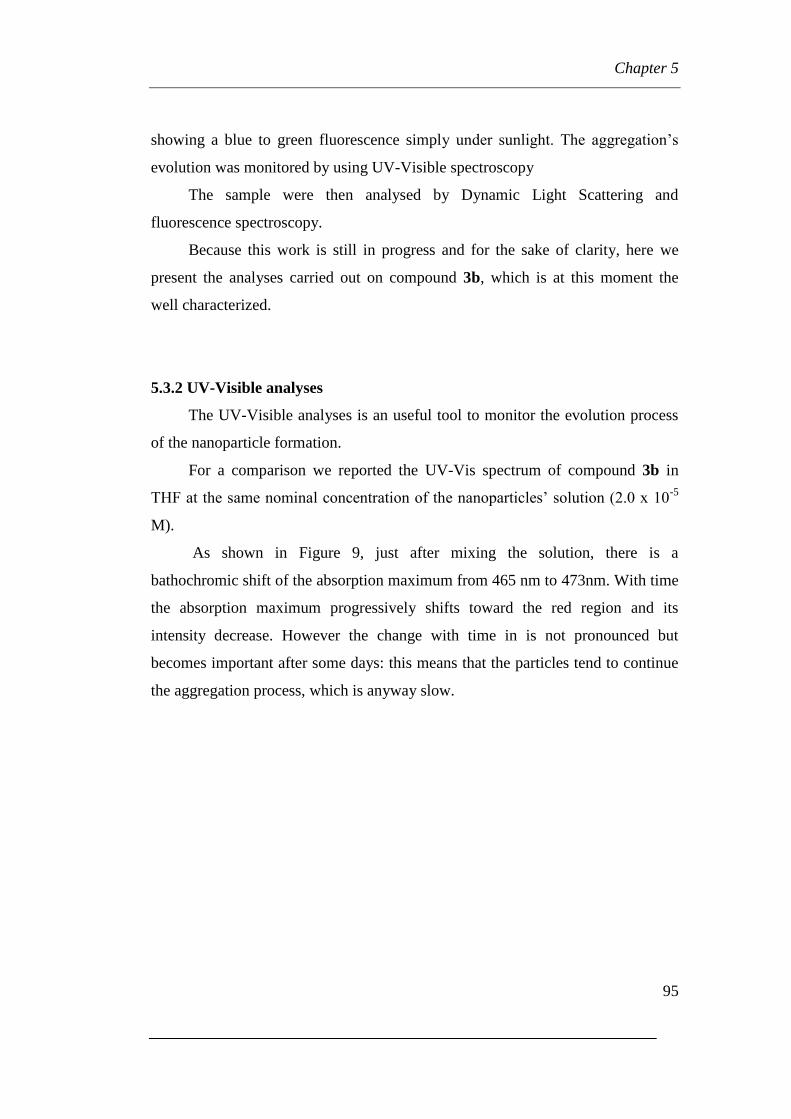
5.3.2 UV-Visible analyses
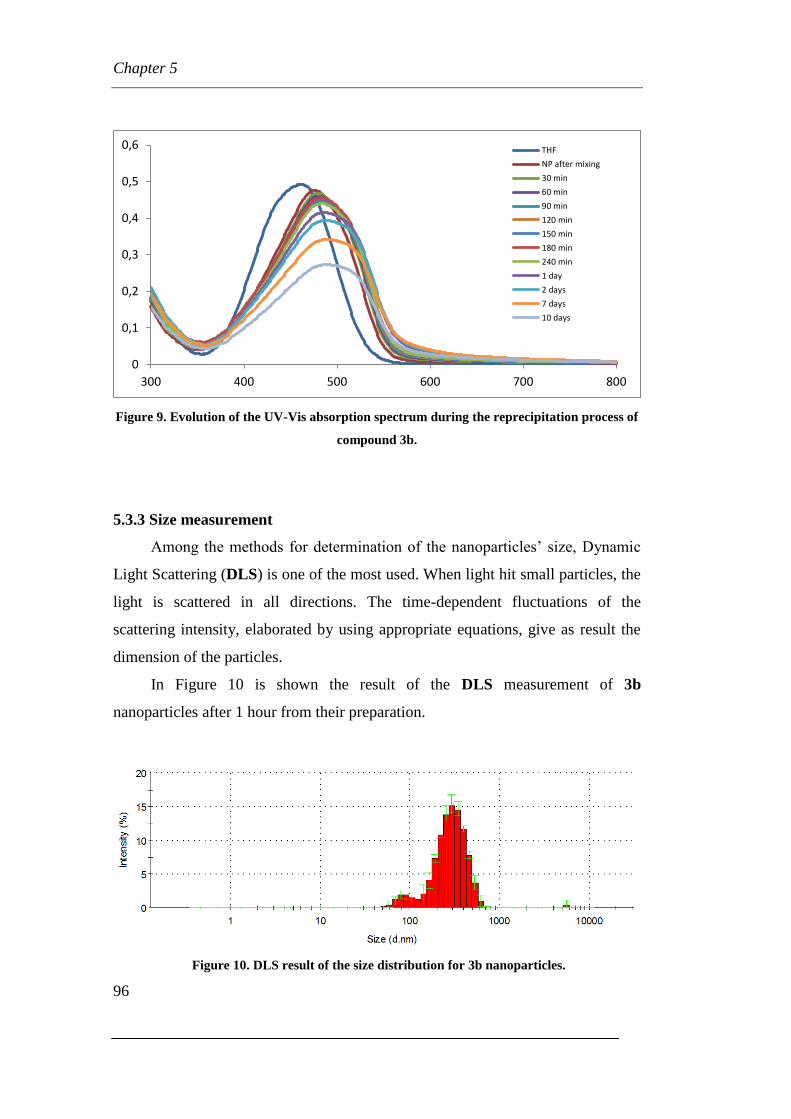
5.3.3 Size measurement
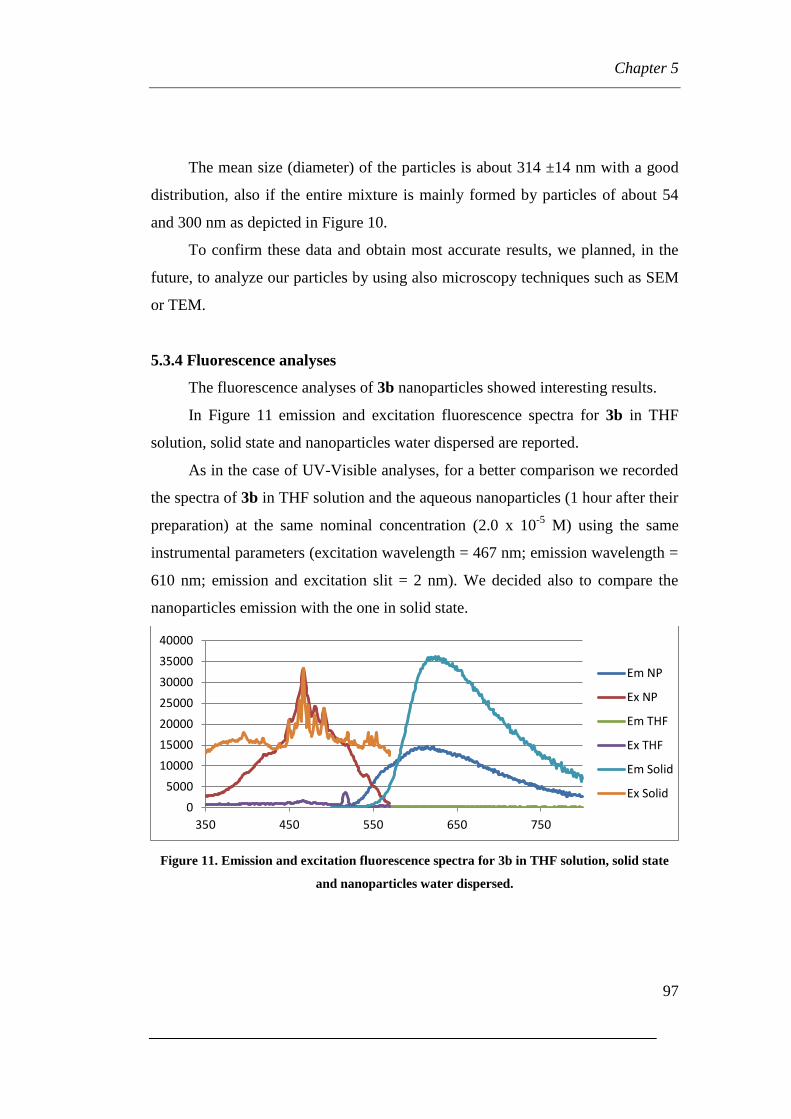
5.3.4 Fluorescence analyses
Chapter 6: Phospha Michael-type reaction of bidentate nucleophiles
6.1 Brief summary of used reagents
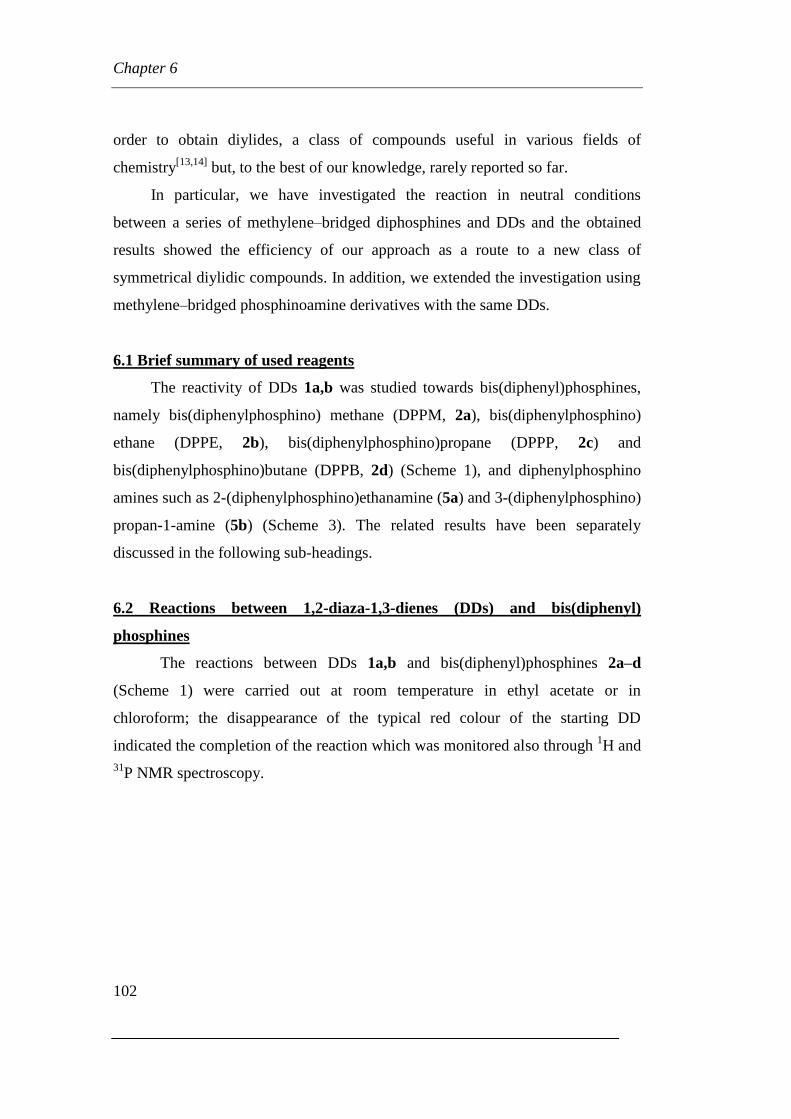
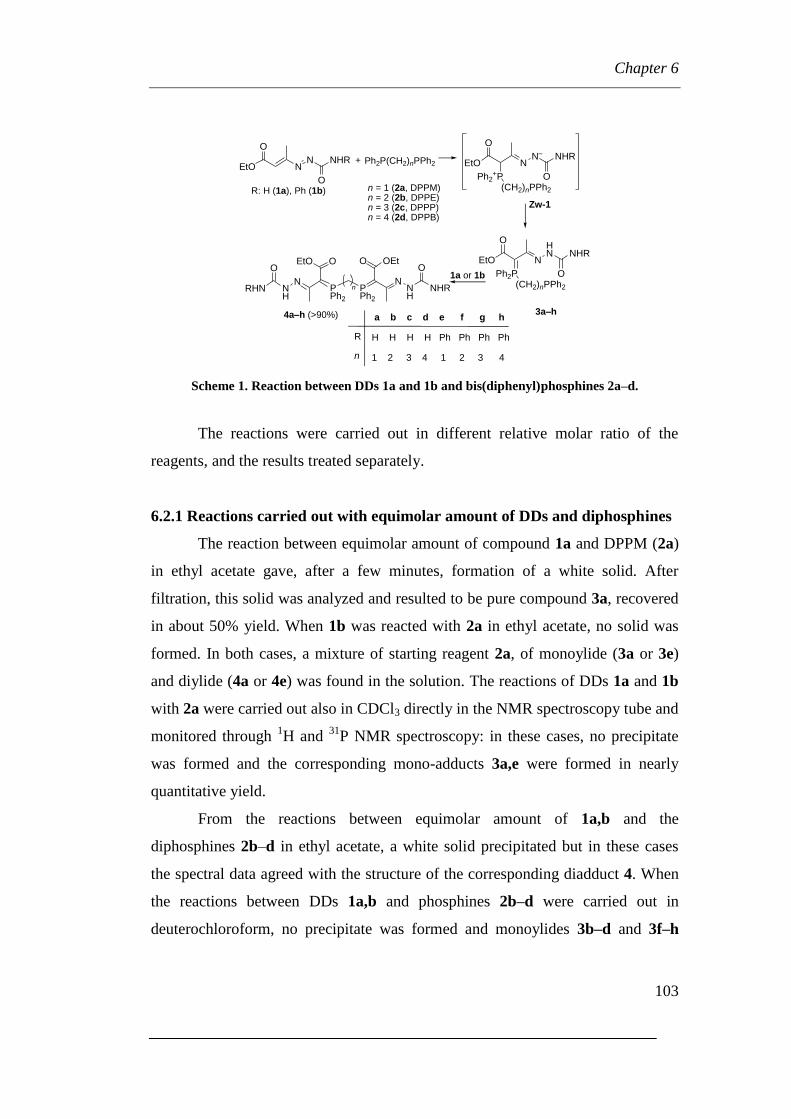
6.2 Reactions between 1,2-diaza-1,3-dienes (DDs) and bis(diphenyl)
phosphines
6.2.1 Reactions carried out with equimolar amount of DDs and
diphosphines
6.2.2 Reactions carried out with DDs and diphosphines in a 2/1 relative
molar ratio
6.3 Reactions between 1,2-diaza-1,3-dienes and diphenyl phosphino amines
Chapter 7: Interaction between gliadins and coumarin: a joint theoretical and
experimental study
7.1 Coumarin (3-EcC) and Glia at neutral pH
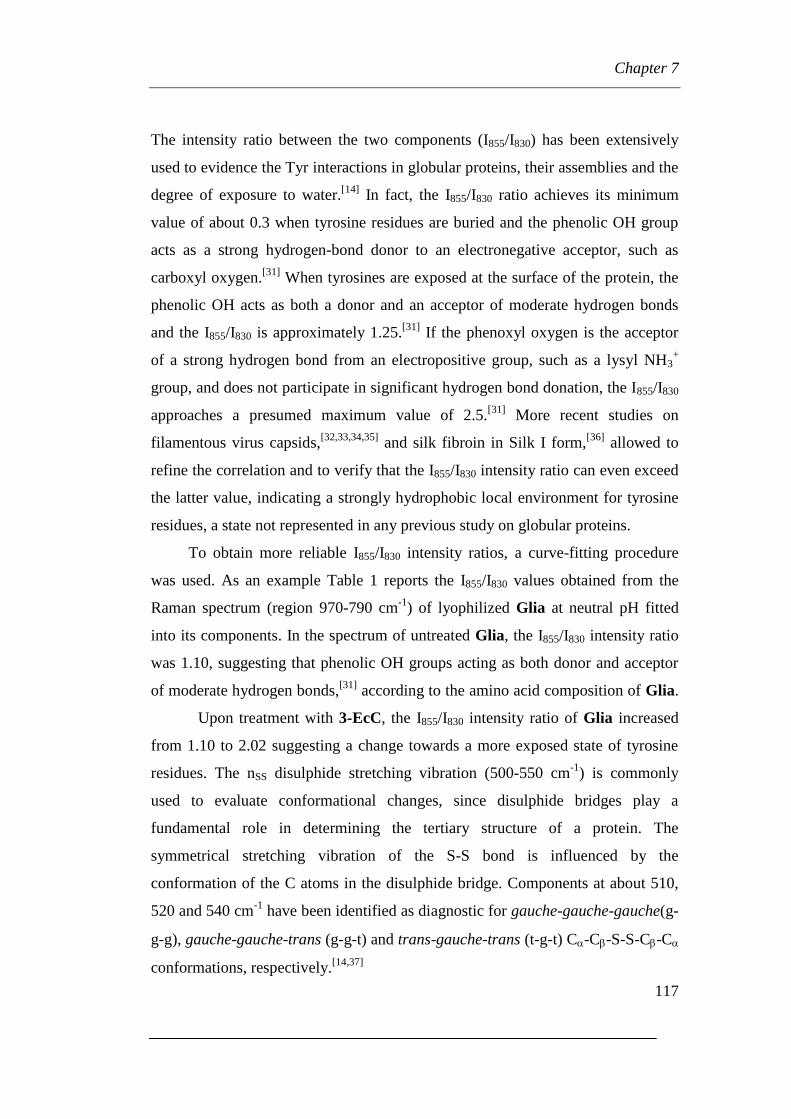
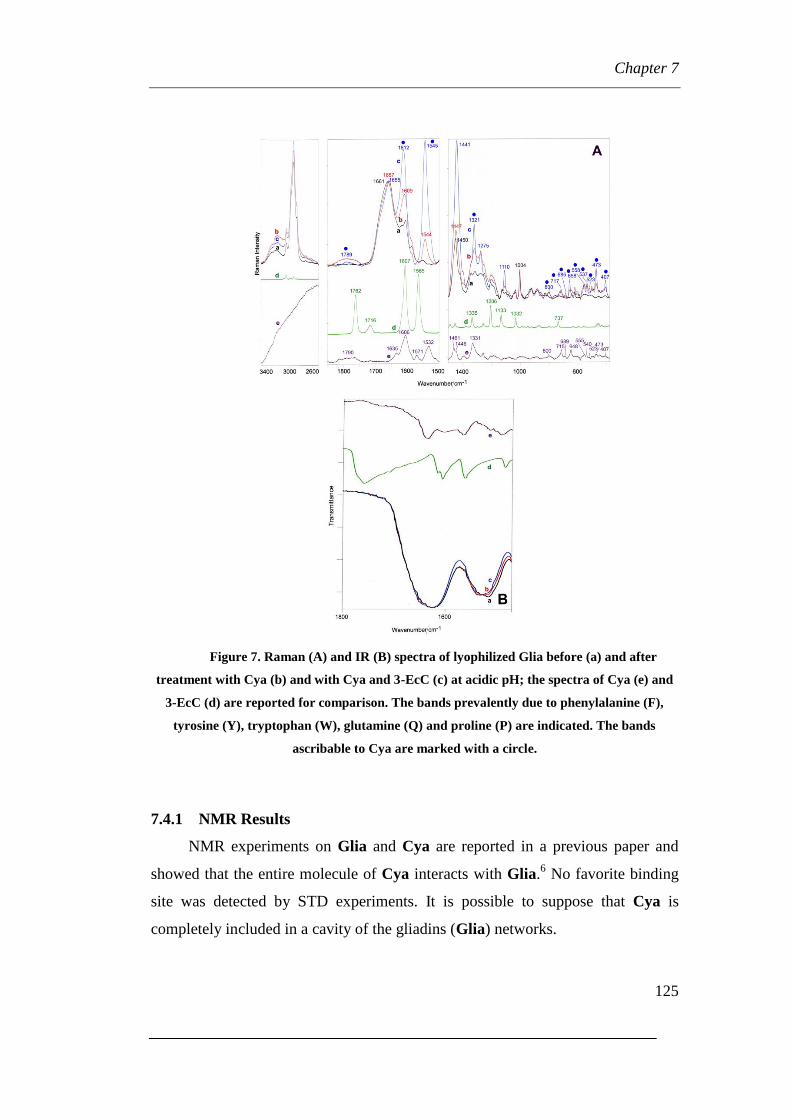
7.1.1 Raman and IR vibrational results
7.1.2 NMR Results
7.2 Coumarin (3-EcC) and Glia at acidic pH
7.2.1 Raman Results
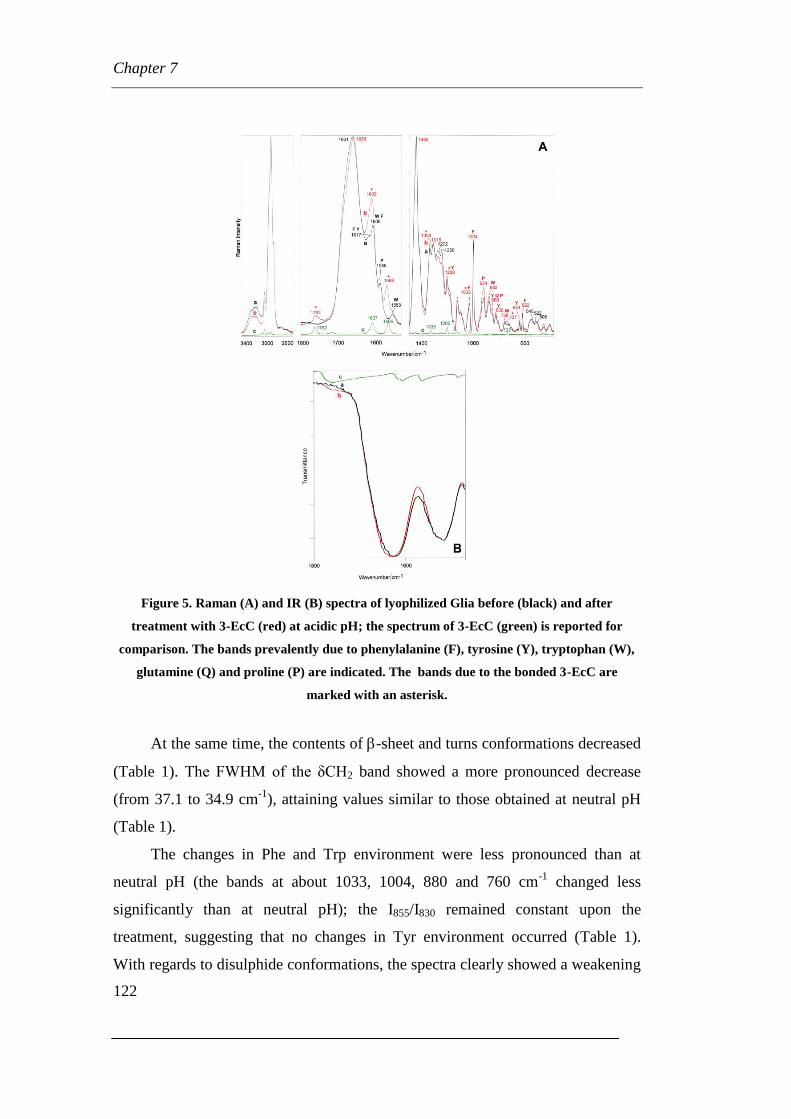
7.2.2 NMR Results
7.3 Cyanidin (Cya) and Glia at acidic pH
7.3.1 Raman Results
7.3.2 NMR Results
Page 5
Table of content
3
7.4 A complex between coumarin and cyanidin? Influence on gliadin (Glia)
secondary structure
7.4.1 Raman Results
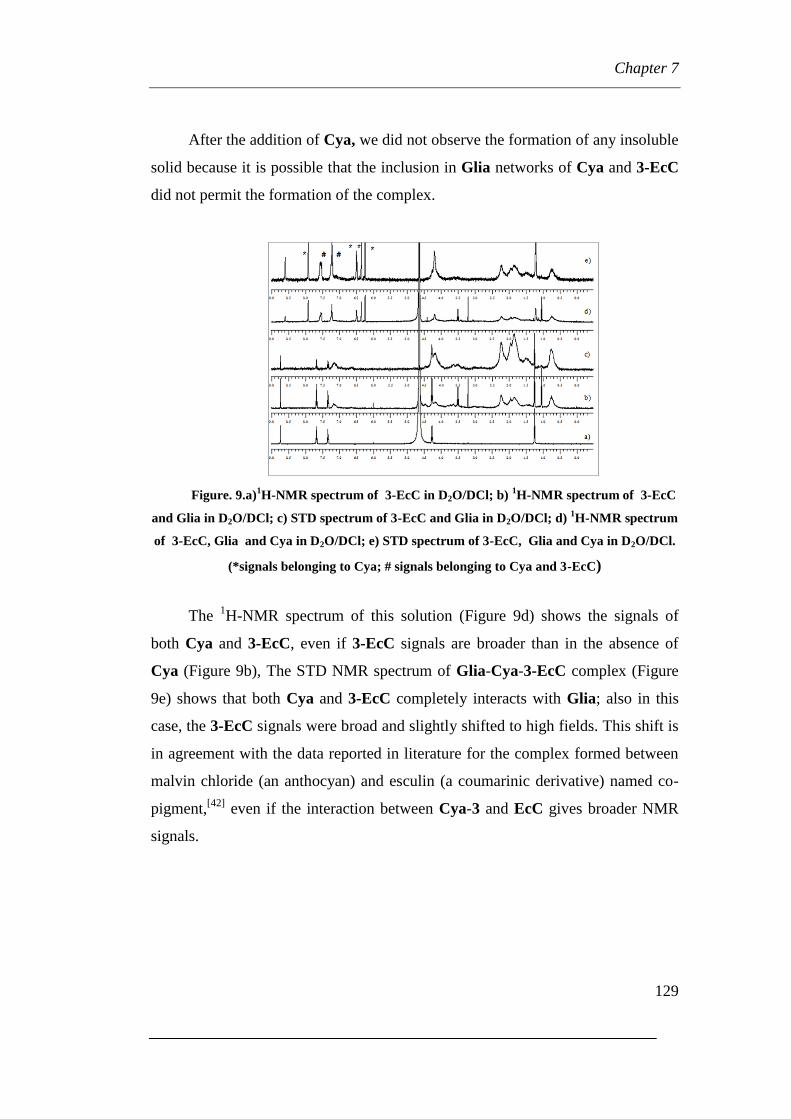
7.4.2 NMR Results
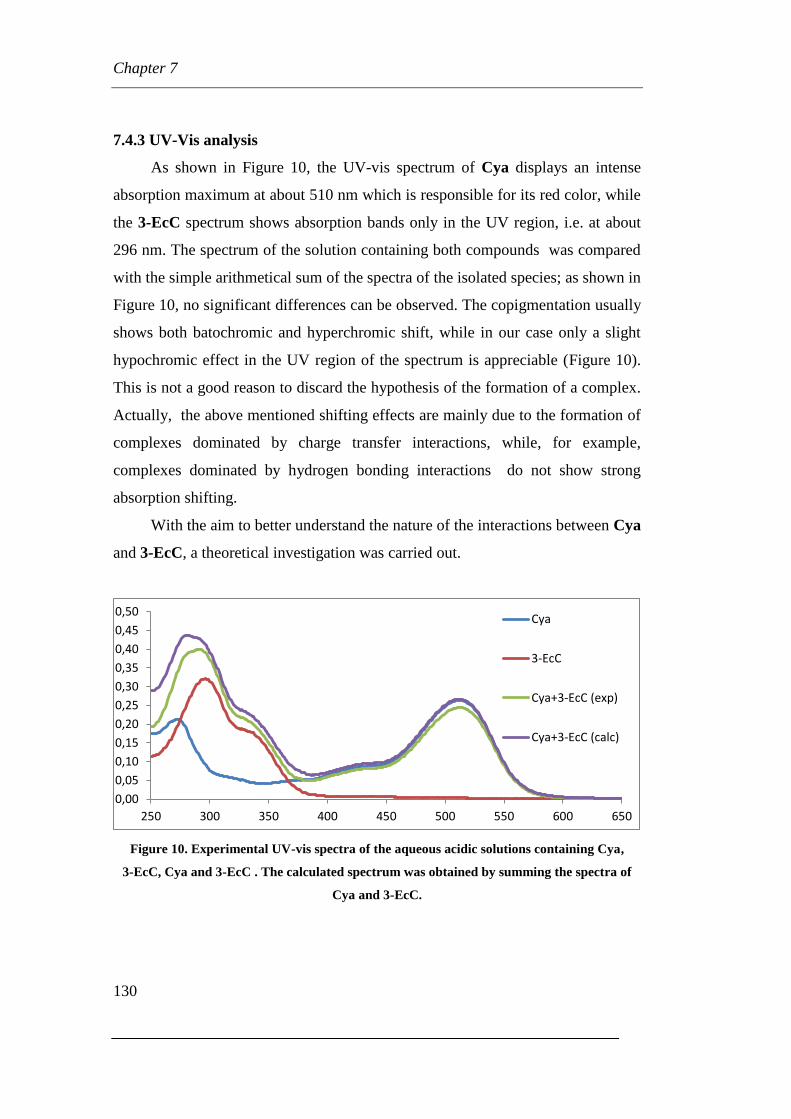
7.4.3 UV-Vis analysis
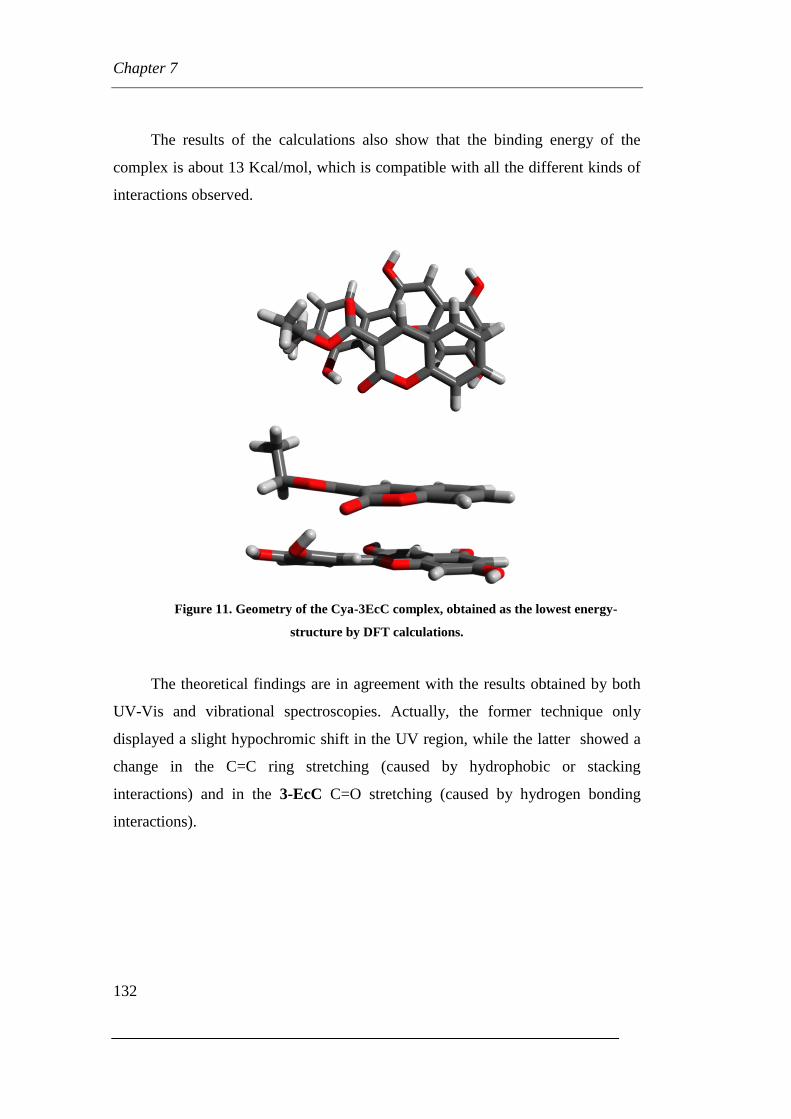
7.4.4 Theoretical calculation
Chapter 8: Theoretical study on the spectroscopic properties of iron
complexes
8.1 Computational methods
8.2 Functionals benchmarking
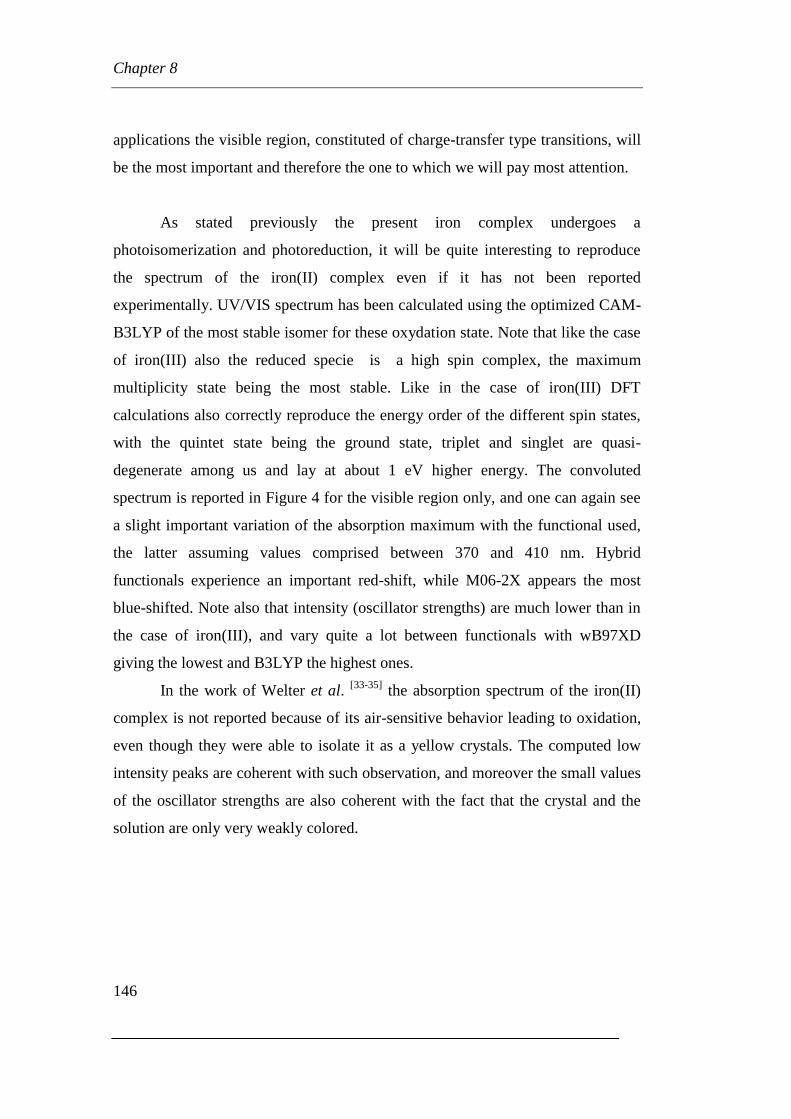
8.3 Transition analyses
Page 6
Table of contents
4
Page 7
Preface
5
Preface
During my time as Ph.D. student I worked in the Forlani-Boga’s research
group. From a long time the research group’s interest lies in the study of
nucleophilic/electrophilic aromatic substitution reactions in particular from a
mechanistic point of view.
These reactions were studied a lot in the past since aromatic compounds
became building blocks for the development of materials with large applications.
The accurate knowledge of their reactivity had a crucial and strategic role for the
improvement of yields and number of steps in the industrial context.
From an academic point of view, a lot of more detailed studies were
carried out with the aim of rationalize the basic reactions of aromatic rings such as
nucleophilic and electrophilic substitutions. These studies were done to better
understand the effects of substituents on the activation and regioselectivity of the
attack by means of both electrophilic and nucleophilic reagents. The kinetic
analyses were for a long time the only way to give an explanation to these
questions, which also corroborated the simple approach of the number of
resonance structures describing the system.
Afterwards, more sophisticated techniques allowed to identify some
reaction’s intermediates, which expanded the knowledge about aromatic
substitution reactions. But even much more is to be discovered, and we tried to do
it with the newest instruments that science give us.
For example, the Nuclear Magnetic Resonance (NMR) spectroscopy,
which is actually among chemists the most used technique, allowed us to carry out
the reactions directly in the NMR tube also at low temperature to letting us study
the reaction’s intermediates.
However our attention was mainly focused on the reactivity of
superactivated aromatic systems. In spite of their high reactivity (hence the high
reaction’s rate), we were able to identify and in some case to isolate -complexes
Page 8
Preface
6
until now only hypothesized. Interesting results comes from the study of the
protonation of the supernucleophiles tris(dialkylamino)benzenes.
The goal of isolate stable complexes was achieved thanks to a mindful
design of these superactivated reagents, which was basically the main target of my
Ph. D. research.
Furthermore we discovered, in some case fortuitously, some relevant
properties and applications of the compounds we synthesized, such as
fluorescence in solid state and nanoparticles or textile dyeing. We decided to
investigate all these findings also by collaborating with other research groups.
Another collaboration with University of Urbino allowed us to investigate
on the reactivity of 1,2-diaza-1,3-dienes toward nucleophiles such as amino and
phosphine derivatives.
With the increasing power of computers and new methodologies such as
Density Functional Theory (DFT) approach, computational chemistry has become
actually an useful tool also for organic chemists which can easily carried out their
studies by its own, looking for a support on the hypothesis based on the
experimental data. Since the main topic of my Ph. D. thesis was the study on the
reaction’s mechanisms, I decided to begin a new path in the field of theoretical
chemistry, with the aim and the hope to obtain important elucidation which could
be able to help me in better describe the hypothesis based on my experimental
data.
The choice of dedicate part of my research in the field of computational
chemistry proceeded with a period in the “Laboratoire de Structure et Réactivité
des Systèmes Moléculaires Complexes-SRSMC, Université de Lorraine et CNRS,
France” in which I improved my knowledge about the topic, making a study on
new iron complexes for the use as dyes in Dye Sensitized Solar Cells (DSSC).
Furthermore, thanks to this new expertise, I was involved in a collaboration for
the study of the ligands’ interaction in biological systems.
This brief introduction is to explain the decision to separate the thesis in
various chapters on the basis of the different research topics I have worked on.
Page 9
Chapter 1
7
Chapter 1
A general overview on the electrophilic and
nucleophilic aromatic substitution reactions
Electrophilic and nucleophilic aromatic substitution reactions are probably
the most studied reactions.[1,2]
The mechanism and the steps involved in both
kinds of reactions is well known and largely reported in literature.
If we analyze in detail the mechanism of both types of reaction, we can
observe that also if the intermediates have opposite charge, the reactive stages of
reactions are the same. In the first step the electron-rich reagent interacts with the
electron-poor one to give a charge transfer complex and then, with the formation
of a real bond, the -complex is obtained.
The final product is obtained as a result of the departure of the leaving
group or a simple atom, such in the case of hydrogen, which can be present in the
reagent.
Starting from this consideration, new hypothesis about substitution
reactions on aromatic substrate were elaborated; this prompted us to study more in
deep the above mentioned reactions.
1.1 Electrophilic Aromatic Substitution Reactions (SEAr)
The simplest example of this kind of reaction is the substitution of a proton
on a benzene ring.
Benzene is the parent of all aromatic compounds; it is characterized by an
high degree of electron’s delocalization and a lower reactivity with respect to
alkene and alkyne.
Page 10
Chapter 1
8
The evidence of the lower reactivity of aromatic hydrocarbon with respect
to the unsaturated ones was observed from a long time: the electrophilic aromatic
substitution is favored in the first case, while in the second case the electrophilic
addition is preferred.
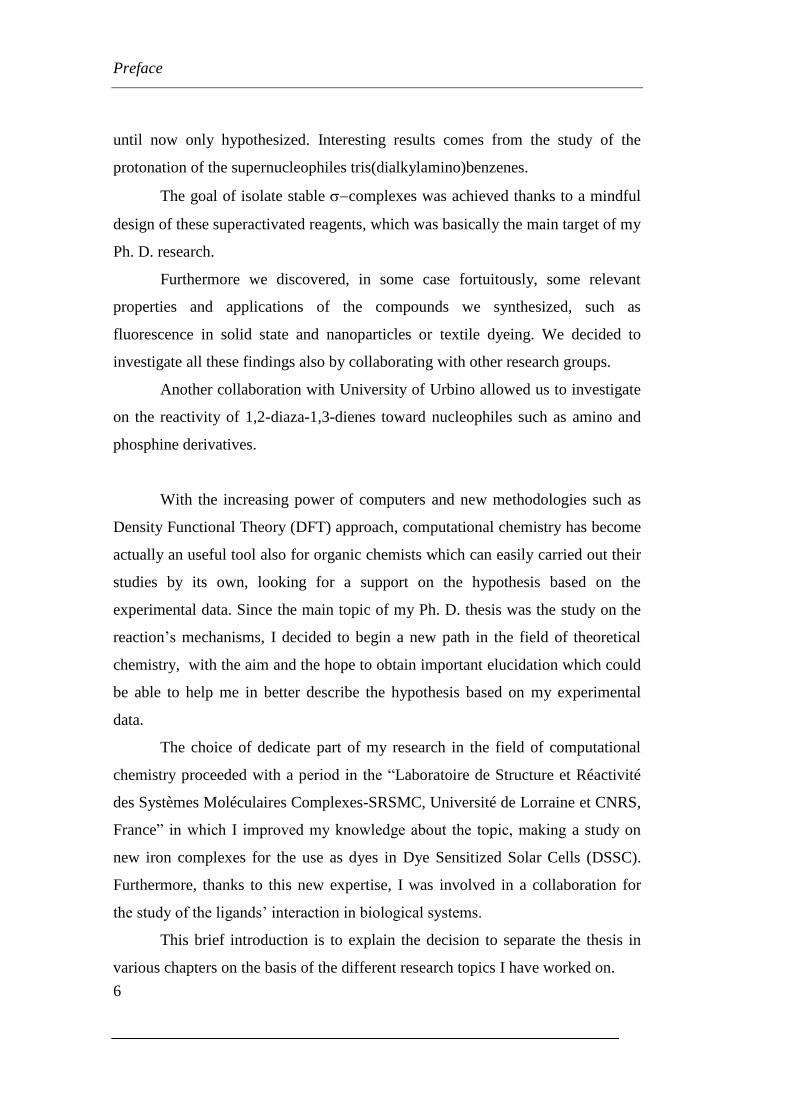
A detailed examination of the aromatic electrophilic substitution reaction
show that the reaction between the aromatic ring and the electrophile bring at first
to the formation of a positively charged intermediate usually called Wheland
complex.[3]
Scheme 1. General scheme for the electrophilic aromatic substitution reactions.
The cationic intermediate (or Wheland) possess a covalent bond between
the electrophilic moiety and the aromatic ring in which one carbon atom change
its hybridization from sp2 to sp
3.
The hybridization change by addition to the double bond and the break of
the highly conjugated aromatic system make the -complex an high energy
intermediate. (Figure 1).[4]
Furthermore, the Wheland intermediate shows an higher stabilization
respect to other cationic intermediates which are generated by addition reaction on
unsaturated non-aromatic compounds. This stabilization is given by the possibility
for the conjugate system to delocalize the charge on the other carbon atoms.[1,2,4]
Page 11
Chapter 1
9
Figure 1. Energetic levels along the reaction coordinates for the electrophilic aromatic
substitution reactions.
Figure 2. Resonance structures of the Wheland intermediate.
This intermediate usually lead to the proton elimination and the subsequent
re-aromatization of the aromatic ring.
The literature reports induce to think that, because of the high rate of the
proton elimination process from the intermediate, the -complex appears to be
more similar to a transition state than to an intermediate.
However the proton substitution with deuterium show that in some cases
the reaction’s rate depends on the break of the C-H bond.[5]
It is still accepted the
presence of two separate steps being the first the electrophilic attack on the
aromatic ring and the second the proton departure, as shown in Figure 1.
Page 12
Chapter 1
10
However the -complex is an intermediate difficult to isolate because it is
a species with a short lifetime for which the concentration result to be really low
during the reaction.[6]
The isolation and characterization of Wheland intermediate has been
possible by the reaction of an electrophile with an hexa-substituted aromatic
system. The cationic intermediate formed is moderately stable because of the
presence of electron-donor groups in a conjugated position respect to the charge
and the lack of easily removable proton.
An example of isolable intermediate comes from the reaction between an
electrophile and hexamethyl-benzene, which lead to the formation of -complexes
charaterizable by using spectroscopic techniques.[7]
Chloro-hexamethylbenzene,
heptamethyl-benzene and nitro-hexamethyl-benzene cations (figure 3) were
isolated and characterized by X-ray diffraction analysis.[8a-b]
Figure 3. Heptamethyl-benzene (a), chloro-hexamethylbenzene (b), and
nitro-hexamethyl-benzene (c) cations.
The energetic and reaction scheme depicted in Figure 1 and Scheme 1
respectively, show only one intermediate. Following studies carried out specially
by J. K. Kochi showed the presence of four steps and three intermediates along
the reaction pathways (scheme 2).[9,10,11,12]
Page 13
Chapter 1
11
Schema 2. The general mechanism of aromatic substitution reactions.
The reaction’s pathway reported in scheme 2 show that in a first step the
electrophile get close to the πelectron of the aromatic systems, bringing to the
formation of a donor-acceptor (DA) interaction. The complex formed is usually
called πcomplex which is not covalent in nature. In a donor-acceptor complex an
interaction between the cloud of the aromatic ring and the electrophile is formed
in a reversible stage.
Hydrochloric acid and toluene form, for example, a complex at -78°C
which is in equilibrium with starting materials.[5]
In a DA complex the electrophile is not localized on a particular atom but
is close to the cloud of the aromatic ring. However some experimental evidence
which involved electrophile such as Br+ o NO2
+ showed their preferential
localization on a specific C-C bond preceding the formation of complex.[13]
The interaction in the complex is weak in nature, hence the energy of
formation is low together with its activation energy. This implies that the rate of
formation of the complex is not highly influenced by the substituent groups on
the aromatic ring. However entropy can have a significant contribution related to
the geometry of the system. In the case of proton this contribution is negligible
because of its small size and the positive charge uniformly distributed on it.
Some complexes have been identified thanks to their property of
showing charge transfer interactions, which can be easily observed as a result of
the high absorption in the visible region of the electromagnetic spectra, hence
resulting in strong colored compounds. In some cases they have been crystallized
and analyzed by X-Ray diffraction spectroscopy.[6,11,12,14]
Page 14
Chapter 1
12
Crystalline complexes were obtained from the reaction between picric
acid and silver salts. It has been demonstrated that in complex between benzene
and bromonium ion, the bromine atom is displaced in the middle of the electron
cloud.[1]
As abovementioned the next step of the reaction implies the formation of
the new bond between the two substrates. These kind of intermediates are
significantly different from the complexes, hence it can be possible to
characterize it in a univocal way with spectroscopic technics. Until now
nitrosation reactions are the only examples of electrophilic substitutions for which
both complexes and complexes have been identified and characterized by X-
ray diffraction analysis and UV-visible spectroscopy.[11,15,16]
The cyclohexadienic system formed from the evolution of the complex
it is higher in energy respect to the starting aromatic compound; this means that
the reaction can go on in both directions. This depends on the easiness with which
the intermediate eliminate the electrophile or the proton also if usually the last is
favored.
At last in the third step, together with the rearomatization process, the
leaving group form a complex with the aromatic ring before it will be
completely removed.
The formation of the Wheland intermediate is considered to be the slow
stages of the reaction, with its energy close to that of transition state. A simplified
energetic trend is reported in figure 4.
Page 15
Chapter 1
13
Figure 4. Energetic profile for SEAr.
The existence of the Wheland intermediate does not necessarily prove that
the transition state is directly correlated with it. Dewar for first discovered the
existence of complexes along the reaction’s coordinate and hypothesized that
the reaction’s rate could depend also on their stability.[17]
In agreement with Hammond’s postulate for which species closer in the
reaction’s coordinate with almost the same energy have similar geometry, it’s
clear that the transition state higher in energy will be similar to the intermediate
with a comparable energy.
Hence it is possible to observe the following three situation:[18]
1. Formation of the complex. In this case the transition state higher in
energy is similar to the complex.[19]
The formation of this non-
covalent interaction is fast and reversible and most of the time the
equilibrium constant is very small. If the formation of the complex
is the rate determining step there is no isotopic effect.
Page 16
Chapter 1
14
2. Formation of the Wheland intermediate. The transition state highest in
energy is that before the formation of the Wheland intermediate.
It has been demonstrated that for some reactions a linear relationship
between the rate of substitution and the relative stability of the
complex exist.
This give indication on the correlation between the transition state
higher in energy and the Wheland intermediate.
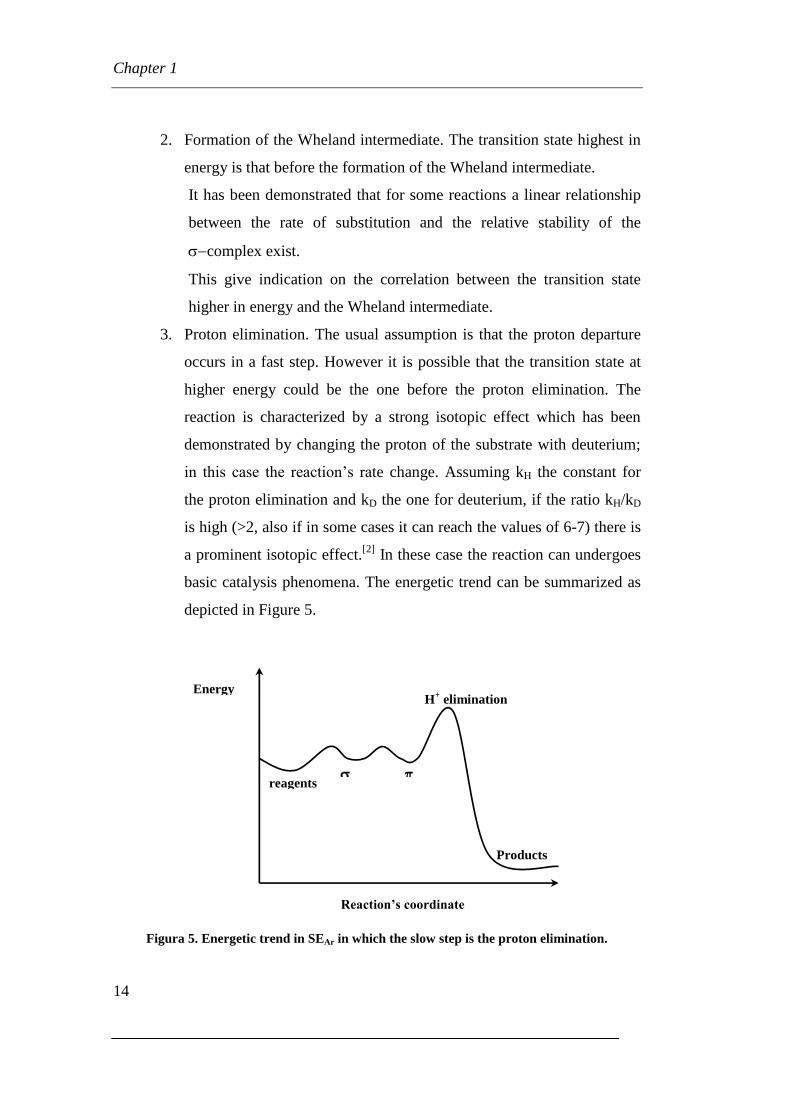
3. Proton elimination. The usual assumption is that the proton departure
occurs in a fast step. However it is possible that the transition state at
higher energy could be the one before the proton elimination. The
reaction is characterized by a strong isotopic effect which has been
demonstrated by changing the proton of the substrate with deuterium;
in this case the reaction’s rate change. Assuming kH the constant for
the proton elimination and kD the one for deuterium, if the ratio kH/kD
is high (>2, also if in some cases it can reach the values of 6-7) there is
a prominent isotopic effect.[2]
In these case the reaction can undergoes
basic catalysis phenomena. The energetic trend can be summarized as
depicted in Figure 5.
Figura 5. Energetic trend in SEAr in which the slow step is the proton elimination.
Products
reagents
H+ elimination
Energy
Reaction’s coordinate
Page 17
Chapter 1
15
The nature of the electrophiles and the other substrates become of great
importance to determine the slow stage. In some cases the electrophile can be a
species which is generated in situ from reagents and it is present at low
concentration. In the nitration reaction, for example, the attack is not performed
by nitric acid but by the nitronium ion NO2+, for which its formation is the rate
determining step. Other factors, such us the nature of the solvent and the presence
of acidic or basic condition, could influence the slow stage.[2]
While considering the nature of the slow stages of the reaction we have not
mentioned the importance of the substituents on the aromatic ring. They have a
strong influence on the regioselectivity determining the resonance energy for the
different Wheland complexes formed by the attack of the electrophile at the
different position.[18]
In the presence of a strong electrophile the rate determining
step can be the formation of the charge transfer complex; this can affect only the
selectivity toward the substrate which becomes low.
Since the complex evolve toward the Wheland intermediate to obtain
the substitution product, it is needed to take into account the substituent effect for
the formation of the complex.
If the substituent is an electron-donor, hence it is able to stabilize the
positive charge, there is an high selectivity on the attack position: ortho and para
are favored respect to meta.
If the electrophile is weak, without considering the proton elimination step,
it is the stability of the complex to determine the selectivity on the attack.
The presence of an electron-donor substituent which stabilize the positive
charge contribute to decrease the stability of the intermediate para>ortho>meta
respectively with an high selectivity in the para position.
Page 18
Chapter 1
16
1.2 Nucleophilic Aromatic Substitution Reaction (SNAr)
Benzene is an electron rich system: this feature lead to a deactivation
toward nucleophilic substitution reactions due basically to the electrostatic
repulsion between the cloud and the nucleophile. However some electron-
withdrawing substituents are able to reduce the electron density of the aromatic
ring allowing it to interact with nucleophile.
The nucleophilic aromatic substitution reaction involve, following the
mechanism proposed by Bunnett, two separate stages: the addition of the
nucleophile and the elimination of the leaving group (Scheme 3).
Scheme 3. Simplified scheme for the nucleophilic aromatic substitution reaction.
It is a bimolecular reaction in which the first step is characterized by a
negative charged intermediate usually called Meisenheimer complex or
complex. The process involved in this step is the formation of a bond
between the nucleophile and the aromatic ring. In the second step of the reaction
the Meisenheimer complex lose the leaving group contemporary with the
rearomatization process of the aromatic ring. Two reaction profiles could be
observed on the basis of the energy of the transition states (Figure 6).
Page 19
Chapter 1
17
Figure 6. Energetic trend for SNAr: (a) Transition state with energy comparable to the
formation of the complex. (b) Transition state with energy closer to the complex
decomposition.
If the nucleophile is neutral such in the case of alcohols and amines, a
zwitterionic complex in which the positive charge is localized on the
heteroatom is obtained (Figure 7).
Figure 7. Meisenheimer intermediates.
Such kind of intermediates can contain acidic hydrogen atoms which allow
the reaction to be easily catalyzed by means of bases (Scheme 4).
Scheme 4. SNAr reaction with neutral nucleophiles possessing acidic hydrogens.
HNu+ L
EWG
Page 20
Chapter 1
18
Different studies shown that, as in the case of electrophilic aromatic
substitution reactions, also in the nucleophilic substitutions the formation of the
Meisenheimer intermediate is preceded by donor-acceptor interactions with
formation of complexes which in some cases have been characterized.[20,21]
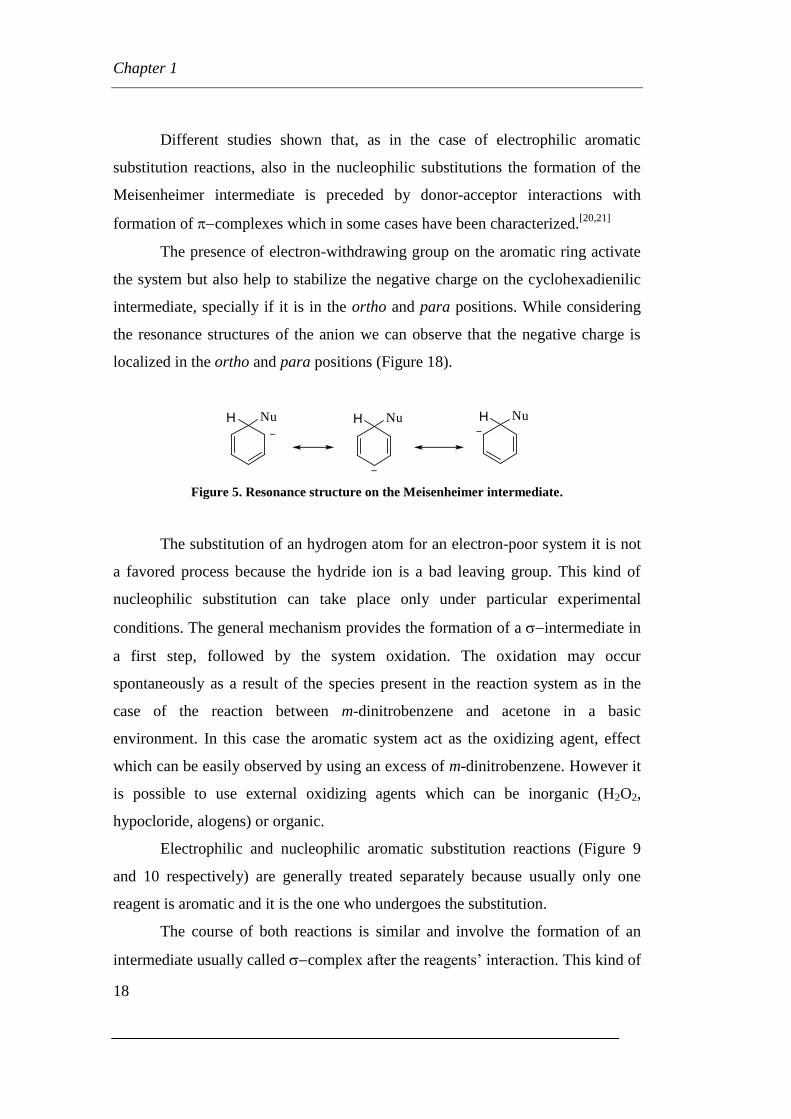
The presence of electron-withdrawing group on the aromatic ring activate
the system but also help to stabilize the negative charge on the cyclohexadienilic
intermediate, specially if it is in the ortho and para positions. While considering
the resonance structures of the anion we can observe that the negative charge is
localized in the ortho and para positions (Figure 18).
H Nu H Nu H Nu
Figure 5. Resonance structure on the Meisenheimer intermediate.
The substitution of an hydrogen atom for an electron-poor system it is not
a favored process because the hydride ion is a bad leaving group. This kind of
nucleophilic substitution can take place only under particular experimental
conditions. The general mechanism provides the formation of a intermediate in
a first step, followed by the system oxidation. The oxidation may occur
spontaneously as a result of the species present in the reaction system as in the
case of the reaction between m-dinitrobenzene and acetone in a basic
environment. In this case the aromatic system act as the oxidizing agent, effect
which can be easily observed by using an excess of m-dinitrobenzene. However it
is possible to use external oxidizing agents which can be inorganic (H2O2,
hypocloride, alogens) or organic.
Electrophilic and nucleophilic aromatic substitution reactions (Figure 9
and 10 respectively) are generally treated separately because usually only one
reagent is aromatic and it is the one who undergoes the substitution.
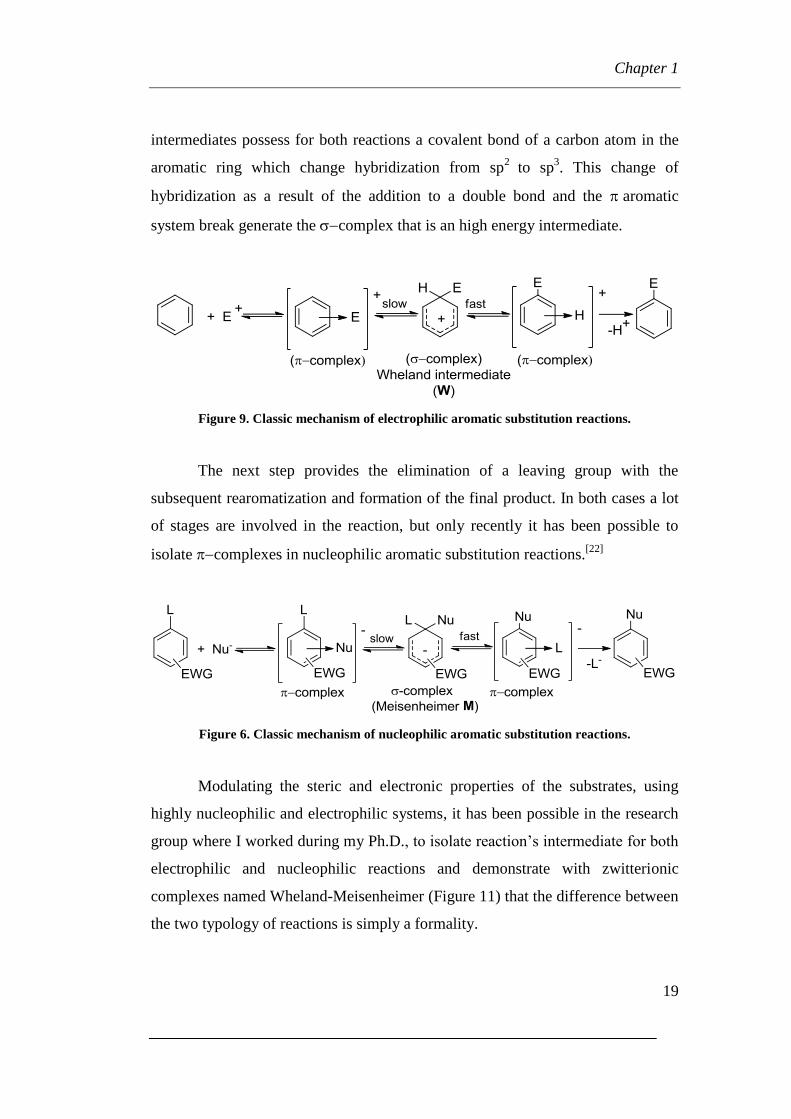
The course of both reactions is similar and involve the formation of an
intermediate usually called complex after the reagents’ interaction. This kind of
Page 21
Chapter 1
19
intermediates possess for both reactions a covalent bond of a carbon atom in the
aromatic ring which change hybridization from sp2
to sp3. This change of
hybridization as a result of the addition to a double bond and the aromatic
system break generate the complex that is an high energy intermediate.
Figure 9. Classic mechanism of electrophilic aromatic substitution reactions.
The next step provides the elimination of a leaving group with the
subsequent rearomatization and formation of the final product. In both cases a lot
of stages are involved in the reaction, but only recently it has been possible to
isolate complexes in nucleophilic aromatic substitution reactions.[22]
Figure 6. Classic mechanism of nucleophilic aromatic substitution reactions.
Modulating the steric and electronic properties of the substrates, using
highly nucleophilic and electrophilic systems, it has been possible in the research
group where I worked during my Ph.D., to isolate reaction’s intermediate for both
electrophilic and nucleophilic reactions and demonstrate with zwitterionic
complexes named Wheland-Meisenheimer (Figure 11) that the difference between
the two typology of reactions is simply a formality.
Page 22
Chapter 1
20
Figure 7. Example of a Wheland-Meisenheimer complex.
References
[1] R.Taylor, Electrophilic Aromatic Substitution; John Wiley & Sons 1990.
[2] F.A.Carey, R.J. Sundberg, Advanced Organic Chemistry Part A, 3a ed; Plenum Press: New
York and London, 1990.
[3] G. W. Wheland, J. Am. Chem. Soc., 1942, 64, 900
[4] N.L. Allinger, M.P. Cava, D.C. De Jongh et al, Chimica Organica, 2a ed., Zanichelli, 1981.
T.H.Lowry, K.S. Richardson, Mechanism and Theory in Organic Chemistry, 3a ed., Harper and
Row Publisher: New York, 1987.
[5] P. Sykes A guidebook to mechanism in organic chemistry, 5a ed, Prentice Hall 1992.
[6] S.M. Hubig, J.K. Kochi, J. Org. Chem., 2000, 65, 6807.
[7] G.A. Olah, R.H. Scholosberg, R.D. Porter, Y.K. Mo, D.P. Kelly, G.D. Mateescu, J. Am.
Chem. Soc., 1972, 94, 2034.
[8] a) R. Rathore, J. Hecht, J.K. Kochi, J. Am. Chem. Soc. 1998, 120, 13278; b) G.A.Olah, H:C:
Lin, Y.K. Mo, J. Am. Chem. Soc., 1972, 94, 3667.
[9] W. Lau, J.K.Kochi, J. Am. Chem. Soc., 1986, 108, 6720.
[10] W. Lau, J.K.Kochi, J. Am. Chem. Soc., 1984, 106, 7100.
[11] S.M. Hubig, J.K. Kochi, J. Am. Chem. Soc., 2000, 122, 8279.
[12] S.Fukuzumi, J.K. Kochi, J. Am. Chem. Soc., 1981, 103, 7240.
[13] S.V. Rosokha, J.K. Kochi, J. Org. Chem., 2002, 67,1727.
[14] L. Forlani, J. Phys. Org. Chem., 1999, 12, 417.
[15] K.Kim, J.K. Kochi, J. Am. Chem. Soc., 1991, 113, 4962.
[16] E. Bosch, J.K. Kochi, J. Org. Chem., 1994, 59, 5573.
[17] M.J.S. Dewar, J. Chem. Soc., 1946, 406, 777.
[18] G.A. Olah., Acc. Chem. Res., 1971, 4, 240.
[19] G.A. Olah, S. . Kuhn, e S. H. Flood, J. Am. Chem. Soc., 1961, 83, 4571.
[20] S.K. Dotterer, R.L. Harris, J. Org. Chem., 1988, 53, 777-779.
[21] R. Bacaloglu, C.A. Bunton, G. Cerichelli, J. Am. Chem.Soc, 1987, 109, 21-623.
[22] P. Sepulcri, R. Goumont, J.C. Hallè, E. Buncel, F. Terrier, Chem. Comm., 1997, 789-790
Page 23
Chapter 2
21
Chapter 2
The proton dance in tris(dialkylamino)benzenes
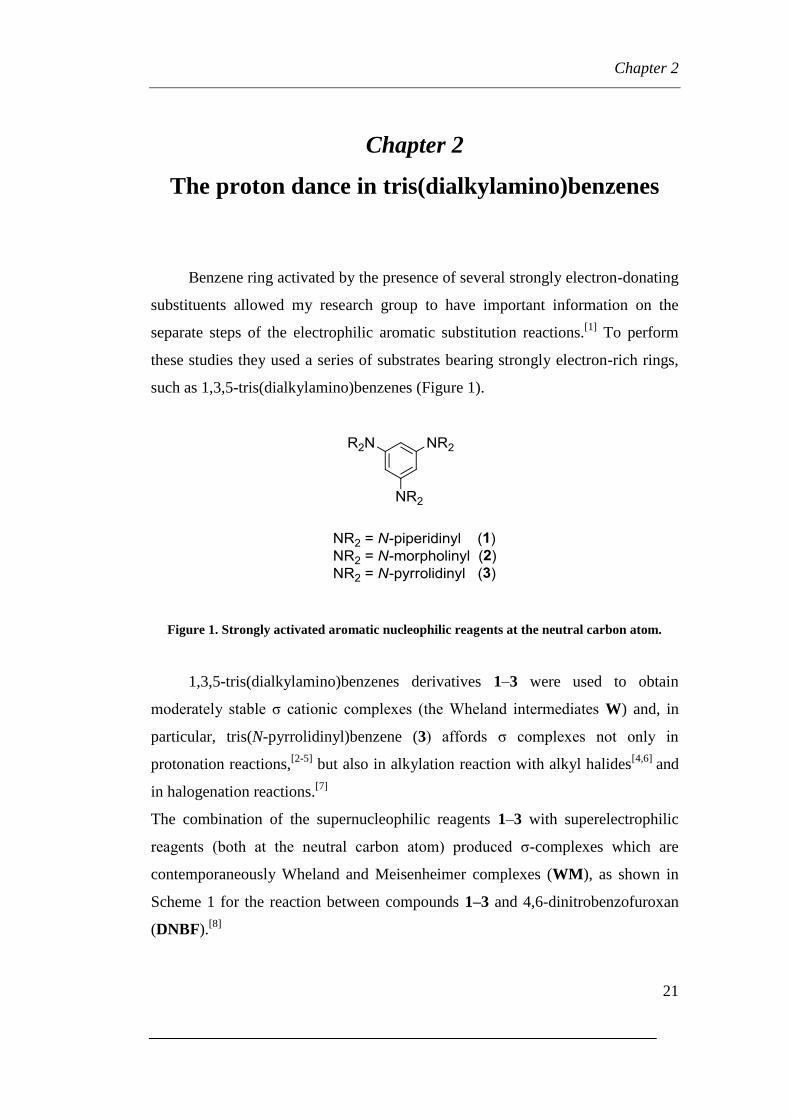
Benzene ring activated by the presence of several strongly electron-donating
substituents allowed my research group to have important information on the
separate steps of the electrophilic aromatic substitution reactions.[1]
To perform
these studies they used a series of substrates bearing strongly electron-rich rings,
such as 1,3,5-tris(dialkylamino)benzenes (Figure 1).
Figure 1. Strongly activated aromatic nucleophilic reagents at the neutral carbon atom.
1,3,5-tris(dialkylamino)benzenes derivatives 1–3 were used to obtain
moderately stable σ cationic complexes (the Wheland intermediates W) and, in
particular, tris(N-pyrrolidinyl)benzene (3) affords σ complexes not only in
protonation reactions,[2-5]
but also in alkylation reaction with alkyl halides[4,6]
and
in halogenation reactions.[7]
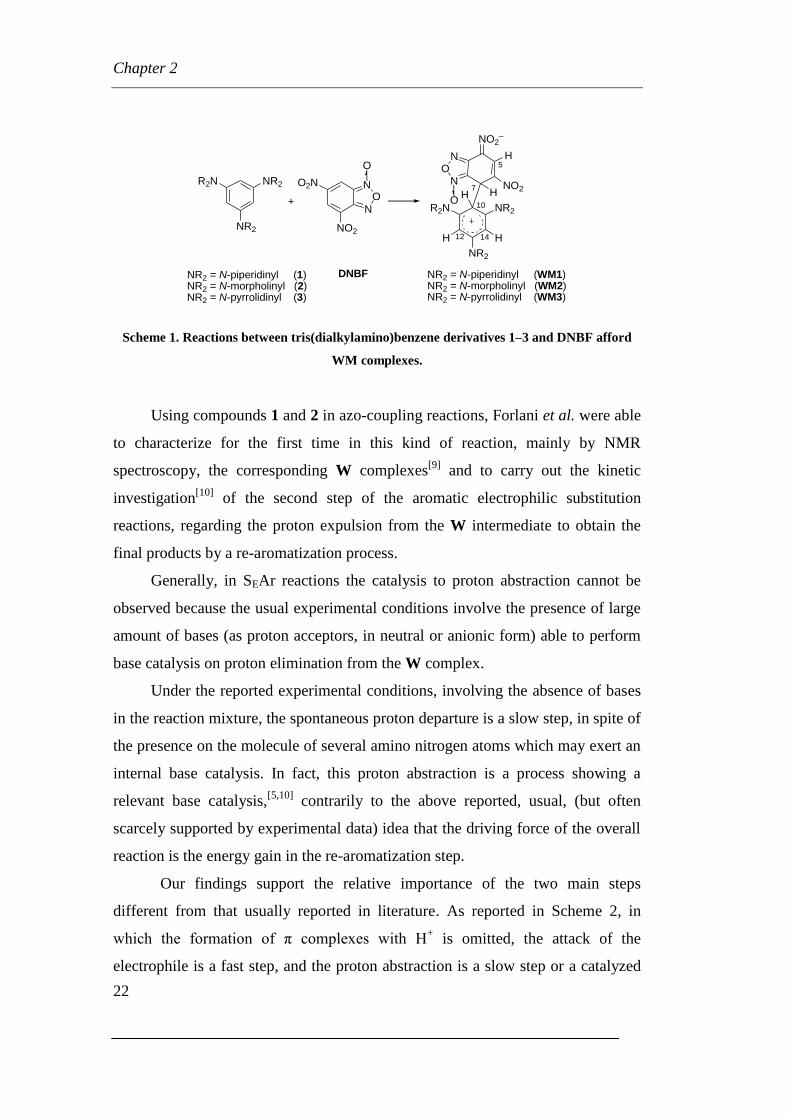
The combination of the supernucleophilic reagents 1–3 with superelectrophilic
reagents (both at the neutral carbon atom) produced σ-complexes which are
contemporaneously Wheland and Meisenheimer complexes (WM), as shown in
Scheme 1 for the reaction between compounds 1–3 and 4,6-dinitrobenzofuroxan
(DNBF).[8]
Page 24
Chapter 2
22
R2N NR2
NR2
+N
ONO2N
NO2
DNBF
ON
ON
HNO2
NO2–
O
NR2 = N-piperidinyl (1)NR2 = N-morpholinyl (2)NR2 = N-pyrrolidinyl (3)
NR2 = N-piperidinyl (WM1)NR2 = N-morpholinyl (WM2)NR2 = N-pyrrolidinyl (WM3)
5
7
10
H
R2N NR2
NR2
H
12 14H H
Scheme 1. Reactions between tris(dialkylamino)benzene derivatives 1–3 and DNBF afford
WM complexes.
Using compounds 1 and 2 in azo-coupling reactions, Forlani et al. were able
to characterize for the first time in this kind of reaction, mainly by NMR
spectroscopy, the corresponding W complexes[9]
and to carry out the kinetic
investigation[10]
of the second step of the aromatic electrophilic substitution
reactions, regarding the proton expulsion from the W intermediate to obtain the
final products by a re-aromatization process.
Generally, in SEAr reactions the catalysis to proton abstraction cannot be
observed because the usual experimental conditions involve the presence of large
amount of bases (as proton acceptors, in neutral or anionic form) able to perform
base catalysis on proton elimination from the W complex.
Under the reported experimental conditions, involving the absence of bases
in the reaction mixture, the spontaneous proton departure is a slow step, in spite of
the presence on the molecule of several amino nitrogen atoms which may exert an
internal base catalysis. In fact, this proton abstraction is a process showing a
relevant base catalysis,[5,10]
contrarily to the above reported, usual, (but often
scarcely supported by experimental data) idea that the driving force of the overall
reaction is the energy gain in the re-aromatization step.
Our findings support the relative importance of the two main steps
different from that usually reported in literature. As reported in Scheme 2, in
which the formation of π complexes with H+ is omitted, the attack of the
electrophile is a fast step, and the proton abstraction is a slow step or a catalyzed
Page 25
Chapter 2
23
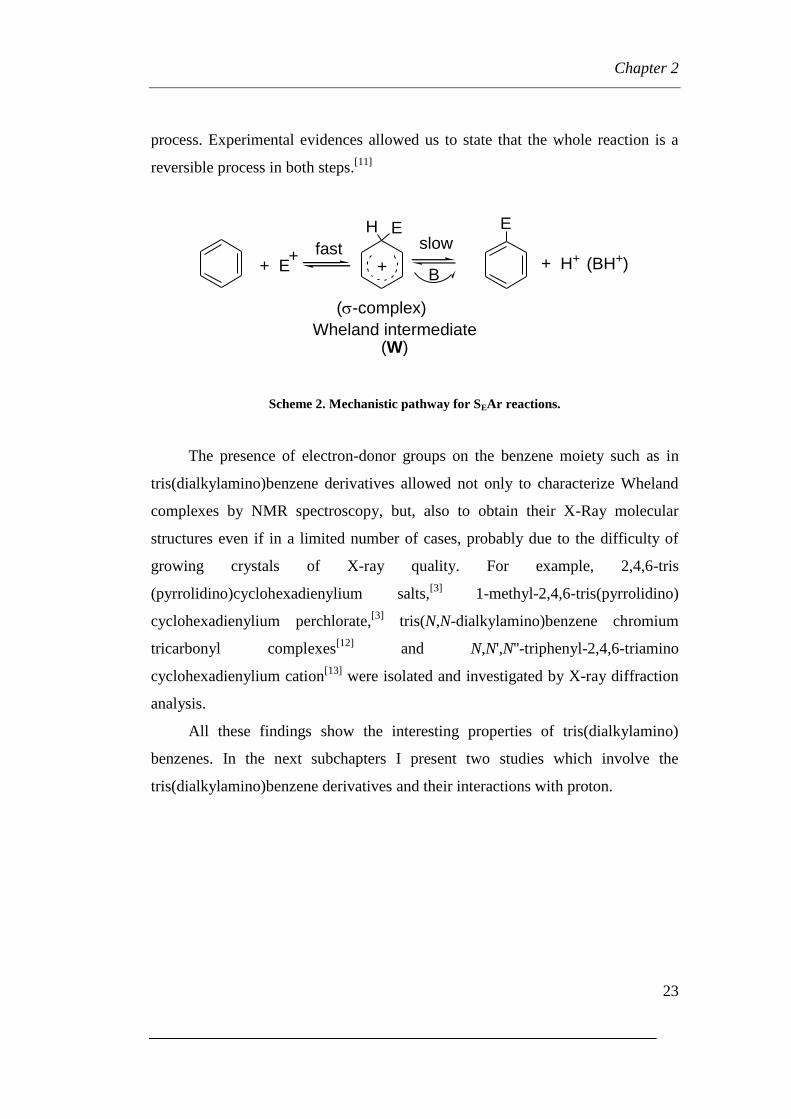
process. Experimental evidences allowed us to state that the whole reaction is a
reversible process in both steps.[11]
E
+ H+
(-complex)
+ E+
Wheland intermediate(W)
fast slow
B(BH+)
H E
+
Scheme 2. Mechanistic pathway for SEAr reactions.
The presence of electron-donor groups on the benzene moiety such as in
tris(dialkylamino)benzene derivatives allowed not only to characterize Wheland
complexes by NMR spectroscopy, but, also to obtain their X-Ray molecular
structures even if in a limited number of cases, probably due to the difficulty of
growing crystals of X-ray quality. For example, 2,4,6-tris
(pyrrolidino)cyclohexadienylium salts,[3]
1-methyl-2,4,6-tris(pyrrolidino)
cyclohexadienylium perchlorate,[3]
tris(N,N-dialkylamino)benzene chromium
tricarbonyl complexes[12]
and N,N',N''-triphenyl-2,4,6-triamino
cyclohexadienylium cation[13]
were isolated and investigated by X-ray diffraction
analysis.
All these findings show the interesting properties of tris(dialkylamino)
benzenes. In the next subchapters I present two studies which involve the
tris(dialkylamino)benzene derivatives and their interactions with proton.
Page 26
Chapter 2
24
2.1 The interactions of proton with tris(dialkylamino)benzenes
Proton is the most simple and hard electrophilic reagent and it is of interest
to investigate its affinity toward centers of different electronegativity and
polarizability.
If the proton acceptor bears different basic centers, the proton may attack
them depending on the availability of their lone pairs. This is the case of 1,3,5-
tris(dialkylamino)benzenes, firstly studied by Effenberger.[2]
1,3,5-Triaminobenzenes react with electrophilic reagents in two main
ways: the attack on the carbon atoms of the aromatic ring and the attack on the
nitrogen atoms of the amino group. When the proton is the electrophilic reagent,
1,3,5-triaminobenzene,[14,15]
as well as compounds 1, 2, and 3 of Scheme 3 can
form σ-complexes 1a-3a by protonation on the ring carbon atom and ammonium
salts 1b-3b by protonation of the amino group.[4]
Evidences of the presence of
both equilibria of Scheme 3 were investigated from long time and are reported in
the literature.[2,4,14,15]
Scheme 3. Possible products of the attack of proton on compounds 1–3.
Knoche et al. reported[16-18]
a thermodynamic and kinetic studies on the
protonation of tris(amino)benzenes 1, 2, and 3 in water/alcohols mixtures.
Data regarding the salification of tris(dialkylamino)benzenes by UV/Vis
spectroscopic measurements[16-18]
clearly indicate the presence of three
protonation steps. For this salification equilibrium the
1H-NMR
[2,17,18] data reveal
Page 27
Chapter 2
25
the importance of the protonation at the nitrogen atoms, showing the magnetic
equivalence of the three aromatic protons, indicating that the protonation site is
undefined.
It has to be noted that σ-complexes derived from the protonation of some
triaminobenzenes are stable, as, for example, in the case of N,N’,N”–triphenyl-
1,3,5-triaminobenzenes.[19]
In previous studies[1,9,11]
the coupling between tris(dialkylamino)benzenes
and arenediazonium salts afforded σ-complexes and no evidence of attack of the
electrophilic reagent to the amino nitrogen atom was obtained. Also electrophilic
neutral carbon reagents[8,19,20,21]
showed a similar reaction regarding the
regioselectivity of the attack. On the contrary, alkylation of 1 is indicated[2]
to
occur on the nitrogen atoms.
Previously, we reported that Wheland-Meisenheimer complexes (WM)
can be formed from the reaction between tris(dialkylamino)benzenes and 4,6-
dinitrobenzofuroxan (DNBF), a superelectrophilic reagent at the neutral carbon
atom (Scheme 1).[7]
WM show an interesting dynamic process. In fact, when the
1H-NMR spectrum of these complexes is recorded at room temperature, the
protons bound to the trisaminobenzene moiety are equivalent. By lowering the
temperature, WM shows a 1H NMR spectrum in agreement with the structure
depicted in Scheme 1 in which the bond between the superelectrophilic and the
supernucleophilic reagents is in a definite position. An analogous behaviour was
observed also in the reaction between compounds 1–3 and 4,6-
dinitrotetrazolopyridine,[22]
a more powerful electrophile than DNBF.[23]
The “aromatic” carbon atom in position 7 of DNBF prefers the carbon
atom of 1–3, while the aliphatic carbon (sp3) of alkyl halides reacts on the
nitrogen atom or at the carbon atom of the same compounds, depending on the
amino substituent.[2,6]
This difference in regioselectivity of electrophilic species
may be hardly explained by usual idea (basicity/acidity, polarizability, etc.).
With the purpose to provide further information on the mechanism of the
electrophilic aromatic substitution reactions of considered substrates, we decided
to investigate the protonation of tris(dialkylamino)benzenes with different acids.
Page 28
Chapter 2
26
Furthermore we report also some data on the alkylation reaction of these
substrates.
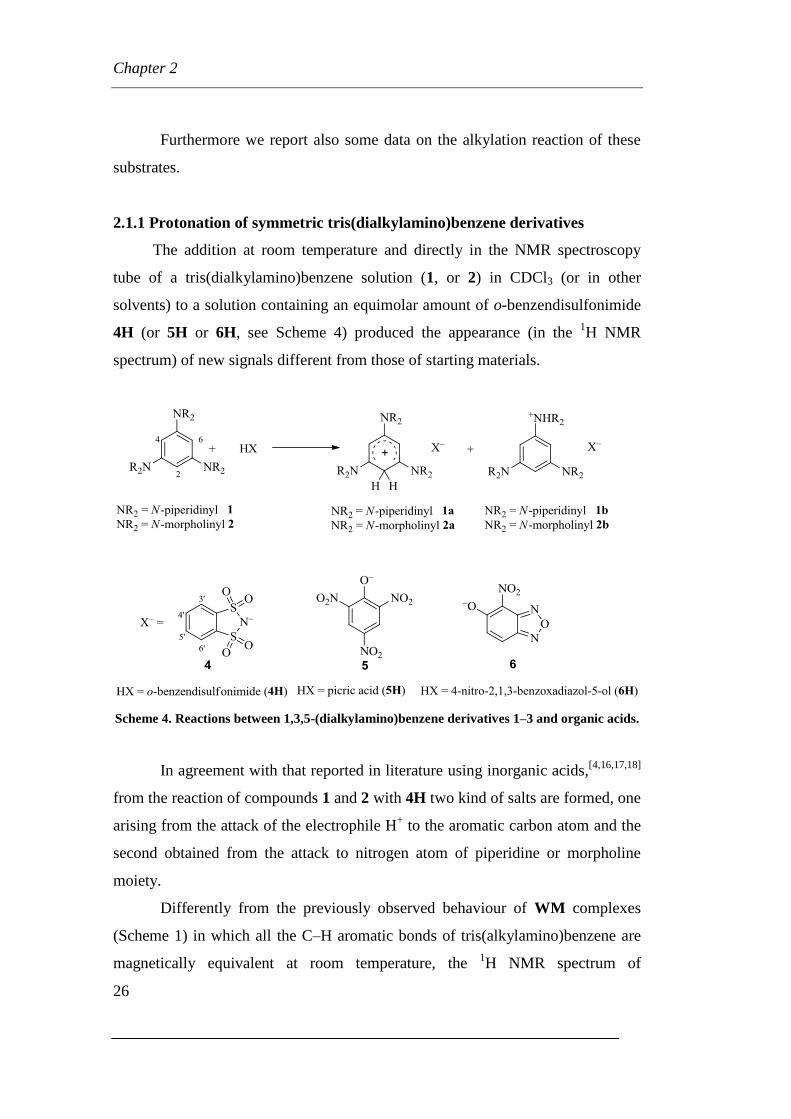
2.1.1 Protonation of symmetric tris(dialkylamino)benzene derivatives
The addition at room temperature and directly in the NMR spectroscopy
tube of a tris(dialkylamino)benzene solution (1, or 2) in CDCl3 (or in other
solvents) to a solution containing an equimolar amount of o-benzendisulfonimide
4H (or 5H or 6H, see Scheme 4) produced the appearance (in the 1H NMR
spectrum) of new signals different from those of starting materials.
Scheme 4. Reactions between 1,3,5-(dialkylamino)benzene derivatives 1–3 and organic acids.
In agreement with that reported in literature using inorganic acids,[4,16,17,18]
from the reaction of compounds 1 and 2 with 4H two kind of salts are formed, one
arising from the attack of the electrophile H+ to the aromatic carbon atom and the
second obtained from the attack to nitrogen atom of piperidine or morpholine
moiety.
Differently from the previously observed behaviour of WM complexes
(Scheme 1) in which all the C–H aromatic bonds of tris(alkylamino)benzene are
magnetically equivalent at room temperature, the 1H NMR spectrum of
Page 29
Chapter 2
27
compounds 1and 2 after reaction with the proton to form a C–H bond agrees with
formula 1a and 2a, indicating that the proton is in a fixed position.
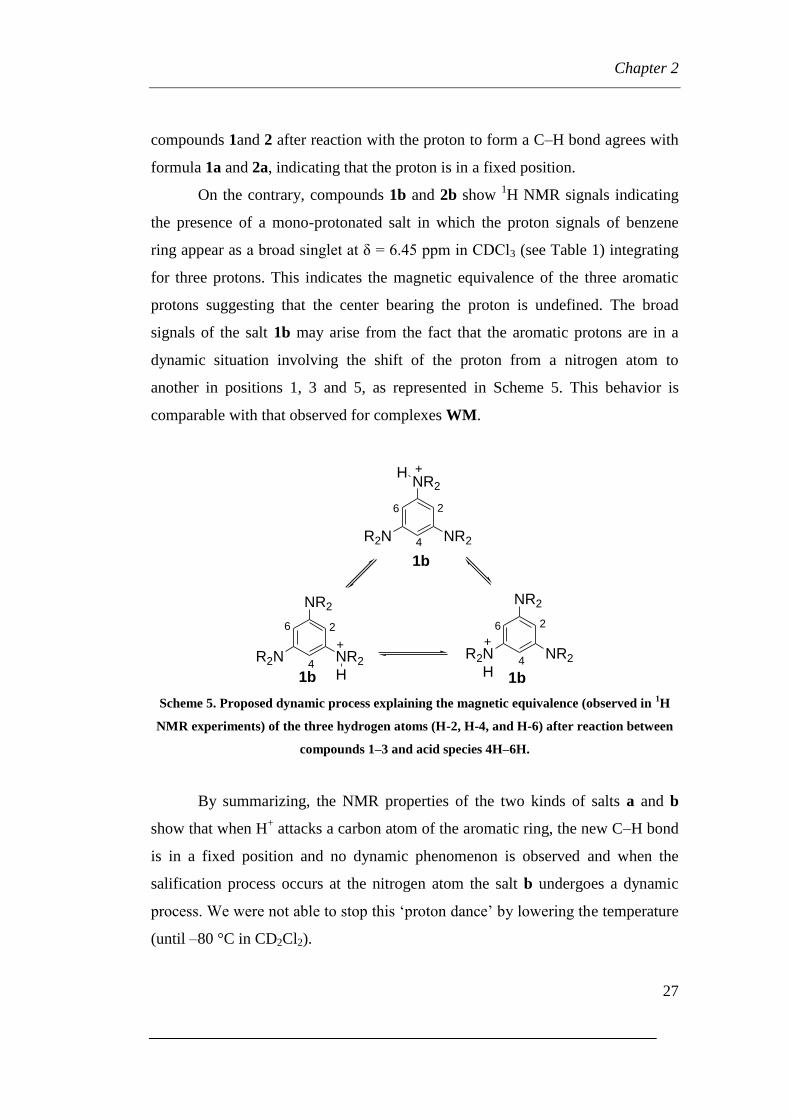
On the contrary, compounds 1b and 2b show 1H NMR signals indicating
the presence of a mono-protonated salt in which the proton signals of benzene
ring appear as a broad singlet at δ = 6.45 ppm in CDCl3 (see Table 1) integrating
for three protons. This indicates the magnetic equivalence of the three aromatic
protons suggesting that the center bearing the proton is undefined. The broad
signals of the salt 1b may arise from the fact that the aromatic protons are in a
dynamic situation involving the shift of the proton from a nitrogen atom to
another in positions 1, 3 and 5, as represented in Scheme 5. This behavior is
comparable with that observed for complexes WM.
2
1b
6
NR2
NR2R2N
H
2
1b
6
NR2
NR2R2N
2
1b
6
NR2
NR2R2N
H H
+
++
4
44
Scheme 5. Proposed dynamic process explaining the magnetic equivalence (observed in 1H
NMR experiments) of the three hydrogen atoms (H-2, H-4, and H-6) after reaction between
compounds 1–3 and acid species 4H–6H.
By summarizing, the NMR properties of the two kinds of salts a and b
show that when H+ attacks a carbon atom of the aromatic ring, the new C–H bond
is in a fixed position and no dynamic phenomenon is observed and when the
salification process occurs at the nitrogen atom the salt b undergoes a dynamic
process. We were not able to stop this ‘proton dance’ by lowering the temperature
(until –80 °C in CD2Cl2).
Page 30
Chapter 2
28
Another possible explanation of the spectral data observed might be the
presence of an interaction between the π electrons of the benzene ring and the
added proton.
A similar behaviour was previously observed by Effenberger and Niess[2]
in the reaction between perchloric acid and 1 in polar and proton-acceptor
solvents: the 1H NMR signal of aromatic protons was a singlet in [D6]-acetone
and in [D6]-DMSO, while in CDCl3 the proton appeared to be fixed on an amino
group (δ =7.90 (1H, N-H), 6.62 (s, 2H) and 5.37 (s, 1H).
The monoperchlorate of 1 was indicated to show, in [D6]-DMSO and in
[D6]-acetone, rapid proton exchange among the amino groups and the behaviour
showed by the system let the authors to observe “there is a strong electronic
disturbance of the π-electron system”. [2]
To further investigate on the regioselectivity of the attack to the ring
carbon atom or to the nitrogen atom of the substituents of the
tris(dialkyamino)benzenes 1 and 2 we planned to change the operative conditions,
such as the solvent, the temperature and the electrophilic reagent. Table 1 reports
a tentative to check the importance of the solvent in determining the relative
amount of the two protonated species, the C-H and the N-H (a/b). On the basis of
the rough definition of the polarity of the used solvent,[25]
in more polar solvents
the equilibrium is shifted toward the b salt that results more polar than the a salt
(C–H salt). Probably, in a the positive charge is more delocalized, and so more
hidden to interactions with solvent than in b salt.
Table 1. Relative % ratio of C-H form versus N-H form of compounds 1 and 2 after
salification with 4H at 25 °C in different solvents[a]
Compound↓
Solvent→
CDCl3 CD2Cl2 CD3CN [D6]-DMSO
1a : 1b 12 : 88 8 : 92 48 : 52 n.d. : ≥99
2a : 2b 11 : 89 – 47 : 53 –
[a]. [1], [2], [3] = [4H] = 1.2 x 10⁻⁵ mol dm-1 (as stoichiometric amount).
From data of Table 1 it is possible to state that 1 and 2 show very similar
behaviours. In CDCl3 (or CD2Cl2) and in [D6]-DMSO, the dependence of the
Page 31
Chapter 2
29
ratios 1a:1b (or 2a:2b) from the solvent used indicates that the increase of the
solvent polarity favours the protonated specie b (N-H) and, in agreement to these
conclusion, we observed that also the addition of tetrabutylammonium bromide to
enhance the polarity of the environment favours the species b (see Table 2).
Table 2. Relative ratio 1a and 1b after addition of tetrabutylammonium bromide in CD3CN
and in CDCl3.[a]
[TBAB][b]
103 x mol dm–3
– 6.25 12.5 18.75 25.0 50.0
1a:1b (CD3CN) 48:52 42:58 35:65 27:73 18:82 5:95
1a:1b (CDCl3) 12:88 10:90 2:98
[a] [1] = [4H] = 1.2 x 10⁻⁵ mol dm–1 (as stoichiometric amount). [b] TBAB = tetrabutylammonium bromide
In contrast, in CD3CN (a more polar solvent than CDCl3 or CD2Cl2, but
less polar than DMSO[25]
) the ratio is about 50:50 for both, 1 and 2 salts.
Probably, in this solvent some particular interaction/solvation processes are
operating. Furthermore in CD3CN, the addition of tetrabutylammonium bromide
(TBAB) shifts the equilibrium from a to b (see Table 2).
In every case, the mixture of 1,3,5-tris(piperidinyl)benzene (1) (and all the
other tris(dialkylamino)benzenes) and o-benzendisulfonimide (4) was prepared in
1:1 relative molar ratio. The addition of higher amount of acid (4H) until a 1:3
molar ratio, did not produce significant variation of NMR spectral data. However,
the reported observations indicate the presence of an equilibrium between C-H
and N-H species. In fact in the presence of the CH/ NH tautomerism shown in
Scheme 3, when to the mixture of 1a and 1b in CDCl3 is added a small amount of
D2O, the rapid exchange of both the sp3 protons of 1a and of the three aromatic
protons of the compound 1b takes place and all the signals related to aromatic
protons are strongly lowered.
With the aim to check the importance of the counter ion in the obtainment
of the reported relative ratios a : b (a = C–H salt, b = N–H salt) and on the
possible modification of chemical shift, we tried to change the acid. For this
purpose we used picric acid (5H) and 4-nitro-5-hydroxybenzofurazane (6H) to
Page 32
Chapter 2
30
protonate compounds 1 and 2. Table 3 shows the relative amount of the two
protonated forms in CDCl3 and in CD3CN (the related 1H NMR chemical shifts in
CDCl3 and in CD3CN resulted to be poorly dependent on the acid used). In all
cases an increase of the amount of b species with respect to the relative ratio
shown in Table 1 was observed.
Table 3. Relative amount of species a and b (see Scheme 1) from salification of 1 and 2 with
5H and 6H.
Entry Starting materials Relative % amount of a : b in CDCl3 Relative % amount of a : b in CD3CN
1 1 and 5H 1 : 99 30 : 70
2 2 and 5H n.d. : ≥99 40 : 60
3 1 and 6H 1 : 99 25 : 75
4 2 and 6H (n.d. : 99)[a] (6 : 94)[a]
[a] Differences in chemical shifts are small with respect to those of starting compound.
In CD3CN the relative ratio a : b of the morpholino derivative (entries 2
and 4) are significantly dependent on the used acid: picric acid 5H enhance the
protonation at the carbon atom respect to 4H, even if the major protonated center
is the nitrogen atom. A possible explanation of this behaviour may be in some
specific interactions of 1a with the anionic part of 5H. In CD3Cl no relevant
influence of the negative counter ion was observed.
2.1.2 Effect of the temperature’s change
The complexes WM between compounds 1, 2, or 3 and DNBF (see
Scheme 1), show a dynamic process of the DNBF moiety on the
tris(amino)benzene ring. This “motion” was observed through 1H NMR spectrum,
at room temperature, and it was stopped by a strong lowering of the mixture
temperature.
The salification herein reported was carried out between equimolar amount
of the tris(dialkylamino)benzenes 1 (and 2) and the acid 4H in different solvents
directly in the NMR spectroscopy tube at various temperatures (in the range of
+25°/ –80 °C in CD2Cl2, +25/ –55 °C in CDCl3 and +25/ –10 °C in CD3CN). If at
these low temperatures the proton may stop its motion localizing it on one
Page 33
Chapter 2
31
nitrogen atom of salt b for a time at least comparable with the NMR time scale,
different chemical shifts for the aromatic protons of the tris(dialkylamino)benzene
moiety should be observed. In our experimental conditions we observed only one
signal for aromatic protons of the tris(dialkylamino)benzene moiety. Since we
have not evidence of the stop of the proton transfer, we deduce that the proton
transfer from a nitrogen atom to another is a very easy and fast process.
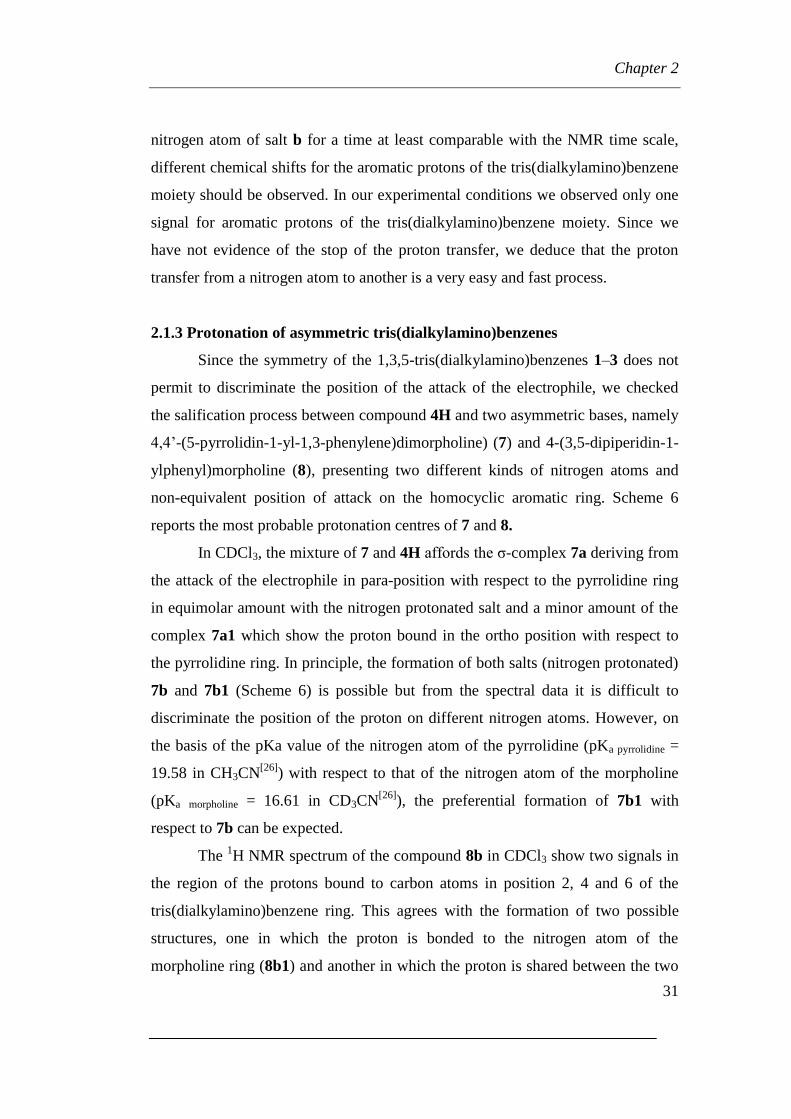
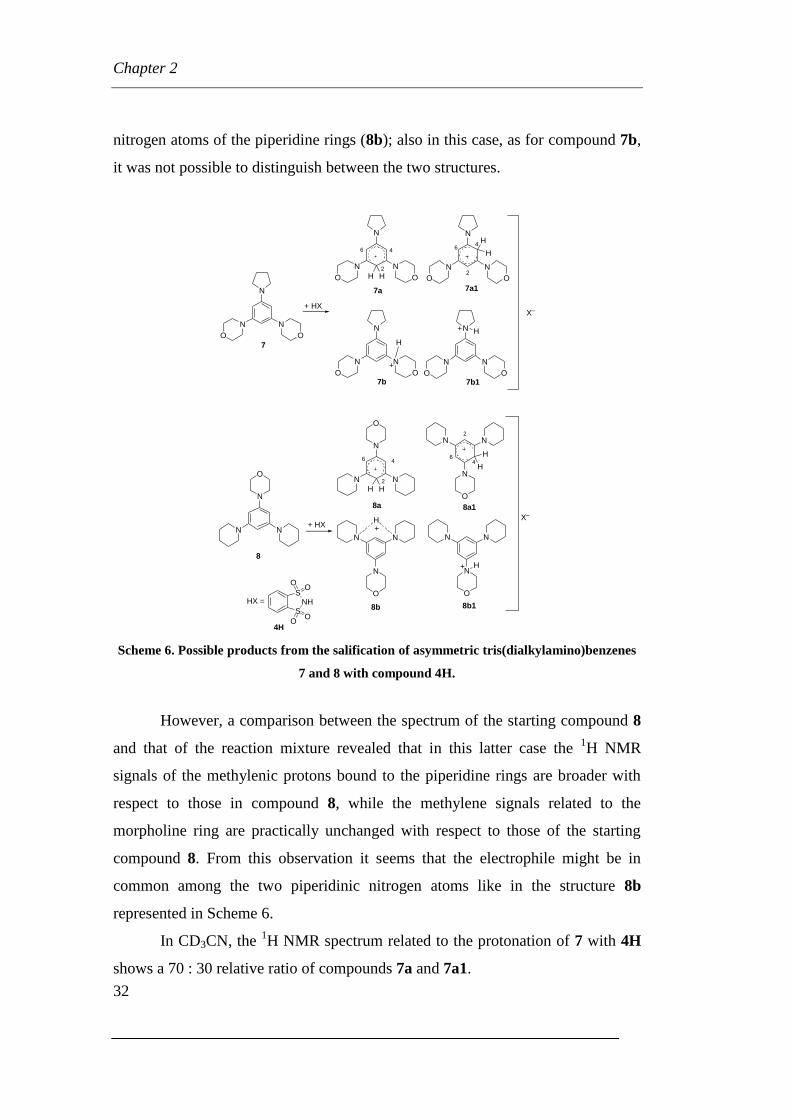
2.1.3 Protonation of asymmetric tris(dialkylamino)benzenes
Since the symmetry of the 1,3,5-tris(dialkylamino)benzenes 1–3 does not
permit to discriminate the position of the attack of the electrophile, we checked
the salification process between compound 4H and two asymmetric bases, namely
4,4’-(5-pyrrolidin-1-yl-1,3-phenylene)dimorpholine) (7) and 4-(3,5-dipiperidin-1-
ylphenyl)morpholine (8), presenting two different kinds of nitrogen atoms and
non-equivalent position of attack on the homocyclic aromatic ring. Scheme 6
reports the most probable protonation centres of 7 and 8.
In CDCl3, the mixture of 7 and 4H affords the σ-complex 7a deriving from
the attack of the electrophile in para-position with respect to the pyrrolidine ring
in equimolar amount with the nitrogen protonated salt and a minor amount of the
complex 7a1 which show the proton bound in the ortho position with respect to
the pyrrolidine ring. In principle, the formation of both salts (nitrogen protonated)
7b and 7b1 (Scheme 6) is possible but from the spectral data it is difficult to
discriminate the position of the proton on different nitrogen atoms. However, on
the basis of the pKa value of the nitrogen atom of the pyrrolidine (pKa pyrrolidine =
19.58 in CH3CN[26]
) with respect to that of the nitrogen atom of the morpholine
(pKa morpholine = 16.61 in CD3CN[26]
), the preferential formation of 7b1 with
respect to 7b can be expected.
The 1H NMR spectrum of the compound 8b in CDCl3 show two signals in
the region of the protons bound to carbon atoms in position 2, 4 and 6 of the
tris(dialkylamino)benzene ring. This agrees with the formation of two possible
structures, one in which the proton is bonded to the nitrogen atom of the
morpholine ring (8b1) and another in which the proton is shared between the two
Page 34
Chapter 2
32
nitrogen atoms of the piperidine rings (8b); also in this case, as for compound 7b,
it was not possible to distinguish between the two structures.
N
NN
N
NN
H H
7a
+ HX
OO
O O
N
NN
O O
H
H
7a1
7
2
46
N
NN
O O7b
H
N
NN
O O7b1
+ H
X–
N
NN
N
NN
H H
8a
SNH
S
OO
OO
HX =
N
NN
H
H
8a1
8
O
O
O
8b
X–
4H
+
+ HX
8b1
N
NN
O
N
NN
O
H+
H+
2
46 64
2
2
46
Scheme 6. Possible products from the salification of asymmetric tris(dialkylamino)benzenes
7 and 8 with compound 4H.
However, a comparison between the spectrum of the starting compound 8
and that of the reaction mixture revealed that in this latter case the 1H NMR
signals of the methylenic protons bound to the piperidine rings are broader with
respect to those in compound 8, while the methylene signals related to the
morpholine ring are practically unchanged with respect to those of the starting
compound 8. From this observation it seems that the electrophile might be in
common among the two piperidinic nitrogen atoms like in the structure 8b
represented in Scheme 6.
In CD3CN, the 1H NMR spectrum related to the protonation of 7 with 4H
shows a 70 : 30 relative ratio of compounds 7a and 7a1.
Page 35
Chapter 2
33
In CDCl3, the reaction between compound 8 and o-benzendisulfonimide
4H, as well as with acids 5H and 6H, affords only the compound 8b, while in
CD3CN also small amounts of the compounds 8a and 8a1 are formed.
2.1.4 X-Ray diffraction analysis
While the crystal structures of some 1,3,5-tris(dialkyl)aminobenzene
derivatives (in particular 1,3,5-tris(pyrrolidino)benzene derivatives)[6]
were
extensively investigated in their protonated cyclohexadienylic form, X-ray
diffraction studies on 1 and 2 or other similar compounds protonated on the
nitrogen atom have not been yet reported in the literature.
The findings of this study extend the number of cases in which the
protonation of 1,3,5-tris(dialkylamino)benzene derivatives occurs on nitrogen
atom and since this is often the main process, we tried to crystallize the product
derived from the reaction between 1 and 8 and the herein used acids 4H, 5H and
6H.
We were able to obtain crystals suitable for X-ray diffraction analysis from
the reaction between tris(dialkylamino)benzenes 1 and 8 and 4-nitro-2,1,3-
benzoxadiazol-5-ol (6H).
In figure 4 are reported the structures determined by single crystal X-ray
diffraction analisys of compounds 1 and two N–H salts named as 1H+ and 8H
+
obtained by reaction of 6H with 1 and 8, respectively. In all the three structures
the aromatic central ring is planar whereas the three piperidine substituents in 1,
the protonated and the two unprotonated piperidine rings in 1H+ and the
protonated, unprotonated piperidine and morpholine rings in 8H+ adopt a chair
conformation.
As a consequence of the protonation of the piperiridinic N atom, the N(H)-
C(aryl) bonds become longer ([1.477(3) and 1.484(2) Å for compound 1H+ and
8H+, respectively) than the other N-C(aryl) distances in 1H
+, 8H
+ and 1 that fall
in the range of 1.391(2)-1.418(2) Å.
The most striking feature in the solid state is the localization of the proton
in both protonated derivatives 1H+ and 8H
+ on the nitrogen atom of one of the
Page 36
Chapter 2
34
piperidine moiety. Interestingly, the twist angle between the protonated piperidine
and the benzene ring in both 1H+ and 8H
+ is larger than that between the
unprotonated piperidine or morpholine substituents and the aromatic ring for 1H+
and 8H+, respectively). In particular in compound 8H
+ the twist angles for the
unprotonated morpholine or piperidine rings and the benzene ring (angles between
atoms N1-C7-C8-O5-C10-C11 and C1-C2-C3-C4-C5-C6 and between N3-C12-
C13-C14-C15-C16 and the aromatic ring) are 5.4(3) and 21.9(2)°, respectively
while in compound 1H+ the two unprotonated piperidine rings have similar twist
angles of 11.9 and 22.3(1)°. A further comparison with the neutral 1 shows that
also in this compound the piperidine substituents and the benzene ring are not
coplanar presumably because of steric congestion and packing forces effects.The
torsion angles are similar to those observed in 1H+ and 8H
+ for the unprotonated
piperidine substituents.
The benzofurazane anion is almost perpendicular to the benzene ring of
the cationic component of 1H+ and 8H
+ and approaches the protonated piperidine
with the oxygen O1 and one oxygen of the nitro group. The O1–C23 distance in
the anionic benzofurazane moiety in 1H+ and 8H
+ is 1.255(4) and 1.250(3) Å,
respectively, showing a double bond character and indicating an electron
delocalization inside the furoxane ring.
Page 37
Chapter 2
35
Figure 2. ORTEP of 1, 1H+, and 8H
+.
2.2 First X-ray structure of the Wheland complex in azo-coupling reaction
The azo-coupling reaction between compounds 1 and 2 (Figure 1) and a
series of benzenediazonium tetrafluoborate salts was previously described by us.[9]
The less reactive diazonium salt was that bearing an electron-donating group. This
caused the slowing down of all processes including the return back[11]
and the
proton departure. On the basis of this findings we realized that 4-
methoxybenzenediazonium tetrafluoborate might be a suitable candidate to obtain
single crystals of a W complex on this aza-coupling reaction. We focused our
attentions on the reaction between 1 and 4-methoxybenzenediazonium
tetrafluoborate as shown in Scheme 7.
Page 38
Chapter 2
36
NR2
R2N NR2
N2+
OCH3
BF4-
NR2 = N-piperidinyl (1)
+
H NR2N NR2
NR2
N
OCH3
BF4–
W complex
NR2N NHR2
NR2
N
OCH3
BF4–
base NR2N NR2
NR2
N
OCH3
H+.
PH+ P
Scheme 7. The reaction between tris(N-piperidinyl)benzene and 4-
methoxybenzenediazonium tetrafluoborate.
As previously described,[9]
this reaction shows NMR and UV/Vis
spectroscopic evidence of the formation of the W complex. Its moderate stability
in the common solvents suggested us to try to grow crystals suitable for an X-ray
diffraction study of this W complex. After several attempts, the solid Wheland
complex precipitated by using a mixture of CH2Cl2/n-hexane at low temperature
(about –60°C). From this solution some crystals of W were obtained. Two
different crystals were analyzed through X-Ray diffraction analysis at different
temperatures. The first data collection was carried out at 223°K, whereas the
second one at 100°K. In both cases the nature of compound W was the same but
the lower temperature data set allowed to understand the disorder involving the
N1, N2 atoms and the methoxyphenyl ring (see later) and therefore this discussion
will comment the structural features of W based on the X-ray structure
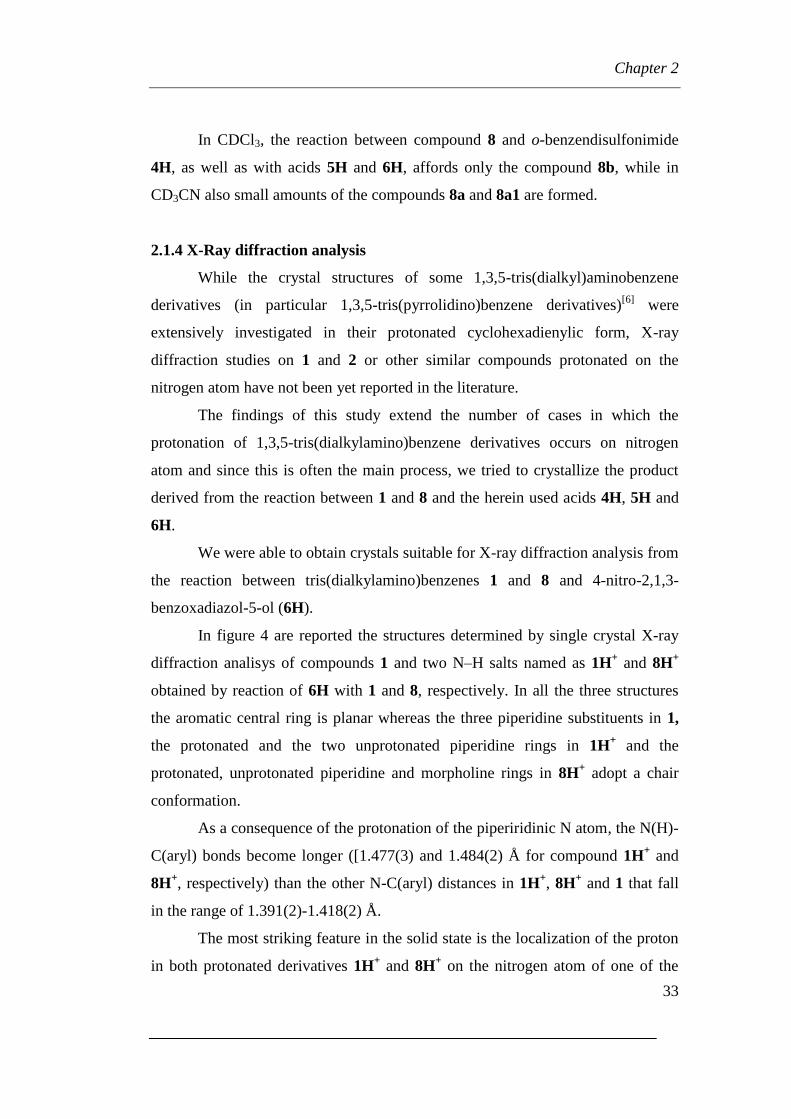
determination at 100 °K. The crystal structure of W is shown in Figure 3.
Page 39
Chapter 2
37
Figure 3. The crystal structure of W complex featured by the pedal motion.27
The cation W consists of a tris(piperidine)substituted ring bearing a 4-
methoxyphenylazo ligand. The tris(piperidine)substituted ring shows a significant
loss of planarity (dihedral angle between the C2-C3-C4-C5 and C2-C1-C6 planes
23.3(2)° and the C1 carbon of W changes its hybridization from sp2 to sp
3. The
C2-C3 and C5-C6 bonds are the shortest ones (1.372 and 1.360(4) Å,
respectively), the C3-C4 and C4-C5 bonds are at longer distance (1.422 and
1.425(4) Å, respectively) and the C1-C2 and C1-C6 bonds are the longest ones
(1.470 and 1.461(4) Å, respectively). This bond lengths distribution evidences the
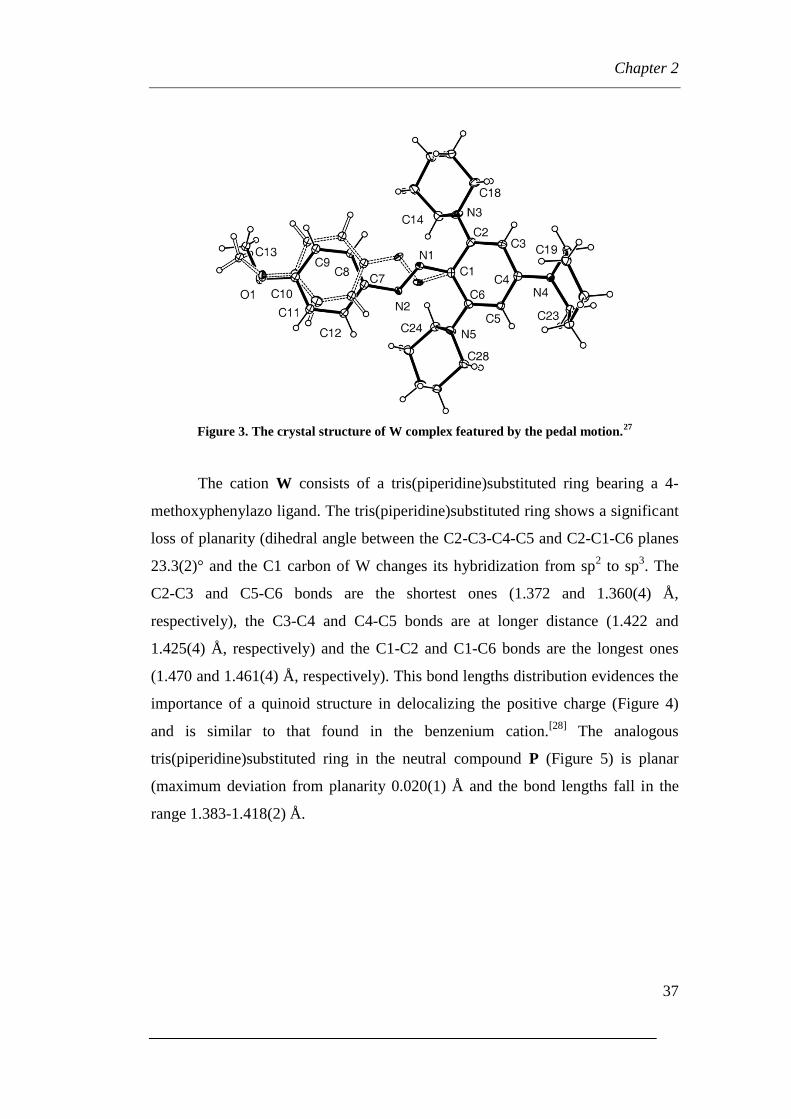
importance of a quinoid structure in delocalizing the positive charge (Figure 4)
and is similar to that found in the benzenium cation.[28]
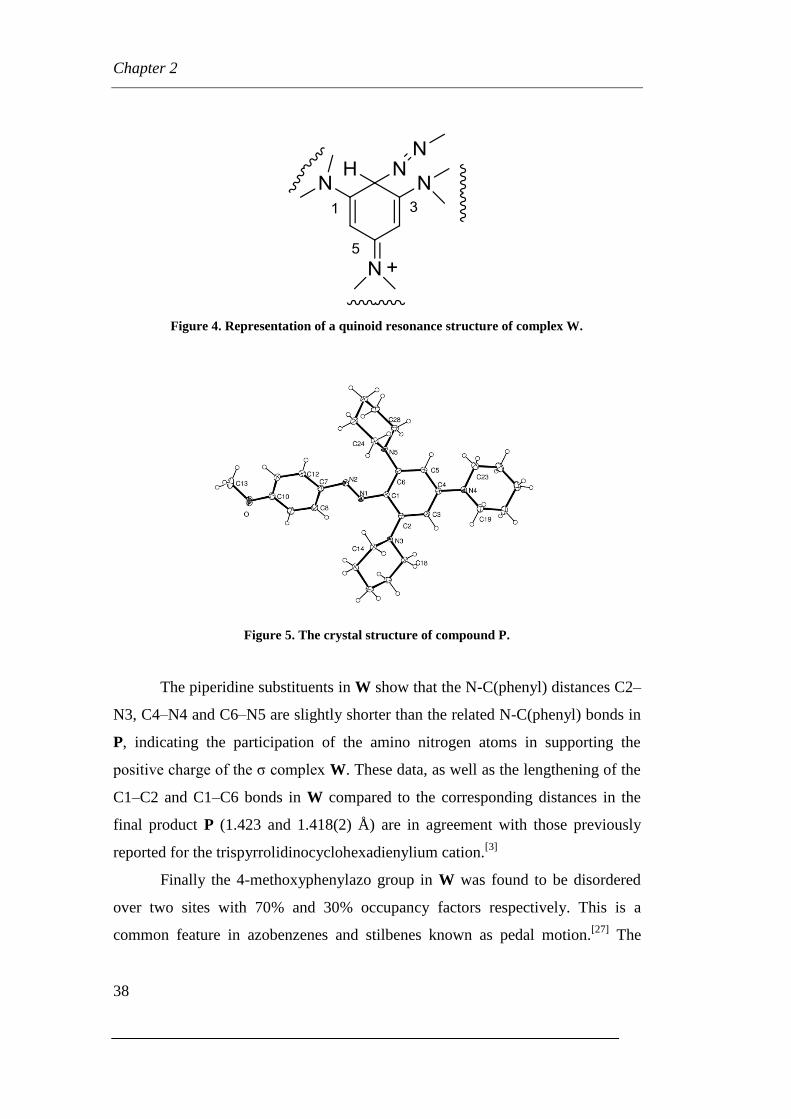
The analogous
tris(piperidine)substituted ring in the neutral compound P (Figure 5) is planar
(maximum deviation from planarity 0.020(1) Å and the bond lengths fall in the
range 1.383-1.418(2) Å.
Page 40
Chapter 2
38
Figure 4. Representation of a quinoid resonance structure of complex W.
Figure 5. The crystal structure of compound P.
The piperidine substituents in W show that the N-C(phenyl) distances C2–
N3, C4–N4 and C6–N5 are slightly shorter than the related N-C(phenyl) bonds in
P, indicating the participation of the amino nitrogen atoms in supporting the
positive charge of the σ complex W. These data, as well as the lengthening of the
C1–C2 and C1–C6 bonds in W compared to the corresponding distances in the
final product P (1.423 and 1.418(2) Å) are in agreement with those previously
reported for the trispyrrolidinocyclohexadienylium cation.[3]
Finally the 4-methoxyphenylazo group in W was found to be disordered
over two sites with 70% and 30% occupancy factors respectively. This is a
common feature in azobenzenes and stilbenes known as pedal motion.[27]
The
Page 41
Chapter 2
39
tris(piperidino)substituted benzene ring is not affected by this disorder because of
the presence in the two ortho positions of the bulky piperidine substituents.
On the contrary, this type of disorder has not been observed in the 4-
methoxyphenylazo group in P presumably because of the very low population of
the minor component. The two substituted phenyl rings in P do not lie on the
same plane and therefore there is no delocalization through the azo group. The
N1-N2 distance in P of 1.262(2) Å has the typical value of a double bond
character whereas the equivalent N=N distance in W of 1.326(6) Å is longer than
a normal double bond. This lengthening of the N=N bond in W is associated to a
shortening of the C1-N1 distance of 1.324(5) Å which is indicative of some
double bond character. It should be pointed out that the interactions involving the
azo group in the cationic W are affected by dynamic disorder and therefore it is
not possible to completely rule out the contemporary presence in the crystal in
trace amounts of a cation in which there is a protonated nitrogen in place of the
Wheland complex.
The Wheland complex W spontaneously (but slowly) produces a salt of
the usual product of substitution which may be obtained quickly by using a base[9]
(NaOH, tertiary amines, etc). The shift of the proton from the carbon atom
produces a salt with a N-H bond. The 1H NMR spectrum of W at –30 °C in
CD3CN shows the signal related to the sp3 carbon atom at δ = 6.42 ppm
[9] which
disappears and a signal at δ =12.51 grows, which may be attributed to N-H bond
of the salt PH+. The fact that the chemical shifts of protons H-4 and H-6 of the
salt PH+ are different
[9] (δ = 5.81 ppm and 6.13 ppm in CDCl3 at 20 °C) indicates
an unsymmetric situation caused by the presence of the proton bound to an
heterocyclic nitrogen in 1 (or 3) position. The presence of the proton in other
positions (on the nitrogen atom of the heterocyclic moiety in 4 position or on
nitrogen atoms of azo group) causes an equivalence of the C-4 and C-6 positions.
Probably, the nitrogen atoms in 1 or in 3 positions are preferred to the
nitrogen atom in 4 position because of the proton sharing between the piperidine
moiety and the two nitrogen atoms of the azo group.
Page 42
Chapter 2
40
The interaction between two nitrogen atoms may be considered a situation
extremely favourable to the bonding of the proton to the nitrogen atom. This is
supported by the fact that the return back of the proton on the carbon atom was
not observed even when the final product P was dissolved in the presence of
strong amount of HCl. In the same way, the decrease of the temperature of a
solution of PH+ (obtained directly in the NMR probe) did not produced a return to
the W complex.
Conclusions
The studies above mentioned are an extension of the previous work on the
peculiar properties of tris(dialkylamino)benzenes, in particular the “proton dance”
on these systems.
In the 2.1 chapter we analyzed the interaction of tris(dialkylamino)
benzenes with the simplest electrophile, the proton. First of all it has to be noticed
that this work reports for the first time, to the best of our knowledge, X-ray
diffraction data of N-adducts between proton and tris(dialkylamino)benzene
derivatives which showed that in the solid state the proton is localized on a
nitrogen atom of piperidine ring. The obtained results, together with the previous
work, help us to have a better understanding on these systems, but there are a lot
of open questions. The first question is: from where arises the regioselectivity of
the electrophiles on trisaminobenzenes? What parameters influence this
regioselectivity?
Some of these parameters might be:
– The pKa values relative to aromatic C carbon atoms and to the nitrogen atoms
of the amino moiety.
– The softness of the two reaction centres.
– The symmetry of the systems that may produce some degenerate structures with
a clear gain of the resonance energy. Even if the symmetry is considerably
lowered by changing the substrate from 1 to 8 (which presents only two
Page 43
Chapter 2
41
equivalent nitrogen atoms) the proton on 8 seems to be shared in solution by both
nitrogen atoms of piperidine moiety which are more basic than the nitrogen atom
of the morpholine moiety.
The second question is: why DNBF and proton are in a dynamic situation
respect to the electron-rich center (the aromatic carbon and the nitrogen atom
respectively). In other words, why DNBF and H+ do not have a fixed position of
attack by a bond?
The two questions involve a lot of parameters, and, up to now, we were not able
to have completely convincing answers. However, we can try the hypothesis of a
“generical symmetry” of the present systems in lowering the energy of these not
usual situations.
Furthermore, up to now, we are not able to state if the proton is bonded as
in a charge transfer complex or it is “dancing” from a nitrogen to another as
depicted in Scheme 5. The dancing hypothesis seems to be more valid for the
dynamic phenomenon observed for DNBF which is stopped by lowering the
temperature. However, it cannot be excluded that both hypotheses might coexist
in explaining the observed behaviours.
The studies described in chapter 2.2 show how the isolation, crystallization
and investigation on W complex in aza-coupling reaction support our previous
findings on this SEAr reaction carried out in the absence of bases different from
the starting tris(dialkylamino)benzene derivative. The reaction proceed through a
two steps pathway. On the contrary to that reported in the literature, the first step
is a fast step, while the spontaneous proton releasing process is in a slow step with
the possibility of a relevant base catalysis towards to the re-aromatized
substrate.[10]
In conclusion, in the present case, the “proton dance” regards the hydrogen
shift from a carbon atom to nitrogen atoms in the same molecule, without
evidence of a return back, even if we reported evidence on the reversibility of the
whole substitution process.[11]
Page 44
Chapter 2
42
Some NMR data related to the products here described can be found in the Ph.D.
thesis of Silvia Tozzi: “Caratterizzazione ed isolamento di intermedi delle reazioni
di sostituzione elettrofila e nucleofila in serie aromatiche” which is freely
available online at http://amsdottorato.cib.unibo.it/
References
[1] L. Forlani, C. Boga Targets in Heterocyclic Systems, Chemistry and Properties, 2011, 15, 372–
401.
[2] F. Effenberger; R. Niess, Angew. Chem. 1967, 79, 1100, Angew. Chem. Int. Ed. Engl. 1967, 6,
1067.
[3] F. Effenberger; F. Reisinger, K.H. Schönwälder, P. Bäuerle, J.J. Stezowski, K.H. Jogun, K.
Schöllkopf, and W.D. Stohrer, J. Am. Chem. Soc. 1987, 109, 882–892.
[4 F. Effenberger, Acc. Chem. Res. 1989, 22, 27–35 and ref. therein.
[5] a) W. Sachs; W. Knoche, S. Herrmann; J. Chem. Soc. Perkin Trans. 2 1991, 701–710. b) S.
Vogel W. Knoche, W. W. Schoeller, J. Chem. Soc. Perkin Transaction 2, 1986, 769–772. c)
W. Knoche; W. Schoeller; R. Schomaecker; S. Vogel. J. Am. Chem. Soc. 1988, 110, 7484–
7489. d) W. Knoche, W. Sachs; S. Vogel, Bull. Soc. Chim. France 1988, 377–382.
[6] a) R. Niess, K. Nagel, F. Effenberger, Tetrahedron Lett. 1968, 40, 4265–4268; b) F.
Effenberger, K. E. Mack, K. Nagel, R. Niess, Chem. Ber. 1977, 110, 165–180; c) P. Fischer,
K. E. Mack, E. Mossner, F. Effenberger, Chem. Ber. 1977, 110, 181–188.
[7] a) P. Menzel, F. Effenberger, Angew.Chem. It. Ed., 1972, 11. 922. b) F. Effenberger, P.
Menzel, Angew.Chem. It. Ed., 1975, 14. 72.
[8] C. Boga, E. Del Vecchio, L. Forlani, A. Mazzanti, P. E. Todesco, Angew. Chem. 2005, 117,
3349–3353; Angew Chem. Int. Ed. Engl. 2005, 44, 3285–3289.
[9] C. Boga, E. Del Vecchio, L. Forlani, Eur. J. Org. Chem 2004, 7, 1567–1571.
[10] Boga, C.; Del Vecchio, E.; Forlani, L.; Tocke Dite Ngobo A.-L.; Tozzi, S. J. Phys. Org.
Chem., 2007, 20, 201–205.
[11] C. Boga, E. Del Vecchio, L. Forlani, S. Tozzi, J. Org. Chem., 2007, 72 (23), 8741–8747.
[12] K. Schollkopf, J.J. Stazowski, F. Effenberger, Organometallics, 1985, 4, 922–929.
[13] D.T. Glatzhofer, M. A. Khan, Acta Cryst., 1993, C49, 2128–2133.
[14] T. Yamaoka; H. Hosoya; S. Nagakura, Tetrahedron 1968, 24, 6203–6213.
[15] T. Yamaoka; H. Hosoya; S. Nagakura, Tetrahedron 1970, 26, 4125–4130.
[16] W. Knoche, W. Sachs; S. Vogel, Bull. Soc. Chim. France 1988, 377–382.
[17] W. Knoche; W. Schoeller; R. Schomaecker; S. Vogel. J. Am. Chem. Soc. 1988, 110, 7484–
7489.
Page 45
Chapter 2
43
[18] W. Sachs; W. Knoche, S. Herrmann; J. Chem. Soc. Perkin Trans. 2 1991, 701–710.
[19] a) D. T. Glatzhofer; D. Allen; R. W. Taylor, J. Org. Chem. 1990, 55, 6229–6231; b) D.T.
Glatzhofer, M. A. Khan, Acta Cryst., 1993, C49, 2128-2133.
[20] C. Boga, E. Del Vecchio, L. Forlani, R. Goumont, F. Terrier, S. Tozzi, Chem. Eur. J. 2007,
13, 9600–9607.
[21] L. Forlani, C. Boga, A. Mazzanti, N. Zanna, Eur. J. Org. Chem. 2012, 1123–1129.
[22] C. Boga, E. Del Vecchio, L. Forlani, A. Mazzanti, C. Menchen Lario, P. E. Todesco, S.
Tozzi, J. Org. Chem. 2009, 74, 5568–5575.
[23] a) H. Mayr, M. Patz, Angew. Chem. 1994, 106, 990–1010; Angew. Chem., Int. Ed. Engl.
1994, 33, 938–957; b) H. Mayr, B. Kempf, A. R. Ofial, Acc. Chem. Res. 2003, 36, 66–77; c)
H. Mayr, M. Patz, M. F. Gotta, A. R. Ofial, Pure Appl. Chem. 1998, 70, 1993–2000; d) H.
Mayr, T. Bug, M. F. Gotta, N. Hering, B. Irrgang, B. Janker, B. Kempf, R. Loos, A. R. Ofial,
G. Remmenikov, N. Schimmel, J. Am. Chem. Soc. 2001, 123, 9500–9512.
[24] a) L. Forlani, Hydrogen Bonding and Complex Formation Involving Compounds with Amino,
Nitroso and Nitro Groups in Amino, Nitroso, Nitro and Related Groups, Patai's Chemistry of
Functional Groups, (Ed S. Patai), John Wiley & Sons, Ltd, Chichester, UK.Ch.10, 2003; b)
L. Forlani, Hydrogen bonds of anilines in The Chemistry of Anilines, Part I Patai's Chemistry
of Functional Groups, (Ed. Z. Z. Rappoport), John Wiley & Sons, Ltd, Chichester, UK.Ch.8,
2007; c) R. Taylor, O. Kennard, W. Versichel J. Am. Chem. Soc. 1984, 106, 244–248; d) M.
T. Scerba, C. M. Leavitt, M. E. Diener, A. F. DeBlase, T. L. Guasco, M. A. Siegler, N. Bair,
M. A. Johnson, T. Lectka J. Org. Chem. 2011, 76, 7975–7984.
[25] a) J. A. Riddick, W. B. Bunger in Organic Solvents (Ed.: A. Weissberger) Wiley-Interscience,
New York, 1970; b) C. Reichardt, Solvents and Solvent Effects in Organic Chemistry, 3rd
Edition, Wiley-VCH, Weinheim, 2003.
[26] J. F. Coetzee, G. R. Padmanabhan, J. Am. Chem. Soc. 1965, 87, 5005–5010.
[27] a) J. Harada, K. Ogawa, J. Am. Chem. Soc.; 2001, 123, 10884–10888; b) J. Harada, K.
Ogawa, Chem. Soc. Rev.; 2009, 38, 2244–2252).
[28] C. R. Reed, K-C. Kim, E. S. Stoyanov, D. Stasko. F. S. Tham, L. J. Mueller, P. D. W. Boyd,
J. Am. Chem. Soc. 2003, 125, 1796–1804.
Page 47
Chapter 3
45
Chapter 3
2,4-dipyrrolidine-1,3-thiazole as a new
supernucleophile
Chemical reactions involving neutral carbon atoms of strongly activated
nucleophilic and electrophilic molecules permit to observe particular behaviours
of the simple nucleophile/electrophile coupling reaction. This is the case of
superelectrophilic species such as 4,6-dinitrobenzofuroxan (DNBF), or
supernucleophilic species such as 1,3,5-tris(N,N-dialkyl)aminobenzenes.
-Anionic complexes (Meisenheimer complexes)[1]
involving a number of
strongly activated electrophilic substrates have been extensively described.[2]
σ-
cationic complexes (Wheland complexes),[3]
intermediates of the electrophilic
aromatic substitution reaction,[4–7]
have been less investigated[8,9]
due also to some
experimental difficulties in their isolation or simple observation by spectroscopic
methods. Recently, our interest has been devoted to Wheland complexes and we
have been able to isolate some of them and to study their reactivity.[10]
The reaction between superelectrophilic and supernucleophilic reagents
afforded a new kind of σ-complex, zwitterionic in character, which was called by
us Wheland-Meisenheimer complex (WM), as shown in Scheme 1.[11]
Zwitterionic adducts WM1-3 are moderately stable[11]
and showed, in
variable temperature 1H NMR experiments, a very peculiar and unexpected
behaviour. The signals ascribed to H-10, H-12, and H-14, at low temperature are
well separated, but, on raising the temperature, they undergo a broadening until to
a coalescence situation. This reversible dynamic process was explained
hypothesizing the existence of the Wheland-Meisenheimer complex in three
homomeric structures rapidly exchanging, as depicted in Scheme 2.[11]
Page 48
Chapter 3
46
R2N NR2
NR2
+N
ONO2N
NO2
DNBF
ON
ON
HNO2
NO2–
O
NR2 = N-piperidinyl (1)NR2 = N-morpholinyl (2)NR2 = N-pyrrolidinyl (3)
NR2 = N-piperidinyl (WM1)NR2 = N-morpholinyl (WM2)NR2 = N-pyrrolidinyl (WM3)
5
7
10
H
R2N NR2
NR2
H
12 14H H
Scheme 1. Formation of Wheland-Meisenheimer complexes (WM) from 1,3,5-tris(N,N-
dialkyl)aminobenzenes and 4,6-dinitrobenzofuroxan (DNBF).
+
H
R2N NR2
NR2
HH
10
12 14
DNBF–
+
R2N NR2
NR2
HH
10
12 14
H
5
HNO2
–
NO2
NO
N
O
DNBF– =
+
R2N NR2
NR2
HH
10
12 14
H
DNBF–
H
DNBF–
7
NR2 = N-piperidinyl, N-morpholinyl, N-pyrrolidinyl
Scheme 2. Proposed explanation of the reversible dynamic process observed for WM1–3 in
variable temperature 1H NMR experiments,
Recently, Lenoir[12]
reported a theoretically calculated comparison
between the formation of WM complex and the formation of donor/acceptor
complex (such as π-π complex) in the reaction between DNBF and symmetrical
triaminobenzenes: the π-π complex results thermodynamically more stable than
the WM complex in the case of 1,3,5-triaminobenzene, while WM complex is
thermodynamically more stable than the donor/acceptor complex in the case
of the reaction between DNBF and 1,3,5-tris(N,N-dialkyl)aminobenzenes.
The high positive-charge stabilization effect of the supernucleophiles
1,3,5-tris(N,N-dialkylamino)benzenes is due to the strong donor ability of
dialkylamino group, as reported by Effenberger.[13]
Page 49
Chapter 3
47
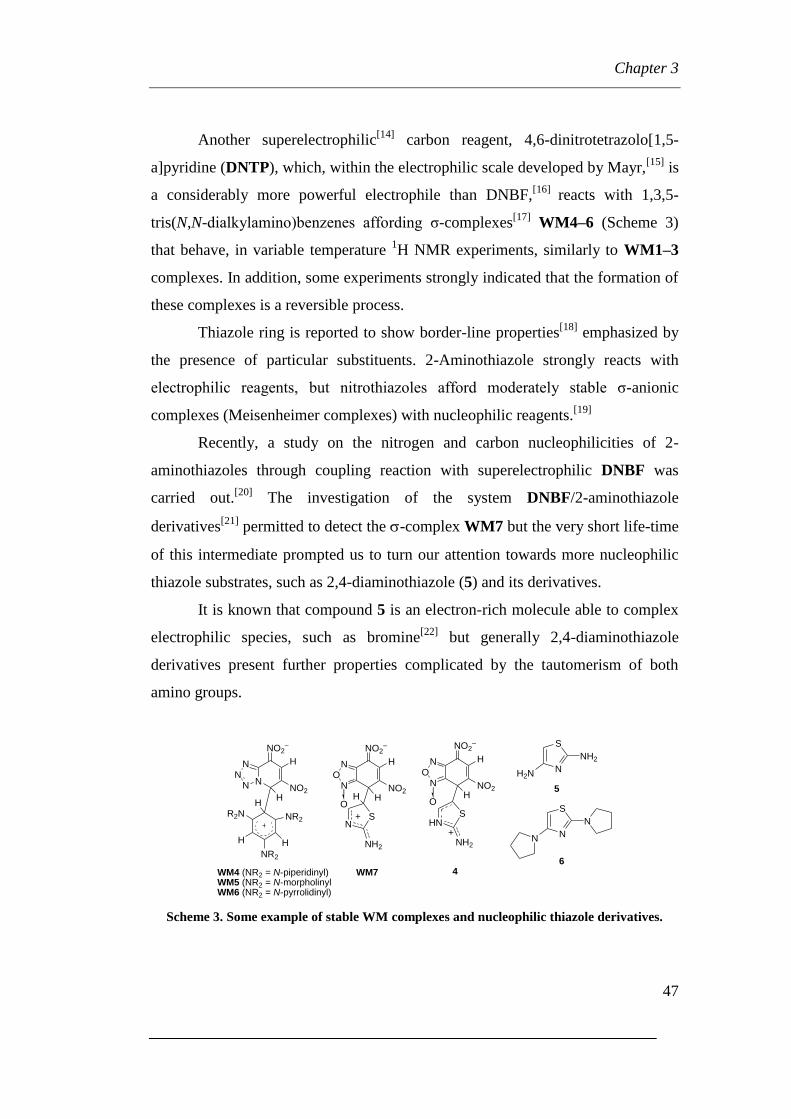
Another superelectrophilic[14]
carbon reagent, 4,6-dinitrotetrazolo[1,5-
a]pyridine (DNTP), which, within the electrophilic scale developed by Mayr,[15]
is
a considerably more powerful electrophile than DNBF,[16]
reacts with 1,3,5-
tris(N,N-dialkylamino)benzenes affording σ-complexes[17]
WM4–6 (Scheme 3)
that behave, in variable temperature 1H NMR experiments, similarly to WM1–3
complexes. In addition, some experiments strongly indicated that the formation of
these complexes is a reversible process.
Thiazole ring is reported to show border-line properties[18]
emphasized by
the presence of particular substituents. 2-Aminothiazole strongly reacts with
electrophilic reagents, but nitrothiazoles afford moderately stable σ-anionic
complexes (Meisenheimer complexes) with nucleophilic reagents.[19]
Recently, a study on the nitrogen and carbon nucleophilicities of 2-
aminothiazoles through coupling reaction with superelectrophilic DNBF was
carried out.[20]
The investigation of the system DNBF/2-aminothiazole
derivatives[21]
permitted to detect the -complex WM7 but the very short life-time
of this intermediate prompted us to turn our attention towards more nucleophilic
thiazole substrates, such as 2,4-diaminothiazole (5) and its derivatives.
It is known that compound 5 is an electron-rich molecule able to complex
electrophilic species, such as bromine[22]
but generally 2,4-diaminothiazole
derivatives present further properties complicated by the tautomerism of both
amino groups.
4WM7WM4 (NR2 = N-piperidinyl)WM5 (NR2 = N-morpholinylWM6 (NR2 = N-pyrrolidinyl)
NR2
H
N
NN
N NO2
NO2–
H
NR2R2N
H
H H
O
NO
N NO2
NO2–
H
H
SHN
NH2
+
O
NO
N NO2
NO2–
H
H
S
N
NH2
H2N
5
S
N
N
N
6
NS+
H
NH2
Scheme 3. Some example of stable WM complexes and nucleophilic thiazole derivatives.
Page 50
Chapter 3
48
In N,N-tetra(alkyl)2,4-diaminothiazole derivatives this complication does
not exists and they can be promising candidates to behave as carbon
supernucleophiles. Their high carbon nucleophilicity is confirmed also by a
previous work of Gompper[23]
which discussed the formation of zwitterionic
complexes between N,N,N',N'-tetramethyl-1,3-thiazole-2,4-diamine and 1,3,5-
trinitrobenzene.
These considerations suggested us that the presence on the thiazole ring of
two pyrrolidinyl groups in 2 and 4 position might enhance the nucleophilic power
at 5 position of the thiazole ring thus giving a supernucleophile at the neutral
carbon at least comparable with 1,3,5-tris(N,N-dialkylamino)benzenes. With this
in mind, we prepared 2,4-dipyrrolidin-1-yl-1,3-thiazole[24]
(6, Scheme 3), and we
studied its reactivity with the superelectrophiles DNBF and DNTP. We were able
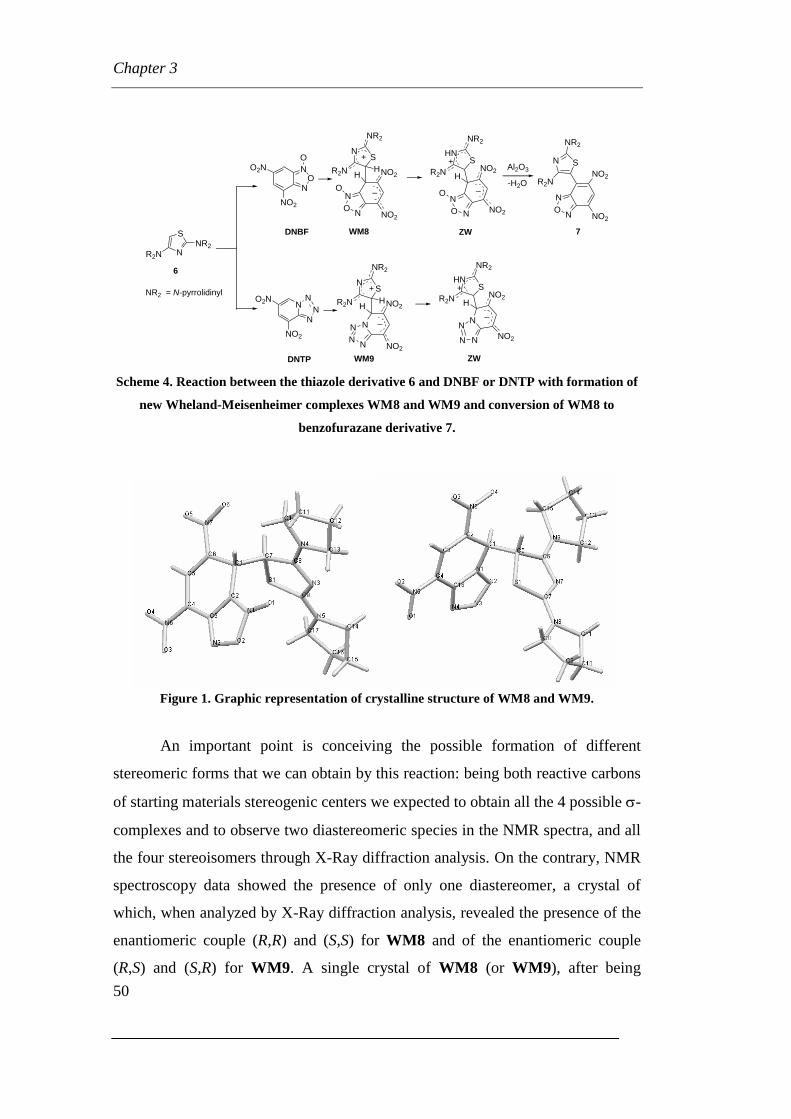
to obtain and crystallize in both cases ultrastable WM complexes thus gaining
important information from their X-ray diffraction analysis. These are the first
examples of Wheland-Meisenheimer complexes so stable to permit a study on
their crystallographic structures. After that we decided to perform a theoretical
study of these reactions by using the Density Functional Theory approach (DFT).
Besides the experimental work which will be discussed in chapter 3.1,
hence, we reported a detailed theoretical study on the energetic, stabilities and
properties of reactants and products reported in this study (chapter 3.2).
3.1 Synthesis and characterization of ultrastable W-M complexes
When 2,4-dipyrrolidin-1-yl-1,3-thiazole (6), dissolved in CH3CN, was
added (at 25 °C) to an equimolar amount of DNBF (or DNTP), immediately the
solution color changed, and a solid precipitated. The 1H NMR spectrum of the
solid obtained from 6 and DNBF showed, in [D6]DMSO and in the range of
chemical shifts between 5 and 9 ppm, two doublets centered at 5.63 and 6.13 ppm
(J = 2.7 Hz), respectively, and a singlet signal at 8.63 ppm, while the related 13
C
NMR signals (correlated through g-HSQC experiments) were at 35.6, 59.6 and
Page 51
Chapter 3
49
132.7 ppm, respectively. The presence of two doublets with the same coupling
constant in the region of protons bound to an sp3 carbon atom, the proton signal
area, and the relative chemical shifts in the 13
C NMR spectrum confirmed the
structure of the zwitterionic -complex WM8 (Scheme 4). 1H NOE experiments
permitted to assign the doublets at 5.63 ppm and 6.13 ppm to the proton bound to
the sp3 carbon of the DNBF and of the thiazole moiety, respectively, while the
singlet at 8.63 ppm is related to the proton bound to the sp2 carbon of DNBF
moiety. The ESI-MS analysis was also in agreement with the structure WM8.
Also NMR spectral data of the solid obtained from 6 and DNTP agree
with structure WM9 (Scheme 4). In particular, in the range of chemical shifts
between 5 and 9 ppm, in [D6]DMSO, 1H NMR signals at 6.32 (br.s., 1 H), 7.23 (d,
3JH,H = 1.8 Hz, 1 H), and 8.65 ppm (s, 1 H) were found, and the related
13C NMR
signals were at 61.9, 56.1 and 131.2 ppm).
Thanks to the stability of complexes WM8 and WM9 we were able to
obtain crystals suitable for X-Ray diffraction analysis from the mixture
CH3CN/CH2Cl2 (1/1 by volume). Structures of WM8 and WM9 were confirmed
by this technique. We emphasize that these are the first instances of detailed
structural X-Ray diffraction analysis of a stable crystalline intermediate of the
nucleophilic/electrophilic aromatic substitution reaction. Some details of the
structure of WM8 and WM9 (Figure 1) are discussed below.
The X-Ray structure showed that the C1-C7 (for both complexes) distance
is longer than a standard C-C distance (1.49 Å), being it 1.56 Å both for WM8
and for the corresponding C1-C5 bond in WM9. This confirms the weakness of
the bond, that can be the cause of the possibility, in WM1–6 complexes, to
observe the dynamic process indicated in Scheme 2. Obviously, this process
cannot occur in the present case. The relative spatial situation of the substituents
around the C1-C7 bond corresponds to a gauche relationship, the torsion angle
H1-C1-C7-H7 for WM8 being 66.7° (the corresponding angle for WM9 is 71.7°).
Page 52
Chapter 3
50
NO
NO2N
NO2
S
NNR2
R2N
O +
NR2 = N-pyrrolidinyl
NO
N
NO2
NO2
N S
NR2
R2N
ZW
-H2O
7DNBF
6
Al2O3
NS
NR2
R2N H
NO
N
NO2
NO2
O
H
_
HNS
NR2
R2N
NO
N
NO2
NO2
O
H
_
+
N
NN
NO2N
NO2
+
DNTP
NS
NR2
R2N H
N
NN
N
NO2
NO2
H
_
ZW
HNS
NR2
R2N
N
NN
N
NO2
NO2
H
_
+
WM8
WM9
Scheme 4. Reaction between the thiazole derivative 6 and DNBF or DNTP with formation of
new Wheland-Meisenheimer complexes WM8 and WM9 and conversion of WM8 to
benzofurazane derivative 7.
Figure 1. Graphic representation of crystalline structure of WM8 and WM9.
An important point is conceiving the possible formation of different
stereomeric forms that we can obtain by this reaction: being both reactive carbons
of starting materials stereogenic centers we expected to obtain all the 4 possible -
complexes and to observe two diastereomeric species in the NMR spectra, and all
the four stereoisomers through X-Ray diffraction analysis. On the contrary, NMR
spectroscopy data showed the presence of only one diastereomer, a crystal of
which, when analyzed by X-Ray diffraction analysis, revealed the presence of the
enantiomeric couple (R,R) and (S,S) for WM8 and of the enantiomeric couple
(R,S) and (S,R) for WM9. A single crystal of WM8 (or WM9), after being
Page 53
Chapter 3
51
analyzed by X-Ray diffraction, was dissolved in CD3CN and his 1H NMR
spectrum showed the same signals observed in the NMR spectrum of the solution
from which the crystal was precipitated.
This diastereoselectivity can be explained considering the spatial
conformation of the complexes in the solid phase: as shown in Figure 1 the
furoxanic ring (as well as the tetrazole ring of DNTP of WM9) of DNBF is
facing the thiazole ring and the medium distance between the two rings is near the
Van der Waals radii for both enantiomeric forms; an approach between the two
reagents that might be responsible for the observed stereoselection.
From crystallographic data it is possible to note as C9-N5 and C8-N4 (1.30
and 1.31 Å respectively for WM8) and the corresponding C7-N8 and C6-N9
(1.31Å for WM9) exocyclic bonds are slightly shorter (or equal for WM9) than
C9-N3 and C8-N3 (1.34 and 1.31 Å, respectively for WM8) and C7-N7 and C6-
N7 (1.33 Å) for WM9 endocyclic bonds of the thiazole ring. One can deduce that
C-N exocyclic bonds are more in π character than the C-N endocyclic bonds, in
agreement to the strong electron-donating effect of the two amino groups bound to
the thiazole ring. The thiazole ring and the furoxanic ring are face to face, and the
observed configuration agrees with the presence of an internal donor/acceptor
interaction between the positively charged thiazole moiety and the negatively
charged benzofuroxan or tetrazolopyridine moiety of WM8 or WM9,
respectively. For instance, S1-C2, S1-C5, and S1-C3 distances are 3.144, 3.714
and 3.690 Å, respectively for complex WM8, and for WM9 complex S1-N1, S1-
C16, and S1-C3 are 3.04, 3.513 and 3.687 respectively. Packing of molecules
does not show donor-acceptor intermolecular interactions. This structural situation
is an indication that the two moieties are prone to a donor-acceptor interaction
which may be conceived also between starting reagents.
Even if it is reasonable that the first evolution of WM8 may be the shift of
the proton from the C7 of the thiazole ring to a more basic centre, probably the N3
atom (and the corresponding shift of the proton bound to the C5 of the thiazole
ring to the N7 atom WM9) we were not able (in both cases) to have evidence on
the presence of the zwitterionic σ-complex ZW. Interestingly, we observed, in the
Page 54
Chapter 3
52
reaction mixture containing the WM8 complex, the slow formation of the final C-
C coupling product 7 which may be obtained, in almost quantitative yields, by
adding Al2O3 to the reaction mixture in CH2Cl2. It has to be noted that this is the
first example of observed evolution of WM complexes to neutral products,
probably favoured by the possibility, for WM8, to lose water.
Finally, when DNTP is added to a solution in CD3CN of WM8, WM9
complex is formed in a slow process (about 2 weeks to rise quantitative
conversion), as depicted in Scheme 5 to confirm our previous conclusion on the
reversibility of the formation of the WM complexes.
NO
NO2N
NO2
O+
DNBF
NS
NR2
R2N H
NO
N
NO2
NO2
O
H
_
N
NN
NO2N
NO2
+
DNTP
NS
NR2
R2N H
N
NN
N
NO2
NO2
H
_+ +
CD3CN
WM8 WM9
Scheme 5. Exchange of the electrophilic partner from WM8 to WM9.
3.2 A theoretical study on the structure, energetic and properties of the W-M
complexes
As described in the introduction, to better understand the peculiar behavior
of these reagents and products we decided to carry out a theoretical study. The
first step was to compare calculated vs. experimental structures and in particular to
optimize all the intermediates compounds leading to the obtained WM’s. In a
second step we performed a benchmark by using MP2 and a variety of DFT
functionals for evaluating the energies of all molecules in the reaction’s pathways;
this has a twofold interest: first of all the performance of the different functionals
can be assessed, secondly the profile of this peculiar reaction can be characterized
in terms of activation energy. Finally, we investigated the electronic properties
Page 55
Chapter 3
53
(frontier orbitals, electrostatic potential, etc…) of all reagents and products in
order to provide more insight into their peculiar reactivity.
All calculations were carried out with the Gaussian 09 program package
(Rev. A.02).[25]
The initial guess geometry of the compounds WM8 and WM9 were taken
from the X-Ray coordinates.[26]
All geometries were fully optimized using
ultrafine grid at the B3LYP/6-31G(d) level of theory, which is known to produce
reliable geometries and frequencies of the stationary points.
Intrinsic Reaction Coordinate (IRC) calculation followed by geometry
optimizations were used to characterized the reaction path, and in particular to
find reactant complexes ( complexes) and products connected to the transition
state.
Frequencies were calculated at the same level of theory as the geometry
optimization to verify the nature of the stationary points and to obtain zero-point
vibrational corrections. As suggested in previous works, the zero point correction
was scaled by 0.977 to better reproduce experimental results.[27]
Different exchange correlation functionals (listed in table 1) were tested as
well as MP2 for the evaluation of the energies of the compounds along the
reaction’s pathways by single-point energy calculations performed using fairly
large basis set such as 6-311+G(d,p).
The basis set superposition error (BSSE) corrections (using the Boys-
Bernardi counterpoise correction scheme) were applied using the automated
procedure available in the Gaussian 09 software package.[28]
Solvent (acetonitrile) effects were introduced in the single point energy
calculations by the universal solvation model SMD[29]
using the geometries
optimized in the gas phase.
Binding energies were calculated as the differences between the energy of
the complexes and the sum of the energies of the isolated reagents.
Partial atomic charges are obtained by using different methods implemented in
Gaussian 09 namely Chelp[30]
, ChelpG[31]
, Hirshfeld[32-34]
, Merz-Singh-Kollman
(MK)[35,36]
and NBO.[37]
Page 56
Chapter 3
54
Table 1. List of functionals used in the present study.
Method Type Xa
Reference(s)
B3LYP Hybrid GGA 20 38, 39, 40, 41
B97-D GGA + D 0 42
B97-1 Hybrid GGA 21 43
B97-2 Hybrid GGA 21 44
BMK Hybrid meta-GGA 42 45
CAM-B3LYP Range-separated-hybrid
GGA
19/65 46
HCTH GGA 0 43
LC-PBE Range-separated-hybrid
GGA
0/100 47, 48
M05 Hybrid meta-GGA 28 49
M05-2X Hybrid meta-GGA 56 50
M06 Hybrid meta-GGA 27 51
M06-HF Hybrid meta-GGA 100 52
M06-L Meta-GGA 0 53
M06-2X Hybrid meta-GGA 54 51
MP2 WFTb
54
mPW1PW91c
Hybrid GGA 25 55
mPWPW91d
GGA 0 55
OLYP GGA 0 56
PBE0e
Hybrid GGA 25 57
-HCTH Meta-GGA 0 58
-HCTHhyb Hybrid meta-GGA 15 58
TPSSh Hybrid meta-GGA 10 59
VSXCf
Meta-GGA 0 60
B97X Range-separated-hybrid
GGA
15.77/10
0
61
B97X-D Range-separated-hybrid
GGA
22.2/100 62
X3LYP Hybrid GGA 21.8 63
aPercentage of Hartree-Fock exchange in each functional; where two values are present, the first
mean the percentage of Hartree-Fock exchange at short range, while the second at long range.
bWFT stands for Wave Function Theory based methods.
cAlso called mPW1PW, mPW0, and
mPW25. dAlso called mPWPW.
eAlso called PBE1PBE.
fAlso called VS98.
Page 57
Chapter 3
55
3.2.1 Theoretical structures
The X-ray structures of WM8 and WM9 are compared with their
counterparts optimized in gas phase and no great conformational discrepancies are
observed among them as can be seen in Figure 2. The overlay similarity is really
high (0.97% for both structures), demonstrating that the standard method used for
optimization B3LYP/6-31G(d) is accurate in predicting also these particular
structures, which we are able to compare for the first time with experimental
results thanks to their unexpected stability. Moreover, the high value of the
overlay similarity also implies that the crystal packing only induces slightly
distortion structure of the equilibrium geometry. This fact can be due to the high
rigidity of the conjugated structure.
WM8 WM9
Figure 2. Atom-by-atom superimposition of the structure calculated (red) over the X-ray
structure (blue) for the titled compounds. The overlay similarity is 0.97 for both structures.
To be sure that the two optimized structures are in a global and not in a
local minimum because of the choice of starting guess, a search for a lowest
energy structure was performed using the scan method implemented in Gaussian
09 at AM1 level of theory as a function of the selected rotational degree of
freedom between the new C-C bonds formed. This search did not found any
Page 58
Chapter 3
56
lower-lying structure, confirming that the structures previously shown are indeed
the lowest energy conformers.
Once the transition states geometry preceding the formation of WMs
complexes have been optimized and the nature of these stationary points has been
verified (one imaginary frequency), we performed an Intrinsic Reaction
Coordinate (IRC) scan at B3LYP/6-31G(d) level of theory to establish their
connection with the initial and final species. A complex was found to be, as
usually supposed for these kinds of reactions, an intermediate preceding the
formation of the WM complex for both reactions. In Figure 3 the optimized
structures of all species involved in both reactions are shown.
8 TS8 WM8
9 TS9 WM9
Figure 3. Optimized structures at B3LYP/6-31G(d) level of theory of WMs and the
compounds preceding their formation.
Page 59
Chapter 3
57
The distance between the two carbon atoms involved in the formation of
the new bond is reported in Table 2. The theoretical distance of the new bonds
formed in the WMs show a good agreement with the experimental one. The
distance of the aromatic rings of the two moieties (DNBF-DPT and DNTP-DPT)
in the complexes is about 3 Ǻ, typical for such kind of complexes.[64]
An
interesting substantial difference for the two reactions is that in the complex
between DNTP and DPT the thiazole ring is directly facing to the six member
ring of the tetrazolepyridine while in the complex between DNBF and DPT
the six member rings of the benzofuroxane is facing to the sulphur atom of the
thiazole ring (Figure 4). This can result in a better overlapping between the
reactant’s orbitals in the 9, whose interaction can be governed by charge
transfer between the aromatic rings, while for 8 the dominant interaction
could be an n- between sulphur atom and benzofuroxane aromatic ring.
Table 2. Selected bond lengths of the titles optimized structure (Ǻ). In parenthesis the
experimental values.
DNBF + DPT DNTP + DPT
3.02 3.05
TS 2.34 2.34
WM 1.60 (1.57) 1.58 (1.56)
Figure 4. Pictures of andcomplexes.
Page 60
Chapter 3
58
3.2.2 Energetic along reaction’s pathways and functional benchmark.
To assess the performance of the most common used DFT exchange
correlation functionals, we performed single point energy calculation with all
methods listed in Table 1 on the stationary points structures along the pathways
for the reaction between DNBF and DPT (previously optimized with B3LYP/6-
31G(d) in gas phase) with the fairly large basis set 6-311+G(d,p). The data
collected in Table 3 (which are not corrected for both ZPVE and BSSE) show, as
expected, a large variance among them. First of all is necessary to remember that
energy of TS8 can be in some cases lower than that of because its energy is
calculated by using large basis set on a geometry optimized at a different level of
theory, and is not due to a bad evaluation of the transition state, whose nature is
confirmed by the number of imaginary frequency. The feature common to all the
functionals tested is the high binding energy of WM8 complex, with the only
exception found in VSXC functional which show a strong overstabilization of the
and TS8 complexes with respect to the final product. We can also note that,
in addition to some different values of relative energies for the same structure,
there is a substantial divergence in the evaluation of the barrier height. In fact,
MP2, together with B97-D, BMK, M06-HF, M05-2X, M06-2X, mPW1PW91,
PBE0, -HCTHhyb and TPSSh indicate a barrierless reaction, while for the other
functionals the activation energy exist. Going more in deep and trying to find if
there is a systematical improvement for example by passing from GGA to the
usually most accurate Hybrid-metaGGA, we can observe that a simple
explanation is not possible. The addition of high percentage of Hartree-Fock
exchange for hybrid functionals or the inclusion of long-range/dispersion
correction terms not always brings significant changes towards an univocal result
or trend. Anyway, the level of theory usually advised for the determination of
barrier heights, since they are considered to be the most accurate (such as M06-2X
and BMK) follow the same energy trend of the wave function based method MP2.
As the recent benchmarks for this kind of reactions show that M06-2X
overcome in accuracy both MP2 and BMK,[65]
we decided to further carry on our
study by using this functional.
Page 61
Chapter 3
59
Table 3. Relative energies (Kcal/mol) at various computational levels of the three structures
along the DNBF-DPT reaction’s pathways.
TS8 WM8
B3LYP -8,7 -7,1 -20,3
B97-D -25,1 -25,9 -31,9
B97-1 -12,8 -12,3 -26,7
B97-2 -8,2 -6,9 -21,5
BMK -11,9 -13,2 -35,7
CAM-B3LYP -8,5 -7,1 -26,6
HCTH -9,7 -4,5 -11,7
LC-PBE -7,4 -5,5 -31,2
M05 -13,1 -10,1 -25,1
M06 -20,1 -19,4 -34,4
M06-HF -20,3 -25,2 -49,8
M06-L -23,0 -21,4 -29,7
M05-2X -17,3 -20,1 -39,1
M06-2X -18,3 -19,6 -37,8
MP2 -27,4 -27,8 -37,8
mPW1PW91 -10,0 -10,4 -27,1
mPWPW91 -12,5 -12,3 -22,6
OLYP -2,5 1,6 -7,8
PBE0 -11,9 -12,5 -29,1
-HCTH -10,4 -7,8 -16,4
-HCTHhyb -12,5 -12,6 -26,2
TPSSH -11,6 -11,7 -23,8
VSXC -63,1 -62,9 -56,9
B97X -13,3 -10,4 -32,4
B97X-D -19,1 -18,2 -36,6
X3LYP -10,0 -8,6 -22,3
In Table 4 we reported the relative energies computed in both solvent and
gas phase at M06-2X/6-311+G(d,p)//B3LYP/6-31G(d) all corrected for zero-point
vibrational energy (BSSE corrected energies in parenthesis). Without taking into
account the BSSE correction, the reaction between DNBF and DPT appears to be
barrierless in both solvent and gas phase, while the reaction between DNTP and
DPT show the transition state to be slightly higher in energy respect to the -
complex, resulting in a very low activation energy (about 2 Kcal/mol). If we take
into account the effect of BSSE we observe for both reactions that the energetic
gap between TS and - complex becomes relevant especially in solvent phase,
which can be easily explained by the fact that the orbitals’ overlap on the two
reactant becomes more pronounced for transition state.
Page 62
Chapter 3
60
Indeed, the difference in energy between TS and - complex is in solvent
phase 6.0 and 12.3 Kcal/mol for DNBF+DPT and DNTP+DPT respectively. As
discussed previously, the explanation can arise from a better overlap of the
reactants’ aromatic rings in - complex, lowering its binding energy and raising
the gap with TS9. During the experimental characterization we had no evidence
on the formation of such kind of stacking complexes by NMR spectroscopy. The
only noteworthy behaviour was the changes in colour observed during the
reaction of DNTP+DPT. After the addition of a solution of DNTP (light yellow)
to a solution of DPT (colourless) we observed a rapid change in colour of the
mixture which became intense red, lasting for a few second before turning into
orange. For the reaction between DNBF and DNTP we had not observed such
behaviour; the explanation of this phenomena, which is supported by the present
theoretical investigation, can be ascribed to the formation of a stacking complex
dominated by charge transfer interaction (which usually favour bathochromic
shift) between DNTP and DPT.
To give a more scientific support to our hypothesis we followed the
reactions by using UV-Visible spectroscopy. While for the reaction of
DNBF+DPT we observed a change in the absorption maximum during the
reaction which corresponds to the value of the final product, for the reaction of
DNTP+DPT we observed a bathochromic shift followed by a rapid shifting of the
absorption maximum towards that of the final product. These data are again
coherent with the hypothesis of the formation of a stacking complex dominated by
charge transfer interaction for the reaction of DNTP+DPT.
The low barrier height and the high binding energy of the final WM
complexes, confirm the fast rate of these reactions and the unprecedented stability
of these compounds. Since the next steps of these reactions were not deeply
studied experimentally and are complicated to investigate from a theoretical point
of view because they include basic catalysis favoured by a solid reagent, we will
not tackle the mechanistic study of the second part of the reaction in the present
study.
Page 63
Chapter 3
61
Table 4. Relative energies (Kcal/mol) calculated at M06-2X/6-311+G(d,p)//B3LYP/6-31G(d);
BSSE corrected values in parenthesis.
DNBF+DPT (Gas) DNBF+DPT (Sol) DNTP+DPT (Gas) DNTP+DPT (Sol)
-17.5 (-13.8) -9.8 (-6.1) -21.7 (-17.8) -12.9 (-8.9)
TS -18.2 (-13.9) -14.0 (0.1) -20.1 (-15.4) -14.2 (3.4)
WM -34.4 (-29.6) -40.4 (-21.6) -32.3 (-27.6) -39.6 (-20.7)
3.2.3 Electronic properties
The simplest way to explore the special reactivity of our reagents and
understand the nature of their interactions, is to analyse some important electronic
properties such as the Electrostatic Surface Potential (ESP), the frontier orbitals
and the charge distribution.
Figure 5 shows ESP and HOMO-LUMO distribution for the 3 reagents
discussed in this study. Both the highest occupied molecular orbital (HOMO) and
the lowest-lying unoccupied molecular orbital (LUMO) are well distributed over
the molecules, indicating that the HOMO-LUMO orbitals are mostly the -type
orbitals and are perpendicularly oriented to each other. The only exception is the
LUMO of DPT which is distributed all over the thiazole aromatic ring, through a
bonding, nodeless pattern. The HOMO-LUMO analysis allow us to understand
that the formation of the final products happens by the interaction of the HOMO
of DPT and the LUMO of both electrophilic partners, but the regioselectivity is
well understandable by the ESP analysis. In fact, the most electron-poor region in
DNBF and DNTP is localized on the carbon atoms which are effectively involved
in the new bonds formation, while in DPT the most electron-rich region is
localized in the exocyclic nitrogen atom and the carbon atom that effectively
reacts. The regioselectivity toward the latter can therefore be explained also by a
steric effect which could become important in the case of attack to the exocyclic
nitrogen by the two bulky electrophiles DNBF and DNTP.
Page 64
Chapter 3
62
Figure 5. Electrostatic surface potential (ESP) and frontier orbitals of reagents DPT, DNBF
and DNTP. ESP is mapped on the electron-density surface where red corresponds to
electron-rich and blue corresponds to electron-poor regions.
In Figure 6 we reported the frontier orbital of -, TS and WM for both
reactions. As expected, in the -complexes the HOMO is mainly localized on
DPT moiety while LUMO in DNBF and DNTP moieties. In TSs, the orbitals are
localized as in -complexes, but with a more balanced distribution across the
other moieties. For the final WM complexes, since HOMO and LUMO are
mainly localized on the electrophilic DNBF and DNTP moieties, we also
represent the HOMO-1 and LUMO+1, which are mainly spread over the DPT
moiety.
Page 65
Chapter 3
63
Figure 6. Frontier orbitals of all intermediates along the reaction’s pathway for DNBF+DPT
and DNTP+DPT.
The HOMO-LUMO gaps reported in table 5 show its increase by passing
from the - complexes to the WMs, for which the extremely high values can
explain their exceptional stability.
Table 5. HOMO-LUMO gap (eV) of titled compounds in gas phase (solvent in parenthesis).
DNBF+DPT DNTP+DPT
2.95 (2.92) 3.56 (3.50)
TS 4.02 (3.96) 4.63 (4.50)
WM 5.10 (5.22) 5.08 (5.21)
Page 66
Chapter 3
64
Since there are a lot of controversy about the validity of the methods used
for population analysis, we decided to test all the ones included in Gaussian 09
(Rev. A.02) software package, except the Mulliken population which is known to
produce unrealistic results. As reported in Table 6, all the methods tested show
only a very little discrepancy on the results obtained, indicating a clear and
general trend. The analysis of the charge distribution on the different moiety
reveal interesting indication about the charge delocalization. In the - complexes
the charge on DPT moiety is about 0.15, a value which is not so high, but that
cannot exclude a charge transfer interaction. In both TS the charge on DPT
moiety increase until to reach the unitary positive charge in WMs, which creates
an electrostatic interaction that probably also contribute to the enhancement of the
stability of these complexes.
Table 6. Charge distribution on the DPT moiety of titled compounds obtained by using
different methods (the charges on DNBF and DNTP moieties possess the same values with
opposite sign).
-8 TS8 WM8 -9 TS9 WM9
CHELP 0.16 0.80 0.84 0.15 0.56 0.92
CHELPG 0.16 0.61 0.88 0.15 0.54 1.04
HIRSHFELD 0.11 0.51 0.82 0.09 0.44 0.84
MK 0.15 0.62 0.99 0.15 0.57 1.15
NBO 0.15 0.58 0.96 0.15 0.55 0.96
Besides the charge analysis, also the dipole moment calculated for all the
structures (Table 7) show an increasing zwitterionic character by passing from -
complexes to WM’s complexes, confirming the previous underlined trend.
Table 7. Dipole moment in gas phase in Debye (solution in parenthesis).
DNBF+DPT DNTP+DPT
4.89 (8.42) 3.49 (4.35)
TS 9.68 (12.90) 7.48 (10.14)
WM 16.68 (20.39) 17.82 (21.60)
Page 67
Chapter 3
65
Conclusion
In conclusion, the reaction between 2,4-dipyrrolidin-1-yl-1,3-thiazole and
4,6-dinitrobenzofuroxan or 4,6-dinitro-tetrazolopyridine quantitatively produces a
covalent complex which is contemporaneously a Wheland and a Meisenheimer
intermediate of the two main reactions on aromatic substrates: the nucleophilic
and electrophilic substitution reaction. The reaction occurs with high
diastereoselectivity and this is explained by considering the particular approach of
the two partners. The particular stability at room temperature of these complexes
permitted to obtain single crystals suitable for X-Ray diffraction analysis which
confirmed their structure and revealed some interesting details useful to explain
the behaviour of WM complexes. Furthermore, exchange of the electrophilic
partner from WM8 to WM9 has been also observed thus to confirming also in
present case our previous conclusion on the reversibility of the formation of the
WM complexes. Finally, the complex obtained by using DNBF as electrophilic
partner easily eliminates water with re-aromatization of both rings affording an
unusual substitution product which is a furazane derivative.
The computational study was carried out to deeper investigate the
reactivity of the supernucleophile DPT and superelectrophiles DNBF and DNTP.
The analysis of the reaction’s pathways show the presence of -
complexes and transition states along the reaction coordinates. Both reactions
showed a low activation energy and an high binding energy for the WM
complexes, which justify their great stability. The electrostatic surface potentials
and frontier orbitals analysis allow us to explain the high reactivity and
regioselectivity of the reagents. At last, the charge distribution and the dipole
moment confirmed the large zwitterionic character of the WM complexes.
Furthermore our benchmark of the most used exchange correlation
functionals showed that there is no negligible discrepancy in the results obtained,
warning about exploring energetics by using common functionals, but confirming
a good choice of B3LYP and M06-2X functionals for geometry and barrier
height, respectively.
Page 68
Chapter 3
66
Part of this chapter is reproduced with permission from “European Journal of
Organic Chemistry” by John Wiley and Sons. Further experimental data, included
characterization data of the related products here described, can be found in the
paper “L. Forlani, C. Boga, A. Mazzanti, N. Zanna, Eur. J. Org. Chem, 2012,
1123-1129” fully available at http://onlinelibrary.wiley.com/.
References
[1] J. Meisenheimer, Just. Lieb. Ann. Chem. 1902, 323, 205–246.
[2] F. Terrier, Nucleophilic Aromatic Displacement (Ed. H. Feuer), Wiley-VCH, New York,
1991.
[3] G. W. Wheland, J. Am. Chem. Soc. 1942, 64, 900–908.
[4] R. Taylor, Electrophilic Aromatic Substitution John Wiley & Sons, New York, 1990.
[5] S. M. Hubig, J. K. Kochi, J. Am. Chem. Soc. 2000, 122, 8279–8288 and ref. therein.
[6] K. J. Szabò, A.-B. Hörnfeldt, S. Gronowitz, J. Am. Chem. Soc. 1992, 114, 6827–6834.
[7] M. Aschi, M. Attinà, F. Cacace, J. Am. Chem. Soc. 1995 117, 12832–12839.
[8] G. A. Olah, R. H. Schlosberg, R. D. Porter, Y. K. Mo, D. P. Kelly, G. D. Mateescu, J. Am.
Chem. Soc. 1972, 94, 2034–2043.
[9] R. Rathore, J. Hecht, J. K. Kochi, J. Am. Chem. Soc. 1998, 120, 13278–13279.
[10] C. Boga, E. Del Vecchio, L. Forlani, Eur. J. Org. Chem. 2004, 1567–1671.
[11] C. Boga, E. Del Vecchio, L. Forlani, A. Mazzanti, P. E. Todesco, Angew. Chem. Int. Ed.
2005, 44, 3285–3289.
[12] P. Jin, F. Li, K. Riley, D. Lenoir, P. v. R. Schleyer, Z. Chen, J. Org. Chem. 2010, 75, 3761–
3765
[13] a) F. Effenberger, P. Fischer, W. W. Schoeller, W.-D. Stohrer, Tetrahedron 1978, 34, 2409–
2417; b) F. Effenberger, Acc. Chem. Res. 1989, 22, 27–35.
[14] E. Buncel, F. Terrier, Org. Biomol. Chem. 2010, 8, 2285–2308.
[15] a) H. Mayr, M. Patz, Angew. Chem., Int. Ed. Engl. 1994, 33, 938–957; b) Mayr, B. Kempf,
A. R. Ofial, Acc. Chem. Res. 2003, 36, 66–77.
[16] a) T. Boubaker, R. Goumont, E. Jan, F. Terrier, Org. Biomol. Chem. 2003, 1, 2764–2770; b)
F. Terrier, S. Lakhdar, T. Boubaker, R. Goumont, J. Org. Chem. 2005, 70, 6242–6253; c) S.
Lakhdar, R. Goumont, F. Terrier, T. Boubaker, J. M. Dust, E. Buncel, Org. Biomol. Chem.
2007, 5, 1744–1751.
[17] C. Boga, E. Del Vecchio, L. Forlani, A. Mazzanti, C. Menchen Lario, P. E. Todesco, S.
Tozzi, J. Org. Chem. 2009, 74, 5568–5575.
[18] J. V. Metzger, Thiazole and its derivatives J. Wiley & Sons, New York, 1979).
Page 69
Chapter 3
67
[19] a) L. Forlani, P. E. Todesco. J. Chem. Res. (S), 1992, 44–55; b) L. Forlani, A. Ferrara, A.
Lugli, P. E. Todesco, J. Chem. Soc. Perkin Trans.2, 1994, 1703–1707.
[20] L. Forlani, A. L. Tocke, E. Del Vecchio, S. Lakhdar, R. Goumont, F. Terrier, J. Org. Chem.
2006, 71, 5527–5537.
[21] C. Boga, E. Del Vecchio, L. Forlani, R. Goumont, F. Terrier, S. Tozzi, Chemistry. A Eur. J.
2007, 13, 9600–9607.
[22] L. Forlani, L. Synthesis 1980, 487–489.
[23] R. Gompper, P. Krich, J. Schelble, Tetrahedron Lett. 1983, 24, 3563–3566.
[24] R. Flaig, H. Hartmann, Heterocycles, 1997, 45, 875–888.
[25] Gaussian 09, Revision B.01, Frisch, M. J.; Trucks, G. W.; Schlegel, H. B.; Scuseria, G. E.;
Robb, M. A.; Cheeseman, J. R.; Scalmani, G.; Barone, V.; Mennucci, B.; Petersson, G. A.;
Nakatsuji, H.; Caricato, M.; Li, X.; Hratchian, H. P.; Izmaylov, A. F.; Bloino, J.; Zheng, G.;
Sonnenberg, J. L.; Hada, M.; Ehara, M.; Toyota, K.; Fukuda, R.; Hasegawa, J.; Ishida, M.;
Nakajima, T.; Honda, Y.; Kitao, O.; Nakai, H.; Vreven, T.; Montgomery, Jr., J. A.; Peralta, J.
E.; Ogliaro, F.; Bearpark, M.; Heyd, J. J.; Brothers, E.; Kudin, K. N.; Staroverov, V. N.;
Kobayashi, R.; Normand, J.; Raghavachari, K.; Rendell, A.; Burant, J. C.; Iyengar, S. S.;
Tomasi, J.; Cossi, M.; Rega, N.; Millam, J. M.; Klene, M.; Knox, J. E.; Cross, J. B.; Bakken,
V.; Adamo, C.; Jaramillo, J.; Gomperts, R.; Stratmann, R. E.; Yazyev, O.; Austin, A. J.;
Cammi, R.; Pomelli, C.; Ochterski, J. W.; Martin, R. L.; Morokuma, K.; Zakrzewski, V. G.;
Voth, G. A.; Salvador, P.; Dannenberg, J. J.; Dapprich, S.; Daniels, A. D.; Farkas, Ö.;
Foresman, J. B.; Ortiz, J. V.; Cioslowski, J.; Fox, D. J. Gaussian, Inc., Wallingford CT, 2009.
[26] L. Forlani, C. Boga, A. Mazzanti, N. Zanna, Eur. J. Org. Chem, 2012, 1123-1129.
[27] Alecu, I. M.; Zheng, J.; Zhao, Y.; Truhlar, D. G. J. Chem. Theory Comput. 2010, 2872–2887.
[28] Boys, S. F.; Bernardi, F. Mol. Phys. 1970, 19, 533.
[29] Marenich, A. V.; Cramer, C. J.; Truhlar D. G. J. Phys. Chem. B, 2009, 113, 6378–6396.
[30] Chirlian, L. E.; Francl, M. M. J. Comp. Chem., 1987, 8, 894-905.
[31] C. M. Breneman, C. M.; Wiberg, K. B. J. Comp. Chem., 1990, 11, 361-373.
[32] Hirshfeld, F. L. Theor. Chem. Acc., 1977, 44, 129-138.
[33] Ritchie, J. P. J. Am. Chem. Soc., 1985, 107, 1829-1837.
[34] Ritchie, J. P.; Bachrach, S. M. J. Comp. Chem., 1987, 8, 499-509.
[35] Singh, U. C.; Kollman, P. A. J. Comp. Chem., 1984, 5, 129-145.
[36] Besler, B. H.; Merz Jr. K. M.; Kollman, P. A. J. Comp. Chem., 1990, 11, 431-439.
[37] NBO Version 3.1, E. D. Glendening, A. E. Reed, J. E. Carpenter, and F. Weinhold.
[38] Lee, C.; Yang, W.; Parr, R. G. Phys. ReV. B 1988, 37, 785.
[39] Becke, A. D. Phys. ReV. A 1988, 38, 3098.
[40] Becke, A. D. J. Chem. Phys. 1993, 98, 5648.
Page 70
Chapter 3
68
[41] Stephens, P. J.; Devlin, F. J.; Chabalowski, C. F.; Frisch,M. J. J. Phys. Chem. 1994, 98,
11623.
[42] Grimme, S. J. Comput. Chem. 2006, 27, 1787.
[43] Hamprecht, F. A.; Cohen, A. J.; Tozer, D. J.; Handy, N. C. J. Chem. Phys. 1998, 109, 6264.
[44] Wilson, P. J.; Bradley, T. J.; Tozer, D. J. J. Chem. Phys. 2001, 115, 9233.
[45] Boese, A. D.; Martin, J. M. L. J. Chem. Phys. 2004, 121, 3405.
[46] Yanai, T.; Tew, D. P.; Handy, N. C. Chem. Phys. Lett. 2004, 393, 51.
[47] Vydrov, O. A.; Heyd., J.; Krukav, A. V.; Scuseria, G. E. J. Chem. Phys. 2006, 125, 074106.
[48]Vydrov, O. A.; Scuseria, G. E. J. Chem. Phys. 2006, 125, 234109
[49] Zhao, Y.; Schultz, N. E.; Truhlar, D. G. J. Chem. Phys. 2005, 123, 161103.
[50] Zhao, Y.; Schultz, N.; Truhlar, D. G. J. Chem. Theory Comput. 2006, 2, 364.
[51] Zhao, Y.; Truhlar, D. G. Theor. Chem. Acc. 2008, 120, 215.
[52] Zhao, Y.; Truhlar, D. G. J. Phys. Chem. A 2006, 110, 13126.
[53] Zhao, Y.; Truhlar, D. G. J. Chem. Phys. 2006, 125, 194101.
[54] Møller, C.; Plesset, M. S. Phys. ReV. 1934, 46, 618.
[55] Adamo, C.; Barone, V. J. Chem. Phys. 1998, 108, 664.
[56] Handy, N. C.; Tozer, D. J. Mol. Phys. 1998, 94, 707.
[57] Adamo, C.; Barone, V. J. Chem. Phys. 1999, 110, 6158.
[58] Boese, A. D.; Handy, N. C. J. Chem. Phys. 2002, 116, 9559.
[59] Staroverov, V. N.; Scuseria, G. E.; Tao, J.; Perdew, J. P. J. Chem. Phys. 2003, 119, 12129.
[60] Van Voorhis, T.; Scuseria, G. E. J. Chem. Phys. 1998, 109, 400.
[61] Chai, J.-D.; Head-Gordon, M. J. Chem. Phys. 2008, 128, 084106.
[62] Chai, J.-D.; Head-Gordon, M. Phys. Chem. Chem. Phys. 2008, 10, 6615.
[63] Xu, X.; Goddard, W. A. Proc. Natl. Acad. Sci. U.S.A. 2004, 101, 2673.
[64] Foster, R. Organic Charge Transfer Complexes; Academic Press: New York, 1969.
[65] Zheng, J.; Zhao, Y.; Truhlar, D. G. J. Chem. Theory Comput. 2009, 5, 808–821.
Page 71
Chapter 4
69
Chapter 4
Solid state fluorescence in protonated azobenzenes
In previous work of my research group interesting mechanistic information
have been obtained by using diazonium salts derivatives as electrophilic
substrates.
For example the reaction of tris(dialkylamino)benzenes with diazonium
salts allow to isolate Wheland intermediates (Scheme 1) and to study separately
the two steps of the reaction thus collecting important information such as the
reversibility of the whole reaction and the departure of the proton as the rate
determining step. [1,2]
Scheme 1. Reaction between tris(dialkylamino)benzenes and p-substituted
benzenediazonium salts.
After that, we decided to continue this mechanistic study by changing the
nucleophilic partner to compare the reactivity with tris(dialkylamino)benzenes.
The most interesting candidate was found to be 1,3,5-trimethoxybenzene because
Page 72
Chapter 4
70
of its symmetry and the electron-donating effect of methoxy substituents which
are comparable with tris(dialkylamino)benzenes.
4.1 Coupling reaction of 1,3,5-trimethoxybenzene and diazonium salt
derivatives
The reactions showed in Scheme 2 were carried out in acetonitrile at room
temperature and gave, in high yields, the monosubstituted coupling products in
saline form (tetrafluoborate salts), which are easily recovered by simple filtration
since they are poorly soluble in the reaction medium. All these products were
fully characterized by standard 1H-NMR,
13C-NMR and mass analyses.
Scheme 2. Reaction between 1,3,5-trimethoxybenzene and benzenediazonium salt
derivatives.
In this case we did not detect the formation of Wheland intermediates, but
we were surprised because of the formation of the inner salt on compounds 3. In
fact, it is known that the nitrogen atoms of the azo moiety are poorly basic. A
possible explanation could be the formation of an intramolecular hydrogen bond
Page 73
Chapter 4
71
between the proton and the oxygen atom of the methoxy moiety. To confirm this
hypothesis we crystallized the compound 3a and performed X-ray diffraction
analysis on it.
The obtained structural data confirmed our hypothesis, showing that also
intermolecular hydrogen bonds are present (Figure 1).
Figure 1. X-ray diffraction structure of compound 3a showing inter/intramolecular
hydrogen bonding.
The crystallographic analysis provided also interesting information on the
nature of the packing in the solid state. As shown in Figure 2 the molecules of 3a
are parallel-aligned (top) and a strong overlap between the electron-rich
trimethoxy substituted rings and the electron-poor nitro substituted rings (bottom)
is present.
This closely packed structure could be hence due to the non-covalent
interactions, which include intra/intermolecular hydrogen bonding and
stacking interaction.
During this work we observed an interesting property: the solid state
fluorescence of compounds 3 (Figure 3). We decide to better investigate this
property that is unusual, especially for azobenzene derivatives.
Page 74
Chapter 4
72
Figure 2. Crystal packing of compound 3b.
Figure 3. Solid state fluorescence of compounds 3a-c under 365nm UV lamp.
3b
3c
3b
3b
3a
3b
3b
Page 75
Chapter 4
73
4.2 Fluorescence of azobenzene derivatives
Since the discovery of azobenzene derivatives in the mid-1800s,[3,4]
they
became an important class of synthetic coloring agents in the dye industry.
Azobenzene derivatives were also used as acid-base indicators [5,6]
, metal
ion indicators [6,7]
and, in the last decade, their photochromic properties due to the
reversible trans-cis conformational change upon photoexcitation (Scheme 3) have
been utilized as light triggered switch in a variety of polymers,[8-10]
surface-
modified materials,[12-14]
protein probes[15-18]
and molecular machines[19-21]
. The
cis-trans photoisomerization process (Scheme 3) is so efficient in photoexcited
states that inhibits their fluorescence emission that is slower and not competitive.
In fact, azobenzenes are known to be not fluorescent since the fluorescence
quantum yield in solution at room temperature for the unsubstituted azobenzene is
about 10-5
.[22]
Scheme 3. Trans-cis photoisomerization in azobenzene derivatives.
However there are some exceptions, such as azobenzenes in rigid matrix at
low temperature [23]
, self-assembled aggregates [24-27]
, ortho-metalated
azobenzenes [28-31]
, hydroxy-substituted [32, 33]
and protonated azobenzenes [34]
, for
which the quantum yield is still low (less than 10-3
).
Page 76
Chapter 4
74
Recently Yoshino et al. reported the synthesis of the most intense
fluorescent azobenzene derivatives by utilizing the intramolecular B-N interaction
(Figure 4).[35,37]
Figure 4. Fluorescent azo-boryl derivatives.
Rau reported a detailed analysis of the spectroscopic properties of
azobenzenes,[38]
especially their fluorescent behaviors. It is well known that the
fluorescence of azo-compounds is higher if the cis-trans photoisomerization is
blocked and if there is an inversion of the and n
transitions which can
occur by coordination of one nitrogen atom of the azo-moiety for example by
simple protonation.
We start our investigation by recording the UV-visible spectra of
compounds 3a-c in acetonitrile. During the measurement we discovered that, if
the solvent is not perfectly anhydrous, there is a shift of the absorption maximum
upon dilution (Figure 5).
Page 77
Chapter 4
75
Figure 5. UV-vis spectrum of 3a in acetonitrile after dilution.
Hence we recorded the spectrum of 2 mL of a 4 x 10⁻⁵
M solution of 3a
after addition of subsequent aliquots of 10L of water. The spectrum reported in
Figure 6 show that water addition shifts the absorption maximum.
Figure 5. UV-vis spectrum of 3a in acetonitrile after water addition.
Page 78
Chapter 4
76
The observed peak at 380 nm was found to belong to compound 4a (the
non-saline form of compound 3a, Scheme 4 and Figure 6), which has been
separated and fully characterized by NMR and MS analyses. The same behavior
occurs also with compounds 3b and 3c. This indicates that water acts as a
scavenger for the proton, probably interacting through H-bond.
Scheme 4. Formation of 4 by water addition to compounds 3.
Figure 6. UV-vis spectrum of 3a and the related non-saline form 4a.
Page 79
Chapter 4
77
It is interesting to note that compounds 4 do not show fluorescence
emission in both solution and solid state. This behavior is in accordance with the
literature data.
Since this work is still in progress (not all the measures of fluorescence
quantum yield were done) we reported the preliminary results, hypothesizing on
the fluorescence behavior of compounds 3 and 4.
As aforementioned, among all compounds synthesized, only 3 in solid
state show fluorescence emission under 254nm and 365nm UV lamp.
The data reported in Table 1 show the solid state quantum yield in solid
state for compounds 3a-c.
Table 1. Solid state fluorescence quantum yield of compounds 3a-c (excitation 440nm).
3a 3b 3c
Solid state quantum yield 0,3% 0,9% 0,2%
The solid state quantum yields of compounds 3a-c are not high but, from a
visual point of view, the fluorescence emission appears to be higher than in
solution and also with respect to compounds 4a-c. Pending for the complete
quantum yield characterization for all compounds, we investigate on the reason of
this behavior by performing experimental and theoretical structural analysis.
4.3 Experimental and theoretical structures of azobenzene derivatives
For comparison, we decided to perform X-ray crystallographic analyses on
the protonated and unprotonated species with the same substituents. We were able
to obtain suitable crystals for X-ray diffraction analyses of compounds 3b and 4b.
The results of X-ray diffraction analysis of 3b depicted in Figure 7 shown
that, as in the case of compound 3a, the molecules are protonated at the nitrogen
atom of the azo-moiety and the two aromatic rings are coplanar.
Page 80
Chapter 4
78
Figure 7. X-ray diffraction structure of compound 3b (left: side view; right: molecular
structure).
The packing in the crystal show an head-to-tail arrangement but, in the top
view (Figure 8), it can be noted that there is no superposition of the bromine-
substituted and the mehoxy-substituted rings as in the case of compound 3a.
The 3-fold higher quantum yield of 3b respect to 3a (see Table 1) could be
due to charge transfer interaction that produce a fluorescence quenching in 3a.
The densely packed crystalline molecular structure of 3b can imply that
trans-cis photoisomerization process through the rotation or inversion around the
N=N double bond of azobenzene could be effectively blocked.
Figure 8. Packing in 3b crystal.
Page 81
Chapter 4
79
The crystal structure of 4b depicted in Figure 9 show that the two aromatic
ring are not coplanar, being 38° the C6-C1-N1-N2 dihedral angle.
Figure 9. X-ray diffraction structure of compound 4b.
The simplest explanation could be the repulsion between the lone pair of
electrons among nitrogen and oxygen atoms.
This non-coplanar structure explains the less restricted packing shown in
Figure 10. This could imply an higher degree of freedom in the vibration of the
molecules inside the crystal which could produce non-radiative decay.
Figure 10. Packing in 4b crystal.
Page 82
Chapter 4
80
The theoretical structures of 3b and 4b (optimized at MP2/6-31G(d)[39]
level of theory and including solvation effect with PCM formalism [40]
in
acetonitrile with Gaussian 09 software package[41]
are in agreement with
experimental structures.
To investigate on the rotational energy which could become important in
the non-radiative decay, we perform a scan analysis on the energy by varying the
dihedral angle at the same level of theory used for optimization.
The dihedral angle scan of 3b (Figure 11) show an energy maximum when
the dihedral reach an angle of about 90°. The rotational activation energy for this
rotation is about 20 Kcal/mol.
The dihedral angle scan of 4b (Figure 12) show instead two energy
maxima, one at about 95 degrees and the other one at about 180°. The rotational
activation energy is about 2 Kcal/mol for the barrier at 95°. These results indicate
that in solution the unprotonated azobenzenes are free to rotate, while the 20
Kcal/mol of activation energy could be enough to hinder the rotation in 3b, hence
the non-radiative decay.
Figure 11. 3b energy vs C6-C7-N2-N1 dihedral angle.
Page 83
Chapter 4
81
Figure 12. 4b energy vs C6-C1-N1-N2 dihedral angle.
Since this work is still in progress it is not possible to clearly elucidate the
mechanisms involved in the fluorescence of protonated azo derivatives 3.
However, on the basis of these preliminary results, we could however
formulate some hypotheses on the fluorescence mechanism. As well described in
a recent review by Hong et al,[42]
the solid state fluorescence which is usually
defined as Aggregation Induced Emission (AIE), can be explained principally by
different mechanistic pathways, such as conformational planarization, J-
aggregates formation and Restriction of Intermolecular Rotation.
In our case, we observed a conformational planarization for protonated
compounds 3, in agreement with the fluorescence emission observed for 3a-c and
not observed for the unprotonated 4a-c.
The J-aggregates are usually fluorescent and their formation is characteristic
of molecules which possess donor (D) and acceptor (A) functional groups and
hence experience D–A or push–pull interactions. The J-aggregates are
characterized by antiparallel displacement of the donor and acceptor groups. The
X-ray structural analysis of compounds 3a-c revealed this kind of behavior which
could be a reason for their fluorescence.
Page 84
Chapter 4
82
Finally, the X-ray diffraction analysis in 3b and 4b crystals showed a more
dense packing state for the first, while the theoretical analyses showed an higher
activation energy for the rotation in 3b respect to 4b. This could explain an higher
fluorescence and a more difficult non-radiative decay of the excited states in
compounds 3 because of the restriction of intramolecular rotations, especially in
the solid state.
Conclusion
This work lead us to understand the importance of hydrogen bonding
interactions which are the main responsible for the isolation of the saline
derivatives 3 and their structural properties, also due to inter/intermolecular
hydrogen bonds.
All the possible fluorescence mechanistic pathways for our compounds are
here only hypothesized, and have to be experimentally confirmed since this work
is still in progress. We hope to be able to rationalize these behaviors to enable an
easy design of new azo-based fluorescent compounds.
References
[1] C. Boga, E. Del Vecchio, L. Forlani, Eur. J. Org. Chem 2004, 7, 1567–1571.
[2] C. Boga, E. Del Vecchio, L. Forlani, S. Tozzi, J. Org. Chem., 2007, 72 (23), 8741–8747.
[3] A. Noble, Justus Liebigs Ann. Chem., 1856, 98, 253–256.
[4] J. Griffiths, Chem. Soc. Rev., 1972, 1, 481–493
[5] H. Wenker, Ind. Eng. Chem., Anal. Ed., 1935, 7, 40–41.
[6] D. Escudero, S. Trupp, B. Bussemer, G. J. Mohr and L. Gonzalez, J. Chem. Theory Comput.,
2011, 7, 1062–1072.
[7] Y.-W. Shi, X.-Q. Liu, P. Shi and X.-Y. Zhang, Arch. Biochem. Biophys., 2010, 494, 1–6.
[8] M. E. Long and P. J. Trotter, Appl. Spectrosc., 1981, 35, 289–292.
[9] C.-U. Bang, A. Shishido and T. Ikeda, Macromol. Rapid Commun., 2007, 28, 1040–1044.
[10] F. Puntoriero, P. Ceroni, V. Balzani, G. Bergamini and F. Voegtle, J. Am. Chem. Soc., 2007,
129, 10714–10719.
Page 85
Chapter 4
83
[11] R. M. Parker, J. C. Gates, H. L. Rogers, P. G. R. Smith and M. C. Grossel, J. Mater. Chem.,
2010, 20, 9118–9125.
[12] V. Ferri, M. Elbing, G. Pace, M. D. Dickey, M. Zharnikov, P. Samori, M. Mayor and M. A.
Rampi, Angew. Chem. Int. Ed., 2008, 47, 3407–3409.
[13] Y. Wen, W. Yi, L. Meng, M. Feng, G. Jiang, W. Yuan, Y. Zhang, H. Gao, L. Jiang and Y.
Song, J. Phys. Chem. B, 2005, 109,14465–14468.
[14] K. Kakiage, M. Yamamura, E. Ido, T. Kyomen, M. Unno and M. Hanaya, Appl. Organomet.
Chem., 2010, 25, 98–104.
[15] M.R. Banghart, A. Mourot, D. L. Fortin, J. Z.Yao, R.H. Kramer and D. Trauner, Angew.
Chem. Int. Ed., 2009, 48, 9097–9101.
[16] Y. Kim, J. A. Phillips, H. Liu, H. Kang and W. Tan, Proc. Natl. Acad. Sci. U. S. A., 2009,
106, 6489–6494.
[17] J. Wang, H.-B. Liu and C.-S. Ha, Tetrahedron, 2009, 65, 9686–9689.
[18] M. Banghart, K. Borges, E. Isacoff, D. Trauner and R.H. Kramer, Nat. Neurosci., 2004, 7,
1381–1386
[19] Y. Norikane and N. Tamaoki, Org. Lett., 2004, 6, 2595–2598.
[20] H. Murakami, A. Kawabuchi, K. Kotoo, M. Kunitake and N. Nakashima, J. Am. Chem. Soc.,
1997, 119, 7605–7606.
[21] T. Muraoka, K. Kinbara and T. Aida, Nature, 2006, 440, 512–515.
[22] T. Fujino, S. Yu. Arzhantsev, T. Tahara, J. Phys. Chem. A, 2001, 105, 8123 – 8129.
[23] M. Neprasˇ, S. Lunˇa´k, Jr., R. Hrdina and J. Fabian, Chem. Phys. Lett., 1989, 159, 366 – 370.
[24] M. Shimomura and T. Kunitake, J. Am. Chem. Soc., 1987, 109, 5175 – 5183.
[25] M. Han and M. Hara, J. Am. Chem. Soc., 2005, 127, 10951 – 10955.
[26] M. R. Han and M. Hara, New J. Chem., 2006, 30, 223 – 227.
[27] M. Han, D. Ishikawa, E. Muto, Journal of Luminescence, 2009, 129, 1163–1168.
[28] Y. Wakatsuki, H. Yamazaki, P. A. Grutsch, M. Santhanam and C. Kutal, J. Am. Chem. Soc.,
1985, 107, 8153 – 8159.
[29] M.Ghedini, D. Pucci, G. Calogero and F. Barigelletti, Chem. Phys. Lett., 1997, 267, 341 –
344.
[30] M. Ghedini, D. Pucci, A. Crispini, I. Aiello, F. Barigelletti, A. Gessi and O. Francescangeli,
Appl. Organomet. Chem., 1999, 13, 565 – 581.
[31] I. Aiello, M. Ghedini and M. La Deda, J. Lumin., 2002, 96, 249 – 259.
[32] G. Gabor, Y. Frei, D. Gegiou, M. Kaganowitch and E. Fischer, Isr. J. Chem., 1967, 5, 193 –
212.
[33] H. Rau, Ber. Bunsenges. Phys. Chem., 1968, 72, 637 – 643.
[34] H. Rau, Ber. Bunsenges. Phys. Chem., 1967, 71, 48 – 53.
Page 86
Chapter 4
84
[35] J. Yoshino, N. Kano, T. Kawashima, Chemical communications (Cambridge, England) 2007,
559–61.
[36] J . Yoshino, A. Furuta, T. Kambe, H. Itoi, N. Kano, T. Kawashima, Y. Ito, M. Asashima,
Chemistry (Weinheim an der Bergstrasse, Germany) 2010, 16, 5026–35.
[37] N. Kano, A. Furuta, T. Kambe, J. Yoshino, Y. Shibata, T. Kawashima, N. Mizorogi, S.
Nagase, European Journal of Inorganic Chemistry, 2012, 1584–1587.]
[38] H. Rau, Angew. Chem. Int. Ed. 1973, 12, 224-235.
[39] C. Møller, M.S. Plesset, Phys. ReV. 1934, 46, 618.
[40] J. Tomasi, B. Mennucci, and R. Cammi, Chem. Rev., 105 (2005) 2999-3093.
[41] Gaussian 09, Revision B.01, Frisch, M. J.; Trucks, G. W.; Schlegel, H. B.; Scuseria, G. E.;
Robb, M. A.; Cheeseman, J. R.; Scalmani, G.; Barone, V.; Mennucci, B.; Petersson, G. A.;
Nakatsuji, H.; Caricato, M.; Li, X.; Hratchian, H. P.; Izmaylov, A. F.; Bloino, J.; Zheng, G.;
Sonnenberg, J. L.; Hada, M.; Ehara, M.; Toyota, K.; Fukuda, R.; Hasegawa, J.; Ishida, M.;
Nakajima, T.; Honda, Y.; Kitao, O.; Nakai, H.; Vreven, T.; Montgomery, Jr., J. A.; Peralta, J. E.;
Ogliaro, F.; Bearpark, M.; Heyd, J. J.; Brothers, E.; Kudin, K. N.; Staroverov, V. N.; Kobayashi,
R.; Normand, J.; Raghavachari, K.; Rendell, A.; Burant, J. C.; Iyengar, S. S.; Tomasi, J.; Cossi,
M.; Rega, N.; Millam, J. M.; Klene, M.; Knox, J. E.; Cross, J. B.; Bakken, V.; Adamo, C.;
Jaramillo, J.; Gomperts, R.; Stratmann, R. E.; Yazyev, O.; Austin, A. J.; Cammi, R.; Pomelli, C.;
Ochterski, J. W.; Martin, R. L.; Morokuma, K.; Zakrzewski, V. G.; Voth, G. A.; Salvador, P.;
Dannenberg, J. J.; Dapprich, S.; Daniels, A. D.; Farkas, Ö.; Foresman, J. B.; Ortiz, J. V.;
Cioslowski, J.; Fox, D. J. Gaussian, Inc., Wallingford CT, 2009.
[42] Y. Hong, W. Y. Lam, B. Zhong, Chem. Comm., 2009, 4332–4353.
Page 87
Chapter 5
85
Chapter 5
Multiple applications for a new class of azobenzene
derivatives
The chemical properties of 1,3-thiazole derivatives are of great interest
because of the unusual behavior of these pentatomic heterocycles (Figure 1).
The presence of a sulphur atom in pentatomic ring lead to an electron-rich
system (similar to thiophene). On the contrary, the nitrogen atom acts as an
electron-withdrawing group. In the case of thiazole, the presence of both sulphur
and nitrogen atom lead to a system for which the net character of electrophile or
nucleophile is not well defined.[1]
By adding one amino-group in the position 2, the system becomes strongly
nucleophilic (Figure 1).
S1
2
N3
4
5
S1
2
N3
4
5
NH2
Figure 1. Structures of 1,3-thiazole and 2-amino-1,3-thiazole (left and right
respectively).
2-amino-1,3-thiazole derivatives are important building blocks for many
drugs, for example for treating hyperthyroidism and for their antibacterial activity.
The endocyclic nitrogen is a basic centre and the addition of an amino group
in the 2 position enhances the basicity of the molecule. [1]
An interesting feature comes from the possibility of 2-aminothiazole to react
with two different tautomeric forms (Figure 2).
Page 88
Chapter 5
86
Figure 2. Tautomeric forms in 2-aminothiazole derivatives.
The tautomeric form A is the most stable, while form B prevails when an
electron-withdrawing group is bonded to the exocyclic nitrogen.[2,3]
The 2-amino-1,3-thiazole derivatives show another interesting feature: they
can act as tridentate nucleophiles as shown in Figure 3.
Figure 3. Nucleophilc centers in 2-aminothiazole derivatives.
The regioselectivity of the attack depends on the electrophile. For example
in the reaction with picryl chloride the attack occurs in the 5 position,[4]
while the
reaction with 2,4-dinitro-fluorobenzene lead to the formation of adducts on both
the exo and endocyclic nitrogen[5]
(Scheme 1).
S
N
NHR
S
N
NR
H
A B
Page 89
Chapter 5
87
Scheme 1. Reactivity of different 2-aminothiazole derivatives.
Some of these peculiar behaviors of 2-aminothiazole derivatives were
studied from a long time in my research group. Recently it has been possible to
isolate a Wheland-Meisenheimer complex in the reaction between 2-
aminothiazole and 2,4-dinitrobenzofuroxane (DNBF) by using NMR
spectroscopy (Scheme 2).[6]
Scheme 2. Formation of the WM complex in the reaction between 2-aminothiazole and
DNBF.
Page 90
Chapter 5
88
Since previous studies with tris(dialkylamino)benzenes as nucleophile and
diazonium salts allowed the isolation of Wheland intermediates (Scheme 3),[7,8]
with the aforementioned behavior of 2-aminothiazole in mind, we decided to test
its reactivity toward diazonium salts.
Scheme 3. Formation of the Wheland complex in the reaction between
tris(dialkylamino)benzenes and diazonium salts.
Even though the reactions (showed in Scheme 4) were carried out at low
temperature and followed by NMR spectroscopy, we were not able to identify the
intermediates of these reactions. However, we discovered, sometimes
accidentally, interesting feature of the related substitution products. In this chapter
all these properties are reported, focusing the attention on the careful observation
that makes possible to discover the multiple applications of these new compounds.
Scheme 4. Reaction between 2-aminothiazole derivatives and different diazonium salts.
Page 91
Chapter 5
89
5.1 The textile-dyeing property
Azo-based compounds are well known for their intense color and thanks to
this property they were used for a long time in the dye industry.
During our literature research on the thiazole derivatives containing the azo
moiety, we discovered that the diazotization reactions on 2-aminothiazole and the
subsequent coupling with aromatic compounds, lead to the formation of strongly
colored compounds which are used in the textile dyeing industry.[1]
The difference between these azo-derivatives and 2a-h is the position of the
azo moiety. Comparing the two structures (products 3 in Scheme 4 and 5) it is
easy to observe that in our case the product 3 contains a free amino functionality
that could improve the anchoring to the fibers by enhancing the electrostatic
interactions that are responsible of their adsorption.
Scheme 5. Diazotization of 2-aminothiazole and subsequent coupling with aromatic
compounds (here generalized as benzene).
The low solubility in water of these compounds suggested us to applicate
them as disperse dyes.
Disperse dyes are compounds insoluble in water but “soluble” in the fibers.
The fiber is soaked in a suspension of the finely ground dye in water, so the dye
can migrate inside the fiber where it becomes adsorbed. Usually a dyeing
temperature of 130 °C is required and a pressurized dyebath is used. The very
small particle size gives a large surface area and favours the dissolution to allow
uptake by the fiber. Disperse dyes are usually used to dye cellulose acetate, nylon,
triacetate, polyester and acrylic fibers.
Page 92
Chapter 5
90
In spite of this, we preferred to try the first dyeing test on the most easily
available fibers, such as pure cotton and wool, and to use very mild dyeing
conditions (20-60°C, atmospheric pressure).
Our preliminary dyeing test was made using only four of all the products we
obtained (3e-h).
We first added 500 mg of the dye to 25 mL water and made it very finely
grinded by using an ultrasounds generator.
Subsequently, we added 2 wires of cotton or wool of about 15 cm in length
to this suspension, continuously stirring the mixture at room temperature (Figure
4, on the left). After about 20 minutes the solution appeared to be more clear and
the fibers became coloured (Figure 4, on the right).
Figure 4. The fiber just added to the stirred solution (left) and after 20 minutes (right).
The wires were then pulled out from the solution and abundantly rinsed with
fresh water; after this the dye seemed to be very well anchored to both fibers.
We were surprised from this unexpected result; in fact, as just discussed
previously, disperse dyes are good only for dyeing synthetic fibers, but in this
case this is not truth.
It is also noteworthy that usually the compounds that well colour the cotton,
are not good for wool, and vice-versa; on the contrary, our tested products can dye
both wool and cotton.
Page 93
Chapter 5
91
The results, as can be seen in Figure 5, are very good. Just changing the
concentration of the dye, we are able to obtain many different colour shades.
Figure 5. The fiber of wool (top) and cotton (bottom) coloured with compounds 3e-h.
The colour of the cotton fibers results to be a little more light with respect to
that of wool, but with a better brightness. The better way to achieve a more
intense fiber colour is to add to the solution a little amount of NaCl that,
enhancing the ionic strenght of the solution, help the dye transfer into the fibers.
In our test, the temperature rising (60 °C) give the same results only for cotton.
This new dyes are very promising. Their simple preparation (short reaction
times, mild conditions, facile recovery, high yields) and their interesting dyeing
features (good color brightness, mild dyeing conditions, application to different
fibers) can be attractive for a future developments and industrial production.
Obviously, more accurate tests must be done such as washfastness,
lighfastness and specific allergenic tests.
5.2 The pH indicator property
Some of the most known pH indicators are based on azo-derivatives.
However, we discovered this property on our compounds accidentally, just by
washing with a KOH solution a flask containing traces of compounds 3h; we
observed a change in colour from red to blue.
Page 94
Chapter 5
92
Then we tested the change in colour of all compounds 3a-h at different pH
values (1, 7 and 13).
Figure 6. Compounds 3a-h at different pH.
As shown in Figure 6 the most intense variation of colour occurs for
compounds 3b, 3d and 3h. The common feature for these compounds is the
presence of a phenyl substituent on the 4 position of the thiazole ring moiety,
which probably influence the conjugation of the system.
However, the most striking feature is the change in colour at basic pH: in
fact, there are not strong acidic protons in these molecules. By using NMR and
mass spectroscopy techniques we discovered that a mild base such as cesium
carbonate is able to remove the N-H proton on the 2-aminothiazole moiety,
modifying the conjugation of the system and allowing the colour change.
Page 95
Chapter 5
93
5.3 Formation of fluorescent nanoparticles
An interesting feature involving one of these compounds comes from the
observation of the solid that is formed by evaporating different solvents (acetone,
acetonitrile, THF) from a solution of 3h. As depicted in Figure 7, we observed the
formation of green microcrystals with opalescent behaviour. In fact the solution of
3h in all the solvents above mentioned appeared to be red coloured, while in the
solid state a brilliant green colour was observed; another interesting feature is that
the colour of this solid turns into red under intense light. This behaviour was
better seen when the solid was analysed by optical microscope (see Figure 7),
which showed the green/red change in colour and let us size these microwires,
which are about 40 m in diameter.
Figure 7. Formation of 3e microwires by simple solvent evaporation.
To better investigate the structural properties of these microaggregates we
tried to crystallize them by using different techniques.
The most unexpected results occur by using the solvent/non solvent
technique. In fact, after addition of some drops of water to a tetrahydrofuran
solution of 3h, the solution became cloudy and showed an intense green
fluorescence under ambient light.
Page 96
Chapter 5
94
We discovered that the fluorescence is given by the formation of
nanoparticles (since in solution there is no emission). By utilizing with
compounds 3a-h this techniques, usually called reprecipitation method, we
observed for all the formation of fluorescent nanoparticles (Figure 8). Then we
decided to start a deeper investigation on this behaviour, since fluorescent organic
nanoparticles find application in optoelectronic[9,10,11]
and bioimaging.[12]
Figure 8. Fluorescent organic nanoparticle of compounds 3a-h.
5.3.1 Preparation of fluorescent nanoparticles
The common way to prepare organic nanoparticles is called “reprecipitation
method”.[13,14]
A concentrated solution of the sample in an organic solvent is
rapidly injected into a vigorously stirred large amount of water in which solvent is
fully miscible. The abrupt modification of the medium induces the agglomeration
of the compound which can form nano/micro-sized crystals or aggregates. In our
case we added 40 L of a 2.0 x 10⁻³
M solution of compounds 3 in THF to 1.96
mL of water, obtaining a nominal final concentration of 2.0 x 10⁻⁵
M. For all
compounds 3, just after mixing, the suspension become progressively cloudy,
Page 97
Chapter 5
95
showing a blue to green fluorescence simply under sunlight. The aggregation’s
evolution was monitored by using UV-Visible spectroscopy
The sample were then analysed by Dynamic Light Scattering and
fluorescence spectroscopy.
Because this work is still in progress and for the sake of clarity, here we
present the analyses carried out on compound 3b, which is at this moment the
well characterized.
5.3.2 UV-Visible analyses
The UV-Visible analyses is an useful tool to monitor the evolution process
of the nanoparticle formation.
For a comparison we reported the UV-Vis spectrum of compound 3b in
THF at the same nominal concentration of the nanoparticles’ solution (2.0 x 10⁻⁵
M).
As shown in Figure 9, just after mixing the solution, there is a
bathochromic shift of the absorption maximum from 465 nm to 473nm. With time
the absorption maximum progressively shifts toward the red region and its
intensity decrease. However the change with time in is not pronounced but
becomes important after some days: this means that the particles tend to continue
the aggregation process, which is anyway slow.
Page 98
Chapter 5
96
Figure 9. Evolution of the UV-Vis absorption spectrum during the reprecipitation process of
compound 3b.
5.3.3 Size measurement
Among the methods for determination of the nanoparticles’ size, Dynamic
Light Scattering (DLS) is one of the most used. When light hit small particles, the
light is scattered in all directions. The time-dependent fluctuations of the
scattering intensity, elaborated by using appropriate equations, give as result the
dimension of the particles.
In Figure 10 is shown the result of the DLS measurement of 3b
nanoparticles after 1 hour from their preparation.
Figure 10. DLS result of the size distribution for 3b nanoparticles.
0
0,1
0,2
0,3
0,4
0,5
0,6
300 400 500 600 700 800
THF
NP after mixing
30 min
60 min
90 min
120 min
150 min
180 min
240 min
1 day
2 days
7 days
10 days
Page 99
Chapter 5
97
The mean size (diameter) of the particles is about 314 ±14 nm with a good
distribution, also if the entire mixture is mainly formed by particles of about 54
and 300 nm as depicted in Figure 10.
To confirm these data and obtain most accurate results, we planned, in the
future, to analyze our particles by using also microscopy techniques such as SEM
or TEM.
5.3.4 Fluorescence analyses
The fluorescence analyses of 3b nanoparticles showed interesting results.
In Figure 11 emission and excitation fluorescence spectra for 3b in THF
solution, solid state and nanoparticles water dispersed are reported.
As in the case of UV-Visible analyses, for a better comparison we recorded
the spectra of 3b in THF solution and the aqueous nanoparticles (1 hour after their
preparation) at the same nominal concentration (2.0 x 10⁻⁵
M) using the same
instrumental parameters (excitation wavelength = 467 nm; emission wavelength =
610 nm; emission and excitation slit = 2 nm). We decided also to compare the
nanoparticles emission with the one in solid state.
Figure 11. Emission and excitation fluorescence spectra for 3b in THF solution, solid state
and nanoparticles water dispersed.
0
5000
10000
15000
20000
25000
30000
35000
40000
350 450 550 650 750
Em NP
Ex NP
Em THF
Ex THF
Em Solid
Ex Solid
Page 100
Chapter 5
98
As depicted in Figure 11 one can see that 3b in THF solution (green line)
practically do not show fluorescence emission, while the nanoparticles
fluorescence is 58 fold higher than THF solution.
The solid state emission maximum is 10 nm red shifted respect to that of the
nanoparticles which is slightly broader but with the emission covering also the
green region.
Conclusion
This work, which is still in progress, shows how many applications can be
found for a simple class of compounds.
Probably, the most interesting feature is the fluorescent nanoparticles
formation, not only for the possible applications in various field of materials
chemistry, but also because it opens a new research field for azo-derivatives,
which are usually considered not fluorescent. This study is still in progress and a
more accurate characterization with other techniques such as SEM and TEM to
evaluate the shape of the particles, powder X-ray diffraction analyses to
understand if the aggregates are crystalline or amorphous are necessary. Finally, it
could be interesting to test the nanoparticles for the use as probes in bioimaging.
Some of the properties here described were discovered serendipitously, but
a careful observation and a basic knowledge in different field of chemistry were
also important. This means that sometimes we have to not look only at the goal of
our research, but it is also important understand the potential behaviours of the
substances we work with.
References
[1] Jacques V. Metzger, Thiazole And Its Derivatives, Part Two, 1979.
[2] L. Forlani, in Targets in Heterocyclic Systems, O. A. Attanasi and D. Spinelli Eds., Italian
Society of Chemistry, Roma, 1, 1997, 75.
[3] L. Forlani, G. Breviglieri, P. De Maria, J. Chem. Soc. Perkin Transaction 2, 1979, 163-165
Page 101
Chapter 5
99
[4] L. Forlani, L. P. Battaglia, A. Bonamartini Corradi and P. Sgarabotto, J. Cryst. and Spectrosc.
Res., 1992, 22, 705.
[5] L. Forlani, P. De Maria, E. Foresti, and G. Pradella, J. Org. Chem., 1981, 46, 1156.
[6] C. Boga, E. Del Vecchio, L. Forlani, R. Goumont, F. Terrier, S. Tozzi, Chemistry. A Eur. J.
2007, 13, 9600–9607.
[7] C. Boga, E. Del Vecchio, L. Forlani and S. Tozzi, J. Org. Chem., 2007, 72, 8741-8747.
[8] C. Boga, E. Del Vecchio, L. Forlani, Eur. J. Org. Chem., 2004, 1567-1571.
[9] Hagfeldt, A.; Gräetzel, M. Chem. Rev. 1995, 95, 49-68.
[10] Schlamp, M. C.; Peng, X.; Alivisatos, A. P. J. Appl. Phys. 1997, 82, 5837-5842.
[11] (a) Wohltjen, H.; Snow, A. W. Anal. Chem. 1998, 70, 2856-2859. (b) Shipway, A. N.; Katz,
E.; Willner, I. ChemPhysChem 2000, 1, 18-52.
[12] (a) Bruchez, M.; Moronne, M.; Gin, P.; Weiss, S.; Alivisatos, A. P. Science 1998, 2013-2016.
(b) Michalet, X.; Pinaud, F.; Lacoste, T. D.; Dahan, M.; Bruchez, M. P.; Alivisatos, A. P.; Weiss,
S. Single Mol. 2001, 2, 261-276.
[13] H. Kasai, H. S. Nalwa, H. Oikawa, S. Okada, H. Matsuda, N. Minami, A. Kakuda, K. Ono, A.
Mukoh, H. Nakanishi, Jpn. J. Appl. Phys. 1992, 31, 1132.
[14] H. Nakanishi, H. Oikawa, Single Organic Nanoparticles (Eds: H. Masuhara, H. Nakanishi, K.
Sasaki), Springer, Berlin, 2003, Ch.2, p. 17.
Page 103
Chapter 6
101
Chapter 6
Phospha Michael-type reaction of bidentate
nucleophile
The Michael addition is one of the most useful methods in synthetic
organic chemistry for the formation of C–C bonds.[1]
However, the importance of
this conjugate addition in organic synthesis is not limited to the formation of C–C
bonds. In fact, a wide number of variants both in the nucleophilic part and in the
electrophilic one permits to obtain a series of carbon-heteroatom bonds, as
carbon-sulfur, carbon-nitrogen, carbon-oxygen, or carbon-phosphorus through the
so-called sulfa-,[2]
aza-,[3]
oxa-,[4]
or phospha-[5]
Michael reaction, respectively. This
latter is one of the most important tools for the formation of the P–C bond, one
bond of great interest in synthetical, applied, and biological chemistry.
Among the non-classical Michael electrophilic partners, 1,2-diaza-1,3-
dienes (DDs) represent a class of compounds with a good reactivity as Michael
acceptors owing to the electron-withdrawing effect of the azo group in the
heterodiene system.[6,7]
The regioselective nucleophilic attack at the terminal carbon atom in the 4-
position of the heterodiene system of DDs occurs with a variety of carbon- and
hetero-nucleophiles such as oxygen, nitrogen-, sulfur-, selenium- and phosphorus
nucleophiles giving the corresponding hydrazones.[6]
Previously, the phospha
Michael reaction on DDs has been studied using triphenylphosphine,[8]
trialkylphosphines,[9]
trialkyl phosphites,[10]
dialkylphenylphosphonites,[11]
phosphoramidites, phosphorodiamidites, and tris(dimethylamino)phosphines.[12]
All these reactions occur under very mild conditions and involve, as key
step, the spontaneous formation of ylidic intermediates. The good results obtained
suggested us to explore the reactivity of DDs also with diphosphine derivatives in
Page 104
Chapter 6
102
order to obtain diylides, a class of compounds useful in various fields of
chemistry[13,14]
but, to the best of our knowledge, rarely reported so far.
In particular, we have investigated the reaction in neutral conditions
between a series of methylene–bridged diphosphines and DDs and the obtained
results showed the efficiency of our approach as a route to a new class of
symmetrical diylidic compounds. In addition, we extended the investigation using
methylene–bridged phosphinoamine derivatives with the same DDs.
6.1 Brief summary of used reagents
The reactivity of DDs 1a,b was studied towards bis(diphenyl)phosphines,
namely bis(diphenylphosphino) methane (DPPM, 2a), bis(diphenylphosphino)
ethane (DPPE, 2b), bis(diphenylphosphino)propane (DPPP, 2c) and
bis(diphenylphosphino)butane (DPPB, 2d) (Scheme 1), and diphenylphosphino
amines such as 2-(diphenylphosphino)ethanamine (5a) and 3-(diphenylphosphino)
propan-1-amine (5b) (Scheme 3). The related results have been separately
discussed in the following sub-headings.
6.2 Reactions between 1,2-diaza-1,3-dienes (DDs) and bis(diphenyl)
phosphines
The reactions between DDs 1a,b and bis(diphenyl)phosphines 2a–d
(Scheme 1) were carried out at room temperature in ethyl acetate or in
chloroform; the disappearance of the typical red colour of the starting DD
indicated the completion of the reaction which was monitored also through 1H and
31P NMR spectroscopy.
Page 105
Chapter 6
103
EtO
O
NN NHR
O
+
R: H (1a), Ph (1b) n = 1 (2a, DPPM)n = 2 (2b, DPPE)n = 3 (2c, DPPP)n = 4 (2d, DPPB)
PPh2
PPh2
NNH
O
NHR
O OEtOEtO
NNH
O
RHN n
EtO
O
NN– NHR
OPh2+P
Ph2P(CH2)nPPh2
(CH2)nPPh2
EtO
O
N
HN NHR
OPh2P(CH2)nPPh2
3a–h
Zw-1
1a or 1b
4a–h (>90%) a b c d e f g h
H H H H Ph Ph Ph Ph
1 2 3 4 1 2 3 4
R
n
Scheme 1. Reaction between DDs 1a and 1b and bis(diphenyl)phosphines 2a–d.
The reactions were carried out in different relative molar ratio of the
reagents, and the results treated separately.
6.2.1 Reactions carried out with equimolar amount of DDs and diphosphines
The reaction between equimolar amount of compound 1a and DPPM (2a)
in ethyl acetate gave, after a few minutes, formation of a white solid. After
filtration, this solid was analyzed and resulted to be pure compound 3a, recovered
in about 50% yield. When 1b was reacted with 2a in ethyl acetate, no solid was
formed. In both cases, a mixture of starting reagent 2a, of monoylide (3a or 3e)
and diylide (4a or 4e) was found in the solution. The reactions of DDs 1a and 1b
with 2a were carried out also in CDCl3 directly in the NMR spectroscopy tube and
monitored through 1H and
31P NMR spectroscopy: in these cases, no precipitate
was formed and the corresponding mono-adducts 3a,e were formed in nearly
quantitative yield.
From the reactions between equimolar amount of 1a,b and the
diphosphines 2b–d in ethyl acetate, a white solid precipitated but in these cases
the spectral data agreed with the structure of the corresponding diadduct 4. When
the reactions between DDs 1a,b and phosphines 2b–d were carried out in
deuterochloroform, no precipitate was formed and monoylides 3b–d and 3f–h
Page 106
Chapter 6
104
were obtained in higher yield, even if in mixture with the corresponding diadducts
4.
These data indicate that the solubility in ethyl acetate of 3a is lower than
that of all others mono-ylides, being it, in the same experimental conditions, the
sole mono-adduct recovered by precipitation from the reaction mixture. On the
other hand, the poor solubility in ethyl acetate showed by diadducts 4b–h (see
below) causes their precipitation from the solution thus increasing the conversion
to the bis-adduct. Attempts to isolate derivatives 3b–h by column chromatography
from reactions carried out in chloroform failed and for this reason 3b–h have been
characterized by 1H and
31P NMR carrying out the reaction directly in NMR
spectroscopy tube.
6.2.2 Reactions carried out with DDs and diphosphines in a 2/1 relative molar
ratio
The reaction between 1a,b and 2a–d in 2:1 relative molar ratio in ethyl
acetate gave, after about 15 min, compounds 4a–h in almost quantitative yield and
their low solubility permitted to obtain them from the reaction mixture by
filtration. Products 4a–d were recovered by filtration in almost double yield with
respect to 4e–h, and this suggests that the presence of the NHPh end group of the
DDs moiety increases the solubility of these diylides. Compound 4a was obtained
also by addition of DD 1a to an equimolar amount of pure 3a, obtained as
described in the above section.
The ylidic structure of Michael-like mono- and bis-adducts is supported by
their IR, 1H,
13C,
31P NMR and mass spectral data. Below are reported some
remarks from both the structural and mechanistic point of view.
Probably, zwitterionic forms as Zw-1 (Scheme 1) are firstly formed by
phospha-Michael addition of one phosphorus atom of 2 on one molecule of DD.
To gain information on the involved intermediates, we carried out the reaction
between equimolar amount of 1a and 3a directly in the NMR spectroscopy tube in
CD2Cl2 at –70 °C but in our experimental conditions no evidence of species Zw-1
have been obtained.
Page 107
Chapter 6
105
EtO
O
N
HN NHR
OPh2P(CH2)nPPh2
N NP
COOEt
(CH2)n
Ph
Ph
PPh2
RHNOC
A-1
or/and
3
EtO
O
NN NHR
O
+ EtO
O
NN– NHR
OPh2+P
Ph2P(CH2)nPPh2
(CH2)nPPh2
Zw-1via a via b
1 2
Scheme 2. Simplified possible reaction pathways for the first attack of diphosphanes to DDs.
Probably, the intermediate Zw-1 is immediately converted into more stable
neutral structures. In principle, from Zw-1 two different can be obtained (Scheme
2): A-1, derived from an internal nucleophilic attack of the nitrogen on the
phosphorus of phosphonium salt through the pathway a, and 3 derived from an
1,4-hydrogen shift (via b) favoured by the great acidity of the hydrogen atom
bound to the carbon in -position both to the phosphorus and to the ester group.
A-1 is a cyclic pentacoordinated phosphorus species, more stable than an
acyclic one of about 106 fold,
[15] but the absence, in the
1H NMR spectrum, also
when recorded at –70 °C, of the signal belonging to the proton in position to the
carboxy group, together with 31
P NMR chemical shifts of the reaction products
(that fall far from the range typical of pentacoordinate phosphorus species[16]
)
permitted to exclude A-1 in favour of the ylidic structure 3. In particular, 31
P
NMR spectrum of compound 3a shows, in CDCl3 at 25 °C, a couple of doublets at
=19.8 ppm (JPP=61.8 Hz) and = –27.3 ppm (JPP=61.8 Hz), indicative of a
PIVCPIII sequence (the first signal belongs to a tetracoordinate phosphorus atom
while the second one is due to a tricoordinated phosphorus atom, with a value
very close to that of starting phosphine 2a). In the case of formation of an A-1-
like species, 31
P NMR signal of the corresponding pentacoordinate phosphorus
atom should be expected at negative values.
Analogous considerations can be made about the diadducts obtained
between diphosphines 2a–d and two molecules of DD. Also in these cases, many
Page 108
Chapter 6
106
intermediates might be expected. However, the presence of a single signal in the
31P NMR spectrum ( values around +20 ppm in CDCl3 at 25 °C) indicates the
presence of the bis-ylide 4, confirmed also by 1H and
13C NMR. Consequently,
intermediates Zw-like are probably very short life-time species.
Finally, during the NMR monitoring of the reaction decourse between 1a
and 2a in CD2Cl2 in variable temperature NMR conditions we observed, at –70
°C, a little amount of 2a (P= –23.5 ppm) and two couple of doublets, at +22.8
and –28.8 ppm (JP-P~62 Hz) and +20.3 and –27.4 ppm (JP-P~61 Hz) indicating the
presence of two species. The corresponding 1H NMR spectrum recorded at the
same temperature confirmed the presence of two compounds in 65/35 relative
ratio. On raising the temperature, both 31
P and 1H NMR spectra do not changed
until –50 °C. Above –50 °C the signals showed line broadening and the
coalescence was reached at –35 °C. A further increase of the temperature caused a
gradual sharpening of the signals until a final averaged situation, which spectra
agreed with those of product 3a. The dynamic process is reversible and, based on
the Eyring equation,[17]
the data permitted to calculate an activation energy of the
process of G#=(11.2±0.2) Kcal mol
-1 a value in agreement
[18] with that of a
rotational constraint due, in this case, to the bulky groups present on compound 3a
that make the molecule quite rigid.
6.3 Reactions between 1,2-diaza-1,3-dienes 1a,b and diphenylphosphino
amines 5a,b
Since it is known that DDs react with amines to give aza-Michael-like
addition,[23]
from the reaction between phosphoamino derivatives 5a,b and 1,2-
diaza-1,3-diene 1a (Scheme 3) beside the phospha-, also an aza-Michael-like
addition might occur or even a tandem phospha-aza Michael[24]
double addition.
When the reactions between equimolar amount of 1a and 5a,b were
carried out at room temperature in ethyl acetate (or in chloroform), the only
products obtained were compounds 6a,b (Scheme 3), whose structure was
ascertained by 1H,
13C,
31P and g-HSQC NMR analyses. Compound 6a, kept in
Page 109
Chapter 6
107
CDCl3 solution, after 1 day was quantitatively converted into a new stable product
with spectral data in agreement with those of structure 7a. When the reaction
between 1a and 5a in 2/1 relative molar ratio was carried out in CDCl3, the 1H
NMR spectrum of the crude reaction mixture showed only the presence of
compound 6a and of starting DD thus suggesting that the expected aza-Michael
addition between 6a and 1a does not occurr in our experimental conditions: also
in this case, with time, the formation of cyclic compound 7a was observed.
EtO
O
NN NH2
O
+
N
PPh PhO
EtO
Ph2P NH2n
1a 5a: n=25b: n=3
EtO
O
NN– NH2
OPh2+P
(CH2)nNH2
Zw-2
EtO
O
N
HN NH2
OPh2P(CH2)nNH2
6a: n=26b: n=3
n=2
n=3
7a
N
PPh PhO
EtO
7b
NH
N
O
+
8
Scheme 3. Reaction between aminophosphanes 5a and 5b and DD 1a.
The cyclization of 6b to cyclic seven-membered compound 7b resulted
less selective with respect to that observed for 6a. In fact, compound 6b, kept in
chloroformic solution, was slowly converted into a mixture of products: among
them, we were able to identify and isolate compound 7b and pyrazole derivative
8. The structure of 8 was ascertained by comparison of its spectral properties with
those of an authentical sample.[8]
New heterocycles 1-aza-2,3-dihydro-4-phosphinine (7a) and 1-aza-5,6-
dihydro-4-phosphepine (7b) resulted to be stable and their spontaneous formation
from precursors 6a and 6b can be due to an internal nucleophilic attack of the
amino nitrogen atom of 6 to the imino carbon atom[23]
with displacement of a
molecule of semicarbazide through a pathway analogous to that recently
reported.[24]
Page 110
Chapter 6
108
It is interesting to note that the behaviour of the ylidic adducts 6a,b is different
from that observed for ylides 3, derived from the reaction of diphosphines 2a–d.
In fact, while adducts 3 undergo addition of a second molecule of DD giving
diadducts 4, in the case of ylides 6a,b obtained from DD 1a and aminophosphines
5a,b, the intramolecular attack by the amino nitrogen atom to give new
heterocyclic species is preferred over the aza-Michael addition of this amino
group with a second molecule of 1a,b.
Conclusions
In conclusion, the reaction between 1,2-diaza-1,3-dienes and bidentate
nucleophiles gave in high yield and under mild conditions new phospha-Michael
adducts. In particular, the use of a series of methylene-bridged
bis(diphenylphosphino) derivatives gave access to new ylides and symmetrical
diylides while diphenylphosphinoamino derivatives produced ylidic intermediates
that spontaneously were converted to new six- and seven-membered heterocycles.
Part of this chapter is reproduced with permission from “European Journal of
Organic Chemistry” by John Wiley and Sons. Further experimental data, included
characterization data of the related products here described, can be found in the
paper “Forlani L., Attanasi O. A., Boga C., De Crescentini L., Del Vecchio E.,
Favi G., Mantellini F., Tozzi S., Zanna N., Eur. J. Org. Chem, 2012, 4357-4366”
fully available at http://onlinelibrary.wiley.com/.
References
[1] a) M. B. Smith, J. March, March's Advanced Organic Chemistry, 6th Edition, J. Wiley &
Sons; Hoboken, N.J., 2007, p.1105 and ref. cit. therein; b) P. Perlmutter in Conjugate
Addition Reactions in Organic Synthesis, Pergamon Press; Oxford, U.K., 1992; c) S.
Paganelli, A. Schionato, C. Boga, A. Fava, J. Mol. Catal. 1991, 66, 7–21,and ref. cit. therein.
[2] D. Enders, K. Lüttgen, A. A. Narine, Synthesis 2007, 959–980 and ref. cit. therein.
Page 111
Chapter 6
109
[3] For a recent review on aza-Michael reaction see: D. Enders, C. Wang, J. X. Liebich, Chem.
Eur. J. 2009, 15, 11058–11076.
[4] C. F. Nising, S. Bräse, Chem. Soc. Rev. 2008, 37, 1218–1228.
[5] a) D. Enders, A. Saint-Dizier, M.-I Lannou, A. Lenzen, Eur. J. Org. Chem. 2006, 29–49; b)
R. Engel in Synthesis of Carbon–Phosphorus Bonds, CRC Press; Boca Raton, FL, 1988.
[6] For recent reviews see: (a) O. A. Attanasi, L. De Crescentini, P. Filippone, F. Mantellini, S.
Santeusanio, ARKIVOC 2002, XI, 274–292; (b) O. A. Attanasi, L. De Crescentini, G. Favi, P.
Filippone, F. Mantellini, F. R. Perrulli, S. Santeusanio, Eur. J. Org. Chem. 2009, 3109–3127.
[7] T. Kanzian, S. Nicolini, L. De Crescentini, O. A. Attanasi, A. Ofial, H. Mayr, Chem. Eur. J.
2010, 16, 12008–12016.
[8] O. A. Attanasi, P. Filippone, A. Mei, Tetrahedron, 1992, 48, 1707–1714.
[9] O. A. Attanasi, P. Filippone, S. Giovagnoli, Org. Prep. Proced. Int. 1994, 26, 321–326.
[10] O. A. Attanasi, G. Baccolini, C. Boga, L. De Crescentini, P. Filippone, F. Mantellini, J. Org.
Chem. 2005, 70, 4033–4037.
[11] O. A. Attanasi, G. Baccolini, C. Boga, L. De Crescentini, P. Filippone, F. Mantellini,
Tetrahedron 2008, 64, 6724–6732.
[12] O. A. Attanasi, G. Baccolini, C. Boga, L. De Crescentini, G. Giorgi, F. Mantellini, S.
Nicolini, Eur. J. Org. Chem. 2008, 5965–5979.
[13] a) O. I. Kolodiazhnyi, in Phosphorus Ylides, Chemistry and application in Organic Synthesis,
Wiley–VCH; Weinheim, 1999; b) G. Pohnert, W. Boland, Eur. J. Org. Chem. 2000, 1821–
1826.
[14] a) D. E. Berry, J. Browning, K. R. Dixon, R. W. Hilts, Can. J. Chem. 1988, 66, 1272–1282;
b) A. Spannenberg, W. Baumann, U. Rosenthal, Organometallics 2000, 19, 3991–3993; c) L.
R. Falvello, M. E. Margalejo, R. Navarro, E. P. Urriolabeitia, Inorg. Chim. Acta 2003, 347,
75–85; d) Y. Canac, C. Lepetit, M. Abdalilah, C. Duhayon, R. Chauvin, J. Am. Chem. Soc.
2008, 130, 8406–8413.
[16] F. H. Westheimer, Acc. Chem. Res. 1968, 1, 70–78.
[16] a) R. R. Holmes, in Pentacoordinated Phosphorus Structure and Spectroscopy, ACS
Monograph 175, American Chemical Society: Washington, DC, 1980, Vols. I and II; b) L. D.
Quin, A. J. Williams, Practical Interpretation of P-31 NMR Spectra and Computer Assisted
Structure Verification. Advanced Chemistry Development, Inc.: Toronto, 2004, Chapt. 12,
pp.83–85; c) E. Fluck, G. Heckmann, Empirical Methods for Interpreting Chemical Shifts of
Phosphorus Compounds, in ‘Phosphorus-31 NMR Spectroscopy in Stereochemical Analysis
Organic Compounds and Metal Complexes’, J. G. Verkade, and L. D. Quin, Eds., VCH
Publihers, Deerfield Beach, FL, 1987, Chapter 2; d) G. Baccolini, C. Boga, R. A. Buscaroli,
Eur. J. Org. Chem. 2001, 3421–3424; e) G. Baccolini, C. Boga, M. Mazzacurati, F.
Page 112
Chapter 6
110
Sangirardi, Org. Lett. 2006, 8, 1677–1680; f) G. Baccolini, C. Boga, M. Mazzacurati, Eur. J.
Org. Chem. 2007, 4529–4534.
[[17] a) H. S. Gutowsky, C. H. Holm, J. Chem. Phys. 1956, 25, 1228–1234; b) H. Eyring, Chem.
Rev. 1935, 17, 65–77.
[18] L. Lunazzi, A. Mazzanti, A. Muñoz Álvarez, J. Org. Chem. 2000, 65, 3200–3206.
[23] J. Vicario, D. Aparicio, F. Palacios, J. Org. Chem. 2009, 74, 452–455.
[24] O. A. Attanasi, S. Bartoccini, G. Giorgi, F. Mantellini, F. R. Perrulli, S. Santeusanio,
Tetrahedron 2010, 66, 5121–5129.
Page 113
Chapter 7
111
Chapter 7
Interaction between gliadins and coumarin: a joint
theoretical and experimental study
Gliadins represent the alcohol soluble fraction of gluten, the wheat storage
protein. They are a family of prolamines, heterogeneous polypeptides of
molecular weight ranging from 30 to 55 kDa. Gliadins are monomeric and
disulphide-bonded proteins formed by a non-repetitive domain rich in α-helix
structures and by heterogeneous repetitive domains rich in β-reverse turns.[1]
The
repetitive domains consist of short repeated sequences, with high content of
proline and glutamine. They are classified according to their structure into α-, β-,
γ-, and ω-type.[2]
Unfortunately, gliadins may be strong food allergens. They cause IgE-
mediated allergies, such as asthma, atopic dermatitis, urticaria, angioedema, food
allergy and anaphylasis,[3,4]
or may aggravate coeliac disease, a genetically-
determined gluten-dependent disease.[5]
Because gluten plays a significant role in
the human diet, many research efforts have been aimed at exploring the
mechanisms of its allergenicity. Attempts to modify gluten proteins have appeared
useful since they may considerably decrease allergen immunoreactivity.
In a previous study it has been reported that several anthocyanins and
anthocyanidins interact with gliadins in conditions similar to those of the
stomach.[6]
Anthocyanidins are flavylium salts, the pigments of the vascular
plants. They are present in vegetables and flowers and give them brilliant red to
violet colours. Anthocyanidins are powerful antioxidant molecules, with
noteworthy biological activity, even if they do not have a long-lasting stability in
solution.[7]
The complexes formed between anthocyanidins and gliadins appeared quite
“stronger” than those between anthocyanins and gliadins.[6]
Among all the tested
Page 114
Chapter 7
112
molecules, cyanidin (Cya, Figure. 1) was found to show the highest affinity for
the gliadins. The previous studies on the interaction between anthocyanidins and
gliadins were carried out by using several spectroscopic techniques, such as
Nuclear Magnetic Resonance Spectroscopy (NMR), UV-Visible spectroscopy and
Infrared spectroscopy. The analysis of the results was complicated due to the
different forms in which anthocyanidins could be present in solution, so it seemed
important to carry out further studies by using a molecular model. Coumarin was
chosen as a model because has a benzocondensed structure similar to that of Cya.
In this study the interaction of the gliadins with a coumarin derivative was
investigated in order to obtain further information about the conformational
changes of gliadins. With this aim, 3-ethoxycarbonylcoumarin (3-EcC, Figure. 1)
has been synthesized.
Coumarins constitute a group of natural compounds derived from 5,6-
benzo-2-pyrone contained in more than 700 species of plants. Their name derives
from the French word coumarou, the popular name of the tonka tree
(Coumarouna odorata) from which coumarin was extracted for the first time.[8]
Many studies have been focused on a large number of beneficial effects of
coumarins including anti-inflammatory,[9]
antitumor,[10]
antioxidant,[11]
antiviral,
and antimicrobial activities,[12]
even if some coumarin derivatives present a
moderate toxicity. Unfortunately, some coumarins are not soluble in water and
this could affect their bioavailability.[13]
3-EcC and Cya have a similar structure, although Cya is a cationic species,
instead 3-EcC is neutral and does not have a phenyl moiety (ring B, Figure 1).
Moreover, this coumarin is present in a sole form. The differences between the
two types of molecules permit us to investigate the influence of the charge, the
steric hindrance and other structural features in the formation of a complex with
the gliadins (Glia). Furthermore, differently from Cya, 3-EcC is stable also in
neutral conditions, allowing to investigate the structural changes of Glia in
different conditions of pH (7 and 2.5).
With the aim to better understand the nature of the interaction between the
gliadins (Glia) and these ligands, Raman, IR and NMR spectroscopies were
Page 115
Chapter 7
113
employed. The obtained results have been sumarized in order to compare the
effect of the two different types of ligand in the interaction with the gliadins
(Glia).
Figure 1. Ligands used in this study.
7.1 Coumarin (3-EcC) and Glia at neutral pH
7.1.1 Raman and IR vibrational results
Figure 2A reports the Raman spectra of lyophilized Glia before and after
treatment with 3-EcC at neutral pH; the spectrum of 3-EcC is reported for
comparison. In both treated and untreated samples, several bands are
characteristic of specific amino acids. The bands prevalently due to phenylalanine
(F), tyrosine (Y), tryptophan (W), glutamine (Q) and proline (P) have been
indicated.14
In addition, the spectrum of the treated sample shows several bands
(indicated with an asterisk) due to the bonded 3-EcC; some of them appeared
slightly shifted in their wavenumber positions.
The Raman spectrum of untreated Glia at neutral pH shows Amide I and III
components at 1661 and 1276 cm-1, respectively. These spectral features,
together with the presence of the bands at about 1340, 1100 and 930 cm-1
(CCaH, CN and skeletal stretching modes, respectively), diagnostic for alpha-
helix,[14,15,16,17,18]
showed that the secondary structure of Glia is dominated by the
α-helix conformation, in agreement with previously reported data. [18]
Page 116
Chapter 7
114
Figure 2. Raman (A) and IR (B) spectra of lyophilized Glia before (black) and after
treatment with 3-EcC (red) at neutral pH; the spectra of 3-EcC (green) are reported for
comparison. The bands prevalently due to phenylalanine (F), tyrosine (Y), tryptophan (W),
glutamine (Q) and proline (P) are indicated. The bands due to the bonded 3-EcC are
marked with an asterisk.
In the Amide III range, the band at about 1315 cm-1
, assignable to poly-
proline II PPII helical structure,[17,19]
revealed the presence of this conformation,
according to other studies;[17]
the component at 1253 cm-1
is ascribable to
turns/unordered conformations.[14]
The quantitative data obtained by the method
of Alix et al. (Table 1) confirmed that the prevalent conformation was a-helix.
Actually, it has been demonstrated that large amounts of proline make the
Page 117
Chapter 7
115
formation of long runs of residues in the -sheet conformation more unlikely.[20]
On the other hand, glutamine residues have been found to favor the α-helix
region of the Ramachandran surface,[21]
although glutamine residues have also
been reported to have a high PPII helix-forming propensity.[22]
Upon treatment with 3-EcC, the Amide I band shifted to lower frequency,
i.e. at 1659 cm-1
(Figure 2A). The quantitative data reported in Table 1 suggested
that the treatment with 3-EcC induced a conformational rearrangement that
involved an increase in α-helix and a parallel decrease in -sheet (the content of
turns and unordered structures remained nearly constant).
The Amide III spectral range confirmed the increase in α-helix content: in
fact, the band at about 1275 cm-1
, assignable to this conformation increased in
intensity, as well as the bands at about 1340, 1100 and 930 cm-1
. Conformational
rearrangements can also explain the changes observed in the 3500-3000 cm-1
range (where NH and OH stretching modes fall), ascribable to the development
of different hydrogen bonding patterns.
Table 1. Percentages of secondary structure conformations as determined by applying the
method of Alix et al.[56]
to the Amide I Raman band; full width at half maximum (FWHM) of
the CH2 band at 1450 cm-1
and I855/I830 intensity ratios as determined from the Raman
spectra of the analyzed samples.
Sample -
heli
x
-
sheet
turns unordere
d
FWHM145
0
I855/I83
0 Glia at neutral pH 47 26 16 11 35.5 1.10
Glia+3-EcC at neutral pH 53 21 16 10 35 2.02
Glia at acidic pH 44 28 17 11 37.1 1.10
Glia+3-EcC at acidic pH 55 20 15 10 34.9 1.08
Glia+Cya at acidic pH 60 16 14 10 unreliable 0.60
Glia+Cya+3-EcC at
acidic pH
64 12 14 10 unreliable 0.84
Glia at neutral pH 47 26 16 11 35.5 1.10
Glia+3-EcC at neutral pH 53 21 16 10 35 2.02
Page 118
Chapter 7
116
According to other authors,[23]
the increase of the α-helix content can be
interpreted as an increased folding of the protein; the same authors explained the
decrease in α-helix content in terms of unfolding of the protein.
The full width at half maximum (FWHM) of theCH2 band at 1450 cm-1
has been used as a marker of the relative order of the hydrophobic component as
suggested for phospholipid assemblies;[ 24,25,26]
a certain increase of order occurred
also in the hydrophobic component, as suggested by the slight sharpening of the
δCH2 band upon complexation with 3-EcC (FWHM decreased from 35.5 to 35
cm-1
, Table 1).
The tryptophan band at 760 cm-1
has been proposed as indicator of the
hydrophobicity of the environment of the indole ring. The addition of 3-EcC
caused a slight strengthening of the 760 cm-1
; this result suggests a little increment
in the “buriedness” of the tryptophan residues in the protein, which contributes to
the formation of a more ordered structure.[27,28]
The intensity change of the band at
880 cm-1
, assignable to Trp besides other amino acid residues, confirmed a change
in Trp environment; upon the treatment with 3-EcC, the effect was opposite to
that observed by other authors upon complexation with arabic gum.[18]
Some
authors suggested that the intensity of the Raman bands of phenylalanine at about
1000 and 1035 cm-1
are sensitive to the environment of this amino acid, besides
its content.[18]
In particular, the variations in the band at about 1000 cm-1
have
been attributed to the environmental influences on the benzene ring π- electron
clouds since Phe could not be involved in specific hydrogen-bonding or other
polar interactions; a weakening of this band has been explained in terms of
exposure to water, while a strengthening to hydrophobic environments.[29,30]
In
our spectrum, the above mentioned bands appeared strengthened upon the
treatment with 3-EcC, particularly that at 1035 cm-1
, partly due to the contribution
of the 3-EcC ligand, which shows a band at a similar wavenumber position
(Figure 2A).
The Raman bands at about 855 and 830 cm-1
(Fermi resonance between the
ν1 ring breathing vibration and the 2ν16a overtone of an out-of-plane ring bending
vibration) can be used to investigate the H-bonding state of the Tyr phenoxyl.[14,31]
Page 119
Chapter 7
117
The intensity ratio between the two components (I855/I830) has been extensively
used to evidence the Tyr interactions in globular proteins, their assemblies and the
degree of exposure to water.[14]
In fact, the I855/I830 ratio achieves its minimum
value of about 0.3 when tyrosine residues are buried and the phenolic OH group
acts as a strong hydrogen-bond donor to an electronegative acceptor, such as
carboxyl oxygen.[31]
When tyrosines are exposed at the surface of the protein, the
phenolic OH acts as both a donor and an acceptor of moderate hydrogen bonds
and the I855/I830 is approximately 1.25.[31]
If the phenoxyl oxygen is the acceptor
of a strong hydrogen bond from an electropositive group, such as a lysyl NH3+
group, and does not participate in significant hydrogen bond donation, the I855/I830
approaches a presumed maximum value of 2.5.[31]
More recent studies on
filamentous virus capsids,[32,33,34,35]
and silk fibroin in Silk I form,[36]
allowed to
refine the correlation and to verify that the I855/I830 intensity ratio can even exceed
the latter value, indicating a strongly hydrophobic local environment for tyrosine
residues, a state not represented in any previous study on globular proteins.
To obtain more reliable I855/I830 intensity ratios, a curve-fitting procedure
was used. As an example Table 1 reports the I855/I830 values obtained from the
Raman spectrum (region 970-790 cm-1
) of lyophilized Glia at neutral pH fitted
into its components. In the spectrum of untreated Glia, the I855/I830 intensity ratio
was 1.10, suggesting that phenolic OH groups acting as both donor and acceptor
of moderate hydrogen bonds,[31]
according to the amino acid composition of Glia.
Upon treatment with 3-EcC, the I855/I830 intensity ratio of Glia increased
from 1.10 to 2.02 suggesting a change towards a more exposed state of tyrosine
residues. The nSS disulphide stretching vibration (500-550 cm-1
) is commonly
used to evaluate conformational changes, since disulphide bridges play a
fundamental role in determining the tertiary structure of a protein. The
symmetrical stretching vibration of the S-S bond is influenced by the
conformation of the C atoms in the disulphide bridge. Components at about 510,
520 and 540 cm-1
have been identified as diagnostic for gauche-gauche-gauche(g-
g-g), gauche-gauche-trans (g-g-t) and trans-gauche-trans (t-g-t) C-C-S-S-C-C
conformations, respectively.[14,37]
Page 120
Chapter 7
118
In the spectral profile of the untreated Glia (Figure 2A), the most evident
component appeared at 508 cm-1
, suggesting that the C-C-S-S-C-C linkage
took the lowest potential energy conformation (i.e. gauche-gauche-gauche).
However, components at about 520 and 540 cm-1
were detected as shoulders.
To obtain more reliable information on the distribution of the disulphide
bridge conformations, a curve-fitting procedure was adopted; as an example
Figure 3 shows the percentages obtained for the g-g-g, g-g-t and t-g-t
conformations in the analysed samples.
Figure 3. Percentages of gauche-gauche-gauche (g-g-g), gauche-gauche-trans (g-g-t)
and trans-gauche-trans (t-g-t) C-C-S-S-C-C conformations, as obtained by fitting the 585-
485 cm-1
Raman spectra of the analysed samples.
The curve fitting analysis (Figure 3) confirmed that the prevalent
conformation of the cystine disulphide bridges was gauche-gauche-gauche (49%).
Significant amounts of trans-gauche-trans conformation were present (37%); the
gauche-gauche-trans conformation was the least represented (14%). Upon the
treatment with 3-EcC, the bands at 540 and 523 cm-1
clearly appeared as distinct
components (Figure 2A). The curve-fitting analysis showed that the trans-gauche-
trans and trans-gauche-trans conformations increased their contents at the
expenses of the gauche-gauche-gauche conformation (attaining percentages of 43,
32 and 25%, respectively, Figure. 3). An analogous behavior was observed by
Page 121
Chapter 7
119
other authors on gluten proteins treated with emulsifying agents,[38]
they
interpreted this result as a marker of protein folding phenomena. Our findings
suggest that the conformation of the disulphide bridges was strongly altered upon
interaction with 3-EcC.
The changes observed in the secondary structure as well as in Tyr, Trp and
S-S bridges were analogous to those observed by other authors for gluten proteins
treated with locust bean gum.[23]
In the light of the obtained results, it can be affirmed that the interaction
with 3-EcC determined significant conformational rearrangements in the gliadins
(Glia).
The IR and Raman region near 1700 cm-1
allowed to better clarify the nature
of the interactions between Glia and 3-EcC. As can be seen in the IR spectra
reported in Figure 2B, the C=O stretching vibration of the ligand was found to
shift to lower wavenumber values upon interaction with Glia, i.e. from 1759 to
1732 cm-1
; analogously, the other C=O stretching vibration shifted in the Raman
spectra from 1716 to 1711 cm-1
(Figure 2A) These trends would show that both
the C=O groups of 3-EcC should be involved in hydrogen bond interactions. At
the same time, the shift of the 3-EcC band from 1565 to 1568 cm-1
, assignable to
C=C stretching vibrations, would suggest that also hydrophobic interactions
occur.
7.1.2 NMR Results
In order to study by NMR gliadins-coumarin interaction in neutral
conditions, methanol-d4 was chosen as solvent instead of a more complicated
mixture of solvents. The gliadins (Glia) are less soluble in methanol-d4 than under
acidic conditions or in the 60:40 ethanol/water mixture, but the STD technique
permits to have binding site information even in the case of very dilute protein
solutions. STD spectra of the reaction mixture show that the entire 3-EcC
molecule interacts because all its signals are involved in Overhauser effect, in
particular the methyl moiety (δ = 1.40 ppm) has a strong interaction with Glia
(Figure 4)
Page 122
Chapter 7
120
Figure 4. a)1H-NMR spectrum of 3-EcC in CD3OD; b)
1H-NMR spectrum of 3-EcC
and Glia in CD3OD; c) STD spectrum of 3-EcC and Glia CD3OD.
7.2 Coumarin (3-EcC) and Glia at acidic pH
7.2.1 Raman Results
The pH conditions appeared to significantly influence the conformation of
Glia. The differences observed are consistent with the findings reported in the
literature,[18]
in particular, at decreasing pH, in the Amide I range, the center of the
band appeared slightly up-shifted, and a shoulder at higher wavenumber values
appeared more prominent. Interestingly, the Amide I broadened (going from
neutral to acidic pH its FWHM increased from 55.5 to 59.8 cm-1
), suggesting a
wider distribution of secondary structure conformations. At the same time, in the
Amide III range, the bands at about 1340 and 1270 cm-1
appeared decreased in
intensity with respect to those at about 1315 and 1250 cm-1
, respectively; in
agreement with Chourpa et al.,[18]
the obtained trends can be explained in terms of
a reduced a-helix content, as confirmed by the quantitative data reported in Table
1. At decreasing pH, the δCH2 band at 1450 cm-1
increased its FWHM from 35.5
to 37.1 cm-1
(Table 1), suggesting an increased disorder also in the hydrophobic
component.
Page 123
Chapter 7
121
According to Chourpa et al.,[18]
the Raman bands of phenylalanine at about
1000 and 1035 cm-1
were found to increase in intensity upon pH decrease,
suggesting a change in the environment of this amino acid.
Upon pH decrease, the 880 cm-1
band decreased in intensity, while no
changes were detected in the intensity of the 760 cm-1
band. At acidic pH, the
I855/I830 intensity ratio was the same as at neutral pH (Table 1). In contrast, the
distribution of the disulphide bridges conformations was significantly affected by
the pH value (Figure 3). At acidic pH, although the gauche-gauche-gauche (g-g-
g) conformation remained the prevailing one, its content appeared significantly
decreased if compared with neutral pH (39% versus 49%); the trans-gauche-trans
conformation underwent a less pronounced decrease (from 37 to 33%), while the
gauche-gauche-trans (g-g-t) conformation doubled its content (from 14 to 28%).
By decreasing pH, also the hydrogen bonding patterns were found to vary, as
suggested by the changes in the 3500-3200 cm-1
range.
Figure 5A reports the Raman spectra of lyophilized Glia before and after
treatment with the 3-EcC at acidic pH; the spectrum of 3-EcC is reported for
comparison. The spectrum of the treated sample showed also the bands due to the
bonded 3-EcC, with a lower relative intensity than at neutral pH, suggesting a
higher protein/3-EcC ratio and thus a lower affinity towards the ligand. The IR
spectra (Figure 5B) confirmed this finding.
The trend of the spectra showed that also at acidic pH, the complexation
with 3-EcC favoured an enrichment in α-helix conformation, as confirmed by the
trend of the above mentioned marker bands of this structure at about 1340 and 930
cm-1
, and the quantitative data reported in Table 1. At acidic pH the extent of
transformation into α-helix appeared more pronounced, in consideration of the
fact that in the untreated sample the content of this conformation was lower.
Page 124
Chapter 7
122
Figure 5. Raman (A) and IR (B) spectra of lyophilized Glia before (black) and after
treatment with 3-EcC (red) at acidic pH; the spectrum of 3-EcC (green) is reported for
comparison. The bands prevalently due to phenylalanine (F), tyrosine (Y), tryptophan (W),
glutamine (Q) and proline (P) are indicated. The bands due to the bonded 3-EcC are
marked with an asterisk.
At the same time, the contents of -sheet and turns conformations decreased
(Table 1). The FWHM of the δCH2 band showed a more pronounced decrease
(from 37.1 to 34.9 cm-1
), attaining values similar to those obtained at neutral pH
(Table 1).
The changes in Phe and Trp environment were less pronounced than at
neutral pH (the bands at about 1033, 1004, 880 and 760 cm-1
changed less
significantly than at neutral pH); the I855/I830 remained constant upon the
treatment, suggesting that no changes in Tyr environment occurred (Table 1).
With regards to disulphide conformations, the spectra clearly showed a weakening
Page 125
Chapter 7
123
of the components at about 540 and 520 cm-1
. The curve fitting analysis
confirmed this qualitative result, showing a decrease of the contents of the trans-
gauche-trans and gauche-gauche-trans conformations and a parallel increase in
the more stable gauche-gauche-gauche conformation (Figure 3).
7.2.2 NMR Results
The spectra reported in Figure 6 show that under acidic conditions 3-EcC
interacts with Glia. By analyzing the spectra c), it is possible to note that the
entire molecule is involved in the interaction as reported in the case of Cya with
Glia.[6]
To gain more insights into the differences of interaction with the ligands
(Cya versus 3-EcC), Raman spectroscopy was used.
Figure 6. a)1H-NMR spectrum of 3-EcC in D2O/DCl; b)
1H-NMR spectrum of 3-EcC
and Glia in D2O/DCl c) STD spectrum of 3-EcC and Glia in D2O/DCl
7.3 Cyanidin (Cya) and Glia at acidic pH
7.3.1 Raman Results
Figure 7A reports the Raman spectra of lyophilized Glia before and after
treatment with Cya; the spectrum of Cya is reported for comparison.
Page 126
Chapter 7
124
Upon treatment with Cya, some new bands ascribable to the anthocyanidin
appeared (marked with a circle), although often significantly shifted with respect
to their position in pure Cya. As can be easily seen, the strongest band of Cya
appeared at 1331 cm-1
and was assigned to an inter-ring bond stretching
mode;[39,40,41]
in the treated Glia sample, no band was observed at a similar
wavenumber. Therefore, it may to be considered that this band, possibly shifted in
frequency contributes to the strengthening of the band at 1320 cm-1
. This result
would suggest, according to Merlin et al.,[41]
a change in the delocalized π-
electron density.
The quantitative data reported in Table 1 suggest that the interaction with
Cya determined an enrichment in the α-helix content more pronounced than upon
3-EcC complexation. This result was confirmed by the trend of the bands at 1270
and 1100 cm-1
, which significantly increased in intensity. At the same time, the
contents of β-sheet and turns conformations decreased, as observed upon 3-EcC
complexation (Table 1).
Due to the contribution of the anthocyanidin to the band at about 1450 cm-1
,
it could not be used to normalize the spectra. Therefore, no information can be
obtained on the possibly changed environment of Trp and Phe. In contrast, curve-
fitting analyses allowed to gain insight into the changes of Tyr environment. Upon
treatment with Cya, the I855/I830 ratio decreased to 0.60 (Table 1), i.e. to a more
buried Tyr state, differently from what observed for the other samples. Also
Linlaud et al.[23]
have observed a different behavior of the Tyr intensity ratio
depending on the kind of hydrocolloid added to gluten proteins.
The distribution of the disulphide conformations cannot be evaluated due to
the contribution of Cya, which showed bands at 540, 520 and 505 cm-1
.
Also the treatment with the anthocyanidin altered the hydrogen bonding
patterns, as suggested by the changes in the 3500-3000 cm-1
range, where OH
and NH modes fall.
Page 127
Chapter 7
125
Figure 7. Raman (A) and IR (B) spectra of lyophilized Glia before (a) and after
treatment with Cya (b) and with Cya and 3-EcC (c) at acidic pH; the spectra of Cya (e) and
3-EcC (d) are reported for comparison. The bands prevalently due to phenylalanine (F),
tyrosine (Y), tryptophan (W), glutamine (Q) and proline (P) are indicated. The bands
ascribable to Cya are marked with a circle.
7.4.1 NMR Results
NMR experiments on Glia and Cya are reported in a previous paper and
showed that the entire molecule of Cya interacts with Glia.6 No favorite binding
site was detected by STD experiments. It is possible to suppose that Cya is
completely included in a cavity of the gliadins (Glia) networks.
Page 128
Chapter 7
126
7.4 A complex between coumarin and cyanidin? Influence on gliadin (Glia)
secondary structure
7.4.1 Raman Results
Figure 7A shows the Raman spectrum of lyophilized Glia after treatment
with Cya and 3-EcC (Figure c) at acidic pH. The bands assignable to Cya
(marked with a circle) appeared even more intense than in the spectrum of Glia
treated only with Cya. Interestingly, no bands due to 3-EcC were observed (in
particular, no band at about 1760 cm-1
was detected and no strengthening near
1205 cm-1
was observed). The IR C=O stretching vibration range confirmed this
finding: no band above 1700 cm-1
was detected (Figure 7B). Upon treatment with
the anthocyanidin, the enrichment in α-helix and the decrease in β-sheet and turns
were even more pronounced than upon treatment with the only 3-EcC, as
suggested by the above discussed spectral features, as well as by the quantitative
data reported in Table 1.
Upon treatment with Cya and 3-EcC, the I855/I830 ratio decreased to 0.84,
i.e. Tyr residues appeared more buried than in Glia, but less than in Glia treated
with Cya alone (I855/I830 = 0.60, see Table 1). Also the treatment with Cya and 3-
EcC altered the hydrogen bonding patterns, as suggested by the changes in the
3500-3000 cm-1
range, where OH and NH modes fall.The vibrational results
would suggest that the species prevalently interacting in the complex is Cya;
however, 3-EcC indirectly favored the complex formation with Glia.
To gain more insights into this behavior, the possible formation of a
complex between Cya and 3-EcC has been investigated. Actually, by mixing Cya
and 3-EcC in the HCl aqueous solution in a 1:1 molar ratio, an insoluble solid is
formed; this could indicate the existence of an interaction between Cya and 3-
EcC. To clarify this aspect, the aqueous solution was lyophilized and the obtained
solid was analyzed by Raman and IR spectroscopy; the spectra are reported in
Figure 8. The theoretical Raman spectrum of the complex was calculated by
summing the normalized spectra of the ligands.
Page 129
Chapter 7
127
The experimental Raman spectrum reported in Figure 8A showed bands of
both ligands and no significant shifts in their wavenumber position were observed
(in particular, for the C=O stretching bands of 3-EcC at about 1760 and 1715 cm-
1). The major differences between the experimental and theoretical spectra were
observed in the δCH2 bending region, i.e. near 1450 cm-1
, suggesting that
hydrophobic interactions occur between the two molecules; moreover, the
difference in intensity of the band at 1334 cm-1
may be interpreted as above, i.e. as
marker of a change in the delocalized π-electron density, according to Merlin et
al.[41]
Complementary information was obtained by IR spectroscopy; the spectrum
of the complex (Figure 8B) was highly dominated by the bands of 3-EcC. Most of
them did not appear shifted in their wavenumber positions; however, significant
changes were observed in the C=O stretching region of 3-EcC.
Upon interaction, the band at 1758 cm-1
was found to slightly shift and
change its profile while the component at 1709 cm-1
appeared less distinct. These
trends would suggest the involvement of the C=O groups into the complex
formation. Only few bands ascribable to Cya were distinctly observed (indicated
with a circle); upon interaction, the C=C ring stretching vibration of Cya appeared
significantly shifted in wavenumber position (from 1635 to 1641 cm-1
); the band
assignable to an inter-ring bond stretching mode at 1327 cm-1
shifted to 1332 cm-
1, confirming a change in the delocalized π-electron density. Moreover, new
bands, absent in the spectra of the ligands, were detected in the C=C ring
stretching range at 1581, 1538 and 1519 cm-1
.Vibrational results are in agreement
with the theoretical calculations reported below.
Page 130
Chapter 7
128
Figure 8. (A) Experimental (a) and theoretical (b) Raman spectra of the Cya+3-EcC
complex; the theoretical spectrum was obtained by summing the normalized spectra of the
ligands (Cya (d), normalized to the 1390 cm-1
band; 3-EcC (c), normalized to the 1762 cm-1
band); (B) Experimental IR spectra of the Cya+3-EcC complex (a), Cya (c) and 3-EcC (b).
The bands ascribable to Cya and 3-EcC are marked with a circle and an asterisk,
respectively.
7.4.2 NMR Results
Attempts to dissolve in a different solvent the solid obtained in the HCl
aqueous solution (and also in the D2O/DCl solution) by mixing 3-EcC and Cya
led to a different ratio of the two molecules in the solution. To avoid the formation
of the solid compound upon interaction between 3-EcC and Cya, at first 3-EcC
was mixed with Glia and the 1HNMR and STD spectra were recorded (Figure 9
b,c). The spectrum in Figure 9c shows the interaction between Glia and 3-EcC.
Page 131
Chapter 7
129
After the addition of Cya, we did not observe the formation of any insoluble
solid because it is possible that the inclusion in Glia networks of Cya and 3-EcC
did not permit the formation of the complex.
Figure. 9.a)1H-NMR spectrum of 3-EcC in D2O/DCl; b)
1H-NMR spectrum of 3-EcC
and Glia in D2O/DCl; c) STD spectrum of 3-EcC and Glia in D2O/DCl; d) 1H-NMR spectrum
of 3-EcC, Glia and Cya in D2O/DCl; e) STD spectrum of 3-EcC, Glia and Cya in D2O/DCl.
(*signals belonging to Cya; # signals belonging to Cya and 3-EcC)
The 1H-NMR spectrum of this solution (Figure 9d) shows the signals of
both Cya and 3-EcC, even if 3-EcC signals are broader than in the absence of
Cya (Figure 9b), The STD NMR spectrum of Glia-Cya-3-EcC complex (Figure
9e) shows that both Cya and 3-EcC completely interacts with Glia; also in this
case, the 3-EcC signals were broad and slightly shifted to high fields. This shift is
in agreement with the data reported in literature for the complex formed between
malvin chloride (an anthocyan) and esculin (a coumarinic derivative) named co-
pigment,[42]
even if the interaction between Cya-3 and EcC gives broader NMR
signals.
Page 132
Chapter 7
130
7.4.3 UV-Vis analysis
As shown in Figure 10, the UV-vis spectrum of Cya displays an intense
absorption maximum at about 510 nm which is responsible for its red color, while
the 3-EcC spectrum shows absorption bands only in the UV region, i.e. at about
296 nm. The spectrum of the solution containing both compounds was compared
with the simple arithmetical sum of the spectra of the isolated species; as shown in
Figure 10, no significant differences can be observed. The copigmentation usually
shows both batochromic and hyperchromic shift, while in our case only a slight
hypochromic effect in the UV region of the spectrum is appreciable (Figure 10).
This is not a good reason to discard the hypothesis of the formation of a complex.
Actually, the above mentioned shifting effects are mainly due to the formation of
complexes dominated by charge transfer interactions, while, for example,
complexes dominated by hydrogen bonding interactions do not show strong
absorption shifting.
With the aim to better understand the nature of the interactions between Cya
and 3-EcC, a theoretical investigation was carried out.
Figure 10. Experimental UV-vis spectra of the aqueous acidic solutions containing Cya,
3-EcC, Cya and 3-EcC . The calculated spectrum was obtained by summing the spectra of
Cya and 3-EcC.
0,00
0,05
0,10
0,15
0,20
0,25
0,30
0,35
0,40
0,45
0,50
250 300 350 400 450 500 550 600 650
Cya
3-EcC
Cya+3-EcC (exp)
Cya+3-EcC (calc)
Page 133
Chapter 7
131
7.4.4 Theoretical calculation
All DFT calculations were carried out with the Gaussian 09 program
package.[43]
All geometries were fully optimized by using the B97X-D/6-31G(d)
level of theory,[44]
which is known to produce reliable geometries for molecules
bonded by non-covalent interactions. Frequencies were calculated at the same
level as the geometry optimization to verify the nature of the stationary points and
to obtain zero-point vibrational corrections. The basis set superposition error
(BSSE) corrections was calculated by using the Boys-Bernardi counterpoise
correction scheme,[45]
with the automated procedure available in the Gaussian 09
software package.
Solvent (water) effects were introduced during the optimization step by
using the PCM model.[46]
Binding energies were calculated as the difference
between the energy of the complexes and the sum of the energy of the isolated
species. The chlorine counterion of the cyanidine moiety was not taken into
account during the calculations since the inclusion of such kind of fragment
usually does not improve the final results; we only balance the global charge by
adding a positive charge in the cyanidine moiety.
We performed the geometry optimization for both molecules and we
calculated their relative energies; then we optimized the geometries of some
complexes that could be intuitively hypothesized to be formed. Only the complex
with the lowest energy was taken into account; its structure is reported in Figure
11.
As depicted in Figure 11, the aromatic rings of Cya and 3-EcC are in a
stacked conformation; however, the non-complete overlap (probably due to the
high number of oxygen atoms which favour electrostatic repulsions) does not
allow for charge transfer interactions, which are usually accompanied by
bathocromic shifts in the visible region of the electromagnetic spectra. It is also
possible to note some hydrogen bonding interactions, which are promoted by the
high content of hydroxyl functions present in both Cya and 3-EcC.
Page 134
Chapter 7
132
The results of the calculations also show that the binding energy of the
complex is about 13 Kcal/mol, which is compatible with all the different kinds of
interactions observed.
Figure 11. Geometry of the Cya-3EcC complex, obtained as the lowest energy-
structure by DFT calculations.
The theoretical findings are in agreement with the results obtained by both
UV-Vis and vibrational spectroscopies. Actually, the former technique only
displayed a slight hypochromic shift in the UV region, while the latter showed a
change in the C=C ring stretching (caused by hydrophobic or stacking
interactions) and in the 3-EcC C=O stretching (caused by hydrogen bonding
interactions).
Page 135
Chapter 7
133
Conclusion
The interaction between Glia and 3-EcC and/or Cya leads to a change in
the secondary structure of the proteins; in particular, Raman spectra showed that
both molecules produce a similar effect on the Glia structure (Table 1).
3-EcC proved to be useful in the evaluation of the Glia conformational
changes at neutral pH because it is structurally similar to Cya, but is not so
sensitive to pH changes. In fact, it was not possible to use Cya in neutral
conditions as it is not stable at this pH value. Furthermore, 3-EcC allowed to
screen the change in the disulphide bridge conformation both in neutral and acidic
conditions (Figure 3). These bridges are mostly present in α-gliadin (main
responsible for coeliac disease) and the change in the distribution of the
disulphide bridge conformations seems to confirm that the interaction involved
this type of Glia.[47]
The interaction of Glia with 3-EcC and/or Cya led to an
increase in a-helix conformation and a decrease in β-sheet and turns (Table 1). In
the presence of both molecules, this effect was more marked.
The obtained NMR data showed that both Cya and 3-EcC interact with
Glia. In the STD NMR spectrum (Figure 9e), the signals belonging to the
aromatic ring of 3-EcC were quite large and slightly shifted to higher field. This
would suggest that 3-EcC and Cya form a complex. Raman spectroscopy did not
detect the 3-EcC bands in the Glia-3-EcC-Cya system; however, the secondary
structure of Glia underwent changes more significant than in the presence of Cya
alone, suggesting that 3-EcC plays a significant role in the Glia-Cya-3-EcC
complex formation. The results obtained in this study provide new insights into
anthocyanidins–gliadins (Glia) interactions and may have relevance to human
health, in the field of the attempts to modify gluten proteins to decrease allergen
immunoreactivity. As reported in a recent review,[47]
three significant protein
structure elements may be identified as responsible for allergenicity. The first is
short “toxic” amino acid sequences that probably function as antibody-binding
epitopes in immunological reactions. Other significant structural elements to be
considered are b-turns, giving allergen particles a specific conformation, and
disulphide (SS) bonds which stabilize that structure. Any treatment able to alter
Page 136
Chapter 7
134
these structural elements may potentially decrease allergen immunoreactivity. In
this light, the investigated ligands (modifying the secondary structure and in
particular the turns content, as well as the disulphide bridge conformation) may be
of interest to decrease allergen immunoreactivity.
References
[1] A. S. Tatham, and P. R Shewry, Journal of Cereal Science, 1995, 22, 1.
[2] H. Weiser, Food Microbiology, 2007, 24, 115.
[3] K. Bürk, A. Melms, J.B. Schulz, J. Dichgans, Ann. Neurol., 2001, 50, 827.
[4] E. Varjonen, E. Vainio, K. Kalimo, Allergy, 2000, 55, 386.
[5] H. Wieser, Acta Paediatrica, 1996, Suppl. 412, 3.
[6] P. Mazzaracchio, S. Tozzi, C. Boga, L. Forlani, P. G. Pifferi, and G. Barbiroli, Food
Chemistry, 2011, 129, 1100.
[7] D. S. Antal, G. Garban, and Z. Garban ,The Ann Univ. Dunarea de Jos of Galati, Food Tech,
2003, VI, 106–115.
[8] S. A. Brown in The Biochemistry of Plants, Vol. 7 Academic Press, Inc., New York, 1981,
269.
[9] K.C. Fylaktakidou, D. J. Hadjipavlou-Litina, K.E. Litinas, D. N. Nicolaides, Current
Pharmaceutical Design, 2004, 10, 3813.
[10] S.S. Bhattacharyya, S.Paul, S.K. Mandal, A. Banerjee, N.Boujedainib, A.R. Khuda-
Bukhsh, European Journal of Pharmacology, 2009, 614, 128.
[11] I. Kostova, S. Bhatia, P. Grigorov, S. Balkansky, V.K. Parmar, A. Prasad, L.Saso, Current
Medicinal Chemistry, 2011, 18, 3929.
[12] R.G. Kalkhambkar, G.M. Kulkarni, C.M. Kamanavalli, N. Premkumar, S.M.B. Asdaq,
C.M. Sun, Europen Journal of Medicinal Chemistry, 2008, 43, 2178.
[13] J.R.S. Hoult, and M. Paya, General Pharmacology: The vascular system, 1996, 27, 713.
[14] A.T. Tu, in Raman Spectroscopy in Biology: Principles and Applications, John Wiley and
Sons, Ltd., Chichester, 1982
[15] R. J. Tuma, Raman Spectroscopy, 2005; 36, 307.
[16] B.G. Frushour, J.L. Koenig, Biopolymers 1974; 13: 455.
[17] E.W. Blanch, D.D. Kasarda, L. Hecht, K. Nielsen, and L.D. Barron. Biochemistry, 2003,
42, 5665.
[18] I. Chourpa, V. Ducel, J. Richard, P. Dubois, and F. Boury. Biomacromolecules 2006, 7,
2616.
Page 137
Chapter 7
135
[19] B. Bochicchio, A. Aït-Ali, A.M.Tamburro, A.J. Alix, Biopolymers, 2004, 73(4) 484.
[20] C. K. Smith, and L. Regan, Acc. Chem. Res., 1997, 30, 153.
[21] D.Pal, and P. Chakrabarti, Acta Crystallographica, 2000, D56, 589.
[22] M.A. Kelly, B.W. Chellgren, A.L. Rucker, J.M. Troutman, M.G. Fried, A.F. Miller, and
T.P. Creamer, Biochemistry 2001, 40, 14376.
[23] N. Linlaud, E. Ferrer, M.C. Puppo, C. Ferrero. Journal of Agricolture and Food Chemistry,
2011, 59, 713.
[24] A. Tinti, M. Di Foggia, P. Taddei, A. Torreggiani, M. Dettin, C. Fagnano, Journal of
Raman Spectroscopy, 2008, 39, 250.
[25] M. Di Foggia, P. Taddei, C. Fagnano, A. Torreggiani, M. Dettin, S. Sanchez-Cortes, A.
Tinti, Journal of Molecular Structure, 2009, 924-926, 120.
[26] I.W. Lewin In Advances in Infrared and Raman Spectroscopy, vol. 11, Chapter 1, Clark
RJH, Hester RE (eds). John Wiley & Sons: New York, 1984.
[27] S.W. Ellepola, S.M. Choi, D.L. Phillips, C.Y. Ma. Journal of Cereal Science, 2006, 43, 85.
[28] T. Kitagawa, T. Azuma, K. Hamaguchi. Biopolymers, 1979, 18, 451.
[29] M. Xu, V.V. Ermolenkov, W. He, V.N. Uversky, L. Fredriksen, I.K. Lednev. Biopolymers,
2005, 79, 58.
[30] P.G. Hildebrandt, R.A. Copeland, T.G. Spiro, J. Otlewskill M. Laskowski Jr., F.G.
Prendergast, Biochemistry 1988, 27, 5426.
[31] M.N. Siamwiza, R.C. Lord, M.C. Chen, T. Takamatsu, I. Harada, H. Matsuura and T.
Shimanouchi, Biochemistry, 1975, 14 4870.
[32] S.A. Overman, K. Aubrey, N.S. Vispo, G. Cesareni and G.J. Thomas Jr., Biochemistry,
1994, 34, 1039.
[33] Z.Q. Wen, A. Armstrong and G.J. Thomas Jr., Biochemistry, 1999, 38, 3148.
[34] Z. Arp, D. Autrey, J. Laane, S.A. Overman and G.J. Thomas Jr., Biochemistry, 2001, 40,
2522.
[35] G.J. Thomas Jr., Biopolymers (Biospectroscopy), 2002, 67, 214.
[36] P. Taddei, T. Asakura, J. Yao and P. Monti, Biopolymers, 2004,75, 314.
[37] E.A. Carter, J.S. Church, R.J. Denning, P.M. Fredericks, Spectrochimica Acta, 1994, 50A,
1927.
[38] E.G. Ferrera, A.V. Gómez, M.C. Anòn, M.C. Puppo. Spectrochimica Acta Part A, 2011,
79, 278.
[39] M. Foster, R.B. Girling, and R.E. Hester, Journal of Raman Spectroscopy, 1982, 12, 36.
[40] D.J. Barker, R.P. Cooney, and L.A. Suners, Journal of Raman Spectroscopy, 1985, 16, 265.
[41] J.-C. Merlin; A. Statoua, J.-P. Cornard. M. Saidi-Idrissi, R. Brouillard, Phytochemistry,
1994, 35 ,227.
Page 138
Chapter 7
136
[42] E. Haslam, T.V. Mistry, Y. Cay, T.H. Lilley, Journal of Chemical Society. Perkin
Transaction 2, 1991, 1287.
[43] Gaussian 09, Revision B.01, Frisch, M. J.; Trucks, G. W.; Schlegel, H. B.; Scuseria, G. E.;
Robb, M. A.; Cheeseman, J. R.; Scalmani, G.; Barone, V.; Mennucci, B.; Petersson, G. A.;
Nakatsuji, H.; Caricato, M.; Li, X.; Hratchian, H. P.; Izmaylov, A. F.; Bloino, J.; Zheng, G.;
Sonnenberg, J. L.; Hada, M.; Ehara, M.; Toyota, K.; Fukuda, R.; Hasegawa, J.; Ishida, M.;
Nakajima, T.; Honda, Y.; Kitao, O.; Nakai, H.; Vreven, T.; Montgomery, Jr., J. A.; Peralta,
J. E.; Ogliaro, F.; Bearpark, M.; Heyd, J. J.; Brothers, E.; Kudin, K. N.; Staroverov, V. N.;
Kobayashi, R.; Normand, J.; Raghavachari, K.; Rendell, A.; Burant, J. C.; Iyengar, S. S.;
Tomasi, J.; Cossi, M.; Rega, N.; Millam, J. M.; Klene, M.; Knox, J. E.; Cross, J. B.;
Bakken, V.; Adamo, C.; Jaramillo, J.; Gomperts, R.; Stratmann, R. E.; Yazyev, O.; Austin,
A. J.; Cammi, R.; Pomelli, C.; Ochterski, J. W.; Martin, R. L.; Morokuma, K.; Zakrzewski,
V. G.; Voth, G. A.; Salvador, P.; Dannenberg, J. J.; Dapprich, S.; Daniels, A. D.; Farkas,
Ö.; Foresman, J. B.; Ortiz, J. V.; Cioslowski, J.; Fox, D. J. Gaussian, Inc., Wallingford CT,
2009.
[44] J. D. Chai and M. Head-Gordon, Phys. Chem. Chem. Phys., 2008, 10, 6615.
[45] S. F. Boys and F. Bernardi; Mol. Phys., 1970, 19, 553.
[46] J. Tomasi, B. Mennucci, R. Cammi, Chem. Rev., 2005, 105, 2999.
[47] J. Waga Pol. J. Food Nutr. Sci. 2004, 13/54 (4), 327.
Page 139
Chapter 8
137
Chapter 8
Theoretical study on the spectroscopic properties
of iron complexes
Over the past decades dye-sensitized solar cells (DSSC) have attracted
remarkable attention as one of the most promising technologies toward cost-
effective light to energy conversion.[1-3]
There is actually an increasing demand,
both from academic and industrial domains, for the research of new dyes that can
improve the, still, not high efficiency, especially compared to the one obtained by
silicon based solar cell3. Indeed, one has to consider that the latter are more
efficient in terms of photon to electricity but show the disadvantage of high cost
and high energy consumption production process, implying a long pay-back time.
DSSCs are composed of different elements[1-3]
: a nanocrystalline semiconductor
film, a dye sensitizer, a redox electrolyte and a counter electrode. Among these
the dye sensitizer represents one of the critical components to achieve a high
power conversion efficiency. Strictly speaking an ideal dye should absorb as
much visible light as possible and channel the electrons in the conduction band of
the semi-conductor. Together with direct DSSC in the last years there has been
some interest also in the so called inverse Grätzel solar cells.[4]
In the latter upon
light excitations a hole, instead of an electron, is injected in the semi-conductors
by the dye.
Most of high efficiency DSSCs, starting from the original works of
Grätzel[1]
, are based on Ruthenium(II)-polypyridyl complexes[3]
, which shows
wide absorption range from the visible to the near infrared (NIR) region with, for
the last generation devices, an overall power conversion efficiency approaching
12%.[3]
The high efficiency showed by ruthenium based dyes has implied an
active field of research on such compounds, and many different ligands are
proposed and tested.[5-31]
The disadvantage of these complexes is related to the use
Page 140
Chapter 8
138
of Ruthenium, a rare and expensive metal that can limit its use in large scale
production. Because of this, many works are focused in finding cheaper dyes,
such as full organic, polymeric or cheaper metal-based complexes.[32]
Let us also
cite that, one important point in building efficient DSSCs relies on the proper
combination of the redox mediator with the proper dye, since the two components
can interplay leading to a considerable variation in the efficiency of the cell.[16]
In some recent works Welter and co-workers synthesized two complexes
of iron with salicyloylhydrazono dithiolane ligand (Figure 1), which can show
interesting properties and potential application as dye sensitizers for solar cells.[33-
35] These two new colored complexes undergo spontaneous photo-reduction and
photo-isomerization following a rather complex mechanism.
In particular the photo-isomerization coupled with a photo-reduction could
be exploited in order to store energy produced from light conversion. To be used
as efficient DSSC sensitizers the complex should show charge transfer
excitations, appearing in the visible and near infrared region, and inducing charge
separation and hence a possible holes or electrons injections. Obviously the
interest on such a system will mainly arise from the use of a cheap and ubiquitous
metal, like iron, that could strongly diminish economic costs and environmental
impact.
Figure 1. Iron(III) and iron(II) complexes molecular structures; notethe different
coordination between the two oxidation states.
Page 141
Chapter 8
139
The interest and the possible use of iron in DSSC was, for instance,
evidenced by recent works of Ferrere that have synthesized and tested iron
complexes with bipyridyl ligands which shown relatively high quantum yield.[32]
In order to maximize the performance of iron-based complexes two
aspects should be considered, first of all ligands should be able to enlarge the
spectral width as much as possible, in particular toward the near infra-red region,
maintaining relatively high absorption intensities. Secondly the electron, or hole
in the case of inverse DSSC, transfer should be made as easy and efficient as
possible, while, at the contrary, the unwanted recombination with the mediator
leading to dark current phenomena should be avoided. A rationalization of this
latter aspect, and the role played by ligands modification, can be realized by a
carefully analysis of the electron density reorganization from ground to excited
state.[6, 17,18]
Obviously quantum chemistry deploys there all its strength and can
ultimately lead to efficient and rational molecular design.
In this work we studied at density functional theory (DFT) and at time
dependent density functional theory (TD-DFT) levels of theory the properties of
the originals iron II and iron III complexes (Figure 1). The absorption spectrum,
inside the Franck-Condon approximation, has been considered to show the
possibility to reproduce experimental results for this kind of complicated systems.
The complex nature of the excited states has also been considered and tackled by
using Natural Transition Orbitals (NTO) formalism.[36-38]
The complex interplay between different phenomena taking place in the
photo-isomerization and photo-reduction process[33-35]
, crucial for energy storage,
will instead make the object of a future contribution. Iron, in both +2 and +3
oxidation states, has a partially filled d shell and can therefore exhibit different
multiplicities, often depending on the strength of the ligands field. For this
reasons, even if experimentally the two complex have been found to have the
maximum spin, all the possible spin multiplicities have been considered in the
present work.
Page 142
Chapter 8
140
Because of the rather peculiar spectroscopic properties of this class of
complexes, and the need to correctly reproduce crucial details, an analysis of the
performance of different exchange-correlation functionals will be presented. In
particular we will focus on the role of long-range corrected functionals, since we
are mostly interested in charge transfer transitions that dominate the visible part of
the spectrum and are crucial for charge injection process. Moreover, we will also
analyze the subtle interplay between the functional used to obtain the equilibrium
geometry and the one used to compute vertical transitions.
8.1 Computational methods
All computations have been performed by using Gaussian09 code[39]
at
DFT and TD-DFT level. Environment effects have been taken into account by
using PCM model[40]
for geometry optimization and for excited states
calculations. Coherently with experimental procedure n,n-dimethylformamide
parameters have been used to simulate the solvent.
Transition states energies and oscillator strengths (intensities) have been
computed in the framework of the Franck-Condon principle from the optimized
ground state geometry. In order to incorporated in a trivial way vibrational and
other experimental effects, vertical transitions have been convoluted with
Gaussian functions of fixed half-length width of 0.3 eV.
Geometry optimization have been performed using the LANL2DZ[41]
basis
set as developed by Hay et al., the latter includes electron core pseudopotentials
(ECP) for heaviest atoms such as iron. Geometry optimization has been performed
for all the possible spin states in order to verify the relative stability.
Optimizations have been performed using the B3LYP[42]
exchange
correlation functionals and the long range corrected CAM-B3LYP.[43]
Excited states have been computed at TD-DFT level using the LANL2DZ
basis. To assess for the quality of the basis some tests have been performed using
an augmented triple zeta basis. Since the difference between the spectra obtained
Page 143
Chapter 8
141
with the two basis is negligible, in particular for the visible region of the
spectrum, in the following we will present results obtained with the smaller
double zeta basis set only.
Excited states have been computed as vertical excitations using TD-DFT
approach. The number of the calculated excited states is chosen for every
functional tested in order to span the experimental absorption spectrum range
(between 80 and 120 singlet states). We also performed a benchmark of different
functionals checking their reliability in reproducing absorption spectra, in
particular we considered: B3LYP, PBE0[44]
and M06-2X[45]
hybrid functionals,
the long-range corrected CAM-B3LYP, LC-PBE[46]
and the long-range and
dispersion corrected functional B97X-D.[47]
The nature of the main excitation has been analyzed with the help of the
Natural Transition Orbitals (NTOs)[36-38]
, in which a transition is represented,
most of the time, by a simple couple of orbitals: the occupied orbital, i.e. the
orbital left empty from the electron upon excitation, and the virtual orbital, i.e. the
orbital which describes the electron in the excited state. NTOs have been obtained
by a proper post-processing of the Gaussian output file using Nancy-EX
(http://nancyex.sourceforge.net/) a GPL code developed in our laboratory.
8.2 Functionals benchmarking
As previously cited, we performed a benchmark to evaluate the
performance of the different classes of functionals on the calculation of the
UV/VIS spectra. Moreover, the effect of the functional chosen for the geometry
optimization, and therefore of the different equilibrium geometries, on the final
absorption spectrum was also considered.
Since the experimental spectrum of the iron(II) complex is missing we
performed this benchmark only on the iron(III) complex to compare the computed
spectrum with the experimental one.
Page 144
Chapter 8
142
Starting from the geometry obtained by X-Ray diffraction analysis we
optimized the structure of the complex at B3LYP and CAM-B3LYP level of
theory for the three possible spin states.
As shown in Table 1 both functionals give the same energy order for the
different multiplicities. In agreement with experimental data, the sextuplet is
always the ground state. The doublet and the quartet are between 0.4 and 0.5 eV
higher energy than the sextuplet. Note that the energy difference between doublet
and quartet is much less important and close to 0.1 eV
Table 1. Relative energies (eV) of Iron(III) complex for different multiplicity states with
respect to the sextuplet ground state obtained with different functionals.
B3LYP CAM-B3LYP
Doublet 0.38 0.38
Quartet 0.45 0.49
Sextuplet 0.00 0.00
In Figure 2 we report the experimental spectrum together with the TDDFT
calculated ones. Different combinations of functionals were used to compute
optimized geometry and vertical transitions, as a convention, in the following
nomenclature, we will indicate first the functional used for TD calculations
followed by the one used for geometry optimization. Notice that the experimental
spectrum presents an intense and broad maximum in the UV region of the
spectrum extending from 250 to 350 nm. Moreover a much lesser intense
absorption band is present in the visible region centered at about 520 nm (see the
zoom panel in Figure 2). If we concentrate on the visible part of the spectrum one
can see that the choice of the functional used for geometry optimization is much
more important than the choice of the functional used for the TD calculations.
Page 145
Chapter 8
143
Figure 2. Absorption spectrum of Iron(III) complex calculated with different functionals vs
the experimental one. On the left the functional used for TD calculation and on the right the
functional used for geometry optimization (wavelenght in nm, intensities in arbitrary units).
Indeed when using the CAM-B3LYP optimized geometry we obtain an
absorption maximum in better agreement with experimental results whatever
functional is used for the calculation of the excited states, with a deviation of
about 25 nm for B3LYP. On the other hand when using B3LYP for geometry
optimization the value of the absorption maximum is significantly red-shifted,
with deviations going from 70 to 100 nm. The worst result is the one obtained
using CAM-B3LYP for vertical excitations and B3LYP for geometry
optimization. Note anyway that long-range corrected functional overperform the
hybrid one in giving a much broader absorption band, coherently with
experimental evidences. As far as the near UV region is considered none of the
methods is able to correctly reproduce the broad absorption spectrum. In that case
the influence of the optimized geometry appears less important than in the
Page 146
Chapter 8
144
previous one with the role of the functional used for TDDFT calculation being the
dominant one. Indeed B3LYP gives absorption maximum at about 330 nm,
whatever functional used for geometry optimization, while CAM-B3LYP
maximum appears at about 280 nm. The somehow worse agreement shown in the
UV region can be due to the limited size of the basis set used as well as to the
necessity to compute more excited states.
These results show that the choice of the functional for the geometry
optimization, that is sometimes not sufficiently addressed, can bring important
differences on the final calculated absorption spectrum, even when the deviations
between the optimized geometries are quite small. This effect may be due to the
internal p conjugation of salicyloylhydrazono dithiolane ligands as well as to the
interaction of the ligands with iron, that necessitate of long-range corrected
functionals to recover the long-range 1/R behavior.
Considering the previous results we decided to assess for the performance
of different functionals in computing absorption spectrum starting from CAM-
B3LYP optimized geometries. As described in computational detail, we want to
consider functionals built using different strategies and including different effects,
such as long-range corrections, in order to understand how taking into account
these contributions can improve the accuracy in reproducing the experimental
spectrum.
In Figure 3 we report the TD-DFT absorption spectrum computed with all
the different functionals. If , in particular, we analyze in detail the visible region
of the spectrum we can see that the M06-2X and LC-wPBE functionals perfectly
fit the absorption maximum. Moreover M06-2X give a pretty broader absorption
band with a general shape and intensity that are in a very good agreement with the
experimental one.
On the other hand PBE0 functional show a blue shift of about 50 nm,
while B3LYP, wB97XD and CAM-B3LYP experience a significant red shift
going up to 50 nm. Notice, as already underlined, that B3LYP experiences a less
pronounced deviation (about 25 nm) from the experimental maximum than long-
Page 147
Chapter 8
145
range corrected functionals, even if the band shape and intensities are less well
reproduced.
Again none of the used functionals is able to correctly reproduce the large and
intense experimental band in the near UV, with again hybrid functionals (B3LYP
and PBE0) presenting maxima at shorter wavelengths than the others, while long
range-corrected as well as M06-2X fail in reproducing the absorption at about
350 nm, showing slightly blue-shifted maxima.
Figure 3. Comparison between absorption spectrum of iron (III) complex calculated with
different functionals vs the experimental one. In the inset an expansion of the visible region
(wavelenght in nm, intensities in arbitrary units).
This functionals benchmark for TD calculation show that although M06-
2X and LC-wPBE represent very well the visible part of the absorption spectrum
their performance is worse in the near UV part. However, in photovoltaic
Page 148
Chapter 8
146
applications the visible region, constituted of charge-transfer type transitions, will
be the most important and therefore the one to which we will pay most attention.
As stated previously the present iron complex undergoes a
photoisomerization and photoreduction, it will be quite interesting to reproduce
the spectrum of the iron(II) complex even if it has not been reported
experimentally. UV/VIS spectrum has been calculated using the optimized CAM-
B3LYP of the most stable isomer for these oxydation state. Note that like the case
of iron(III) also the reduced specie is a high spin complex, the maximum
multiplicity state being the most stable. Like in the case of iron(III) DFT
calculations also correctly reproduce the energy order of the different spin states,
with the quintet state being the ground state, triplet and singlet are quasi-
degenerate among us and lay at about 1 eV higher energy. The convoluted
spectrum is reported in Figure 4 for the visible region only, and one can again see
a slight important variation of the absorption maximum with the functional used,
the latter assuming values comprised between 370 and 410 nm. Hybrid
functionals experience an important red-shift, while M06-2X appears the most
blue-shifted. Note also that intensity (oscillator strengths) are much lower than in
the case of iron(III), and vary quite a lot between functionals with wB97XD
giving the lowest and B3LYP the highest ones.
In the work of Welter et al. [33-35]
the absorption spectrum of the iron(II)
complex is not reported because of its air-sensitive behavior leading to oxidation,
even though they were able to isolate it as a yellow crystals. The computed low
intensity peaks are coherent with such observation, and moreover the small values
of the oscillator strengths are also coherent with the fact that the crystal and the
solution are only very weakly colored.
Page 149
Chapter 8
147
Figura 4. Expansion of the visible region of the spectrum of iron (II) complex calculated with
different functionals (wavelenght in nm, intensities in arbitrary units).
8.3 Transition analyses
One important possibility offered by quantum chemistry is to have a direct
access to the analysis of the individual electronic transitions, composing the
experimental spectrum, in terms of electron density rearrangement. Hence it can
be extremely helpful to show the role of the different ligand in the physical
process and to orient the synthesis of optimized dyes.
This analysis has been conducted in terms of NTO and allows to graphically
visualize the topology of the orbital involved in the transition and the type of
excitations, that can be a Metal-to-Ligand (MLCT), Ligand-to-Ligand (LLCT) or
Ligand-to-Metal (LMCT) Charge Transfer.
We decided to extract NTO from the TD-B3LYP calculation since it
shows a good overall performance, compared with the experimental iron(III)
Page 150
Chapter 8
148
spectrum, in all the spectral regions. However NTOs obtained with the other
functionals show the same qualitative behavior.
In Table 2 are reported the wavelengths of the most important vertical
transitions in terms of oscillator strength and in figure 5 some NTOs for the
iron(III) complex.
Table 2. Main electronic transition of iron(III) complex with B3LYP. The transition index
indicates the excited state involved in the transition.
Transition Wavelenght (nm) f
9 553 0.0129
10 550 0.0026
11 544 0.0082
12 542 0.0032
13 516 0.0021
17 480 0.0056
20 451 0.0081
22 444 0.0099
42 390 0.0155
43 387 0.0113
44 384 0.0207
74 323 0.0599
75 322 0.2134
76 319 0.1214
78 317 0.2374
80 312 0.1034
94 288 0.3950
95 287 0.0748
Page 152
Chapter 8
150
Figure 5. Occupied (left) and Virtual (right) NTO for iron III complex selected transitions
By analyzing the selected NTOs reported in figure 5 one can notice the
presence of LMCT transitions in the visible part of the spectrum (transitions 9, 11,
17, 22). In particular the lowest lying transitions involves the creation of a hole on
the salycilic ligands, while higher energy transitions draw electron density from
the chlorine. Notice that some transitions appearing at relative high energy
(transition 75, 322 nm) can still be qualified as LMCT. The other most important
Page 153
Chapter 8
151
transition in Figure 5 can be seen whether as LLCT (transition 80, 95) or as
strongly delocalized p-p type (transition 78). Note that no MLCT transitions
appears to have significant intensity.
In Table 3 the main vertical transitions of iron(II) complex are reported
while in Figure 6 some representative selected NTOs for the same system are
shown.
Table 3. Main electronic transition of iron(II) complex with B3LYP. The transition index
indicates the excited state involved in the transition.Table 3.
Transition Wavelenght (nm) f
6 431 0.0007
8 406 0.0022
9 364 0.0013
11 362 0.0004
12 354 0.0009
16 330 0.0752
22 319 0.2189
27 311 0.2270
38 296 0.0229
50 284 0.0775
56 275 0.1785
Again one can clearly see that the visible part of the spectrum is
characterized by LMCT transitions (8, 9, 16) notice also the more important role
played by the chlorine atoms in the low energy transitions, and notice also the
presence of a chlorine-to-metal charge-transfer transition at quite high energy
values (transition 56, 276 nm). All the other evidenced transitions are of LLCT
type and always show an extremely important role of the chlorine in the occupied
NTO, i.e. chlorine definitively acts as the principal electron donor group.
Page 155
Chapter 8
153
Figure 6. Occupied (left) and Virtual (right) NTO for iron II complex selected transitions
The presence of LMCT that leaves holes on the ligand can be extremely
beneficial in the case of the application as dyes in inverse DSSC, since in that
paradigm is the semiconductor that is supposed to inject electron into the dye
following excitation. Obviously the presence of important electron deficiency on
Page 156
Chapter 8
154
the ligand that are directly grafted to the surface can favor such a process.
However the weak absorption intensities, as well as the important role
played by the chlorine atom can limit the performance of the system. The
introduction of more delocalized chelating ligand can help in overcoming such
limitations.
Conclusion
The electronic excitation spectrum of an iron complex known to
experience photoisomerization and photoreduction has been performed at TDDFT
level for both +3 and +2 oxidation states. The performance of different functionals
has been accounted for, and in particular the dependence of the functional used for
geometry optimization has been particularly evidenced. In particular B3LYP
appears unable to provide equilibrium geometries from which one can safely
extract vertical excitation energies. At the other hand the use of long-range
corrected CAM-B3LYP for geometry optimization allows to reliably reproduce
the absorption spectrum. New generation M06-2X functional as well as LC-wPBE
appears to be the ones better reproducing the visible region of the spectrum,
although their performance is less good in the near UV. Quite surprisingly, for
vertical excitations, B3LYP performs better than some of long-range corrected
functionals, namely CAM-B3LYP. This occurrence even in the case of charge-
transfer states can be related to the limited size of the complex and therefore to the
presence of a small charge separation. It is known that in such conditions CAM-
B3LYP may experience important deviations from experience, and in general has
a worse performance than B3LYP in reproducing excitation energies.[48,49]
This
evidence has also already been pointed out, for instance by Ruud et al.[50]
in the
calculation of circular dichroism as well as by some of us in computing absorption
spectra of ruthenium organo-metallic complexes.[51,52]
The topological analysis of
the transition has clearly shown that the absorption spectrum is dominated by
LMCT transition type, leaving a hole in the ligands. This occurrence is confirmed
for both iron(III) and iron(II) complexes, moreover an important participation of
Page 157
Chapter 8
155
the ancillary chlorine ligands has been evidenced. The necessity to modify the
ligands in order to enhance the absorption intensities and to favor transitions
potentially leading to efficient charge injection in the domain of DSSC has been
also evidenced. In particular the use of more p-delocalized ligands and a
substitution of the chlorine, for instance by NCS, should be considered. In the
future we plan to perform a systematic computational study on possible
candidates in order to optimize the ligand choice in a molecular design approach.
Part of this chapter is reproduced with permission from “Journal of Physical
Chemistry A” by American Chemical Society. The complete study here described
can be found in the paper “N. Zanna, A. Monari, X. Assfeld, J. Phys. Chem. A,
2012, 48, 11905-11912” fully available at http://pubs.acs.org .
References
[1] O'Regan, B.; Grätzel, M. Nature, 1991, 353, 737
[2] Hagfeldt, A.; Grätzel, M. Acc. Chem. Res., 2000, 33, 269
[3] Hagfeldt, A.; Boschloo, G.; Sun, L.; Kloo, L.; Petterson, H. Chem. Rev., 2010, 110, 6595
[4] Nattestad, A.; Mozer, A. J.; Fischer, M. K. R.; Cheng, Y.-B.; Mishra, A.; Bäuerle, P.; Bach,
U. Nature Mat., 2010, 10, 31
[5] Hagfeldt, A. Gr tzel, M. Chem. Rev. 1995, 95, 49
[6] Labat, F.; Le Bahers, T.; Ciofini, I.; Adamo, C. Acc. Chem. Res. 2012, 45, 1268
[7] Gr tzel, M. Nature 2001, 414, 338
[8] Gr tzel, M. Inorg. Chem. 2005, 44, 6841
[9] Ardo, S.; Meyer, G. J. Chem. Soc. Rev. 2009, 38, 115
[10] Peter, L. M. J. Phys. Chem. C 2007, 111, 6601
[11] Peter, L. M. Phys. Chem. Chem. Phys. 2007, 9, 2630
[12] Bisquert, J.; Cahen, D.; Hodes, G.; Ruhle, S.; Zaban, A. J. Phys. Chem. B 2004, 108, 8106
[13] O’Regan, B. C. Durrant, J. Acc. Chem. Res. 2009, 42, 1799
[14] Hagfeldt, A.; Boschloo, G.; Sun, L.; Kloo, L.; Pettersson, H. Chem. Rev. 2010, 110, 62595
[15] Robertson, N. Angew. Chem., Int. Ed. 2006, 45, 2338
[16] Grabulosa, A.; Martineau, D.; Beley, M.; Gros, P. C.; Cazzanti, S.; Caramori, S.; Bignozzi,
C. A. Dalton Trans. 2009, 63
Page 158
Chapter 8
156
[17] Noureen, S.; Caramori, S.; Monari, A.; Assfeld, X.; Bignozzi, C. A., Beley, M.; Gros, P. C.
Dalton Trans. 2012, 41, 4833.
[18] Monari, A., Assfeld, X. Beley, M., Gros. P. C. J. Phys. Chem. A, 2011 115, 3596.
[19] Preat, J. J. Phys. Chem. C 2010, 114, 16716
[20] Preat, J. Jacquemin, D. Perp te, E. A. Energy Environ. Sci. 2010, 3, 891
[21] Preat, J. Jacquemin, D. Michaux, C. Perp te, E. A. Chem. Phys. 2010, 376, 56
[22] Preat, J. Jacquemin, D. Perp te, E. A. Environ. Sci. Technol. 2010, 44, 5666
[23] Preat, J. Michaux, C. Jacquemin, D. Perp te, E. A. J. Phys. Chem. C 2009, 113, 16821
[24] Pastore, M.; De Angelis, F. ASC Nano 2010, 4, 556
[25] Fantacci, S.; De Angelis, F.; Selloni, A. J. Am. Chem. Soc. 2005, 125, 16835
[26] De Angelis, F. Fantacci, S. Selloni, A. Gr tzel, M. Nazeruddin, M. . J. Am. Chem. Soc.
2007, 129, 14157
[27] Lundqvist, M. J.; E. Galoppini, E.; Meyer, G. J.; Persson, P. J. Phys. Chem. A 2007, 111,
1487
[28] Jacquemin, D. Perp te, E. A. Laurent, A. D. Assfeld, . Adamo, C. Phys. Chem. Chem.
Phys. 2009, 11, 1258
[29] Martineau, D.; Beley, M.; Gros, P. C.; Cazzanti, S.; Caramori, S.; Bignozzi, C. A. Inorg.
Chem. 2007, 46, 2272
[30] Grabulosa, A.; Beley, M.; Gros, P. C.; Cazzanti, S.; Caramori, S.; Bignozzi, C. A. Inorg.
Chem. 2009, 48, 8030
[31] Nazeeruddin, M. K.; Wang, Q.; Cevey, L.; Aranyos, V.; Liska, P.; Figgemeier, E.; Klein, C.;
Hirata, N.; Koops, S. Haque, S. A. Durrant, J. R. Hagfeldt, A. Lever, A. B. P. Gr tzel, M.
Inorg. Chem. 2006, 45, 787
[32] Ferrere, S. Inorg. Chim. Acta, 2002, 329, 79
[33] Bouslimani, N.; Clément, N.; Rogez, G.; Turek, P.; Bernard, M.; Dagorne, S.; Martel, D.;
Cong, H. N.; Welter, R. Inorg. Chem, 2008, 47, 7623.
[34] Bouslimani, N.; Clément, N.; Toussaint, C.; Hameury, S.; Turek, P.; Choua, S.; Dagorne, S.;
Martel, D.; Welter, R. Eur. J. Inorg. Chem., 2009, 2009, 3734.
[35] Bouslimani, N.; Clément, N.; Rogez, G.; Turek, P.; Choua, S.; Dagorne, S.; Welter, R.
(2010). Inorg. Chim. Acta, 2010, 363, 213.
[36] Martin, R. L. J. Chem. Phys. 2003, 118, 4775.
[37] Monari, A.; Very, T.; Rivail, J.-L.; Assfeld, X. Comp. Theor. Chem., 2012, 990, 119.
[38] Monari, A.; Very, T.; Rivail, J.-L.; Assfeld, X. Theor. Chem. Acc., 2012, 131, 1221.
[39] Gaussian 09, Revision B.01, Frisch, M. J.; Trucks, G. W.; Schlegel, H. B.; Scuseria, G. E.;
Robb, M. A.; Cheeseman, J. R.; Scalmani, G.; Barone, V.; Mennucci, B.; Petersson, G. A.;
Nakatsuji, H.; Caricato, M.; Li, X.; Hratchian, H. P.; Izmaylov, A. F.; Bloino, J.; Zheng, G.;
Sonnenberg, J. L.; Hada, M.; Ehara, M.; Toyota, K.; Fukuda, R.; Hasegawa, J.; Ishida, M.;
Page 159
Chapter 8
157
Nakajima, T.; Honda, Y.; Kitao, O.; Nakai, H.; Vreven, T.; Montgomery, Jr., J. A.; Peralta, J.
E.; Ogliaro, F.; Bearpark, M.; Heyd, J. J.; Brothers, E.; Kudin, K. N.; Staroverov, V. N.;
Kobayashi, R.; Normand, J.; Raghavachari, K.; Rendell, A.; Burant, J. C.; Iyengar, S. S.;
Tomasi, J.; Cossi, M.; Rega, N.; Millam, J. M.; Klene, M.; Knox, J. E.; Cross, J. B.; Bakken,
V.; Adamo, C.; Jaramillo, J.; Gomperts, R.; Stratmann, R. E.; Yazyev, O.; Austin, A. J.;
Cammi, R.; Pomelli, C.; Ochterski, J. W.; Martin, R. L.; Morokuma, K.; Zakrzewski, V. G.;
Voth, G. A.; Salvador, P.; Dannenberg, J. J.; Dapprich, S.; Daniels, A. D.; Farkas, Ö.;
Foresman, J. B.; Ortiz, J. V.; Cioslowski, J.; Fox, D. J. Gaussian, Inc., Wallingford CT, 2009.
[40] Tomasi, J.; Mennucci, B.; Cammi, R. Chem. Rev. 2005, 105, 2999.
[41] Wadt, W. R.; Hay, P. J. J. Chem. Phys. 1985, 82, 284.
[42] a) Becke, A. D. J. Chem. Phys. 1993, 98, 1372 b) Lee, C.; Yang, W.; Parr, R. G. Phys. Rev. B
1993, 37, 785.
[43] Yanai, T.; Tew, D. P.; Handy, N. C. Chem. Phys. Lett. 2004, 393, 51
[44] Adamo, C.; Barone, V. J. Chem. Phys. 1999, 110, 6158
[45] Zhao, Y.; Truhlar, D. G. Theor. Chem. Acc. 2008, 120, 215
[46] a) Vydrov, O. A.; Heyd., J.; Krukav, A. V.; Scuseria, G. E. J. Chem. Phys. 2006, 125, 074106
b) Vydrov, O. A.; Scuseria, G. E. J. Chem. Phys. 2006, 125, 234109
[47] Chai, J.-D.; Head-Gordon, M. Phys. Chem. Chem. Phys. 2008, 10, 6615
[48] Peach, M. J. G.; Benfield, P.; Helgaker, T.; Tozer, D. J. J. Chem. Phys. 2008, 128, 044118.
[49] Jacquemin, D.; Perpète, E. A.; Wathelet, V.; Adamo, C. J. Chem. Theory Comp. 2009, 5,
2420
[50] Scherbin, D.; Ruud, K. Chem. Phys. 2008, 349, 234.
[51] Very, T.; Despax, S.; Hébraux, P.; Monari, A.; Assfeld, X. Phys. Chem. Chem. Phys. 2012,
14, 12496
[52] Chantzis, A.; Very, T.; Monari, A.; Assfeld, X. J. Chem. Theory Comp., 2012, 8, 1536.