Scofield Reservoir predator-prey interactions: investigating the roles of interspecific interactions and forage availability on the performance of three predatory fishes by Phaedra Budy, Professor, Unit Leader Lisa Winters, Graduate Research Assistant Gary P. Thiede, Fisheries Biologist Konrad Hafen, Undergraduate Researcher Bryce Roholt, Undergraduate Researcher US Geological Survey, Utah Cooperative Fish and Wildlife Research Unit, Department of Watershed Sciences, and the Ecology Center Utah State University, Logan, UT 84322-5210 2 April 2014 Project Completion Report USU Control Number 130738 UDWR Contract Number 132579 Sport Fisheries Research (US) Grant Number: F – 134 – R, Segment 1 Grant Period: 1 July 2011 to 30 June 2013
Transcript
Scofield Reservoir predator-prey interactions: investigating the roles of interspecific interactions and forage
availability on the performance of three predatory fishes
by Phaedra Budy, Professor, Unit Leader
Lisa Winters, Graduate Research Assistant
Gary P. Thiede, Fisheries Biologist
Konrad Hafen, Undergraduate Researcher
Bryce Roholt, Undergraduate Researcher
US Geological Survey, Utah Cooperative Fish and Wildlife Research Unit, Department of Watershed Sciences, and the Ecology Center
Utah State University, Logan, UT 84322-5210
2 April 2014 Project Completion Report
USU Control Number 130738 UDWR Contract Number 132579
Sport Fisheries Research (US) Grant Number: F – 134 – R, Segment 1
Grant Period: 1 July 2011 to 30 June 2013
TABLE OF CONTENTS
Page
Acknowledgments………………………………………………………………………….……………….............… ii
Preface....................…………………………………………………………………….………………….............… iii
Chapter 1. Unwelcome invaders and trout predators: effective biological controls in a western reservoir?................................................................................................................ 1
Chapter 2. Quantifying the food web impacts of introduced piscivores in reservoir fish assemblages.......................................................................................................................... 50
Appendix 1. Hydroacoustic assessment of fish density, abundance, and biomass in Scofield Reservoir, Utah....................................................................................................... 89
Appendix 2. Agonistic behavior between three species of salmonids stocked into Scofield Reservoir, Utah: an experimental evaluation......................................................... 100
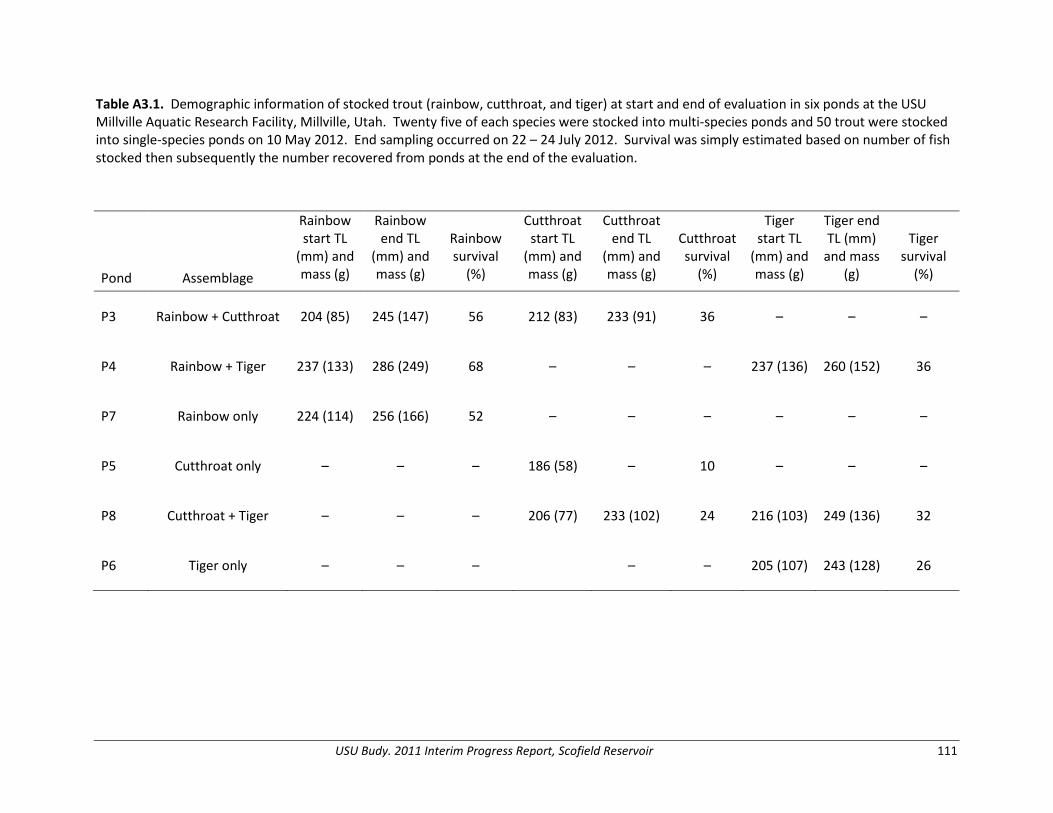
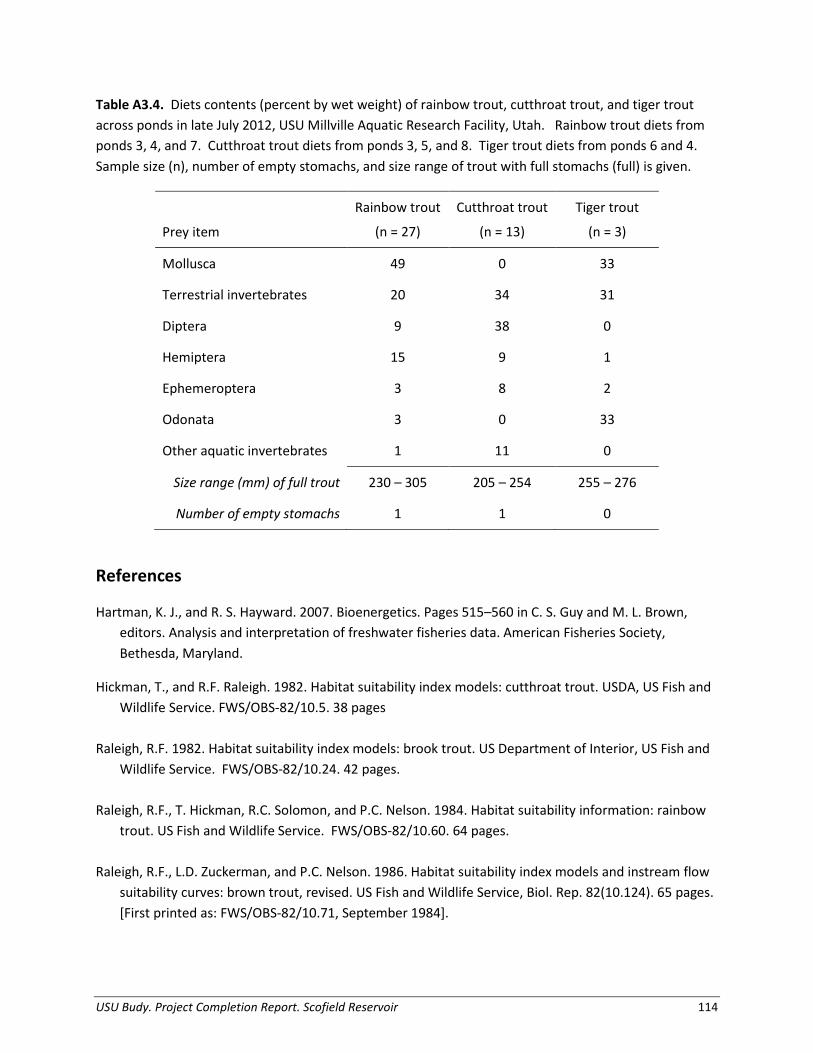
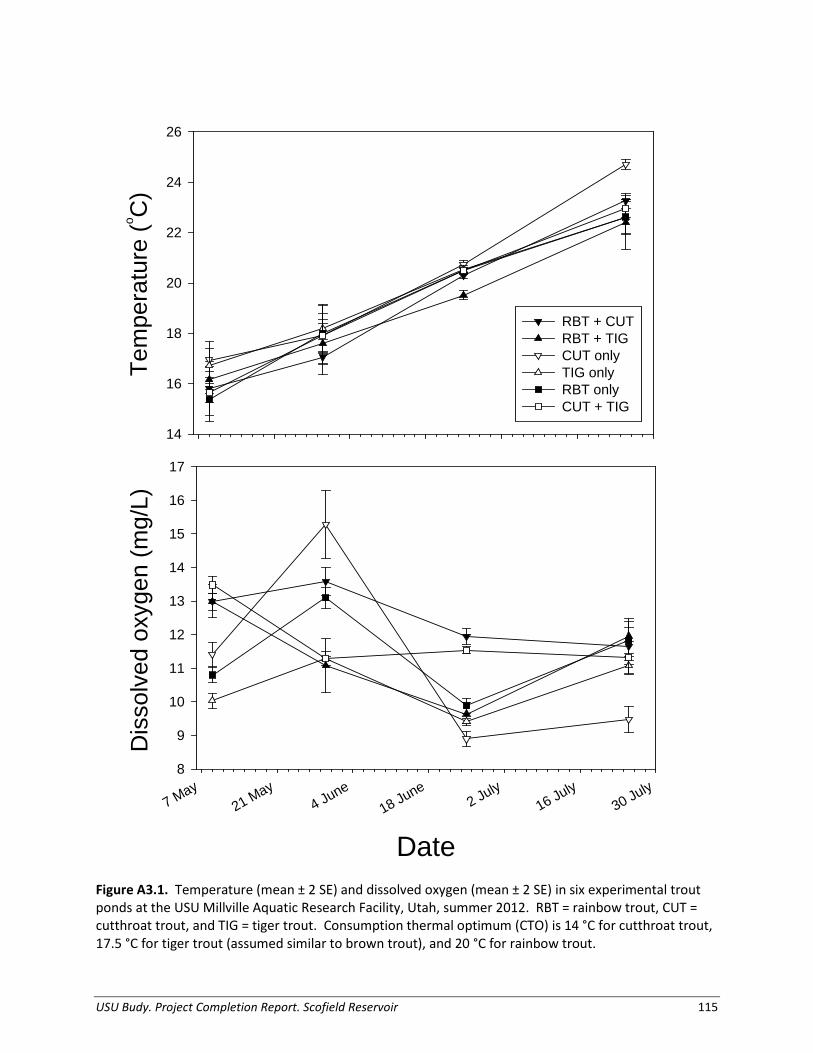
Appendix 3. Evaluation of trout performance under various fish assemblages in experimental ponds.............................................................................................................. 110
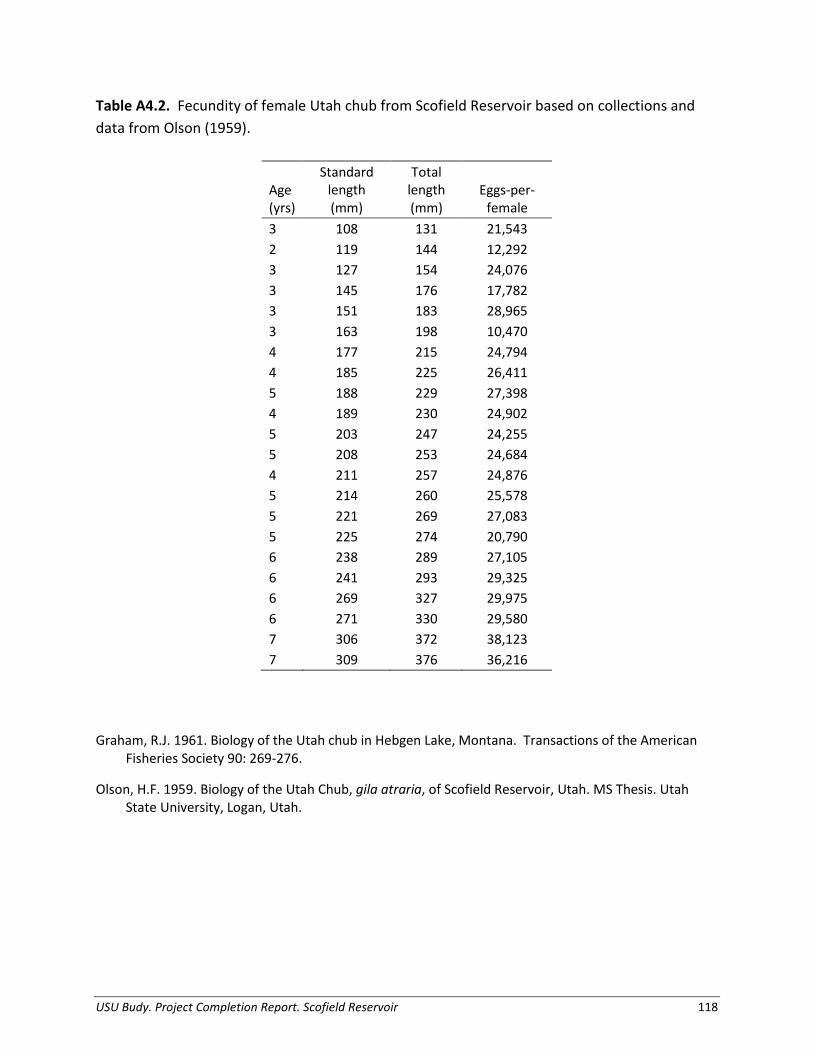
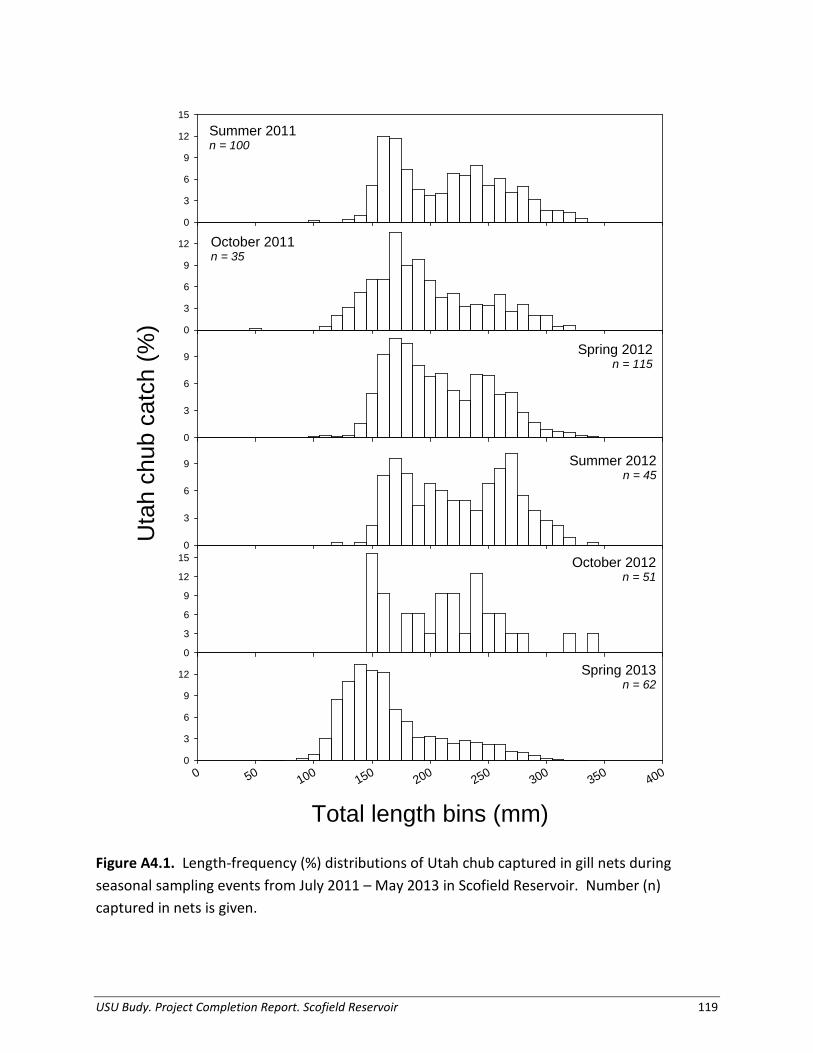
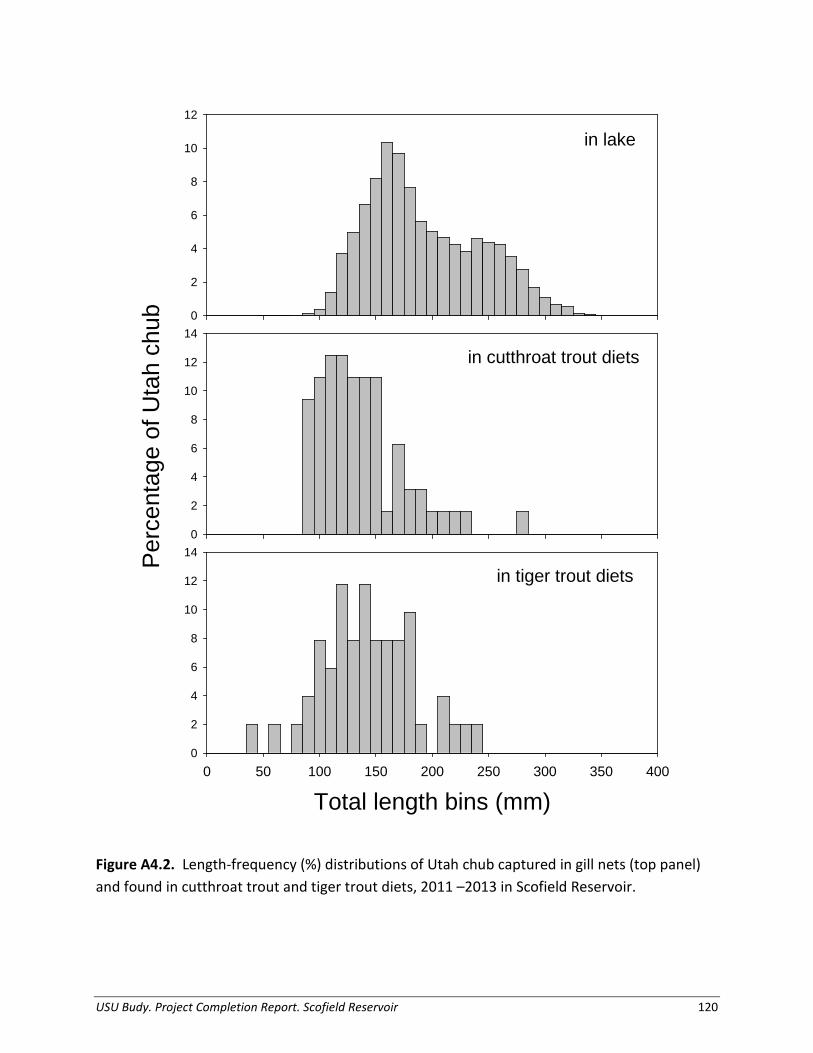
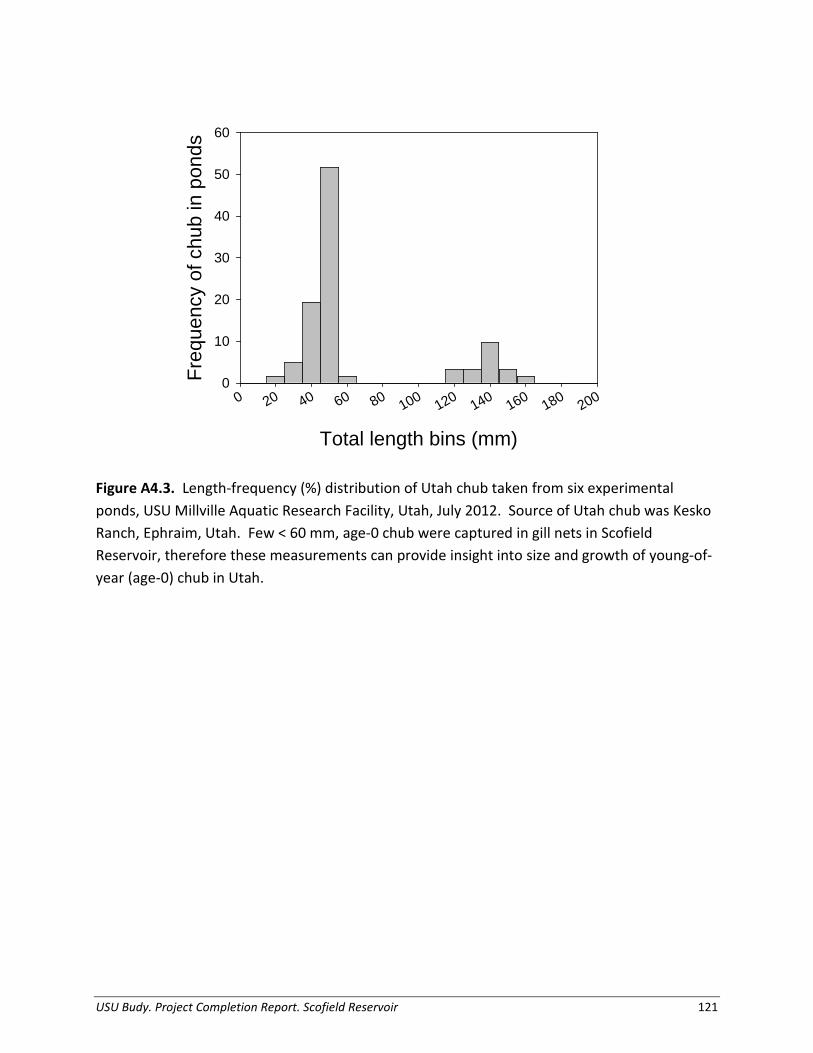
Appendix 4. Demographics and diet of Utah chub in Scofield Reservoir, Utah.................. 117
Suggested citation:
Budy, P., L. Winters, G.P. Thiede, K. Hafen, and B. Roholt. 2014. Scofield Reservoir predator-prey interactions: investigating the roles of interspecific interactions and forage availability on the performance of three predatory fishes. 2013 Project Completion Report to the Utah Division of Wildlife Resources. UTCFWRU 2014(2):1-123.
USU Budy, Project Completion Report, Scofield Reservoir i
ACKNOWLEDGMENTS
Funding and support was provided by Utah Department of Natural Resources, Division of Wildlife Resources (UDWR; Federal Sport Fish Restoration, Grant number F – 134 – R, Project 1) and US Geological Survey, Utah Cooperative Fish and Wildlife Research Unit, in-kind. We would also like to acknowledge the support from the Ecology Center at Utah State University (USU).
We would like to thank Paul Birdsey, Justin Hart, Calvin Black, and Craig Walker from the UDWR for their assistance and guidance. Thanks to our field and lab technicians: Michael Yarnall, Konrad Hafen, Hannah Moore, Jared Baker, Bryce Roholt, Brie Estrada, and Dan Weber. Thanks also to graduate students in the Fish Ecology Lab for assistance and advice: Stephen Klobucar, Nick Heredia, and Christy Meredith. Thanks to Carl Saunders and Susan Durham for generous assistance to Konrad Hafen during his trout behavior study.
For hydroacoustics work, we especially thank Chris Luecke at Utah State University and Paul Birdsey and Justin Hart (UDWR). Calvin Black (UDWR) graciously provided the gill-net catch and size data where needed.
We would like to sincerely thank the UDWR Fountain Green Fish Hatchery and personnel for supplying three species of trout for the trout evaluation experiments in ponds and trout behavioral experiments in tanks conducted at the USU Millville Aquatic Research Facility in Millville, Utah. Also, thanks to Kesko Ranch (Ephriam, Utah) for selling us Utah chub. For assistance with these experiments, we thank Carl Saunders, Stephen Klobucar, and Konrad Hafen. Thanks to the Ecology Center at USU for support at the USU Millville Aquatic Research Facility.
Permitting assistance was provided by Suzanne McMullin (UDWR) and Jenna Daniels and Aaron Olsen of the Institutional Animal Care and Use Committee (IACUC) at Utah State University. This research is conducted under State of Utah COR number 1COLL8712 and IACUC protocol number 1544.
USU Budy. Project Completion Report. Scofield Reservoir ii
PREFACE
In this completion report, we summarize our findings from an intensive two-year study of the fish community of Scofield Reservoir, Utah. In 2011, a need was identified to gain a better understanding of the ecological processes shaping the food web and fishery in Scofield Reservoir, historically the most important trout fishery in Utah’s southeastern region and still one of the most heavily used fisheries in the state. Rainbow trout (Oncorhynchus mykiss) was the primary species sought by anglers, and the fishery is managed as a “put-grow-and-take” family fishery with rainbow trout stocked annually. Historically, around 600,000 trout were stocked every year; however, stocking levels are now adjusted nearly every year in response to the re-discovery of Utah chub (Gila atraria) in 2005. Tiger trout (Salmo trutta X Salvelinus fontinalis) fingerlings were added in 2005 as a biological control for the Utah chub and have since proven to be one of the more highly desirable sport fish in the state. Bear Lake-strain cutthroat trout (O. clarkii utah) have been stocked annually since 2009, also as an additional Utah chub control measure. Consequently, there are theoretically three top predators and conspecifics with the potential for considerable competition for food and space. Further, despite its historic and contemporary popularity, angler use of the reservoir has declined since 1986 by a substantial amount. However, a public opinion survey revealed no consistent agreement of either (1) why the reservoir has declined in popularity (e.g., stocked fish had low survival) or (2) what changes in regulation might improve the fishing experience in the future (e.g., stricter or more relaxed regulations?).
Over the past two years, we have collected the necessary information to answer the following important questions with important management implications for the management of the fishery of the reservoir:
1) How does the food web operate (i.e., basal flow of energy) and what are the abiotic and physicalconstraints on fish performance?
2) What is the size and condition of the predator population in the reservoir, which speciescontribute the greatest or least, and from which cohort?
3) What are the preferred prey species, degree of diet overlap, and consumption rates of the threepredators on Utah chub and other prey species?
4) Can the predator population limit the prey population through top-down control?5) Are the three predators limited by interspecific competition for resources?
A quantitative assessment of the relative potential for biological control of an explosive prey fish by three different trout predators in Scofield Reservoir is provided in Chapter 1. In Chapter 2, we quantify the food web impacts of introduced piscivores in the Scofield Reservoir fish assemblage. Four appendices (1) provide hydroacoustic fish density estimates of Scofield Reservoir, (2) summarize controlled laboratory experiments describing agonistic interaction between the three trout species, (3) describe the performance of the three trout species raised in experimental ponds, and (4) compile some demographic information on Utah chub. Chapters 1 and 2 come directly from the MS Thesis (in Ecology) of Lisa Winters, Department of Watershed Sciences, Utah State University completed in March 2014.
Management Implications and Projections are provided in Chapter 3, starting on page 76.
USU Budy, Project Completion Report, Scofield Reservoir iii
CHAPTER 1
Unwelcome invaders and trout predators: effective biological controls in a western reservoir?
Introduction
Biological agents are becoming increasingly common as a method of natural control to remove invasive species and maintain native biodiversity worldwide (Freeman et al. 2010). Biological control, an environmentally sound and effective means of reducing or mitigating nuisance species and their impacts through the use of natural enemies, depends upon parasites, pathogens, or predators to lower population densities of the nuisance species (Debach 1964; Freeman et al. 2010; USDA 2013a). The United States alone has employed almost 200 biological control agents towards nuisance weeds in agriculture (USDA 2013b). Since 2002, the Emerald Ash Borer Agrilus planipennis, from northeastern Asia has been a poster-child of destructive pest and threat to the United States economy (USDA 2013b). Nevertheless, despite seemingly prolific use of biological control agents, vertebrate species represent a small portion of biological control targets (Saunders et al. 2010). Only in the past few decades has the biomanipulation of fishes become a common technique to prevent over-expanding prey bases from negatively affecting sport fish (Stewart et al. 1981; Hartman and Margraf 1993; Irwin et al. 2003) or to improve water quality (Shapiro et al. 1975; Carpenter et al. 1985; Ireland 2010). Many such techniques are employed within artificial systems, which commonly contain intentionally introduced and intensively managed species (Anderson and Neumann 1996). Reservoir systems exhibit characteristics intermediate to lotic and lentic habitat and thus incorporate an atypical community of fish (Wetzel 1990; Anderson and Neumann 1996: Wetzel 2001). These artificial systems, manipulated through stocking, may have unpredictable food webs with decoupled predator and prey dynamics (Kitchell and Crowder 1986; Ruzycki et al. 2001). In addition, reservoirs are usually relatively young, such that assemblage community members have not co-evolved (Havel et al. 2005; Raborn et al. 2007). Finally, predominant uses of reservoirs, such as for water storage and flood control, may dramatically change water levels, leading to fluctuations in fish habitat and population dynamics (Gasinth and Gafny 1990; Rose and Mesa 2013). Similarly, the balance of interactions within reservoir food webs may be unstable due to their simplicity, where the entire assemblage can be affected by random fluctuations in a single species (Stein et al. 1995; Raborn et al. 2007). In the western USA, non-native Lake Trout
USU Budy, Project Completion Report, Scofield Reservoir 1
Salvelinus namaycush, have had a substantial impact on native, and federally threatened, Bull Trout S. confluentus, populations due to predation, competition for food, and varying life history traits of these two top predators (Guy et al. 2011). Burbot lota lota, rapidly invading Flaming Gorge Reservoir, Utah-Wyoming, threaten to be a detriment to native fishes through predation or competitive interactions for shared prey resources (Gardunio et al. 2011). The strength of interactions within reservoir food webs may change with the introduction of other non-native fishes; however, establishment of a species is not always successful (Kohler et al. 1986; Williamson and Fitter 1996). Successful introductions to artificial assemblages may result in a lengthened food chain (Walsworth et al. 2013), alter energy flow through the system (Sousa et al. 2008), initiate novel predator-prey interactions (Kitchell et al. 1997; Romare and Hansson 2003; Schoen et al. 2012), or alter trophic structure (Reissig et al. 2006; Skov et al. 2010; Ellis et al. 2011). The addition of species also increases potential for competition (Tyus and Saunders 2000; Tronstad 2008). Consequently, unwelcome invaders may disrupt certain linkages and alter the strength of interactions within a complex and not well understood reservoir food web. Our understanding of the use of top predators as a tool for biological control in aquatic systems is of upmost importance, as there has been a surge of invasive fish species in recent years (Sorenson and Stacey 2004). Piscivorous fishes represent a commonly introduced species, intentionally stocked as a management tool in an attempt to control undesired species (Courtenay and Kohler 1986), as well as to enhance angling opportunities (Martinez et al. 2009). In the Laurentian Great Lakes, a salmonid stocking program was launched to trigger top down control of an invasive and nuisance Alewife Alosa pseudoharengus, population, which resulted in a valuable sport fishery and a reduction in Alewife abundance (Bunnell et al. 2006). After Largemouth Bass Micropterus salmoides, were stocked in ponds to control Gizzard Shad D. cepedianum, Shad populations plummeted, suggesting Largemouth Bass consumed enough Shad to limit their overall abundance (Irwin et al. 2003). However, as with many introductions, there can be adverse effects on non-target organisms as a result (Wittenberg and Cock 2001; Simberloff 2009). A note-able example of a successful biological control with unintended results is the Mosquitofish Gambusia affinis, introduced to prey on mosquito larvae, thus, successfully controlling adult mosquito populations (Kumar and Hwang 2006); however, these fish have decreased native fish populations through predation (Simberloff and Stiling 1996). Nonetheless, when introduced as potential biological controls, top predators present a potentially powerful tool for invasive species management, where a carefully-selected, upper-trophic level species theoretically uses the undesired organism as a primary food resource to reduce the population size (Hoddle 2004).
USU Budy. Project Completion Report. Scofield Reservoir 2
Predator growth and survival depends on the availability of prey resources. This dependence is described by the classic supply-demand relationship; prey abundance and accessibility (i.e., supply) is directly related to biomass and production of predators in the system (i.e., demand; Ney 1990). This link to prey availability, however, is not always apparent in manipulated, artificial assemblages (Vatland et al. 2008). Predator size relative to prey size often limit (or influence) predator ability to capture, handle, and consume prey (Hambright 1991; Magnhagen and Heibo 2001; Juanes et al. 2002). Gape size limitations, where a larger gape increases the potential size of prey captured, is exemplified by Yellow Perch Perca flavescens, where size selection of Round Goby Neogobius melanostomus, prey increased with predator size (Truemper and Lauer 2005). Further, young fish with rapid growth rates may quickly exceed the gape of piscivores, thereby allowing them to become less vulnerable to predation and attain high survival rates, such as Gizzard Shad throughout the southeast (Noble 1981; Michaletz 2013). With few predators and abundant resources, the prey species may dominant the assemblage (Stein et al. 1995). Additionally, based on optimal foraging theory, foraging behavior should maximize fitness (the ultimate measure of performance), through choices relating to foraging time, diet selection, and handling time (Werner and Hall 1974; Mittlebach 2002; Gill 2003). These behaviors and feeding choices are based on a theoretical goal of expending the least amount of energy while still obtaining the most calories, and may result in different interactions between predator and prey than those predicted by supply and demand alone. Thus, the strength of complex food web interactions depends on prey life-history traits and subsequent predator foraging decisions. Given these complexities, understanding the mechanisms driving predator-prey relationships in cold water impoundments can be challenging, but is also therefore critical for making informed management decisions (Johnson and Goettle 1999). Bioenergetics-based modeling, coupled with comprehensive field sampling, provides a quantitative and predictive tool for managers to estimate current and future predator impacts on prey populations (Rice and Cochran 1984; Hanson et al. 1997). This approach, based on a balanced energy budget, uses physiological and allometric relationships driven by food, temperature, and fish size to predict consumption, growth, or production of fish (Brandt and Hartman 1993; Chipps and Wahl 2008). More specifically, the model can compute the consumption, in terms of biomass and associated prey energy, necessary to satisfy the annual growth of a fish, given the body mass, thermal experience, and diet of the modeled fish (Beauchamp et al. 2007). The results can be used to effectively evaluate complex interactions within reservoir food webs and the mechanisms that operate to structure these webs (Baldwin et al. 2000; Beauchamp and VanTassell 2001; Irwin et al. 2003). In Bear Lake, Utah, Bonneville Cutthroat Trout Oncorhynchus clarkii utah, and introduced Lake Trout prey heavily on endemic prey fish; as a result, model simulations estimated strong predation impacts from Lake Trout
USU Budy. Project Completion Report. Scofield Reservoir 3
with consumption exceeding prey fish production (Ruzycki et al. 2001). Similarly, Strawberry Reservoir, Utah, stocked with a unique assemblage of salmonids, quantified monthly sport fish consumption to highlight a bottleneck in Daphnia prey supply which was limiting to fish production (Baldwin et al. 2000). In sum, this approach has been effectively used to 1) assess water quality constraints on fish growth (Budy et al. 2011); 2) estimate management effects, such as slot limits and angler harvest (Luecke et al. 1994); 3) investigate species invasion success (Budy et al. 2013); and 4) predict predation pressure due to climate effects (Peterson and Kitchell 2001; Mesa et al. 2013), among many other uses. In Scofield Reservoir, Utah, the fast-reproducing non-game fish, Utah Chub Gila atraria, was unintentionally introduced in the reservoir, and subsequently the population exploded in 2005. Utah Chub are native to the nearby Snake River and Lake Bonneville basins, though not native to the Colorado River drainage, where Scofield Reservoir is located. Within the past decade, populations of sport fish, Bear Lake strain Bonneville Cutthroat Trout, Rainbow Trout O. mykiss, and Tiger Trout Salmo trutta, female x Salvelinus fontinalis, male, have been stocked in relatively high numbers as an effort to suppress the Utah Chub population. Since the majority of the lake-wide fish abundance consisted of Utah Chub, there was concern the expanding Utah Chub population would adversely affect the popular blue-ribbon sport fishery. Maintaining balanced predator and prey populations can thus be an ongoing management challenge for fisheries managers. Accordingly, the Scofield Reservoir food web poses a unique opportunity to investigate the use of salmonids as biological control agents to control an unwelcome non-game fish population. One project goal was to identify the best single, or combination of species for suppressing Utah Chub abundance, as well as to assess the relative performance of three popular sport fish (Cutthroat Trout, Rainbow Trout, and Tiger Trout). Specifically, our objectives were to:
1) estimate the abundance, biomass, and population growth trajectory of the principal prey fish, Utah Chub;
2) quantify trout consumptive demand relative to production of Utah Chub; and
3) compare the relative abundance and condition of the three predator species.
To achieve these objectives, we estimated catch-per-unit-effort (CPUE) and collected fish for measurements of growth and diet using a combination of common fisheries field techniques, conducted hydroacoustics surveys of fish density, and lastly, assembled this information into bioenergetic simulations of predator population consumption, compared with prey abundance and production. This study, and the results presented herein, is also one of the first documented rigorous studies of Tiger Trout ecology.
USU Budy. Project Completion Report. Scofield Reservoir 4
Table 1.1. Summary of trout stocking by species by month from 2005-2012. The number stocked and mean total length (TL) was estimated by state fish hatcheries.
Year Cutthroat Trout Rainbow Trout Tiger Trout
Month Number stocked
Mean TL (mm)
Number stocked
Mean TL (mm)
Number stocked
Mean TL (mm)
2005
July ---- ---- 478,484 83 ---- ----
September ---- ---- ---- ---- 103,716 122
October ---- ---- 100,003 169 ---- ----
2006
June ---- ---- 399,214 78 ---- ----
October ---- ---- 134,880 151 46,800 135
2007
May ---- ---- 467,365 74 ---- ----
October ---- ---- 100,960 135 129,941 150
2008
October ---- ---- ---- ---- 139,375 152
2009
May 86,052 207 24,320 217 ---- ----
October ---- ---- 58,533 201 122,500 148
November ---- ---- 162,544 170 ---- ----
2010
May 90,132 193 ---- ---- ---- ----
October ---- ---- ---- ---- 108,560 160
November ---- ---- 80,100 183 ---- ----
2011
May 80,143 203 ---- ---- ---- ----
October ---- ---- 74,523 183 119,635 149
2012
April 81,152 199 ---- ---- ---- ----
October ---- ---- 91,702 187 116,681 182
USU Budy. Project Completion Report. Scofield Reservoir 5
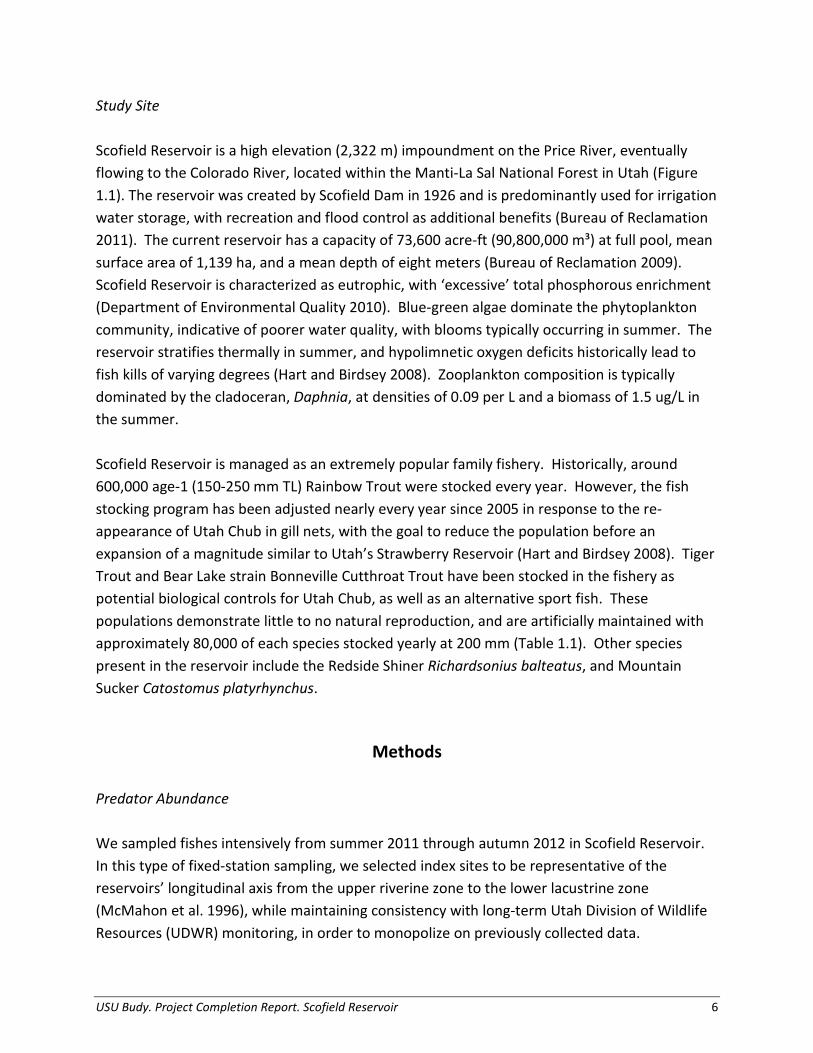
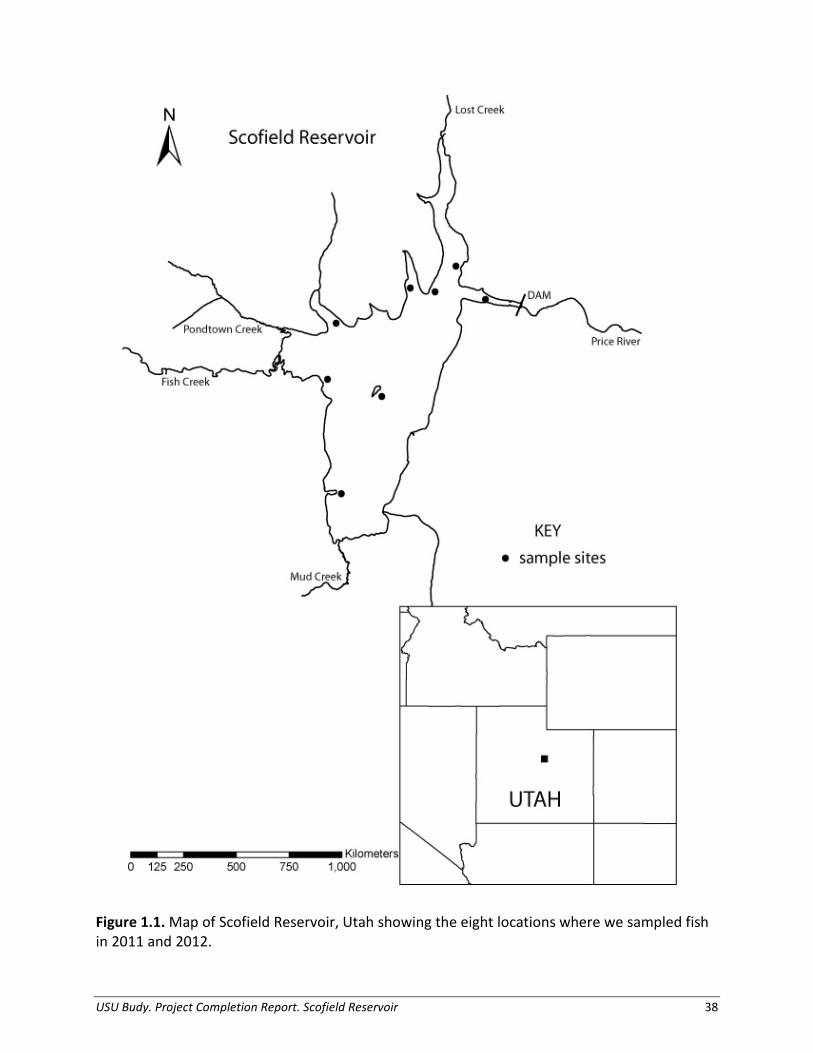
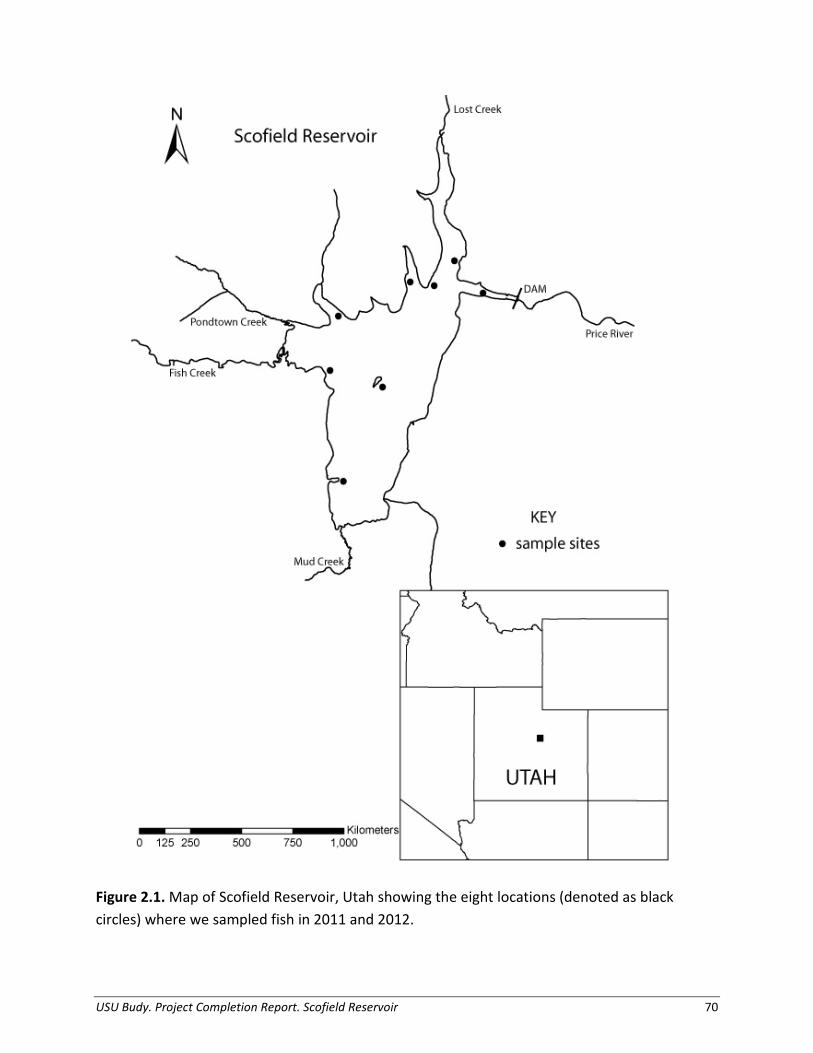
Study Site Scofield Reservoir is a high elevation (2,322 m) impoundment on the Price River, eventually flowing to the Colorado River, located within the Manti-La Sal National Forest in Utah (Figure 1.1). The reservoir was created by Scofield Dam in 1926 and is predominantly used for irrigation water storage, with recreation and flood control as additional benefits (Bureau of Reclamation 2011). The current reservoir has a capacity of 73,600 acre-ft (90,800,000 m³) at full pool, mean surface area of 1,139 ha, and a mean depth of eight meters (Bureau of Reclamation 2009). Scofield Reservoir is characterized as eutrophic, with ‘excessive’ total phosphorous enrichment (Department of Environmental Quality 2010). Blue-green algae dominate the phytoplankton community, indicative of poorer water quality, with blooms typically occurring in summer. The reservoir stratifies thermally in summer, and hypolimnetic oxygen deficits historically lead to fish kills of varying degrees (Hart and Birdsey 2008). Zooplankton composition is typically dominated by the cladoceran, Daphnia, at densities of 0.09 per L and a biomass of 1.5 ug/L in the summer. Scofield Reservoir is managed as an extremely popular family fishery. Historically, around 600,000 age-1 (150-250 mm TL) Rainbow Trout were stocked every year. However, the fish stocking program has been adjusted nearly every year since 2005 in response to the re-appearance of Utah Chub in gill nets, with the goal to reduce the population before an expansion of a magnitude similar to Utah’s Strawberry Reservoir (Hart and Birdsey 2008). Tiger Trout and Bear Lake strain Bonneville Cutthroat Trout have been stocked in the fishery as potential biological controls for Utah Chub, as well as an alternative sport fish. These populations demonstrate little to no natural reproduction, and are artificially maintained with approximately 80,000 of each species stocked yearly at 200 mm (Table 1.1). Other species present in the reservoir include the Redside Shiner Richardsonius balteatus, and Mountain Sucker Catostomus platyrhynchus.
Methods Predator Abundance We sampled fishes intensively from summer 2011 through autumn 2012 in Scofield Reservoir. In this type of fixed-station sampling, we selected index sites to be representative of the reservoirs’ longitudinal axis from the upper riverine zone to the lower lacustrine zone (McMahon et al. 1996), while maintaining consistency with long-term Utah Division of Wildlife Resources (UDWR) monitoring, in order to monopolize on previously collected data.
USU Budy. Project Completion Report. Scofield Reservoir 6
We used gill netting to collect data to evaluate the size structure, growth rate, body condition, and diet of trout in the reservoir. We set two horizontal sinking gill nets at each of eight index sites within the reservoir (Figure 1.1). We set these experimental gill nets (1.8 m tall x 24 m long with eight monofilament panels of 38-, 57-, 25-, 44-, 19-, 64-, 32-, and 51- mm bar mesh) according to standard gill-net methods to capture a representative size distribution of all fish in the reservoir (Beauchamp et al. 2009; Lester et al. 2009). We placed gill nets in littoral areas offshore at depths fish were predicted to be most abundant; set before dusk and pulled after dawn, spanning two crepuscular periods. We calculated catch-per-unit-effort (CPUE; fish/net/hour) at each sample site for each trout species and Utah Chub. Within each season, we summed catches from all gill nets and divided by total effort in order to estimate seasonal reservoir-wide CPUE. We expressed relative abundance of each species as a percentage of CPUE. We ran an analysis of variance (ANOVA) to compare the CPUE between each trout species and by season. We completed all statistical analyses using SAS and a “proc glimmix” statement, with an a priori α of 0.05 (SAS Institute Inc., Cary, NC, USA).
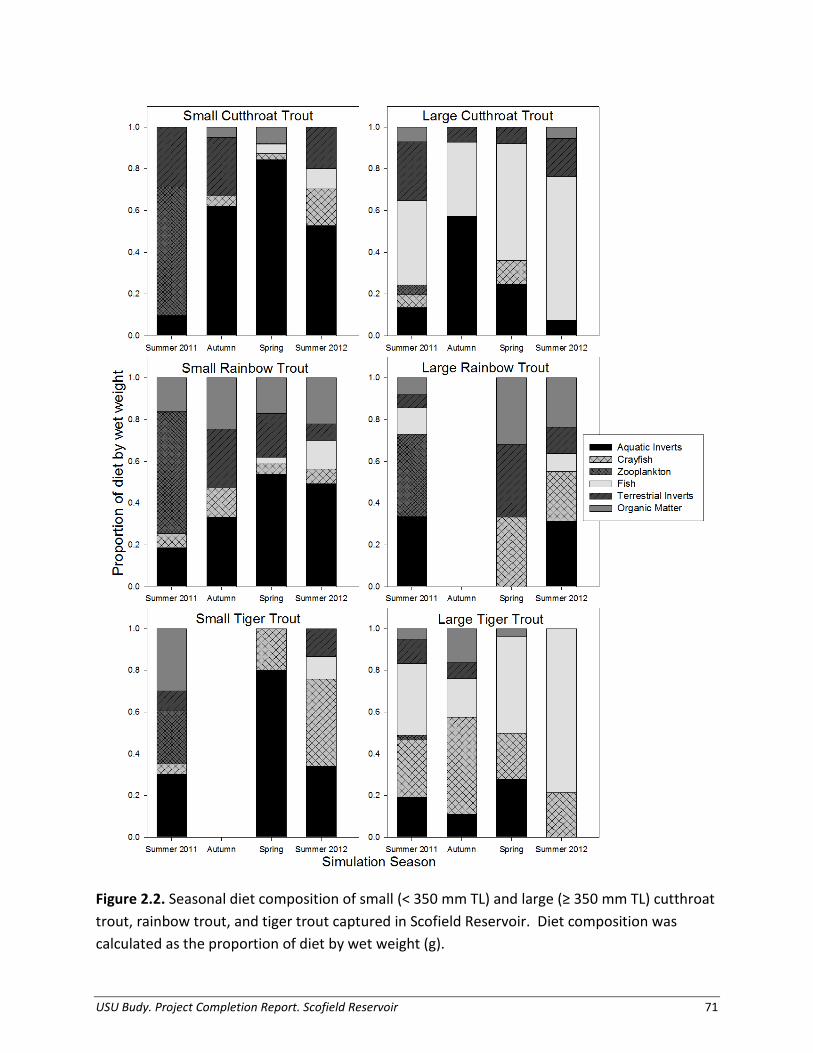
Predator Diet Composition We collected Cutthroat Trout, Rainbow Trout, and Tiger Trout diets primarily from fish captured in gill nets from July 2011 through October 2012. We placed all fish captured on ice and removed and preserved their stomachs whole for later analysis. We identified all organisms sampled from stomach contents to the lowest taxonomic level possible (Brooks 1957; Edmonson 1959; Merritt and Cummins 1996). We grouped fish stomach contents by prey fish (identified to species when possible), zooplankton, organic matter, aquatic invertebrates (classified to order), and terrestrial invertebrates (classified to order). We counted and weighed (blot-dry wet weight to nearest 0.001 g) prey fish, and weighed invertebrate prey en masse by classification. We measured intact prey fish to nearest mm (backbone and standard length). For model simulations, we determined diet composition as a proportion by wet weight, and calculated seasonally aggregated percentages. We delimited seasons as follows: spring (April – May), summer (June – August), and autumn (September – October). We applied these seasonal diet data to the appropriate size-class bioenergetic simulations, which interpolates changes in diet composition between seasonal inputs.
Predator Growth We estimated annual mean size-at-age from a combination of otolith-aging data, analysis of length-frequency modes, and mark-recapture data (from dye-marked fish). All otoliths were aged whole, independently by at least two laboratory personnel who were experienced in
USU Budy. Project Completion Report. Scofield Reservoir 7
otolith aging. We viewed otoliths under a microscope and aged them by counting the opaque bands (annuli) from the center to the anterior edge. We then used size-at-age datasets to estimate annual growth (g/year) from July 2011 to July 2012. We used the resulting growth estimates for size-specific growth inputs in bioenergetics simulations.
Thermal History We estimated the thermal history of the modeled cohorts of trout from a combination of monthly vertical temperature profiles and remote temperature data loggers placed at depths of 3-, 6-, and 9-m attached to a stationary buoy on the reservoir for a full year. Since the depth distribution of catches in gill nets varied throughout the water column, and the reservoir is shallow, we used the average of the three temperature loggers as the representative thermal history. We modeled all sizes and species of trout with the same temperature regime. To identify temperature sensitivity of model estimates of consumption, we also ran a set of simulations using the species consumption thermal optimum (CTO) assigned for each day the temperature was available in the reservoir. This scenario assumes trout will behaviorally thermoregulate when possible (Budy et al. 2013).
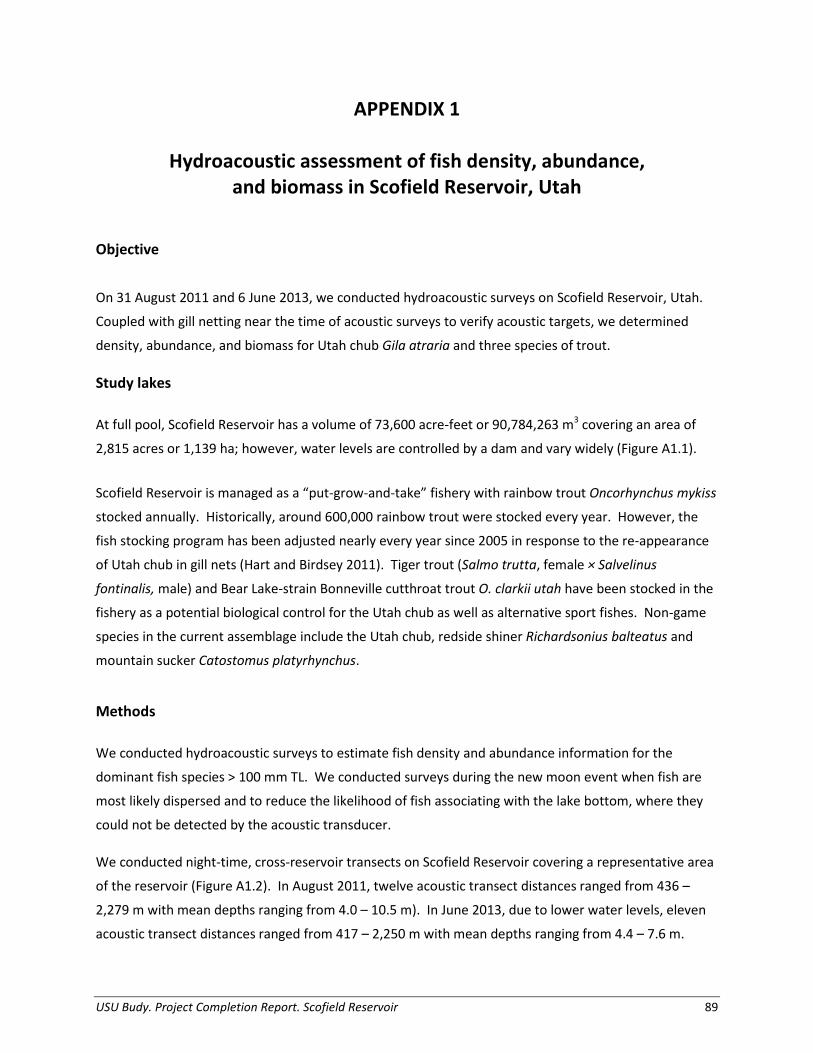
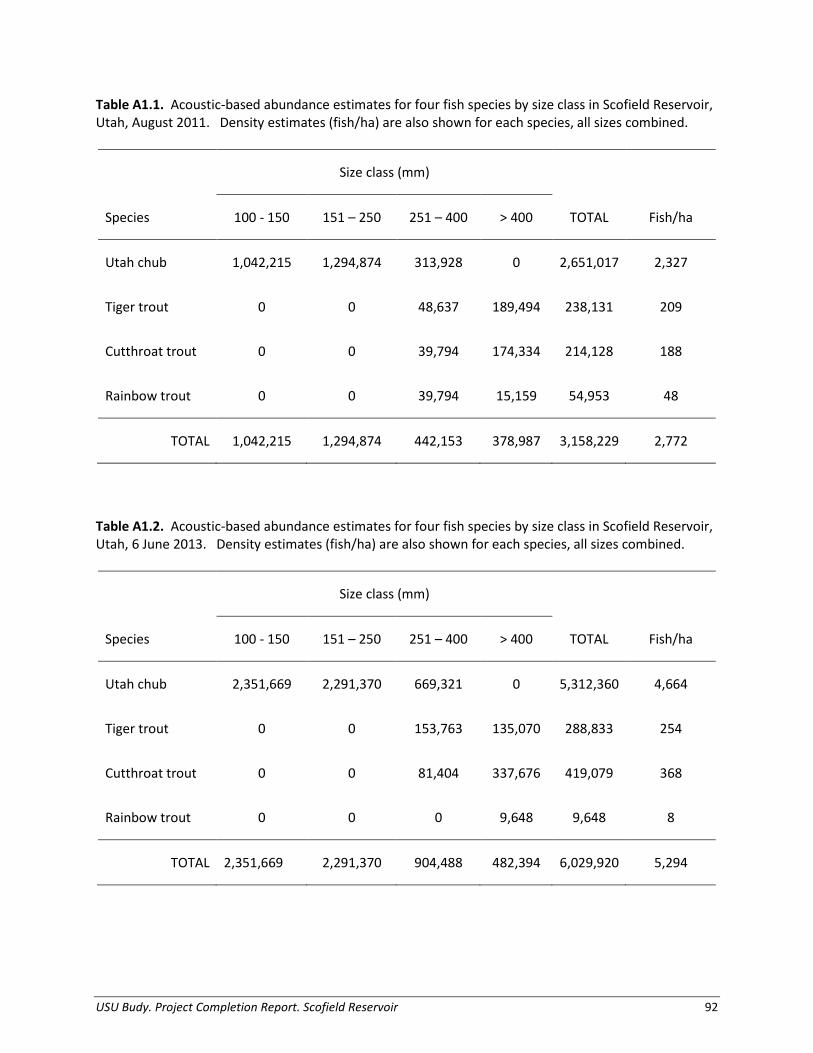
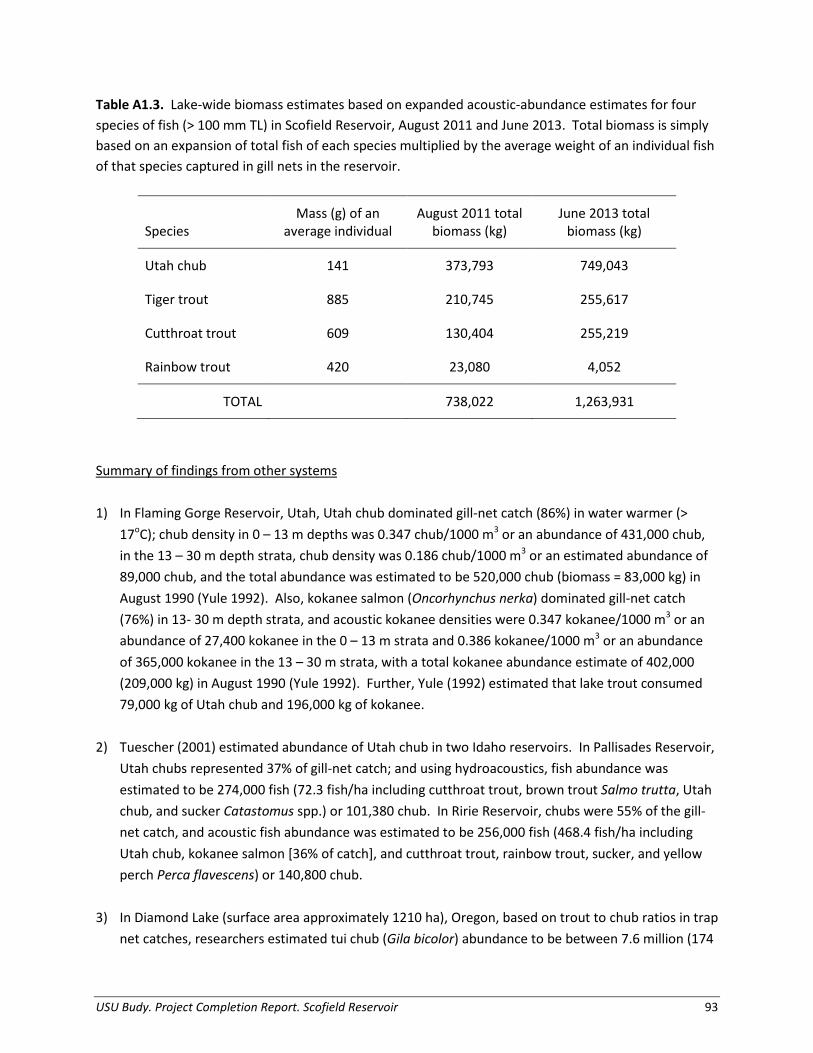
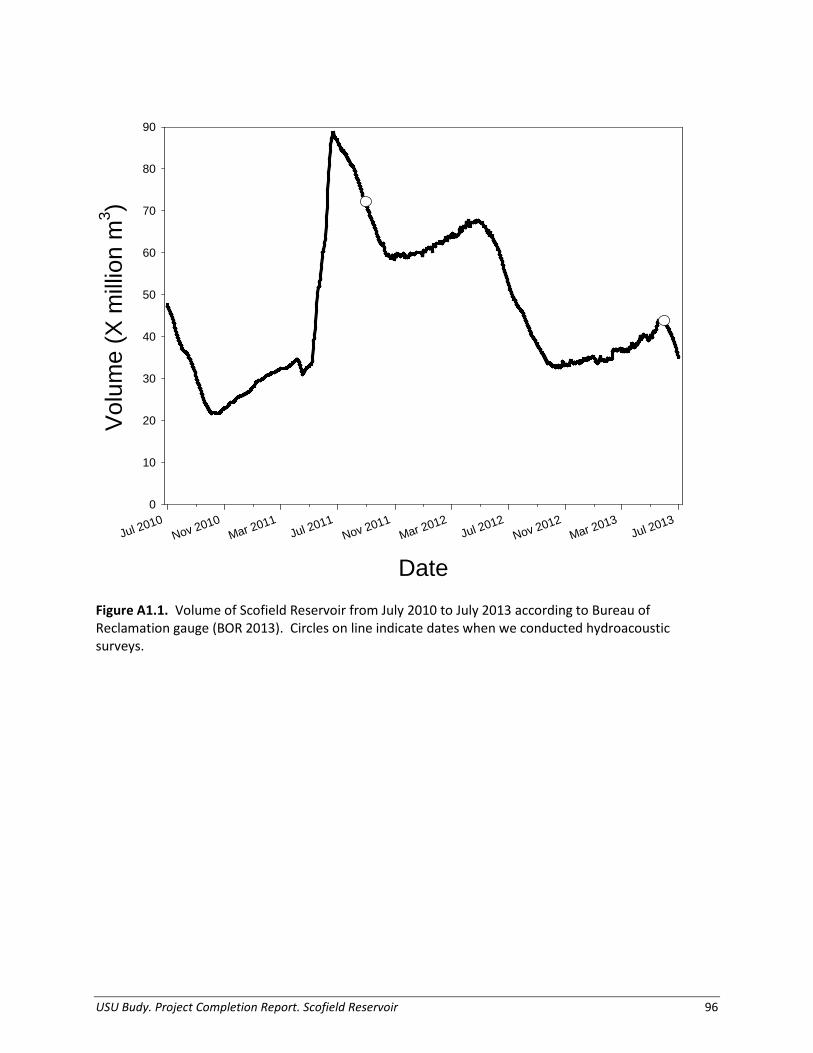
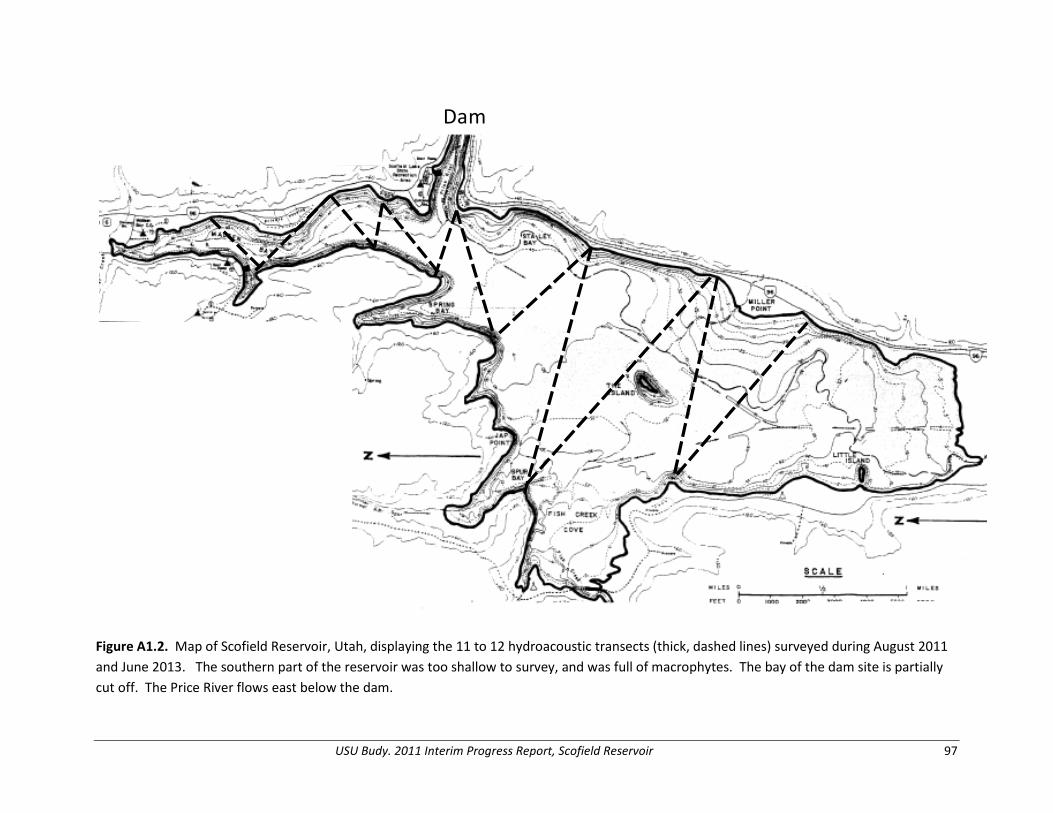
Prey Abundance, Biomass, and Production We conducted hydroacoustic surveys to provide density and abundance information of fishes > 100 mm TL (age-2 and older) in Scofield Reservoir (also see Appendix 1). We conducted surveys during the new moon event when fish are most likely dispersed and to reduce the likelihood of fish associating with the lake bottom, where they could not be detected by the acoustic transducer. We conducted night-time cross-reservoir transects on Scofield Reservoir covering a representative area of the reservoir. In August 2011, twelve acoustic transect distances ranged from 436 – 2,279 m with mean depths ranging from 4.0 – 10.5 m. In June 2013, due to lower water levels, eleven acoustic transect distances ranged from 417 – 2,250 m with mean depths ranging from 4.4 – 7.6 m. We collected data using a Biosonics Model DE6000 scientific echosounder with 420 kHz dual-beam transducer (6 X 15o) and towed the transducer on a fin at 1-m depth while recording data using Biosonics Visual Acquisition processing software. We sampled at a rate of two pings per second traveling at a boat speed of 1 – 2 m/s (2 – 5 kph). Pulse width of the signal was 0.4 ms. We processed acoustic target and density data using Biosonics Visual Analyzer software, using single fish targets with dual-beam target strengths ranging from -48 to -32 decibels (dB), representing fish 100 mm and larger (Dahm et al. 1985). We selected only echoes that met the single-target shape criteria used by the analysis software to calculate target strengths and densities. We treated transects as replicates in the analysis to
USU Budy. Project Completion Report. Scofield Reservoir 8
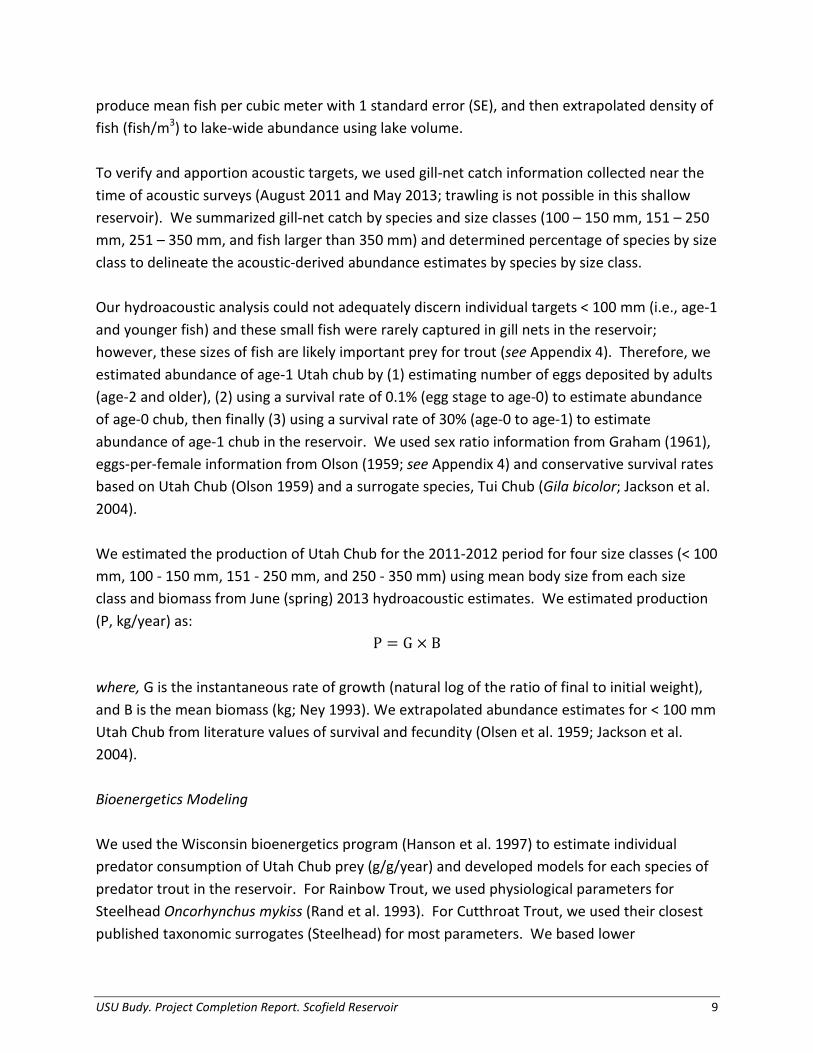
produce mean fish per cubic meter with 1 standard error (SE), and then extrapolated density of fish (fish/m3) to lake-wide abundance using lake volume. To verify and apportion acoustic targets, we used gill-net catch information collected near the time of acoustic surveys (August 2011 and May 2013; trawling is not possible in this shallow reservoir). We summarized gill-net catch by species and size classes (100 – 150 mm, 151 – 250 mm, 251 – 350 mm, and fish larger than 350 mm) and determined percentage of species by size class to delineate the acoustic-derived abundance estimates by species by size class. Our hydroacoustic analysis could not adequately discern individual targets < 100 mm (i.e., age-1 and younger fish) and these small fish were rarely captured in gill nets in the reservoir; however, these sizes of fish are likely important prey for trout (see Appendix 4). Therefore, we estimated abundance of age-1 Utah chub by (1) estimating number of eggs deposited by adults (age-2 and older), (2) using a survival rate of 0.1% (egg stage to age-0) to estimate abundance of age-0 chub, then finally (3) using a survival rate of 30% (age-0 to age-1) to estimate abundance of age-1 chub in the reservoir. We used sex ratio information from Graham (1961), eggs-per-female information from Olson (1959; see Appendix 4) and conservative survival rates based on Utah Chub (Olson 1959) and a surrogate species, Tui Chub (Gila bicolor; Jackson et al. 2004). We estimated the production of Utah Chub for the 2011-2012 period for four size classes (< 100 mm, 100 - 150 mm, 151 - 250 mm, and 250 - 350 mm) using mean body size from each size class and biomass from June (spring) 2013 hydroacoustic estimates. We estimated production (P, kg/year) as:
P = G × B where, G is the instantaneous rate of growth (natural log of the ratio of final to initial weight), and B is the mean biomass (kg; Ney 1993). We extrapolated abundance estimates for < 100 mm Utah Chub from literature values of survival and fecundity (Olsen et al. 1959; Jackson et al. 2004). Bioenergetics Modeling We used the Wisconsin bioenergetics program (Hanson et al. 1997) to estimate individual predator consumption of Utah Chub prey (g/g/year) and developed models for each species of predator trout in the reservoir. For Rainbow Trout, we used physiological parameters for Steelhead Oncorhynchus mykiss (Rand et al. 1993). For Cutthroat Trout, we used their closest published taxonomic surrogates (Steelhead) for most parameters. We based lower
USU Budy. Project Completion Report. Scofield Reservoir 9
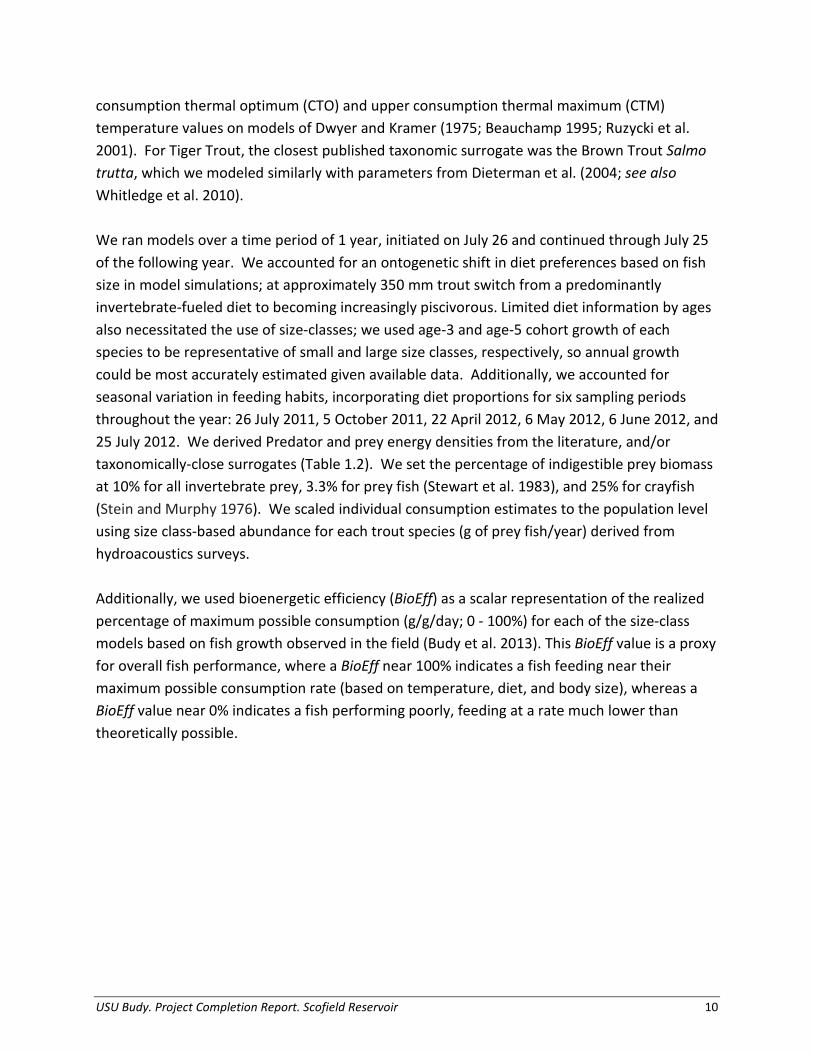
consumption thermal optimum (CTO) and upper consumption thermal maximum (CTM) temperature values on models of Dwyer and Kramer (1975; Beauchamp 1995; Ruzycki et al. 2001). For Tiger Trout, the closest published taxonomic surrogate was the Brown Trout Salmo trutta, which we modeled similarly with parameters from Dieterman et al. (2004; see also Whitledge et al. 2010). We ran models over a time period of 1 year, initiated on July 26 and continued through July 25 of the following year. We accounted for an ontogenetic shift in diet preferences based on fish size in model simulations; at approximately 350 mm trout switch from a predominantly invertebrate-fueled diet to becoming increasingly piscivorous. Limited diet information by ages also necessitated the use of size-classes; we used age-3 and age-5 cohort growth of each species to be representative of small and large size classes, respectively, so annual growth could be most accurately estimated given available data. Additionally, we accounted for seasonal variation in feeding habits, incorporating diet proportions for six sampling periods throughout the year: 26 July 2011, 5 October 2011, 22 April 2012, 6 May 2012, 6 June 2012, and 25 July 2012. We derived Predator and prey energy densities from the literature, and/or taxonomically-close surrogates (Table 1.2). We set the percentage of indigestible prey biomass at 10% for all invertebrate prey, 3.3% for prey fish (Stewart et al. 1983), and 25% for crayfish (Stein and Murphy 1976). We scaled individual consumption estimates to the population level using size class-based abundance for each trout species (g of prey fish/year) derived from hydroacoustics surveys. Additionally, we used bioenergetic efficiency (BioEff) as a scalar representation of the realized percentage of maximum possible consumption (g/g/day; 0 - 100%) for each of the size-class models based on fish growth observed in the field (Budy et al. 2013). This BioEff value is a proxy for overall fish performance, where a BioEff near 100% indicates a fish feeding near their maximum possible consumption rate (based on temperature, diet, and body size), whereas a BioEff value near 0% indicates a fish performing poorly, feeding at a rate much lower than theoretically possible.
USU Budy. Project Completion Report. Scofield Reservoir 10
Table 1.2. Wet weight energy density estimates of individual predators and prey items used for bioenergetics simulations. All estimates are from literature sources; where noted, a similar prey surrogate was substituted.
Prey Energy density
(Joules/g) Source Amphipoda 4429 Cummins and Wuycheck 1971
Chironomidae 3304 Cummins and Wuycheck 1971 Coleoptera 2448 Cummins and Wuycheck 1971 Decapoda 4507 Cummins and Wuycheck 1971
Ephemeroptera 3715 Cummins and Wuycheck 1971 Hemiptera 2621 Ciancio et al. 2007; Penczak et al. 1999 Isopoda 2624 Cummins and Wuycheck 1971
Mollusca 2007 Cauffope and Heymans 2005 Zooplankton 2445 Cladoceran, Cummins and Wuycheck 1971 Trichoptera 3342 Cummins and Wuycheck 1971
Fish 5230 Tui Chub (Gila bicolor), Raymond and Sobel 1990 Other aquatic invertebrates 3351 Cummins and Wuycheck 1971 Terrestrial invertebrates 2742 Cummins and Wuycheck 1971
Organic matter 2116 Penczak et al. 1999 Cutthroat Trout 5764 Steelhead, Hanson et al. 1997 Rainbow Trout 5921 Cummins and Wuycheck 1971; Hanson et al. 1997
Tiger Trout 5591 Brown Trout (S. trutta), Dieterman et al. 2004
Predator Performance We calculated condition of all predators using two indices, Fulton’s K (KTL) and relative weight (Wr), since body condition is related to the availability of prey:
Fulton's KTL=WL3 *100,000
Relative Weight Wr=100*(WWS
)
where W is the weight of the fish (mass, g), L is the total length (mm) of the fish, and WS is the standard weight of a fish of the same length. The KTL index assumes larger ratios reflect a
USU Budy. Project Completion Report. Scofield Reservoir 11
healthier physiological state (Pope and Kruse 2007). We obtained equations and values for WS from the literature for lentic Cutthroat Trout and lentic Rainbow Trout (Kruse and Hubert 1997; Simpkins and Hubert 1996). We estimated parameters for lentic Tiger Trout using a length-weight regression of summer 2011 Tiger Trout data (r2 = 0.97, a = -6.2159 and b = 3.4608). A Wr of 100 is generally accepted as the national standard (Anderson and Neumann 1996). We ran an analysis of variance (ANOVA) to compare Fulton’s KTL between each trout species and by season. Additionally, the Utah Division of Wildlife Resources has marked all stocked Cutthroat Trout and Rainbow Trout since 2009 with unique fluorescent dyes (red, green, and orange) or adipose fin clips, where each year corresponds to a different color dye or mark. We examined all Rainbow Trout and Cutthroat Trout caught for fluorescent dye marks by using an ultraviolet lamp set up in a dark room. We then calculated the relative return rate as the number of marked fish recaptured, divided by the initial number stocked by Utah Division of Wildlife Resources. We determined the proportional stock density (PSD) for each trout species following procedures outlined in Anderson and Neumann (1996):
PSD= (number of fish ≥ minimum quality length)(number of fish ≥ minimum stock length)
*100
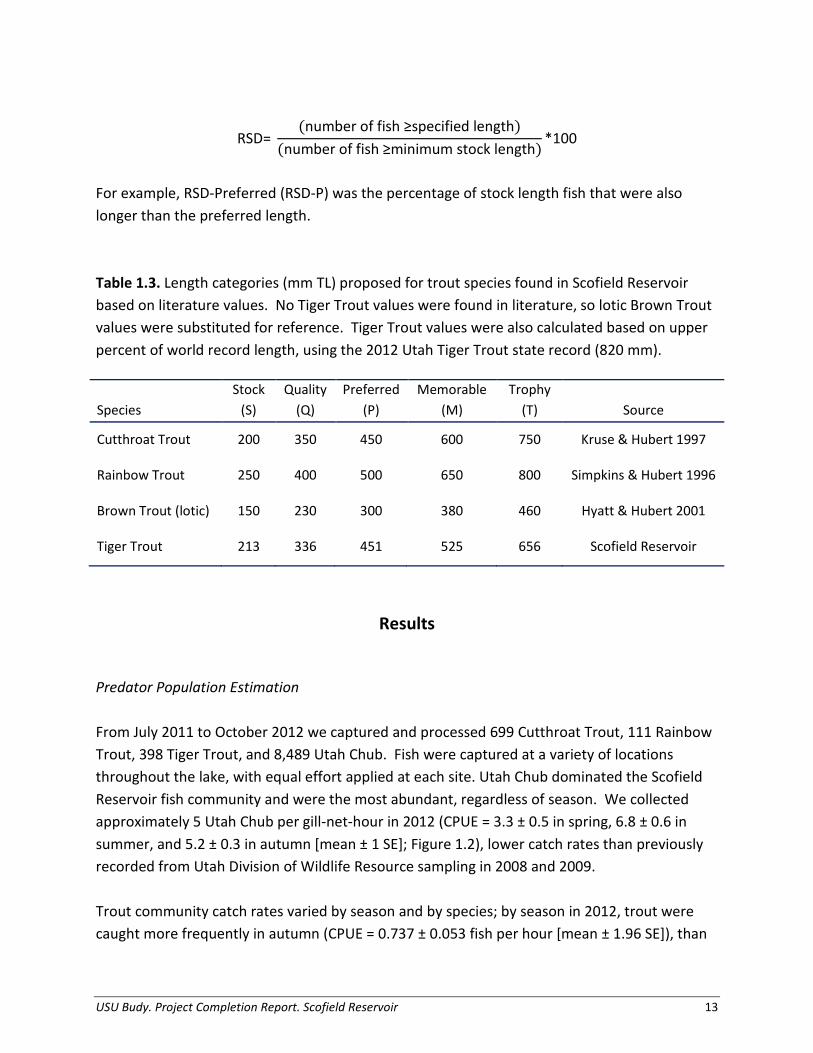
Values of PSD range from 1 to 100, and are a descriptor value of length-frequency data which may identify potential for “imbalances” in predator-prey population dynamics. For most fish, 40-70 is a typical objective range for “balanced” populations. Values less than the objective range indicate a population dominated by small fish, whereas values greater than the objective range indicate a population comprised mainly of large fish. Stock and quality lengths vary by species, and are based on percentages of world-record lengths (Gabelhouse 1984; Simpkins and Hubert 1996; Kruse and Hubert 1997; Hyatt and Hubert 2001). Stock length (20-26% of world-record length) refers to the minimum size fish with recreation value, while “quality” length (36-41% of world-record length) refers to the minimum size fish most anglers want to catch. We also evaluated the relative stock density (RSD) using values reported in Table 1.3. “Preferred” length (45-55% of world-record length) refers to the minimum size fish anglers prefer to catch when given a choice. “Memorable” length (59-64% of world-record length) refers to the minimum size fish most anglers remember catching, whereas “trophy” length (74-80% of world-record length) refers to the minimum size fish considered worthy of acknowledgement. Like PSD, RSD can provide useful information regarding population dynamics, but is more sensitive to changes in year-class strength. We calculated RSD as
USU Budy. Project Completion Report. Scofield Reservoir 12
RSD= (number of fish ≥specified length)
(number of fish ≥minimum stock length)*100
For example, RSD-Preferred (RSD-P) was the percentage of stock length fish that were also longer than the preferred length. Table 1.3. Length categories (mm TL) proposed for trout species found in Scofield Reservoir based on literature values. No Tiger Trout values were found in literature, so lotic Brown Trout values were substituted for reference. Tiger Trout values were also calculated based on upper percent of world record length, using the 2012 Utah Tiger Trout state record (820 mm).
Predator Population Estimation From July 2011 to October 2012 we captured and processed 699 Cutthroat Trout, 111 Rainbow Trout, 398 Tiger Trout, and 8,489 Utah Chub. Fish were captured at a variety of locations throughout the lake, with equal effort applied at each site. Utah Chub dominated the Scofield Reservoir fish community and were the most abundant, regardless of season. We collected approximately 5 Utah Chub per gill-net-hour in 2012 (CPUE = 3.3 ± 0.5 in spring, 6.8 ± 0.6 in summer, and 5.2 ± 0.3 in autumn [mean ± 1 SE]; Figure 1.2), lower catch rates than previously recorded from Utah Division of Wildlife Resource sampling in 2008 and 2009. Trout community catch rates varied by season and by species; by season in 2012, trout were caught more frequently in autumn (CPUE = 0.737 ± 0.053 fish per hour [mean ± 1.96 SE]), than
USU Budy. Project Completion Report. Scofield Reservoir 13
either the summer (CPUE = 0.242 ± 0.053 fish per hour) or spring (CPUE = 0.216 ± 0.053 fish per hour; ANOVA; F=34.39; df=2, 14; P < 0.001). By species, Cutthroat Trout were numerically dominant from Rainbow Trout, which were significantly less than Tiger Trout. There were no significant differences in Cutthroat Trout and Tiger Trout catch.
Table 1.4. Seasonal catch rate (CPUE), an index of relative abundance, calculated as the number of fish, per net, per hour, for Cutthroat Trout, Rainbow Trout, Tiger Trout, and Utah Chub in Scofield Reservoir, Utah. One standard error is shown in parentheses. A “---“ indicates no data was available.
Species Season CPUE 2011 2012
Cutthroat Trout
Spring --- 0.45 (0.1)
Summer 0.18 (0.022) 0.45 (0.08)
Autumn 0.20 (0.048) 0.68 (0.03)
Rainbow Trout
Spring --- 0.03 (0.01)
Summer 0.060 (0.015) 0.068 (0.02)
Autumn 0.014 (0.010) 0.037 (0.005)
Tiger Trout
Spring -- 0.18 (0.08)
Summer 0.19 (0.03) 0.20 (0.03)
Autumn 0.16 (0.04) 0.32 (0.01)
Utah Chub
Spring --- 3.3 (0.5)
Summer 3.7 (0.4) 6.8 (0.6)
Autumn 4.5 (1.4) 5.2 (0.3)
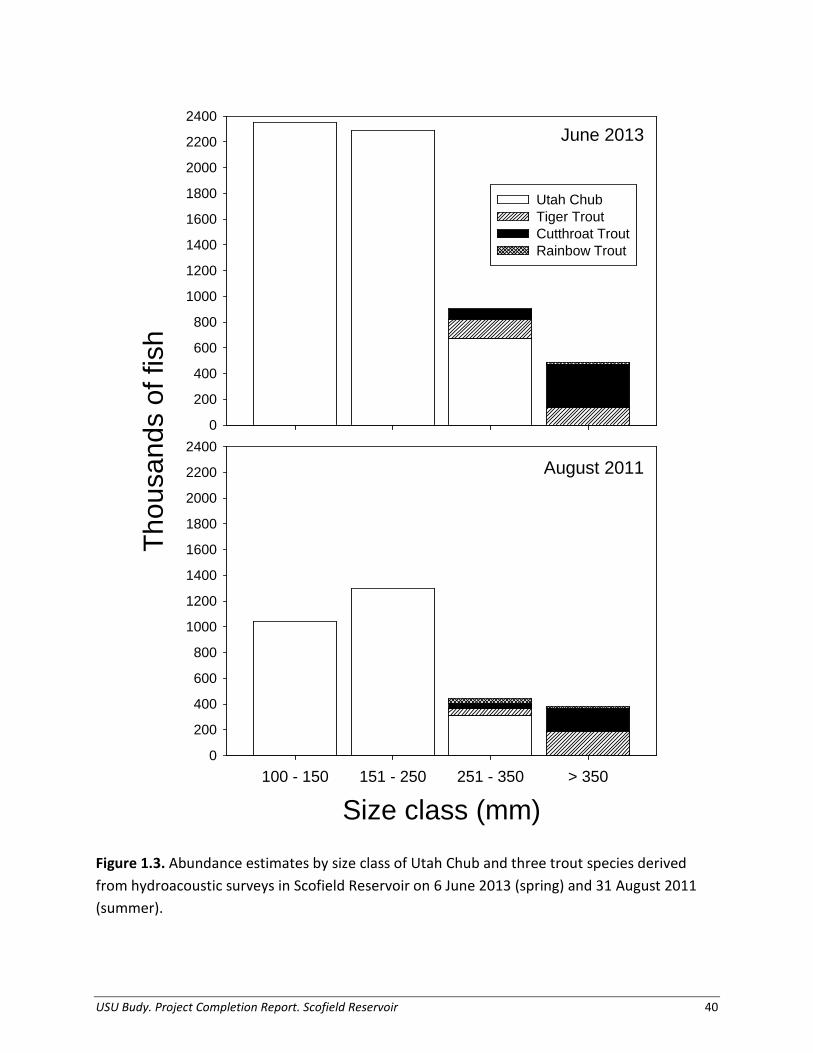
Estimates of abundance for Cutthroat Trout, Rainbow Trout, and Tiger Trout fluctuated based on season. Notably, Cutthroat Trout abundance ranged from low abundance in August 2011 to high abundance in June 2013 (Table 1.5; Figure 1.3), and made up 7% of the total catch in 2013. Tiger Trout were caught less frequently in gill nets than Cutthroat Trout, but still increased in abundance in early 2013, making up 4% of the total catch. Regardless of season, Rainbow Trout had extremely low catch rates (< 1%), with the population appearing to consist of only a small fraction of individuals compared to Cutthroat Trout and Tiger Trout. Proportionally, the Cutthroat Trout population was dominated by large fish (81%) and the Tiger Trout population
USU Budy. Project Completion Report. Scofield Reservoir 14
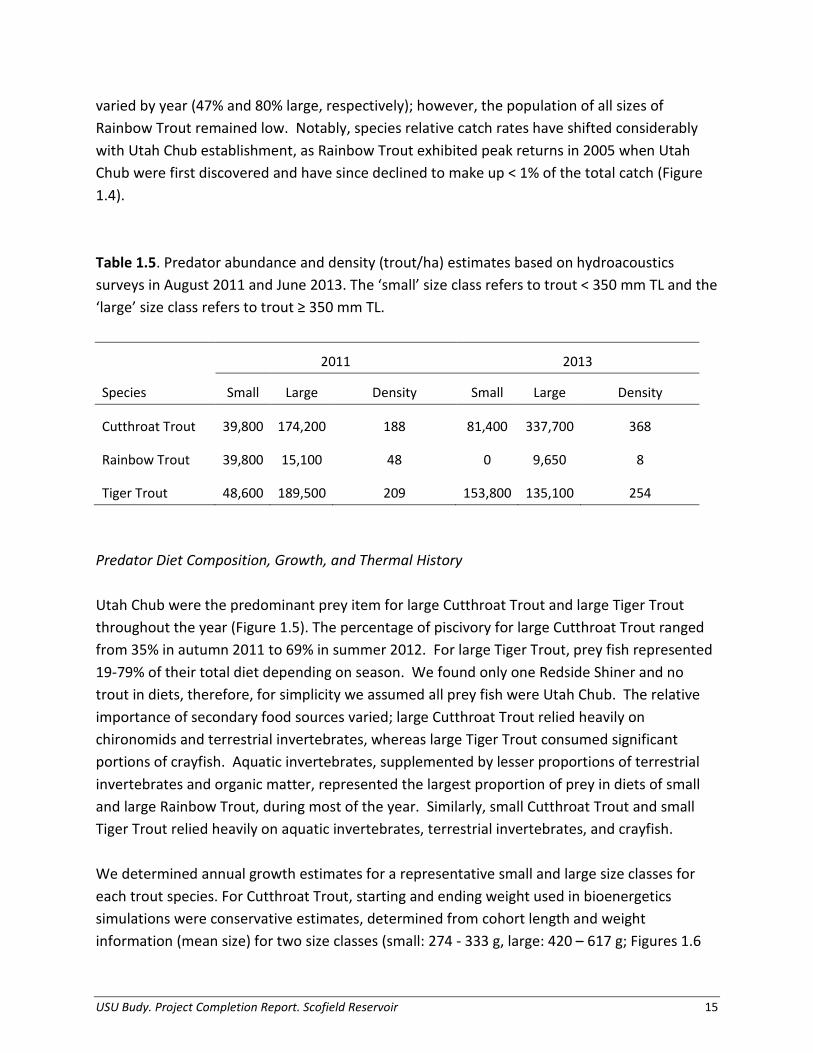
varied by year (47% and 80% large, respectively); however, the population of all sizes of Rainbow Trout remained low. Notably, species relative catch rates have shifted considerably with Utah Chub establishment, as Rainbow Trout exhibited peak returns in 2005 when Utah Chub were first discovered and have since declined to make up < 1% of the total catch (Figure 1.4). Table 1.5. Predator abundance and density (trout/ha) estimates based on hydroacoustics surveys in August 2011 and June 2013. The ‘small’ size class refers to trout < 350 mm TL and the ‘large’ size class refers to trout ≥ 350 mm TL.
Tiger Trout 48,600 189,500 209 153,800 135,100 254 Predator Diet Composition, Growth, and Thermal History Utah Chub were the predominant prey item for large Cutthroat Trout and large Tiger Trout throughout the year (Figure 1.5). The percentage of piscivory for large Cutthroat Trout ranged from 35% in autumn 2011 to 69% in summer 2012. For large Tiger Trout, prey fish represented 19-79% of their total diet depending on season. We found only one Redside Shiner and no trout in diets, therefore, for simplicity we assumed all prey fish were Utah Chub. The relative importance of secondary food sources varied; large Cutthroat Trout relied heavily on chironomids and terrestrial invertebrates, whereas large Tiger Trout consumed significant portions of crayfish. Aquatic invertebrates, supplemented by lesser proportions of terrestrial invertebrates and organic matter, represented the largest proportion of prey in diets of small and large Rainbow Trout, during most of the year. Similarly, small Cutthroat Trout and small Tiger Trout relied heavily on aquatic invertebrates, terrestrial invertebrates, and crayfish. We determined annual growth estimates for a representative small and large size classes for each trout species. For Cutthroat Trout, starting and ending weight used in bioenergetics simulations were conservative estimates, determined from cohort length and weight information (mean size) for two size classes (small: 274 - 333 g, large: 420 – 617 g; Figures 1.6
USU Budy. Project Completion Report. Scofield Reservoir 15
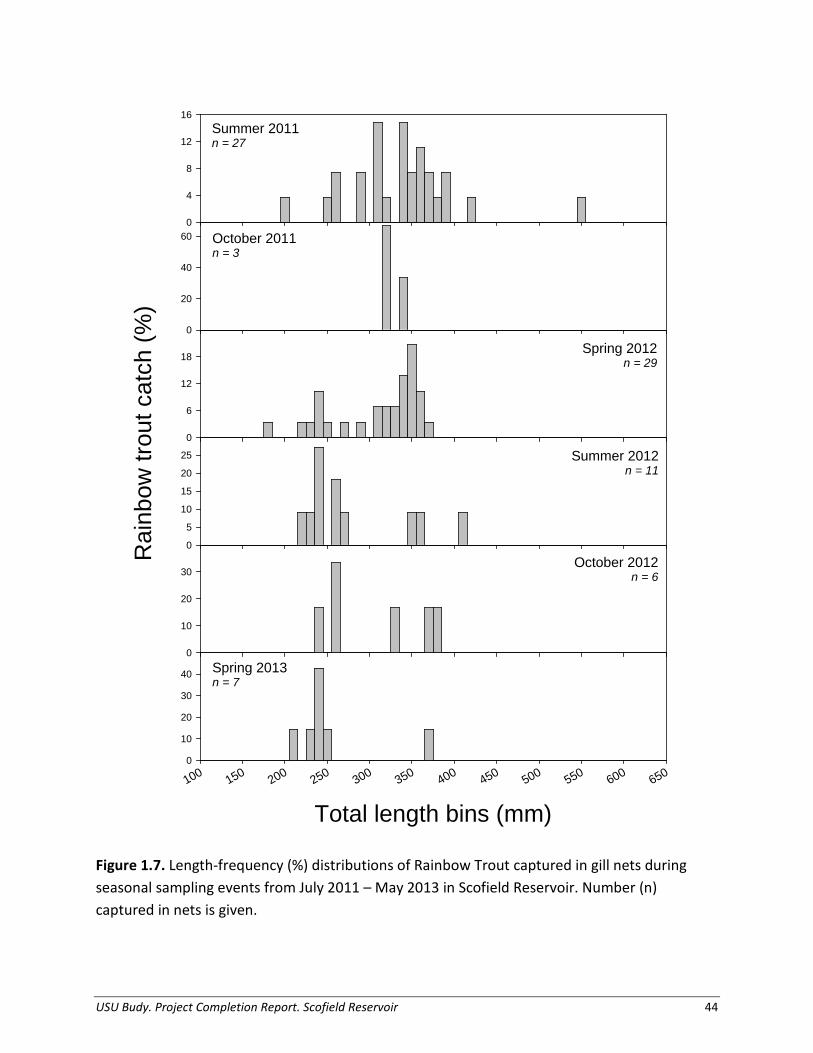
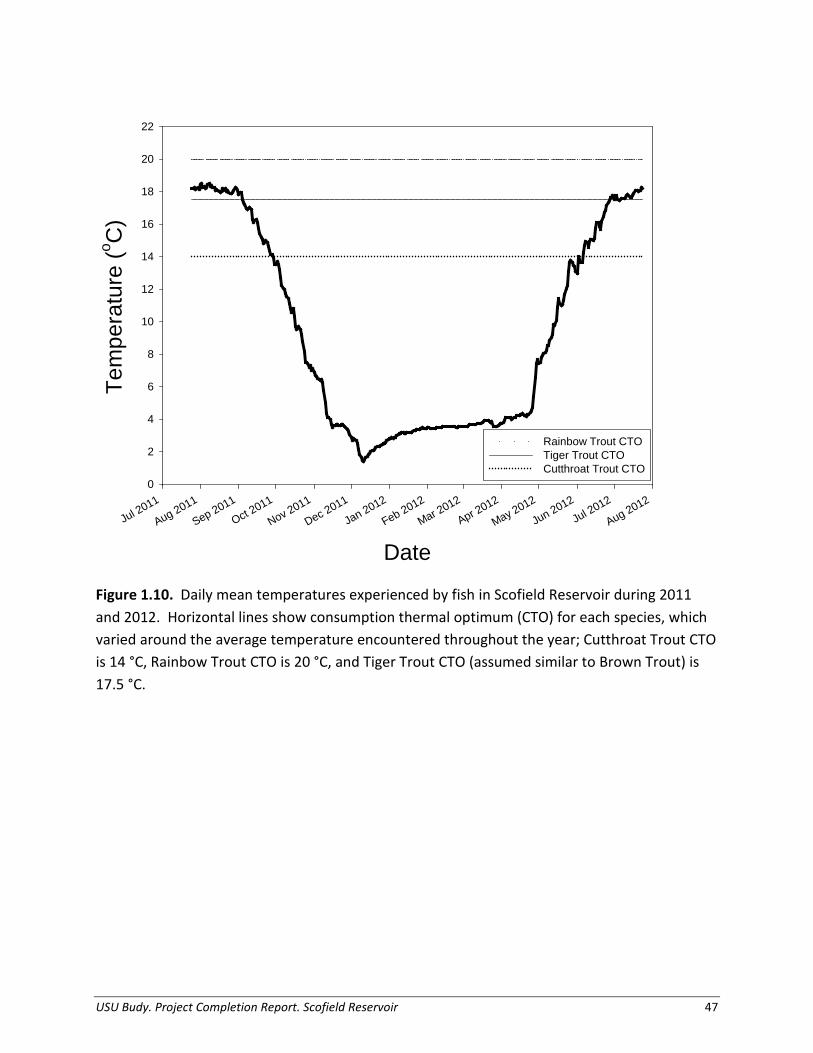
and 1.9). Rainbow Trout collected during both 2011 and 2012 ranged from age-2 to age-7 according to otoliths, with weight estimates based on otolith aging (small: 114 – 186 g, large: 495 – 614 g; Figures 1.7 and 1.9). There were no marked cohorts of Tiger Trout in Scofield Reservoir, therefore mean weight at size was determined from otolith size-at-age data (small: 134 – 327 g, large: 761 – 1901 g; Figures 1.8-1.9). Temperature was recorded at 1- hour intervals from 19 July 2011 – 7 September 2011 and 23 April 2012 to 7 June 2013, for depths of 3-, 6-, and 9-m from the surface (Figure 1.10). We combined these data with monthly temperature profiles taken by hand using a data logger to obtain a representative simulation year. Maximum average daily temperature during the simulation period was 18.5°C. The consumption thermal optimum (CTO) for Rainbow Trout, 20°C, was higher than Rainbow Trout typically experienced in the reservoir, whereas CTO for Tiger Trout, 17.5°C, was available in Scofield Reservoir during the summer months, and temperatures near the CTO of Cutthroat Trout, 14°C, were available through much of the time series. The consumption thermal optimum of a fish represents the optimum water temperature of a fish needed for maximum achieved consumption, based on laboratory studies (Hartman and Hayward 2007).
Prey Abundance, Biomass, and Production We estimated biomass and production of Utah Chub to quantify the amount of prey available in Scofield Reservoir. The biomass of Utah Chub varied from a low of 318,900 kg of Utah Chub in August 2011 to a high of 627,600 kg of Utah Chub in June 2013 (Table 1.6). Age -1 chub, or those < 100 mm TL, were estimated as 9,027,000 fish in the population in 2011 and 17,970,000 fish in 2013 (Table 1.6). Using biomass and mass gain by size class, Utah Chub production was estimated at 433,960 kg/year (8,272,600 Chub/year) during the end of the summer growth season in 2011. In comparison, Utah Chub production at the start of the season in 2013 was 649,630 kg/year (9,989,700 Chub/year; Figure 1.11). Bioenergetics Simulations of Consumption Of all predator species, an average, individual large Tiger Trout consumed the largest proportion of prey fish, primarily Utah Chub. The average large individual Tiger Trout consumed over 2,660 g of prey fish in a given year (63 Chub per year; Table 1.6). The average individual large Cutthroat Trout consumed 1,820 g Utah Chub annually (49 chub per year). The mean total length of Utah Chub eaten by Cutthroat Trout was 131 mm (37 g), while the mean total length of Utah Chub eaten by Tiger Trout was 139 mm (42 g); these sizes were used to scale consumption estimates (g) to number of Chub. Rainbow Trout did not display an affinity for
USU Budy. Project Completion Report. Scofield Reservoir 16
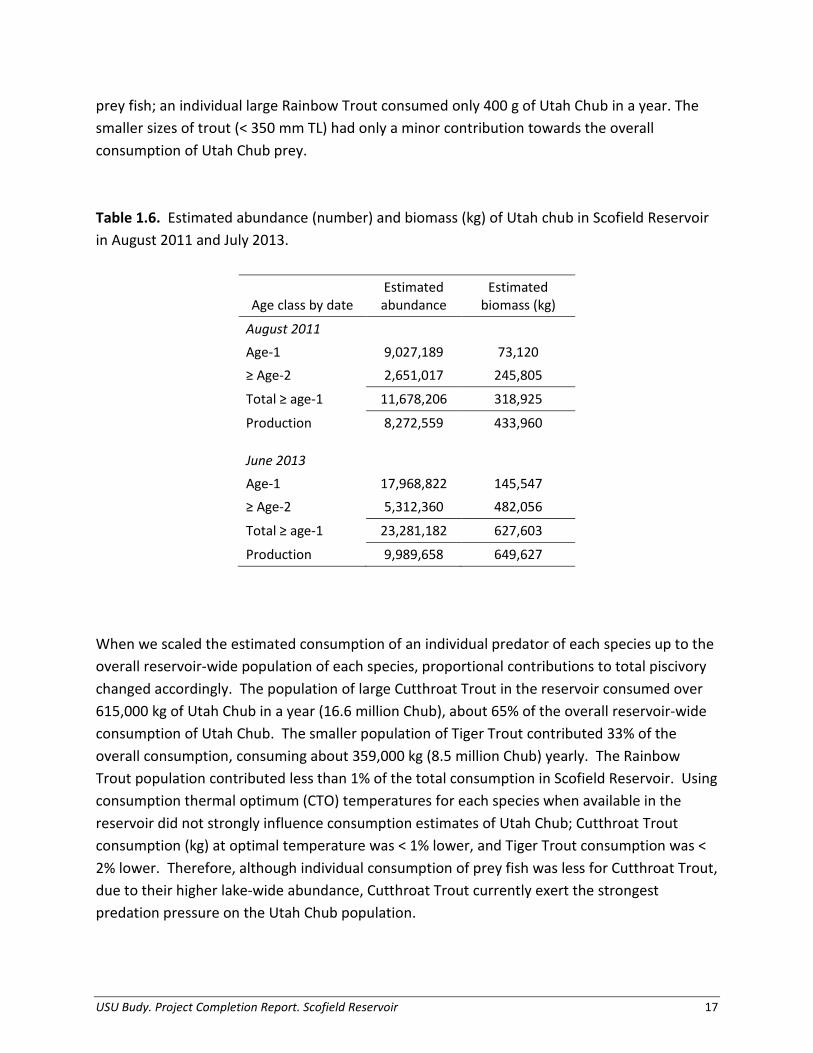
prey fish; an individual large Rainbow Trout consumed only 400 g of Utah Chub in a year. The smaller sizes of trout (< 350 mm TL) had only a minor contribution towards the overall consumption of Utah Chub prey. Table 1.6. Estimated abundance (number) and biomass (kg) of Utah chub in Scofield Reservoir in August 2011 and July 2013.
Age class by date Estimated abundance
Estimated biomass (kg)
August 2011 Age-1 9,027,189 73,120 ≥ Age-2 2,651,017 245,805
Total ≥ age-1 11,678,206 318,925
Production 8,272,559 433,960 June 2013 Age-1 17,968,822 145,547 ≥ Age-2 5,312,360 482,056
Total ≥ age-1 23,281,182 627,603
Production 9,989,658 649,627
When we scaled the estimated consumption of an individual predator of each species up to the overall reservoir-wide population of each species, proportional contributions to total piscivory changed accordingly. The population of large Cutthroat Trout in the reservoir consumed over 615,000 kg of Utah Chub in a year (16.6 million Chub), about 65% of the overall reservoir-wide consumption of Utah Chub. The smaller population of Tiger Trout contributed 33% of the overall consumption, consuming about 359,000 kg (8.5 million Chub) yearly. The Rainbow Trout population contributed less than 1% of the total consumption in Scofield Reservoir. Using consumption thermal optimum (CTO) temperatures for each species when available in the reservoir did not strongly influence consumption estimates of Utah Chub; Cutthroat Trout consumption (kg) at optimal temperature was < 1% lower, and Tiger Trout consumption was < 2% lower. Therefore, although individual consumption of prey fish was less for Cutthroat Trout, due to their higher lake-wide abundance, Cutthroat Trout currently exert the strongest predation pressure on the Utah Chub population.
USU Budy. Project Completion Report. Scofield Reservoir 17
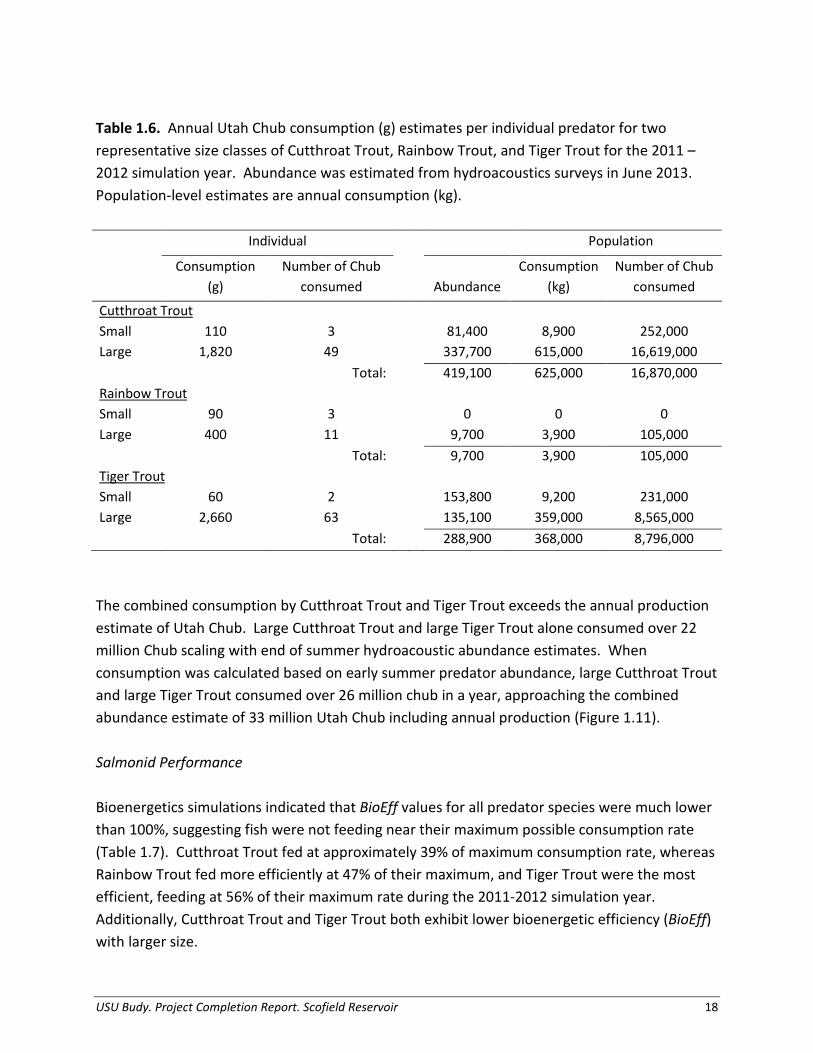
Table 1.6. Annual Utah Chub consumption (g) estimates per individual predator for two representative size classes of Cutthroat Trout, Rainbow Trout, and Tiger Trout for the 2011 – 2012 simulation year. Abundance was estimated from hydroacoustics surveys in June 2013. Population-level estimates are annual consumption (kg).
Individual Population
Consumption
(g) Number of Chub
consumed
Abundance Consumption
(kg) Number of Chub
consumed
Cutthroat Trout
Small 110 3 81,400 8,900 252,000 Large 1,820 49 337,700 615,000 16,619,000
Total: 419,100 625,000 16,870,000
Rainbow Trout
Small 90 3 0 0 0 Large 400 11 9,700 3,900 105,000
Total: 9,700 3,900 105,000
Tiger Trout
Small 60 2 153,800 9,200 231,000 Large 2,660 63 135,100 359,000 8,565,000
Total: 288,900 368,000 8,796,000
The combined consumption by Cutthroat Trout and Tiger Trout exceeds the annual production estimate of Utah Chub. Large Cutthroat Trout and large Tiger Trout alone consumed over 22 million Chub scaling with end of summer hydroacoustic abundance estimates. When consumption was calculated based on early summer predator abundance, large Cutthroat Trout and large Tiger Trout consumed over 26 million chub in a year, approaching the combined abundance estimate of 33 million Utah Chub including annual production (Figure 1.11).
Salmonid Performance Bioenergetics simulations indicated that BioEff values for all predator species were much lower than 100%, suggesting fish were not feeding near their maximum possible consumption rate (Table 1.7). Cutthroat Trout fed at approximately 39% of maximum consumption rate, whereas Rainbow Trout fed more efficiently at 47% of their maximum, and Tiger Trout were the most efficient, feeding at 56% of their maximum rate during the 2011-2012 simulation year. Additionally, Cutthroat Trout and Tiger Trout both exhibit lower bioenergetic efficiency (BioEff) with larger size.
USU Budy. Project Completion Report. Scofield Reservoir 18
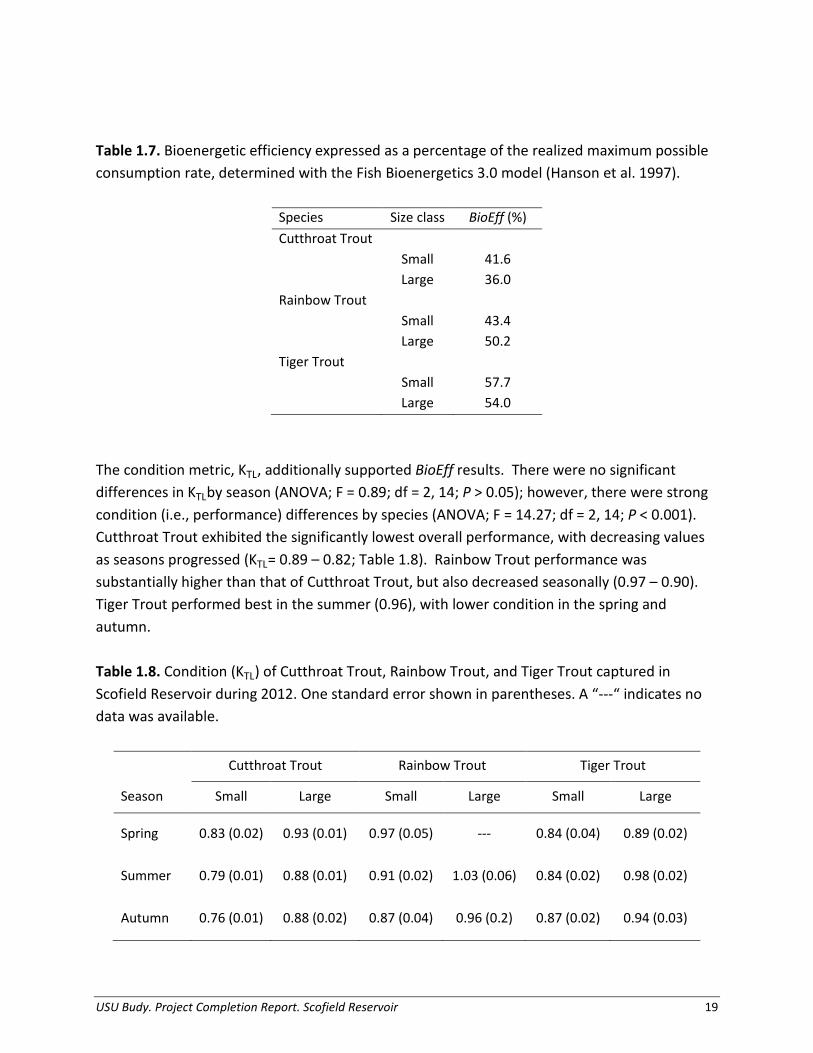
Table 1.7. Bioenergetic efficiency expressed as a percentage of the realized maximum possible consumption rate, determined with the Fish Bioenergetics 3.0 model (Hanson et al. 1997).
Species Size class BioEff (%) Cutthroat Trout
Small 41.6
Large 36.0
Rainbow Trout
Small 43.4
Large 50.2
Tiger Trout
Small 57.7
Large 54.0
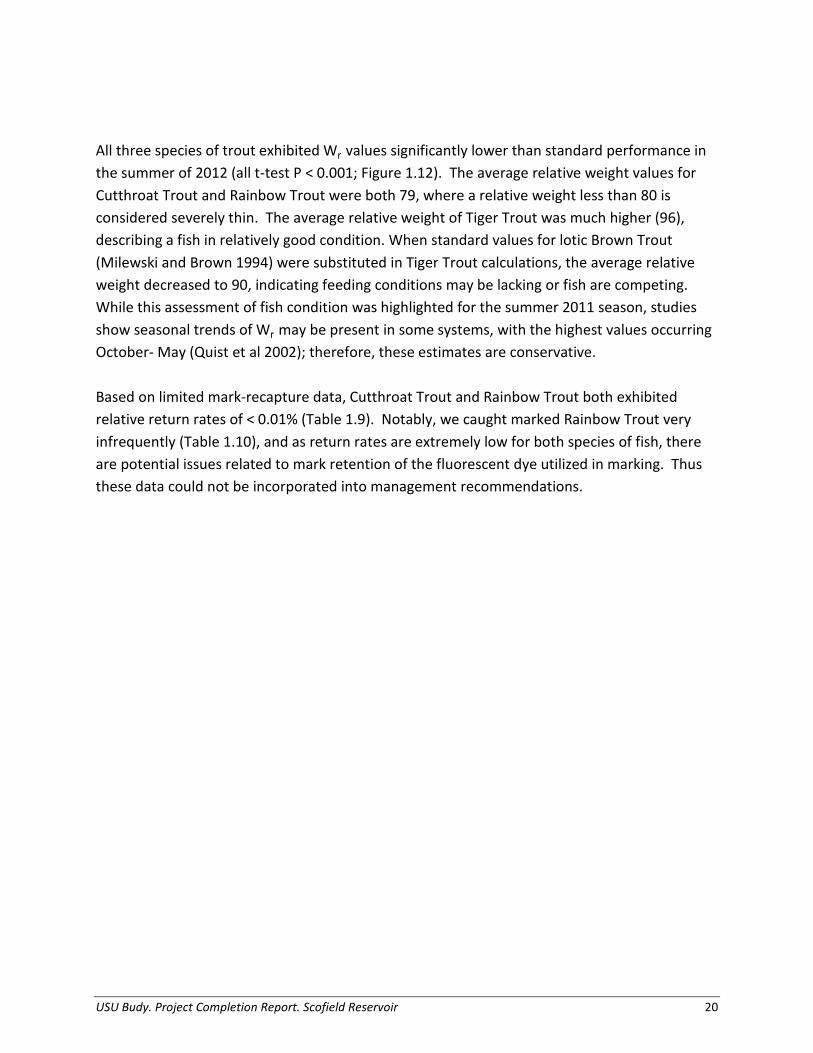
The condition metric, KTL, additionally supported BioEff results. There were no significant differences in KTLby season (ANOVA; F = 0.89; df = 2, 14; P > 0.05); however, there were strong condition (i.e., performance) differences by species (ANOVA; F = 14.27; df = 2, 14; P < 0.001). Cutthroat Trout exhibited the significantly lowest overall performance, with decreasing values as seasons progressed (KTL= 0.89 – 0.82; Table 1.8). Rainbow Trout performance was substantially higher than that of Cutthroat Trout, but also decreased seasonally (0.97 – 0.90). Tiger Trout performed best in the summer (0.96), with lower condition in the spring and autumn. Table 1.8. Condition (KTL) of Cutthroat Trout, Rainbow Trout, and Tiger Trout captured in Scofield Reservoir during 2012. One standard error shown in parentheses. A “---“ indicates no data was available.
USU Budy. Project Completion Report. Scofield Reservoir 19
All three species of trout exhibited Wr values significantly lower than standard performance in the summer of 2012 (all t-test P < 0.001; Figure 1.12). The average relative weight values for Cutthroat Trout and Rainbow Trout were both 79, where a relative weight less than 80 is considered severely thin. The average relative weight of Tiger Trout was much higher (96), describing a fish in relatively good condition. When standard values for lotic Brown Trout (Milewski and Brown 1994) were substituted in Tiger Trout calculations, the average relative weight decreased to 90, indicating feeding conditions may be lacking or fish are competing. While this assessment of fish condition was highlighted for the summer 2011 season, studies show seasonal trends of Wr may be present in some systems, with the highest values occurring October- May (Quist et al 2002); therefore, these estimates are conservative.
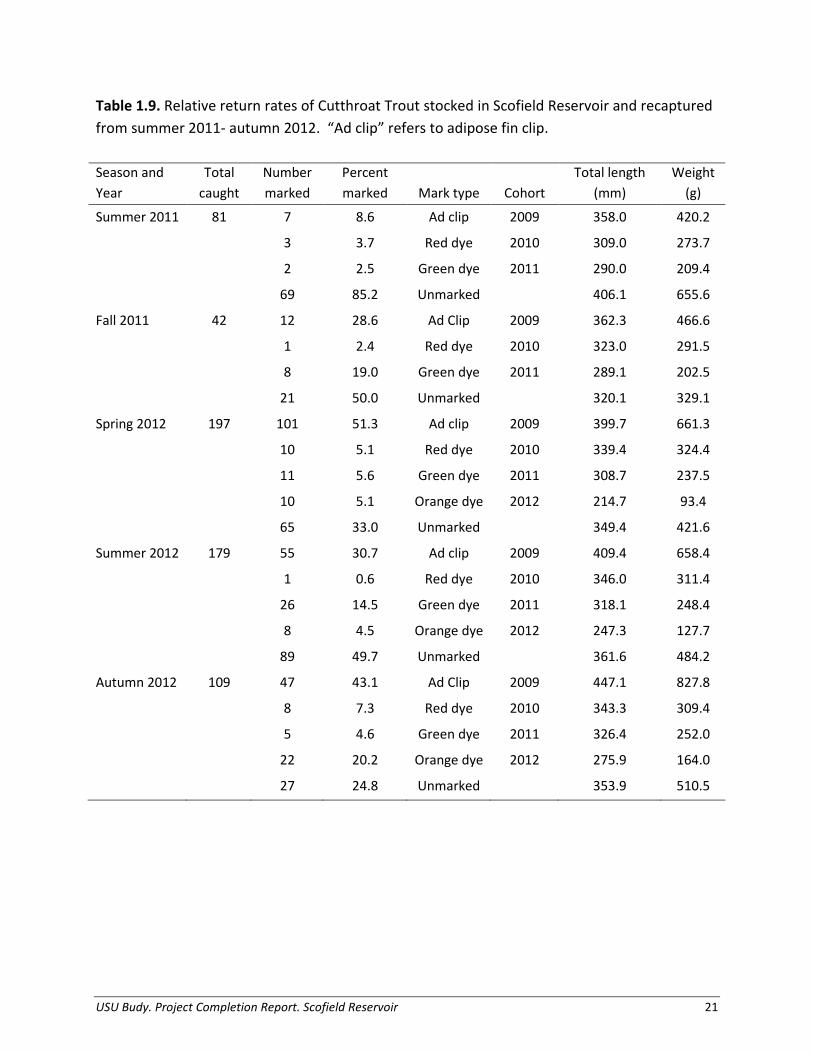
Based on limited mark-recapture data, Cutthroat Trout and Rainbow Trout both exhibited relative return rates of < 0.01% (Table 1.9). Notably, we caught marked Rainbow Trout very infrequently (Table 1.10), and as return rates are extremely low for both species of fish, there are potential issues related to mark retention of the fluorescent dye utilized in marking. Thus these data could not be incorporated into management recommendations.
USU Budy. Project Completion Report. Scofield Reservoir 20
Table 1.9. Relative return rates of Cutthroat Trout stocked in Scofield Reservoir and recaptured from summer 2011- autumn 2012. “Ad clip” refers to adipose fin clip. Season and Year
Total caught
Number marked
Percent marked Mark type Cohort
Total length (mm)
Weight (g)
Summer 2011 81 7 8.6 Ad clip 2009 358.0 420.2
3 3.7 Red dye 2010 309.0 273.7
2 2.5 Green dye 2011 290.0 209.4
69 85.2 Unmarked
406.1 655.6
Fall 2011 42 12 28.6 Ad Clip 2009 362.3 466.6
1 2.4 Red dye 2010 323.0 291.5
8 19.0 Green dye 2011 289.1 202.5
21 50.0 Unmarked
320.1 329.1
Spring 2012 197 101 51.3 Ad clip 2009 399.7 661.3
10 5.1 Red dye 2010 339.4 324.4
11 5.6 Green dye 2011 308.7 237.5
10 5.1 Orange dye 2012 214.7 93.4
65 33.0 Unmarked
349.4 421.6
Summer 2012 179 55 30.7 Ad clip 2009 409.4 658.4
1 0.6 Red dye 2010 346.0 311.4
26 14.5 Green dye 2011 318.1 248.4
8 4.5 Orange dye 2012 247.3 127.7
89 49.7 Unmarked
361.6 484.2
Autumn 2012 109 47 43.1 Ad Clip 2009 447.1 827.8
8 7.3 Red dye 2010 343.3 309.4
5 4.6 Green dye 2011 326.4 252.0
22 20.2 Orange dye 2012 275.9 164.0
27 24.8 Unmarked 353.9 510.5
USU Budy. Project Completion Report. Scofield Reservoir 21
Table 1.10. Relative return rates of Rainbow Trout stocked in Scofield Reservoir and recaptured from summer 2011 – autumn 2012. “Ad clip” refers to adipose fin clip. A “---“ indicates data was not available.
Season and Year
Total caught
Number marked
Percent marked Mark type Cohort
Total length (mm)
Weight (g)
Summer 2011 27 2 7.4 Ad clip 2009 334.0 357.9
4 14.8 Red dye 2010 287.0 449.1
21 77.78 Unmarked
342.81 459.82
Fall 2011 3 1 33.3 Ad clip 2009 320 334.5
1 33.3 Red dye 2010 316 333.9
0 0.0 Green dye 2011 --- ---
1 33.3 Unmarked
340 426.3
Spring 2012 13 1 7.7 Ad Clip 2009 344 374.1
2 15.4 Red 2010 330.5 443.0
4 30.8 Green 2011 297.0 250.5
6 46.2 Unmarked
273.2 224.5
Summer 2012 27 2 7.4 Ad clip 2009 357.5 457.15
1 3.7 Red dye 2010 332.0 382.1
2 7.4 Green dye 2011 307.0 295.1
22 81.5 Unmarked
291.2 264.3
Autumn 2012 6 1 16.7 Ad clip 2009 251.0 134.9
1 16.7 Red clip 2010 326.0 285.4
0 0.0 Green clip 2011 --- ---
1 16.7 Orange clip 2012 256.0 140.5
3 50.0 Unmarked 323.7 363.4
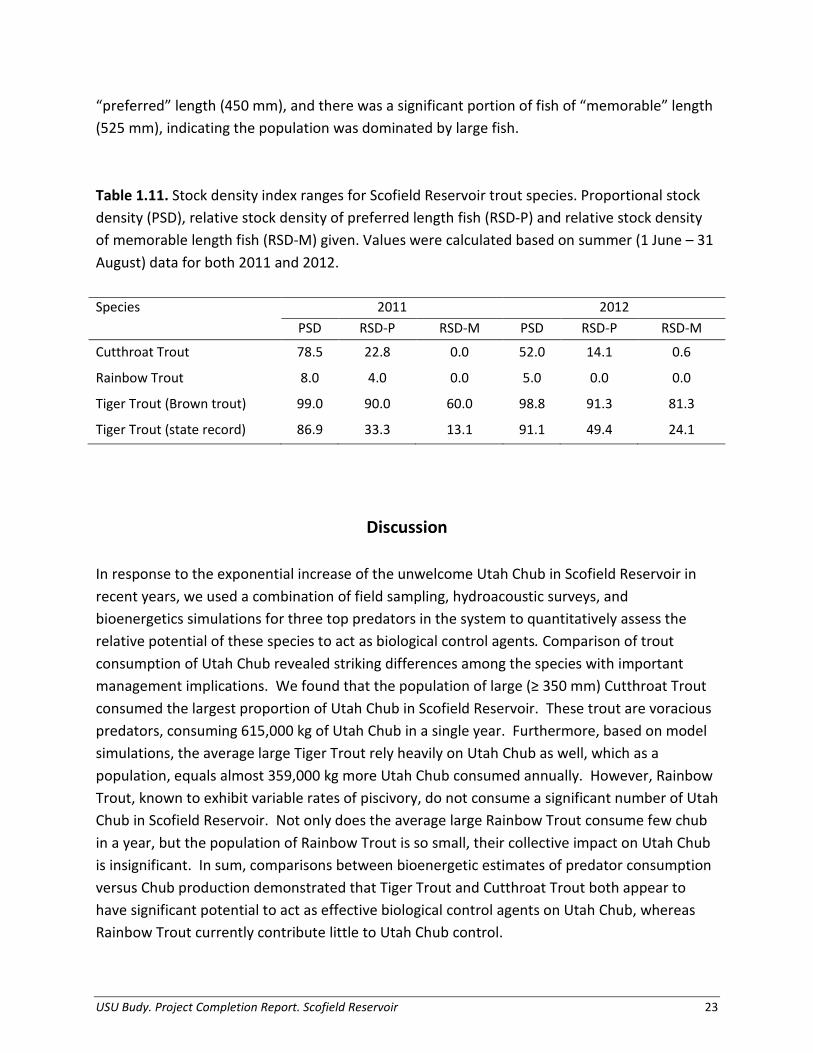
Stock density values of trout in Scofield Reservoir fluctuated widely, despite initial stockings at similar numbers and sizes. In Scofield Reservoir, Rainbow Trout exhibited extremely low PSD and RSD-P values, with few fish above the “preferred” length of 500 mm and no proportion of fish above the “memorable” length of 650 mm (Table 1.11). Cutthroat Trout exhibited relatively high values of proportional stock density, with a substantial proportion of fish above the “preferred” length of 450 mm. Nearly all Tiger Trout in Scofield Reservoir were of
USU Budy. Project Completion Report. Scofield Reservoir 22
“preferred” length (450 mm), and there was a significant portion of fish of “memorable” length (525 mm), indicating the population was dominated by large fish. Table 1.11. Stock density index ranges for Scofield Reservoir trout species. Proportional stock density (PSD), relative stock density of preferred length fish (RSD-P) and relative stock density of memorable length fish (RSD-M) given. Values were calculated based on summer (1 June – 31 August) data for both 2011 and 2012. Species 2011 2012 PSD RSD-P RSD-M PSD RSD-P RSD-M
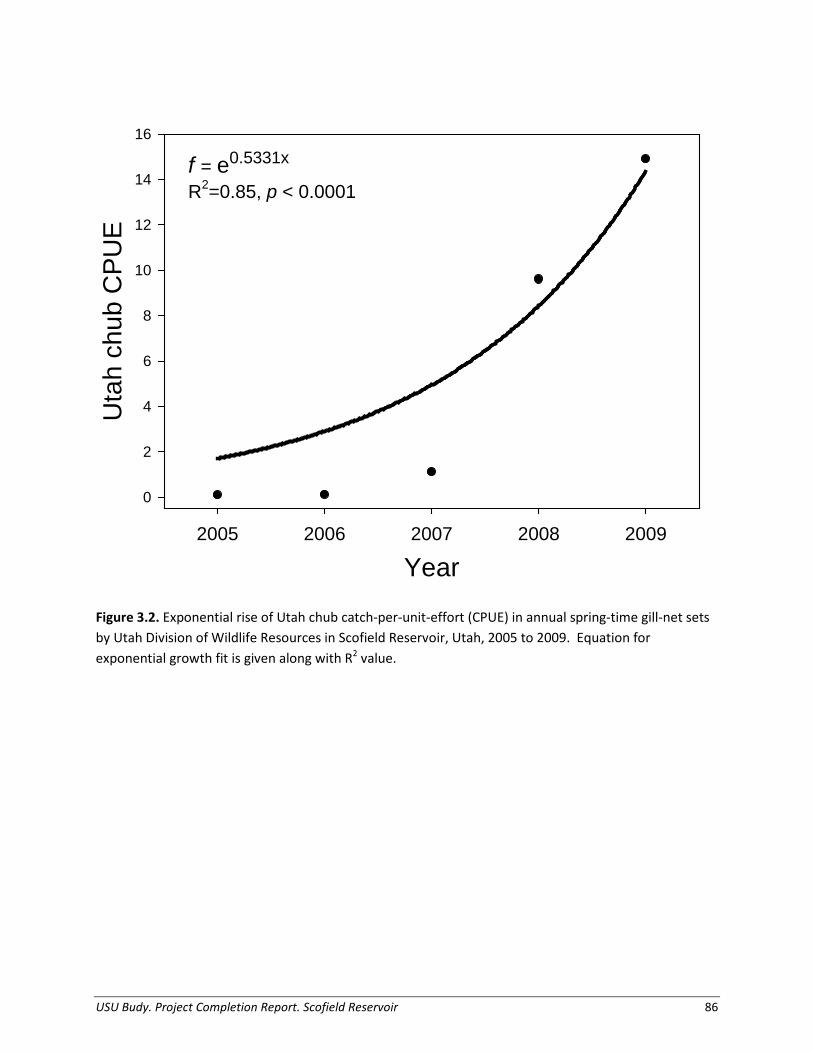
In response to the exponential increase of the unwelcome Utah Chub in Scofield Reservoir in recent years, we used a combination of field sampling, hydroacoustic surveys, and bioenergetics simulations for three top predators in the system to quantitatively assess the relative potential of these species to act as biological control agents. Comparison of trout consumption of Utah Chub revealed striking differences among the species with important management implications. We found that the population of large (≥ 350 mm) Cutthroat Trout consumed the largest proportion of Utah Chub in Scofield Reservoir. These trout are voracious predators, consuming 615,000 kg of Utah Chub in a single year. Furthermore, based on model simulations, the average large Tiger Trout rely heavily on Utah Chub as well, which as a population, equals almost 359,000 kg more Utah Chub consumed annually. However, Rainbow Trout, known to exhibit variable rates of piscivory, do not consume a significant number of Utah Chub in Scofield Reservoir. Not only does the average large Rainbow Trout consume few chub in a year, but the population of Rainbow Trout is so small, their collective impact on Utah Chub is insignificant. In sum, comparisons between bioenergetic estimates of predator consumption versus Chub production demonstrated that Tiger Trout and Cutthroat Trout both appear to have significant potential to act as effective biological control agents on Utah Chub, whereas Rainbow Trout currently contribute little to Utah Chub control.
USU Budy. Project Completion Report. Scofield Reservoir 23
Utah Chub were caught in extremely high densities throughout the time period of this study, confirming that the population of Utah Chub has increased to very high levels. Abundance estimates from June 2013 suggest there are over 23 million chub (1,277,000 kg) in the reservoir. This estimate is substantially lower when using acoustic data from late August, perhaps because trout consumed large quantities of chub throughout the summer growing season. Nonetheless, we estimated production of Utah Chub in 2013 at a rate of 2.5 million chub per year. Utah Chub are a non-game fish that are not targeted by harvest and that exhibit high reproductive potential (Neuhold 1957). As such, the high production rates of Utah Chub in Scofield Reservoir are not surprising, and are most likely due to favorable littoral habitat and abundant food supply (Olsen 1959). In Scofield Reservoir, summer Daphnia densities (0.1 per L) were low compared to a nearby Utah reservoir (7.4 per L), possibly indicating Utah Chub feed heavily on these available aquatic zooplankton (Baldwin et al. 2000). Abundance and production estimates for Utah Chub are based on a few important assumptions. Our acoustic surveys were only able to clearly account for fish 100 mm and larger, as such, the age-0 and age-1 Utah Chub fell outside acoustic-target acceptance guidelines; and abundance of age-1 Chub were necessarily back-calculated based on literature estimates of fecundity (Olson 1959); sex ratios (Graham 1961), and survival values for Utah chub (held in captivity; Olson 1959) and Tui Chub Gila bicolor (Jackson et al. 2004). Nonetheless, our results are logical and consistent with expected values from similar prey-dominated systems. Eilers et al. (2011) estimated up to 23 million Tui Chub present in Diamond Lake, Oregon before a prescribed rotenone treatment, with a density of ‘catchable’ Tui Chub equal to 0.09 fish/m³. Comparatively, we estimated densities of 0.04 fish /m³ - 0.13 fish /m³ of Utah Chub at Scofield Reservoir. Additionally, historical evidence demonstrates that Utah Chub coexisting with Cutthroat Trout display higher juvenile growth rates, delayed age at maturity, and larger size at maturity, as chub that reach adult sizes are less vulnerable to predation (Johnson and Belk 1999). Utah Chub in Scofield Reservoir display similar life-history traits; there are a substantial proportion of Utah Chub larger than gape-limited predators are able to consume. Consequently, the reproductively-mature portion of this population of Chub must senesce before trout predators will be fully capable of controlling the population (see Chapter 3). The full impacts of Cutthroat Trout and Tiger Trout on Utah Chub in Scofield reservoir are likely even greater, as this study did not consider non-consumptive effects of predators on Chub. Predators may affect Utah Chub survival and production through behavioral changes, such as predator avoidance. Understanding density dependent responses of the Utah Chub population, stunting and potentially restraining Utah Chub within the size range at which predators are not gape limited, is important for predicting long term effects of trout predation on chub
USU Budy. Project Completion Report. Scofield Reservoir 24
(Freckleton et al. 2003; Irwin et al. 2003). Effective biological control will be more difficult if the Chub population growth rate increases at low densities (Hein et al. 2006). Our bioenergetics model predictions demonstrated the large Cutthroat Trout population annually could consume more than half the standing prey biomass in Scofield Reservoir, highlighting their potential as an efficient biological control agent. The disparity between consumption and production suggests strong predation pressure from Cutthroat Trout on Utah Chub, but could also indicate that we are unsurprisingly underestimating one or more components of Chub production (Jackson et al. 2004). Regardless, Bear Lake Cutthroat Trout, the strain stocked in Scofield Reservoir, are known to exhibit traits of top-level predators and attain large sizes using fishes as forage (Neilson and Lentsch 1988; Hepworth et al. 1999; Hepworth et al. 2009). In Lake Chelan, Washington, Lake Trout consumption on Kokanee Salmon O. nerka, exceeded Kokanee Salmon production rates, leading to an almost 90% decline in the Kokanee Salmon population over 5 years (Schoen et al. 2012). Additionally, at Flaming Gorge Reservoir, Utah-Wyoming, researchers postulated the slower-growing Utah Chub were more vulnerable to predation by Lake Trout than fast-growing Kokanee Salmon (Yule and Luecke 1993). Prey size is an important factor determining consumption (Scharf et al. 2000), and Cutthroat Trout in Scofield Reservoir are consuming prey at and above their theoretical gape limit, demonstrating consumption of chub up to 60% of their own total length. Collectively, these observations and those of others support the argument that these piscivorous trout may effectively control Utah Chub in Scofield Reservoir. Similar to Cutthroat Trout, Tiger Trout appear to have potential as an effective biological control agent. Despite a paucity of literature on Tiger Trout ecology, Tiger Trout in Scofield Reservoir demonstrate the aggressive and piscivorous nature suggested of this new hybrid species. Tiger Trout displayed strong predation impacts on Utah Chub prey, relatively high catch rates, high condition factors, and modest BioEff values in Scofield Reservoir. Furthermore, Tiger Trout have high proportional stock density (and relative stock density) values, indicating the importance of this species to the Scofield Reservoir fishery. Tiger Trout are currently being stocked in over 30 bodies of water throughout the state of Utah to potentially enhance fisheries and consume undesired prey species. In addition to their contribution to the fishery and ability to control undesired prey species, Tiger Trout have the added benefit that they are a sterile hybrid (Brown Trout x Brook Trout) and unable to permanently expand beyond where they are stocked, an important conservation consideration for native species and ecosystems downstream (Zelasko et al. 2010). Our study indicated Rainbow Trout, a ubiquitous species stocked throughout the western U.S. and potential top predator, does not contribute substantially to predation pressure on Utah
USU Budy. Project Completion Report. Scofield Reservoir 25
Chub in Scofield Reservoir. There are at least a dozen strains of Rainbow Trout stocked worldwide, which display a range of piscivory (Hudy and Berry 1983; Swales 2006). Rainbow Trout have demonstrated piscivory at sizes greater than 250 mm TL (Beauchamp 1990), sizes as small as 100 mm TL for age-1 fish (Juncos et al. 2013), and broadly feed on this more energetically-favorable prey at least seasonally (Galbraith 1967; Taylor and Gerking 1980; Juncos et al. 2011). However, Rainbow Trout in Flaming Gorge, UT-WY, consume primarily aquatic invertebrates and zooplankton and rarely demonstrate an ontogenetic shift to piscivory at larger sizes (Haddix and Budy 2005). The Utah Division of Wildlife Resources stocks Fish Lake/DeSmet or Erwin/Sand Creek Rainbow Trout into Scofield Reservoir, likely originating from the Eagle Creek, California strain, where their diet has been documented to not contain fish prey (Hubert et al. 1994; Wagner 1996). Rainbow Trout recreational fisheries and subsequent stocking programs are common throughout North America (Baird et al. 2006; Swales 2006; Josephson et al. 2012); however, performance varies widely across lentic systems (Hepworth et al. 1999). The success of stocking programs may be attributed to strain (Babey and Berry 1989), age and size at stocking (Baird et al. 2006), lack of predation (Matkowski 1989), abundant food supplies (Hubert and Chamberlain 1996; Haddix and Budy 2005), or productivity of waters (Gipson and Hubert 1991; Budy et al. 2011; Blair et al. 2013). Specifically, Rainbow Trout in Scofield Reservoir exhibit poor returns and low survival, despite seemingly high prey availability, contributing to a declining fishery. However, the few Rainbow Trout survivors display relatively high body condition indices. It is possible that Fulton’s K and relative weight are not sufficient indices to detect a decline in energy reserves, as water content will increase with food limitation (Josephson et al. 2012). Nonetheless, the few Rainbow Trout that persist are of size that parallel Rainbow Trout in other systems. Mean total lengths of Rainbow Trout populations stocked in Utah reservoirs at similar sizes to those of Scofield Reservoir were around 300 mm one year after stocking (Hepworth et al. 1999), similar to the 290 – 310 mm TL range of Rainbow Trout in Scofield Reservoir a year after being stocked. Low proportions of fish in the diet of Rainbow Trout may limit maximum growth potential (Hubert and Gibson 1994; Luecke et al. 1999; Haddix and Budy 2005). Furthermore, reduced Rainbow Trout performance may be due to competition for resources or predator avoidance behaviors with other sport or non-game species. Rainbow Trout in Fish Lake, Utah, have exhibited substantially lower catch and harvest rates in recent years, as the community composed of Yellow Perch, Splake, Lake Trout, and Utah Chub led to a shift to predation on Rainbow Trout by Lake Trout, as well as other potential food limitations (Hepworth et al. 2011). Thus, while Rainbow Trout in Scofield Reservoir are stocked at relatively large sizes and in large quantities, presence of other top predators in the system may
USU Budy. Project Completion Report. Scofield Reservoir 26
influence feeding and behavior of Rainbow Trout, leading to low apparent survival and also possibly realized growth potential. In contrast, Cutthroat Trout in Scofield Reservoir switch to a more piscivorous diet at smaller sizes than observed elsewhere. In Scofield Reservoir, Cutthroat Trout switch to a Utah Chub-based diet around 300 mm TL, whereas Cutthroat Trout in Bear Lake, Utah-Wyoming, a very unproductive reservoir, did not become more piscivorous until 380 mm TL with very high mortality of these adult age-classes (Ruzycki et al. 2001). In Strawberry Reservoir, Utah, the diet of stocked Bear Lake Cutthroat Trout is dominated by Daphnia prey, and fish only represent a small fraction of their diet (Baldwin et al. 2000). Bioenergetic efficiency values for Cutthroat Trout in Scofield Reservoir indicate they are feeding at less than half of their maximum possible consumption rate, suggesting this species may be food-limited and/or experiencing inter or intraspecific competitive exclusion effects (Budy et al. 2013). The superior performance of the Tiger Trout stock in Scofield Reservoir contradicts observations in other Utah reservoirs. Tiger trout stocked in Panguitch Reservoir after a rotenone treatment in 2006 demonstrated poor survival and were found in limited numbers during annual gill-net surveys (Hepworth et al. 2009). However, Tiger Trout in Panguitch reservoir were stocked in lower quantities and at smaller sizes, with 20,000 fish at 75 mm yearly, as opposed to 120,000 fish at 150 mm TL in Scofield Reservoir. Predation risk due to a smaller size at stocking and lack of fish prey-base due to chemical treatment may have contributed to the poor performance of Tiger Trout elsewhere. Additionally, piscivores may interact strongly with prey populations in one system, but interact very weakly if at all with the same prey in other systems (Rudolf 2012). Tiger Trout in lakes of eastern Washington rarely became piscivorous, even in the presence of a dense Redside Shiner population (Miller 2010). In contrast, Tiger Trout within our study exhibited strong preferences for fish prey (Utah Chub). The high performance of Scofield Reservoir Tiger Trout is similar to High Savery Reservoir, Wyoming, where state record Tiger Trout has become an annual occurrence (Carrico 2012). This proven strong performance of Tiger Trout reflects on their potential to support a valuable sport fishery. Although we observed several different lines of evidence that consistently demonstrated trout exert a strong predatory effect on Utah Chub, there are some notable uncertainties associated with our bioenergetics estimates. Borrowing parameters from other species could produce unreliable or biased results, especially when the physiology of the species varies. These discrepancies may explain low BioEff values (Ney 1993; Chipps and Wahl 2008; Hartman and Kitchell 2008) and lead to under- or over-estimates of consumption. While it is not uncommon to borrow parameters (e.g., Beauchamp 1995; Beauchamp and VanTassel 2001; Ruzycki et al.
USU Budy. Project Completion Report. Scofield Reservoir 27
2001) improved parameter estimates may be needed, specifically for Tiger Trout, a new species. Nevertheless, we borrowed metabolic costs of activity, respiration, and thermal habit parameters for Tiger Trout from studies of Brown Trout (Ney 1990; Dieterman et al. 2004; Whitledge et al. 2010). Nonetheless, Tiger Trout have been generally accepted to behave similarly to Brown Trout, their close relative, and no studies to-date has quantified consumption potential of this unique species. Predator control of nuisance prey has been variable with other organisms. Despite citing typical failure to control target species (Williamson and Fitter 1996), Simberloff (2009) argues many species have been successfully eradicated and other species maintained at low densities for long periods of time. Consequently, pessimism surrounding the potential to eradicate invasive species or manage at very low densities may be unwarranted. The species-specific models presented herein were based on wild fish, natural prey, and ecologically-realistic temperature ranges, which typically results in models with reasonable predictive capability (Mesa et al 2013). Others have used a similar approach to predict consumption of Brook Trout S. fontinalis (Hartman and Cox 2008), Bull Trout S. confluentus (Mesa et al. 2013), Chinook Salmon O. tshawytscha (Madenjian et al. 2004), hybrid Sunfish Lepomis cyanellus x L. macrochirus (Whitledge et al. 1998), and Burbot (Paakkonen et al. 2003). Thus, we believe these results represent a plausible reflection of the consumption occurring in Scofield Reservoir and indicate strong potential for Cutthroat Trout and Tiger Trout to act as effective biological control agents of undesired prey fish.
Management Implications The findings of this study contribute to our understanding of the potential for stocked trout to act as biological control agents on unwelcome forage fishes. Our results suggest that the high rates of piscivory of Cutthroat Trout and Tiger Trout in artificial lentic ecosystems are likely sufficient to effectively reduce the overall abundance of Utah Chub and control their ability to dominate fish assemblages. Further, since 2009, there has been a dramatic reduction in Utah Chub catch rates and the population no longer appears to be increasing. Additionally, Tiger Trout caught in the reservoir have been of state record status, an exciting aspect of this new fishery for anglers. Management regulations that protect large Cutthroat Trout and Tiger Trout and increase predator densities may provide the predation pressure necessary to suppress overabundant Utah Chub populations, whereas Rainbow Trout have little potential for responsive management manipulations. A stocking shift from Rainbow Trout to Tiger Trout may be beneficial, if chub reduction is the overall management goal. Careful scrutiny of the current system as well as management goals and objectives, must continue to be taken into consideration when determining management actions.
USU Budy. Project Completion Report. Scofield Reservoir 28
References
Anderson, R.O., & R.M. Neumann. 1996. Length, weight, and associated structural indices. Pages 447-482 in B.R.
Babey, G.J., & C.R. Berry. 1989. Post-stocking performance of three strains of Rainbow Trout in a reservoir. North American Journal of Fisheries Management 9:309-315.
Baird, O.E., C.C. Krueger, & D.C. Josephson. 2006. Growth, movement, and catch of Brook, Rainbow, and Brown Trout after stocking into a large, marginally suitable Adirondack river. North American Journal of Fisheries Management 26:180-189.
Baldwin, C. M., D.A. Beauchamp, & J.J. Van Tassell. 2000. Bioenergetic assessment of temporal food supply and consumption demand by salmonids in the Strawberry Reservoir food web. Transactions of the American Fisheries Society 129(2):429–450.
Beauchamp, D. A. 1990. Seasonal and diel food habits of Rainbow Trout stocked as juveniles in Lake Washington. Transactions of the American Fisheries Society 119:475–482.
Beauchamp, D. A., A.D. Cross, J.L. Armstrong, K.W. Myers, J.H. Moss, J.L. Boldt, & L.J. Haldorson. 2007. Bioenergetic responses by Pacific Salmon to climate and ecosystem variation. North Pacific Anadromous Fish Commission Bulletin No. 4: 257–269.
Beauchamp, D. A., M.G. LaRiviere, & G.L. Thomas. 1995. Evaluation of competition and predation as limits to juvenile Kokanee and Sockeye Salmon production in Lake Ozette, Washington. North American Journal of Fisheries Management 15:193–207.
Beauchamp, D. A., & J.J. Van Tassell. 2001. Modeling trophic interactions of Bull Trout in Lake Billy Chinook, Oregon. Transactions of the American Fisheries Society 130:204–216.
Beauchamp, D. A., D.L. Parrish, & R.A. Whaley. 2009. Coldwater fish in large standing waters. Pages 97-118 in S.A. Bonar, W.A. Hubert, & D.W. Willis, editors. Standard methods for sampling North American freshwater fishes. American Fisheries Society, Bethesda, Maryland.
Blair, J.M., I. Ostrovsky, B.J. Hicks, R.J. Pitkethley, & P. Scholes. 2013. Growth of Rainbow Trout (Oncorhynchus mykiss) in warm-temperate lakes: implications for environmental change. Canadian Journal of Fisheries and Aquatic Sciences 70:815-823.
Brandt, S. B., & K.J. Hartman. 1993. Innovative approaches with bioenergetics models: future applications to fish ecology and management. Transactions of the American Fisheries Society 122:731-735.
Brooks, J.L. 1957. Identifications and nomenclature of Cladocera, Calanoida, and Cyclopoida. Memoirs of the Connecticut Academy of the Arts and Science 13(1).
Budy, P., M. Baker, & S. K. Dahle. 2011. Predicting fish growth potential and identifying water quality constraints: a spatially-explicit bioenergetics approach. Environmental Management 48(4):691-709.
Budy, P., G.P. Thiede, J. Lobon-Cervia, G. Gonzalez Fernandez, P. McHugh, A. McIntosh, L. Asbjorn Vollestad, E. Becares, & P. Jellyman. 2013. Limitation and facilitation of one of the world ’s most invasive fish: an intercontinental comparison. Ecology 94(2):356-367.
USU Budy. Project Completion Report. Scofield Reservoir 29
Bunnell, D. B., C.P. Madenjian, & R.M. Claramunt. 2006. Long-term changes of the Lake Michigan fish community following the reduction of exotic Alewife (Alosa pseudoharengus). Canadian Journal of Fisheries and Aquatic Sciences 63:2434-2446.
Bureau of Reclamation. 2009. Scofield Dam. U.S. Department of the Interior.
Bureau of Reclamation. 2011. Scofield Project. U.S. Department of the Interior.
Carpenter, S.R., J.F. Kitchell, & J.R. Hodgson. 1985. Cascading trophic interactions and lake productivity. BioScience 35(10):634-639.
Carrico, M. 2012. High Savery Reservoir, Wyoming. Available: www.highsavery.com. (November 2013).
Cauffope, G., & S.J.J. Heymans. 2005. Energy contents and conversion factors for sea lion’s prey. Pages 225-237 in S. Guenette & V. Christensen, editors. Food web models and data for studying fisheries and environmental impacts on Eastern Pacific Ecosystems. Fisheries. Centre Research Reports 13(1).
Chipps, S.R., & D.H. Wahl. 2008. Bioenergetics modeling in the 21st century: reviewing new insights and revisiting old constraints. Transactions of the American Fisheries Society 137:298-313.
Ciancio, J. E., M.A. Pascual, & D.A. Beauchamp. 2007. Energy density of Patagonian aquatic organisms and empirical predictions based on water content. Transactions of the American Fisheries Society 136:1415-1422.
Courtenay, W. R., & C.C. Kohler. 1986. Regulating introduced aquatic species- a review of past initiatives. Fisheries 11(2):34-38.
Cummins, K. W., & J.C. Wuycheck. 1971. Caloric equivalents for investigations in ecological energetics. International Association for Theoretical and Applied Limnology Proceedings No. 18.
Dahm, E., J. Hartmann, T. Lindem, & H. Loffler. 1985. ELFAC experiments on pelagic fish stock assessment by acoustic methods in Lake Constance. European Inland Fisheries Advisory Commission Occassional Paper No. 15. FAO, Rome, Italy. 14 pp.
Debach, P.D. 1964. Biological control of insect pests and weeds. Chapman & Hall Ltd., London.
Department of Environmental Quality. 2010. Scofield Reservoir TMDL. Division of Water Quality, Salt Lake City, UT 84103.
Dieterman, D. J., W.C. Thorn, & C.S. Anderson. 2004. Application of a bioenergetics model for Brown Trout to evaluate growth in Southeast Minnesota streams. Minnesota Department of Natural Resources, St. Paul, MN, 1-27.
Dwyer, W. P., & R.H. Kramer. 1975. The influence of temperature on scope for activity in Cutthroat Trout, Salmo clarki. Transactions of the American Fisheries Society 104(3):552-554.
Edmonson, W.T. 1959.The rotifera in G.C. Whipple & H.B. Ward, editors. Freshwater Biology, 2nd edition. Wiley, New York.
Eilers, J. M., H.A. Truemper, L.S. Jackson, B.J. Eilers, & D.W. Loomis. 2011. Eradication of an invasive cyprinid (Gila bicolor) to achieve water quality goals in Diamond Lake, Oregon (USA). Lake and Reservoir Management 27(3):194-204.
Ellis, B.K., J.A. Stanford, D. Goodman, C.P. Stafford, D.L. Gustafson, D.A. Beauchamp, D.W. Chess, J.A. Craft, M.A. Deleray, & B.S. Hansen. 2011. Long-term effects of a trophic cascade in a large lake ecosystem. Proceedings of the National Academy of Sciences 108:1070-1075.
USU Budy. Project Completion Report. Scofield Reservoir 30
Freckleton, R.P., D.M. Silva Matos, M.L.A. Bovi, & A.R. Watkinson. 2003. Predicting the impacts of harvesting using structured population models: the importance of density-dependence and timing of harvest from a tropical palm tree. Journal of Applied Ecology 40:846-858.
Freeman, M.A., J.F. Turnbull, W.E. Yeomans, & C.W. Bean. 2010. Prospects for management strategies of invasive crayfish populations with an emphasis on biological control. Aquatic Conservation: Marine and Freshwater Ecosystems 20(2):211-223.
Gabelhouse, D.W. 1984. A length-categorization system to assess fish stocks. North American Journal of Fisheries Management 4:273-285.
Galbraith, M. G. 1967. Size-selective predation on Daphnia by Rainbow Trout and Yellow Perch. Transactions of the American Fisheries Society 96:1-10.
Gardunio, E.I., C.A. Myrick, R.A. Ridenour, R.M. Keith, & C.J. Amadio. 2011. Invasion of illegally introduced Burbot to the upper Colorado River Basin, USA. Journal of Applied Icthyology 27:36-42.
Gasith, A., & S. Gafny. 1990. Effects of water level fluctuation on the structure and function of the littoral zone. Pages 156-171 in M.M. Tilzer & C. Serruya, editors. Large Lakes. Springer Berlin Heidelberg.
Gill, A.B. 2003. The dynamics of prey choice in fish: the importance of prey size and satiation. Journal of Fish Biology 63(1):105-116.
Gipson, R.D., & W.A. Hubert. 1991. Factors influencing the body condition of Rainbow Trout in small Wyoming reservoirs. Journal of Freshwater Ecology 6:327-334.
Graham, R.J. 1961. Biology of the Utah chub in Hebgen Lake, Montana. Transactions of the American Fisheries Society 90: 269-276.
Guy, C.S., T.E. McMahon, C.J. Smith, B.S. Cox, W.A. Fedenberg, & D.W. Garfield. 2011. Diet overlap of top-level predators in recent sympatry: Bull Trout and nonnative Lake Trout. Journal of Fish and Wildlife Management 2(2):183-189.
Haddix, T., & P. Budy. 2005. Factors that limit growth and abundance of Rainbow Trout across ecologically distinct areas of Flaming Gorge Reservoir, Utah–Wyoming. North American Journal of Fisheries Management 25(3):1082-1094.
Hambright, K. D. 1991. Experimental analysis of prey selection by Largemouth Bass: role of predator mouth width and prey body depth. Transactions of the American Fisheries Society 120:500–508.
Hanson, M. J., D. Boisclair, S.B. Brandt, & S.W. Hewett. 1993. Applications of bioenergetics models to fish ecology and management -where do we go from here. Transactions of the American Fisheries Society 122:1019-1030.
Hanson, P.C., T.B. Johnson, D.E. Schindler, & J.F. Kitchell. 1997. Bioenergetics model 3.0 for Windows. University of Wisconsin, Sea Grant Institute, Technical Report WISCU-T-97-001. Madison, Wisconsin.
Hart, J., & P.W. Birdsey. 2008. Scofield Research Proposal. Price, UT: Utah Division of Wildlife Resources, Southeastern Regional Office. 5 pp.
Hartman, K.J., & M.K. Cox. 2008. Refinement and testing of a Brook Trout bioenergetics model. Transactions of the American Fisheries Society 137:357-363.
Hartman, K. J., and R. S. Hayward. 2007. Bioenergetics. Pages 515–560 in C. S. Guy and M. L. Brown, editors. Analysis and interpretation of freshwater fisheries data. American Fisheries Society, Bethesda, Maryland.
USU Budy. Project Completion Report. Scofield Reservoir 31
Hartman, K.J., & J.F. Kitchell. 2008. Bioenergetics modeling: progress since the 1992 symposium. Transactions of the American Fisheries Society 137:216-223.
Hartman, K.J., & F.J. Margraf. 1993. Evidence of predatory control of Yellow Perch (Perca flavescens) recruitment in Lake Erie, USA. Journal of Fish Biology 43(1):109-119.
Havel, J.E., C.E. Lee, & J. VanderZanden. 2005. Do reservoirs facilitate invasions into landscapes? BioScience 55(6):518-525.
Hein, C.L., B.M. Roth, A.R. Ives, & J.M. Vander Zanden. 2006. Fish predation and trapping for Rusty Crayfish (Orconectes rusticus) control: a whole-lake experiment. Canadian Journal of Fisheries and Aquatic Sciences 63:383-393.
Hepworth, D. K., C.B. Chamberlain, & M.J. Ottenbacher. 1999. Comparative sport fish performance of Bonneville Cutthroat Trout in three small put-grow-and-take reservoirs. North American Journal of Fisheries Management 19(1):774-785.
Hepworth, R.D., J. Warner, M.J. Ottenbacher, & M.J. Hadley. 2009. Panguitch Lake: an evaluation of the sport fishery management plan. Utah Department of Natural Resources, Division of Wildlife Resources, Salt Lake City.
Hepworth, R.D., M. Ottenbacher, & M.J. Hadley. 2011. Angler survey and monitoring results, Fish Lake Utah 2010. Utah Department of Natural Resources, Division of Wildlife Resources, Salt Lake City.
Hoddle, M.S. 2004. Restoring balance: using exotic species to control invasive exotic species. Conservation Biology 18(1):38-49.
Hubert, W.A., & C.B. Chamberlain. 1996. Environmental gradients affect Rainbow Trout populations among lakes and reservoirs in Wyoming. Transactions of the American Fisheries Society 125:925-932.
Hubert, W.A., D. Gipson, R.A. McDowell, & A.C. Stewart. 1994. Diet of Eagle Lake Rainbow Trout in Lake DeSmet, Wyoming. North American Journal of Fisheries Management 14:457-459.
Hudy, M., & C.R. Berry Jr. 1983. Performance of three strains of Rainbow Trout in a Utah reservoir. North American Journal of Fisheries Management 3(2):136-141.
Hyatt, M.W., & W.A. Hubert. 2001. Proposed standard-weight (Ws) equation and length-categorization standards for Brown Trout (Salmo trutta) in lentic habitats. Journal of Freshwater Ecology 16(1):53-56.
Ireland, P.A. 2010. Changes in native aquatic vegetation, associated fish assemblages, and food habits of Largemouth Bass (Micropterus salmoides) following the addition of triploid Grass Carp to manage Hydrilla (Hydrilla verticillata) in Lake Conroe, TX. Master’s Thesis, Texas A&M University.
Irwin, B. J., D.R. Devries, & R.A. Wright. 2003. Evaluating the potential for predatory control of gizzard shad by Bargemouth bass in small impoundments: a bioenergetics approach. Transactions of the American Fisheries Society 132(5):913-924.
Jackson, L.S., D.H. Jackson, & D.W. Loomis. 2004. Analysis of Tui Chub data collected at Diamond Lake by the Oregon Department of Fish and Wildlife, 1992-2003. Oregon Department of Fish and Wildlife, Roseburg, Oregon.
Johnson, B.M., & J.P. Goettle. 1999. Food web changes over fourteen years following introduction of Rainbow Smelt into a Colorado reservoir. North American Journal of Fisheries Management 19:629-642.
USU Budy. Project Completion Report. Scofield Reservoir 32
Johnson, J.B., & M.C. Belk. 1999. Effects of predation on life-history evolution in Utah Chub (Gila atraria). Copeia 4:948–957.
Josephson, D.C., J.M. Robinson, J.M. Lepak, & C.E. Kraft. 2012. Rainbow Trout performance in food-limited environments: implications for future assessment and management. Journal of Freshwater Ecology 27(2):159-170.
Juanes, F., J.A. Buckel, & F.S. Scharf. 2002. Feeding ecology of piscivorous fishes. Pages 267-283 in P. J. B. Hart & J. D. Reynolds, editors. Handbook of Fish Biology and Fisheries, 1st edition. Oxford, UK: Blackwell Publishing Ltd.
Juncos, R., D.A. Beauchamp, & P.H. Vigliano. 2013. Modeling prey consumption by native and nonnative piscivorous fishes: implications for competition and impacts on shared prey in an ultraoligotrophic lake in Patagonia. Transactions of the American Fisheries Society 142:268-281.
Juncos, R., D. Milano, P.J. Macchi, M.F. Alonso, & P.H. Vigliano. 2011. Response of Rainbow Trout to different food web structures in northern Patagonia: implications for growth, bioenergetics, and invasiveness. Transactions of the American Fisheries Society 140:415-428.
Kitchell, J.F., & L.B. Crowder. 1986. Predator-prey interactions in Lake Michigan: model predictions and recent dynamics. Environmental Biology of Fishes 16:205-211.
Kitchell, J. F., D.E. Schindler, R. Ogutu-Ohwayo, & P.N. Reinthal. 1997. The Nile Perch in Lake Victoria: interactions between predation and fisheries. Ecological Applications 7(2):653-664.
Kohler, C.C., J.J. Ney, & W.E. Kelso. 1986. Filling the void: development of a pelagic fishery and its consequences to littoral fishes in a Virginia mainstem reservoir. Pages 166-177 in G.E. Hall & M. J. Van Den Avyle, editors. Reservoir fisheries management: strategies for the 80’s. Southern Division, American Fisheries Society, Bethesda, Maryland.
Kruse, C.G., & W.A. Hubert. 1997. Proposed standard weight (Ws) equations for Interior Cutthroat Trout. North American Journal of Fisheries Management, 17(3):784-790.
Kumar, R., & J.S. Hwang. 2006. Larvicidal efficiency of aquatic predators: a perspective for mosquito biocontrol. Zoological Studies 45(4):447-466.
Lester, N.P., P.E. Bailey, & W.A. Hubert. 2009. Coldwater fish in small standing waters. Pages 85-96 in S.A. Bonar, W.A. Hubert, & D.W. Willis, editors. Standard methods for sampling North American freshwater fishes. American Fisheries Society, Bethesda, Maryland.
Luecke, C., T.C. Edwards, M.W. Wengert, S. Brayton, & R. Schneidervin. 1994. Simulated changes in Lake Trout yield, trophies, and forage consumption under various slot limits. North American Journal of Fisheries Management 14(1):14-21.
Luecke, C.M., W. Wengert, & R.W. Schneidervin. 1999. Comparing results of a spatially explicit growth model with changes in the length-weight relationship of Lake Trout (Salvelinus namaycush) in Flaming Gorge Reservoir. Canadian Journal of Fisheries and Aquatic Sciences 56:162-169.
Madenjian, C.P., D.V. O'Connor, S.M. Chernyak, R.R. Rediske, & J.P. O'Keefe. 2004. Evaluation of a Chinook Salmon (Oncorhynchus tshawytscha) bioenergetics model. Canadian Journal of Fisheries and Aquatic Sciences 61:627-635.
Magnhagen, C., & E. Heibo. 2001. Gape size allometry in Pike reflects variation between lakes in prey availability and relative body depth. Functional Ecology 15:754-762.
USU Budy. Project Completion Report. Scofield Reservoir 33
Martinez, P.J., P.E. Bigelow, M.A. Deleray, W.A. Fredenberg, B.S. Hansen, N.J. Horner, S.K. Lehr, R.W. Schneidervin, S.A. Tolentino, & A.E. Viola. 2009. Western Lake Trout woes. Fisheries 34:424-442.
Matkowski, S.M.D. 1989. Differential susceptibility of three species of stocked trout to bird predation. North American Journal of Fisheries Management 9:184-187.
McMahon, T. E., A.V. Zale, & D.J. Orth. 1996. Aquatic habitat measurements. Pages 83 -120 in B.R. Murphy & D.W. Willis, editors. Fisheries techniques. American Fisheries Society, Bethesda, Maryland.
Merritt, R.W., & K.W. Cummins, editors. 1996. An introduction to the aquatic insects of North America. Dubuque, Iowa: Kendall & Hunt. 441 p.
Mesa, M.G., L.K. Weiland, H.E. Christiansen, S.T. Sauter, & D.A. Beauchamp. 2013. Development and evaluation of a bioenergetics model for bull trout. Transactions of the American Fisheries Society 142(1):41-49.
Michaletz, P.H. 2013. Temperature, plankton and conspecific density influence dynamics of age-0 Gizzard Shad: implications for a gape-limited piscivore. Ecology of Freshwater Fish. DOI: 10.1111/eff.12083.
Milewski, C.L., & M.L. Brown. 1994. Proposed standard weight (Ws) equation and length-categorization standards for stream-dwelling Brown Trout (Salmo trutta). Journal of Freshwater Ecology 9(2):111-116.
Miller, A.L. 2010. Diet, growth, and age analysis of Tiger Trout from ten lakes in Eastern Washington. Master's Thesis. Eastern Washington University.
Mittlebach, G.G. 2002. Fish foraging and habitat choice: a theoretical perspective. Handbook of Fish Biology and Fisheries 1:251-266.
Neilson, B.R. & L. Lentsch. 1988. Bonneville Cutthroat Trout in Bear Lake: status and management. American Fisheries Society Symposium 4:128-133.
Neuhold, J. M. 1957. Age and growth of the Utah Chub, Gila atraria (Girard), in Panguitch Lake and Navajo Lake , Utah, from scales and opercular bones. Transactions of the American Fisheries Society 85(1):217-233.
Ney, J. J. 1990. Trophic economics in fisheries: assessment of demand-supply relationships between predators and prey. Reviews in Aquatic Sciences 2(1):55–81.
Ney, J. J. 1993. Bioenergetics modeling today: growing pains on the cutting edge. Transactions of the American Fisheries Society 122:736-748.
Noble, R. L. 1981. Management of forage fishes in impoundments of the Southern United States. Transactions of the American Fisheries Society 110(6):738-750.
Olson, H. F. 1959. Biology of the Utah Chub, gila atraria, of Scofield Reservoir, Utah. MS thesis. Utah State University. Logan, Utah.
Paakkonen, J.P.J., O. Tikkanen, & J. Karjalainen. 2003. Development and validation of a bioenergetics model for juvenile and adult Burbot. Journal of Fish Biology 63:956-969.
Penczak, T., A.A. Agostinho, N.S. Hahn, R. Fugi, & L.C. Gomes. 1999. Energy budgets of fish populations in two tributaries of the Parana River, Parana, Brazil. Journal of Tropical Ecology 15:159-177.
Peterson, J. H., & J.F. Kitchell. 2001. Climate regimes and water temperature changes in the Columbia River: bioenergetic implictions for predators of juvenile sSlmon. Canadian Journal of Fisheries and Aquatic Sciences 58:1831-1841.
USU Budy. Project Completion Report. Scofield Reservoir 34
Pope, K.L., & C.G. Kruse. 2007. Condition. Pages 423-472 in C.S. Guy & M.L. Brown, editors. Analysis and interpretation of freshwater fisheries data. American Fisheries Society, Bethesda, Maryland.
Quist, M.C., C.S. Guy, R.J. Bernot, & J.L. Stephen. 2002. Seasonal variation in condition, growthand food habits of walleye in a Great Plains reservoir and simulated effects of an altered thermal regime. Journal of Fish Biology 61(6):1329-1344.
Raborn, S. W., L.E. Miranda, & M.T. Driscoll. 2007. Prey supply and predator demand in a reservoir of the Southeastern United States. Transactions of the American Fisheries Society 136(1):12-23.
Rand, P.S., D.J. Stewart, P.W. Seelbach, M.L. Jones, & L.R. Wedge. 1993. Modeling steelhead population energetics in lakes Michigan and Ontario. Transactions of the American Fisheries Society 122:977-1001.
Raymond, A.W., & E. Sobel. 1990. The use of Tui Chub as food by Indians of the Western Great Basin. Journal of California and Great Basin anthropology 12(1):2-18.
Reissig, M., C. Trochine, C. Quelimalinos, E. Balseiro, & B. Modenutti. 2006. Impact of fish introduction on planktonic food webs in lakes of the Patagonian Plateau. Biological Conservation 132:437-447.
Rice, J.A., & P.A. Cochran. 1984. Independent evaluation of a bioenergetics model for Largemouth Bass. Ecology 65(3):732-739.
Romare, P., & L.A. Hansson. 2003. A behavioral cascade: top-predator induced behavioral shifts in planktivorous fish and zooplankton. Limnology and Oceanography 48(5):1956-1964.
Rose, B.P. & M.G. Mesa. 2013. Effects of summer drawdown on the fishes and larval chironomids in Beulah Reservoir, Oregon. Northwest Scientific Association 87(3):207-218.
Rudolf, V.H.W. 2012. Seasonal shifts in predator body size diversity and trophic interactions in size-structured predator-prey systems. Journal of Animal Ecology 81:524-532.
Ruzycki, J. R., W.A. Wurtsbaugh, & C. Luecke. 2001. Salmonine consumption and competition for endemic prey fishes in Bear Lake, Utah–Idaho. Transactions of the American Fisheries Society 130(6):1175-1189.
SAS Institute Inc. 2009. SAS Web Report Studio 4.2: Users guide, Cary, North Carolina: SAS Institute Inc.
Saunders, G., B. Cooke, K. McColl, R. Shine, & T. Peacock. 2010. Modern approaches for the biological control of vertebrate pests: an Australian perspective. Biological Control 52(3):288-295.
Scharf, F.S., F.J. Juanes, & R.A. Rountree. 2000. Predator size - prey size relationships of marine fish predators: interspecific variation and effects of ontogeny and body size on trophic-niche breadth. Marine Ecology Progress Series 208:229-248.
Schoen, E.R., D.A. Beauchamp, & N.C. Overman. 2012. Quantifying latent impacts of an introduced piscivore: pulsed predatory inertia of Lake Trout and decline of Kokanee. Transactions of the American Fisheries Society 141(5):1191-1206.
Shapiro, J., V. Lamarra, & M. Lynch. 1975. Biomanipulation: an ecosystem approach to lake restoration. Pages 85-96 in P.L. Brezonik & J.L. Fox, editors. Water Quality Management Through Biological Control. University of Florida.
Simberloff, D. 2009. We can eliminate invasions or live with them. Successful management projects. Biological Invasions 11:149-157.
Simberloff, D., & P. Stiling. 1996. Risks of species introduced for biological control. Biological Conservation 78:185-192.
USU Budy. Project Completion Report. Scofield Reservoir 35
Simpkins, D.G. & W.A. Hubert. 1996. Proposed revision of the standard-weight equation for Rainbow Trout. Journal of Freshwater Ecology 11(3):319-325.
Skov, T., T. Buchaca, S.L. Amsinck, F. Landkildehus, B.V. Odgaard, J. Azevedo, V. Goncalves, P.M. Raposeiro, T.J. Anderson, & E. Jeppesen. 2010. Using invertebrate remains and pigments in the sediment to infer changes in trophic structure after fish introduction in Lake Fogo: a crater lake in the Azores. Hydrobiologia 654(1):13-25.
Sorenson, P.W. & N.E. Stacey. 2004. Brief review of fish pheromones and discussion of their possible uses in the control of non-indigenous teleost fishes. New Zealand Journal of Marine and Freshwater Research 38(3):399-417.
Sousa, R., A.J.A. Noguiera, M.B. Gaspar, C. Antunes, & L. Guilhermino. 2008. Growth and extremely high production of non-indigenous invasive species Corbicula fluminea: possible implications for ecosystem functioning. Estuarine, Coastal, and Shelf Science 2:289-295.
Stein, R.A., D.R. Devries, & J.M. Dettmers. 1995. Food-web regulation by a planktivore: exploring the generality of the trophic cascade hypothesis. Canadian Journal of Fisheries and Aquatic Sciences 52:2518-2526.
Stein, R.A., & M.L. Murphy. 1976. Changes in the proximate composition of crayfish with size, sex, and life stage. Journal of Fisheries Research Board of Canada 33:2450-2458.
Stewart, D.J., D. Weininger, D.V. Rottiers, & T.A. Edsall. 1983. An energetics model for Lake Trout, Salvelinus namaycush: application to the Lake Michigan population. Canadian Journal of Fisheries and Aquatic Sciences 40:681–698.
Stewart, D.J., J.F. Kitchell, & L.B. Crowder. 1981. Forage fishes and their salmonid predators in Lake Michigan. Transactions of the American Fisheries Society 110:751-763.
Swales, S. 2006. A review of factors affecting the distribution and abundance of rainbow trout (Oncorhynchus mykiss Walbaum) in lake and reservoir systems. Lake and Reservoir Management 22:167-178.
Taylor, W.W., & S.D. Gerking. 1980. Population dynamics of Daphnia pulex and utilization by the Rainbow Trout (Salmo gairdneri). Hydrobiologia 71:277-287.
Tronstad, L. 2008. Ecosystem consequences of declining Yellowstone Cutthroat Trout in Yellowstone Lake and spawning streams. Doctoral dissertation. Laramie, Wyoming: University of Wyoming.
Truemper, H.A., & Lauer, T.E. 2005. Gape limitation and piscine prey size-selection by Yellow Perch in the extreme southern area of Lake Michigan , with emphasis on two exotic prey items. Journal of Fish Biology 66:135-149.
Tyus, H.M., & J.F. Saunders. 2000. Nonnative fish control and endangered fish recovery: lessons from the Colorado River. Fisheries 25:17-24.
U.S. Department of Agriculture, Animal and Plant Health Inspection Service. 2013a. Biological Control, Center for Plant Health Science and Technology. Last modified April 4, 2013. http://www.aphis.usda.gov/plant_health/cphst/projects/biological-control.shtml
U.S. Department of Agriculture. 2013b. Weeds and biological control agents. Technical Advisory Group, Biological Control Agents of Weeds. DRAFT. May 9, 2013. Available: http://www.aphis.usda.gov/plant_health/permits/tag/downloads/Weeds%20and%20Biological%20Control%20Agents%20Released%20in%20US%20and%20Canada.pdf
Vatland, S., P. Budy, & G.P. Thiede. 2008. A bioenergetics approach to modeling striped bass and threadfin shad predator-prey dynamics in Lake Powell, Utah-Arizona. Transactions of the American Fisheries Society 137(1):262-277.
USU Budy. Project Completion Report. Scofield Reservoir 36
Wagner, E.J. 1996. History and fluctuating asymmetry of Utah salmonid broodstocks. The Progressive Fish-Culturist 58:92-103.
Walsworth, T.E., P. Budy, & G.P. Thiede. 2013. Longer food chains and crowded niche space: effects of multiple invaders on desert stream food web structure. Ecology of Freshwater Fish 22(3):439-452.
Werner, E.E., & D.J. Hall. 1974. Optimal foraging and the size selection of prey by the Bluegill Sunfish (Lepomis macrochirus). Ecology 55(5):1042-1052.
Wetzel, R.G. 1990. Reservoir ecosystems: conclusions and speculations. Pages 227-238 in K.W. Thorton, B.I. Kimmel, & F.E. Payne, editors. Reservoir Limnology: Ecological Perspectives. John Wiley and Sons, New York.
Wetzel, R.G. 2001. Limnology: lake and river ecosystems, third edition. Academic Press, San Diego, California.
Whitledge, G.W., R.S. Hayward, D.B. Noltie, & N. Wang. 1998. Testing bioenergetics models under feeding regimes that elicit compensatory growth. Transactions of the American Fisheries Society 127:740-746.
Whitledge, G.W., P.G. Bajer, & R.S. Hayward. 2010. Laboratory evaluation of two bioenergetics models for Brown Trout. Transactions of the American Fisheries Society 139(4):929-936.
Williamson, M., & A. Fitter. 1996. The varying success of invaders. Ecology 77(6):1661-1668.
Wittenberg, R., & M.J.W. Cock, editors. 2001. Invasive alien species: a toolkit of best prevention and management practices. Wallingford, Oxon, UK: CAB International.
Yule, D.L., & C. Luecke. 1993. Lake Trout consumption and recent changes in the fish assemblage of Flaming Gorge Reservoir. Transactions of the American Fisheries Society 122(6):1058-1069.
Zelasko, K.A., K.R. Bestgen, & C. White. 2010. Survival rates and movement of hatchery-reared Razorback Suckers in the Upper Colorado River Basin, Utah and Colorado. Transactions of the American Fisheries Society 139(5):1478-1499.
USU Budy. Project Completion Report. Scofield Reservoir 37
Figure 1.1. Map of Scofield Reservoir, Utah showing the eight locations where we sampled fish in 2011 and 2012.
USU Budy. Project Completion Report. Scofield Reservoir 38
Figure 1.2. Utah Chub catch-per-unit-effort (CPUE) from 2004 to 2012. Catch data from 2004 – 2010 courtesy of Utah Division of Wildlife Resources.
Year2004
20052006
20072008
20092010
20112012
CP
UE
(Chu
b/ne
t/hr)
0
2
4
6
8
10
12
14
16
USU Budy. Project Completion Report. Scofield Reservoir 39
Figure 1.3. Abundance estimates by size class of Utah Chub and three trout species derived from hydroacoustic surveys in Scofield Reservoir on 6 June 2013 (spring) and 31 August 2011 (summer).
USU Budy. Project Completion Report. Scofield Reservoir 40
Figure 1.4. Proportion of total catch, based on CPUE, for each of the trout species and Utah Chub in Scofield Reservoir. Solid lines represent data from Utah Division of Wildlife Resources yearly spring sampling, with additional summer and autumn data collected for this study (metrics calculated similarly).
Rainbow TroutP
ropo
rtion
of t
otal
cat
ch (b
ased
on
CP
UE
)
0.0
0.2
0.4
0.6
0.8
1.0
springsummerautumn
Cutthroat Trout
0.0
0.2
0.4
0.6
0.8
1.0
Tiger Trout
0.0
0.2
0.4
0.6
0.8
1.0
Utah Chub
Year2004 2005 2006 2007 2008 2009 2010 2011 2012
0.0
0.2
0.4
0.6
0.8
1.0
USU Budy. Project Completion Report. Scofield Reservoir 41
Figure 1.5. Seasonal diet composition of small (< 350 mm TL) and large (≥ 350 mm TL) Cutthroat Trout, Rainbow Trout, and Tiger Trout, as well as small (< 250 mm TL) and large (≥ 250 mm TL) Utah Chub captured in Scofield Reservoir. Diet composition was calculated as the proportion of diet by wet weight (g).
USU Budy. Project Completion Report. Scofield Reservoir 42
Figure 1.6. Length-frequency (%) distributions of Bear Lake-strain Cutthroat Trout captured in gill nets during seasonal sampling events from July 2011 – May 2013 in Scofield Reservoir. Number (n) captured in nets is given.
USU Budy. Project Completion Report. Scofield Reservoir 43
Figure 1.7. Length-frequency (%) distributions of Rainbow Trout captured in gill nets during seasonal sampling events from July 2011 – May 2013 in Scofield Reservoir. Number (n) captured in nets is given.
USU Budy. Project Completion Report. Scofield Reservoir 44
Figure 1.8. Length-frequency (%) distributions of Tiger Trout captured in gill nets during seasonal sampling events from July 2011 – May 2013 in Scofield Reservoir. Number (n) captured in nets is given.
USU Budy. Project Completion Report. Scofield Reservoir 45
Figure 1.9. Mean (± 2 SE) total length- (top panel) and weight- (bottom panel) at-age of each trout species in Scofield Reservoir. Ages were determined as annuli counts from 30 of each species captured in 2012.
Tota
l len
gth
(mm
)
100
200
300
400
500
600
700
800
TigerAge vs TRT TL CUTT age vs CTT TL Rain Age vs RB TL
Trout age (annuli count)2 3 4 5 6 7 8
Wei
ght (
g)
0
1000
2000
3000
4000
5000
Tiger TroutCutthroat TroutRainbow Trout
USU Budy. Project Completion Report. Scofield Reservoir 46
Figure 1.10. Daily mean temperatures experienced by fish in Scofield Reservoir during 2011 and 2012. Horizontal lines show consumption thermal optimum (CTO) for each species, which varied around the average temperature encountered throughout the year; Cutthroat Trout CTO is 14 °C, Rainbow Trout CTO is 20 °C, and Tiger Trout CTO (assumed similar to Brown Trout) is 17.5 °C.
USU Budy. Project Completion Report. Scofield Reservoir 47
Figure 1.11. Comparison of Utah Chub abundance and annual production (In lake) versus bioenergetics estimates of annual Cutthroat Trout and Tiger Trout consumption of Chub (Consumed by) in Scofield Reservoir. Age-2 and older (100 – 350 mm) Chub abundance (± 1 SE) is based on June 2013 hydroacoustic estimates.
In lake Consumed by
Biom
ass
of U
tah
chub
(ton
nes)
0
300
600
900
1200
1500ProductionAge-1 Chub > Age-2 Chub
Cons. by Cutthroat TroutCons. by Tiger Trout
USU Budy. Project Completion Report. Scofield Reservoir 48
Figure 1.12. Relationship between total length and relative weight (Wr) of Cutthroat Trout (top), Rainbow Trout (middle), and Tiger Trout (bottom) from Scofield Reservoir in summer 2012. Reference line at Wr = 100.
USU Budy. Project Completion Report. Scofield Reservoir 49
CHAPTER 2
Quantifying the food web impacts of introduced piscivores in reservoir fish assemblages
Introduction
Ecologists are continually challenged with describing and quantifying the interactions that define food webs and community structure of aquatic systems (Paine 1980; Polis 1991; Polis and Strong 1996). Food webs are dynamic, as linkages between organisms rely on the movement of nutrients, prey, and consumers (Polis et al. 1997). Human manipulations, such as the widespread construction of reservoirs, present uncertainties in our understanding of aquatic food web structure. Reservoirs in particular differ from the ‘typical’ structure and functioning of aquatic ecosystems, making them an interesting study system to inform freshwater ecology (Miranda and DeVries 1996; Havel et al. 2005). Fish populations and subsequent food web interactions in impounded riverine systems likely differ from those in lakes, as the highly-manipulated and recently-stocked fish communities in reservoirs are often unstable (Stein et al. 1995; Havel et al. 2005).
Reservoirs are thus novel, dynamic ecosystems that often demonstrate complex trophic interactions among resident species. Not only do species roles change with ontogenetic shifts, but species composition in reservoirs may vary from natural rivers and lakes in the region and may consist of an assemblage of species that did not co-evolve. This assemblage may include both native stream species that persist in the reservoir, and non-native species either intentionally or accidentally introduced (Olsen et al. 1995; Matthews et al. 2004; Clavero et al. 2013). These artificial assemblages may have an increased number of trophic positions relative to a prior state (Walsworth et al. 2013), decoupled or novel predator-prey interactions (Noble 1986), or may result in increased potential for competition of nutrients and resources amongst species (Ney 1996; Wuellner et al. 2010). Reservoirs are often managed similarly to natural lakes because they are assumed to be functionally comparable; however, direct comparisons of fish assemblages has demonstrated dissimilarity between systems (Terra and Araujo 2011). These unnatural lentic habitats may be unsuitable for stream fishes, but favorable for introduced piscivorous fishes (Gido et al. 2009; Kashiwagi and Miranda 2009; Franssen and Tobler 2013). Understanding the biotic interactions of artificial assemblages of fish will expand our knowledge of novel food web interactions, as well as assist towards developing and implementing suitable management strategies for these highly manipulated fisheries.
USU Budy. Project Completion Report. Scofield Reservoir 50
Top predators in reservoir systems that are highly managed (i.e., stocked) for fishing may exhibit strong competition between species. Competition amongst coexisting species can structure community dynamics and limit predator performance, in addition to, or in combination with predation (Kitchell and Crowder 1986; Ney 1990; Wuellner et al. 2010). Additionally, exploitative competition may be a strong driver of decreasing angler success (Marrin and Erman 1982; Wuellner et al. 2010), or the poor relative return rates of stocked sport fish. In Patagonian lakes, invasive rainbow trout Oncorhynchus mykiss and brown trout Salmo trutta cause a niche shift in a native galaxiid, leading to reduced growth and survival (Correa et al. 2012). Overlapping food habits may also lead to limited supplies of prey resources for the predator community (Bacheler et al. 2004). In Flaming Gorge, Utah-Wyoming, kokanee Oncorhynchus nerka and Utah chub Gila atraria fed extensively and similarly on zooplankton; subsequently, zooplankton biomass declined, and the decline in kokanee growth was correlated with increased chub densities (Teuscher and Luecke 1996). Similarly, the introduction of lake trout Salvelinus namaycush into Bear Lake, Utah reduced survival of Bear Lake strain Bonneville cutthroat trout O. clarki utah due to shared competition for Bear Lake sculpin Cottus extensus prey (Ruzycki et al. 2001). Competition among top predators may therefore result in reduced growth and survival, or affect behavior such as changes in habitat use (Werner and Hall 1977) or variable recruitment success (Marrin and Erman 1982).
Piscivores are commonly introduced as a management tool in an attempt to control undesired species (Courtenay and Kohler 1986), as well as to enhance or provide new angling opportunities (Wuellner et al. 2010). The growth and survival of these piscivores depends on prey fish availability (Ney and Orth 1986), subsequently, the size of prey consumed and the frequency of piscivory both generally increase with predator size (Juanes et al. 2002). Accordingly, body morphology is a major factor affecting foraging performance of fish; for example, mouth gape size affects the size of prey species that can be eaten by piscivores (Mittelbach and Persson 1998). While the selection of prey fish of larger sizes increases proportionally with predator size, sizes of prey consumed often appear to be smaller than what is thought possible based on gape size measurements (Truemper and Lauer 2005). Further, the range of prey sizes eaten typically increases in larger predators, as maximum prey size often increases rapidly while minimum prey size may change only modestly over a broad range of predator sizes (Juanes et al. 2002). The overall impact of these introduced piscivores on complex food web interactions thus depends, in part, on prey life-history traits relating to size and predator avoidance, and subsequent predator foraging decisions (Lundvall et al. 1999).
Predator feeding is not solely based on predator and prey size, but also on a suite of characteristics related to the search, pursuit, attack, and handling of prey by predators (Werner and Gilliam 1984; Bronmark and Hansson 1998). According to optimal foraging theory, fish will
USU Budy. Project Completion Report. Scofield Reservoir 51
forage in such a way as to maximize fitness, typically taking into consideration food quality, quantity, and spatial distribution (Werner and Hall 1974; Svanback and Bolnick 2007). The amount of food consumed relative to the prey density is a functional response, where the amount of predation generally increases with prey density, up until a saturation point (Abrams and Fung 2010). High spatiotemporal overlap between the predator and prey is necessary for encounter, and strategies vary from the sit-and-wait predation of pike Esox spp. to the sensing of prey electrical activity by paddlefish Polyodon spathula (Dodds and Whiles 2010). On the other hand, defenses against predation, such as habitat and behavior choices or mechanical and chemical protections by prey, act in concert with predator behavior to influence predator diet (Romare and Hansson 2003; Sih et al. 2010; Dodds and Whiles 2010). If prey detect predators before they are detected by predators, they have the potential to actively avoid them. Increased refuge efficiency by prey species was shown to cause a decrease in piscivorous perch Perca spp. growth rates, likely due to a necessary shift in predator diet (Persson and Eklov 1995). The use of these structurally-complex habitats may therefore reduce predation rates because of a decrease in predator-prey encounters (Tabor and Wurtsbaugh 1991; Christensen and Persson 1993; Carey and Wahl 2010). Encounter rates also depend on the spatiotemporal patterns of prey. Zooplankton exhibit diel vertical migrations, foraging at night to avoid visual predators (Hays 2003). A high cost of handling time for low energy returns is unfavorable for predators; prey may employ behaviors (e.g., schooling), protective spines (e.g., spiny water flea Bythotrephes), armor (e.g., mollusks), or toxins (e.g., Coleoptera) to deter predators (Dodds and Whiles 2010). Finally, abiotic factors such as water clarity may impact food web structure, as many fish are visual predators. Introductions of a novel predator or prey into a system may cause unintended or unanticipated impacts. Trout introduced into alpine lakes have had unintended effects on their amphibian and invertebrate prey, as naïve prey are poorly adapted to novel predators (Knapp 2005; Sih et al. 2010). In contrast, spiny water fleas make up a large part of salmonid diets in their native Norway but function as a serious threat in North America, as top predators in North America may be incapable of recognizing or capturing the newly introduced species (Yan et al. 2011). Additionally, galaxioid fishes have been identified as in serious conservation crisis partially due to negative competitive interactions with introduced brown trout and rainbow trout from the northern hemisphere (McDowall 2006). Rainbow trout are one of the most widely stocked and highly valuable sport fish world-wide (FAO Inland Water Resources and Aquaculture 2003 in Fausch 2008). Located in the western United States, Scofield Reservoir is a high-elevation Utah reservoir with an historic blue-ribbon rainbow trout fishery. This reservoir now contains an assemblage of top predators including
USU Budy. Project Completion Report. Scofield Reservoir 52
rainbow trout, Bear Lake strain Bonneville cutthroat trout, and tiger trout Salmo trutta, female x Salvelinus fontinalis, male. These additional species have been stocked into the reservoir in an effort to suppress Utah chub, an unwelcome and rapid invader that re-appeared in 2005. Though each species is known for their individual piscivorous nature, this combination of multiple potential top predators is unique, with relatively little knowledge of the likely interspecific interactions between cutthroat trout, rainbow trout, and tiger trout. Subsequent to the timing of chub invasion, rainbow trout have experienced apparent reductions in abundance and survival. Scofield Reservoir is typical of many systems in the intermountain west, where a nuisance species may threaten the existence of a popular and artificial sport fishery. Therefore, Scofield Reservoir presents an opportunity to better understand how multiple top predators in a food web may interact in reservoirs throughout the West. In this study, we examined the interspecific interactions among Scofield Reservoir piscivores using stable isotope analysis and gut content analysis. Specifically, the objectives of this study were to (1) explore the food habits and use gut content to calculate indices of diet overlap between top predators or top predators and the principal prey fish, to identify potential for competition, and (2) evaluate niche overlap using stable isotope techniques, by collecting tissue samples of fish and aquatic organisms throughout the food web, to further characterize potential predation and competition linkages of the three top predators in the system.
Study Site Scofield Reservoir is a high elevation (2,322 m) impoundment on the Price River, a tributary of the Green River, located in southeast Utah. The reservoir was created by Scofield Dam in 1926 and is predominantly used for irrigation water storage, with recreation and flood control as additional benefits (Bureau of Reclamation 2011). The current reservoir has a capacity of 73,600 acre-ft at full pool, mean surface area of 2,815 acres (1,139 ha), and a mean depth of 8 m (Bureau of Reclamation 2009). Scofield Reservoir is classified as eutrophic, with “excessive” total phosphorous enrichment (Division of Environmental Quality 2010), typical of reservoirs, as high loads of organic materials and nutrients correspond to a proportionally large watershed area relative to volume (Wetzel 1990). Carlson Trophic State Index calculated for 1981-2007, a general measure of eutrophication based on Secchi depth, chlorophyll a, and phosphorous indicated a mesotrophic system (Bureau of Reclamation 2012). Blue-green algae dominate the phytoplankton community, indicative of poorer water quality, with blooms typically occurring in summer. The reservoir stratifies thermally in summer, and hypolimnetic oxygen deficits historically lead to fish kills of varying degrees (Hart and Birdsey 2008).
USU Budy. Project Completion Report. Scofield Reservoir 53
Scofield Reservoir is managed as a put-grow-and take sport fishery. Historically, around 600,000 150-250 mm long rainbow trout were stocked every year. However, the fish stocking program has been adjusted nearly every year since 2005 in response to the re-appearance of Utah chub in gill nets and fear of a population expansion, with potential for negative impacts to the trout fishery (Hart and Birdsey 2008). Tiger trout and Bear Lake-strain Bonneville cutthroat trout have been stocked in the fishery as a potential biological control for the Utah chub as well as alternative sport fishes. These populations demonstrate little to no natural reproduction, and are artificially maintained with approximately 80,000 of each stocked yearly at 200 mm long (see Table 2.1). Non-game species also present include the redside shiner Richardsonius balteatus and mountain sucker Catostomus platyrhynchus.
Methods
Field sampling
We sampled fishes in spring, summer, and autumn of 2012 in Scofield Reservoir. In this type of fixed-station sampling, we selected index sites to be representative of the reservoirs’ longitudinal axis from the upper riverine zone to the lower lacustrine zone (McMahon et al. 1996), while maintaining consistency with long-term Utah Division of Wildlife Resources monitoring (Figure 2.1). We set horizontal sinking gill nets (24 m long x 1.8 m tall with eight monofilament panels of 38-, 57-, 25-, 44-, 19-, 64-, 32-, and 51 mm bar mesh) according to standard gill-net methods to capture a representative size distribution of all fish in the reservoir (Beauchamp et al. 2009). We placed two nets at each of eight sample sites within the reservoir in littoral areas offshore at depths that fish were predicted to be most abundant; set before dusk and pulled at dawn, spanning two crepuscular periods.
Diet analysis
We collected cutthroat trout, rainbow trout, tiger trout, and Utah chub diets from each gill-netting survey. We immediately preserved trout and chub stomachs in 95% ethanol for later analysis. We identified all organisms from stomach contents to the lowest taxonomic level possible (Brooks 1957; Edmonson 1959; Merrit and Cummins 1996) to determine abundance of species and composition. We grouped stomach contents by prey fish (identified to species when possible), zooplankton, organic matter, aquatic invertebrates (classified to order), and terrestrial invertebrates (classified to order). We counted and weighed (blot-dry wet weight to nearest 0.001 g) individual prey fish, and weighed invertebrate prey en masse by classification. We measured intact prey fish to the nearest mm (backbone and standard length), then
USU Budy. Project Completion Report. Scofield Reservoir 54
calculated the contribution of each prey category to the diet of each predator species as the mean proportion by weight (g) for each stomach individually, and then averaged across all nonempty stomachs (Chipps and Garvey 2007):
MWi= 1 N⁄ � ( Wij �Wij)Q
i=1
�N
j=1
where, 𝑁 is the total number of fish with nonempty stomachs, 𝑊𝑖𝑗 is the weight of prey 𝑖 in the stomach of predator𝑗, and 𝑄 is the total number of prey categories. We used Schoener’s index of diet overlap to calculate the percent diet overlap between species. The index is determined using the formula:
∝ =1-0.5�� |pxi-pyi|n
i=1
�
where, ∝ is the degree of overlap, 𝑛 is the number of food categories, 𝑝𝑥𝑖 is the proportion of food category i in the diet of species x, and 𝑝𝑦𝑖 is the proportion of food category i in the diet of species y (Schoener 1970). Index values range from 0 to 1, where a value approaching 0 means the species share no prey resources and a value closer to 1 means the species have identical prey utilizations. Values exceeding 0.6 are considered “biologically significant” in terms of overlap in resource use (Wallace 1981). We pooled all of the fish from each species into representative ‘small’ (fish < 350 mm TL) and ‘large’ (≥ 350 mm TL) size classes with diet overlap values calculated for each season of the study period. Trophic position analysis From all gill-netted trout and chub, we removed a small dorsal muscle tissue sample for isotopic diet analysis. We quantified longer-term dietary habits of a subset of cutthroat trout (n = 15), rainbow trout (n = 11), tiger trout (n = 8), and Utah chub (n = 10) using stable isotope analysis. Specifically, we assessed fish trophic position and dietary carbon source based on the respective δ¹⁵N and δ¹³C signatures of dorsal muscle tissue (Post 2002). We dried tissue samples in an oven for 48 hours at 70°C, ground them to a powder, encapsulated them in 8.5 mm tin capsules, and then samples were analyzed at the Washington State University Stable Isotope CORE for a mass spectrometry-based determination of isotopic signatures. Signatures are an expressed ratio (¹⁵N:¹⁴N and ¹³C:¹²C), per mille (‰) values relative to ratios of the standard atmospheric N₂ and Pee Dee Belemnite, respectively.
USU Budy. Project Completion Report. Scofield Reservoir 55
We then plotted isotopic signature values as coordinates in niche space to determine both resource and habitat use of each species (Newsome et al. 2007). We used the program SIBER (Stable Isotope Bayesian Ellipses in R) to fit standard ellipses based on multivariate normal distributions and maximum likelihood estimators. We then calculated standard ellipse area and overlap, corrected for small sample size (Jackson et al. 2011). Additionally, we used stable isotope data to estimate the relative contribution of Utah chub prey to predator diets using the program SIAR (Stable Isotope Analysis in R), a linear mass balance mixing model (Philips and Gregg 2001; Clarke et al. 2005).
Gape limit To determine the gape size of predators, which indicates the size of fish prey available, we measured several morphometric features of each predator, including total body length (nearest mm TL) and length of the lower (LLJ) and upper (LUJ) jaw, using a digital caliper (to nearest 0.1 mm). We then calculated gape size (G) trigonometrically assuming a maximum mouth opening of 60o during food uptake, using the equation as per Jensen et al. (2004):
Gpred = [(LLJ sin60)2 + (LUJ – LLJ cos60)2]0.5
where, Gpred is the gape size of the predator, LLJ is the length of the predators lower jaw (mm), and LUJ is the length of the predators upper jaw (mm). Second, we also measured the stretched width (laterally left to right) of the predator’s mouth using a digital caliper (to nearest 0.1 mm; Truemper and Lauer 2005). To determine actual sizes of prey consumed by piscivores, we examined diet contents of predators. From fish prey found in diets, when possible, we obtained prey: backbone lengths, standard lengths, and total length measurements. To determine the size of prey “vulnerable” to predators based on their gape, we also measured body depth and total length of prey (i.e., Utah chub) found in the reservoir, and created a relationship relating body depth to total length.
USU Budy. Project Completion Report. Scofield Reservoir 56
Results
Diet
Food habits varied substantially among trout species and Utah chub in Scofield Reservoir. Utah chub were found in the diets of large (≥ 350 mm TL) cutthroat trout (n = 53) throughout every season in 2012 (Figure 2.2). Large cutthroat trout stomachs contained from 50-100% Utah chub prey. Aquatic invertebrates (primarily chironomids) and terrestrial invertebrates made up the remainder of large cutthroat trout diets. However, considerable differences in individuals based on size were evident. Aquatic invertebrates composed 25-85% of small (< 350 mm TL) cutthroat trout diets (n = 65). Small cutthroat trout relied heavily on zooplankton as well (up to 53%).
Tiger trout displayed similar food habits to cutthroat trout. Large tiger trout (n = 57) were distinguished by their piscivorous diet, containing 45-80% Utah chub by season. Small tiger trout (n = 39) displayed a similar affinity for aquatic invertebrates, but additionally, tiger trout consumed a substantial proportion of crayfish at all sizes throughout all seasons (upwards of 20%). Small tiger trout demonstrated a varied diet of not only aquatic invertebrates (primarily Ephemeroptera, Isopoda, and Mollusca) and crayfish, but included prey fish and terrestrial invertebrates.
Rainbow trout differed considerably from these trends. Diets of small (n = 67) and large rainbow trout (n = 13) were similar, characterized by low proportions of prey fish (Figure 2.3). Approximately half of the rainbow trout diet was composed of aquatic invertebrates (primarily Chironomids, with some Isopoda). These rainbow trout also included crayfish, terrestrial invertebrates, and organic matter as a substantial proportion of their diet.
Utah chub diets consisted substantially of aquatic invertebrates at both smaller (n = 30) and larger (n = 20) sizes (ranging from 20-81%). Smaller Utah chub also relied more heavily on zooplankton and organic matter, whereas large Utah chub were found to have a sizable proportion of crayfish in their diet (also see Appendix 4).
Trout and chub also displayed substantial changes in food habits across seasons. The proportion of Utah chub in large cutthroat trout diets in autumn was twice that in spring. Small cutthroat trout relied heavily on aquatic invertebrates regardless of season, but consumed a greater diversity of invertebrates in spring than in summer and autumn. Small cutthroat trout exhibited a strong affinity for zooplankton in autumn, much more than the remainder of the year.
USU Budy. Project Completion Report. Scofield Reservoir 57
Large tiger trout consumed 30% more prey fish in summer than during spring or autumn 2012. Small tiger trout consumed a hefty 80% of aquatic invertebrates in the spring, whereas only 34% in summer and 56% in autumn. Overall, tiger trout incorporated crayfish as 20% of their diet annually, whereas small tiger trout relied more heavily on crayfish for about 42% of their diet in summer. Furthermore, both small and large rainbow trout had a high proportion of aquatic invertebrates, terrestrial invertebrates, and organic matter in their diet regardless of season.
Finally, Utah chub consumed less aquatic invertebrates in summer than in the spring (20-30% compared with 50-80%), but made up the difference with substantial zooplankton consumption at both small (40%) and large (20%) size classes in the summer. Small and large Utah chub also exhibited an exceptionally strong affinity for zooplankton (72% and 100%) in autumn 2012.
Diet overlap amongst Scofield Reservoir trout and Utah chub was lowest in spring 2012. Based on Schoener’s index, there was significant diet overlap between small cutthroat trout (α = 0.63) and small rainbow trout (α = 0.64) with Utah chub, as well as large cutthroat trout with large tiger trout (α = 0.66) in spring 2012. There is also evidence of diet overlap between small and large tiger trout (α = 0.68). Similarly, there is significant diet overlap between small cutthroat trout with large rainbow trout (α = 0.68) and small tiger trout (α = 0.61), as well as overlap between large cutthroat trout (α = 0.69) with large tiger trout during the summer season. In autumn, there were many instances of significant diet overlap, the strongest involving: small cutthroat trout with small Utah chub (α = 0.76), large cutthroat trout with large tiger trout (α = 0.77), and large rainbow trout with both small and large tiger trout (α = 0.66). Similar patterns of extensive diet overlap were observed with summer and autumn 2011 food habits.
Trophic position
Organisms collected displayed carbon and nitrogen signatures indicative of their habitat use and feeding position. Tiger trout (n = 10) had the highest carbon isotopic signature, indicative of their use of more littoral primary carbon sources. Utah chub (n = 10), however, had the most negative carbon isotopic signature, reflecting usage of pelagic habitat at all sizes. Large Utah chub were significantly more depleted in carbon than tiger trout, as well as cutthroat trout (both students t-tests P = 0.02). In comparison, there were no statistical differences between carbon signatures of any large trout species, they all utilized similar carbon sources (Figure 2.4).
Based on δ¹⁵ N results, large cutthroat trout (n = 13) and large tiger trout share a similar position as top predators in this system, feeding at trophic positions corresponding to high δ¹⁵ N values (students t-test P > 0.05). The nitrogen signature of large rainbow trout was also
USU Budy. Project Completion Report. Scofield Reservoir 58
statistically similar to tiger trout, although less similar to cutthroat trout (both students t-tests P > 0.05). Large Utah chub occupy trophic positions similar to rainbow trout and tiger trout, but have a trophic position lower than large cutthroat trout (students t-test P < 0.001). Small Utah chub fed more littorally, and additionally fed at lower trophic positions, with ¹⁵δN signatures similar to trout. Small cutthroat trout fed at nearly the same position as both small and large Utah chub. All three trout species varied in niche space with respect to size class, demonstrating an ontogenetic shift around 350 mm in length, to higher trophic positions. These results suggest that for tiger trout and rainbow trout, small individuals fed in littoral areas whereas the diet of larger individuals originated in more pelagic areas. Cutthroat trout sampled for stable isotope analysis shifted to feed more littorally with an increase in size. When the isotopic niche of these species was plotted in 2-dimensional niche space, large tiger trout had a very broad niche (ellipse area, EA = 10.4); they consumed food at a wide range of trophic positions and vary with respect to their basal resources (Figure 2.5). Large cutthroat trout (EA = 2.2) and large rainbow trout (EA = 2.7) both had smaller more focused isotopic niche areas which overlapped significantly with the tiger trout niche (78% and 64%, respectively), and with each other (31% and 26%, respectively). The isotopic niche of tiger trout only overlapped 17% with both cutthroat trout and rainbow trout. Small rainbow trout (EA = 3.2) and small tiger trout (EA = 2.8) overlap significantly with respect to their isotopic niches (45% of the rainbow trout niche and 52% of the tiger trout niche), sharing similar prey resources at an intermediate trophic position. Small cutthroat trout (EA = 6.6), closely share a feeding niche space with all sizes of Utah chub, as demonstrated by their similar isotopic signatures, with 19% of their niche overlapping with the entirety of the small chub niche. Small Utah chub may consume more pelagic prey than do small rainbow trout, however, adult (i.e., large) rainbow trout may share a large proportion of niche space with small Utah chub.
Gape limit Utah chub found in cutthroat trout diets ranged from 80 to 272 mm in total length. Cutthroat trout became piscivorous at approximately 320 mm TL, and consumed Utah chub near and well above both their horizontal and vertical gape size (Figure 2.6). In several instances, cutthroat trout consumed Utah chub that were greater than 50% of their body size. One 425 mm cutthroat trout consumed a 272 mm Utah chub (64% of the trout’s body size). However, on average, cutthroat trout consumed fish prey 30% of their body size. Gape-width limit was very similar to gape-size limit calculated using vertical gape measurements.
USU Budy. Project Completion Report. Scofield Reservoir 59
Utah chub found in tiger trout diets ranged from 37 to 234 mm in total length. Tiger trout switched to piscivory at approximately 340 mm TL and consumed fish very close to or just exceeding their horizontal and vertical gape sizes. On average, tiger trout consumed prey fish approximately 28% of their body size. One 418 mm tiger trout consumed a 202 mm Utah chub (48% of the trout’s body size). Comparable to cutthroat trout, gape-width limit was very similar to gape-size limit calculated using vertical gape measurements. Rainbow trout, however, demonstrated limited piscivory in Scofield Reservoir, and we found no measureable fish prey in diets.
Discussion
In this study, we present new information on diet among a unique assemblage of trout in a lentic environment, and quantified species interactions and diet overlap of three top trout predators. We also described the feeding niches of three top predators and Utah chub using stable isotope analyses. Overall, the fish composition in Scofield Reservoir was dominated by Utah chub, a species which consumed large quantities of a suite of aquatic invertebrates and zooplankton throughout the growing season. Isotopic signatures of Utah chub, indicative of its feeding position and primary food source, compared similarly to small cutthroat trout. We observed consistently low numbers of rainbow trout, which consumed few prey fish, and relied substantially on aquatic and terrestrial invertebrates for food resources. High overlap was demonstrated amongst rainbow trout with all other species, strength of overlap varying based on season. Additionally, we found cutthroat trout and tiger trout share a top trophic position in the food web, relying on an ontogenetic shift to piscivory to consume Utah chub as a substantial proportion of their adult diet. Both cutthroat trout and tiger trout consumed Utah chub at and above theoretical predictions of gape limit, demonstrating they were not food-limited based on gape morphology or prey size. Throughout the study period, all large trout relied extensively on shared resources. We found evidence that large cutthroat trout and large tiger trout exhibited high diet overlap, with both species feeding primarily on Utah chub. There was no evidence of predation by one species on the other; Utah chub dominated the diets of both. The diets of cutthroat trout reported in this study differed substantially from diets reported from other lentic systems. At least 50% of cutthroat trout diet in Scofield Reservoir consisted of Utah chub throughout the year. Small cutthroat trout displayed an expansive diet throughout all seasons and fed on many different aquatic and terrestrial invertebrates, crayfish, and zooplankton. Within Strawberry Reservoir, Utah, Daphnia were important prey for juvenile cutthroat trout and were seasonally important to adult fish; additionally, fish was a minor contributor to adult diet (Baldwin et al. 2000).
USU Budy. Project Completion Report. Scofield Reservoir 60
However, in Bear Lake, Utah-Idaho, Bonneville cutthroat trout are a dominant piscivore, predominantly consuming cisco Prosopium gemmifer and sculpin Cottus extensus (Ruzycki et al. 2001). The similar piscivorous behavior of cutthroat trout in Scofield Reservoir is likely influenced by the abundant fish prey. The potential for competition between top predators is indicated by similar trophic habits among cutthroat trout and tiger trout. Small tiger trout consumed a wide variety of aquatic invertebrates, whereas large tiger trout switched to a diet primarily of prey fish and crayfish. Tiger trout have been described as a ‘predator trout’ capable of utilizing nuisance prey fish, and as such, added to stocking programs for this purpose (Hepworth et al. 2009; Hepworth et al. 2011). In contrast, tiger trout in eastern Washington appeared to rely substantially on Daphnia, and were intermittently piscivorous (to pumpkinseed Lepomis gibbosus and redside shiners), but only in the summer months (Miller 2010). The same study postulated that kokanee salmon were outcompeting tiger trout for zooplankton, and thus tiger trout had adapted a more benthic diet. While we observed tiger trout consuming a significant proportion of crayfish, a benthic prey item, fish still were the favored prey of tiger trout in this study. The shared chub diet of cutthroat trout and tiger trout alone does not necessarily indicate competition for prey resources (Matthews et al. 1982). Resources must be limited and fitness or performance-related factors such as growth, condition, and fecundity must be negatively affected in order for competition to occur. Consequently, there is likely minimal potential for competition between these trout species as Utah chub are abundant and as cutthroat trout and tiger trout are caught at large sizes and in high numbers throughout the reservoir (see chapter 2). However, if the Utah chub population collapsed under high predation, or if the trout population continued to expand via increased stocking rates, then con-specific competition and predation rates may increase. Both predator size and prey size strongly influence predation (Hambright 1991; Fritts and Pearsons 2006). Cutthroat trout and tiger trout displayed an ontogenetic shift to piscivory around 330 mm TL, and consumed prey fish at 30% of their own size. Additionally, the mouth size and morphometry of these top piscivores does not appear to be limiting prey consumption, as both species also consumed prey at and above their theoretical gape limits. Piscivorous mouth gape size restricts the size of prey based on the body depth of that prey; however, food can be attacked and then manipulated in such a way as to consume larger than expected sizes (Nilsson and Bronmark 2000). In contrast, Hambright (1991) and Hill et al. (2004) both suggest the vulnerability of prey larger than predator gape size is reduced to zero. Subsequently, predation may also depend on prey morphology and predator behavior. Northern pike Esox lucius prefer shallow bodied roach Rutilus rutilus before deep-bodied bream Abramis brama in
USU Budy. Project Completion Report. Scofield Reservoir 61
Swedish lakes, experiments that also highlighted pike may swallow larger prey than suggested by gape measurements (Nilsson and Bronmark 2000). Convincingly, our study also demonstrates the ability of cutthroat trout and tiger trout to consume prey up to 50% of their own size, much larger than gape limit alone would predict.
Unlike the piscivorous cutthroat trout and tiger trout, rainbow trout behaved mostly as invertivores in Scofield Reservoir and occupied a more pelagic habitat than the other trout species. Large rainbow trout displayed a similar propensity for aquatic invertebrates as small rainbow trout. Although our sample size of rainbow trout diets was low, the results agreed with previous studies, demonstrating that rainbow trout relied heavily on aquatic invertebrates, zooplankton, and a small percentage of prey fish (Tabor et al. 1996; Baldwin et al. 2000; Haddix and Budy 2005). In contrast, however, there are many studies which depict rainbow trout as aggressive piscivores (Beauchamp 1990; McDowell 2003; Yard et al. 2011; Juncos et al. 2011). Consequently, the suite of top predators in Scofield Reservoir may have indirect effects on rainbow trout through exploitative competition or behavioral interactions (Duffy et al. 2007; Sih et al. 2010). For example, the presence of cutthroat trout and tiger trout could cause rainbow trout to decrease activity, exhibit predator avoidance, or change feeding strategies (Romare and Hansson 2003). Catch rates of rainbow trout throughout our study were low, and the Blue-Ribbon rainbow trout fishery has abated from this western reservoir.
We observed no biologically-significant diet overlap between large rainbow trout and Utah chub, contradicting expectation that rainbow trout were performing poorly due to shared food resources, and thereby limited food resources, with Utah chub. The small sample size of rainbow trout, which inflated average contributions of prey towards diet composition, may have substantially and unrealistically altered diet proportions. Marrin and Erman (1982) found minimal diet overlap between brown trout and rainbow trout with tui chub Gila bicolor, and Tahoe sucker Catostomus tahoensis, demonstrating these trout and nongame fish partition resources sufficiently, and contradicting the common belief in that system that competition for food resources was the cause for the decrease in trout performance. However, apparent survival of rainbow trout, a relevant measure of interaction strength (Keeley 2001), is extremely low in Scofield Reservoir, and we may not have captured changes in competitive abilities with size and environmental conditions (Hayes 1989).
Our analyses of stable isotope data corroborate with overall diet contributions, and reaffirm evidence of potential for competition amongst this unique assemblage of species. High nitrogen signatures of large cutthroat trout and large tiger trout confirm these top predators are piscivorous share a top trophic position in the food web, relying heavily on prey fish.
USU Budy. Project Completion Report. Scofield Reservoir 62
Carbon signatures from tiger trout suggest they utilize more littoral resources, a pattern corresponding with the high percentage of crayfish in diets.
The trophic positions of small cutthroat trout, rainbow trout, and tiger trout all shifted to higher nitrogen values at larger sizes, indicating a strong ontogenetic shift in diet preferences with size. Rainbow trout also shifted to a more negative δ¹³C value as they became larger. Vander Zanden et al. (1999) documented a similar carbon shift of lake trout in bass-invaded Canadian lakes, reflecting a diet shift towards zooplankton and reduced dependence on littoral prey fish. This diet shift from the littoral to the pelagia for rainbow trout in Scofield Reservoir may indicate rainbow trout are altering their trophic niche in response to direct or indirect competition with the new predators recently stocked into this system (Correa et al. 2012). Despite low sample size, our results indicate rainbow trout are now performing poorly in Scofield Reservoir as suggested, in part, by very low rates of apparent survival and return to the creel, a pattern that could very likely be due to feeding constraints or other limitations associated with the other predators.
Our dietary findings are particularly important given the recent interest in tiger trout and managers’ desire to expand their use in stocking regimes. Several lines of evidence suggest that tiger trout are performing very well and are not limited by strong food web interactions such as competition or predation. Utah chub make up at least 30% of the diet of tiger trout seasonally, suggesting encounter rates are high and prey fish are energetically favorable (Wallace 1981). Large tiger trout also have a wide breadth of diet preferences, relying on a diversity of prey. In addition, this hybrid species feeds more littorally than other trout, thus potentially allowing them to minimize competition for food and space (Petchey 2000; Helland et al. 2011). Accordingly, tiger trout hold a high trophic position in the ecosystem. Tiger trout are also ideal predators to stock into reservoirs as sport fishes, because they are sterile hybrids, and energy normally allocated for gamete production should be allocated into growth (Budy et al. 2012). In addition, sterile trout are easier to control over the long-term (Scheerer and Thorgaard 1987), a consideration that has important conservation implications.
The combination of gut content and stable isotope analysis performed in this study provided a more complete understanding of potential limitations due to competitive or predatory interactions among a suite of novel predators. Competition for food resources between sport and nongame fishes is commonly cited as a reason for decreased salmonid angling success, and competition is often assumed to exist between desired sport fish and undesired invasive prey species (Marking 1992). Nevertheless, competition does not always occur, and, our data suggests two of the top trout predators are not competing, likely because food is not limiting. Both tiger trout and cutthroat trout are monopolizing upon the abundant prey fish, Utah chub,
USU Budy. Project Completion Report. Scofield Reservoir 63
and their growth and survival rates are high. However, prey availability may change spatially, as well as on a seasonal or annual basis, and increased growth rates of prey may result in chub outgrowing predator gape quickly, causing a shift in predator-prey dynamics. This novel fish community should be monitored carefully, as large-scale recent changes in the food web as well as annual changes in reservoir volume may result in an extremely dynamic predator-prey system.
References
Abrams, P.A. & Fung, S.R. 2010. Prey persistence and abundance in systems with intraguild predation and type-2 functional responses. Journal of Theoretical Biology 264: 1033-1042.
Bacheler, N.M., Neal, J.W. & Noble, R.L. 2004. Diet overlap between native bigmouth sleepers (Gobiomorus dormitor) and introduced predatory fishes in a Puerto Rico reservoir. Ecology of Freshwater Fish 13: 111–118.
Baldwin, C.M., Beauchamp, D.A. & Van Tassell, J.J. 2000. Bioenergetic assessment of temporal food supply and consumption demand by salmonids in the Strawberry Reservoir food web. Transactions of the American Fisheries Society 129: 429-450.
Beauchamp, D.A. 1990. Seasonal and diel food habits of rainbow trout stocked as juveniles in Lake Washington. Transactions of the American Fisheries Society 119: 475-482.
Beauchamp, D.A., Parrish, D.L. & Whaley, R.A. 2009. Coldwater fish in large standing waters. In: Bonar, S.A., Hubert, W.A. & Willis, D.W., eds. Standard methods for sampling North American freshwater fishes. American Fisheries Society: Bethesda, Maryland, pp 97-118
Brooks, J.L. 1957. Identifications and nomenclature of Cladocera, Calanoida, and Cyclopoida. Memoirs of the Connecticut Academy of the Arts and Science 13(1).
Bronmark, C. & Hansson, L.A. 1998. Consumption patterns, complexity and enrichment in aquatic food chains. Proceedings of the Royal Society 265: 901-906.
Budy, P., Thiede, G.P., Dean, A., Olsen, D. & Rowley, G. 2012. A comparative and experimental evaluation of performance of stocked diploid and triploid brook trout. North American Journal of Fisheries Management 32: 1211-1224.
Bureau of Reclamation. 2009. Scofield Dam. U.S. Department of the Interior.
Bureau of Reclamation. 2011. Scofield Project. U.S. Department of the Interior.
Bureau of Reclamation. 2012. Scofield Reservoir. U.S. Department of the Interior.
Carey, M.P. & Wahl, D.H. 2010. Interactions of multiple predators with different foraging modes in an aquatic food web. Oecologia 162: 443-452.
Chipps, S. R., & Garvey, J.E. 2007. Assessment of diets and feeding patterns. In: Guy, C.S. & Brown, M.L., eds. Analysis and interpretation of freshwater fisheries data. American Fisheries Society: Bethesda, Maryland, pp 473-514
USU Budy. Project Completion Report. Scofield Reservoir 64
Christensen, B., & Persson, L. 1993. Species-specific antipredator behaviours: effects on prey choice in different habitats. Behavioral Ecology and Sociobiology 32: 1-9.
Clarke, L.R., Vidergar, D.T., & Bennett, D.H. 2005. Stable isotopes and gut content show diet overlap among native and introduced piscivores in a large oligotrophic lake. Ecology of Freshwater Fish 14: 267-277.
Clavero, M., Hermoso, V., Aparicio, E. & Godinho, F.N. 2013. Biodiversity in heavily modified waterbodies: native and introduced fish in Iberian reservoirs. Freshwater Biology 58: 1190-1201.
Correa, C., Bravo, A.P. & Hendry, A.P. 2012. Reciprocal trophic niche shifts in native and invasive fish: salmonids and galaxiids in Patagonian lakes. Freshwater Biology 57: 1769-1781.
Courtenay, W.R. & Kohler, C.C. 1986. Regulating introduced aquatic species- a review of past initiatives. Fisheries 11: 34-38.
Department of Environmental Quality. 2010. Scofield Reservoir TMDL. Division of Water Quality. Salt Lake City, Utah.
Dodds, W.K. & Whiles, M.R. 2010. Freshwater ecology: concepts and environmental applications of limnology, second edition. Elsevier Inc., United States.
Duffy, J.E., Cardinale, B.J., France, K.E., Mcintyre, P.B., Thebault, E. & Loreau, M. 2007. The functional role of biodiversity in ecosystems: incorporating trophic complexity. Ecology Letters 10: 522-538.
FAO Inland Water Resources and Aquaculture Service. 2003. Fishery Record Collections. FIGIS Data Collection. FAO - Rome. Food and Agriculture Organization.
Fausch, K.D. 2008. A paradox of trout invasions in North America. Biological Invasions 10: 685-701.
Franssen, N.R. & Tobler, M. 2013. Upstream effects of a reservoir on fish assemblages 45 years following impoundment. Journal of Fish Biology 82: 1659-1670.
Fritts, A.L. & Pearsons, T.N. 2006. Effects of predation by nonnative smallmouth bass on native salmonid prey: the role of predator and prey size. Transactions of the American Fisheries Society 135: 853-860.
Gido, K.B., Schaefer, J. & Falke, J.A. 2009. Convergence of littoral zone fish communities in reservoirs. Freshwater Biology 54: 1163-1177.
Haddix, T. & Budy, P. 2005. Factors that limit growth and abundance of rainbow trout across ecologically distinct areas of Flaming Gorge Reservoir, Utah-Wyoming. North American Journal of Fisheries Management 25: 1082-1094.
Hambright, K.D. 1991. Experimental analysis of prey selection by largemouth bass: role of predator mouth width and prey body depth. Transactions of the American Fisheries Society 120: 500-508.
Hart, J., & Birdsey, P.W. 2008. Scofield Research Proposal. Price, UT: Utah Division of Wildlife Resources, Southeastern Regional Office. 5 pp.
Havel, J.E., Lee, C.E. & VanderZanden, J. 2005. Do reservoirs facilitate invasions into landscapes? BioScience 55: 518-525.
Hayes, J.W. 1989. Social interaction between 0+ brown and rainbow trout in an experimental stream design. New Zealand Journal of Marine Freshwater Resources 23: 163-170.
USU Budy. Project Completion Report. Scofield Reservoir 65
Hays, G.C. 2003. A review of the adaptive significance and ecosystem consequences of zooplankton diel vertical migrations. Hydrobiologia 503: 163-170.
Helland, I.P., Finstad, A.G., Forseth, T., Hesthagen, T. & Ugedal, O. 2011. Ice-cover effects on competitive interactions between two fish species. Journal of Animal Ecology 80: 539-547.
Hepworth, R.D., Warner, J., Ottenbacher, M.J. & Hadley, M.J. 2009. Panguitch Lake: an evaluation of the sport fishery management plan. Utah Department of Natural Resources, Division of Wildlife Resources, Salt Lake City.
Hepworth, R.D., Ottenbacher, M. & Hadley, M.J. 2011. Angler survey and monitoring results, Fish Lake Utah 2010. Utah Department of Natural Resources, Division of Wildlife Resources, Salt Lake City, Utah.
Hill, J.E., Nico, L.G., Cichra, C.E. & Gilbert, C.R. 2004. Prey vulnerability to peacock cichlids and largemouth bass based on predator gape and prey body depth. Proceedings of the Annual Conference, Southeast Association for Fish and Wildlife Agencies 58: 47-56.
Jackson, A.L., Inger, R., Parnell, A.C. & Bearhop, S. 2011. Comparing isotopic niche widths among and within communities: SIBER - Stable Isotope Bayesian Ellipses in R. The Journal of Animal Ecology 80: 595–602.
Jensen, H., Bohn, T., Amundsen, P. & Aspholm, P.E. 2004. Feeding ecology of piscivorous brown trout (Salmo trutta L.) in a subarctic watercourse. Annales Zoologici Fennici 41: 319-328.
Juanes, F., Buckel, J.A. & Scharf, F.S. 2002. Feeding ecology of piscivorous fishes. In: Hart, P.J.B & Reynolds, J.D., eds. Handbook of Fish Biology and Fisheries, first edition. Oxford, UK: Blackwell Publishing Ltd, pp 267-283.
Juncos, R., Milano, D., Macchi, P.J., Alonso, M.F. & Vigliano, P.H. 2011. Response of rainbow trout to different food web structures in Northern Patagonia: implications for growth, bioenergetics, and invasiveness. Transactions of the American Fisheries Society 140: 415-428.
Kashiwagi, M.T., & Miranda, L.E. 2009. Influence of small impoundments on habitat and fish communities in headwater streams. Southeastern Naturalist 8: 23-36.
Keeley, E.R. 2001. Demographic responses to food and space competition by juvenile steelhead trout. Ecology 85: 1247-1259.
Kitchell, J.F., & Crowder, L.B. 1986. Predator-prey interactions in Lake Michigan: model predictions and recent dynamics. Environmental Biology of Fishes 16: 205-211.
Knapp, R.A., Hawkins, C.P, Ladau, J. & McClory, J.G. 2005. Fauna of Yosemite National Park lakes has low resistance but high resilience to fish introductions. Ecological Applications 15: 835-847.
Layman, C.A., Araujo, M.S., Boucek, R., Hammerschlag-Peyer, C.M., Harrison, E., Jud, Z.R., Matich, P., Rosenblatt, A.E., Vaudo, J.J., Yeager, L.A., Post, D.M. & Bearhop, S. 2012. Applying stable isotopes to examine food-web structure: an overview of analytical tools. Biological Reviews 87: 545-562.
Lundvall, D., Svanback, R., Persson, L. & Bystrom, P. 1999. Size-dependent predation in piscivores: interactions between predator foraging and prey avoidance abilities. Canadian Journal of Fisheries and Aquatic Sciences 56: 1285-1292.
Marking, L.L. 1992. Evaulation of the toxicants for the control of carp and other nuisance species. Fisheries 17: 6-13.
Marrin, D.L. & Erman, D.C. 1982. Evidence against competition between trout and nongame fishes in Stampede Reservoir, California. North American Journal of Fisheries Management 2: 262-269.
USU Budy. Project Completion Report. Scofield Reservoir 66
Matthews, W.J., Gido, K.B. & Gelwick, F.P. 2004. Fish assemblages of reservoirs, illustrated by Lake Texoma (Oklahoma-Texas , USA) as a representative system. Lake and Reservoir Management 20: 219–239.
Matthews, W.J., Bek, J. & Surat, E. 1982. Comparative ecology of the darters Etheostoma podostemone, E. flabellare, and Percina roanoka in the upper Roanoke River drainage, Virginia. Copeia 805-814.
McDowall, R.M. 2003. Impacts of introduced salmonids on native galaxiids in New Zealand upland streams: a new look at an old problem. Transactions of the American Fisheries Society 132: 229-238.
McDowall, R.M. 2006. Crying wolf, crying foul, or crying shame: alien salmonids and a biodiversity crisis in the southern cool-temperate galaxioid fishes? Review in Fish Biology and Fisheries 16: 233-422.
Merritt, R.W., & Cummins, K.W., eds. 1996. An introduction to the aquatic insects of North America. Dubuque, Iowa: Kendall & Hunt.
Miller, A.L. 2010. Diet, growth, and age analysis of tiger trout from ten lakes in Eastern Washington. Masters Thesis. Eastern Washington University.
Miranda, L.E. & DeVries, D.R., eds. 1996. Multidimensional approaches to reservoir fisheries management. American Fisheries Society Symposium 16, Bethesda, Maryland.
Mittelbach, G.G., & Persson, L. 1998. The ontogeny of piscivory and its ecological consequences. Canadian Journal of Fisheries and Aquatic Sciences 55: 1454–1465.
Newsome, S.D., del Rio, C.M. & Bearhop, S. 2007. A niche for isotopic ecology. Frontiers in Ecology and the Environment 5: 429-436.
Ney, J.J. 1990. Trophic economics in fisheries: assessment of demand-supply relationships between predators and prey. Reviews in Aquatic Sciences 2: 55-81.
Ney, J.J. 1996. Oligotrophication and its discontents: effects of reduced nutrient loading on reservoir fisheries. In: Miranda, L.E. & DeVries, D.R., eds. Multidimensional approaches to reservoir fisheries management. American Fisheries Society Symposium 16: Bethesda, Maryland, pp 285-295.
Ney, J.J., & Orth, D.J. 1986. Coping with future shock: the challenge of matching predator stocking programs to prey abundance. In: Stoud, R.H., ed. Fish culture in fisheries management. American Fisheries Society: Bethesda, Maryland, pp 81-92.
Nilsson, P.A. & Bronmark, C. 2000. Prey vulnerability to a gape-size limited predator: behavioural and morphological impacts on northern pike piscivory. Oikos 88: 539-546.
Noble, R.L. 1986. Management of reservoir fish communities by influencing species interactions: predator-prey interactions in reservoir communities. In: Hall, G.E. & Van Den Avyle, M.J., eds. Reservoir fisheries management strategies for the 80's. American Fisheries Society: Bethesda, Maryland, pp 137-143.
Olson, M.H., Mittelbach, G.G. & Osenberg, C.W. 1995. Competition between predator and prey: resource-based mechanisms and implications for stage-structured dynamics. Ecology 76: 1758–1771.
Paine, R.T. 1980. Food webs: linkage, interaction strength and community structure. Journal of Animal Ecology 49: 667–685.
Persson, L. & Eklov, P. 1995. Prey refuges affecting interactions between piscivorous perch and juvenile perch and roach. Ecology 76: 70-81.
USU Budy. Project Completion Report. Scofield Reservoir 67
Petchey, O.L. 2000. Prey diversity, prey composition, and predator population dynamics in experimental microcosms. Journal of Animal Ecology 69: 874-882.
Phillips, D.L., & Gregg, J.W. 2001. Uncertainty in source partitioning using stable isotopes. Oecologia 127: 171-179.
Polis, G.A. 1991. Complex trophic interactions in deserts: an empirical critique of food web theory. The American Naturalist 138: 123–155.
Polis, G.A., & Strong, D.R. 1996. Food web complexity and community dynamics. The American Naturalist 147(5): 813–846.
Polis, G.A., Anderson, W.B. & Holt, R.D. 1997. Toward an integration of landscape and food web ecology: the dynamics of spatially subsidized food webs. Annual Review of Ecological Systems 28: 289-316.
Post, D.M. 2002. Using stable isotopes to estimate trophic position: models, methods, and assumptions. Ecology 83: 703-718.
Romare, P. & Hansson, L. 2003. A behavioral cascade: top-predator induced behavioral shifts in planktivorous fish and zooplankton. Limnology and Oceanography 48: 1956-1964.
Ruzycki, J.R., Wurtsbaugh, W.A. & Luecke, C. 2001. Salmonine consumption and competition for endemic prey fishes in Bear Lake, Utah–Idaho. Transactions of the American Fisheries Society 130: 1175–1189.
Scheerer, P.D. & Thorgaard, G.H. 1987. Performance and developmental stability of triploid tiger trout (brown trout x brook trout). Transactions of the American Fisheries Society 116: 92-97.
Schoener, T.W. 1970. Non-synchronous spatial overlap of lizards in patchy habitats. Ecology 51: 408–418.
Sih, A., Bolnick, D.I., Luttbeg, B., Orrock, J.L., Peacor, S.D., Pintor, L.M., Preisser, E., Rehage, J.S. & Vonesh, J.R. 2010. Predator-prey naiveté, antipredator behavior, and the ecology of predator invasions. Oikos 119: 610-621.
Stein, R.A., DeVries, D.R. & Dettmers, J.M. 1995. Food-web regulation by a planktivore: exploring the generality of the trophic cascade hypothesis. Canadian Journal of Fisheries and Aquatic Sciences 52: 2518-2526.
Svanback, R. & Bolnick, D.I. 2007. Intraspecific competition drives increased resource use diversity within a natural population. Proceedings of the Royal Society 274: 839-844.
Tabor, R.A. & Wurtsbaugh, W.A. 1991. Predation risk and the importance of cover for juvenile rainbow trout in lentic systems. Transactions of the American Fisheries Society 120: 728-738.
Tabor, R.A., Luecke, C. & W. Wurtsbaugh. 1996. Effects of daphnia availability on growth and food consumption of rainbow trout in two Utah reservoirs. North American Journal of Fisheries Management 16: 591-599.
Terra, B.F. & Araujo, F.G. 2011. A preliminary fish assemblage index for a transitional river-reservoir system in southeastern Brazil. Ecological Indicators 11: 874-881.
Teuscher, D., & Luecke, C. 1996. Competition between kokanees and Utah chub in Flaming Gorge Reservoir, Utah-Wyoming. Transactions of the American Fisheries Society 125: 505-511.
Truemper, H.A. & Lauer, T.E. 2005. Gape limitation and piscine prey size-selection by Yellow Perch in the extreme southern area of Lake Michigan, with emphasis on two exotic prey items. Journal of Fish Biology 66: 135–149.
Vander Zanden, M.J., Casselman, J.M. & Rasmussen, J.B. 1999. Stable isotope evidence for the food web consequences of species invasions in lakes. Nature 401: 464–467.
USU Budy. Project Completion Report. Scofield Reservoir 68
Wallace, R.K. 1981. An assessment of diet-overlap indexes. Transactions of the American Fisheries Society 110: 72–76.
Walsworth, T., Budy, P. & Thiede, G.P. 2013. Longer food chains and crowded niche space: effects of multiple invaders on desert stream food web structure. Ecology of Freshwater Fish 22: 439-452.
Werner, E.E., & Gilliam, J.F. 1984. The ontogenetic niche and species interactions in size-structured populations. Annual Review of Ecology and Systematics 15: 393-425.
Werner, E.E. & Hall, D.J. 1974. Optimal foraging and size selection of prey by the bluegill sunfish (Lepomis macrochirus). Ecology 55: 1042-1052.
Werner, E.E., & Hall, D.J. 1977. Competition and habitat shift in two sunfishes (Centrarchidae). Ecology 58: 869-876.
Wetzel, R.G. 1990. Land-water interfaces: metabolic and limnological regulators. Verhandlungen des Internationalen Verin Limnologie 24: 6–24.
Wuellner, M.R., Chipps, S.R, Willis, D.W. & Adams Jr, W.E. 2010. Interactions between walleyes and smallmouth bass in a Missouri river reservoir with consideration of the influence of temperature and prey. North American Journal of Fisheries Management 30: 445-463.
Yan, N.D., Lueng, B., Lewis, M.A. & Peacor, S.D. 2011. The spread, establishment and impacts of the spiny water flea, Bythotrephes longimanus, in temperate North America: a synopsis of the special issue. Biological Invasions 13: 2423-2432.
Yard, M.D., Coggins Jr., L.G., Baxter, C.V., Bennett, G.E. & Korman, J. 2011. Trout piscivory in the Colorado River, Grand Canyon: effects of turbidity, temperature, and fish prey availability. Transactions of the American Fisheries Society 140: 471-486.
USU Budy. Project Completion Report. Scofield Reservoir 69
Figure 2.1. Map of Scofield Reservoir, Utah showing the eight locations (denoted as black circles) where we sampled fish in 2011 and 2012.
USU Budy. Project Completion Report. Scofield Reservoir 70
Figure 2.2. Seasonal diet composition of small (< 350 mm TL) and large (≥ 350 mm TL) cutthroat trout, rainbow trout, and tiger trout captured in Scofield Reservoir. Diet composition was calculated as the proportion of diet by wet weight (g).
USU Budy. Project Completion Report. Scofield Reservoir 71
Figure 2.3. Proportion of Utah chub diet contribution for each predator species in Scofield Reservoir. Proportions are displayed with 95% confidence intervals in dark gray, then 75%, 25%, to 5% credibility intervals in light gray.
USU Budy. Project Completion Report. Scofield Reservoir 72
Figure 2.4. Stable isotope bi-plots for ¹³C and ¹⁵N of (top panel) small trout (< 350 mm TL) and small chub (< 250 mm TL), and (bottom panel) large trout (≥ 350 mm TL) and large chub (≥ 250 mm TL). Error bars show 1 standard error.
Utah chub
9
10
11
12
13
14
Utah chub
δ13Carbon-29 -28 -27 -26 -25 -24
δ15N
itrog
en
9
10
11
12
13
14
cutthroat trout
rainbow trouttigertrout
tigertrout
cutthroat trout
rainbow trout
USU Budy. Project Completion Report. Scofield Reservoir 73
Figure 2.5. Two-dimensional isotopic (δ¹⁵N and δ¹³C) niche plots of (left panel) large (≥ 350 mm) cutthroat trout, rainbow trout, tiger trout, and Utah chub (≥ 250 mm) from Scofield Reservoir, and (right panel) small (< 350 mm) cutthroat trout, rainbow trout, tiger trout, and Utah chub (< 250 mm).
USU Budy. Project Completion Report. Scofield Reservoir 74
Figure 2.6. Relationship between cutthroat trout (top), rainbow trout (middle), and tiger trout (bottom) length with Utah chub length in Scofield Reservoir, Utah. Gray circles represent actual sizes of prey found in trout diets. Lines show the calculated gape limit for trout based on two gape measurements. Although rainbow trout did consume fish prey, we found no measureable fish prey in diets.
I. Collectively, our results suggest that if a primary management goal for the fishery of Scofield Reservoir is to maintain a popular sport fishery, rainbow trout currently provide little return.
A. Across both years of the study, rainbow trout had extremely low catch rates, with the population appearing to consist of only a small fraction of individuals compared to cutthroat trout and tiger trout. Relative abundance of rainbow trout was less than 1% of the total catch (i.e., CPUE) every year. In addition, their apparent survival is very low.
B. Rainbow trout exhibit extremely low PSD and RSD-P values, with few fish above the “preferred” length of 500 mm and no proportion of fish above the “memorable” length of 650 mm. In contrast, cutthroat trout exhibit relatively high values of proportional stock density, with a substantial proportion of fish above the “preferred” length of 450 mm. Nearly all tiger trout in Scofield Reservoir are of “preferred” length (450 mm), and there is a significant portion of fish of “memorable” length (525 mm), indicating the population is dominated by large, healthy fish. Notably, multiple Utah state record tiger trout have been caught at Scofield Reservoir recently.
C. Based on isotopic analyses, while tiger trout and cutthroat trout appear to show considerable niche differentiation, with tiger trout being more littoral and cutthroat trout being more pelagic, rainbow trout demonstrate considerable overlap with both small cutthroat trout and large tiger trout. Further, because rainbow trout are largely insectivorous in Scofield Reservoir, their diet overlaps with Utah chub. These results suggest the potential for competition between rainbow trout and Utah chub, and rainbow trout and both of the other trout, perhaps contributing to their poor performance in the reservoir.
D. In observational studies of aggression in the laboratory, rainbow trout were more aggressive, demonstrating more chases, bites, and contact relative to both tiger trout and cutthroat trout. In controlled pond experiments measuring growth of the three trout species held in different combinations, rainbow trout grew bigger when in the presence of tiger trout or cutthroat trout, whereas the other two trout species grew best when reared with only conspecifics. Although it is difficult to extrapolate from the lab to the field, it is possible that excessive energy expenditure could be inhibiting rainbow trout growth (i.e., they could be spending too much time chasing the other trout species) in the reservoir, where the other trout strongly dominate the species composition.
USU Budy. Project Completion Report. Scofield Reservoir 76
E. In addition, although anecdotal, while working in the dock area at Scofield Reservoir, our technicians noted that in several cases, anglers who were enthusiastic about the large “rainbow trout” they had recently caught were actually holding a Bonneville cutthroat trout. These anecdotal observations suggest a need for outreach efforts including signage at boat launches and possibly informational brochures.
II. Similarly, if a primary management goal for the fishery of Scofield Reservoir is tocontrol the Utah chub population, collectively our results suggest that rainbow troutare contributing little to the biological control of Utah chub, whereas tiger trout andcutthroat trout are consuming millions of Utah chub each year and appear to bekeeping the Utah chub population somewhat in check.
A. The diets of large (> 350 mm) tiger trout and cutthroat trout contain as much as 79% Utah chub, and on average they consume Utah chub of 30% of their body size. Although our sample size of rainbow trout stomachs was low, our results agreed with previous studies (e.g., in Flaming Gorge Reservoir), and demonstrated that rainbow trout rely heavily on aquatic invertebrates, zooplankton, and consume only small percentage of prey fish (< 5%).
B. The optimum temperature for rainbow trout consumption (CTO, 20 oC) was available in the epilimnion (i.e., near surface waters) during summer 2012 from late July to mid-August (Figure 3.1). The CTO for tiger trout was often available in Scofield Reservoir during the summer months and temperatures near the CTO of cutthroat trout were available through much of the time series. Unsurprisingly, bioenergetic efficiency (i.e., proportion of maximum consumption) was greatest for tiger trout. Temperatures available in the reservoir during the summer growth season (June – September) for trout, although not optimum at all times, were within acceptable ranges for good growth and consumption by trout as demonstrated by bioenergetic efficiency rates of 36 – 58%.
C. On average, an individual large tiger trout was responsible for the majority of consumption of prey fish, primarily Utah chub – the average large tiger trout consumes over 2,660 g of prey fish in a given year (63 chub per year), contributing to over half (52%) of the total annual piscivory at Scofield Reservoir. An average large individual cutthroat trout consumes 1,820 g chub annually (49 chub per year), accounting for 35% of the annual consumption of Utah chub.
D. When scaled up to the overall reservoir-wide population of each species, proportional contributions to total piscivory change accordingly. The population of large cutthroat trout in the reservoir consumes over 16.6 million Utah chub in a year, about 65% of the overall reservoir-wide consumption of chub. The smaller population of large tiger trout contributes 33% of the overall consumption, consuming about 8.5 million Utah chub yearly. The
USU Budy. Project Completion Report. Scofield Reservoir 77
rainbow trout population contributes less than 1% of the total piscivory in Scofield Reservoir.
E. We estimate that the population of cutthroat trout and tiger trout (combined) consumed 76% of the Utah chub biomass (standing stock + production) in Scofield Reservoir. Given the uncertainties associated with estimates of predator and prey abundance and predation rates, if the predation (i.e., consumption) estimate approaches 60% of the prey biomass (including production for fast growing, r-selected species like Utah chub), then predation is likely capable of regulating the prey population (Dave Beauchamp, personal communication). Since the goal is the suppression of Utah chub, rather than conservation of Utah chub, it is noteworthy that populations of these two predators, tiger trout and cutthroat trout, are likely consuming a very large proportion of available Utah chub biomass. However, we note that our acoustic estimates likely underestimate the total Utah chub abundance in Scofield Reservoir due to (1) an inability to accurately estimate small < 100 mm chub, (2) an inability to discern targets within shallow, dense-macrophyte areas (e.g., in the southern end of reservoir), and (3) boundary effects along the slopes and surfaces of the reservoir.
III. Based on the sum of these results and some preliminary cohort modeling describedbelow, our results suggest that the reservoir population of trout (tiger trout andcutthroat trout) must be maintained at a minimum of 320,000 trout, preferably with aspecies composition of approximately 75% tiger trout and 25% cutthroat trout in ordercontrol the Utah chub population.
A. If all else stays similar to the time of this study (e.g., environmental conditions in the reservoir, survival rates of stocked fishes), we estimate that a goal of maintaining the reservoir at a minimum of 320,000 trout with a species composition of 75% tiger trout and 25% cutthroat trout could be met with several different combinations of stocking densities (Table 3.1). For example, for the next three years, stocking 250,000 tiger trout and 40,000, 30,000, and 30,000 cutthroat trout for 2014, 2015, and 2016, respectively should keep the total trout population at a safe minimum density (350,000 – 400,000) and would bring the ratio back in favor of tiger trout (closer to 75%). A simple spreadsheet could be provided that managers can use to “game play” given production abilities.
B. However, for the near future (next 3 – 5 years) more is likely going to be better, and trout densities should be maintained at very high densities if production allows, unless their condition appears to change and begins to decline (see also Utah chub decline below). If 600,000 total tiger and cutthroat could be stocked for 3 more years, the Utah chub population would likely be “under control”. See below.
USU Budy. Project Completion Report. Scofield Reservoir 78
C. Although the Utah chub population no longer appears to be increasing exponentially (Figure 3.2), the current density of Utah chub in the reservoir is extremely high and nearly 10-fold greater than the density of the trout population. In addition, Utah chub > 250 mm are less susceptible to predation (see Appendix Figure A4.4) and simultaneously the most fecund. And, the large discrepancy between fish production and fish consumption reported here suggests we may be underestimating the size of the chub population (young-of-year [age-0] and age-1 in particular) and/or their growth rates.
1. Thus the situation should be considered still volatile, and it is imperative that the
reservoir be monitored with hydroacoustics and gill netting in the spring, but preferably in both the spring and autumn for the next three to five years (i.e., the length of time it will take for Utah chub > 200 mm to senesce [Figure 3.3], and for tiger trout to increase in relative abundance).
2. We also recommend starting and ichthyoplankton-net tow regime to the spring sampling in order to capture recruitment patterns of Utah chub
3. The greatest densities of trout that can be produced should be stocked, until the Utah
chub population appears to be consistently declining over a three-year time frame.
D. As tiger trout were not marked, we cannot make an assessment about the relative performance (e.g., growth) of different cohorts of tiger trout stocked at different times or different sizes. For cutthroat trout, the best overall performance resulted from fish adipose-clipped and stocked in May 2009 at 207 mm; likewise for rainbow trout adipose-clipped and stocked in May 2009 at 200 mm (Figure 3.4).
E. Based on a limited time series analysis described below, before biological control became effective in about 2009, the chub population was experiencing an extremely high annual increase, more than 500% increase in chub abundance each year (λ = 6.5; 95% CI = 1.6 – 26.3). After biological control appeared to become effective in 2009, the annual population growth rate declined to 1.52 (95% CI = 0.06 – 35.92) indicating the population is still increasing, however this later estimate is highly uncertain due to the short time series and large confidence intervals. Nonetheless, the population trajectory did change dramatically in 2009 from an exponential increase prior to 2009 to a much flatter linear relationship after 2009, suggesting the chub population is under control. We also estimated the future year when those unsusceptible large adults reach an abundance no longer of management concern, in terms of the effectiveness of biological control. Under those scenarios, we estimate that by 2021 there will be very few adult chub remaining from the 2013 cohort (Figure 3.5). By 2019, there will be very few adult chub > 250 mm, those that had escaped gape limitation prior to reaching effective numbers of stocked trout as described above. We anticipate that these are both conservative estimates
USU Budy. Project Completion Report. Scofield Reservoir 79
(the date for meeting effective control targets is likely earlier), as the stocked predators are getting larger and likely more effective over time. Nonetheless, we note these projections are somewhat limited, as they are based on one point in time, 2013, for reasons associated with analytical and data restrictions. Therefore, annual hydroacoustic estimates of chub abundance are critical for effective monitoring and management of this uncertain system.
IV. Anticipated effects of the Gooseberry Narrows Project
A. The effects of a 10% decline in reservoir acres are difficult to anticipate. The reduction in reservoir volume should be estimated and monitored (see Appendix Figure A1.1). If the reservoir volume declines significantly, the carrying capacity for both Utah chub and trout will also decline, while trout predation rates may actually increase.
B. The reservoir currently becomes slightly too warm for tiger trout and cutthroat trout during some times of the year (mid to late summer). If the volume declines, water temperatures may increase, which could be simultaneously bad for the performance of trout and good for the population of Utah chub. Similarly, the likelihood of the reservoir going anoxic will increase, which could be simultaneously bad for trout, which are more sensitive to low oxygen concentrations, with lesser impacts on Utah chub.
C. Belatedly, as directly stated in the Gooseberry Narrows Findings report, “The overall probability of eutrophication (algae bloom) in Scofield Reservoir for the period studied shows an increase from 68.3 to 73.5% (about a 5.2% increase). This will increase the probability of fish kills.”…due to anoxic conditions. See above.
V. Additional recommendations
A. We strongly recommend that the reservoir be consistently monitored via gill netting, hydroacoustics, and ichthyoplankton tows for the next 3 – 5 years (see above). A full field study would not be required.
B. The various estimates and cohort modeling should be updated annually based on hydroacoustic estimates and netting results.
C. Tiger trout should be dye marked to assess cohort strength, growth, and relative survival.
D. It might be useful to do some more explicit comparisons to Strawberry Reservoir, at the time period leading up to the rotenone treatment.
E. Given the amazing performance of tiger trout and the good performance of cutthroat trout, relative to the poor performance of rainbow trout and the need for biological control of Utah
USU Budy. Project Completion Report. Scofield Reservoir 80
chub, anglers should be made aware of the overall situation in Scofield Reservoir. This awareness should include the trophic dynamics currently operating, the new opportunities (state record tiger trout), and anglers should be provided with identification tips (so cutthroat trout are not confused with rainbow trout). An outreach and education sign, similar to signage at Strawberry Reservoir, should be posted at boat launches and docks and perhaps other areas.
Cohort Trend Analysis for Trout and Chub: Predictions for the Future
In order to try and start developing an estimate of the number of trout and of what species composition will be required to try and control the Utah chub (Gila atraria) population of Scofield Reservoir, we completed a simple cohort analysis of stocked trout over the time series available, and compared this to the trend in chub. We applied a range of biologically-realistic survival rates, ranging from 30-70% to the cohorts of stocked tiger trout (Salmo trutta, female X Salvelinus fontinalis, male), and Bear Lake strain cutthroat trout (Oncorhynchus clarkii utah) each year, and removed fish from the cohort after they were age-6 and age-7 for cutthroat trout and tiger trout, respectively. In comparison, Rozengranz et al, (1999) reported survival rates of 37 – 51% for lake-dwelling cutthroat trout in Alaska, Hegge et al. (1991) reported a survival rate of 49% for brown trout (Salmo trutta) in Norway, Glenn et al. (1989) reported survival of 44% for brown trout stocked into small lakes, and Quinn and Kwak (2011) reported mean annual survival of 22 – 36% for stream-dwelling brown trout.
We used the catch-per-unit-effort (CPUE) from the annual UDWR spring-time, gill-netting survey (the most comparable data over time) to estimate the time trend in chub abundance. We also relied on the spring gill netting, because it likely represents the most accurate index of the “adult” (i.e., large chub) population trend. Further, we corroborated our results from this simple cohort analysis with estimates of the abundance of tiger trout (238,130) and cutthroat trout (214,128) from the August 2011 hydroacoustic survey (Table 3.1).
Based on this simple analysis, in about 2007, Utah chub started increasing exponentially in the reservoir (Figure 3.1). An exponential increase is indicative of a population growing without limitation. After 2009, based on the spring gill netting, the density of the Utah chub population appeared to be substantially reduced, with little, if any, rate of increase. Thus it appears that when the combined population of tiger trout and cutthroat trout in the reservoir reached about 320,000 trout, with a species composition of about 77% tiger trout and 23% cutthroat trout, the trout population was controlling the chub population (Table 3.1). These estimates also indicate that annual survival of tiger trout and cutthroat trout are approximately 52% and 87%, respectively, based on corroboration with August 2011 acoustics-based estimates of tiger trout and cutthroat trout abundance (Table 3.1).
Therefore, we estimate that in order to prevent an increasing trend in chub, the reservoir would need to be maintained at a minimum of 320,000 trout, ideally with a species composition more skewed toward tiger trout over cutthroat trout (Table 3.1). Note that while this abundance and composition of trout appears to have reversed the increasing population trend of chub, the current estimates of Utah chub
USU Budy. Project Completion Report. Scofield Reservoir 81
are extremely high and appear to have increased (nearly doubled) from 2011 to 2013, based on hydroacoustic estimates (see Appendix 1). As such, in order to further suppress the chub population, the numbers of trout in the reservoir should be substantially increased. Because the survival of cutthroat trout appears to be considerably higher (Table 3.1) than that of tiger trout, more tiger trout will be needed. We suggest this ratio should be maintained at 75% tiger and 25% cutthroat. As of 2012, we estimate that the proportion of tiger trout has declined to 47% (Table 3.1).
We estimated the population trend for Utah chub in Scofield Reservoir using 8 years of CPUE estimates obtained from Utah Division of Wildlife Resources, 2005 – 2012, using linear regression of log-transformed annual changes in population growth rate as a function of time step (Morris and Doak 2002). We express trend as lambda (λ), the annual population growth rate with 95% confidence intervals (CI). We calculated λ for the time period 2005 – 2012, before biological control appeared to be effective, and the time period 2009 – 2012, when it appears that biological control became effective. A λ > 1 indicates a positive population trend, a λ = 1 indicates no change in population growth rate, and a λ < 1 indicates the population is declining; however, given the short, time series available, and when 95% confidence intervals overlap 1.0, we cannot completely rule out either a population increase or decrease.
Based on this limited time series analysis, before biological control became effective in about 2009, the chub population was experiencing an extremely high annual increase, more than 500% increase in chub abundance each year (λ = 6.5; 95% CI = 1.6 – 26.3). After biological control appeared to become effective in 2009, the annual population growth rate declined to 1.52 (95% CI = 0.06 – 35.92) indicating the population is still increasing; however, because confidence intervals overlap 0 and we have only three data points, we cannot say for certain whether the population is now increasing or decreasing. Nonetheless, the population trajectory did change graphically from an exponential increase prior to 2009, to a much flatter linear relationship after 2009.
Utah chub > 250 mm are generally not susceptible to predation, and in Scofield Reservoir, these are the fish that remain of concern for biological control. Therefore, we used: 1) the age-specific estimated abundance of Utah chub as of 2013, 2) the cohort-specific annual survival rate, and 3) a maximum age of 10 (Johnson and Belk 1999) to project forward. We used this approach to estimate the future year when those unsusceptible large adults reach an abundance no longer of management concern, in terms of the effectiveness of biological control. Under those scenarios, we estimate that by 2021 there will be very few adult chub remaining from the 2013 cohort (Figure 3.5). By 2019, there will be very few adult chub > 250 mm, those that had escaped gape limitation prior to reaching effective numbers of stocked trout as described above. We anticipate that these are both conservative estimates (the date for meeting effective control targets is likely earlier), as the stocked predators are getting larger and likely more effective over time. Nonetheless, we note these projections, uncertain as they are, are based on one point in time, 2013, for reasons associated with analytical and data restrictions.
USU Budy. Project Completion Report. Scofield Reservoir 82
Table 3.1. Abundance of tiger trout and cutthroat trout in Scofield Reservoir based on number stocked and three cumulative, annual survival- rate scenarios since initiation of stocking in 2005 (tiger trout stocked each October) and 2009 (cutthroat trout stocked each May). Acoustic-based abundance estimates, conducted on 31 August 2011 and 6 June 2013, are provided for reference. To reach that 2011 acoustic abundance estimate, we determined the “best” survival-rate scenario to be 52% for tiger trout and 87% for cutthroat trout. In 2009, Utah chub abundance began to decline, in that year we estimated there to be nearly 320,000 trout (77% tiger and 23% cutthroat) in the reservoir.
USU Budy, Project Completion Report, Scofield Reservoir 83
Future
We have made some attempts to build a more elaborate population viability model for Utah chub; however, the data are too limited and getting quite “circular”. We are estimating survival from abundance estimates for one year, and then would be applying those same survival estimates to make predictions into the future. This model could be developed with the caveat that the only utility would be to further explore different configurations of species and sizes of spawners to stock in a given year. Even then, it would be somewhat speculative. Annual hydroacoustic estimates of chub abundance are critical for effective monitoring and management of this uncertain system.
References
Glenn, C.L., A.O. Bush, and R.C. Rounds. 1989. Survival and growth of rainbow trout and brown trout in farm dugouts and winterkill lakes. The Progressive Fish-Culturist 51: 121-126.
Hegge, O., B.K. Dervo, and J. Skurdal. 1991. Age and size at sexual maturity of heavily exploited arctic char and brown trout in Lake Atnsju, Southeastern Norway. Transactions of the American Fisheries Society 120: 141-149.
Johnson, J.B., and M.C. Belk. 1999. Effects of predation on life-history evolution in Utah chub (Gila atraria). Copeia 4: 948-957.
Morris, W.F., and D.F. Doak. 2002. Quantitative conservation biology: theory and practice of population viability analysis. Sinauer Associates, Inc. Sunderland, Massachusetts.
Quinn, J.W., and T.J Kwak. 2011. Movement and survival of brown trout and rainbow trout in an Ozark tailwater river. North American Journal of Fisheries Management 31: 299-304
Rozencrans, G, R.P. Marshall, R.D. Harding, and D.R. Bernard. 1999. Estimating natural mortality and abundance of potamodromous lake dwelling cutthroat trout at Florence Lake, Alaska, Alaska Department of Fish and Game, Fishery Manuscript Number 99-1, Anchorage, Alaska.
USU Budy, Project Completion Report, Scofield Reservoir 84
Figure 3.1. Temperatures (maximum, mean, and minimum) measured at three depths (3, 6, and 9 m from surface) in the “no wake” zone in the dam arm of Scofield Reservoir, April 2012 to June 2013. Cutthroat trout CTO (optimum temperature for consumption) is 14 °C, tiger trout CTO (assumed similar to brown trout) is 17.5 °C, and rainbow trout CTO is 20 °C.
Epilimnion
0
5
10
15
20
25
maximumaverageminimum
Thermocline
Tem
pera
ture
(o C)
0
5
10
15
20
25
Rainbow CTOTiger CTOCutthroat CTO
Hypolimnion
Date (2012 - 2013)Apr Jun Aug Oct Dec Feb Apr Jun 0
5
10
15
20
25
USU Budy. Project Completion Report. Scofield Reservoir 85
Figure 3.2. Exponential rise of Utah chub catch-per-unit-effort (CPUE) in annual spring-time gill-net sets by Utah Division of Wildlife Resources in Scofield Reservoir, Utah, 2005 to 2009. Equation for exponential growth fit is given along with R2 value.
f = e0.5331x
R2=0.85, p < 0.0001
Year2005 2006 2007 2008 2009
Uta
h ch
ub C
PUE
0
2
4
6
8
10
12
14
16
USU Budy. Project Completion Report. Scofield Reservoir 86
Figure 3.3. Future projections of abundance for seven Utah chub age cohorts starting from 2013 based on abundance by chub cohort from June 2013 hydroacoustic estimates.
Projections by age class
Date2014 2015 2016 2017 2018 2019 2020 2021
Uta
h ch
ub a
bund
ance
(X 1
000)
0
100
200
300
400
500
600
age-2 age-3 age-4 age-5 age-6 age-7
USU Budy. Project Completion Report. Scofield Reservoir 87
gary.thiede
Line
gary.thiede
Line
gary.thiede
Line
gary.thiede
Line
gary.thiede
Line
gary.thiede
Line
gary.thiede
Line
gary.thiede
Line
gary.thiede
Line
gary.thiede
Line
gary.thiede
Line
gary.thiede
Line
gary.thiede
Line
gary.thiede
Line
Figure 3.4. Growth of cutthroat trout (left panel) and rainbow trout (right panel) that were batch marked in the hatchery (2009 – 2012) with adipose clips or fluorescent dyes and subsequently recaptured in Scofield Reservoir, 2011 – 2012. Numbers of recaptures were very low for rainbow trout (0 – 27 recaptures per year; see Chapter 1, Table 1.9) and higher for cutthroat trout (41 – 197 recaptures per year; see Chapter 1, Table 1.10).
Cutthroat trout
Apr 2009
Sep 2009
Feb 2010
Jul 2010
Dec 2010
May 2011
Oct 2011
Mar 2012
Aug 2012
Jan 2013
Jun 2013
Ave
rage
tota
l len
gth
(mm
) by
mar
k ty
pe
180
200
220
240
260
280
300
320
340
360
380
400
420
440
460
480
500
Rainbow trout
Date
Apr 2009
Sep 2009
Feb 2010
Jul 2010
Dec 2010
May 2011
Oct 2011
Mar 2012
Aug 2012
Jan 2013
Jun 2013
2009 ad clip2010 red2011 green2012 orange
USU Budy. Project Completion Report. Scofield Reservoir 88
APPENDIX 1
Hydroacoustic assessment of fish density, abundance, and biomass in Scofield Reservoir, Utah
Objective
On 31 August 2011 and 6 June 2013, we conducted hydroacoustic surveys on Scofield Reservoir, Utah.
Coupled with gill netting near the time of acoustic surveys to verify acoustic targets, we determined
density, abundance, and biomass for Utah chub Gila atraria and three species of trout. Study lakes
At full pool, Scofield Reservoir has a volume of 73,600 acre-feet or 90,784,263 m3 covering an area of
2,815 acres or 1,139 ha; however, water levels are controlled by a dam and vary widely (Figure A1.1).
Scofield Reservoir is managed as a “put-grow-and-take” fishery with rainbow trout Oncorhynchus mykiss
stocked annually. Historically, around 600,000 rainbow trout were stocked every year. However, the
fish stocking program has been adjusted nearly every year since 2005 in response to the re-appearance
of Utah chub in gill nets (Hart and Birdsey 2011). Tiger trout (Salmo trutta, female × Salvelinus
fontinalis, male) and Bear Lake-strain Bonneville cutthroat trout O. clarkii utah have been stocked in the
fishery as a potential biological control for the Utah chub as well as alternative sport fishes. Non-game
species in the current assemblage include the Utah chub, redside shiner Richardsonius balteatus and
mountain sucker Catostomus platyrhynchus.
Methods
We conducted hydroacoustic surveys to estimate fish density and abundance information for the
dominant fish species > 100 mm TL. We conducted surveys during the new moon event when fish are
most likely dispersed and to reduce the likelihood of fish associating with the lake bottom, where they
could not be detected by the acoustic transducer.
We conducted night-time, cross-reservoir transects on Scofield Reservoir covering a representative area
of the reservoir (Figure A1.2). In August 2011, twelve acoustic transect distances ranged from 436 –
2,279 m with mean depths ranging from 4.0 – 10.5 m). In June 2013, due to lower water levels, eleven
acoustic transect distances ranged from 417 – 2,250 m with mean depths ranging from 4.4 – 7.6 m.
USU Budy. Project Completion Report. Scofield Reservoir 89
We collected data using a Biosonics Model DE6000 scientific echosounder with 420 kHz dual-beam
transducer (6 X 15o) and towed the transducer on a fin at 1-m depth while recording data using
Biosonics Visual Acquisition processing software. We sampled at a rate of two pings per second
traveling at a boat speed of 1 – 2 m/s (4 – 5 kph). Pulse width of the signal was 0.4 ms. We processed
acoustic target and density data using Biosonics Visual Analyzer software.
We used single fish targets with dual-beam target strengths ranging from -48 to -32 decibels (dB),
representing fish 100 mm and larger (Dahm et al. 1985). We chose this minimum size due to the high
productivity of the reservoir. We selected only echoes that met the single-target shape criteria used by
the analysis software to calculate target strengths and densities. Transects were treated as replicates in
the analysis to produce mean fish per cubic meter with 1 standard error. We extrapolated density of fish
(fish/m3) into lake-wide abundance using lake volume (Figure A1.1).
To verify targets, we used gill-net catch information collected during the summer combined with gill
netting during the evening after acoustic surveys. Trawling was not possible in this shallow reservoir.
We summarized gill-net catch by species and size classes (100 – 150 mm, 151 – 250 mm, 251 – 350 mm,
and fish larger than 350 mm) and determined percentage of species by size class to delineate our
acoustic-derived abundance estimates by species by size class.
Results and Discussion
Since 2008 in Scofield Reservoir, Utah chub have represented over 95% of the gill net catch (Figure
A1.3). In 2011 and 2013, the gill-net catch was at least 96% Utah chub. From our gill netting surveys in
July 2011 and near the night of sampling, we apportioned acoustic targets according to average gill-net
catch as 66% Utah chub, 18% tiger trout, 14% cutthroat trout, and 3% rainbow trout. From UDWR gill-
net survey data in May 2013, we apportioned acoustic targets according to average gill-net catch as 69%
chub, 11% tiger trout, 20% cutthroat trout, and 2% rainbow trout. Although we did not catch redside
shiner and mountain sucker in our gill-netting efforts, those species, particularly redside shiners have
been captured in UDWR gill netting from 1997 – 2013, although catch rates in 2010 reached an all-time
low (Hart and Birdsey 2011). Our surveys and therefore density estimates did not include (1) near shore
zones, (2) depths less than 4 m, and (3) the southern portion of the lake, due to high densities of
macrophytes.
Across the 12 transects in August 2011, fish densities (all species combined) ranged from 0.006 to 0.065
fish/m3 (mean ± 1 standard error = 0.04 ± 0.02 fish/m3) or an overall abundance of 3,158,000 fish (± 1
SE = 1,553,000). Percentage of acoustic targets by length class was 33% in the 100 – 150 mm class, 41%
USU Budy. Project Completion Report. Scofield Reservoir 90
in the 151 – 250 mm class, 14% in the 251 – 350 mm class and 12% in the > 350 mm class. Across the 11
transects in June 2013, fish densities (all species combined) ranged from 0.04 to 0.37 fish/m3 (mean ± 1
standard error = 0.14 ± 0.04 fish/m3) or an overall abundance of 6,030,000 fish (± 1 SE = 1,834,000).
Percentage of acoustic targets by length class was 39% in the 100 – 150 mm class, 38% in the 151 – 250
mm class, 15% in the 251 – 350 mm class and 8% in the > 350 mm class.
In August 2011, considering only targets greater than -48 dB or fish greater than 100 mm, Utah chub
dominated (84% of acoustic targets overall) the fish community at densities of 2,327 fish/ha (Table
A1.1). The three salmonid sport fish (> 251 mm) combined to reach densities of 445 fish/ha. In June
2013, considering only targets greater than -48 dB or fish greater than 100 mm, Utah chub dominated
(88% of acoustic targets overall) the fish community at densities of 4,664 fish/ha (Table A1.2). The three
salmonid sport fish (> 251 mm) combined to reach densities of 630 fish/ha.
Although partitioning acoustic targets for species that may not be segregated in space and time (i.e., are
mixed homogenously in the lake) may provoke concern, we partitioned acoustic targets simply in terms
of proportion of gill-net catch. This simplified approach would affect fish particularly in the 251 – 350
mm size class. In August 2011, we apportioned these targets as 71% chub, 11% tiger trout, 9% cutthroat
trout, and 9% rainbow trout, representing 442,000 fish. In June 2013, we apportioned these targets as
we did not designate any acoustic targets as shiners or suckers due to the primarily “pelagic” nature of
our acoustic surveys; however, it is likely our estimates include a small proportion of both fishes.
Minimally, due to our confidence that acoustic targets between -48 to 40 db (100 – 250 mm) are very
unlikely to be stocked trout, we designated 100% of acoustic targets in that range as Utah chub,
representing a lake-wide abundance of at least 2.3 million Utah chub on 31 August 2011 and 4.6 million
chub on 6 June 2013 (Figure A1.4). Further, acoustic targets greater than -36 db (350 mm) were
expected to be 100% trout as these sizes are unlikely to be Utah chub; therefore, there were at least
379,000 large trout in Scofield Reservoir on 31 August 2011 and at least 482,000 large trout on 6 June
2013 (Figure A1.4).
USU Budy. Project Completion Report. Scofield Reservoir 91
Table A1.1. Acoustic-based abundance estimates for four fish species by size class in Scofield Reservoir, Utah, August 2011. Density estimates (fish/ha) are also shown for each species, all sizes combined.
TOTAL 1,042,215 1,294,874 442,153 378,987 3,158,229 2,772
Table A1.2. Acoustic-based abundance estimates for four fish species by size class in Scofield Reservoir, Utah, 6 June 2013. Density estimates (fish/ha) are also shown for each species, all sizes combined.
TOTAL 2,351,669 2,291,370 904,488 482,394 6,029,920 5,294
USU Budy. Project Completion Report. Scofield Reservoir 92
Table A1.3. Lake-wide biomass estimates based on expanded acoustic-abundance estimates for four species of fish (> 100 mm TL) in Scofield Reservoir, August 2011 and June 2013. Total biomass is simply based on an expansion of total fish of each species multiplied by the average weight of an individual fish of that species captured in gill nets in the reservoir.
Species Mass (g) of an
average individual August 2011 total
biomass (kg) June 2013 total
biomass (kg)
Utah chub 141 373,793 749,043
Tiger trout 885 210,745 255,617
Cutthroat trout 609 130,404 255,219
Rainbow trout 420 23,080 4,052
TOTAL 738,022 1,263,931
Summary of findings from other systems 1) In Flaming Gorge Reservoir, Utah, Utah chub dominated gill-net catch (86%) in water warmer (>
17oC); chub density in 0 – 13 m depths was 0.347 chub/1000 m3 or an abundance of 431,000 chub, in the 13 – 30 m depth strata, chub density was 0.186 chub/1000 m3 or an estimated abundance of 89,000 chub, and the total abundance was estimated to be 520,000 chub (biomass = 83,000 kg) in August 1990 (Yule 1992). Also, kokanee salmon (Oncorhynchus nerka) dominated gill-net catch (76%) in 13- 30 m depth strata, and acoustic kokanee densities were 0.347 kokanee/1000 m3 or an abundance of 27,400 kokanee in the 0 – 13 m strata and 0.386 kokanee/1000 m3 or an abundance of 365,000 kokanee in the 13 – 30 m strata, with a total kokanee abundance estimate of 402,000 (209,000 kg) in August 1990 (Yule 1992). Further, Yule (1992) estimated that lake trout consumed 79,000 kg of Utah chub and 196,000 kg of kokanee.
2) Tuescher (2001) estimated abundance of Utah chub in two Idaho reservoirs. In Pallisades Reservoir,
Utah chubs represented 37% of gill-net catch; and using hydroacoustics, fish abundance was estimated to be 274,000 fish (72.3 fish/ha including cutthroat trout, brown trout Salmo trutta, Utah chub, and sucker Catastomus spp.) or 101,380 chub. In Ririe Reservoir, chubs were 55% of the gill-net catch, and acoustic fish abundance was estimated to be 256,000 fish (468.4 fish/ha including Utah chub, kokanee salmon [36% of catch], and cutthroat trout, rainbow trout, sucker, and yellow perch Perca flavescens) or 140,800 chub.
3) In Diamond Lake (surface area approximately 1210 ha), Oregon, based on trout to chub ratios in trap
net catches, researchers estimated tui chub (Gila bicolor) abundance to be between 7.6 million (174
USU Budy. Project Completion Report. Scofield Reservoir 93
tonnes) and 23.4 million (540 tonnes) chub (Jackson et al. 2003), and researcher reported a hydroacoustic estimate of greater than 10 million chub (cited in Jackson et al. 2003). This compares with a post-rotenone treatment estimate of 250 tonnes in the lake (Eilers et al. 2011). Further, this compares the estimate to the estimate of a total mass of 363 tonnes of chub removed in the 1954 rotenone treatment of Diamond Lake (cited in Eilers et al. 2011).
Table A1.4. Comparison of acoustic-derived chub densities in western water bodies.
Lake Surface
area (ha) Species
Mean density
(chub/ha) Source
Scofield Reservoir, Utah (August 2011) 1,139 Utah chub 2,327 This study
Scofield Reservoir, Utah (June 2013) 1,139 Utah chub 4,664 This study
Diamond Lake, Oregon 1,226 Tui chub 6,500 Eilers et al. 2011
Pyramid Lake, Nevada 45,325 Tui chub 958 Unpublished data
References BOR (Bureau of Reclamation). 2013. Upper Colorado Region Reservoir Operations, Scofield Reservoir.
Website: http://www.usbr.gov/uc/crsp/GetDateInfo?d0=1729&d1=1800&d2=1880&d3=1936&id Count=4&l=SCOFIELD+RESERVOIR. Visited 14 August 2013.
Dahm, E., J. Hartmann, T. Lindem, and H. Loffler. 1985. ELFAC experiments on pelagic fish stock
assessment by acoustic methods in Lake Constance. European Inland Fisheries Advisory Commission Occasional Paper number 15. FAO, Rome, Italy. 14 pages.
USU Budy. Project Completion Report. Scofield Reservoir 94
Eilers, J.M., H.A. Truemper, L.S. Jackson, B.J. Eilers, and D.W. Loomis. 2011. Eradication of an invasive cyprinid (Gila bicolor) to achieve water quality goals in Diamond Lake, Oregon (USA). Lake and Reservoir Management 27: 194-204.
Hart, J.M., and P. Birdsey. 2011. Spring and fall gill-net survey of fish populations at Scofield Reservoir in
2010 compared with previous years. U. S. Fish and Wildlife Service, Sport Fish Restoration Program, Project F-44-R. 24 pages. Salt Lake City, Utah.
Jackson, L.S., D.H. Jackson, and D.W. Loomis. 2003. Analysis of tui chub data collected at Diamond Lake
by the Oregon Department of Fish and Wildlife, 1992 – 2003. Oregon Department of Fish and Wildlife. 30 pages.
Tuescher, D. 2001. Job Performance Report. Project 5 – Lake and Reservoir Research. Grant F-73-R-23.
IDFG Report Number 01 – 40. Idaho Department of Fish and Game, Boise Idaho. 105 pages. Yule, D. 1992. Investigations of forage fish and lake trout Salvelinus namaycush interactions in Flaming
Gorge Reservoir, Wyoming – Utah. MS thesis, Utah State University, Logan, Utah. 120 pages.
USU Budy. Project Completion Report. Scofield Reservoir 95
Figure A1.1. Volume of Scofield Reservoir from July 2010 to July 2013 according to Bureau of Reclamation gauge (BOR 2013). Circles on line indicate dates when we conducted hydroacoustic surveys.
DateJul 2010
Nov 2010 Mar 2011
Jul 2011 Nov 2011
Mar 2012 Jul 2012
Nov 2012 Mar 2013
Jul 2013
Volu
me
(X m
illio
n m
3 )
0
10
20
30
40
50
60
70
80
90
USU Budy. Project Completion Report. Scofield Reservoir 96
Figure A1.2. Map of Scofield Reservoir, Utah, displaying the 11 to 12 hydroacoustic transects (thick, dashed lines) surveyed during August 2011 and June 2013. The southern part of the reservoir was too shallow to survey, and was full of macrophytes. The bay of the dam site is partially cut off. The Price River flows east below the dam.
Dam
USU Budy. 2011 Interim Progress Report, Scofield Reservoir 97
Figure A1.3. A relative index of catch based on proportion of catch by year (2004 – 2012) and season (for 2010 to 2012) for three species of trout and Utah chub in Scofield Reservoir, Utah.
Rainbow troutP
ropo
rtion
of t
otal
cat
ch (b
ased
on
CP
UE
)
0.0
0.2
0.4
0.6
0.8
1.0
springsummerautumn
Cutthroat trout
0.0
0.2
0.4
0.6
0.8
1.0
Tiger trout
0.0
0.2
0.4
0.6
0.8
1.0
Utah chub
Year2004 2005 2006 2007 2008 2009 2010 2011 2012
0.0
0.2
0.4
0.6
0.8
1.0
USU Budy. 2011 Interim Progress Report, Scofield Reservoir 98
Figure A1.4. Abundance estimates by size class of Utah chub and three trout species derived from hydroacoustic surveys in Scofield Reservoir on 6 June 2013 (spring, top panel) and 31 August 2011 (summer, bottom panel).
USU Budy. Project Completion Report. Scofield Reservoir 99
APPENDIX 2 Agonistic behavior between rainbow trout, cutthroat trout, and tiger trout in a
novel Utah reservoir community INTRODUCTION Agonistic behavior in fishes is a means to obtain resources, defend resources, and establish dominance over other individuals in a community, thus increasing the fitness of aggressive individuals or species (Grant 1990; Stamps 2007; Vollestad et al. 2003). Many laboratory experiments have associated increased growth rates and feeding opportunities with aggressive behavior in multiple salmonid species (Abbott and Dill 1989; Hojesjo et al. 2002; Li and Brocksen 1977). Grant (1990) documented similar results in the field and provided evidence that aggressive individuals are able to obtain better territories and have more feeding opportunities than subordinate and non-aggressive individuals. Furthermore, when species occur sympatrically, differences in exhibition of agonistic behavior may allow one species to gain dominance and growth advantage over another (Gunckel et al. 2002), or limit access of less aggressive species to the best feeding habitat (Grant 1990). An individual’s size is also important in determining its level of aggression, with larger individuals generally being more aggressive (Newman 1956; Abbot et al. 1985; Berejikian 1995). In addition, the presence of food has been shown to increase agonistic behavior between individuals (Newman 1956; and Symonds 1968), as well as the density of prey (Slaney and Northcote 1974). Differences in agonistic behavior between species have important implications for fishery management (Newman 1956). While aggressiveness may benefit and individual’s performance in the hatchery, agonistic behavior may be detrimental in natural environments. Species that select for aggressive behavior and high growth rates in hatcheries often experience lower survival in nature because of greater energy expenditure (Nilsson and Northcote 1981; Mesa 1991) and higher predation rates (Berejikian 1995; Biro 2004). However, in communities comprising multiple salmonid species, one species may gain growth or competitive advantage over another by establishing dominance through increased aggression (Newman 1956; Gunckel et al 2002), supporting the role of agonistic interactions between salmonid species in fitness and species survival (Li 1977; Grant 1990; Deverill et al. 1999). In Utah, novel communities of predatory salmonids have been created by managers to simultaneously hedge the potentially uncontrollable expansion of nongame fish in certain reservoirs and provide angling opportunities. For example, exponential growth of the Utah chub (Gila atraria) population in Scofield Reservoir prompted managers to shift the stocking program from exclusively rainbow trout (Oncorhynchus mykiss) to include tiger trout (Salmo trutta, female X Salvelinus fontinalis, male) and Bear Lake-strain Bonneville cutthroat trout (O. clarkii utah) after 2005, as potential biological controls. Winters (2014) demonstrated substantial niche overlap between rainbow trout and Utah chub at lower
USU Budy. Project Completion Report. Scofield Reservoir 100
tropic levels, and tiger trout and cutthroat trout at top trophic positions, indicating possible direct competition for food and space and raising concern that the effect of niche overlap may be an overall decrease in trout condition. However, little is known about inter-specific interactions among this unusual complex of predatory species. We determined the extent of agonistic behavior between tiger trout, cutthroat trout, and rainbow trout, and explored the possible drivers of such behavior, as part of a larger study focusing on the feeding ecology and the potential for biological control of this novel species assemblage (Winters 2014) Understanding agonistic behavior between top predators in this assemblage will aid in decisions of which fish to stock and in management of other novel communities, where direct competition from one species could reduce the survival or fitness of another.
METHODS We obtained tiger trout (n = 15), cutthroat trout (n = 17), and rainbow trout (n = 18) from Fountain Green State Fish Hatchery. Upon arrival at our research center, we weighed (nearest 0.1 g) and measured (TL, nearest mm) each fish, and marked fish with a plastic anchor tag. Tags were uniquely colored for each species and uniquely numbered for each individual. Tiger trout averaged 246.7 mm (1 S.E. = 4.0 mm), and 135.7 g (S.E. = 5.5 g), cutthroat trout 248.2 mm (1 S.E. = 3.1 mm), and 145.3 g (1 S.E. = 3.1 g), and rainbow trout 243.1 mm (S.E. = 6.8 mm), and 169.7 g (1 S.E. = 14.4 g). We separated fish into three separate holding tanks by species. Once daily, automatic feeders dispensed commercial trout feed to the fish. We fed fish approximately 2% of their body weight daily. Prior to behavior experiments fish we did not feed for at least 24 hours. To examine behavior between species we randomly selected one tiger trout, cutthroat trout, and rainbow trout to interact in an observation tank 122-cm diameter filled to 35-cm depth with fresh well water. We video recorded all behavior trials in high definition (1080 pixel) to minimize effects of human presence on fish behavior (Wagner et al. 2006). We placed the video camera above the tank and began recording after all fish were in the tank; each trial was recorded for one hour. The first 40 minutes of each trial was allotted as an acclimation period, and behavior was not analyzed (Newman 1956; Wagner et al. 2006). We designated a 40 minute acclimation period because we wanted to observe the subject fish before one achieved dominance over the others; once dominance is established agonistic behavior declines (Wagner et al. 2006). During the remaining 20 minutes we recorded ‘chases’ and ‘bites/contacts’ initiated by each species and the recipient species of the aggressive behavior. A ‘chase’ was defined as one fish advancing within one body length of another and provoking a response, and a ‘bite/contact’ was defined as any contact between two fish. Ten minutes (halfway) into the 20 minute observation period an automatic feeder dispensed approximately 4 g of commercial trout feed into the observation tank. We separated aggressive initiations by each species into pre, and post feeding categories. The same observer recorded all behavioral interactions to eliminate observer bias.
USU Budy. Project Completion Report. Scofield Reservoir 101
We conducted trials with all three species present in the observation tank, and pairwise trials with combinations of two species in the observation tank (Table A2.1). To assess the effects of density and as well as inter- and intraspecific interactions, we altered the number of fish present in the observation tank between two (density = 4.9 fish/m3), three (7.3 fish/m3), and four (9.8 fish/m3). To reach an adequate sample size we used fish in multiple trials; after a fish participated in a trial it was given at least 24 hours of rest before participation in another trial. Data Analysis We tested for statistical differences among species-specific aggression and also evaluated the drivers influencing agonistic behavior using the MASS package (Venables and Ripley 2002) for the negative binomial distribution in program R (R Development Core Team 2008; Table A2.2). We analyzed differences in encounter type (e.g., chase or bite/contact) and encounters before and after feeding with a t-test. During model construction we considered species, length, weight, and density as factors contributing to aggressive behavior. To capture in-trial length differences, we used the metric of relative length, calculated as length of a given fish divided by the length of the longest fish in the trial (Saunders and Fausch 2012). Therefore, the largest fish in each trial has a relative length of one, and the other fish a proportionally smaller value. We conducted trials with all three species present in the observation tank, and pairwise trials with combinations of two species in the observation tank (Table A2.2). To assess the effects of density and as well as inter and intraspecific competition we altered the number of fish present in the observation tank between two, three, and four. To reach an adequate sample size we used fish in multiple trials. After a fish participated in a trial it was given at least 24 hours of rest before participation in another trial. Table A2.1. Sampling design for each combination of species and density tested during experimental trials. Number of replications (n) for each combination is given. TRT = tiger trout, CTT = cutthroat trout, and RWT = rainbow trout.
Participating species Number of
each species Total fish
in tank Relative density n
TRT, CTT, RWT 1 3 Medium 30
TRT, CTT 2 4 High 6
TRT, CTT 1 2 Low 6
TRT, RWT 2 4 High 6
TRT, RWT 1 2 Low 6
RWT, CTT 2 4 High 6
RWT, CTT 1 2 Low 6
USU Budy. Project Completion Report. Scofield Reservoir 102
We created models to determine the drivers influencing agonistic behavior using the MASS package for the negative binomial distribution in R (Table A2.2). We analyzed differences in encounter type (chase or bite/contact) and encounters before and after feeding with a t-test. We considered species, length, weight, and density as factors contributing to aggressive behavior in the models. To capture in-trial length differences we used the metric of relative length (Saunders and Fausch 2012). The relative length for a given fish is its length divided by the length of the longest fish in the trial (Saunders and Fausch 2012). Therefore, the largest fish in each trial has a relative length of one, and the other fish a proportionally smaller value.
Table A2.2. Top ranking models describing aggressive initiations. The number of parameters (K) in each model is given.
Model K Log
Likelihood ∆AICc Model weight
Species * Relative Length + Density 4 -814.5 0 0.46
Species * Density + Relative Length 4 -817.7 7.16 0.01
Species + Density + Relative Length 4 -825.9 7.38 0.01
RESULTS Our top model included species, relative length, and density to be the most important drivers of interspecific agonistic behavior between tiger trout, cutthroat trout, and rainbow trout (Table A2.2). Aggressive behavior differed significantly by species (Figure 2.1). Rainbow trout instigated significantly more aggressive bouts than tiger trout or cutthroat trout (p < 0.01). On average rainbow trout initiated 10.2 times more aggressive interactions than tiger trout and 24.8 times more cutthroat trout per trial. Initiations by tiger trout and cutthroat trout did not differ significantly. Rainbow trout did not attack either cutthroat trout or tiger trout more frequently than the other (p = 0.65). Chases were the primary expression of aggressive behavior (p < 0.000). Chases and bites/contacts per trial followed the same general trend for each species, with rainbow trout being most aggressive in each instance (Figure A2.1). No difference was observed between pre and post feeding aggression overall (t = 0.3688, p = 0.71), or in any species combination (Figure A2.2). However, we observed that when trout feed was introduced into the observation tank, only rainbow trout commenced feeding. Tiger trout and cutthroat trout appeared to be uninfluenced by the introduction of food. The same observation was made outside of observed
USU Budy. Project Completion Report. Scofield Reservoir 103
trials where rainbow trout fed voraciously while tiger trout and cutthroat trout seemed to take some time to acclimate to the commercial feed. Although no significant differences in aggressive initiations were observed across the three tested densities (p = 0.31), density was determined to be a significant covariate in four of the five top models (Table A2.2). Across all species mean initiations per trial at high, medium, and low density were 9.21, 7.84, and 4.24, respectively. Also, there was a trend (though not significant) indicating increased agonistic behavior at higher fish densities. In general, for each species more aggressive initiations were observed at higher densities than at lower densities (Figure A2.3). In our top model overall, greater relative length was positively associated with agonistic behavior (p = 0.02). Overall the larger fish in a given trial initiated more aggression than smaller fish. Relationships between aggressive initiations and relative length were not significant (p = 0.89) for any species. However, tiger trout and cutthroat trout demonstrated a trend toward increased aggression at higher relative lengths, while rainbow trout tended to be equally aggressive regardless of relative length. Aggressive behavior differed significantly by species (Figure A2.1). Rainbow trout instigated significantly more aggressive bouts than tiger trout or cutthroat trout (p < 0.01). Initiations by tiger trout and cutthroat trout did not differ significantly from each other. Rainbow trout did not attack either cutthroat trout or tiger trout more frequently than the other (p = 0.65). Chases were the primary expression of aggressive behavior (p < 0.000). Chases and bites/contacts per trial followed the same general trend for each species, with rainbow trout being most aggressive in each instance (Figure A2.1).
No difference was observed between pre and post feeding aggression overall (t = 0.3688, p = 0.71), or in any species (Figure A2.2). However, we observed that when trout feed was introduced into the observation tank, only rainbow trout commenced feeding. Tiger trout and cutthroat trout appeared uninfluenced by the introduction of food. The same observation was made outside of observed trials where rainbow trout fed voraciously while tiger trout and cutthroat trout seemed to take some time to acclimate to the commercial feed. Although no significant differences in aggressive initiations were observed across the three tested densities (p = 0.31), density was determined to be a significant covariate in four of the five top models (Table A2.2). Also, there is a trend (though not significant) indicating increased agonistic behavior at higher fish densities. In general, for each species more aggressive initiations were observed at higher densities than at lower densities (Figure A2.3). Increased relative length positively affected agonistic behavior (p = 0.02). Overall the larger fish in a given trial initiated more aggression than smaller fish. While relationships between aggressive initiations and relative length any species were not significant (p = 0.89) tiger trout and cutthroat trout showed increased aggression at higher relative lengths, while rainbow trout appeared equally aggressive regardless of relative length.
USU Budy. Project Completion Report. Scofield Reservoir 104
Figure A2.1. Number of aggressive initiations by type for three trout species used in the experimental trials. Error bars are one standard error from the mean. TRT = tiger trout, CTT = cutthroat trout, and RWT = rainbow trout.
Figure A2.2. Number of aggressive initiations before (pre-) and after (post-) feeding for each species during the experimental trials. Error bars indicate one standard error from the mean. TRT = tiger trout, CTT = cutthroat trout, and RWT = rainbow trout.
USU Budy. Project Completion Report. Scofield Reservoir 105
Figure A2.3. Number of aggressive initiations at each tested density (high, medium, low) by three trout species in experimental trials. Error bars indicate one standard error from the mean.
DISCUSSION Our study clearly demonstrates that in an experimental setting rainbow trout are more aggressive than cutthroat and tiger trout. Our results are further supported by others who documented a competitive advantage of rainbow trout over cutthroat trout (Nilsson and Northcote 1981; Kreuger and May 1991). However, the low aggression of tiger trout was unexpected. Newman (1956) observed high aggression in brook trout; and brown trout are widely recognized as competitively superior to many species (Townsend 1996), particularly cutthroat trout (McHugh and Budy 2005), but agonistic behavior by tiger trout, which are claimed to be more aggressive than their parent species (McCale 1974; Sheerer et al. 1987), did not differ from cutthroat trout which displayed the least aggression. This pattern (or observation) may be explained by differences in hatchery strategies of each species based on food availability and growth rate. For example, higher aggression was observed in hatchery raised brown trout than wild trout of the same species (Deverill et al. 1999). Yet, Vollestad et al. (2003) surmise that while aggressive individuals have better competitive ability hatcheries often select for decreased aggression, because food is not limiting and cannot be monopolized. Perhaps, in this instance, rainbow trout exhibited a higher intrinsic growth rate than cutthroat trout or tiger trout, such that they have a higher metabolic requirement, thus stimulating more aggressive behavior, relative to the other species. We also identified relative length and density as important factors contributing to agonistic behavior. We considered both total length and relative length in our analysis; however, only relative length was a
USU Budy. Project Completion Report. Scofield Reservoir 106
significant covariate in our models (Table A2.2). This pattern suggests a fish becomes more aggressive as it becomes larger than those around it, not just as it gets bigger, a premise supported by multiple other studies(Symons 1968; Abbott et al. 1985; Vollestad et al. 2003). As more fish were added to the observation tank agonistic behavior increased. Newman (1956) tested density by maintaining the same number of individuals in an observation but decreasing the size of the observation tank, and recorded similar results. In contrast to other studies however, in our study, the introduction of food did not prompt changes in agonistic behavior (Newman 1956; Symonds 1968). Although rainbow trout fed more vigorously than cutthroat trout and tiger trout (both species rarely fed during observations) when food was introduced into the observation tank, the degree of aggression expressed during and after feeding did not increase. Similar behavior was noted outside of behavioral observations; rainbow trout fed voraciously when commercial trout feed was added to their tank, but cutthroat trout and tiger trout did not begin feeding immediately and frequently failed to completely consume their rations. Although our results are clear and consistent, perhaps the largest limitation of our study is small sample size. We effectively recorded differences in aggression between our three study species and identified relative length and density as contributors to agonistic behavior, but were unable to statistically separate species-specific differences and trends with relation to density and relative length. Hatchery conditions may play more to the strengths of rainbow trout than cutthroat trout or tiger trout, which did not readily recognize commercial trout feed as an exceptional food source. Introduction of a more natural food source, readily recognized by cutthroat trout and tiger trout could have important influences on their feeding behavior and interactions with other species. Also, it is likely aggression rates observed in the laboratory are higher than those found in nature, as subordinate fish may not be able to escape aggressive displays while enclosed in a tank (Chiszar and Drake 1975). Finally, a study examining these three species in natural environments would yield different results. Trout used in our experiments were slightly smaller overall than the average-sized trout found in reservoirs. Despite limitations, we demonstrate the usefulness of controlled lab experiments to identify species interactions, as species combinations can be tightly manipulated and behavior can be closely observed. We also highlight some important management implications for novel reservoir fish communities. Although we determined rainbow trout to be the most aggressive species in this study, their survival is lowest relative to tiger trout and cutthroat trout when stocked sympatrically in a high elevation Utah reservoir (Winters 2014). Thus, it is possible that excessive energy expenditure during aggressive behavior could be inhibiting rainbow trout growth and survival in the reservoir (Nilsson and Northcote 1981; Deverill et al. 1999). The bold, aggressive behavior that allows high hatchery growth rates in hatchery rainbow trout may render them more susceptible to predators when introduced into reservoir communities (Berejikian 1995; Biro et al. 2004; Stamps 2007). Agonistic behavior is most important immediately following the stocking of fish into a reservoir. Aggression may be important in obtaining a defending a territory, but could greatly increase the risk of naïve fish to predation. With larger predaceous fish already established in a reservoir agonistic behavior could easily be more of a hindrance
USU Budy. Project Completion Report. Scofield Reservoir 107
than an advantage (Berejikian 1995; Deverill et al 1999; Biro et al. 2004). These are important considerations in designing and maintaining a stocking program.
LITERATURE CITED Abbott, J.C., and L.M. Dill. 1989. The Relative Growth of Dominant and Subordinate Juvenile Steelhead Trout
Abbott, J.C., R.L. Dunbrack, and C.D. Orr. 1985. The Interaction of Size and Experience in Dominance Relationships of Juvenile Steelhead Trout (Salmo gairdneri). Behavior 92: 241-253.
Berejikian, B.A. 1995. The effects of hatchery and wild ancestry and experience on the relative ability of steelhead trout fry (Oncorhynchus mykiss) to avoid a benthic predator. Canadian Journal of Fisheries and Aquatic Sciences 52: 2476-2482.
Biro, P.A., M.V. Abrams, J.R. Post, and E.A. Parkinson. 2004. Predators select against high growth rates and risk-taking behavior in domestic trout populations. Proceedings of the Royal Society of London 271:2233-2237.
Budy, P., L. Winters, and G.P. Thiede. 2012. Scofield Reservoir predator-prey interactions: investigating the roles of interspecific interactions and forage availability on the performance of three predatory fishes. 2011 Progress Report to the Utah Division of Wildlife Resources. UTCFWRU 2012(3):1-42.
Deverill, J.I., C.E. Adams, and C.W. Bean. 1999. Prior residence, aggression and territory acquisition in hatchery-reared and wild brown trout. Journal of fish Biology 55: 868-875.
Chiszar, D., and R.W. Drake. 1975. Aggressive Behavior in Rainbow Trout (Salmo gairdneri Richardson) of Two Ages. Behavioral Biology 13: 425-431.
Grant, J.W.A. 1990. Aggressiveness and the Foraging Behaviour of Young-of-the-Year brook charr (Salvelinus fontinalis). Canadian Journal of Fisheries and Aquatic Sciences 47: 915-920.
Gunckel, S.L., A.R. Hemmingsen, and J.L. Li. 2002. Effect of bull trout and brook trout interactions on foraging habitat, feeding behavior, and growth. Transactions of the American Fisheries Society 131: 1119-1130.
Hösejö, J., J.I Johnsson, and T. Bohlin. 2002. Can laboratory studies on dominance predict fitness of young brown trout in the wild? Behavioral Ecology and Sociobiology 52: 102-108.
Krueger, C.C., and B. May. 1991. Ecological and Genetic Effects of Salmonid Introductions in North America. Canadian Journal of Fisheries and Aquatic Sciences 48: 66-77.
Li, H. W., and R. W. Brocksen. 1977. Approaches to the analysis of energetic costs of interspecific competition for space by rainbow trout. Journal of Fish Biology 11: 329-341.
McClane, A.J. 1974. McClane’s New Standard Fishing Encyclopedia. Holt, Rinehart and Winston Inc., New York.
McHugh, P., and P. Budy. 2005. An experimental evaluation of competitive and thermal effects on brown trout (Salmo trutta) and Bonneville cutthroat trout (Oncorhynchus clarkii utah) performance along an altitudinal gradient. Canadian Journal of Fisheries and Aquatic Sciences 62:2784-2795.
Mesa, G. 1991. Variation in feeding, aggression, and position choice between hatchery and wild cutthroat trout in an artificial stream. Transactions of the American Fisheries Society 113: 737-743.
USU Budy. Project Completion Report. Scofield Reservoir 108
Newman, M.A. 1956. Social behavior and interspecific competition in two trout species. Physiological Zoology 29: 64-81.
Nilsson, N.-A., and T.G. Northcote. 1981. Rainbow trout (Salmo gairdneri) and cutthroat trout (S. clarki) Interactions in Coastal British Columbia Lakes. Canadian Journal of Fisheries and Aquatic Sciences 38: 1228-1246.
R Development Core Team. 2008. R: A language and environment for statistical computing. R Foundation for Statistical Computing, Vienna, Austria. ISBN 3-900051-07-0, URL http://www.R-project.org.
Saunders, W.C., and K.D. Fausch. 2012. Grazing management influences the subsidy of terrestrial prey to trout in Rocky Mountain streams (USA). Freshwater Biology 57: 1512-1529.
Scheerer, P.D., G.H. Thorgaard, and J.E. Seeb. 1987. Performance and development stability of triploid tiger trout (brown trout, female X brook trout, male). Transactions of the American Fisheries Society 116: 92-97.
Slaney, P.A., and T.G. Northcote. 1974. Effects of prey abundance on density and territorial behavior of young rainbow trout (Salmo gairdneri) in laboratory stream channels. Journal Fisheries Research Board of Canada 31: 1201-1209.
Stamps, J.A. 2007. Growth-mortality tradeoffs and ‘personality traits’ in animals. Ecology Letters 10: 355-363.
Symons, P.E.K. 1968. Increase in aggression and in strength of the social hierarchy among juvenile Atlantic salmon deprived of food. Journal Fisheries Research Board of Canada 25: 2387-2401.
Townsend. C.R. 1996. Invasion biology and ecological impacts of brown trout Salmo trutta in New Zeland. Biological Conservation 78: 13-22.
Venables, W.N., and B.D. Ripley. 2002. Modern Applied Statistics with S. Fourth Edition. Springer, New York. ISBN 0-387-95457-0.
Vøllestad, L.A. and T.P. Quinn. 2003. Trade-off between growth rate and aggression in juvenile Coho salmon, Oncorhynchus kisutch. Animal Behaviour. 66: 561-568.
Wagner, E.J., R.E. Arndt, M.D. Routledge, D. Latremouille, and R.F. Mellenthin. 2006. Comparison of hatchery performance, agonistic behavior, and post stocking survival between diploid and triploid rainbow trout of three different Utah strains. North American Journal of Aquaculture 68: 63-73.
USU Budy. Project Completion Report. Scofield Reservoir 109
APPENDIX 3
Evaluation of trout performance under various fish assemblages in experimental ponds
Introduction and Methods
To determine the performance of three trout species commonly stocked into Scofield Reservoir in a controlled environment, on 10 May 2012, we stocked six ponds at the Millville Aquatic Research Facility with various assemblages of trout, 50 total trout per pond. We obtained trout from the Fountain Green State Fish Hatchery, the same source of trout that are stocked into Scofield Reservoir. Rainbow trout stocked into ponds ranged from 179 – 256 mm TL, cutthroat trout ranged from 148 – 234 mm TL, and tiger trout ranged from 185 – 255 mm TL (Table A3.1). The ponds have a surface area of 500 m2, approximate volume of 1050 m3, and average depth of 2.2 m. We filled ponds in early spring with 10 oC well water, a macroinvertebrate community was developed, and we subsequently inoculated each pond with zooplankton. We deployed temperature loggers in all ponds at approximately 1-m deep. Over the summer, when necessary to maintain water depth, we added 10 oC well water to ponds to maintain water levels. To mimic the reservoir food web, in late May 2012, we stocked 600 Utah chub (Gila atraria) into ponds, 100 into each pond. We obtained the chub from Kesko Ranch, Ephraim, Utah (Certificate of Registration number 5001–57). New juvenile Utah chub were seen in the ponds during June. Midway through the experiment, 11 July 2012, fish were seined, measured, weighed, and returned to their respective ponds. At the end of the evaluation (22 – 24 July 2012), trout and chub were removed from ponds, measured, weighed, and euthanized. Stomach contents and fin clips were taken from a subsample of trout. All fish were euthanized and ponds were drained and dried.
Results and Discussion
At the start of the evaluation, average temperature across ponds was 16.1 oC and mean dissolved oxygen (DO) level was 12.0 mg/L (Table A3.2; Figure A3.1). Water temperatures rose during the summer, out of optimal range for all three trout species by mid-June, and reaching 23.1 oC at the end of the evaluation (Table A3.2, Figure A3.1); however, average DO levels were very favorable for all trout, 11.2 mg/L (Table A3.2; Figure A3.1).
On 9 May 2012, zooplankton in ponds were scarce; across pond average zooplankton density was 0.4 daphnids/L, 0.2/calanoids/L, and 1.3 cyclopoids/L. By 30 May 2012, mean zooplankton abundance increased substantially: 47 daphnids /L, 10/calanoids/L, and 24 cyclopoids/L. By mid-summer, 25 June 2012, zooplankton were abundant: 105 daphnids /L, 35/calanoids/L, and 10 cyclopoids/L. Bosmina spp, ostracods, and Alona spp. were also present in low densities.
USU Budy. Project Completion Report. Scofield Reservoir 110
Table A3.1. Demographic information of stocked trout (rainbow, cutthroat, and tiger) at start and end of evaluation in six ponds at the USU Millville Aquatic Research Facility, Millville, Utah. Twenty five of each species were stocked into multi-species ponds and 50 trout were stocked into single-species ponds on 10 May 2012. End sampling occurred on 22 – 24 July 2012. Survival was simply estimated based on number of fish stocked then subsequently the number recovered from ponds at the end of the evaluation.
USU Budy. 2011 Interim Progress Report, Scofield Reservoir 111
Rainbow trout performed well in these pond environments. Over the 46-day evaluation period, survival, estimated based on number of fish stocked then subsequently recovered from ponds at the end of the evaluation, was highest for rainbow trout (52 – 68%) and much lower for tiger trout (26 – 36%) and cutthroat trout (10 – 36%; Table A3.1).
Table A3.2. Physical conditions across the summer in six experimental ponds used to evaluate trout performance, USU Millville Aquatic Research Facility, Utah.
Date Temperature,
oC (1 SE)
Dissolved oxygen, mg/L
(1 SE) Secchi depth,
m (1 SE)
9 May 2012 16.1 (0.2) 12.0 (0.2) 1.75 (0.1)
30 May 2012 17.8 (0.2) 12.6 (0.3) 1.95 (0.1)
25 June 2012 20.3 (0.1) 10.3 (0.2) 2.2 (0.1)
25 July 2012 23.1 (0.2) 11.2 (0.2) 2.2 (0.2)
Overall, rainbow trout performed best of all trout species in these experimental ponds, while cutthroat trout and tiger trout performed best in ponds when not in the presence of other species. In the cutthroat trout only pond, cutthroat trout grew 56 mm (90 g), yet performed poorest in the pond with rainbow trout growing only 17 mm (4 g; Figure A3.2). Cutthroat trout grew well in the cutthroat trout only pond even though temperatures were never within the optimal range for cutthroat trout growth (Figure A3.1). Similarly, tiger trout performed best in the tiger-trout-only pond, growing 42 mm (40 g), and performed poorest when mixed with rainbow trout, growing only 23 mm (16 g; Figure A3.2). Conversely, rainbow trout performed best in interspecies ponds growing 49 mm (115 g) when mixed with tiger trout and growing 43 mm (68 g) when mixed with cutthroat trout (Figure A3.2). In contrast, rainbow trout only grew 33 mm (56 g) when raised with conspecifics. In sum, growth for all trout species was poorest when co-occurring with rainbow trout.
Rainbow trout were found to be the most aggressive of these three trout species in laboratory-tank behavioral evaluations under various assemblages and densities (see Appendix 2). Unsurprisingly, due to their aggressive nature, these rainbow trout performed better when grouped with other species in ponds, and demonstrated poorer performance when with conspecifics.
Table A3.3. Lethal temperatures and optimum temperature ranges for growth and survival for rainbow trout (Raleigh et al. 1984), cutthroat trout (Hickman and Raleigh 1982), brown trout (Raleigh et al. 1986), and brook trout (Raleigh 1982). Consumption thermal optimum (CTO) for each species is also given (Hartman and Hayward 2007).
At the end of the evaluations, we removed and measured a subsample of at least two distinct size classes of Utah chub: a small size class 20 – 53 mm TL (0.1 – 1.8 grams) likely representing age-0 and age-1 chub, and a large size class 117 – 151 mm TL (18.6 – 41.4 g), likely representing age-2 and older chub. Pond P8 (cutthroat trout + tiger trout) and Pond P5 (cutthroat trout only) had the highest numbers of chub, while Pond P7 (rainbow trout only) had the lowest numbers of chub based on equal-effort seining of all ponds.
We analyzed the diets of a subsample of trout from the six ponds. Rainbow trout primarily consumed molluscans and terrestrial invertebrates, cutthroat trout primarily consumed dipterans and terrestrial invertebrates, and tiger trout consumed primarily molluscans, odonates, and terrestrial invertebrates (Table A3.4). In late September, months after the experimental trials were finished and just prior to pond draining, several relict trout were taken from ponds, and we found chub in the diets of a few trout. Isotopic analysis of tissue samples taken at the end of the evaluation (25 July 2012) will help determine if piscivory occurred during the evaluation period.
USU Budy. Project Completion Report. Scofield Reservoir 113
Table A3.4. Diets contents (percent by wet weight) of rainbow trout, cutthroat trout, and tiger trout across ponds in late July 2012, USU Millville Aquatic Research Facility, Utah. Rainbow trout diets from ponds 3, 4, and 7. Cutthroat trout diets from ponds 3, 5, and 8. Tiger trout diets from ponds 6 and 4. Sample size (n), number of empty stomachs, and size range of trout with full stomachs (full) is given.
Prey item
Rainbow trout
(n = 27)
Cutthroat trout
(n = 13)
Tiger trout
(n = 3)
Mollusca 49 0 33
Terrestrial invertebrates 20 34 31
Diptera 9 38 0
Hemiptera 15 9 1
Ephemeroptera 3 8 2
Odonata 3 0 33
Other aquatic invertebrates 1 11 0
Size range (mm) of full trout 230 – 305 205 – 254 255 – 276
Number of empty stomachs 1 1 0
References
Hartman, K. J., and R. S. Hayward. 2007. Bioenergetics. Pages 515–560 in C. S. Guy and M. L. Brown, editors. Analysis and interpretation of freshwater fisheries data. American Fisheries Society, Bethesda, Maryland.
Hickman, T., and R.F. Raleigh. 1982. Habitat suitability index models: cutthroat trout. USDA, US Fish and Wildlife Service. FWS/OBS-82/10.5. 38 pages
Raleigh, R.F. 1982. Habitat suitability index models: brook trout. US Department of Interior, US Fish and
Wildlife Service. FWS/OBS-82/10.24. 42 pages. Raleigh, R.F., T. Hickman, R.C. Solomon, and P.C. Nelson. 1984. Habitat suitability information: rainbow
trout. US Fish and Wildlife Service. FWS/OBS-82/10.60. 64 pages. Raleigh, R.F., L.D. Zuckerman, and P.C. Nelson. 1986. Habitat suitability index models and instream flow
suitability curves: brown trout, revised. US Fish and Wildlife Service, Biol. Rep. 82(10.124). 65 pages. [First printed as: FWS/OBS-82/10.71, September 1984].
USU Budy. Project Completion Report. Scofield Reservoir 114
Figure A3.1. Temperature (mean ± 2 SE) and dissolved oxygen (mean ± 2 SE) in six experimental trout ponds at the USU Millville Aquatic Research Facility, Utah, summer 2012. RBT = rainbow trout, CUT = cutthroat trout, and TIG = tiger trout. Consumption thermal optimum (CTO) is 14 °C for cutthroat trout, 17.5 °C for tiger trout (assumed similar to brown trout), and 20 °C for rainbow trout.
USU Budy. Project Completion Report. Scofield Reservoir 115
Figure A3.2. Average growth (total length, TL, mm) of the three stocked trout species raised in experimental ponds, 10 May 2012 (start) to 24 July 2012 (end). Average growth in mass (g) is given on bars.
Cutthroat trout
0
10
20
30
40
50
60
Tiger trout
Gro
wth
(TL,
mm
)
0
10
20
30
40
50
60
Rainbow trout
Species assemblage in pondwith Cutthroat with Rainbow with Tiger
0
10
20
30
40
50
60
90 g
4 g
25 g
31 g16 g
40 g
68 g
56 g
114 g
USU Budy. Project Completion Report. Scofield Reservoir 116
APPENDIX 4
Demographics and diet of Utah chub in Scofield Reservoir, Utah In this appendix, we compiled literature and current information on Utah chub in Scofield Reservoir and other systems. Table A4.1. Length-at-age for Utah chub based on Olson (1959) and Graham (1961).
Scofield Reservoir (Olsen 1959) Hebgen Lake (Graham 1961)
Graham, R.J. 1961. Biology of the Utah chub in Hebgen Lake, Montana. Transactions of the American Fisheries Society 90: 269-276.
Olson, H.F. 1959. Biology of the Utah Chub, gila atraria, of Scofield Reservoir, Utah. MS Thesis. Utah State University, Logan, Utah.
USU Budy. Project Completion Report. Scofield Reservoir 118
Figure A4.1. Length-frequency (%) distributions of Utah chub captured in gill nets during seasonal sampling events from July 2011 – May 2013 in Scofield Reservoir. Number (n) captured in nets is given.
Spring 2013n = 62
Total length bins (mm)
0 50 100 150 200 250 300 350 4000
3
6
9
12
October 2012n = 51
0
3
6
9
12
15
Summer 2012n = 45
0
3
6
9
Spring 2012n = 115
Uta
h ch
ub c
atch
(%)
0
3
6
9
October 2011n = 35
0
3
6
9
12
Summer 2011n = 100
0
3
6
9
12
15
USU Budy. Project Completion Report. Scofield Reservoir 119
Figure A4.2. Length-frequency (%) distributions of Utah chub captured in gill nets (top panel) and found in cutthroat trout and tiger trout diets, 2011 –2013 in Scofield Reservoir.
USU Budy. Project Completion Report. Scofield Reservoir 120
Figure A4.3. Length-frequency (%) distribution of Utah chub taken from six experimental ponds, USU Millville Aquatic Research Facility, Utah, July 2012. Source of Utah chub was Kesko Ranch, Ephraim, Utah. Few < 60 mm, age-0 chub were captured in gill nets in Scofield Reservoir, therefore these measurements can provide insight into size and growth of young-of-year (age-0) chub in Utah.
Total length bins (mm)
0 20 40 60 80 100 120 140 160 180 200
Freq
uenc
y of
chu
b in
pon
ds
0
10
20
30
40
50
60
USU Budy. Project Completion Report. Scofield Reservoir 121
Figure A4.4. Length-to-weight (body mass) relationship for Utah chub in Scofield Reservoir, Utah, 2011 - 2012. Equation is given with R2 value and sample size.
USU Budy. Project Completion Report. Scofield Reservoir 122
Figure A4.5. Diets (percentage by wet mass) across seasons of small (< 250 mm) and large (> 250 mm) Utah chub taken from Scofield Reservoir in 2012. Size range of small chub (n = 25, 36% empty) was 143 – 241 mm (mean = 187 mm, 1 SE = 6.4; 89.7 g, 1 SE = 9.9) and large chub (n = 17, 35% empty) was 251 – 348 mm (mean = 292 mm, 1 SE = 7.6; 322.5 g, 1 SE = 19.3). Diet items included chironomids, dipterans, molluscans, unidentified aquatic invertebrate parts, crayfish (decapods), zooplankton, terrestrial invertebrates, and organic matter (e.g., plant material and detritus). See Chapter 1 for information on diet overlap between chub and trout.