Converging Networks Week of March 31, 2014 Jeff Fan, CPA, CA, CFA – (416) 863-7780 Jay Oduwole – (416) 945-4249 Telecommunication Services & Cable Scotia Capital Inc. – Canada Scotia Capital Inc. – Canada [email protected]Shay Nulman – (416) 862-3721 Scotia Capital Inc. – Canada For Reg AC Certification and important disclosures see Appendix A of this report. Analysts employed by non-U.S. affiliates are not registered/qualified as research analysts withFINRA in the U.S. Converging Networks INVESTING IN TELCOS, CELLCOS, AND CABLECOS Inside Is It Time to Re-evaluate Some of Our Wireless Industry Assumptions? 1 Industry News 5 Calendar of Events 7 Regulatory Events to Watch 8 Price Performance Charts 10 Valuation Comparables 15 Net Asset Valuations 18 Is It Time to Re-evaluate Some of Our Wireless Industry Assumptions? Over the past few weeks, all three Canadian wireless incumbents have implemented price changes. Although there were some reductions on certain data plans (i.e., lower price per MB) and the elimination of less-popular data plans, the common denominator was that they all implemented a $5 increase per month per device in data sharing plans for new subscribers. Hence, new single-line customers will pay $5 more per month, new two-device customers (i.e., multi-device or family plans) will pay $10 more per month, and so on. The move also helps recover the higher-than-expected cost of the 700 MHz auction. Normally, we would accept these price increases and move on, as the action reaffirms our positive view on the Canadian wireless sector, and in particular the wireless incumbents, and, therefore, should support margins and return on investment. However, recent trends make us wonder whether the Canadian market will simply absorb the price increases and whether industry pricing power is as strong as it has been historically. The latest quarterly results suggest the market has not yet adjusted to the price increases from last summer when incumbents raised monthly prices after the three-year contract ban under the Wireless Code of Conduct (WCOC). In a previous edition of Converging Networks (from February 18, 2014, available on ScotiaView), we showed that smartphone penetration growth slowed in the second half of 2013 after the price increases were implemented. Since then, Wind and Quebecor have also reported their 2013 year-end results. As shown in Exhibits 1 and 2, wireless subscriber growth and wireless penetration growth slowed at an accelerating rate in Q4/13. At this pace, we are trending toward no subscriber growth and no penetration growth in 2014.
Transcript
Converging Networks Week of March 31, 2014
Jeff Fan, CPA, CA, CFA – (416) 863-7780 Jay Oduwole – (416) 945-4249 Telecommunication Services & Cable Scotia Capital Inc. – Canada Scotia Capital Inc. – Canada [email protected] Shay Nulman – (416) 862-3721 Scotia Capital Inc. – Canada
For Reg AC Certification and important disclosures see Appendix A of this report. Analysts employed by non-U.S. affiliates are not registered/qualified as research analysts withFINRA in the U.S.
Converging Networks I N V E S T I N G I N T E L C O S , C E L L C O S , A N D C A B L E C O S
Inside
Is It Time to Re-evaluate Some of Our Wireless Industry Assumptions? 1 Industry News 5 Calendar of Events 7 Regulatory Events to Watch 8 Price Performance Charts 10 Valuation Comparables 15 Net Asset Valuations 18
Is It Time to Re-evaluate Some of Our Wireless Industry Assumptions? Over the past few weeks, all three Canadian wireless incumbents have implemented price changes. Although there were some reductions on certain data plans (i.e., lower price per MB) and the elimination of less-popular data plans, the common denominator was that they all implemented a $5 increase per month per device in data sharing plans for new subscribers. Hence, new single-line customers will pay $5 more per month, new two-device customers (i.e., multi-device or family plans) will pay $10 more per month, and so on. The move also helps recover the higher-than-expected cost of the 700 MHz auction.
Normally, we would accept these price increases and move on, as the action reaffirms our positive view on the Canadian wireless sector, and in particular the wireless incumbents, and, therefore, should support margins and return on investment. However, recent trends make us wonder whether the Canadian market will simply absorb the price increases and whether industry pricing power is as strong as it has been historically.
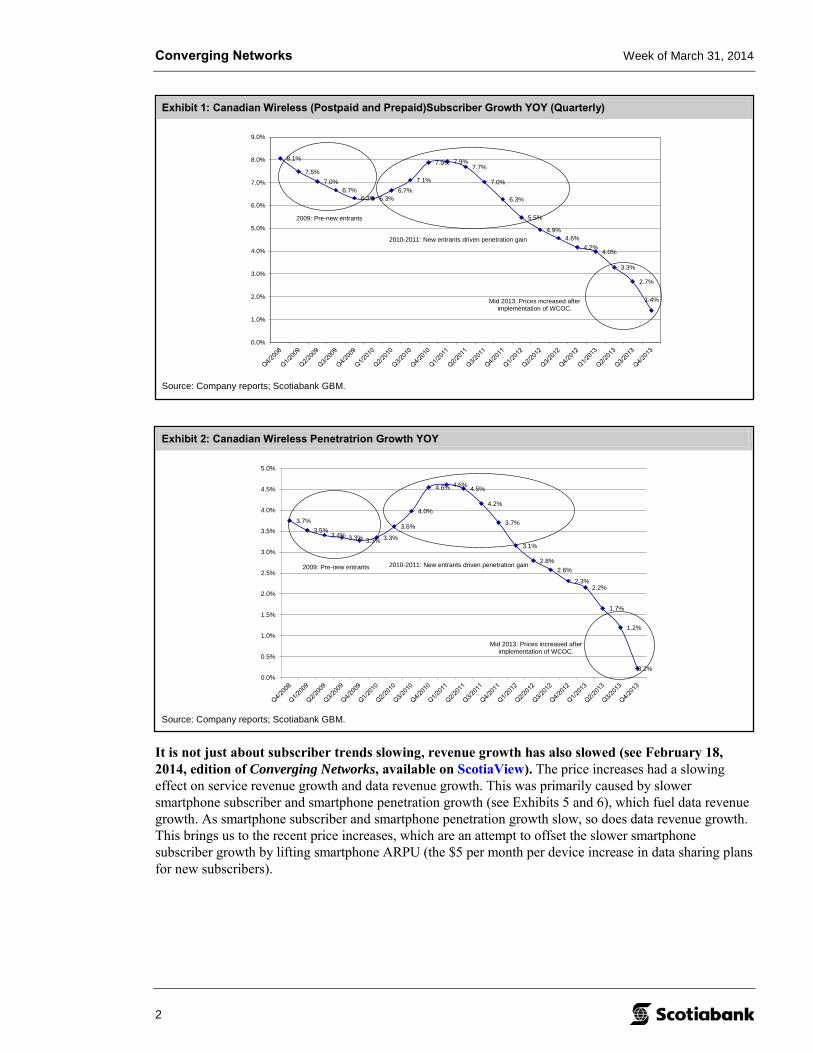
The latest quarterly results suggest the market has not yet adjusted to the price increases from last summer when incumbents raised monthly prices after the three-year contract ban under the Wireless Code of Conduct (WCOC). In a previous edition of Converging Networks (from February 18, 2014, available on ScotiaView), we showed that smartphone penetration growth slowed in the second half of 2013 after the price increases were implemented. Since then, Wind and Quebecor have also reported their 2013 year-end results. As shown in Exhibits 1 and 2, wireless subscriber growth and wireless penetration growth slowed at an accelerating rate in Q4/13. At this pace, we are trending toward no subscriber growth and no penetration growth in 2014.
Exhibit 2: Canadian Wireless Penetratrion Growth YOY
Source: Company reports; Scotiabank GBM.
3.7%3.5%
3.4% 3.3% 3.3% 3.3%
3.6%
4.0%
4.6% 4.6% 4.5%
4.2%
3.7%
3.1%
2.8%2.6%
2.3%2.2%
1.7%
1.2%
0.2%0.0%
0.5%
1.0%
1.5%
2.0%
2.5%
3.0%
3.5%
4.0%
4.5%
5.0%
2010-2011: New entrants driven penetration gain2009: Pre-new entrants
Mid 2013: Prices increased after implementation of WCOC.
Exhibit 1: Canadian Wireless (Postpaid and Prepaid)Subscriber Growth YOY (Quarterly)
Source: Company reports; Scotiabank GBM.
8.1%
7.5%7.0%
6.7%6.3% 6.3%
6.7%7.1%
7.9% 7.9%7.7%
7.0%
6.3%
5.5%
4.9%4.6%
4.2%4.0%
3.3%
2.7%
1.4%
0.0%
1.0%
2.0%
3.0%
4.0%
5.0%
6.0%
7.0%
8.0%
9.0%
2010-2011: New entrants driven penetration gain
2009: Pre-new entrants
Mid 2013: Prices increased after implementation of WCOC.
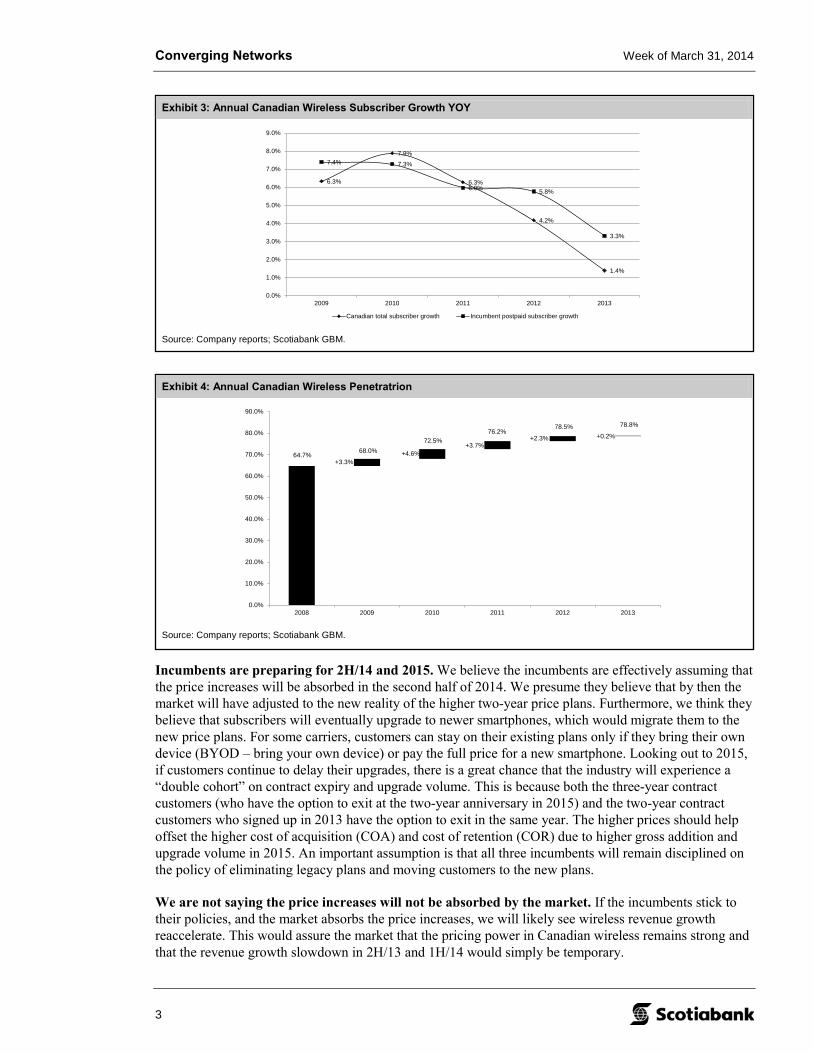
It is not just about subscriber trends slowing, revenue growth has also slowed (see February 18, 2014, edition of Converging Networks, available on ScotiaView). The price increases had a slowing effect on service revenue growth and data revenue growth. This was primarily caused by slower smartphone subscriber and smartphone penetration growth (see Exhibits 5 and 6), which fuel data revenue growth. As smartphone subscriber and smartphone penetration growth slow, so does data revenue growth. This brings us to the recent price increases, which are an attempt to offset the slower smartphone subscriber growth by lifting smartphone ARPU (the $5 per month per device increase in data sharing plans for new subscribers).
Exhibit 3: Annual Canadian Wireless Subscriber Growth YOY
Source: Company reports; Scotiabank GBM.
6.3%
7.9%
6.3%
4.2%
1.4%
7.4% 7.3%
6.0% 5.8%
3.3%
0.0%
1.0%
2.0%
3.0%
4.0%
5.0%
6.0%
7.0%
8.0%
9.0%
2009 2010 2011 2012 2013
Canadian total subscriber growth Incumbent postpaid subscriber growth
Exhibit 4: Annual Canadian Wireless Penetratrion
Source: Company reports; Scotiabank GBM.
64.7%+3.3%
+4.6%+3.7%
+2.3% +0.2%
0.0%
10.0%
20.0%
30.0%
40.0%
50.0%
60.0%
70.0%
80.0%
90.0%
2008 2009 2010 2011 2012 2013
68.0%72.5%
76.2%78.5% 78.8%
Incumbents are preparing for 2H/14 and 2015. We believe the incumbents are effectively assuming that the price increases will be absorbed in the second half of 2014. We presume they believe that by then the market will have adjusted to the new reality of the higher two-year price plans. Furthermore, we think they believe that subscribers will eventually upgrade to newer smartphones, which would migrate them to the new price plans. For some carriers, customers can stay on their existing plans only if they bring their own device (BYOD – bring your own device) or pay the full price for a new smartphone. Looking out to 2015, if customers continue to delay their upgrades, there is a great chance that the industry will experience a “double cohort” on contract expiry and upgrade volume. This is because both the three-year contract customers (who have the option to exit at the two-year anniversary in 2015) and the two-year contract customers who signed up in 2013 have the option to exit in the same year. The higher prices should help offset the higher cost of acquisition (COA) and cost of retention (COR) due to higher gross addition and upgrade volume in 2015. An important assumption is that all three incumbents will remain disciplined on the policy of eliminating legacy plans and moving customers to the new plans.
We are not saying the price increases will not be absorbed by the market. If the incumbents stick to their policies, and the market absorbs the price increases, we will likely see wireless revenue growth reaccelerate. This would assure the market that the pricing power in Canadian wireless remains strong and that the revenue growth slowdown in 2H/13 and 1H/14 would simply be temporary.
Converging Networks Week of March 31, 2014
4
Exhibit 5: Annual Canadian Smartphone Penetratrion (Percentage of Postpaid Subscribers)
Source: Company reports; Scotiabank GBM.
15% +8%
+12%
+17%
+14%
+8%
0%
10%
20%
30%
40%
50%
60%
70%
80%
2008 2009 2010 2011 2012 2013
23%
36%
53%
67%
75%
Exhibit 6: Annual Canadian Smartphone Penetratrion (Percentage of Total Subscribers)
Source: Company reports; Scotiabank GBM.
12% +7%
+10%
+15%
+13%
+9%
0%
10%
20%
30%
40%
50%
60%
70%
2008 2009 2010 2011 2012 2013
19%
28%
43%
56%
65%
However, if the price increases are not absorbed, then we believe some of the long-standing industry assumptions may have to be re-evaluated. This would include our long-term wireless penetration assumption (current assumption is that it should track the United States) and, more importantly, our smartphone penetration assumption (current assumption is that it should reach 100%). How could subscribers not absorb the price increase? Is it possible that subscribers could reduce their data bucket purchases to keep the monthly service fee at par? This may be easier in Western Canada where Shaw’s Wi-Fi network now has more than 30,000 hotspots and is seeing average Wi-Fi data usage near the current average usage for smartphones. Wireless spending (and communications spending overall) as a percentage of GDP has risen sharply over the past several years; have we finally reached the peak? We believe the 2H/14 results will provide us the insights.
On EBITDA and cash flow, incumbents generated strong margins due to the slower subscriber volume in 2H/13 and we expect this will continue in the first half of 2014. Hence, even if wireless revenue growth continues to slow in the first half of 2014, we expect EBITDA growth to remain healthy for the industry overall. However, while rising margins is easily achievable in the short term due to lower volume, it would be difficult to sustain over the medium to long term without sustainable revenue growth.
Converging Networks Week of March 31, 2014
5
Industry News TELUS Announces Leadership Progression
• (March 31 – TELUS) Effective as of TELUS’ (T-T) upcoming Annual General Meeting on May 8, 2014, TELUS is pleased to announce board and management leadership appointments that have been fostered through the company’s robust succession planning process. These changes will ensure the continuity of TELUS’ national growth strategy and the company’s top priority of always putting customers first.
• Brian Canfield will retire following 58 years of exemplary service with TELUS and BC TEL. Mr. Canfield has served as TELUS’ non-executive chair since 1999, upon completion of the merger of BC TEL and TELUS.
• Darren Entwistle is being appointed executive chair of TELUS. Since 2000, TELUS has become a recognized global leader in shareholder value creation, technology innovation, human capital development and employee engagement, and corporate social responsibility.
• Joe Natale is being appointed president and CEO of TELUS. Mr. Natale joined TELUS in 2003 as an executive vice president and has progressed through increasingly expansive roles, including president of TELUS Business Solutions and president of TELUS Consumer Solutions. Since 2010, Mr. Natale has served as TELUS’ chief commercial officer, leading a team of more than 25,000.
Cheaper iPhone Plans Come to Quebec
• (March 29 – Global News) Videotron (OBR.B-T), the scrappy cable company that launched cellphone services across Quebec a few years ago has at last landed the vaunted iPhone, which continues to be the most popular wireless device on the planet. The launch of the device isn’t so much the big news – it’s the monthly pricing that’s come along with it.
• Videotron is substantially undercutting the plans offered by Bell (BCE-T), Rogers (RCI.B-T), and TELUS (T-T) in the province, offering monthly rates that are as much as 36% less expensive than what the Big Three incumbents charge for iPhone-eligible plans.
• Videotron is charging $74.95 a month for unlimited Canada-wide calling, text message, and 4 GB of data. The equivalent incumbent plans are $110/month – which Bell, Rogers, and Telus uniformly charge their subscribers. For $80 a month, Videotron iPhone subscribers can get the same deal and a total of 6 GB of data, a plan that costs Rogers, Bell, and TELUS subscribers $125 a month currently, according to analysts. Videotron’s pricing is clearly designed to win over droves of new customers in a hurry.
Charter Challenges Comcast-Time Warner Cable Deal in Proxy Fight
• (March 28 – Bloomberg) Charter (CHTR-Q) urged Time Warner Cable (TWC-N) investors not to endorse a takeover by Comcast (CMCSA-Q) signalling it’s not backing down in its pursuit of Time Warner Cable without a fight.
• Comcast, which outbid Charter this year with a $45 billion stock offer, is too susceptible to regulatory hurdles because it’s the biggest in the cable industry, Charter said today in a filing. Time Warner Cable, meanwhile, refused to engage with Charter to develop a merger deal, Charter said.
• Charter, the fourth-largest U.S. cable company, had offered to buy Time Warner Cable – the second-largest U.S. cable company – for $37 billion in cash and stock, a bid rejected as too low by Time Warner Cable Chief Executive Officer Rob Marcus. Although Comcast’s shares have declined about 10% since the acquisition agreement was announced, they would need to drop at least another 8% to fall to the levels of Charter’s proposal.
Converging Networks Week of March 31, 2014
6
• “We are fully committed to our merger with Comcast, which we believe is in the best interests of shareholders,” Time Warner Cable said today. John Demming, a Comcast spokesman, said the company declined to comment.
Billionaire Ergen Revisits Dish-DirecTV as Options Run Out
• (March 28 – Bloomberg) Billionaire Charlie Ergen, who scrapped plans 11 years ago to merge his Dish satellite business with DirecTV because of regulatory concerns, is at it again.
• The cable rivals of Ergen’s Dish Network (DISH-Q) are getting bigger, with Comcast (CMCSA-Q) and Time Warner Cable (TWC-N) preparing for a $45 billion merger. Potential partners in the wireless business have spurned the company. Furthermore, a host of new competitors, from phone companies to Internet-video providers, are luring away the company’s subscribers.
• That’s all putting increasing pressure on Ergen, a former professional gambler from Oak Ridge, Tennessee, to coax a skittish DirecTV into a deal. At the same time, he has to convince regulators that a satellite merger wouldn’t harm competition.
• “You’ve got a whole different dynamic than 10 years ago,” he said in a 2012 interview. “I would be relatively optimistic you could put a deal together if there was a desire with DirecTV that makes sense for the government to approve.”
• Ergen, 61, recently reached out to Mike White, DirecTV’s chief executive officer, to discuss a combination of the two largest satellite TV providers, according to several people with knowledge of the matter, Bloomberg News reported this week. While White hasn’t ruled out a deal, he’s reluctant to push forward with formal talks out of concern that regulators would block the combination again, the same sources said. Government regulators forced Ergen to scrap the merger in late 2002.
TELUS’ Decision to Shut Public Mobile Angers Consumers
• (March 27 – The Globe and Mail) TELUS (T-T) is preparing to shut down Public Mobile’s wireless network, a move that will force the discount carrier’s roughly 280,000 customers to buy new cellphones in order to maintain service. Although TELUS is planning to migrate Public Mobile’s customers onto its faster 4G (fourth-generation) national network, its decision is sparking a firestorm of criticism from consumer advocates and is raising the eyebrows of federal officials, including Industry Minister James Moore. That’s because Public Mobile largely caters to low-income Canadians who are least able to afford the cost of purchasing new cellphones.
• Since those consumers often opt for ultra-cheap talk-and-text plans, broader questions are being raised about the state of competition in the $20 billion wireless market at a time when the two remaining independent carriers, Mobilicity and Wind Mobile, appear to be on weaker footing.
• “For a large majority of the customers, this is actually an incredibly beneficial move,” said Kevin Banderk, general manager of Public Mobile and the head of TELUS’ Koodo brand. “To move from where they are today and, generally speaking, keep the price points where they are today onto a network that is of the latest and greatest technology – much more reliable, much faster data speeds and national in scope – is actually a good thing. We understand that the transition is a bit tricky and we’re doing everything we can to make that as easy as possible.”
• Industry Minister James Moore questioned the wisdom of TELUS’ move. “Seems like an odd business decision to alienate thousands of Public Mobile users as you absorb Public Mobile itself,” Mr. Moore told The Globe and Mail, while on a trade mission in Germany. “Ultimately it’s a business decision I’ll leave for Telus to explain.”
Converging Networks Week of March 31, 2014
7
Exhibit 7: Upcoming Events
Source: Company reports; Industry Canada; CRTC; Scotiabank GBM.
March 31 April 1 2 3 4
Scotiabank
Jeff Fan marketing in Boston
Scotiabank
Jeff Fan marketing in Boston
7 8 9 10 11
Quebec General Election
National Assoc. of
Broadcasters Show Las Vegas April 7 - 10
Comcast Senate
Hearing
CCA Q2/14
Call 11:00 a.m. ET Dial: 1-800-820-0231
Code: 8125587
SJR Q2/14 Call 3:30 p.m. ET
Dial: 866-321-6651 Code: 1639706
14 15 16 17 18
Good Friday
Bank closed
21 22 23 24 25
RCI Q1/14 Call 4:30 p.m. ET Dial 416-644-3414
Code: N/A
Comcast Q1/14
Call 8:30 a.m. ET Dial 1-800-263-8495
Code: 10792182
AT&T Q1/14 Call 4:30 p.m. ET
Dial 1-866-232-4457 Code: N/A
VZ Q1/14
Call 8:30 a.m. ET Dial 1-888-455-3018
Code: VERIZON
28 29 30 May 1 2
NCTA Cable Show
Los Angeles April 29- May 1
BA Q1/14
Call 4:30 p.m. ET Dial 866-696-5910
Code: 2743188
5 6 7 8 9
BCE Q1/14
Tentative
TELUS Q1/14
Tentative
12 13 14 15 16
MTS Q1/14
Tentative
QBR Q1/14
Tentative
Calendar of Events
Converging Networks Week of March 31, 2014
8
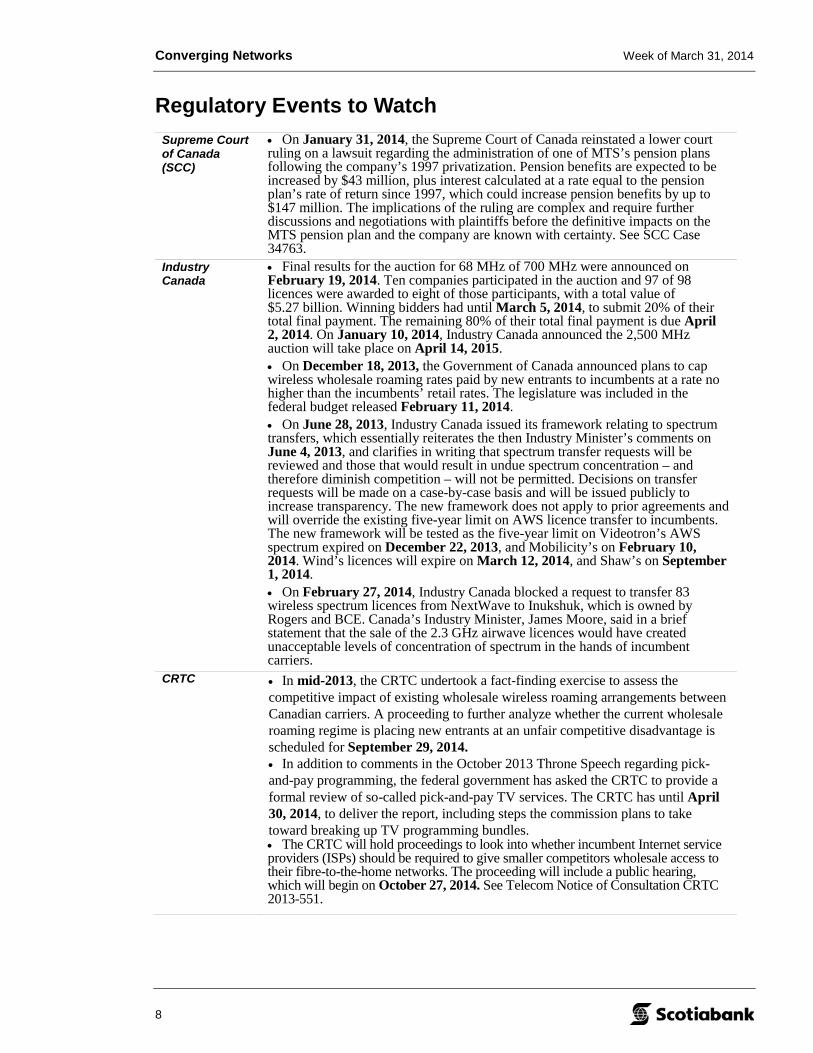
Regulatory Events to Watch Supreme Court of Canada (SCC)
• On January 31, 2014, the Supreme Court of Canada reinstated a lower court ruling on a lawsuit regarding the administration of one of MTS’s pension plans following the company’s 1997 privatization. Pension benefits are expected to be increased by $43 million, plus interest calculated at a rate equal to the pension plan’s rate of return since 1997, which could increase pension benefits by up to $147 million. The implications of the ruling are complex and require further discussions and negotiations with plaintiffs before the definitive impacts on the MTS pension plan and the company are known with certainty. See SCC Case 34763.
Industry Canada
• Final results for the auction for 68 MHz of 700 MHz were announced on February 19, 2014. Ten companies participated in the auction and 97 of 98 licences were awarded to eight of those participants, with a total value of $5.27 billion. Winning bidders had until March 5, 2014, to submit 20% of their total final payment. The remaining 80% of their total final payment is due April 2, 2014. On January 10, 2014, Industry Canada announced the 2,500 MHz auction will take place on April 14, 2015. • On December 18, 2013, the Government of Canada announced plans to cap wireless wholesale roaming rates paid by new entrants to incumbents at a rate no higher than the incumbents’ retail rates. The legislature was included in the federal budget released February 11, 2014. • On June 28, 2013, Industry Canada issued its framework relating to spectrum transfers, which essentially reiterates the then Industry Minister’s comments on June 4, 2013, and clarifies in writing that spectrum transfer requests will be reviewed and those that would result in undue spectrum concentration – and therefore diminish competition – will not be permitted. Decisions on transfer requests will be made on a case-by-case basis and will be issued publicly to increase transparency. The new framework does not apply to prior agreements and will override the existing five-year limit on AWS licence transfer to incumbents. The new framework will be tested as the five-year limit on Videotron’s AWS spectrum expired on December 22, 2013, and Mobilicity’s on February 10, 2014. Wind’s licences will expire on March 12, 2014, and Shaw’s on September 1, 2014. • On February 27, 2014, Industry Canada blocked a request to transfer 83 wireless spectrum licences from NextWave to Inukshuk, which is owned by Rogers and BCE. Canada’s Industry Minister, James Moore, said in a brief statement that the sale of the 2.3 GHz airwave licences would have created unacceptable levels of concentration of spectrum in the hands of incumbent carriers.
CRTC • In mid-2013, the CRTC undertook a fact-finding exercise to assess the competitive impact of existing wholesale wireless roaming arrangements between Canadian carriers. A proceeding to further analyze whether the current wholesale roaming regime is placing new entrants at an unfair competitive disadvantage is scheduled for September 29, 2014. • In addition to comments in the October 2013 Throne Speech regarding pick-and-pay programming, the federal government has asked the CRTC to provide a formal review of so-called pick-and-pay TV services. The CRTC has until April 30, 2014, to deliver the report, including steps the commission plans to take toward breaking up TV programming bundles. • The CRTC will hold proceedings to look into whether incumbent Internet service providers (ISPs) should be required to give smaller competitors wholesale access to their fibre-to-the-home networks. The proceeding will include a public hearing, which will begin on October 27, 2014. See Telecom Notice of Consultation CRTC 2013-551.
Converging Networks Week of March 31, 2014
9
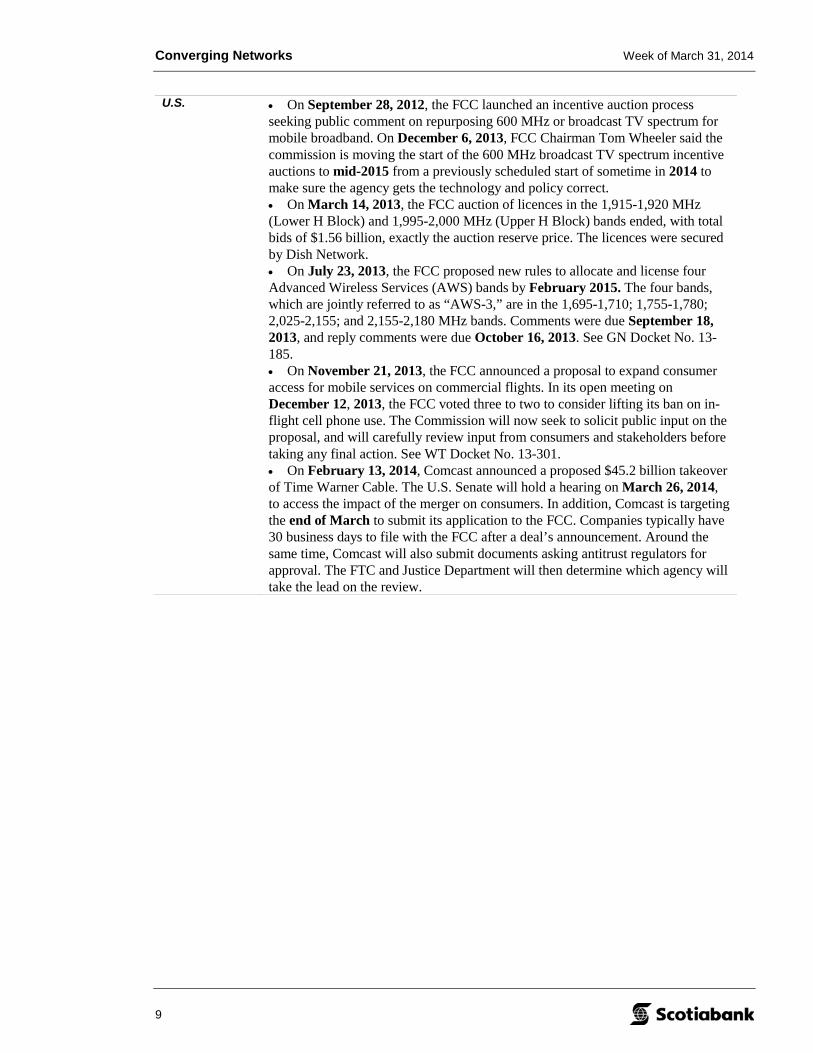
U.S. • On September 28, 2012, the FCC launched an incentive auction process seeking public comment on repurposing 600 MHz or broadcast TV spectrum for mobile broadband. On December 6, 2013, FCC Chairman Tom Wheeler said the commission is moving the start of the 600 MHz broadcast TV spectrum incentive auctions to mid-2015 from a previously scheduled start of sometime in 2014 to make sure the agency gets the technology and policy correct. • On March 14, 2013, the FCC auction of licences in the 1,915-1,920 MHz (Lower H Block) and 1,995-2,000 MHz (Upper H Block) bands ended, with total bids of $1.56 billion, exactly the auction reserve price. The licences were secured by Dish Network. • On July 23, 2013, the FCC proposed new rules to allocate and license four Advanced Wireless Services (AWS) bands by February 2015. The four bands, which are jointly referred to as “AWS-3,” are in the 1,695-1,710; 1,755-1,780; 2,025-2,155; and 2,155-2,180 MHz bands. Comments were due September 18, 2013, and reply comments were due October 16, 2013. See GN Docket No. 13-185. • On November 21, 2013, the FCC announced a proposal to expand consumer access for mobile services on commercial flights. In its open meeting on December 12, 2013, the FCC voted three to two to consider lifting its ban on in-flight cell phone use. The Commission will now seek to solicit public input on the proposal, and will carefully review input from consumers and stakeholders before taking any final action. See WT Docket No. 13-301. • On February 13, 2014, Comcast announced a proposed $45.2 billion takeover of Time Warner Cable. The U.S. Senate will hold a hearing on March 26, 2014, to access the impact of the merger on consumers. In addition, Comcast is targeting the end of March to submit its application to the FCC. Companies typically have 30 business days to file with the FCC after a deal’s announcement. Around the same time, Comcast will also submit documents asking antitrust regulators for approval. The FTC and Justice Department will then determine which agency will take the lead on the review.
Converging Networks Week of March 31, 2014
10
Exhibit 9: Canadian Wireless Total Return Performance
03-Jan-14
10-Jan-14
17-Jan-14
24-Jan-14
31-Jan-14
07-Feb-14
14-Feb-14
21-Feb-14
28-Feb-14
07-Mar-1
4
14-Mar-1
4
21-Mar-1
4
28-Mar-1
485
90
95
100
105
110
115
RogersTELUS CorporationBCE Inc.
Dividends included in calculations.
Source: Bloomberg; FactSet.
Exhibit 8: Telecom Total Return Performance
03-Ja
n-14
10-Jan-14
17-Jan-14
24-Jan-14
31-Jan-14
07-Feb-14
14-Feb-14
21-Feb-14
28-Feb-14
07-Mar-1
4
14-Mar-1
4
21-Mar-1
4
28-Mar-1
490
95
100
105
110
115
Bell AliantBCE Inc.MTSTELUSVerizonAT&T Inc.
Dividends included in calculations.
Source: Bloomberg; FactSet.
Price Performance Charts
Converging Networks Week of March 31, 2014
11
Exhibit 10: U.S. Wireless Total Return Performance
Exhibit 11: Canadian Cable Total Return Performance
03-Jan-14
10-Jan-14
17-Jan-14
24-Jan-14
31-Jan-14
07-Feb
-14
14-Feb
-14
21-Feb
-14
28-Feb
-14
07-Mar-1
4
14-Mar-1
4
21-Mar-1
4
28-Mar-1
485
90
95
100
105
110
115
120
Cogeco CableShawRogersQuebecor
Dividends included in calculations.
Source: Bloomberg; FactSet.
Converging Networks Week of March 31, 2014
12
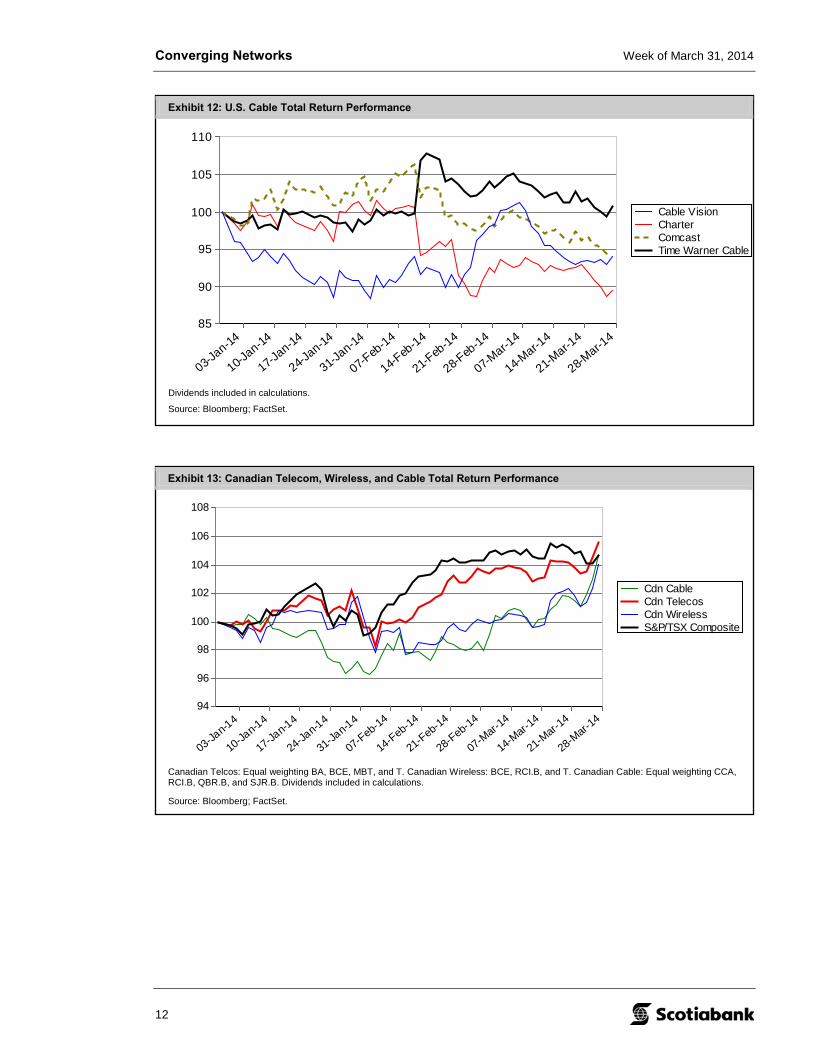
Exhibit 12: U.S. Cable Total Return Performance
03-Jan-14
10-Jan-14
17-Jan-14
24-Jan-14
31-Jan-14
07-Feb
-14
14-Feb
-14
21-Feb
-14
28-Feb
-14
07-Mar-1
4
14-Mar-1
4
21-Mar-1
4
28-Mar-1
485
90
95
100
105
110
Cable VisionCharterComcastTime Warner Cable
Dividends included in calculations.
Source: Bloomberg; FactSet.
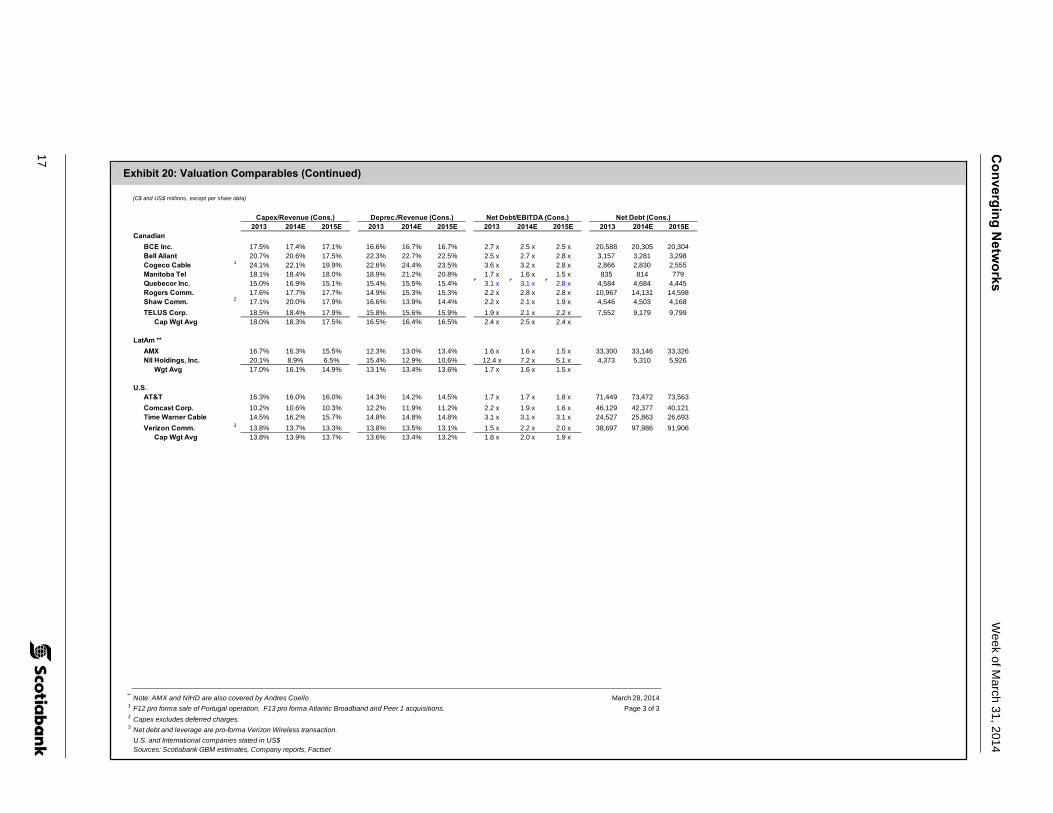
Exhibit 13: Canadian Telecom, Wireless, and Cable Total Return Performance
03-Jan-14
10-Jan-14
17-Jan-14
24-Jan-14
31-Jan-14
07-Feb-14
14-Feb-14
21-Feb-14
28-Feb-14
07-Mar-1
4
14-Mar-1
4
21-Mar-1
4
28-Mar-1
494
96
98
100
102
104
106
108
Cdn CableCdn TelecosCdn WirelessS&P/TSX Composite
Canadian Telcos: Equal weighting BA, BCE, MBT, and T. Canadian Wireless: BCE, RCI.B, and T. Canadian Cable: Equal weighting CCA, RCI.B, QBR.B, and SJR.B. Dividends included in calculations.
Source: Bloomberg; FactSet.
Converging Networks Week of March 31, 2014
13
Exhibit 15: Mexican Telecom Total Return Performance
03-Jan-14
10-Jan-14
17-Jan-14
24-Jan-14
31-Jan-14
07-Feb-14
14-Feb-14
21-Feb-14
28-Feb-14
07-Mar-1
4
14-Mar-1
4
21-Mar-1
4
28-Mar-1
475
80
85
90
95
100
105
America MovilMEXBOLIBOV
MEXBOL = Mexican Bolsa Index or IPC (ĺndice de Precios y Cotizaciones); IBOV = Brazil BOVESPA stock index. Returns are in local currency.
Source: Bloomberg; FactSet.
Exhibit 14: U.S. Telecom, Wireless, and Cable Total Return Performance
03-Jan-14
10-Jan-14
17-Jan-14
24-Jan-14
31-Jan-14
07-Feb-14
14-Feb-14
21-Feb-14
28-Feb-14
07-Mar-1
4
14-Mar-1
4
21-Mar-1
4
28-Mar-1
488
90
92
94
96
98
100
102
104
U.S. TelecosU.S. WirelessU.S. CableS&P 500
U.S. Telcos: Equal weighting T and VZ. U.S. Wireless: T, VZ, S, USM, TMUS. U.S. Cable: Equal weighting CHTR, CMCSA, CVC, TWC. Dividends included in calculations.
Source: Bloomberg; FactSet.
Converging Networks Week of March 31, 2014
14
Exhibit 17: Total Return Performance: Three Months Rolling to March 31, 2014
Dividends included in calculations.
Source: FactSet.
-20% -10% 0% 10% 20%
S&P 500S&P/TSX
CVC-NSJR.B-TRCI.B-TCCA-TTWC-N
QBR.B-TCGO-T
CMCSA-OS-N
USM-ATMUS-N
BA-TT-N
BCE-TVZ-N
T-TMBT-T
Exhibit 16: Total Return Performance: One Month Rolling to March 31, 2014
Dividends included in calculations.
Source: FactSet.
-5% 0% 5% 10% 15%
S&P 500S&P/TSX
TWC-NCGO-TCCA-T
CMCSA-OSJR.B-T
CVC-NRCI.B-T
QBR.B-TTMUS-N
S-NUSM-A
T-TVZ-N
MBT-TBA-T
BCE-TT-N
Exhibit 19: Total Return Performance: One Year Rolling to March 31, 2014
*One-year returns not available for Sprint given re-listing on 07/08/13 post-Softbank transaction Dividends included in calculations.
Source: FactSet.
-20% 0% 20% 40% 60% 80%100%120%140%
S&P 500S&P/TSX
RCI.B-TSJR.B-T
CVC-NCMCSA-O
QBR.B-TCCA-TCGO-TTWC-NUSM-A
TMUS-NS-N*
MBT-TT-N
VZ-NBCE-T
BA-TT-T
Exhibit 18: Total Return Performance: Six Months Rolling to March 31, 2014
Dividends included in calculations.
Source: FactSet.
-20%-10% 0% 10% 20% 30% 40% 50%
S&P 500S&P/TSX
CCA-TCVC-N
RCI.B-TSJR.B-TCGO-T
QBR.B-TCMCSA-O
TWC-NUSM-A
TMUS-NS-NT-N
VZ-NMBT-T
BA-TBCE-T
T-T
15
Converging N
etworks
Week of M
arch 31, 2014
Exhibit 20: Valuation Comparables
(C$ and US$ millions, except per share data)One-year
Scotiabank GBM Price Target 52-week Dividend Market Net Enterprise '13E-'15E 2014ETKR Rating 3/28/14 Price ROR High Low Rate Yield Cap. Debt Other* Value EPS CAGR PEG
BCE Inc. 7.8 x 7.3 x 7.3 x 14.7 x 13.3 x 13.1 x 17.7 x 15.8 x 15.8 x 5.7% 5.5% 5.8% 7.4 x 15.9 x 13.2 x 5.8%Bell Aliant 7.3 x 7.7 x 7.9 x 13.3 x 13.3 x 12.9 x 16.4 x 17.8 x 18.9 x 6.2% 4.9% 6.7% 7.9 x 16.0 x 12.9 x 6.8%Cogeco Cable 6.7 x 6.7 x 6.3 x 13.8 x 12.9 x 11.0 x 11.8 x 12.3 x 11.8 x 7.1% 7.8% 12.2% 6.7 x 12.4 x 11.1 x 10.8%Manitoba Tel 4 5.7 x 5.6 x 5.6 x 15.0 x 13.6 x 13.0 x 17.5 x 18.6 x 17.7 x -0.2% 6.3% 6.1% 5.9 x 17.9 x 13.7 x 5.9%Quebecor Inc. 5 6.6 x 7.0 x 6.6 x 12.1 x 14.0 x 12.3 x 16.7 x 14.5 x 12.7 x 5.9% 5.4% 7.2% 6.6 x 15.7 x 12.2 x 6.1%Rogers Comm. 7.5 x 6.9 x 6.7 x 13.6 x 12.8 x 12.2 x 14.1 x 13.8 x 13.3 x 5.3% 5.9% 6.2% 8.1 x 15.5 x 14.9 x 5.5%Shaw Comm. 8.2 x 8.0 x 7.7 x 15.1 x 16.6 x 14.2 x 16.2 x 14.1 x 14.4 x 5.7% 3.0% 4.1% 8.1 x 14.0 x 14.8 x 4.4%TELUS Corp. 8.0 x 7.8 x 7.4 x 16.8 x 16.4 x 14.7 x 18.1 x 17.6 x 16.4 x 4.0% 4.1% 4.9% 7.7 x 15.9 x 14.8 x 5.2%
Cap Wgt Avg 7.7 x 7.4 x 7.2 x 14.8 x 14.3 x 13.3 x 16.6 x 15.6 x 15.2 x 5.2% 5.0% 5.8% 7.6 x 15.6 x 14.0 x 5.6%
LatAm **AMX 5.9 x 5.0 x 4.8 x 12.1 x 10.1 x 9.3 x 11.4 x 8.7 x 8.2 x 6.2% 7.8% 9.0% 5.7 x 8.7 x 11.5 x 7.9%NII Holdings, Inc. 13.8 x 6.2 x 4.0 x n.m. 20 x 6.1 x n.m. n.m. n.m. n.m. n.m. n.m. 6.6 x n.m. 21.6 x n.m.
Cap Wgt Avg 5.9 x 5.0 x 4.8 x 12.1 x 10.1 x 9.3 x 11.4 x 8.7 x 8.2 x 6.2% 7.8% 9.0% 5.7 x 8.6 x 11.5 x 7.9%
U.S.AT&T 6.3 x 5.9 x 6.1 x 12.8 x 11.8 x 12.6 x 14.1 x 13.7 x 14.8 x 4.3% 6.0% 5.5% 6.0 x 14.8 x 12.3 x 5.6%Comcast Corp. 8.7 x 7.7 x 7.2 x 12.7 x 11.3 x 10.4 x 21.4 x 18.1 x 15.1 x 5.7% 5.9% 6.9% 7.5 x 16.4 x 10.8 x 6.3%Time Warner Cable 8.0 x 7.4 x 7.2 x 13.4 x 13.3 x 12.6 x 20.5 x 18.0 x 16.5 x 5.2% 5.8% 5.9% 7.1 x 16.0 x 12.4 x 6.1%Verizon Comm. 1 7.4 x 7.2 x 6.8 x 12.6 x 11.1 x 10.3 x 17.2 x 13.8 x 12.5 x 6.7% 7.1% 7.9% 6.9 x 14.2 x 11.0 x 6.3%
Cap Wgt Avg 7.4 x 6.9 x 6.7 x 12.7 x 11.5 x 11.3 x 17.4 x 15.1 x 14.2 x 5.5% 6.3% 6.7% 6.8 x 15.1 x 11.5 x 6.0%
March 28, 2014
* Includes minority interest, working capital deficit, and tax shields.** Note: AMX and NIHD are also covered by Andres Coello1 EV and valuation metrics are pro-forma Verizon Wireless transaction2 BCE, BA, QBR, RCI, T, T.N, TWC, CMCSA, and VZ FCF yields are fully taxed. BA, BCE, MBT, T.TO, TWC, and VZ FCF yields include voluntary pension contributions. AMX excludes acquisition of KPN and Telekom Austria stakes3 Using NTM estimates, one year forward4 EBITDA includes wireless equipment subsidies5 EBITDA and Cash EBIT represents QBR's proportionate share of TVA and QMI
Normalized Adjusted Earnings used. BA EPS excludes customer relationship amortization expense.U.S. and International companies stated in US$Sources: Scotiabank GBM estimates, Company reports, Factset
** Note: AMX and NIHD are also covered by Andres Coello March 28, 20141 EBITDA, Cash EBIT and EPS includes restructuring. Page 2 of 32 Figures are pro forma sale of Portugal operation. Growth rates except EPS are pro forma Atlantic Broadband and Peer 1 acquisitions.3 EBITDA includes deferred charges.4 EBITDA includes wireless equipment subsidies (which are capitalized by MTS but not by its peers) and adjusted for IAS19 adoption. EBITDA growth rates before wireless SAC but include restructuring.5 EBITDA and Cash EBIT represents QBR's proportionate share of TVA and QMI6 Proportionate FCF. BCE, BA, QBR, RCI, T, T.N, TWC, CMCSA, VZ figures are fully taxed. AMX F12 figure excludes acquisition of KPN and Telekom Austria stakes.7 BCE, Bell Aliant, TELUS, MBT, SJR, TWC, and VZ growth rates exclude voluntary pension contributions.
Normalized Adjusted Earnings used. BA EPS excludes customer relationship amortization expense.U.S. and International companies stated in US$Sources: Scotiabank GBM estimates, Company reports, Factset
CanadianBCE Inc. 17.5% 17.4% 17.1% 16.6% 16.7% 16.7% 2.7 x 2.5 x 2.5 x 20,588 20,305 20,304Bell Aliant 20.7% 20.6% 17.5% 22.3% 22.7% 22.5% 2.5 x 2.7 x 2.8 x 3,157 3,281 3,298Cogeco Cable 1 24.1% 22.1% 19.9% 22.6% 24.4% 23.5% 3.6 x 3.2 x 2.8 x 2,866 2,830 2,555Manitoba Tel 18.1% 18.4% 18.0% 18.9% 21.2% 20.8% 1.7 x 1.6 x 1.5 x 835 814 779Quebecor Inc. 15.0% 16.9% 15.1% 15.4% 15.5% 15.4% 3.1 x 3.1 x 2.8 x 4,584 4,684 4,445Rogers Comm. 17.6% 17.7% 17.7% 14.9% 15.3% 15.3% 2.2 x 2.8 x 2.8 x 10,967 14,131 14,598Shaw Comm. 2 17.1% 20.0% 17.9% 16.6% 13.9% 14.4% 2.2 x 2.1 x 1.9 x 4,546 4,503 4,168TELUS Corp. 18.5% 18.4% 17.9% 15.8% 15.6% 15.9% 1.9 x 2.1 x 2.2 x 7,552 9,179 9,799
Cap Wgt Avg 18.0% 18.3% 17.5% 16.5% 16.4% 16.5% 2.4 x 2.5 x 2.4 x
LatAm **AMX 16.7% 16.3% 15.5% 12.3% 13.0% 13.4% 1.6 x 1.6 x 1.5 x 33,300 33,146 33,326NII Holdings, Inc. 20.1% 8.9% 6.5% 15.4% 12.9% 10.6% 12.4 x 7.2 x 5.1 x 4,373 5,310 5,926
Wgt Avg 17.0% 16.1% 14.9% 13.1% 13.4% 13.6% 1.7 x 1.6 x 1.5 x
U.S.AT&T 16.3% 16.0% 16.0% 14.3% 14.2% 14.5% 1.7 x 1.7 x 1.8 x 71,449 73,472 73,563Comcast Corp. 10.2% 10.6% 10.3% 12.2% 11.9% 11.2% 2.2 x 1.9 x 1.6 x 46,129 42,377 40,121Time Warner Cable 14.5% 16.2% 15.7% 14.8% 14.8% 14.8% 3.1 x 3.1 x 3.1 x 24,527 25,863 26,693Verizon Comm. 3 13.8% 13.7% 13.3% 13.8% 13.5% 13.1% 1.5 x 2.2 x 2.0 x 38,697 97,986 91,906
Cap Wgt Avg 13.8% 13.9% 13.7% 13.6% 13.4% 13.2% 1.8 x 2.0 x 1.9 x
** Note: AMX and NIHD are also covered by Andres Coello March 28, 20141 F12 pro forma sale of Portugal operation. F13 pro forma Atlantic Broadband and Peer 1 acquisitions. Page 3 of 32 Capex excludes deferred charges.3 Net debt and leverage are pro-forma Verizon Wireless transaction.
U.S. and International companies stated in US$Sources: Scotiabank GBM estimates, Company reports, Factset
Converging Networks Week of March 31, 2014
18
Net Asset Valuations Pricing in this section as at March 28, 2014.
Exhibit 21: AT&T Net Asset Valuation
Source: Company reports; FactSet; Scotiabank GBM estimates.
(US$ millions, except per share data) Current 1-Year TargetShare Price $35.07 $35.00Consolidated EV/cash EBIT Multiple 12.0 x 12.2 xEV/EBITDA Multiple 6.0 x 6.0 xP/E Multiple 14.0 x 14.8 xFCF Yield (NTM, fully taxed) 5.9% 5.7%1-Year ROR 5.1%
Current 1-Year TargetEBITDA EV/EBITDA Value EV/EBITDA Value
2012 2013E 2014E 2015E 2016E Multiple Value+ per Share Multiple Value+ per Share
Wireline 18,408 17,176 16,095 14,807 14,870 4.25 x 67,127 $12.71 4.00 x 59,292 $11.44 Wireless 23,595 25,391 27,070 26,968 26,780 7.00 x 189,312 $35.85 7.00 x 188,450 $36.37
Other (692) (1,277) (776) (775) (773) 6.00 x (4,653) -$0.88 6.00 x (4,646) -$0.90Total Telecom 41,311 41,290 42,389 41,001 40,877 251,787 $47.69 243,096 $46.91
Other Tax Shields (discounted 25%) $0.00 0.0 $0.00
Equity investments 8,235 $1.56 8,235 $1.59 Total Other 8,235 $1.56 8,235 $1.59
Total Gross Asset Value 260,022 $49.25 251,331 $48.50Less:Total Net Debt (Cash) 74,852 $14.18 73,494 $14.18
Less: Bell Net Debt 2 15,693 $20.23 15,217 $19.61Total Bell Canada 35,823 $46.17 37,026 $47.72
Other/CorpBell Aliant (BA) * 100 M 27.03 2,713 $3.50 $27.00 2,710 $3.49Total Gross Asset Value 38,536 $49.67 39,736 $51.21
Less:Bell working capital deficit 507 $0.65 393 $0.51Bell Preferred Shares (50%) 1,698 $2.19 1,698 $2.19
Total Net Debt (Cash) 2,204 $2.84 2,090 $2.69Plus: NPV of Tax shield 484 $0.62 - $0.00Less: 30% Discount on Inukshuk - $0.00 - $0.00
Shares Outstanding (M) 775.9 775.9
Net Asset Value 36,816 $47.45 37,646 $48.52
Target Price Calculation (Average of NAV and DCF) $48.29* Reflects Bell Canada's proportionate interest in Bell Aliant.1 EBITDA estimates are consolidated. Ownership % reflects Bell's proportionate share.2 Reflects Bell's proportionate share of CTVgm debt.+ Enterprise Values calculated using 12 month forward values.
Converging Networks Week of March 31, 2014
20
Exhibit 23: Bell Aliant Net Asset Valuation
Source: FactSet; company reports; Scotiabank GBM estimates.
(C$ millions, except per share data) Current 1-Year Target
Bell Aliant Share Price $27.03 $27.00EV/EBITDA multiple (NTM) 7.7 x 7.9 xP/E multiple (NTM) - fully taxed 1 18.1 x 16.0 xFCF yield (NTM) - fully taxed 2 5.2% 6.8%FCF yield (NTM) - actual tax 2 5.4% 6.8%Cash EBIT (NTM) multiple 13.2 x 12.9 x1-Year ROR 6.9%
EBITDA 3 EV/EBITDA Value EV/EBITDA Value2011 2012 2013E 2014E 2015E 2016E Multiple Value+ per Share Multiple Value+ per Share
TelecomTelecom 1,290 1,291 1,274 1,229 1,198 1,215 7.73 x 9,446 $41.23 7.25 x 8,717 $38.03
+ Enterprise Value calculated using 12 month forward EBITDA 1 P/E excludes purchase price amortization expense of ~$80M per annum, pre-tax 2 Includes $65M-60M one-time cash tax payment in 2014 for change in partnership income deferral rules. 3 EBITDA includes restructuring and pension current service cost. 4 Pension solvency deficit (~$700M in early F13) not included as pension cost has been included in EBITDA. 5 Includes non-cash working capital deficit and preferred shares accorded 50% equity treatment.
Current 1-Year Target
Converging Networks Week of March 31, 2014
21
Exhibit 24: Comcast Corp. Net Asset Valuation
Source: FactSet; company reports; Scotiabank GBM estimates.
(US$ millions, except per share data) Current 1-Year TargetShare Price $49.34 $62.00Cons. EV/EBITDA Multiple 7.5 x 8.1 xP/E Multiple 17.0 x 18.0 xFCF Yield (NTM, cons.) 6.1% 5.7%Cons. EV/Cash EBIT Multiple 11.0 x 11.6 x1-Year ROR 27.5%
Current 1-Year TargetEBITDA EV/EBITDA Value EV/EBITDA Value
2012 2013E 2014E 2015E 2016E Multiple Value+ per Share Multiple Value+ per Share
Cable Communications 16,255 17,205 18,219 19,197 20,273 6.80 x 125,562 $47.35 7.50 x 145,972 $56.00NBCUniversal (100%) 4,107 4,732 5,157 5,683 6,146 10.00 x 52,869 $19.94 10.00 x 57,978 $22.24Corporate, Other and Eliminations -385 -503 -537 -564 -599 7.00 x (3,807) -$1.44 7.00 x (4,008) -$1.54
Total 19,977 21,434 22,839 24,316 25,819 174,623 $65.85 199,943 $76.71
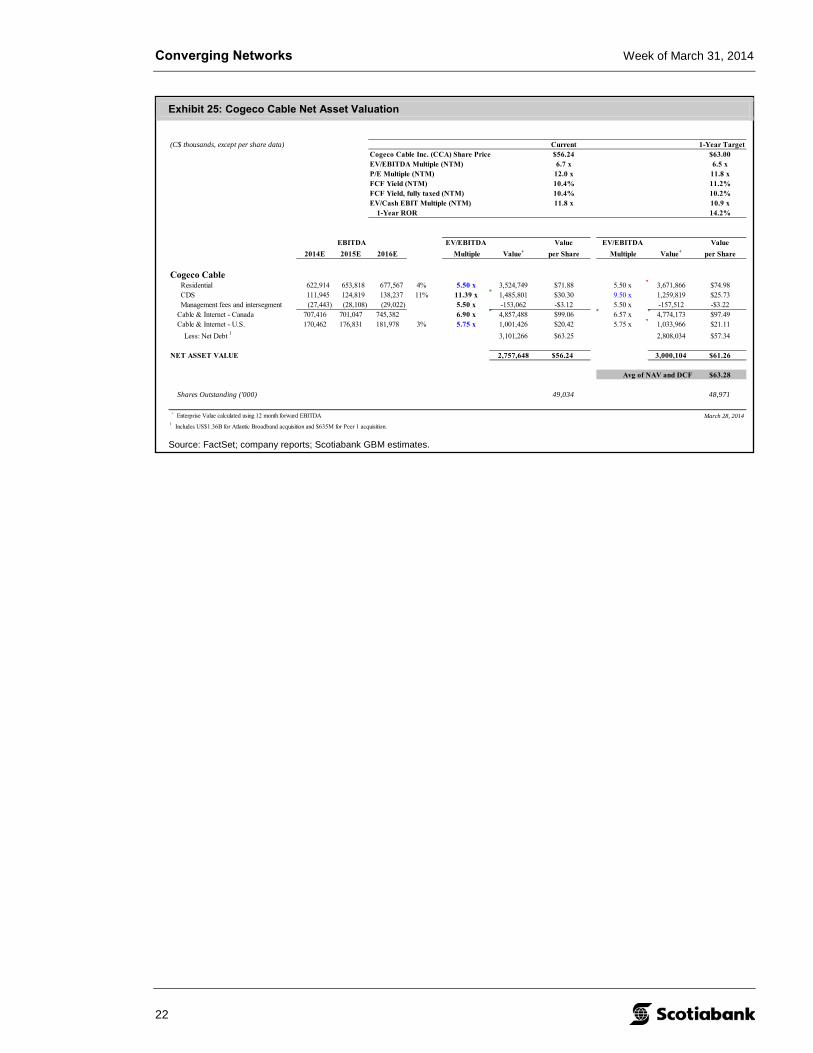
Source: FactSet; company reports; Scotiabank GBM estimates.
(C$ thousands, except per share data) Current 1-Year TargetCogeco Cable Inc. (CCA) Share Price $56.24 $63.00EV/EBITDA Multiple (NTM) 6.7 x 6.5 xP/E Multiple (NTM) 12.0 x 11.8 xFCF Yield (NTM) 10.4% 11.2%FCF Yield, fully taxed (NTM) 10.4% 10.2%EV/Cash EBIT Multiple (NTM) 11.8 x 10.9 x
1-Year ROR 14.2%
EV/EBITDA Value EV/EBITDA Value2014E 2015E 2016E Multiple Value+ per Share Multiple Value+ per Share
Cogeco CableResidential 622,914 653,818 677,567 4% 5.50 x 3,524,749 $71.88 5.50 x 3,671,866 $74.98CDS 111,945 124,819 138,237 11% 11.39 x 1,485,801 $30.30 9.50 x 1,259,819 $25.73Management fees and intersegment (27,443) (28,108) (29,022) 5.50 x -153,062 -$3.12 5.50 x -157,512 -$3.22
Cable & Internet - Canada 707,416 701,047 745,382 6.90 x 4,857,488 $99.06 6.57 x 4,774,173 $97.49Cable & Internet - U.S. 170,462 176,831 181,978 3% 5.75 x 1,001,426 $20.42 5.75 x 1,033,966 $21.11
Less: Net Debt 1 3,101,266 $63.25 2,808,034 $57.34
NET ASSET VALUE 2,757,648 $56.24 3,000,104 $61.26
Avg of NAV and DCF $63.28
Shares Outstanding ('000) 49,034 48,971
+ Enterprise Value calculated using 12 month forward EBITDA1 Includes US$1.36B for Atlantic Broadband acquisition and $635M for Peer 1 acquisition.
March 28, 2014
EBITDA
Converging Networks Week of March 31, 2014
23
Exhibit 26: Manitoba Telecom Services Net Asset Valuation
Source: FactSet; company reports; Scotiabank GBM estimates.
(C$ thousands, except per share data) Current 1-Year TargetShare Price $30.23 $31.00Consolidated EV/EBITDA Mult. 2 5.6 x 5.9 xConsolidated P/E Mult. 18.3 x 17.9 xFCF Yield (NTM) 6.3% 5.9%EV/Cash EBIT Mult. 2 13.5 x 13.7 x1-Year ROR 8.2%
EBITDA EV/EBITDA Value EV/EBITDA Value2013E 2014E 2015E 2016E Multiple Value+ per Share Multiple Value+ per Share
Telecom MTS (Manitoba) 1 399,400 403,657 403,715 399,526 6.02 x 2,431,153 $34.58 6.25 x 2,516,740 $34.47 Allstream (National) 79,700 106,123 106,349 111,112 4.00 x 424,716 $6.04 4.00 x 430,112 $5.89 Total Telecom 479,100 509,780 510,064 510,638 2,855,869 $40.62 2,946,851 $40.36
Tax Shield and Legal Liab Tax Shield Value 305,000 $4.34 247,978 $3.40 Pension Cost 3 $0.00 0 $0.00
Total Gross Asset Value 3,160,869 $44.96 3,194,829 $43.75Less:Total Net Debt (Cash) 1,035,700 $14.73 987,884 $13.53
FD Shares Outstanding ('000) 70,300 73,019
NET ASSET VALUE 2,125,169 $30.23 2,206,945 $30.22
DCF Value $32.25
Average of DCF and NAV $31.24
1 Net of wireless deferred costs and restructuring. March 28, 20142 Excludes tax shield value.3 Pension service costs are included in EBITDA and hence deficit is not included in the NAV calculation. However, on a take-out of the MTS unit, we believe pension solvency deficit of approx. $300M, reflecting all 2013 voluntary contributions, will have to be included.+ Enterprise Values calculated using 12 month forward values
Current 1-Year Target
Converging Networks Week of March 31, 2014
24
Exhibit 27: Quebecor Inc. Net Asset Valuation
Source: FactSet; company reports; Scotiabank GBM estimates.
C$ thousands, except per share data Current 1-Year TargetShare Price $26.90 $33.50Prop. EV/EBITDA Multiple 6.9 x 6.6 xP/E Multiple 14.9 x 15.6 xFCF Yield (NTM) 1 5.9% 6.1%Prop. EV/cash EBIT Multiple 13.5 x 12.1 xFCF Yield (NTM) fully taxed 2 5.9% 6.1%1-Year ROR 24.9%
Current 1-yr TargetShares EV/EBITDA Value EV/EBITDA Value
2012 2013E 2014E 2015E 2016E Owned Multiple Value+ per share Multiple Value+ per share
Cable (Videotron, including wireless) 1,213,400 1,291,100 1,363,085 1,438,884 1,504,095 7.20 x 9,954,919 $68.80 6.75 x 9,821,452 $80.38
Newspapers 3 81,100 84,000 53,116 61,858 65,582 4.0 x 221,121 $1.53 4.0 x 251,119 $2.06
Other (Leisure & Entertainment + NURUN + Portals) 32,800 20,600 19,452 17,905 16,981 5.0 x 95,347 $0.66 5.0 x 88,382 $0.72
TVA gross asset value 35,807 48,100 45,966 49,536 53,345 4.2 x 196,036 $1.35 3.6 x 176,607 $1.45Less: Net debt (cash) + w/c deficit (surplus) (18,378) ($0.13) (35,573) ($0.29)
TVA net asset value 23.8 M $9.02 214,414 $1.48 $9.02 212,180 $1.74
QMI Cons. Gross Asset Value 3 1,359,707 1,450,700 1,489,945 1,578,765 1,652,236 6.9 x 10,467,422 $72.34 6.5 x 10,337,560 $84.60
QBR Corporate 3,400 (6,900) (8,326) (10,582) (12,233) 5.5 x (48,864) ($0.34) 5.5 x (60,448) ($0.49)
FD Shares Outstanding ('000) 144,700 122,189
QBR Net Asset Value 3,892,430 $26.90 3,763,174 $30.80
Average NAV and DCF 33.49
March 28, 2014+ Enterprise Value calculated using 12 month forward values1 Assumes two years of cash taxes (F12 and F13) are paid in 2013.2 Assumes 2012 cash taxes are paid in 2012, not in 2013.3 Includes News Media severance expense.4 24.6% of QMI held by CDP5 Includes $500M of convertible debentures at Quebecor Inc.
EBITDA
Converging Networks Week of March 31, 2014
25
Exhibit 28: Rogers Communications Net Asset Valuation
Source: FactSet; company reports; Scotiabank GBM estimates.
(C$ thousands, except per share data) Current 1-Year TargetShare Price $45.85 $46.00EV/Cash EBIT Multiple (net of tax shield) 12.6 x 13.2 xEV/EBITDA Multiple (net of tax shield) 6.8 x 7.2 xP/E Multiple (NTM) 13.6 x 13.0 xFree Cash Flow Yield (NTM actual tax) 6.3% 6.5%Free Cash Flow Yield (NTM fully taxed) 5.9% 6.3%1-Year ROR 4.4%
Current 1-Year TargetEBITDA Shares EV/EBITDA Mult. Value EV/EBITDA Mult. Value
2012 2013E 2014E 2015E 2016E Owned or Share Price Value* per Share or Share Price Value* per Share
Less:Total Net Debt (Cash) 2 5,147,000 $11.36 4,921,516 $10.71
FD Shares Outstanding ('000) 453,000 459,507
NET ASSET VALUE 11,891,250 $26.25 12,180,331 $26.51
Average (DCF, NAV) 28.78
+ Enterprise Value calculated using 12 month forward values1 Includes equipment subsidies.2 Includes working capital deficit and preferred shares accorded 50% equity treatment.
Current 1-Year Target
March 28, 2014
Converging Networks Week of March 31, 2014
27
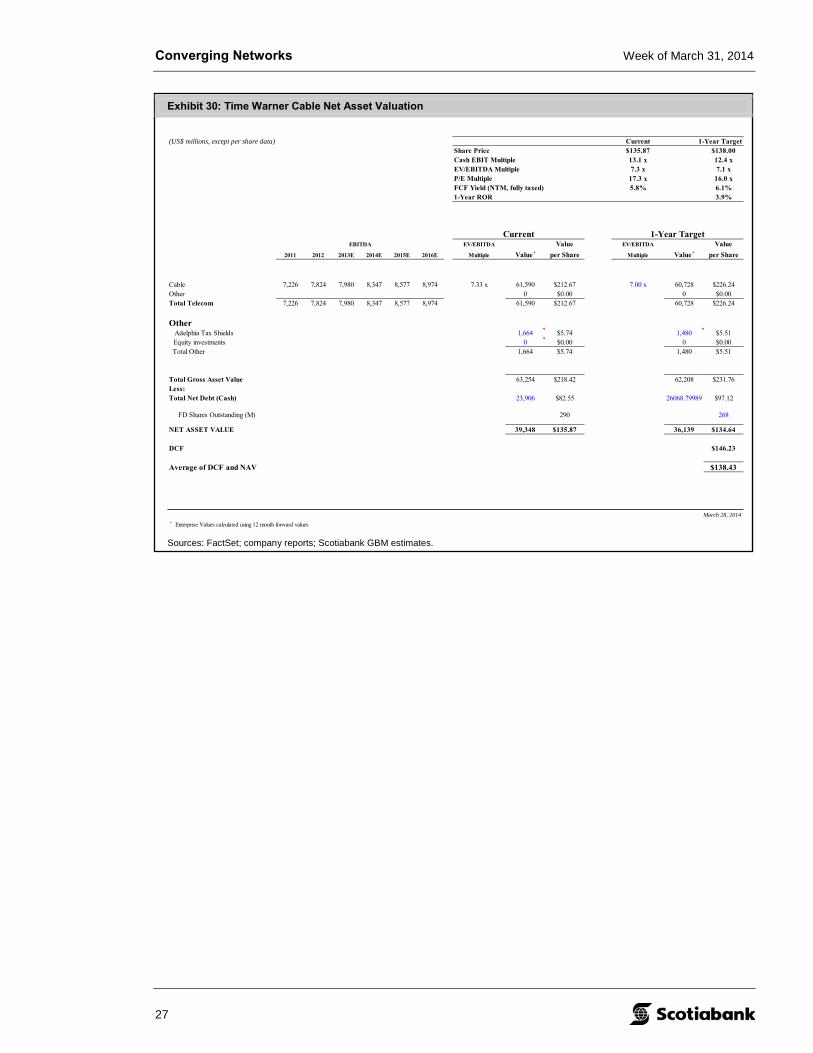
Exhibit 30: Time Warner Cable Net Asset Valuation
Sources: FactSet; company reports; Scotiabank GBM estimates.
(US$ millions, except per share data) Current 1-Year TargetShare Price $135.87 $138.00Cash EBIT Multiple 13.1 x 12.4 xEV/EBITDA Multiple 7.3 x 7.1 xP/E Multiple 17.3 x 16.0 xFCF Yield (NTM, fully taxed) 5.8% 6.1%1-Year ROR 3.9%
Current 1-Year TargetEBITDA EV/EBITDA Value EV/EBITDA Value
2011 2012 2013E 2014E 2015E 2016E Multiple Value+ per Share Multiple Value+ per Share
Sources: FactSet; company reports; Scotiabank GBM estimates.
(C$ millions, except per share data) Current 1-Year TargetShare Price $40.35 $39.00Consolidated EV/Cash EBIT Multiple 16.0 x 14.5 xConsolidated EV/EBITDA Multiple 7.8 x 7.6 xConsolidated P/E Multiple 17.3 x 15.5 xFCF Yield (NTM, fully taxed) 4.3% 5.3%FCF Yield (NTM, actual tax) 4.0% 5.3%1-Year ROR 0.5%
Current 1-Year TargetEV/EBITDA Value EV/EBITDA Value
2013E 2014E 2015E 2016E Multiple Value+ per Share Multiple Value+ per Share
Wireline 1 1,384 1,477 1,544 1,646 7.53 x 11,247 $17.71 6.00 x 9,417 $15.24 Wireless 2,634 2,777 2,942 3,055 8.00 x 22,543 $35.50 8.00 x 23,760 $38.44Total Telecom 4,018 4,254 4,487 4,701 33,790 $53.21 33,177 $53.68
Other Tax Shields (discounted 25%) -52.2 -$0.08 0.0 $0.00
Total Gross Asset Value 33,738 $53.13 33,177 $53.68Less:Total Net Debt (Cash) 2 8,116 $12.78 10,256 $16.59Implied Holding Company Discount 0.0% 0.0 $0.00 0.0% 0.0 $0.00
FD Shares Outstanding (M) 635 618
NET ASSET VALUE 25,622 $40.35 22,921 $37.08
DCF $42.03
Average of DCF and NAV $38.56
1 Excludes pension interest expense and pension return on assets.2 Includes working capital deficit. + Enterprise Values calculated using 12 month forward values
March 28, 2014
Converging Networks Week of March 31, 2014
29
Exhibit 32: Verizon Net Asset Valuation
Sources: FactSet; company reports; Scotiabank GBM estimates.
(US$ millions, except per share data) Current 1-Year TargShare Price $47.42 $55.00EV/Cash EBIT Multiple 10.9 x 11.0 xEV/EBITDA Multiple 6.7 x 6.9 xP/E Multiple 13.4 x 14.2 xFCF Yield (NTM, fully taxed) 7.3% 6.3%1-Year ROR 20.6%
Current 1-Year TargetEBITDA EV/EBITDA Value EV/EBITDA Value
2011A 2012 2013 2014E 2015E 2016E Multiple Value+ per Share Multiple Value+ per Share
Wireline 9,417 8,803 8,700 8,789 8,867 8,934 2.59 x 22,556 $5.45 4.50 x 39,976 $9.66Wireless 26,489 29,728 34,199 35,984 37,874 39,344 7.75 x 282,504 $68.30 7.50 x 286,783 $69.28Other -576 -746 -835 -600 -600 -600 6.60 x -3,960 -$0.96 6.60 x -3,960 -$0.96
America Movil AMX M4, T BCE Inc. BCE B26, B8, G, S, T, U Bell Aliant Inc. BA G, I, T, U Cogeco Cable Inc. CCA G, N1, T, U Manitoba Telecom Services Inc. MBT B9, G, I, S, T, U NII Holdings, Inc. NIHD M4, T Quebecor Inc. QBR.B I, T Rogers Communications Inc. RCI.B G, N1, S, T, U Shaw Communications Inc. SJR.B G, S, T, U TELUS Corporation T G, I, J, T, U Verizon Communications Inc. VZ H.P.230
The following analysts certify that (1) the views expressed in this report in connection with securities or issuers they analyze accurately reflect their personal views and (2) no part of their compensation was, is, or will be directly or indirectly, related to the specific recommendations or views expressed by them in this report: Andres Coello, and Jeff Fan.
This research report was prepared by employees of Scotia Capital Inc. and/or its affiliates who have the title of Analyst.
All pricing of securities in reports is based on the closing price of the securities’ principal marketplace on the night before the publication date, unless otherwise explicitly stated.
All Equity Research Analysts report to the Head of Equity Research. The Head of Equity Research reports to the Managing Director, Head of Institutional Equity Sales, Trading and Research, who is not and does not report to the Head of the Investment Banking Department. Scotiabank, Global Banking and Markets has policies that are reasonably designed to prevent or control the sharing of material non-public information across internal information barriers, such as between Investment Banking and Research.
The compensation of the research analyst who prepared this report is based on several factors, including but not limited to, the overall profitability of Scotiabank, Global Banking and Markets and the revenues generated from its various departments, including investment banking. Furthermore, the research analyst's compensation is charged as an expense to various Scotiabank, Global Banking and Markets departments, including investment banking. Research Analysts may not receive compensation from the companies they cover.
Non-U.S. analysts may not be associated persons of Scotia Capital (USA) Inc. and therefore may not be subject to FINRA Rule 2711 restrictions on communications with subject company, public appearances and trading securities held by the analysts.
For Scotiabank, Global Banking and Markets Research analyst standards and disclosure policies, please visit http://www.gbm.scotiabank.com/disclosures
Scotiabank, Global Banking and Markets Research, 40 King Street West, 33rd Floor, Toronto, Ontario, M5H 1H1.
* Legend
B26 Thomas C. O'Neill is a director of BCE Inc. and is a director of The Bank of Nova Scotia.
B8 Ronald Brenneman is a director of BCE Inc and is a director of The Bank of Nova Scotia.
B9 N. Ashleigh Everett is a director of Manitoba Telecom Services Inc. and is a director of The Bank of Nova Scotia.
G Scotia Capital (USA) Inc. or its affiliates has managed or co-managed a public offering in the past 12 months.
H.P.230 Jay Oduwole, a member of Jay Oduwole's household and/or an account related to Jay Oduwole own securities of this issuer.
I Scotia Capital (USA) Inc. or its affiliates has received compensation for investment banking services in the past 12 months.
J Scotia Capital (USA) Inc. or its affiliates expects to receive or intends to seek compensation for investment banking services in the next 3 months.
M4 Andres Coello, an analyst, prepared this report and is an employee of the Research Department of
Scotiabank Inverlat, S.A., Institucion de Banca Multiple which forms a part of Grupo Financiero Scotiabank Inverlat.
N1 Scotia Capital (USA) Inc. had an investment banking services client relationship during the past 12 months.
S Scotia Capital Inc. and its affiliates collectively beneficially own in excess of 1% of one or more classes of the issued and outstanding equity securities of this issuer.
T The Fundamental Research Analyst/Associate has visited material operations of this issuer.
U Within the last 12 months, Scotia Capital Inc. and/or its affiliates have undertaken an underwriting liability with respect to equity or debt securities of, or have provided advice for a fee with respect to, this issuer.
General Disclosures This report has been prepared by analysts who are employed by the Research Department of Scotiabank, Global Banking and Markets. Scotiabank, together with “Global Banking and Markets,” is a marketing name for the global corporate and investment banking and capital markets businesses of The Bank of Nova Scotia and certain of its affiliates in the countries where they operate, including Scotia Capital Inc.
All other trademarks are acknowledged as belonging to their respective owners and the display of such trademarks is for informational use only.
Scotiabank, Global Banking and Markets Research produces research reports under a single marketing identity referred to as “Globally-branded research” under U.S. rules. This research is produced on a single global research platform with one set of rules which meet the most stringent standards set by regulators in the various jurisdictions in which the research reports are produced. In addition, the analysts who produce the research reports, regardless of location, are subject to one set of policies designed to meet the most stringent rules established by regulators in the various jurisdictions where the research reports are produced.
Scotia Capital Inc. or an affiliate thereof owns or controls an equity interest in TMX Group Limited and in excess of 1% of the issued and outstanding equity securities thereof. In addition, an affiliate of Scotia Capital Inc. is a lender to TMX Group Limited under its credit facilities. As such, Scotia Capital Inc. may be considered to have an economic interest in TMX Group Limited.
This report is provided to you for informational purposes only. This report is not, and is not to be construed as, an offer to sell or solicitation of an offer to buy any securities and/or commodity futures contracts.
The securities mentioned in this report may neither be suitable for all investors nor eligible for sale in some jurisdictions where the report is distributed.
The information and opinions contained herein have been compiled or arrived at from sources believed reliable, however, Scotiabank, Global Banking and Markets makes no representation or warranty, express or implied, as to their accuracy or completeness.
Scotiabank, Global Banking and Markets has policies designed to make best efforts to ensure that the information contained in this report is current as of the date of this report, unless otherwise specified.
Any prices that are stated in this report are for informational purposes only. Scotiabank, Global Banking and Markets makes no representation that any transaction may be or could have been effected at those prices.
Any opinions expressed herein are those of the author(s) and are subject to change without notice and may differ or be contrary from the opinions expressed by other departments of Scotiabank, Global Banking and Markets or any of its affiliates.
Neither Scotiabank, Global Banking and Markets nor its affiliates accepts any liability whatsoever for any direct or consequential loss arising from any use of this report or its contents.
Equity research reports published by Scotiabank, Global Banking and Markets are available electronically via: Bloomberg, Thomson Financial/First Call - Research Direct, Reuters, Capital IQ, and FactSet. Institutional clients with questions regarding distribution of equity research should contact us at 1-800-208-7666.
This report and all the information, opinions, and conclusions contained in it are protected by copyright. This report may not be reproduced in whole or in part, or referred to in any manner whatsoever, nor may the information, opinions, and conclusions contained in it be referred to without the prior express consent of Scotiabank, Global Banking and Markets.
Additional Disclosures Canada: This report is distributed by Scotia Capital Inc., a subsidiary of The Bank of Nova Scotia. Scotia Capital Inc. is a member of the Canadian Investor Protection Fund and the Investment Industry Regulatory Organization of Canada.
Chile: This report is distributed by Scotia Corredora de Bolsa Chile S.A., a subsidiary of The Bank of Nova Scotia.
Hong Kong: This report is distributed by The Bank of Nova Scotia Hong Kong Branch, which is authorized by the Securities and Future Commission to conduct Type 1, Type 4 and Type 6 regulated activities and regulated by the Hong Kong Monetary Authority.
Mexico: This report is distributed by Scotia Inverlat Casa de Bolsa S.A. de C.V., a subsidiary of the Bank of Nova Scotia.
Peru: This report is distributed by Scotia Sociedad Agente de Bolsa S.A., a subsidiary of The Bank of Nova Scotia.
Singapore: This report is distributed by The Bank of Nova Scotia Asia Limited, a subsidiary of The Bank of Nova Scotia. The Bank of Nova Scotia Asia Limited is authorised and regulated by the Monetary Authority of Singapore, and exempted under Section 99(1)(a),and (b), (c) and (d) of the Securities and Futures Act to conduct regulated activities.
United Kingdom and the rest of Europe: Except as otherwise specified herein, this report is distributed by Scotiabank Europe plc, a subsidiary of The Bank of Nova Scotia. Scotiabank Europe plc is authorized by the Prudential Regulation Authority (PRA) and regulated by the PRA and the Financial Conduct Authority (FCA). Scotiabank Europe plc complies with all FCA requirements concerning research and the associated disclosures and these are indicated on the research where applicable.
United States: This report is distributed by Scotia Capital (USA) Inc., a subsidiary of Scotia Capital Inc., and a registered U.S. broker-dealer. All transactions by a U.S. investor of securities mentioned in this report must be effected through Scotia Capital (USA) Inc.
Non-U.S. investors wishing to effect a transaction in the securities discussed in this report should contact a Scotiabank, Global Banking and Markets entity in their local jurisdiction unless governing law permits otherwise.
Definition of Scotiabank, Global Banking and Markets Equity Research Ratings &
Risk Rankings
We have a four-tiered rating system, with ratings of Focus Stock, Sector Outperform, Sector Perform, and Sector Underperform. Each analyst assigns a rating that is relative to his or her coverage universe or an index identified by the analyst that includes, but is not limited to, stocks covered by the analyst.
Our risk ranking system provides transparency as to the underlying financial and operational risk of each stock covered. Statistical and judgmental factors considered are: historical financial results, share price volatility, liquidity of the shares, credit ratings, analyst forecasts, consistency and predictability of earnings, EPS growth, dividends, cash flow from operations, and strength of balance sheet. The Director of Research and the Supervisory Analyst jointly make the final determination of all risk rankings.
The rating assigned to each security covered in this report is based on the Scotiabank, Global Banking and Markets research analyst’s 12-month view on the security. Analysts may sometimes express to traders, salespeople and certain clients their shorter-term views on these securities that differ from their 12-month view due to several factors, including but not limited to the inherent volatility of the marketplace.
Ratings
Focus Stock (FS) The stock represents an analyst’s best idea(s); stocks in this category are expected to significantly outperform the average 12-month total return of the analyst’s coverage universe or an index identified by the analyst that includes, but is not limited to, stocks covered by the analyst.
Sector Outperform (SO) The stock is expected to outperform the average 12-month total return of the analyst’s coverage universe or an index identified by the analyst that includes, but is not limited to, stocks covered by the analyst.
Sector Perform (SP) The stock is expected to perform approximately in line with the average 12-month total return of the analyst’s coverage universe or an index identified by the analyst that includes, but is not limited to, stocks covered by the analyst.
Sector Underperform (SU) The stock is expected to underperform the average 12-month total return of the analyst’s coverage universe or an index identified by the analyst that includes, but is not limited to, stocks covered by the analyst.
Other Ratings Tender – Investors are guided to tender to the terms of the takeover offer.
Under Review – The rating has been temporarily placed under review, until sufficient information has been received and assessed by the analyst.
Risk Rankings
Low Low financial and operational risk, high predictability of financial results, low stock volatility.
Medium Moderate financial and operational risk, moderate predictability of financial results, moderate stock volatility.
High High financial and/or operational risk, low predictability of financial results, high stock volatility.
Speculative Exceptionally high financial and/or operational risk, exceptionally low predictability of financial results, exceptionally high stock volatility. For risk-tolerant investors only.
Scotiabank, Global Banking and Markets Equity Research Ratings Distribution*
Distribution by Ratings and Equity and Equity-Related Financings*
Percentage of companies covered by Scotiabank, Global Banking and Markets Equity Research within each rating category.
Percentage of companies within each rating category for which Scotiabank, Global Banking and Markets has undertaken an underwriting liability or has provided advice for a fee within the last 12 months.
Source: Scotiabank GBM.
For the purposes of the ratings distribution disclosure FINRA requires members who use a ratings system with terms different than “buy,” “hold/neutral” and “sell,” to equate their own ratings into these categories. Our Focus Stock, Sector Outperform, Sector Perform, and Sector Underperform ratings are based on the criteria above, but for this purpose could be equated to strong buy, buy, neutral and sell ratings, respectively.
Scotiabank, Global Banking and Markets Equity Research Team HEAD OF EQUITY RESEARCH John Henderson, P.Eng. .............................. (416) 945-7393 [email protected] HEAD OF BUSINESS MANAGEMENT Erika Osmond ............................................... (416) 945-4529 [email protected] CONSUMER DISCRETIONARY Cable Jeff Fan, CPA, CA, CFA ............................... (416) 863-7780 [email protected] Media Paul Steep .................................................... (416) 945-4310 [email protected] CONSUMER STAPLES Retailing Patricia Baker, Ph.D. .................................... (514) 287-4535 [email protected] ENERGY Oil & Gas – Integrated and E&P Jason Bouvier, CFA...................................... (403) 213-7345 [email protected] Oil & Gas – International E&P Gavin Wylie ................................................... (403) 213-7333
PORTFOLIO STRATEGY Vincent Delisle, CFA ..................................... (514) 287-3628 [email protected] Hugo Ste-Marie, CFA ................................... (514) 287-4992 [email protected] REAL ESTATE & REITS Mario Saric, CPA, CA, CFA .......................... (416) 863-7824 [email protected] Pammi Bir, CPA, CA, CFA ........................... (416) 863-7218 [email protected] SPECIAL SITUATIONS Anthony Zicha ............................................... (514) 350-7748 [email protected]
George Doumet ........................................... (514) 350-7788 [email protected] TELECOMMUNICATION SERVICES Jeff Fan, CPA, CA, CFA ............................... (416) 863-7780 [email protected] ECONOMICS Warren Jestin ................................................ (416) 866-6136 Aron Gampel ................................................. (416) 866-6259 Pablo Bréard ................................................. (416) 862-3876 Derek Holt ..................................................... (416) 863-7707 Patricia Mohr ................................................. (416) 866-4210 Mary Webb .................................................... (416) 866-4202 PORTFOLIO ADVISORY GROUP (PAG) (SCOTIAMCLEOD) Chief Investment Officer & Co-Head of PAG Shane Jones ................................................. (416) 945-5332 Co-Head of PAG: Stewart Hunt ................................................. (416) 863-2855 Trading Elliott Fishman .............................................. (416) 863-7860 Dave Stephens ............................................. (416) 862-3115 Tara Quinn .................................................... (416) 863-7149 Portfolio Manager: Shane Jones ................................................. (416) 945-5332 Caroline Escott, CFA ................................... (416) 945-5332 Equity Advisory Himalaya Jain, CFA ...................................... (416) 863-7604 Marco Martin ................................................ (416) 863-7921 Warren Hastings ........................................... (416) 865-6354 Fixed Income Advisory Andrew Mystic ............................................... (416) 863-7474 INSTITUTIONAL EQUITY SALES & TRADING Toronto .......................................................... (416) 863-2885 1-888-251-4484
Montreal ........................................................ (514) 287-4513
New York.................................................. (212) 225-6605/04 1-800-262-4060
Boston ........................................................... (617) 330-1477
Mexico City, MX ................................ 011-52-55-9179-5181 (Scotia Inverlat Casa de Bolsa)
TM Trademark of The Bank of Nova Scotia. Used under license, where applicable. Scotiabank, together with “Global Banking and Markets”, is a
marketing name for the global corporate and investment banking and capital markets businesses of The Bank of Nova Scotia and certain of its affiliates in the countries where they operate, including Scotia Capital Inc. Scotia Capital Inc. is a Member of the Canadian Investor Protection Fund.