53
Scotland Sector Scorecard analysis report 2019 Cover photography Report produced by
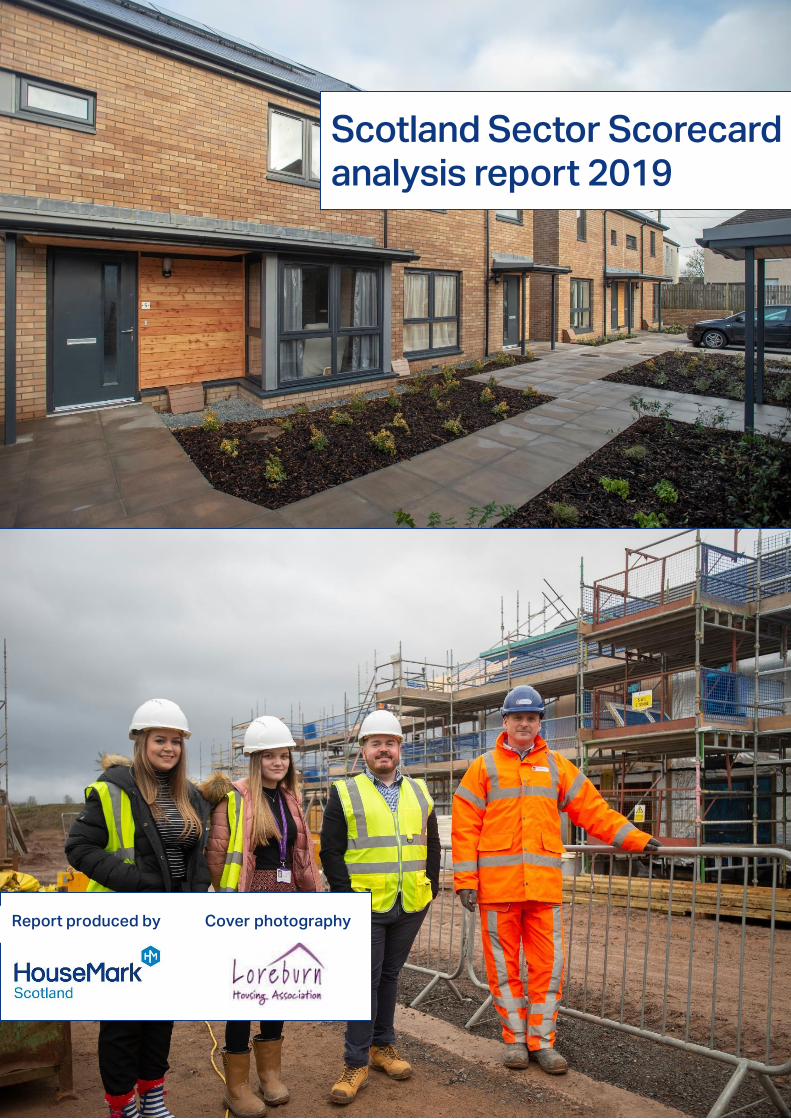
Scotland Sector Scorecard
analysis report 2019
Cover photography
Report produced by

Sector Scorecard Scotland Analysis Report 2019
2
Contents page
Contents page ........................................................................................................................................................................... 2
Foreword ....................................................................................................................................................................................... 4
Executive summary ................................................................................................................................................................. 6
The Sector Scorecard ...................................................................................................................................................... 6
Key messages ....................................................................................................................................................................... 6
National medians ................................................................................................................................................................. 7
Introduction ...............................................................................................................................................................................10
What is the housing association sector? ...........................................................................................................10
Context ...................................................................................................................................................................................10
About the Sector Scorecard .....................................................................................................................................10
Implementation ..................................................................................................................................................................10
Method of Analysis ..........................................................................................................................................................11
Business Health ......................................................................................................................................................................12
Operating margin (overall) ...........................................................................................................................................12
Operating margin (social housing lettings) ........................................................................................................14
EBITDA MRI (as % interest) .........................................................................................................................................15
Development (Capacity & Supply) ...............................................................................................................................17
New Supply delivered: absolute (social and non-social) ...........................................................................17
New supply delivered % (social) ...............................................................................................................................17
New supply delivered % (non-social) ....................................................................................................................18
Gearing ...................................................................................................................................................................................18
Outcomes Delivered ............................................................................................................................................................21
Customer satisfaction (GN & OP) ............................................................................................................................21
Reinvestment % ................................................................................................................................................................22
Investment in communities ........................................................................................................................................24
Effective Asset Management .........................................................................................................................................26
Return on capital employed (ROCE) ......................................................................................................................26
Occupancy ...........................................................................................................................................................................27
Ratio of responsive repairs to planned maintenance .................................................................................29
Operating Efficiencies ........................................................................................................................................................31
Headline social housing cost per unit ..................................................................................................................31
Rent collected as % of rent due (GN) ....................................................................................................................33
Overhead costs as a percentage of turnover .................................................................................................35
Conclusions ..............................................................................................................................................................................37
Appendices ...............................................................................................................................................................................38
Sector Scorecard Scotland Analysis Report 2019
3
Acknowledgements
Report author:
Emma Holgate, Research Analyst, HouseMark
With support from:
Kirsty Wells, Head of HouseMark Scotland
John Wickenden, Research Manager, HouseMark
Emily Cullingham, Communications Manager, HouseMark
Thank you to Loreburn Housing Association for permission to use their photography on the
front cover.
Sector Scorecard Scotland Analysis Report 2019
4
Foreword
Lorraine Usher, Chief Executive, Loreburn Housing Association and Helen
Murdoch, Chief Executive, Hanover (Scotland) Housing Association
2019 is the third year that housing associations in Scotland have participated on a voluntary
basis in the Sector Scorecard project. During that time there has been growing political
uncertainty over Brexit, increasing poverty as a result of welfare reform and new regulatory
and policy requirements for housing associations to respond to. More than ever, the role
played by housing associations in our local communities is vital to support tenants and
others to live in safe, warm and affordable homes.
2018-19 Social Housing Charter data shows that the average rent increase for all social
landlords in Scotland was 3.7% This increased from 2.4% in 2017-18 and is the highest rate
of increase since recording of Charter data began in 2013. At the same time, rent arrears
and void rates have also increased in the sector. Arrears have risen by more than 4% and
now sit at £52.5m and voids have risen by almost 5% which equates to lost income of
£10.2m
The Scottish Housing Regulator (SHR) has increased its narrative around rent affordability,
tenant health and safety and cyber security. These key issues combined with additional
pressure on arrears and voids mean that housing associations are constantly thinking about
our financial resilience, pressures on rental income and additional cost burdens.
The housing associations participating in the sector scorecard project are willing to be
transparent about our efficiency, performance and outcomes for tenants. We believe it is
vital to demonstrate to our tenants, other stakeholders and SHR that we are properly
managing our resources. We also know we don’t always get it right, so transparency and
accountability are important guiding principles for all of us.
The sector scorecard is one of a range of tools that can be used in internal assessments of
compliance with the new regulatory standards to provide assurance to governing boards,
tenants and SHR. This compliance ensures that we are well governed and are financially
sustainable to minimise rent and service charge increases and maximise efficiency and
effectiveness.
We extend our thanks to all housing associations who participated in the sector scorecard
project, submitted data timeously and have been willing to engage in submitting cost data
alongside their performance and satisfaction data.
Laurice Ponting, Chief Executive, HouseMark
Now in its third year, I’m pleased to see that participation in the Sector Scorecard, including in
Scotland, remains high. The continued level of engagement from the sector shows a
commitment to transparency, accountability and continuous improvement. It is important
that our sector tells its own story of the positive impact it makes in communities around the
country, including during periods of political uncertainty such as we are currently
experiencing.
Being able to use data and integrate it into the DNA of an organisation to evidence impact,
understand costs, target scarce resources and improve services is becoming increasingly

Sector Scorecard Scotland Analysis Report 2019
5
important. The Sector Scorecard allows housing providers to compare their performance at
the highest level.
HouseMark Scotland is pleased to support the publication of the Sector Scorecard to help
demonstrate to residents, the Scottish Housing Regulator and other stakeholders, the
performance and efficiencies being achieved by the housing sector.
As the year-on-year data collected in the Sector Scorecard increases, the richness and
depth of the data, alongside more trend information, will help to demonstrate the value of the
housing sector across Scotland and the UK.
I hope to see an increase in participation in 2020 to support evidence-based decision
making and to help the sector confidently articulate evidence of high performance and
efficiency to all stakeholders.
Sector Scorecard Scotland Analysis Report 2019
6
Executive summary
The Sector Scorecard The Sector Scorecard demonstrates that the housing association sector is committed to
efficiency, transparency and accountability. With measures covering financial viability as well
as delivery and outcomes, the Scorecard covers the wide remit that housing associations
have in the community and the economy.
Following a successful pilot in 2017, the 2018 and 2019 reports have continued to highlight
the diversity in the sector. Differences in place, products, priorities and practice have
resulted in some interesting comparisons between landlords. The Scorecard continues to be
a key primary source of evidence for headline comparisons of efficiency and value across
Scotland and the UK.
Key messages This report outlines the results for 34 Scottish housing associations owning over 100,000
homes – around one third of the sector’s stock.
Business health: Most Scottish housing associations record a considerable surplus, with
median operating margins of over 20%. Overall margins increased in Scotland whilst social
housing lettings margins fell – most likely due to increased social housing costs.
Development: Overall development levels recorded by participants in Scotland are lower
than the rest of the UK. Just over half the associations taking part recorded no new-build
dwellings in the year. Across the UK, almost 80% of Sector Scorecard participants are
adding to new supply. As across the rest of the UK, very few Scottish participants are
developing non-social housing.
Outcomes delivered: Satisfaction rates in Scotland have historically been higher than the
rest of the UK, however that gap is now narrowing. Organisations in the North East of England
surpassed Scotland as the area with the highest median satisfaction rate in 2019 (90%
compared with 89% in Scotland). Scottish participants are investing more in their
communities - £111 per property was invested into Scottish communities, compared with
£57 across the rest of the UK.
Effective asset management: Scottish participants recorded the lowest rates of return on
capital employed than other UK countries at 2.2% - which corresponds with comparatively
high costs per unit and low operating margins. Occupancy rates are lower in Scotland with
evidence of a clear UK-wide north/south divide as results in Northern Ireland and the North
East of England are similarly low.
Operating efficiencies: Following a considerable increase since 2018, Scottish
organisations reported comparatively higher headline social housing costs than the rest of
the UK. Despite the rollout of Universal Credit, rent collection rates have remained relatively
stable in Scotland with around three-quarters of participants collecting over 99% of their
rent.
Overall: No organisation performed consistently well in every area of the scorecard. Most
Scottish participants recorded between one and three results in the best quartile. Scottish
landlords’ performance and satisfaction levels compare favourably to the rest of the UK while
financial results tend to be comparatively lower. Lower levels of development (and therefore
borrowing) and lower rent levels are both factors with rising social housing costs also
contributing to this trend.
Sector Scorecard Scotland Analysis Report 2019
7
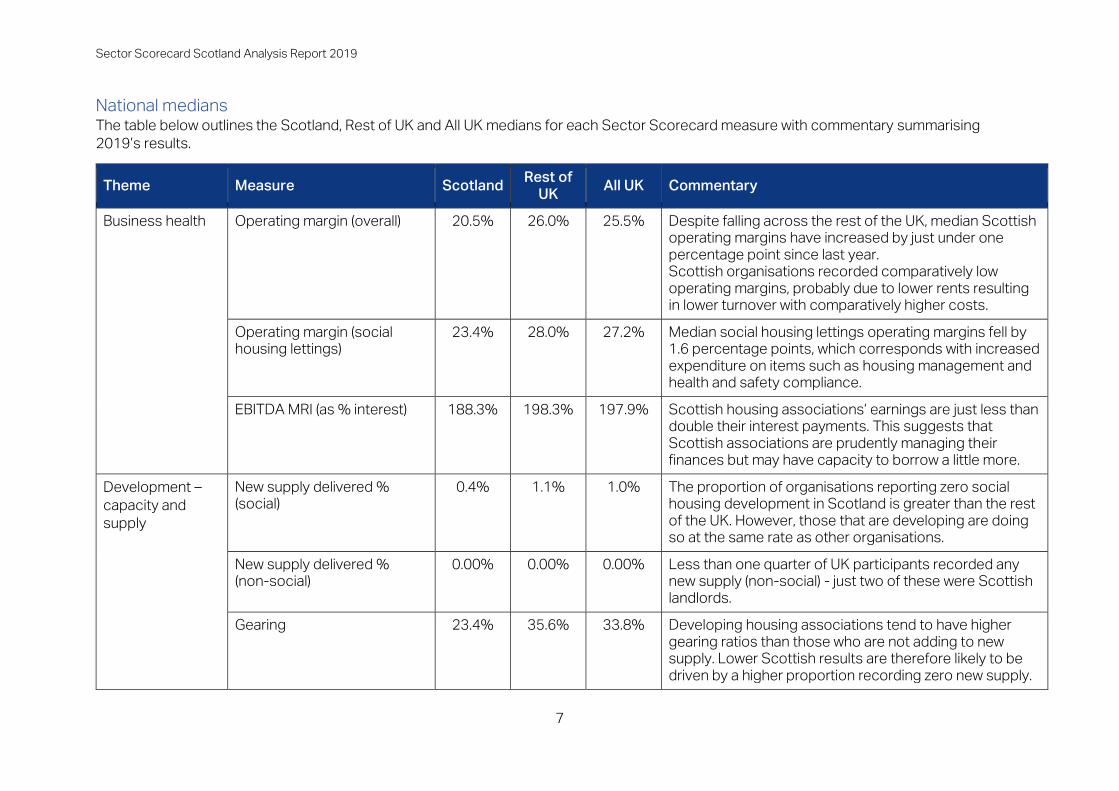
National medians The table below outlines the Scotland, Rest of UK and All UK medians for each Sector Scorecard measure with commentary summarising
2019’s results.
Theme Measure Scotland Rest of
UK All UK Commentary
Business health Operating margin (overall) 20.5% 26.0% 25.5% Despite falling across the rest of the UK, median Scottish
operating margins have increased by just under one
percentage point since last year.
Scottish organisations recorded comparatively low
operating margins, probably due to lower rents resulting
in lower turnover with comparatively higher costs.
Operating margin (social
housing lettings)
23.4% 28.0% 27.2% Median social housing lettings operating margins fell by
1.6 percentage points, which corresponds with increased
expenditure on items such as housing management and
health and safety compliance.
EBITDA MRI (as % interest) 188.3% 198.3% 197.9% Scottish housing associations’ earnings are just less than
double their interest payments. This suggests that
Scottish associations are prudently managing their
finances but may have capacity to borrow a little more.
Development –
capacity and
supply
New supply delivered %
(social)
0.4% 1.1% 1.0% The proportion of organisations reporting zero social
housing development in Scotland is greater than the rest
of the UK. However, those that are developing are doing
so at the same rate as other organisations.
New supply delivered %
(non-social)
0.00% 0.00% 0.00% Less than one quarter of UK participants recorded any
new supply (non-social) - just two of these were Scottish
landlords.
Gearing 23.4% 35.6% 33.8% Developing housing associations tend to have higher
gearing ratios than those who are not adding to new
supply. Lower Scottish results are therefore likely to be
driven by a higher proportion recording zero new supply.
Sector Scorecard Scotland Analysis Report 2019
8
Theme Measure Scotland Rest of
UK All UK Commentary
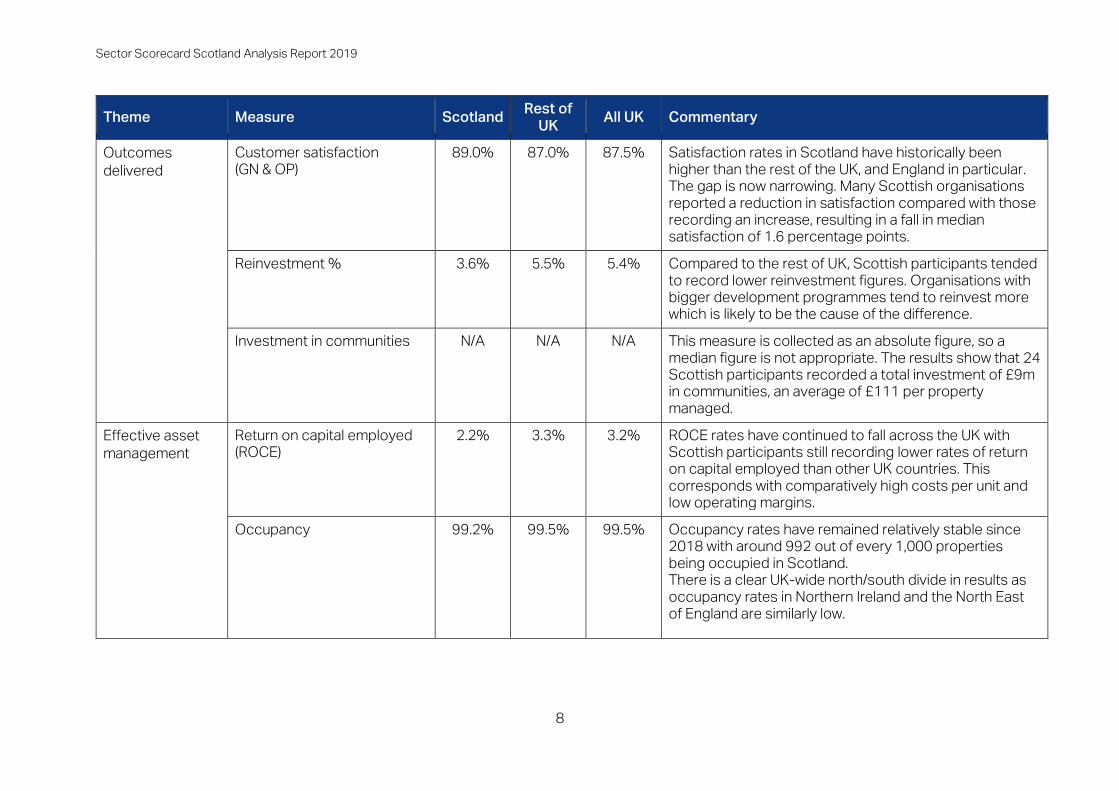
Outcomes
delivered
Customer satisfaction
(GN & OP)
89.0% 87.0% 87.5% Satisfaction rates in Scotland have historically been
higher than the rest of the UK, and England in particular.
The gap is now narrowing. Many Scottish organisations
reported a reduction in satisfaction compared with those
recording an increase, resulting in a fall in median
satisfaction of 1.6 percentage points.
Reinvestment % 3.6% 5.5% 5.4% Compared to the rest of UK, Scottish participants tended
to record lower reinvestment figures. Organisations with
bigger development programmes tend to reinvest more
which is likely to be the cause of the difference.
Investment in communities N/A N/A N/A This measure is collected as an absolute figure, so a
median figure is not appropriate. The results show that 24
Scottish participants recorded a total investment of £9m
in communities, an average of £111 per property
managed.
Effective asset
management
Return on capital employed
(ROCE)
2.2% 3.3% 3.2% ROCE rates have continued to fall across the UK with
Scottish participants still recording lower rates of return
on capital employed than other UK countries. This
corresponds with comparatively high costs per unit and
low operating margins.
Occupancy 99.2% 99.5% 99.5% Occupancy rates have remained relatively stable since
2018 with around 992 out of every 1,000 properties
being occupied in Scotland.
There is a clear UK-wide north/south divide in results as
occupancy rates in Northern Ireland and the North East
of England are similarly low.
Sector Scorecard Scotland Analysis Report 2019
9
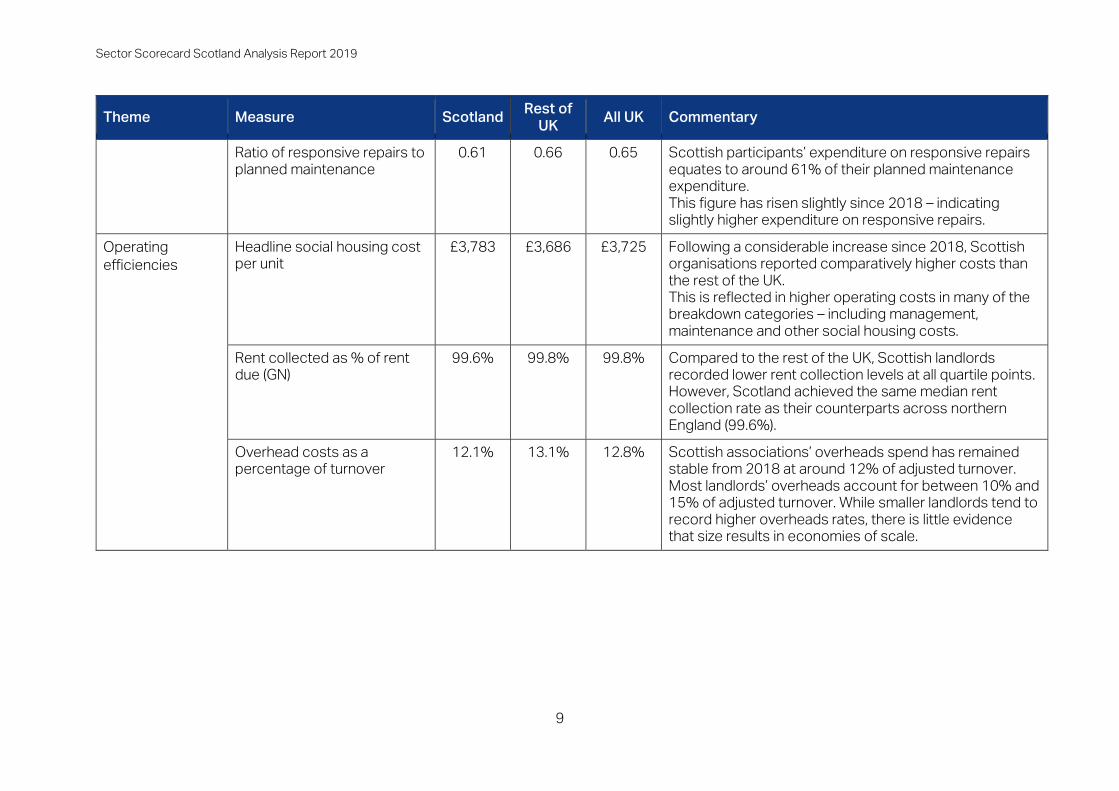
Theme Measure Scotland Rest of
UK All UK Commentary
Ratio of responsive repairs to
planned maintenance
0.61 0.66 0.65 Scottish participants’ expenditure on responsive repairs
equates to around 61% of their planned maintenance
expenditure.
This figure has risen slightly since 2018 – indicating
slightly higher expenditure on responsive repairs.
Operating
efficiencies
Headline social housing cost
per unit
£3,783 £3,686 £3,725 Following a considerable increase since 2018, Scottish
organisations reported comparatively higher costs than
the rest of the UK.
This is reflected in higher operating costs in many of the
breakdown categories – including management,
maintenance and other social housing costs.
Rent collected as % of rent
due (GN)
99.6% 99.8% 99.8% Compared to the rest of the UK, Scottish landlords
recorded lower rent collection levels at all quartile points.
However, Scotland achieved the same median rent
collection rate as their counterparts across northern
England (99.6%).
Overhead costs as a
percentage of turnover
12.1% 13.1% 12.8% Scottish associations’ overheads spend has remained
stable from 2018 at around 12% of adjusted turnover.
Most landlords’ overheads account for between 10% and
15% of adjusted turnover. While smaller landlords tend to
record higher overheads rates, there is little evidence
that size results in economies of scale.
Sector Scorecard Scotland Analysis Report 2019
10
Introduction
What is the housing association sector? Housing associations provide homes to rent and buy at affordable rates, cater for specialist
needs and develop new homes. Housing associations deliver where the private sector won’t,
and the public sector can’t. They generate income which doesn’t go to shareholders,
reinvesting their surpluses in homes and communities.
Context Assurance lies at the heart of the new regulatory framework, effective from 1 April 2019. All
housing associations and local authorities were required to submit assurance statements by
31 October 2019. These statements require positive affirmation from social landlords that
they comply with regulatory standards and must be owned by the governing body of the
organisation. If non-compliance is highlighted, then the Scottish Housing Regulator (SHR) will
work with that landlord to address areas for improvement.
On 11 November 2019, housing associations became subject to the Freedom of Information
(Scotland) Act and this combined with issues such as rising rent arrears due to Universal
Credit, GDPR compliance, housing first initiatives along with business as usual puts
increasing pressure on the business and financial performance of housing associations. The
Sector Scorecard data for 2018/19 is one tool in the box of participating associations that
can provide assurance to SHR, stimulate internal debate and reassure stakeholders that
rental income is being well-used.
About the Sector Scorecard The Sector Scorecard is an initiative to benchmark housing associations' performance and
assess value for money. It demonstrates the sector's accountability to its tenants and
stakeholders, with measurements ranging from financial gearing ratios to customer
satisfaction.
The initiative started with a well-received pilot exercise and analysis report in 2017, which
proved the worth of comparing measures at a high level – for housing associations of all
sizes, across the UK. In 2018, the Scorecard harmonised metric definitions with those used
by the English Regulator to ensure consistency, while retaining the additional performance,
impact and satisfaction measures that are essential to telling the sector’s story in a holistic
and balanced way. This suite of metrics has continued into 2019.
This year’s Scorecard exercise has continued to garner broad support across the sector
with increased participation in Northern Ireland and backing from key sector representatives
as well as support from the National Housing Federation (NHF) and the Northern Ireland
Federation of Housing Associations (NIFHA).
Implementation Since the 2017 pilot exercise, the Sector Scorecard Advisory Group has used Acuity and
HouseMark to collate Sector Scorecard data and provide reporting facilities. HouseMark
collects data from English providers managing over 1,000 properties as well as associations
based in Scotland, Wales and Northern Ireland1. Acuity collects Sector Scorecard data from
smaller associations managing up to around 1,000 properties, mainly in England.
1 Where organisations submitted data to both HouseMark and Acuity, the duplicate dataset has been removed
from the analysis.

Sector Scorecard Scotland Analysis Report 2019
11
The data for this report was extracted in October 2019. In total, 304 housing associations
took part in the exercise. Thirty-four Scottish organisations took part in the exercise,
collectively managing around 104,500 homes.
This table shows the number of participants by location and size band.
Scotland Traditional LSVT Total
Under 1,000 units 7 1 8
1,000 - 5,000 units 21 0 21
5,000 - 10,000 units 2 2 4
10,000+ units 0 1 1
Total 30 4 34
The table shows that the typical Scottish Sector Scorecard participant is a traditional
housing association with between 1,000 and 5,000 units.
The number of Scottish participants has changed slightly since 2018. There are eight
associations that took part in 2018 but not in 2019. This is offset by five new associations
taking part, resulting in a net decrease in participation of three organisations.
Method of Analysis The analysis in this report considers the spread of results recorded for each measure, the
relationship between measures and the comparative results entered by each association
across the Scorecard. Definitions of each measure are available in Appendix 1.
This report uses quartiles to provide an idea of how the results entered by associations
spread out across all participants. The median, or mid-point in the results helps to set a
benchmark for what is ‘average’ for associations. This is preferable to the mean average as it
is not skewed by extremely high or low results. The first and third quartiles show where the
results are low or high for the group. Each measure has an explanation about whether high is
good, low is good or whether the measure is neutral.
The report compares 2019 results to 2018 where appropriate. All comparisons are based on
a balanced panel of Scottish organisations that submitted data consistently for both years.
Year-on-year differences in Scotland are often compared to changes across the whole of
the UK, which have been calculated in the same way.
Correlation analysis is used throughout this report to analyse the relationship between two
measures. While it doesn’t show causality, it does help to investigate whether patterns that
show in aggregated groups (e.g. smaller associations) are evident across the group.
As a whole, no organisation performed consistently well in every area of the scorecard.
Across the UK, around 8% of participants had six or seven of their results in the best quartile
across the 13 measures (excluding two neutral polarity measures) – one of these
organisations was Scottish. No Scottish association achieved more than seven results in the
best quartile. For two-thirds of Scottish participants, less than a quarter of their submitted
figures were in the best quartile and five organisations had no results in the top quartile.
More information on analysis methods is available in Appendix 2.
Sector Scorecard Scotland Analysis Report 2019
12
Business Health
Business health measures demonstrate how associations are meeting the challenge of
running successful businesses while fulfilling their social mission.
Operating margin (overall) For the housing association sector, operating margin measures the amount of surplus
generated from turnover on a landlord’s day-to-day activities. It is therefore a key measure of
operational efficiency as it is influenced by both income and expenditure.
There are various factors that can affect a housing association’s operating margin including
the rent charged to tenants (lower rents mean lower margins) as well as expenditure on
maintaining properties (higher costs mean lower margins).
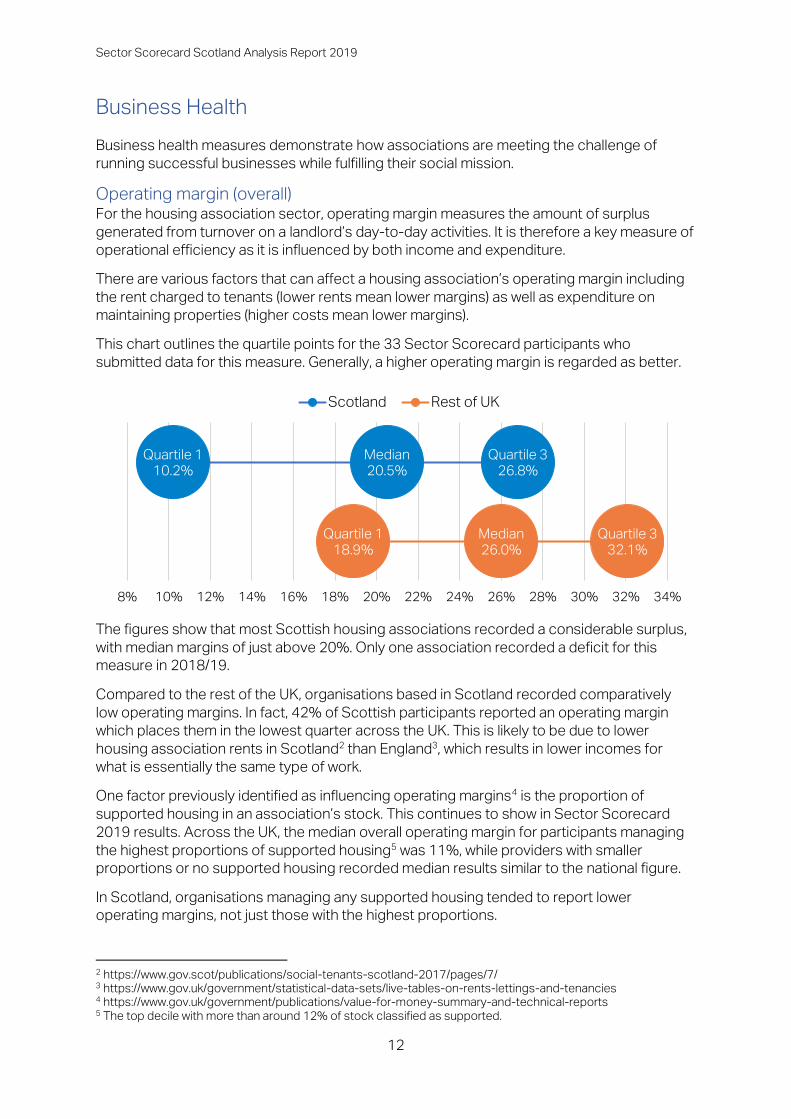
This chart outlines the quartile points for the 33 Sector Scorecard participants who
submitted data for this measure. Generally, a higher operating margin is regarded as better.
The figures show that most Scottish housing associations recorded a considerable surplus,
with median margins of just above 20%. Only one association recorded a deficit for this
measure in 2018/19.
Compared to the rest of the UK, organisations based in Scotland recorded comparatively
low operating margins. In fact, 42% of Scottish participants reported an operating margin
which places them in the lowest quarter across the UK. This is likely to be due to lower
housing association rents in Scotland2 than England3, which results in lower incomes for
what is essentially the same type of work.
One factor previously identified as influencing operating margins4 is the proportion of
supported housing in an association’s stock. This continues to show in Sector Scorecard
2019 results. Across the UK, the median overall operating margin for participants managing
the highest proportions of supported housing5 was 11%, while providers with smaller
proportions or no supported housing recorded median results similar to the national figure.
In Scotland, organisations managing any supported housing tended to report lower
operating margins, not just those with the highest proportions.
2 https://www.gov.scot/publications/social-tenants-scotland-2017/pages/7/ 3 https://www.gov.uk/government/statistical-data-sets/live-tables-on-rents-lettings-and-tenancies 4 https://www.gov.uk/government/publications/value-for-money-summary-and-technical-reports 5 The top decile with more than around 12% of stock classified as supported.
Quartile 1
10.2%
Median
20.5%
Quartile 3
26.8%
Quartile 1
18.9%
Median
26.0%
Quartile 3
32.1%
8% 10% 12% 14% 16% 18% 20% 22% 24% 26% 28% 30% 32% 34%
Scotland Rest of UK

Sector Scorecard Scotland Analysis Report 2019
13
The median overall operating margin for participants which do not manage any supported
housing is comparable to similar organisations across the rest of the UK. However, those
who do manage supported housing report operating margins which are much lower than
other Scottish participants in addition to similar organisations across the rest of the UK. This
could, in part, be due to the higher costs associated with delivering supported housing.
There also appears to be some relationship between other financial metrics and the
operating margin. Higher operating margins show a tendency to be associated with one or
more of: higher gearing, larger development programmes and lower costs. For example, the
median overall operating margin for Scottish participants with comparatively high headline
social housing costs is 9%, while the median for an association with comparatively low costs
is 25%.
Comparison to 2018 results – Operating margin (overall) The chart below outlines the change in quartile position between the two years for Scottish
participants which submitted data in both 2018 and 2019.
27.2%
20.1%
27.1%26.0%
0%
5%
10%
15%
20%
25%
30%
No SH Some SH
Median operating margin (overall)
Scotland Rest of UK
Quartile 1
13.0%
Median
21.8%
Quartile 3
27.6%
Quartile 1
14.7%
Median
20.8%
Quartile 3
30.4%
10% 12% 14% 16% 18% 20% 22% 24% 26% 28% 30% 32%
2018/19 2017/18
Number of participants: 27

Sector Scorecard Scotland Analysis Report 2019
14
Compared to the 2018 results, overall operating margins have increased by one percentage
point. These movements are the results of some large year-on-year changes at either end of
the scale, with a small movement upwards for landlords in the mid-range.
Over the same period, operating margins across the entire UK fell by around two percentage
points at each quartile point. One of the reasons for this fall is likely to be ongoing rent
reductions imposed on English housing associations over a five-year period to 2020. Other
items cited include increased health and safety compliance costs and a slowdown in market
sales.
Operating margin (social housing lettings) This measure looks at the operating margin for the part of the business that manages social
housing.
The chart below outlines the quartile positions for the 34 organisations that submitted data
for this measure. Generally, a higher operating margin is regarded as better.
The chart shows that for Scottish participants, median operating margins for social housing
lettings are 4.6 percentage points lower than across the rest of the UK. There is a strong
correlation6 between social housing lettings operating margins and the overall figure, which
demonstrates that social housing lettings forms the bulk of a housing association’s business.
Patterns in social housing lettings operating margins tend to mirror those of overall operating
margins, though social housing lettings margins are almost invariably 2-3 percentage points
higher than the overall figure.
Comparison to 2018 results – Operating margin (social housing lettings) The chart below outlines the change in quartile position between the two years for Scottish
participants which submitted data in both 2018 and 2019.
6 A Pearson correlation coefficient score of 0.9
Quartile 1
11.8%
Median
23.4%
Quartile 3
29.3%
Quartile 1
20.6%
Median
28.0%
Quartile 3
34.1%
10% 12% 14% 16% 18% 20% 22% 24% 26% 28% 30% 32% 34% 36%
Scotland Rest of UK
Sector Scorecard Scotland Analysis Report 2019
15
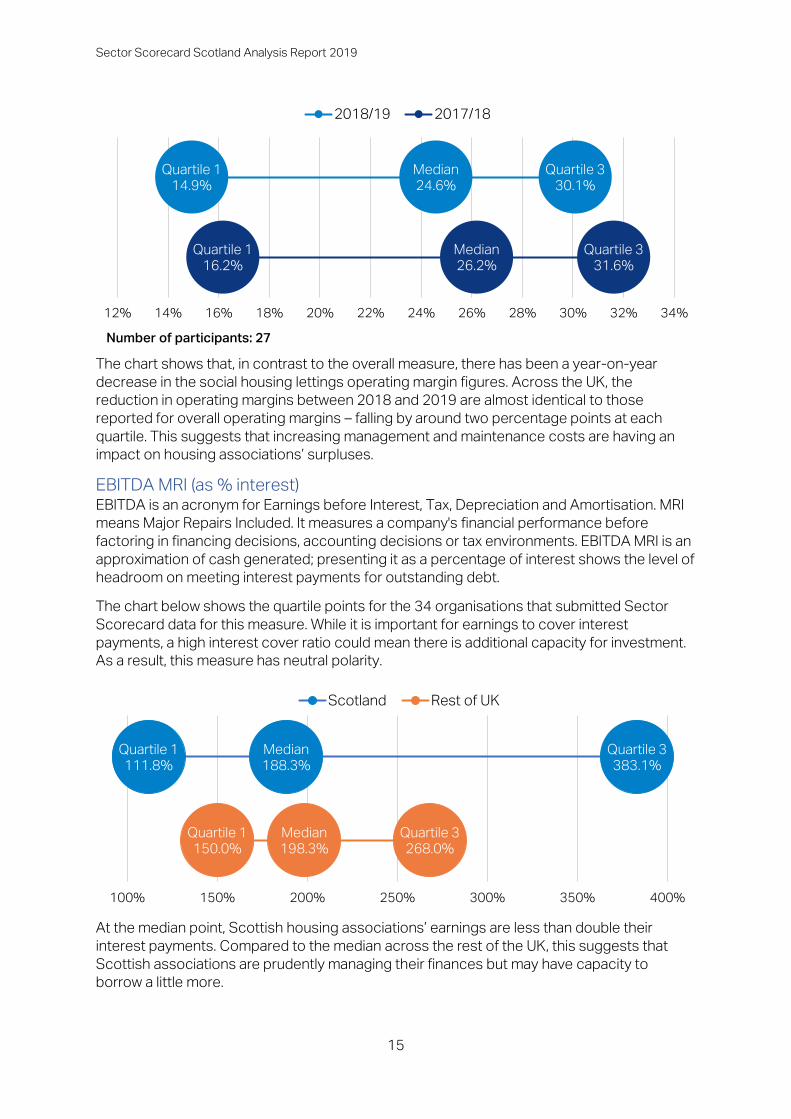
The chart shows that, in contrast to the overall measure, there has been a year-on-year
decrease in the social housing lettings operating margin figures. Across the UK, the
reduction in operating margins between 2018 and 2019 are almost identical to those
reported for overall operating margins – falling by around two percentage points at each
quartile. This suggests that increasing management and maintenance costs are having an
impact on housing associations’ surpluses.
EBITDA MRI (as % interest) EBITDA is an acronym for Earnings before Interest, Tax, Depreciation and Amortisation. MRI
means Major Repairs Included. It measures a company's financial performance before
factoring in financing decisions, accounting decisions or tax environments. EBITDA MRI is an
approximation of cash generated; presenting it as a percentage of interest shows the level of
headroom on meeting interest payments for outstanding debt.
The chart below shows the quartile points for the 34 organisations that submitted Sector
Scorecard data for this measure. While it is important for earnings to cover interest
payments, a high interest cover ratio could mean there is additional capacity for investment.
As a result, this measure has neutral polarity.
At the median point, Scottish housing associations’ earnings are less than double their
interest payments. Compared to the median across the rest of the UK, this suggests that
Scottish associations are prudently managing their finances but may have capacity to
borrow a little more.
Quartile 1
14.9%
Median
24.6%
Quartile 3
30.1%
Quartile 1
16.2%
Median
26.2%
Quartile 3
31.6%
12% 14% 16% 18% 20% 22% 24% 26% 28% 30% 32% 34%
2018/19 2017/18
Number of participants: 27
Quartile 1
111.8%
Median
188.3%
Quartile 3
383.1%
Quartile 1
150.0%
Median
198.3%
Quartile 3
268.0%
100% 150% 200% 250% 300% 350% 400%
Scotland Rest of UK

Sector Scorecard Scotland Analysis Report 2019
16
This measure is the most variable with outliers at the lower and upper end of the spectrum.
Scottish results for this measure are generally more varied than the rest of the UK,
particularly at the upper end of the scale, which reflects low borrowing requirements and/or
large capitalised expenditure in the year. Across the UK, 14 participants reported figures
greater than 1,000% in 2019 - five of these are Scottish.
There are few patterns to note for EBITDA (MRI), with no considerable differences at the
median point relating to organisational characteristics.
These figures demonstrate that this metric only provides meaningful information for
associations who borrow to invest and cover interest payments with their operating surplus.
Comparison to 2018 results – EBITDA MRI (as % interest) The chart below outlines the change in quartile position between the two years for a
balanced panel of Scottish organisations submitting consistent data for both years.
The difference between the years does not suggest a particularly strong trend, with the
median only increasing by six percentage points.
Across the rest of the UK, median EBITDA (MRI) results fell by 22 percentage points thereby
narrowing the gap between Scotland and other UK countries. This is likely to be driven by
lower surpluses and appears to be happening to large numbers of housing associations
across the country, with two-thirds of Sector Scorecard participants recording a reduction in
the last 12 months.
Quartile 1
99.3%
Median
191.2%
Quartile 3
344.2%
Quartile 1
149.8%
Median
185.0%
Quartile 3
323.6%
80% 120% 160% 200% 240% 280% 320% 360%
2018/19 2017/18
Number of participants: 27

Sector Scorecard Scotland Analysis Report 2019
17
Development (Capacity & Supply)
With the country relying on housing associations to deliver a large proportion of new homes,
and the vast majority of affordable homes, it is important that an exercise such as the Sector
Scorecard captures performance in this area.
New Supply delivered: absolute (social and non-social) In total, Scottish Sector Scorecard participants completed 1,362 dwellings in the year to 31
March 2019 – which accounts for about 6% of the total in Scotland7.
Out of 32 organisations submitting data for this measure, 60% completed at least one new
dwelling in the period. This is less than the figure the across the rest of the UK, where 79% of
participants completed at least one new dwelling in the period.
The largest number of units developed (of any tenure) by a participant was 314. Four
participants completed over 100 dwellings in the period. Participants who submitted data for
this measure in both years increased their development output by 14% or 125 units. This is
similar to the rest of the UK.
New supply delivered % (social) This comparable measure allows associations to assess the size of their development
programme in relation to the amount of stock they already manage. This makes it possible to
compare large landlords delivering volume to smaller landlords concentrating on a particular
type of provision or geographical area.
The chart below outlines the quartile positions for this measure. In total, 32 Scottish
associations submitted data for this measure; of these 19 recorded a figure above zero.
Generally, larger development programmes are seen as better, but this has to be set in the
context of appropriate risk management and the ongoing financial viability of the
organisation.
The figures show that at the median, Scottish housing associations are developing new
social housing at a lower rate than across the rest of the UK. Landlords based in England
recorded a median result close to the Rest of UK figure, while landlords in Northern Ireland
recorded much higher rates of development – with a median figure of 4.95%. The Scottish
median result is lowered by the number of organisations recording zero. In Scotland, the
proportion of organisations reporting zero social development is greater than the rest of the
7 21,292 completions Housing Statistics for Scotland - All sector new build: Scottish Government Sep 2019
https://www2.gov.scot/Topics/Statistics/Browse/Housing-Regeneration/HSfS/NewBuildAllSector
Quartile 1
0.00%
Median
0.36%
Quartile 3
1.67%
Quartile 1
0.17%
Median
1.09%
Quartile 3
2.45%
0.0% 0.5% 1.0% 1.5% 2.0% 2.5%
Scotland Rest of UK
Sector Scorecard Scotland Analysis Report 2019
18
UK. When we exclude non-developing organisations, the median for landlords developing
social housing increases to 1.6%, which is the same as the result across the rest of the UK.
Organisations with lower costs are contributing a greater proportion to social new supply in
Scotland. At the median point, participants with comparatively high costs increased social
supply by 0.3% of their social stock whereas those with comparatively low costs increased
supply by 1.7%. Additionally, landlords which have higher reinvestment and operating
margins also tend to deliver higher rates of social new supply.
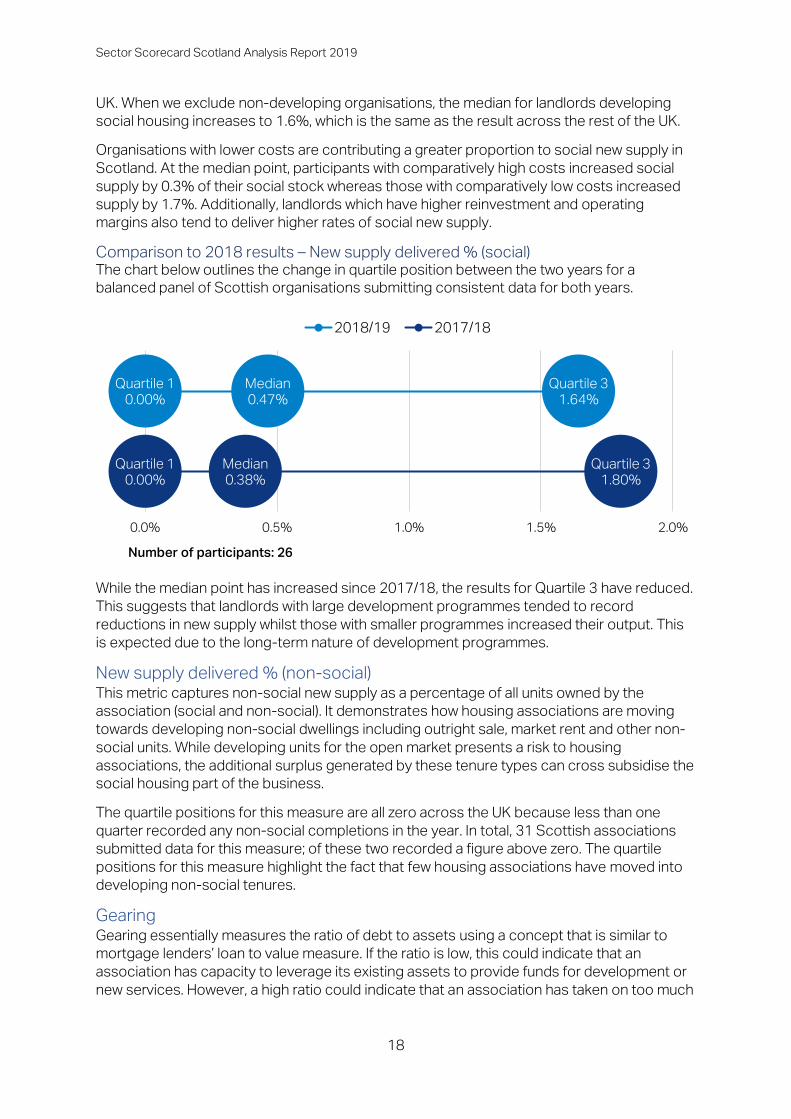
Comparison to 2018 results – New supply delivered % (social) The chart below outlines the change in quartile position between the two years for a
balanced panel of Scottish organisations submitting consistent data for both years.
While the median point has increased since 2017/18, the results for Quartile 3 have reduced.
This suggests that landlords with large development programmes tended to record
reductions in new supply whilst those with smaller programmes increased their output. This
is expected due to the long-term nature of development programmes.
New supply delivered % (non-social) This metric captures non-social new supply as a percentage of all units owned by the
association (social and non-social). It demonstrates how housing associations are moving
towards developing non-social dwellings including outright sale, market rent and other non-
social units. While developing units for the open market presents a risk to housing
associations, the additional surplus generated by these tenure types can cross subsidise the
social housing part of the business.
The quartile positions for this measure are all zero across the UK because less than one
quarter recorded any non-social completions in the year. In total, 31 Scottish associations
submitted data for this measure; of these two recorded a figure above zero. The quartile
positions for this measure highlight the fact that few housing associations have moved into
developing non-social tenures.
Gearing Gearing essentially measures the ratio of debt to assets using a concept that is similar to
mortgage lenders’ loan to value measure. If the ratio is low, this could indicate that an
association has capacity to leverage its existing assets to provide funds for development or
new services. However, a high ratio could indicate that an association has taken on too much
Quartile 1
0.00%
Median
0.47%
Quartile 3
1.64%
Quartile 1
0.00%
Median
0.38%
Quartile 3
1.80%
0.0% 0.5% 1.0% 1.5% 2.0%
2018/19 2017/18
Number of participants: 26
Sector Scorecard Scotland Analysis Report 2019
19
borrowing, which could put its assets at risk. Gearing can also be affected by funders’ lending
covenants, which may set conditions in relation to borrowing levels.
There are several ways to measure gearing and little consensus about the best definition for
housing associations to follow. The Sector Scorecard metric takes the proportion of
borrowing (offset by cash and cash equivalents) in relation to the size of the association’s
asset base.
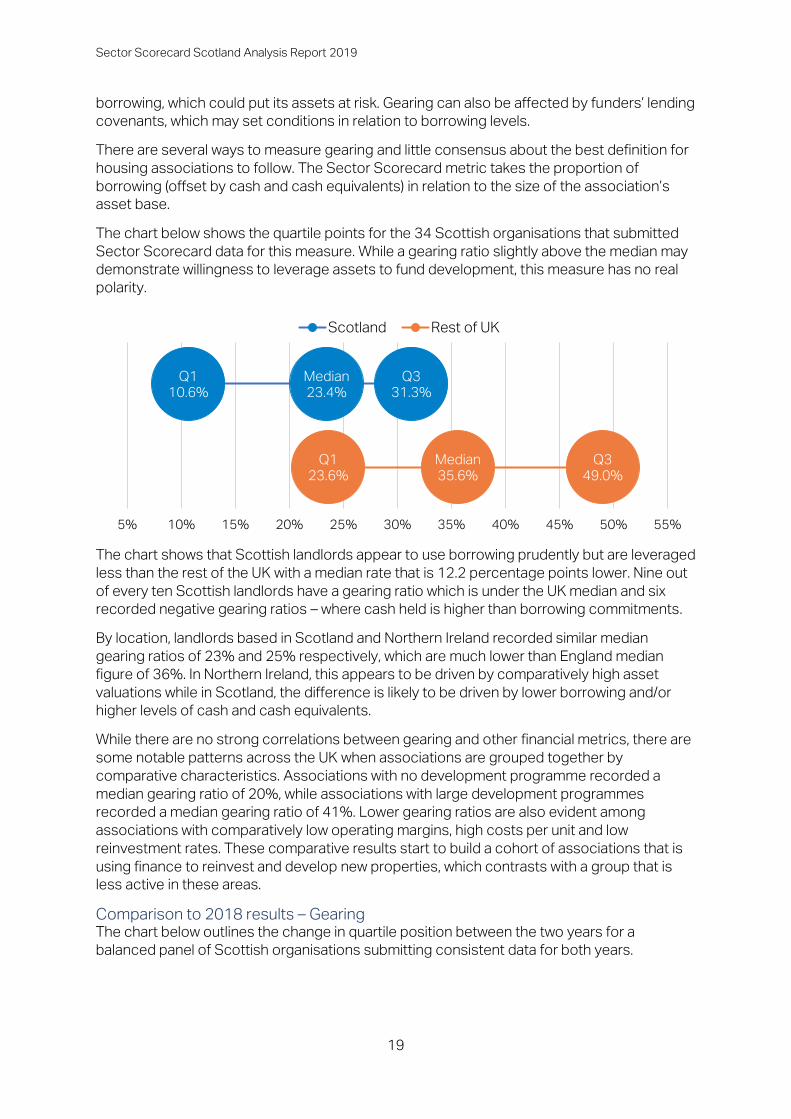
The chart below shows the quartile points for the 34 Scottish organisations that submitted
Sector Scorecard data for this measure. While a gearing ratio slightly above the median may
demonstrate willingness to leverage assets to fund development, this measure has no real
polarity.
The chart shows that Scottish landlords appear to use borrowing prudently but are leveraged
less than the rest of the UK with a median rate that is 12.2 percentage points lower. Nine out
of every ten Scottish landlords have a gearing ratio which is under the UK median and six
recorded negative gearing ratios – where cash held is higher than borrowing commitments.
By location, landlords based in Scotland and Northern Ireland recorded similar median
gearing ratios of 23% and 25% respectively, which are much lower than England median
figure of 36%. In Northern Ireland, this appears to be driven by comparatively high asset
valuations while in Scotland, the difference is likely to be driven by lower borrowing and/or
higher levels of cash and cash equivalents.
While there are no strong correlations between gearing and other financial metrics, there are
some notable patterns across the UK when associations are grouped together by
comparative characteristics. Associations with no development programme recorded a
median gearing ratio of 20%, while associations with large development programmes
recorded a median gearing ratio of 41%. Lower gearing ratios are also evident among
associations with comparatively low operating margins, high costs per unit and low
reinvestment rates. These comparative results start to build a cohort of associations that is
using finance to reinvest and develop new properties, which contrasts with a group that is
less active in these areas.
Comparison to 2018 results – Gearing The chart below outlines the change in quartile position between the two years for a
balanced panel of Scottish organisations submitting consistent data for both years.
Q1
10.6%
Median
23.4%
Q3
31.3%
Q1
23.6%
Median
35.6%
Q3
49.0%
5% 10% 15% 20% 25% 30% 35% 40% 45% 50% 55%
Scotland Rest of UK
Sector Scorecard Scotland Analysis Report 2019
20
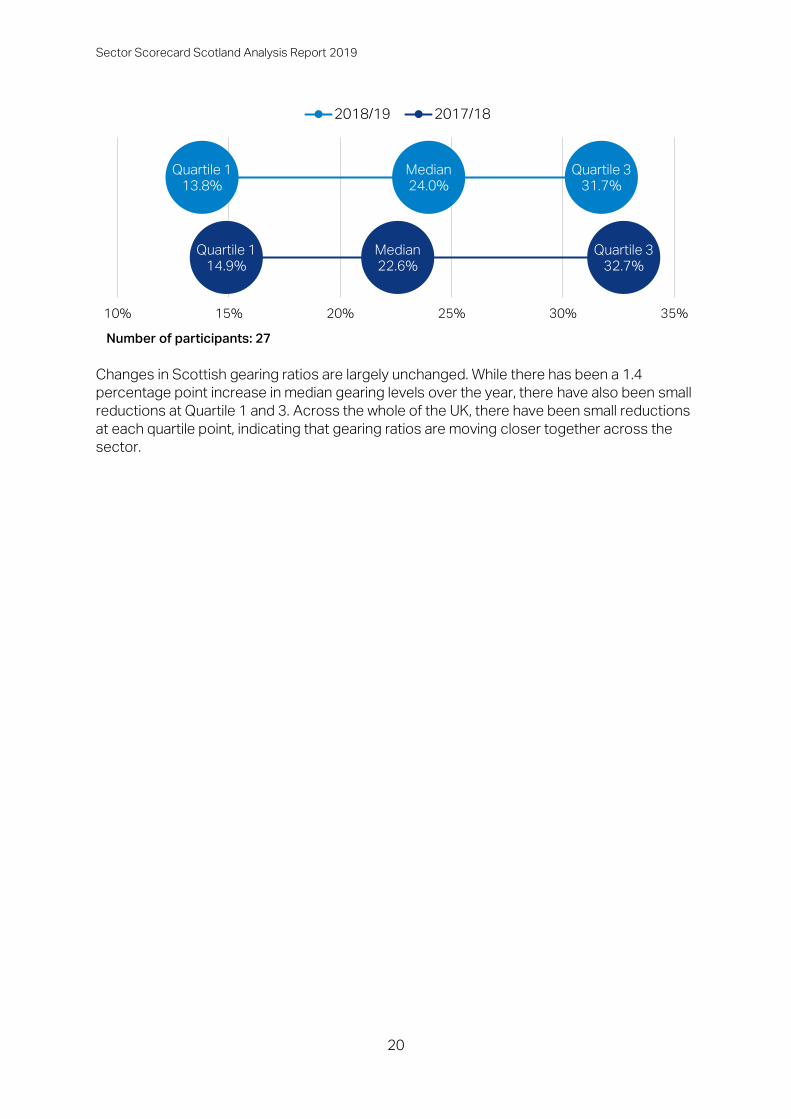
Changes in Scottish gearing ratios are largely unchanged. While there has been a 1.4
percentage point increase in median gearing levels over the year, there have also been small
reductions at Quartile 1 and 3. Across the whole of the UK, there have been small reductions
at each quartile point, indicating that gearing ratios are moving closer together across the
sector.
Quartile 1
13.8%
Median
24.0%
Quartile 3
31.7%
Quartile 1
14.9%
Median
22.6%
Quartile 3
32.7%
10% 15% 20% 25% 30% 35%
2018/19 2017/18
Number of participants: 27
Sector Scorecard Scotland Analysis Report 2019
21
Outcomes Delivered
Housing associations need to achieve a balance between building homes and delivering
services to existing residents. The Sector Scorecard measures some of the outcomes
delivered for the millions of people who live in homes they manage.
Alongside customer satisfaction, this section includes a reinvestment metric and a measure
for investment in communities.
Customer satisfaction (GN & OP) The social housing sector has a framework for periodic surveys of customer perception,
developed by HouseMark called STAR (Survey of tenants and residents). This uses a
consistent set of questions, response scales and methodology for participants to measure
customer satisfaction and to compare results with each other. The Scottish Housing
Regulator uses the STAR framework for the collection of satisfaction data as part of the
Annual Return on the Charter (ARC) which landlords submit to SHR.
For the Sector Scorecard, associations enter the combined satisfaction score for the overall
service question. This is the proportion of survey respondents who stated that they were
fairly or very satisfied with the service provided by their landlord.
During 2019, HouseMark has been leading a review of STAR involving stakeholders across
the social housing sector as well as thousands of tenants and residents. Early indications
from this review are to retain the overall satisfaction question and scoring mechanism that is
used in the Sector Scorecard.
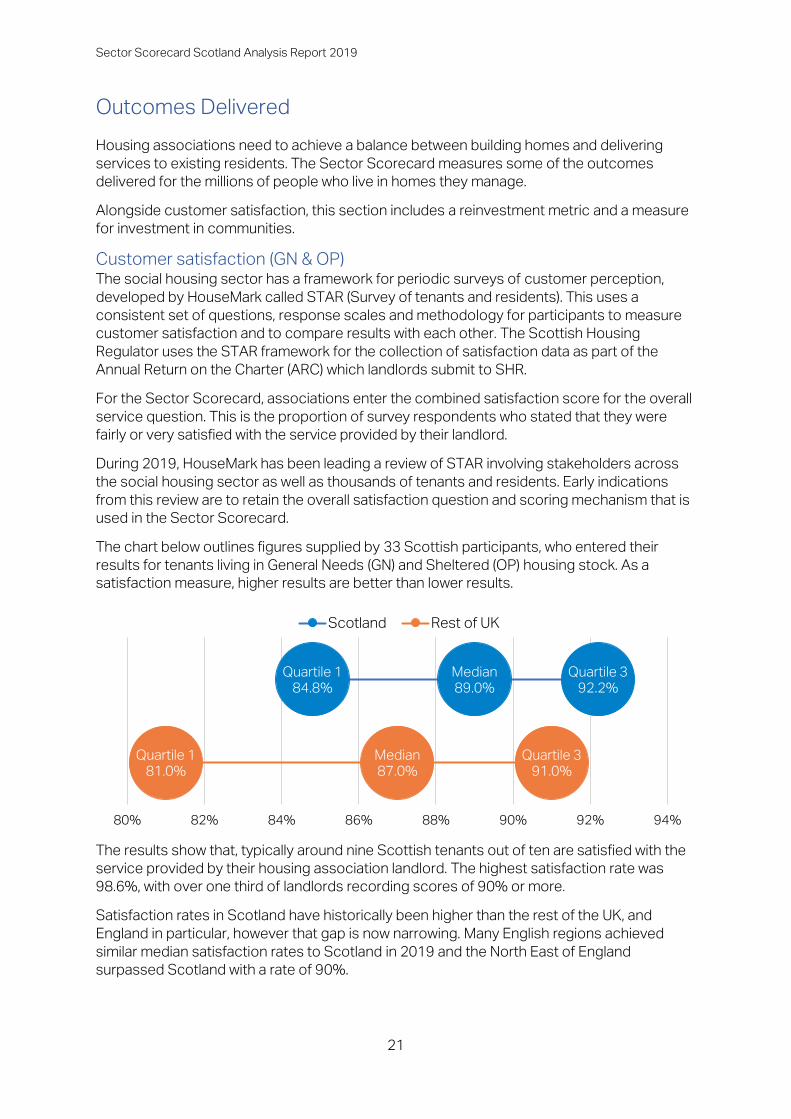
The chart below outlines figures supplied by 33 Scottish participants, who entered their
results for tenants living in General Needs (GN) and Sheltered (OP) housing stock. As a
satisfaction measure, higher results are better than lower results.
The results show that, typically around nine Scottish tenants out of ten are satisfied with the
service provided by their housing association landlord. The highest satisfaction rate was
98.6%, with over one third of landlords recording scores of 90% or more.
Satisfaction rates in Scotland have historically been higher than the rest of the UK, and
England in particular, however that gap is now narrowing. Many English regions achieved
similar median satisfaction rates to Scotland in 2019 and the North East of England
surpassed Scotland with a rate of 90%.
Quartile 1
84.8%
Median
89.0%
Quartile 3
92.2%
Quartile 1
81.0%
Median
87.0%
Quartile 3
91.0%
80% 82% 84% 86% 88% 90% 92% 94%
Scotland Rest of UK
Sector Scorecard Scotland Analysis Report 2019
22
While there are no patterns to link median satisfaction levels and financial metrics such as
gearing and operating margin, there is a tendency for higher cost landlords across the UK to
record lower satisfaction rates. Median satisfaction rates for landlords with high costs per
unit were around three percentage points lower than those with comparatively low costs per
unit. This corresponds with HouseMark research showing that lower costs = more efficient
services = higher satisfaction8.
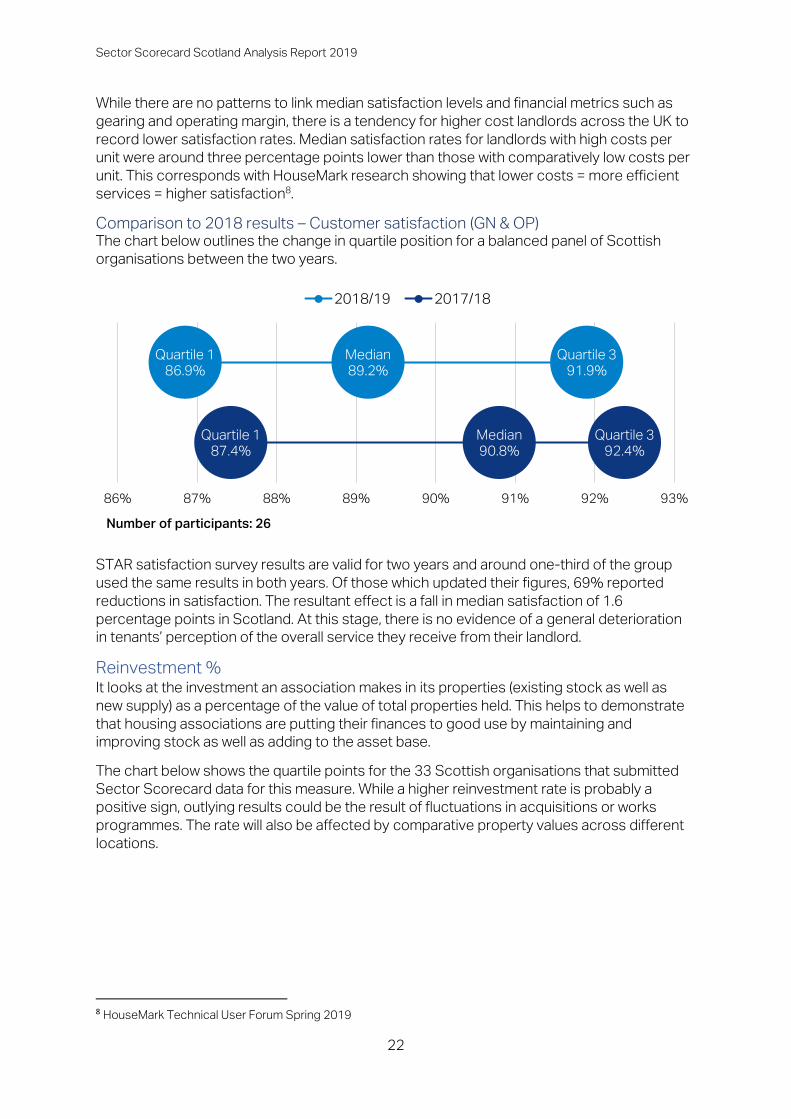
Comparison to 2018 results – Customer satisfaction (GN & OP) The chart below outlines the change in quartile position for a balanced panel of Scottish
organisations between the two years.
STAR satisfaction survey results are valid for two years and around one-third of the group
used the same results in both years. Of those which updated their figures, 69% reported
reductions in satisfaction. The resultant effect is a fall in median satisfaction of 1.6
percentage points in Scotland. At this stage, there is no evidence of a general deterioration
in tenants’ perception of the overall service they receive from their landlord.
Reinvestment % It looks at the investment an association makes in its properties (existing stock as well as
new supply) as a percentage of the value of total properties held. This helps to demonstrate
that housing associations are putting their finances to good use by maintaining and
improving stock as well as adding to the asset base.
The chart below shows the quartile points for the 33 Scottish organisations that submitted
Sector Scorecard data for this measure. While a higher reinvestment rate is probably a
positive sign, outlying results could be the result of fluctuations in acquisitions or works
programmes. The rate will also be affected by comparative property values across different
locations.
8 HouseMark Technical User Forum Spring 2019
Quartile 1
86.9%
Median
89.2%
Quartile 3
91.9%
Quartile 1
87.4%
Median
90.8%
Quartile 3
92.4%
86% 87% 88% 89% 90% 91% 92% 93%
2018/19 2017/18
Number of participants: 26
Sector Scorecard Scotland Analysis Report 2019
23
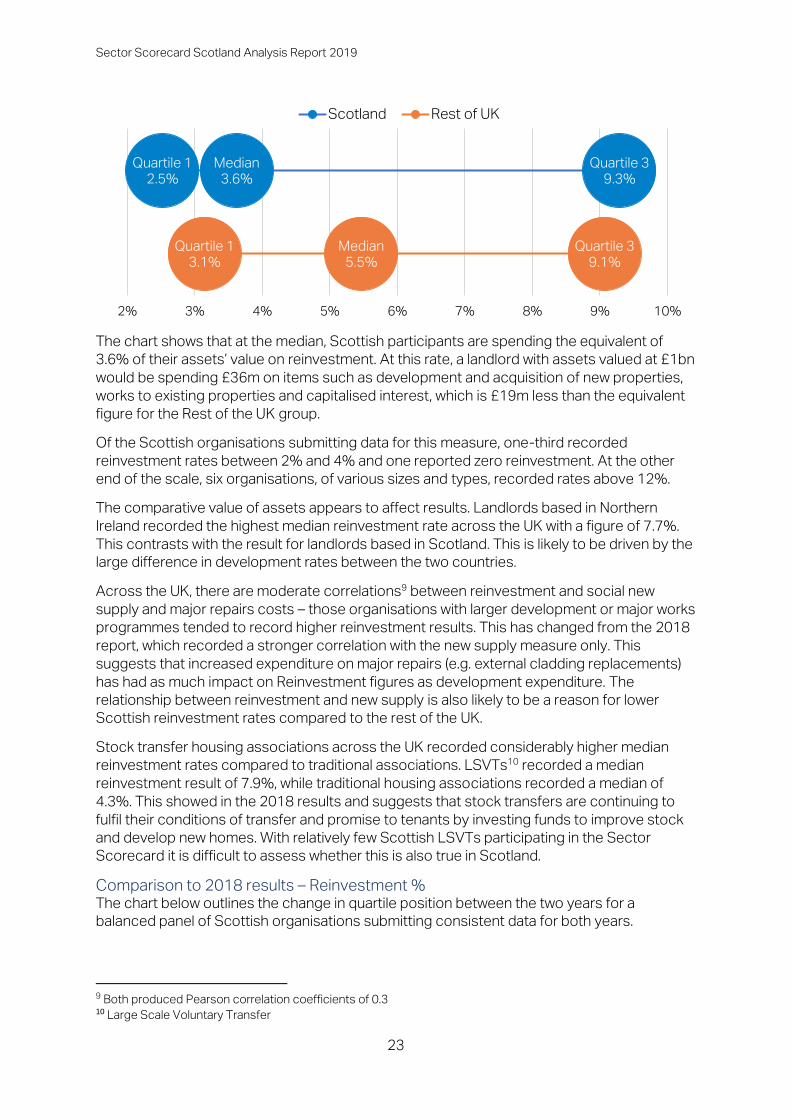
The chart shows that at the median, Scottish participants are spending the equivalent of
3.6% of their assets’ value on reinvestment. At this rate, a landlord with assets valued at £1bn
would be spending £36m on items such as development and acquisition of new properties,
works to existing properties and capitalised interest, which is £19m less than the equivalent
figure for the Rest of the UK group.
Of the Scottish organisations submitting data for this measure, one-third recorded
reinvestment rates between 2% and 4% and one reported zero reinvestment. At the other
end of the scale, six organisations, of various sizes and types, recorded rates above 12%.
The comparative value of assets appears to affect results. Landlords based in Northern
Ireland recorded the highest median reinvestment rate across the UK with a figure of 7.7%.
This contrasts with the result for landlords based in Scotland. This is likely to be driven by the
large difference in development rates between the two countries.
Across the UK, there are moderate correlations9 between reinvestment and social new
supply and major repairs costs – those organisations with larger development or major works
programmes tended to record higher reinvestment results. This has changed from the 2018
report, which recorded a stronger correlation with the new supply measure only. This
suggests that increased expenditure on major repairs (e.g. external cladding replacements)
has had as much impact on Reinvestment figures as development expenditure. The
relationship between reinvestment and new supply is also likely to be a reason for lower
Scottish reinvestment rates compared to the rest of the UK.
Stock transfer housing associations across the UK recorded considerably higher median
reinvestment rates compared to traditional associations. LSVTs10 recorded a median
reinvestment result of 7.9%, while traditional housing associations recorded a median of
4.3%. This showed in the 2018 results and suggests that stock transfers are continuing to
fulfil their conditions of transfer and promise to tenants by investing funds to improve stock
and develop new homes. With relatively few Scottish LSVTs participating in the Sector
Scorecard it is difficult to assess whether this is also true in Scotland.
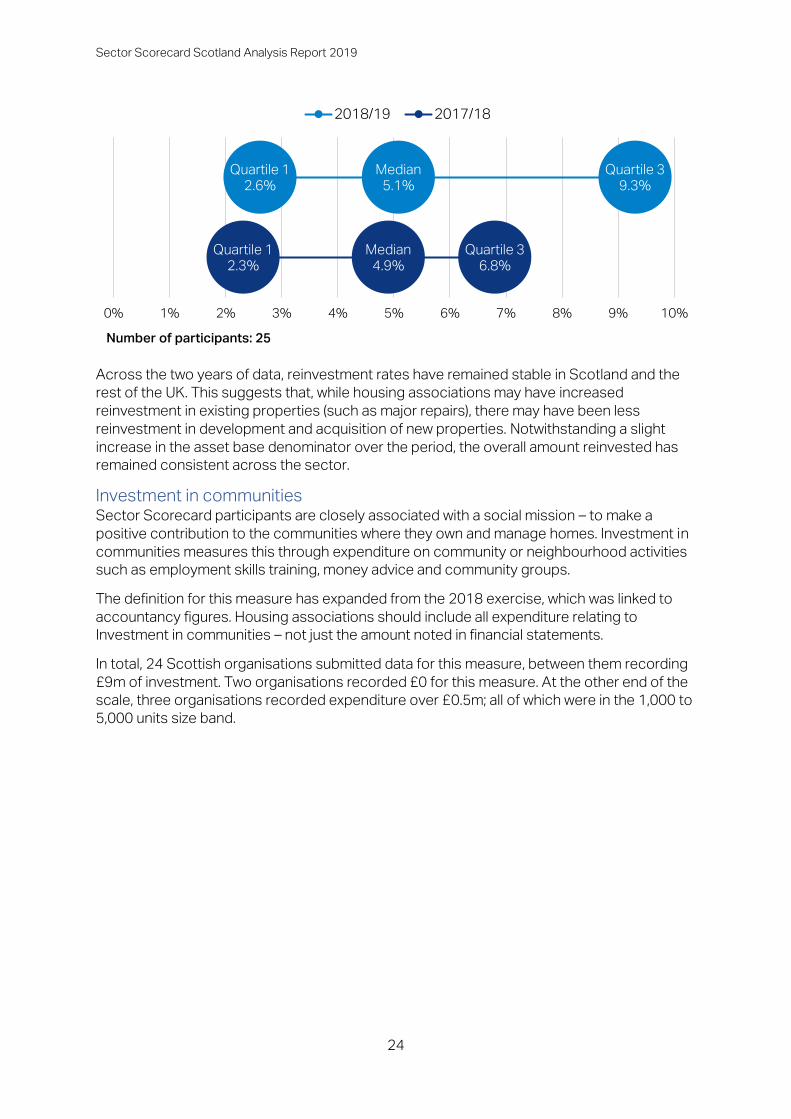
Comparison to 2018 results – Reinvestment % The chart below outlines the change in quartile position between the two years for a
balanced panel of Scottish organisations submitting consistent data for both years.
9 Both produced Pearson correlation coefficients of 0.3 10 Large Scale Voluntary Transfer
Quartile 1
2.5%
Median
3.6%
Quartile 3
9.3%
Quartile 1
3.1%
Median
5.5%
Quartile 3
9.1%
2% 3% 4% 5% 6% 7% 8% 9% 10%
Scotland Rest of UK
Sector Scorecard Scotland Analysis Report 2019
24
Across the two years of data, reinvestment rates have remained stable in Scotland and the
rest of the UK. This suggests that, while housing associations may have increased
reinvestment in existing properties (such as major repairs), there may have been less
reinvestment in development and acquisition of new properties. Notwithstanding a slight
increase in the asset base denominator over the period, the overall amount reinvested has
remained consistent across the sector.
Investment in communities Sector Scorecard participants are closely associated with a social mission – to make a
positive contribution to the communities where they own and manage homes. Investment in
communities measures this through expenditure on community or neighbourhood activities
such as employment skills training, money advice and community groups.
The definition for this measure has expanded from the 2018 exercise, which was linked to
accountancy figures. Housing associations should include all expenditure relating to
Investment in communities – not just the amount noted in financial statements.
In total, 24 Scottish organisations submitted data for this measure, between them recording
£9m of investment. Two organisations recorded £0 for this measure. At the other end of the
scale, three organisations recorded expenditure over £0.5m; all of which were in the 1,000 to
5,000 units size band.
Quartile 1
2.6%
Median
5.1%
Quartile 3
9.3%
Quartile 1
2.3%
Median
4.9%
Quartile 3
6.8%
0% 1% 2% 3% 4% 5% 6% 7% 8% 9% 10%
2018/19 2017/18
Number of participants: 25
Sector Scorecard Scotland Analysis Report 2019
25
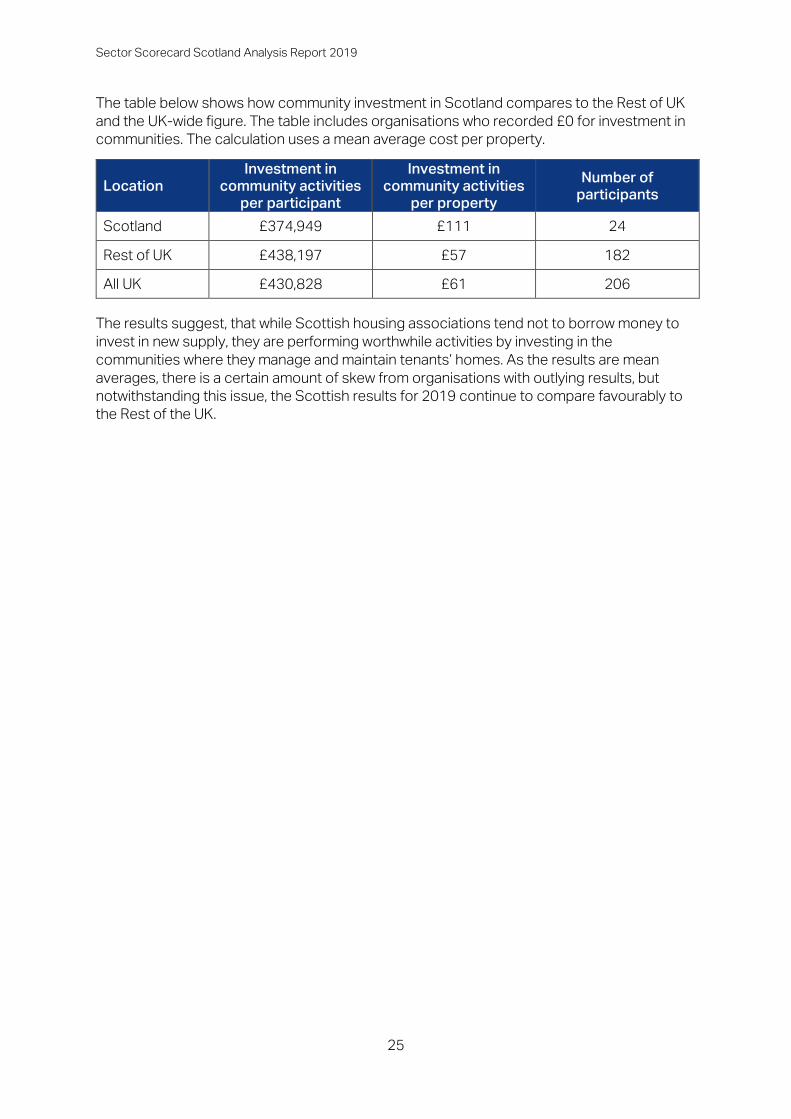
The table below shows how community investment in Scotland compares to the Rest of UK
and the UK-wide figure. The table includes organisations who recorded £0 for investment in
communities. The calculation uses a mean average cost per property.
Location
Investment in
community activities
per participant
Investment in
community activities
per property
Number of
participants
Scotland £374,949 £111 24
Rest of UK £438,197 £57 182
All UK £430,828 £61 206
The results suggest, that while Scottish housing associations tend not to borrow money to
invest in new supply, they are performing worthwhile activities by investing in the
communities where they manage and maintain tenants’ homes. As the results are mean
averages, there is a certain amount of skew from organisations with outlying results, but
notwithstanding this issue, the Scottish results for 2019 continue to compare favourably to
the Rest of the UK.
Sector Scorecard Scotland Analysis Report 2019
26
Effective Asset Management
An important part of a housing association’s business is looking after the assets it manages,
ensuring they are good quality homes that people want to live in, now and in the future. Any
business maintaining fixed assets needs to make strategic investments to renew and
improve components, meet health and safety compliance measures as well as seeing a
sustained financial, social and environmental return in the long term.
All three measures in this section have been part of the Sector Scorecard since the 2017
pilot exercise.
Return on capital employed (ROCE) Return on capital employed (ROCE) shows how well a provider is using both its capital and
debt to generate a financial return. It is a commonly-used ratio to assess the efficient
investment of capital resources. The ROCE metric supports associations with a wide range
of capital investment programmes. However, it can be influenced by the nature of the
organisation’s property portfolio (e.g. balance between market and social rent, age of stock,
historic debt, basis of valuation).
While ROCE is like the operating margin measures in that it uses an association’s surplus in
the numerator, unlike operating margin it measures this against the amount of capital in an
association’s asset base. Put simply, this means that an association’s surplus is compared to
the value of its properties.
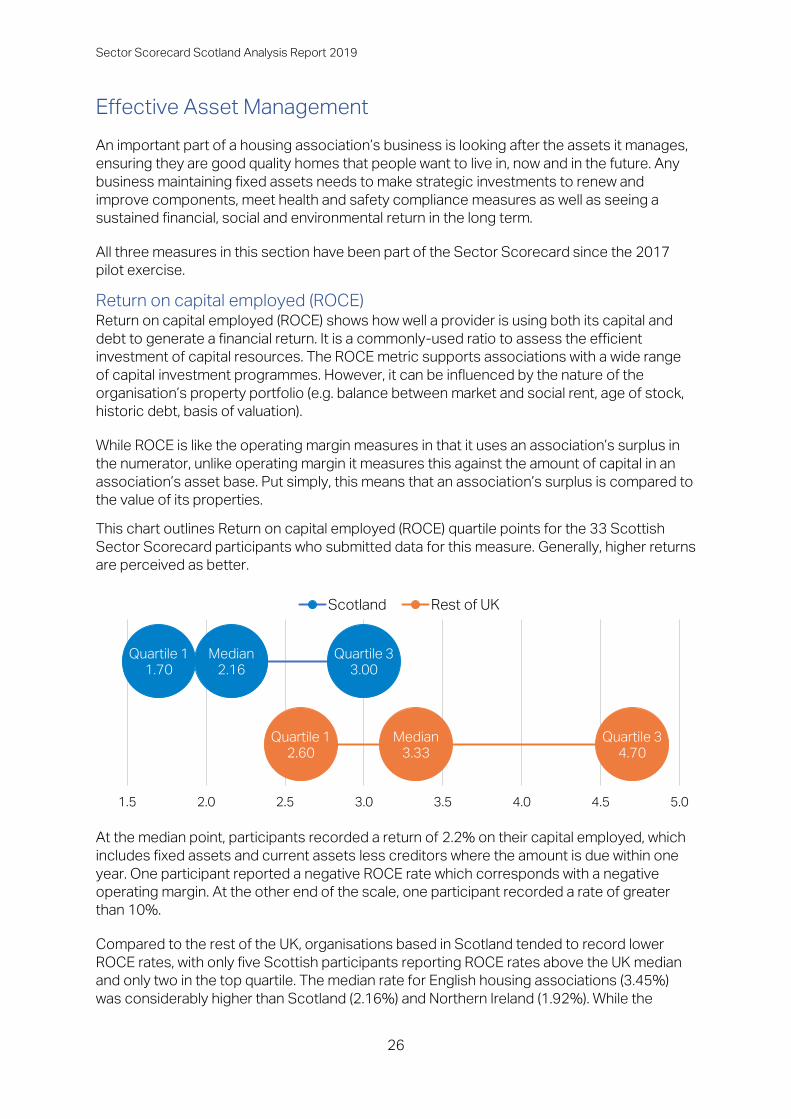
This chart outlines Return on capital employed (ROCE) quartile points for the 33 Scottish
Sector Scorecard participants who submitted data for this measure. Generally, higher returns
are perceived as better.
At the median point, participants recorded a return of 2.2% on their capital employed, which
includes fixed assets and current assets less creditors where the amount is due within one
year. One participant reported a negative ROCE rate which corresponds with a negative
operating margin. At the other end of the scale, one participant recorded a rate of greater
than 10%.
Compared to the rest of the UK, organisations based in Scotland tended to record lower
ROCE rates, with only five Scottish participants reporting ROCE rates above the UK median
and only two in the top quartile. The median rate for English housing associations (3.45%)
was considerably higher than Scotland (2.16%) and Northern Ireland (1.92%). While the
Quartile 1
1.70
Median
2.16
Quartile 3
3.00
Quartile 1
2.60
Median
3.33
Quartile 3
4.70
1.5 2.0 2.5 3.0 3.5 4.0 4.5 5.0
Scotland Rest of UK
Sector Scorecard Scotland Analysis Report 2019
27
Scottish result corresponds with comparatively high costs per unit and comparatively low
operating margins, the Northern Ireland figure appears to be driven by higher asset values.
Landlords across the sector with comparatively high ROCE rates tend to have higher gearing
ratios, higher operating margins, lower costs per unit and higher reinvestment rates. This
adds to the view that there is a group of housing associations that have incorporated
treasury management into their business model alongside associations whose business
solely concentrates on landlord functions of management and maintenance.
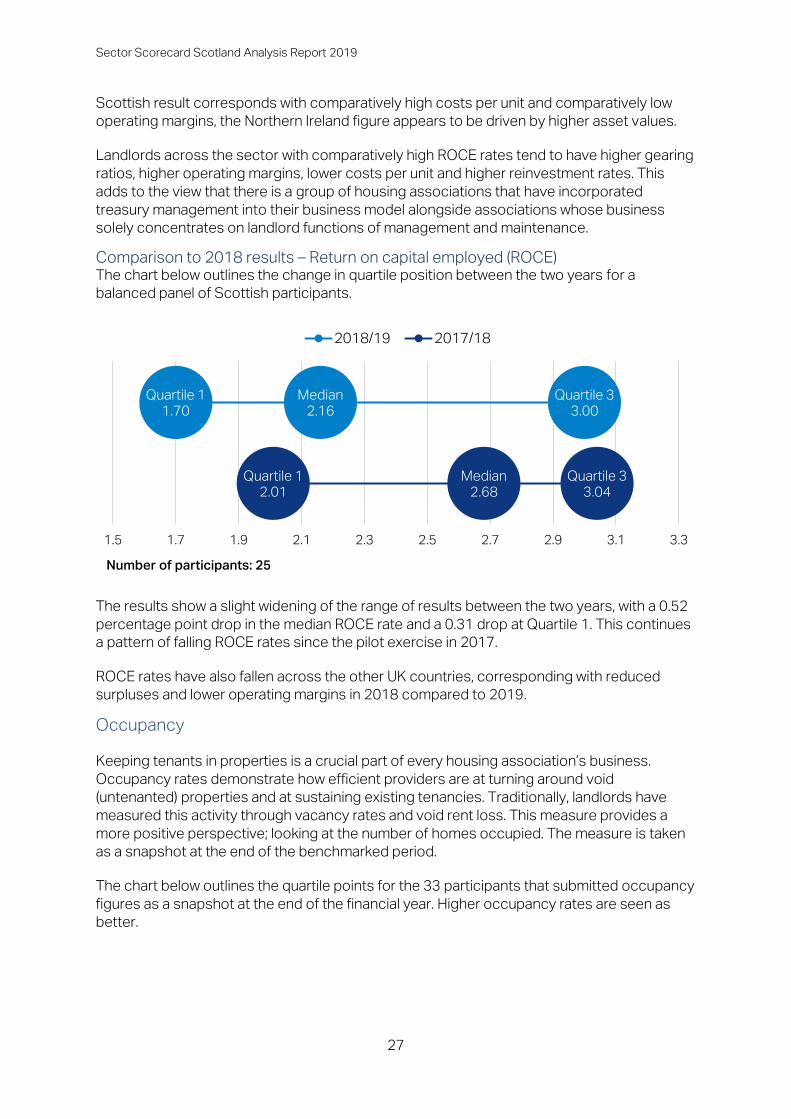
Comparison to 2018 results – Return on capital employed (ROCE) The chart below outlines the change in quartile position between the two years for a
balanced panel of Scottish participants.
The results show a slight widening of the range of results between the two years, with a 0.52
percentage point drop in the median ROCE rate and a 0.31 drop at Quartile 1. This continues
a pattern of falling ROCE rates since the pilot exercise in 2017.
ROCE rates have also fallen across the other UK countries, corresponding with reduced
surpluses and lower operating margins in 2018 compared to 2019.
Occupancy
Keeping tenants in properties is a crucial part of every housing association’s business.
Occupancy rates demonstrate how efficient providers are at turning around void
(untenanted) properties and at sustaining existing tenancies. Traditionally, landlords have
measured this activity through vacancy rates and void rent loss. This measure provides a
more positive perspective; looking at the number of homes occupied. The measure is taken
as a snapshot at the end of the benchmarked period.
The chart below outlines the quartile points for the 33 participants that submitted occupancy
figures as a snapshot at the end of the financial year. Higher occupancy rates are seen as
better.
Quartile 1
1.70
Median
2.16
Quartile 3
3.00
Quartile 1
2.01
Median
2.68
Quartile 3
3.04
1.5 1.7 1.9 2.1 2.3 2.5 2.7 2.9 3.1 3.3
2018/19 2017/18
Number of participants: 25
Sector Scorecard Scotland Analysis Report 2019
28
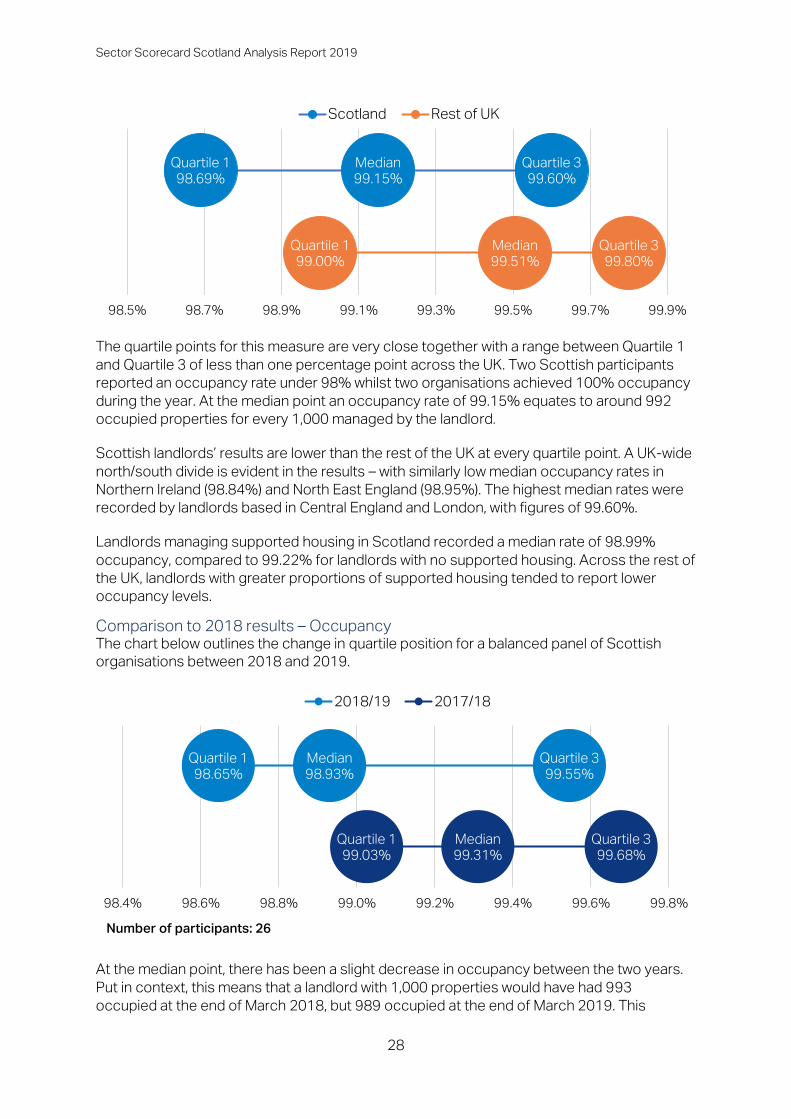
The quartile points for this measure are very close together with a range between Quartile 1
and Quartile 3 of less than one percentage point across the UK. Two Scottish participants
reported an occupancy rate under 98% whilst two organisations achieved 100% occupancy
during the year. At the median point an occupancy rate of 99.15% equates to around 992
occupied properties for every 1,000 managed by the landlord.
Scottish landlords’ results are lower than the rest of the UK at every quartile point. A UK-wide
north/south divide is evident in the results – with similarly low median occupancy rates in
Northern Ireland (98.84%) and North East England (98.95%). The highest median rates were
recorded by landlords based in Central England and London, with figures of 99.60%.
Landlords managing supported housing in Scotland recorded a median rate of 98.99%
occupancy, compared to 99.22% for landlords with no supported housing. Across the rest of
the UK, landlords with greater proportions of supported housing tended to report lower
occupancy levels.
Comparison to 2018 results – Occupancy The chart below outlines the change in quartile position for a balanced panel of Scottish
organisations between 2018 and 2019.
At the median point, there has been a slight decrease in occupancy between the two years.
Put in context, this means that a landlord with 1,000 properties would have had 993
occupied at the end of March 2018, but 989 occupied at the end of March 2019. This
Quartile 1
98.69%
Median
99.15%
Quartile 3
99.60%
Quartile 1
99.00%
Median
99.51%
Quartile 3
99.80%
98.5% 98.7% 98.9% 99.1% 99.3% 99.5% 99.7% 99.9%
Scotland Rest of UK
Quartile 1
98.65%
Median
98.93%
Quartile 3
99.55%
Quartile 1
99.03%
Median
99.31%
Quartile 3
99.68%
98.4% 98.6% 98.8% 99.0% 99.2% 99.4% 99.6% 99.8%
2018/19 2017/18
Number of participants: 26

Sector Scorecard Scotland Analysis Report 2019
29
increase of four empty properties between years demonstrates that the change is relatively
small. Across the UK, occupancy increased by 0.7 percentage points to 2019 following a
small decline in the previous year. This suggests that this measure fluctuates very slightly
between years.
Ratio of responsive repairs to planned maintenance Effective planning based on detailed stock condition surveys and understanding of assets
potentially allows the sector to reduce spend on responsive repairs in favour of planned
maintenance. There is an assumption that planned work is the more cost-effective way of
maintaining properties.
This measure looks at the ratio of an association’s expenditure on routine maintenance to
spend on planned maintenance, major repairs and capitalised major repairs. It is calculated
by dividing routine maintenance expenditure by the sum of planned maintenance, major
repairs and capitalised major repairs.
The chart below outlines the quartile points for the 33 Scottish organisations that submitted
data for the ratio of responsive repairs to planned maintenance. Generally, a lower ratio of
responsive repairs to planned works is considered better, though there are likely to be
explanatory reasons for ratios that are at either end of the scale. This measure may also be
affected by cyclical fluctuations in expenditure.
The chart shows that at the median, participants’ expenditure on responsive repairs equates
to around 61% of their planned maintenance expenditure, for example, if an association
recorded £10m planned maintenance expenditure, a 0.61 result would indicate responsive
repairs expenditure of £6.1m. Scottish participants tend to record lower ratios when
compared to the Rest of the UK group, which indicates that they are spending a little more on
planned maintenance than responsive repairs. There are notably fewer organisations with
very high ratios.
Two Scottish landlords recorded results over 1.00, which means they spent more on
responsive repairs than on major repairs in the period. For four organisations, responsive
repairs spend equated to less than a quarter of planned maintenance. These organisations
were a mix of sizes and types suggesting that organisational characteristics do not influence
comparative expenditure on responsive and major repairs.
Unlike last year’s figures, there was no correlation across the UK between this ratio and
participants’ major repairs cost per unit (CPU). This suggests that comparative expenditure
Quartile 1
0.43
Median
0.61
Quartile 3
0.69
Quartile 1
0.47
Median
0.66
Quartile 3
0.95
0.4 0.5 0.6 0.7 0.8 0.9 1.0
Scotland Rest of UK
Sector Scorecard Scotland Analysis Report 2019
30
on major repairs has no effect on this ratio. Likewise, there was no correlation between
maintenance CPU and this ratio. It appears that comparative expenditure on routine
maintenance has little bearing on this figure in the light of increased costs of health and
safety compliance and related items.
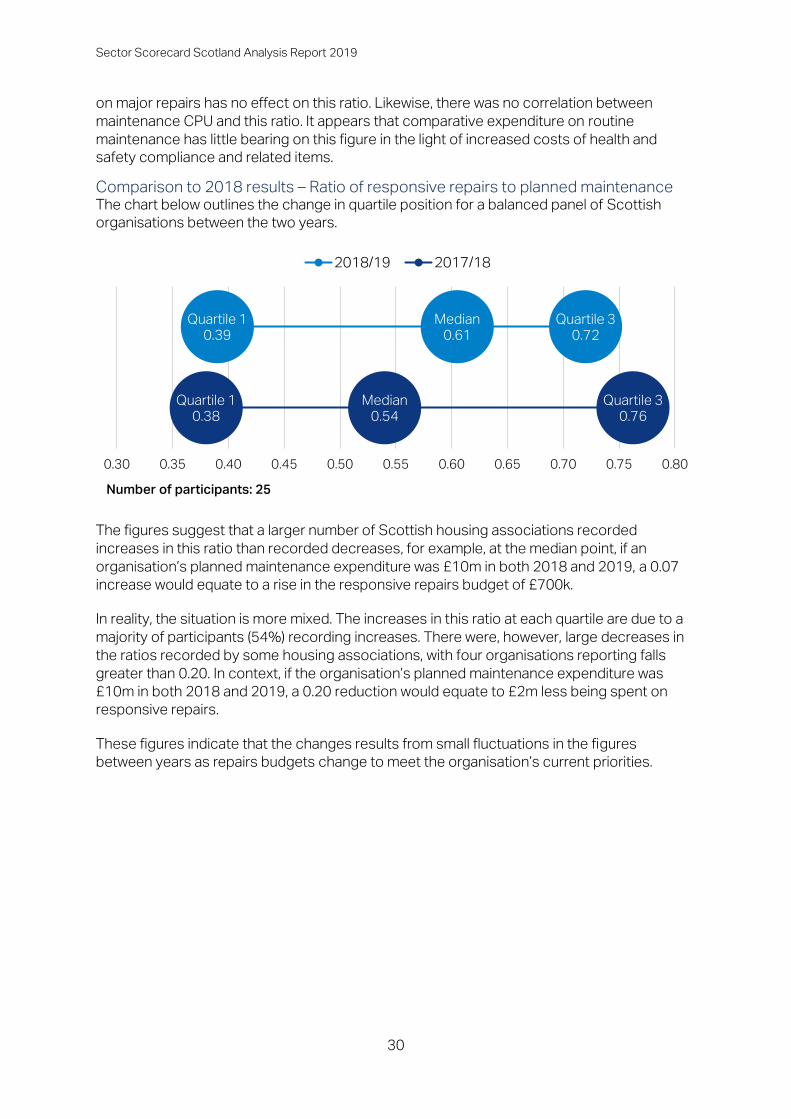
Comparison to 2018 results – Ratio of responsive repairs to planned maintenance The chart below outlines the change in quartile position for a balanced panel of Scottish
organisations between the two years.
The figures suggest that a larger number of Scottish housing associations recorded
increases in this ratio than recorded decreases, for example, at the median point, if an
organisation’s planned maintenance expenditure was £10m in both 2018 and 2019, a 0.07
increase would equate to a rise in the responsive repairs budget of £700k.
In reality, the situation is more mixed. The increases in this ratio at each quartile are due to a
majority of participants (54%) recording increases. There were, however, large decreases in
the ratios recorded by some housing associations, with four organisations reporting falls
greater than 0.20. In context, if the organisation’s planned maintenance expenditure was
£10m in both 2018 and 2019, a 0.20 reduction would equate to £2m less being spent on
responsive repairs.
These figures indicate that the changes results from small fluctuations in the figures
between years as repairs budgets change to meet the organisation’s current priorities.
Quartile 1
0.39
Median
0.61
Quartile 3
0.72
Quartile 1
0.38
Median
0.54
Quartile 3
0.76
0.30 0.35 0.40 0.45 0.50 0.55 0.60 0.65 0.70 0.75 0.80
2018/19 2017/18
Number of participants: 25

Sector Scorecard Scotland Analysis Report 2019
31
Operating Efficiencies
Housing associations need to demonstrate how they deliver value for money through their
strategic and operational choices. The Sector Scorecard takes this on board with measures
looking at the cost of providing social housing as well as income collection rates and
proportionate expenditure on overheads.
Headline social housing cost per unit This measure uses components from associations’ financial statements to create a social
housing cost figure. This is divided by the number of properties owned and/or managed by
the association for a cost per unit figure that is comparable between different organisations.
The chart below outlines the quartile points for the 34 organisations that submitted data for
the headline cost per unit measure. It is important for associations to understand their cost
drivers and the outcomes they are achieving by incurring this expenditure.
At the median point, Scottish housing associations spend £3,783 each year managing and
maintaining each social housing property.
Put into context; if the annual rent due from a property is £4,000, a typical housing
association will spend about 95% of rental income on management and maintenance. After
London and Yorkshire and the Humber, Scottish landlords recorded the third highest median
cost per unit. These locations recorded comparatively low median operating margin (social
housing lettings) results. This means higher costs in Scotland may be impacting operating
margins to a greater extent than reduced income.
Underneath these headlines, there is some variation. Across the Scottish participants, costs
range from £2,035 to £11,465 per unit with the latter managing a comparatively high
proportion of supported housing. The effect of supported housing on the headline social
cost per unit has been documented by the English regulator11. In 2019 Sector Scorecard
participants managing a large proportion of supported housing properties across the UK
recorded a median cost per unit of £6,775, which is more than £3,000 per unit higher than
the national median. This is due to the high support costs and broader range of activities that
care and support providers undertake. A group of housing associations is working with the
NHF, HouseMark and Acuity to understand the drivers for higher supported housing costs
with a Supported Housing Sector Scorecard initiative, which is due to be piloted in 2020.
11 https://www.gov.uk/government/publications/value-for-money-summary-and-technical-reports
Quartile 1
£3,099
Median
£3,783
Quartile 3
£4,562
Quartile 1
£3,174
Median
£3,686
Quartile 3
£4,718
£3,000 £3,250 £3,500 £3,750 £4,000 £4,250 £4,500 £4,750 £5,000
Scotland Rest of UK
Sector Scorecard Scotland Analysis Report 2019
32
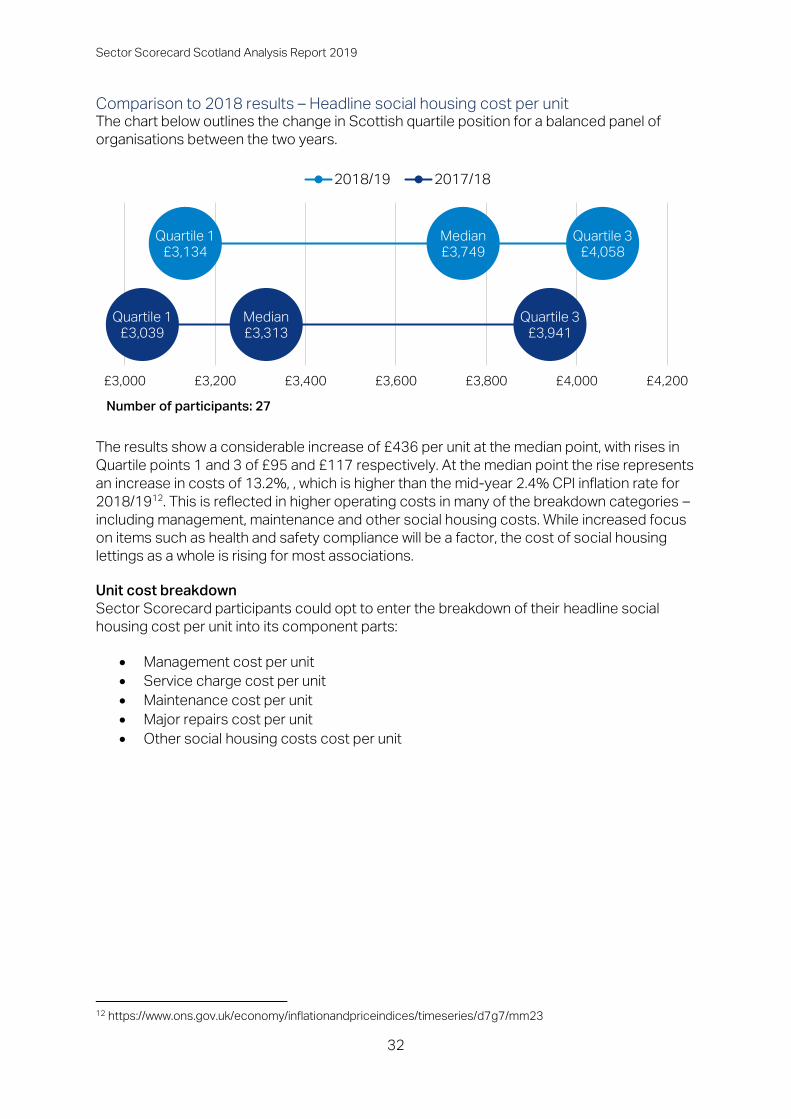
Comparison to 2018 results – Headline social housing cost per unit The chart below outlines the change in Scottish quartile position for a balanced panel of
organisations between the two years.
The results show a considerable increase of £436 per unit at the median point, with rises in
Quartile points 1 and 3 of £95 and £117 respectively. At the median point the rise represents
an increase in costs of 13.2%, , which is higher than the mid-year 2.4% CPI inflation rate for
2018/1912. This is reflected in higher operating costs in many of the breakdown categories –
including management, maintenance and other social housing costs. While increased focus
on items such as health and safety compliance will be a factor, the cost of social housing
lettings as a whole is rising for most associations.
Unit cost breakdown
Sector Scorecard participants could opt to enter the breakdown of their headline social
housing cost per unit into its component parts:
• Management cost per unit
• Service charge cost per unit
• Maintenance cost per unit
• Major repairs cost per unit
• Other social housing costs cost per unit
12 https://www.ons.gov.uk/economy/inflationandpriceindices/timeseries/d7g7/mm23
Quartile 1
£3,134
Median
£3,749
Quartile 3
£4,058
Quartile 1
£3,039
Median
£3,313
Quartile 3
£3,941
£3,000 £3,200 £3,400 £3,600 £3,800 £4,000 £4,200
2018/19 2017/18
Number of participants: 27
Sector Scorecard Scotland Analysis Report 2019
33
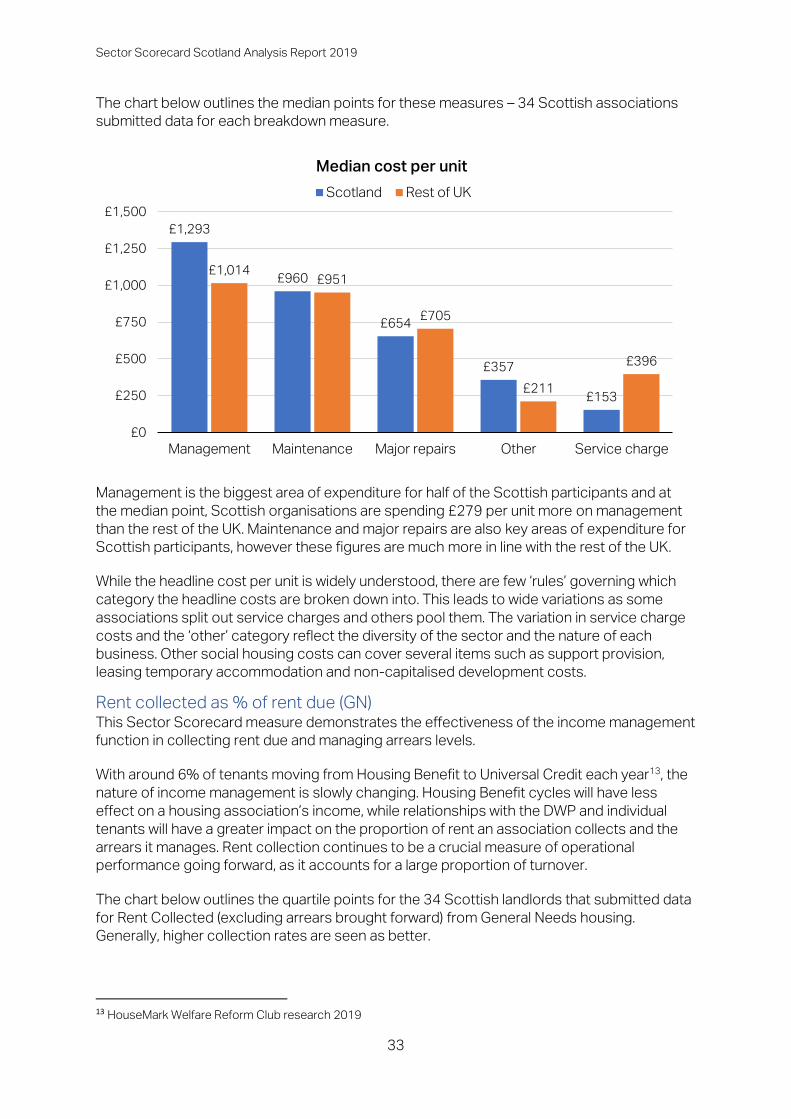
The chart below outlines the median points for these measures – 34 Scottish associations
submitted data for each breakdown measure.
Management is the biggest area of expenditure for half of the Scottish participants and at
the median point, Scottish organisations are spending £279 per unit more on management
than the rest of the UK. Maintenance and major repairs are also key areas of expenditure for
Scottish participants, however these figures are much more in line with the rest of the UK.
While the headline cost per unit is widely understood, there are few ‘rules’ governing which
category the headline costs are broken down into. This leads to wide variations as some
associations split out service charges and others pool them. The variation in service charge
costs and the ‘other’ category reflect the diversity of the sector and the nature of each
business. Other social housing costs can cover several items such as support provision,
leasing temporary accommodation and non-capitalised development costs.
Rent collected as % of rent due (GN) This Sector Scorecard measure demonstrates the effectiveness of the income management
function in collecting rent due and managing arrears levels.
With around 6% of tenants moving from Housing Benefit to Universal Credit each year13, the
nature of income management is slowly changing. Housing Benefit cycles will have less
effect on a housing association’s income, while relationships with the DWP and individual
tenants will have a greater impact on the proportion of rent an association collects and the
arrears it manages. Rent collection continues to be a crucial measure of operational
performance going forward, as it accounts for a large proportion of turnover.
The chart below outlines the quartile points for the 34 Scottish landlords that submitted data
for Rent Collected (excluding arrears brought forward) from General Needs housing.
Generally, higher collection rates are seen as better.
13 HouseMark Welfare Reform Club research 2019
£1,293
£960
£654
£357
£153
£1,014£951
£705
£211
£396
£0
£250
£500
£750
£1,000
£1,250
£1,500
Management Maintenance Major repairs Other Service charge
Median cost per unit
Scotland Rest of UK
Sector Scorecard Scotland Analysis Report 2019
34
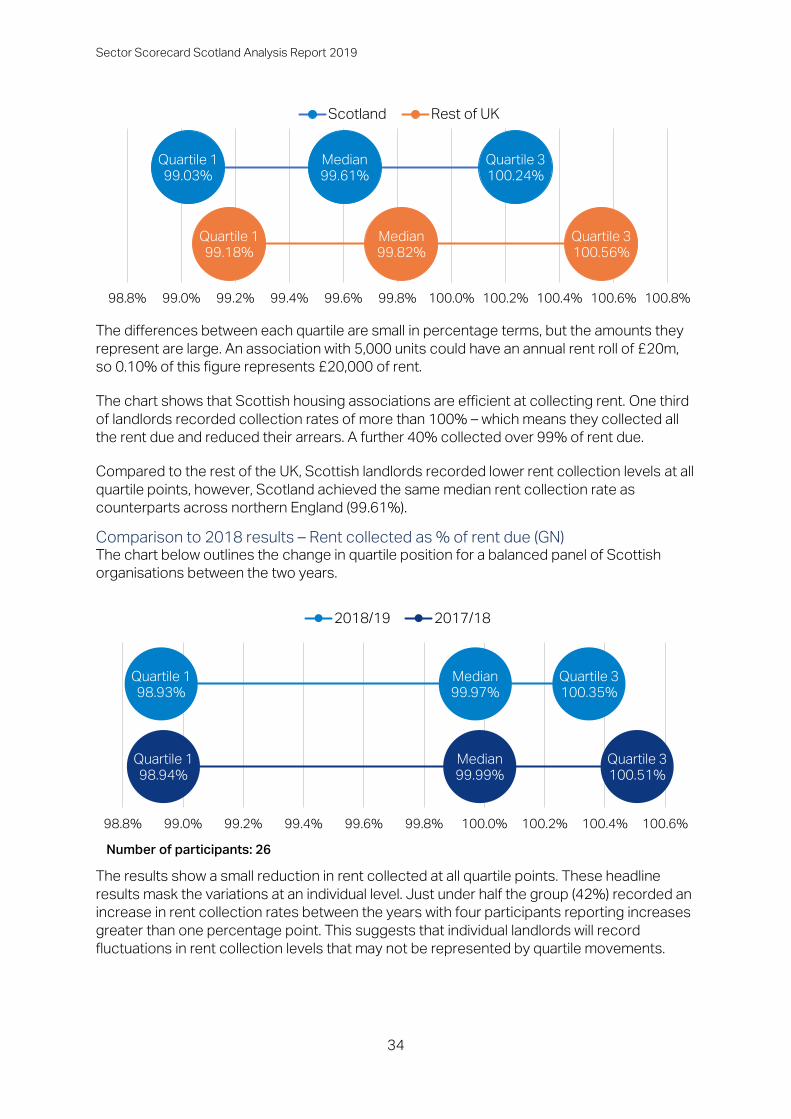
The differences between each quartile are small in percentage terms, but the amounts they
represent are large. An association with 5,000 units could have an annual rent roll of £20m,
so 0.10% of this figure represents £20,000 of rent.
The chart shows that Scottish housing associations are efficient at collecting rent. One third
of landlords recorded collection rates of more than 100% – which means they collected all
the rent due and reduced their arrears. A further 40% collected over 99% of rent due.
Compared to the rest of the UK, Scottish landlords recorded lower rent collection levels at all
quartile points, however, Scotland achieved the same median rent collection rate as
counterparts across northern England (99.61%).
Comparison to 2018 results – Rent collected as % of rent due (GN) The chart below outlines the change in quartile position for a balanced panel of Scottish
organisations between the two years.
The results show a small reduction in rent collected at all quartile points. These headline
results mask the variations at an individual level. Just under half the group (42%) recorded an
increase in rent collection rates between the years with four participants reporting increases
greater than one percentage point. This suggests that individual landlords will record
fluctuations in rent collection levels that may not be represented by quartile movements.
Quartile 1
99.03%
Median
99.61%
Quartile 3
100.24%
Quartile 1
99.18%
Median
99.82%
Quartile 3
100.56%
98.8% 99.0% 99.2% 99.4% 99.6% 99.8% 100.0% 100.2% 100.4% 100.6% 100.8%
Scotland Rest of UK
Quartile 1
98.93%
Median
99.97%
Quartile 3
100.35%
Quartile 1
98.94%
Median
99.99%
Quartile 3
100.51%
98.8% 99.0% 99.2% 99.4% 99.6% 99.8% 100.0% 100.2% 100.4% 100.6%
2018/19 2017/18
Number of participants: 26
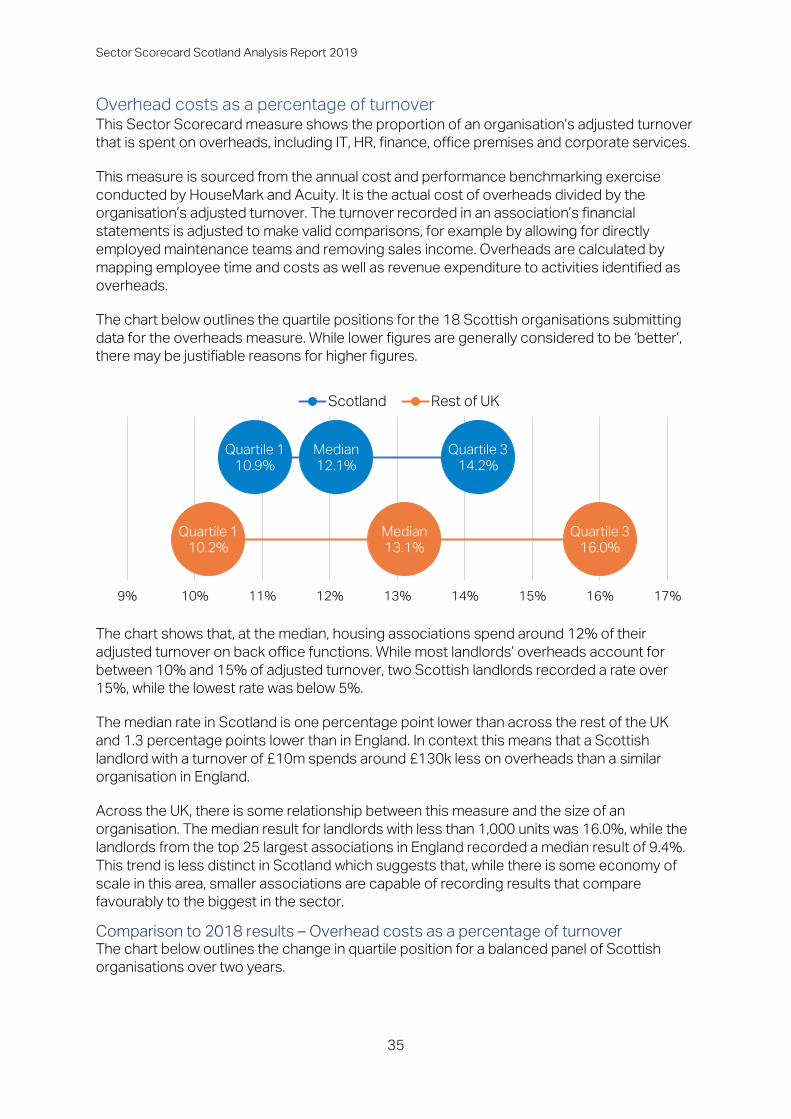
Sector Scorecard Scotland Analysis Report 2019
35
Overhead costs as a percentage of turnover This Sector Scorecard measure shows the proportion of an organisation’s adjusted turnover
that is spent on overheads, including IT, HR, finance, office premises and corporate services.
This measure is sourced from the annual cost and performance benchmarking exercise
conducted by HouseMark and Acuity. It is the actual cost of overheads divided by the
organisation’s adjusted turnover. The turnover recorded in an association’s financial
statements is adjusted to make valid comparisons, for example by allowing for directly
employed maintenance teams and removing sales income. Overheads are calculated by
mapping employee time and costs as well as revenue expenditure to activities identified as
overheads.
The chart below outlines the quartile positions for the 18 Scottish organisations submitting
data for the overheads measure. While lower figures are generally considered to be ‘better’,
there may be justifiable reasons for higher figures.
The chart shows that, at the median, housing associations spend around 12% of their
adjusted turnover on back office functions. While most landlords’ overheads account for
between 10% and 15% of adjusted turnover, two Scottish landlords recorded a rate over
15%, while the lowest rate was below 5%.
The median rate in Scotland is one percentage point lower than across the rest of the UK
and 1.3 percentage points lower than in England. In context this means that a Scottish
landlord with a turnover of £10m spends around £130k less on overheads than a similar
organisation in England.
Across the UK, there is some relationship between this measure and the size of an
organisation. The median result for landlords with less than 1,000 units was 16.0%, while the
landlords from the top 25 largest associations in England recorded a median result of 9.4%.
This trend is less distinct in Scotland which suggests that, while there is some economy of
scale in this area, smaller associations are capable of recording results that compare
favourably to the biggest in the sector.
Comparison to 2018 results – Overhead costs as a percentage of turnover The chart below outlines the change in quartile position for a balanced panel of Scottish
organisations over two years.
Quartile 1
10.9%
Median
12.1%
Quartile 3
14.2%
Quartile 1
10.2%
Median
13.1%
Quartile 3
16.0%
9% 10% 11% 12% 13% 14% 15% 16% 17%
Scotland Rest of UK
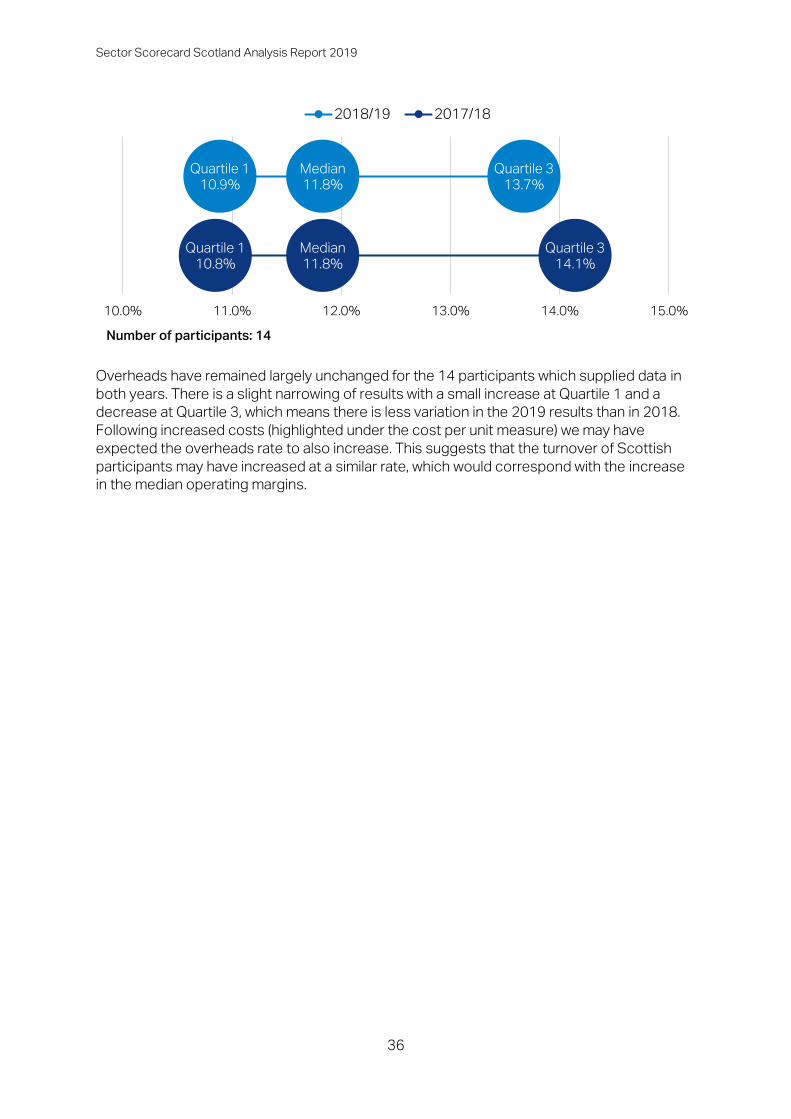
Sector Scorecard Scotland Analysis Report 2019
36
Overheads have remained largely unchanged for the 14 participants which supplied data in
both years. There is a slight narrowing of results with a small increase at Quartile 1 and a
decrease at Quartile 3, which means there is less variation in the 2019 results than in 2018.
Following increased costs (highlighted under the cost per unit measure) we may have
expected the overheads rate to also increase. This suggests that the turnover of Scottish
participants may have increased at a similar rate, which would correspond with the increase
in the median operating margins.
Quartile 1
10.9%
Median
11.8%
Quartile 3
13.7%
Quartile 1
10.8%
Median
11.8%
Quartile 3
14.1%
10.0% 11.0% 12.0% 13.0% 14.0% 15.0%
2018/19 2017/18
Number of participants: 14
Sector Scorecard Scotland Analysis Report 2019
37
Conclusions
Now in its third year, the Sector Scorecard continues to demonstrate the commitment of
housing associations across the UK to transparency by publicly taking part in a voluntary
exercise to compare value for money and efficiency.
The results in this report continue to show the sector’s commitment to meet the demand for
new homes while looking after their core business of managing and maintaining social
housing for existing tenants.
In 2019, we have seen how landlords have taken onboard additional costs of items such as
health and safety compliance with lower operating margins and higher maintenance costs.
This appears to have had little impact on customer-facing services, with no notable changes
to satisfaction levels or investment in communities.
Going forward, it is vital that the sector continues to measure what is important to boards,
executive teams and tenants, as well as SHR. Landlords should use the Sector Scorecard
exercise to understand how operating conditions can affect the service provided to tenants.
As conditions change for housing associations, the Scorecard will adapt to meet the need to
share, compare and learn.
Sector Scorecard Scotland Analysis Report 2019
38
Appendices
Appendix 1: Sector Scorecard definitions Sector Scorecard definitions are also available online from www.sectorscorecard.com
* Denotes where the measure is an English regulatory VFM metric
Definitions – Business Health
RSH 101 – Operating margin (overall) *
The Operating Margin demonstrates the profitability of operating assets before exceptional
expenses are considered. Increasing margins are one way to improve the financial efficiency
of a business. When the regulator assesses this ratio, consideration is given to registered
providers’ purpose and objectives (including their social objectives). Further consideration is
also given to specialist providers who tend to have lower margins than average.
Operating margin (overall) = (A ÷ B) x 100
A = Overall operating surplus/(deficit), not including any Gain/(loss) on disposal of fixed assets
(housing properties). Similarly, results of JVs are not included in either turnover or operating
surplus.
B = Turnover (overall)
Source = statutory financial statements or FVA. Clarification of the accounting terms used in
this and other definitions provided by the Regulator for Social Housing may be found here:
Accounting direction 2015.
RSH 102 – Operating margin (social housing lettings) *
Operating margin (social housing lettings) = (A ÷ B) x 100
A = Operating surplus/(deficit) on social housing lettings, not including Gain/(loss) on disposal
of fixed assets (housing properties). Similarly, results of JVs are not included in either
turnover or operating surplus.
B = Turnover from social housing lettings
Source = statutory financial statements or FVA. Clarification of the accounting terms used in
this and other definitions provided by the Regulator for Social Housing may be found here:
Accounting direction 2015.
RSH 103 – EBITDA MRI (as % interest) *
The EBITDA MRI interest cover measure is a key indicator for liquidity and investment
capacity. It seeks to measure the level of surplus that a registered provider generates
compared to interest payable; the measure avoids any distortions stemming from the
depreciation charge.
EBITDA MRI (as % interest) = (EBITDA MRI ÷ Gross interest payable) x 100
EBITDA MRI = [Overall operating surplus / (deficit)
- Gain/(loss) on disposal of fixed assets (housing properties)
- Amortised government grant
- Grant taken to income
Sector Scorecard Scotland Analysis Report 2019
39
+ Interest receivable
- Capitalised major repairs expenditure for period
+ Total depreciation charge for period]
Gross interest payable = [Interest capitalised + Interest payable and financing costs]
Clarification of the accounting terms used in this and other definitions provided by the
Regulator for Social Housing may be found here: Accounting direction 2015.
Definitions – Development (Capacity & Supply)
New supply delivered: absolute
SS 201A – social housing units
This uses the numerator for the RSH VFM metric on new supply (social housing).
Total social housing units developed, or newly built units acquired in-year (owned):
• Social rent general needs housing (excluding Affordable Rent)
• Affordable Rent general needs housing
• Social rent supported housing and sheltered housing (excluding Affordable Rent)
• Affordable Rent supported housing and sheltered housing
• Low Cost Home Ownership
• Care homes
• Other social housing units
• Social leasehold.
MHCLG definition of completion: In principle, a dwelling is regarded as completed when it
becomes ready for occupation or when a completion certificate is issued whether it is in fact
occupied or not.
Newly-built acquired properties include new dwellings built where construction is carried out
by another entity (such as newly-built S106 acquisitions).
Also, include additions of properties which are new to the social rented sector, i.e. not
previously held by registered providers or otherwise let on social or affordable tenancies,
including acquisitions from the open market regardless of whether these are newly built or
not.
A unit completed by a joint venture with a private sector partner should be counted as a
whole unit. A unit completed by a joint venture with another registered provider should be
counted as a whole unit only by the provider that will own the unit (to avoid double counting).
SS 201B – non-social housing units
This uses the numerator for the RSH VFM metric on new supply (non-social housing).
Total non-social units developed, or newly built units acquired in-year (owned):
• Total non-social rental housing units owned
• Non-social leasehold units owned
• New outright sale units developed or acquired
Sector Scorecard Scotland Analysis Report 2019
40
MHCLG definition of completion: In principle, a dwelling is regarded as completed when it
becomes ready for occupation or when a completion certificate is issued whether it is in fact
occupied or not.
Newly-built acquired properties includes new dwellings built where construction is carried
out by another entity (such as newly-built S106 acquisitions).
A unit completed by a joint venture with a private sector partner should be counted as a
whole unit. A unit completed by a joint venture with another registered provider should be
counted as a whole unit only by the provider that will own the unit (to avoid double counting).
New supply delivered %
RSH 204 A – social housing units
New social housing supply delivered as a percentage of stock owned, during the period April
– March.
[A / B] * 100
A = Total social housing units developed or newly built units acquired in-year (owned) [Social
rent general needs housing (excluding Affordable Rent), Affordable Rent general needs
housing Social rent supported housing and sheltered housing (excluding Affordable Rent),
Affordable Rent supported housing and sheltered housing, Low Cost Home Ownership, Care
homes, Other social housing units, Social leasehold]
B = [Total social housing units owned at period end (‘social units’ as defined in numerator)]
MHCLG definition of completion: In principle, a dwelling is regarded as completed when it
becomes ready for occupation or when a completion certificate is issued whether it is in fact
occupied or not.
Newly-built acquired properties includes new dwellings built where construction is carried
out by another entity (such as newly-built S106 acquisitions).
A unit completed by a joint venture with a private sector partner should be counted as a
whole unit. A unit completed by a joint venture with another registered provider should be
counted as a whole unit only by the provider that will own the unit (to avoid double counting).
RSH 205 B – non-social housing units
New non-social housing supply delivered as a percentage of stock owned, during the period
April – March.
[A / B] * 100
A = [Total non-social units developed, or newly built units acquired in-year (owned)
(Total non-social rental housing units owned, non-social leasehold units owned, New outright
sale units developed or acquired)]
B = [Total social housing units owned (period end)
+ Total non-social rental housing units owned (period end)
+ Social leasehold units owned (period end) [if not included in Total social housing
units owned]
Sector Scorecard Scotland Analysis Report 2019
41
+ Non-social leasehold units owned (period end)]
MHCLG definition of completion: In principle, a dwelling is regarded as completed when it
becomes ready for occupation or when a completion certificate is issued whether it is in fact
occupied or not.
Newly-built acquired properties includes new dwellings built where construction is carried
out by another entity (such as newly-built S106 acquisitions).
A unit completed by a joint venture with a private sector partner should be counted as a
whole unit. A unit completed by a joint venture with another registered provider should be
counted as a whole unit only by the provider that will own the unit (to avoid double counting).
RSH 203 – Gearing *
This metric assesses how much of the adjusted assets are made up of debt and the degree
of dependence on debt finance. It is often a key indicator of a registered provider’s appetite
for growth.
Gearing = (Net debt ÷ Carrying value of housing properties) x 100
Net Debt = [Short-term loans
+ Long term loans
- Cash and cash equivalents
+ Amounts owed to group undertakings
+ Finance lease obligations]
Carrying value of housing properties = [Tangible fixed assets: Housing properties at cost
(Period end) / Tangible fixed assets: Housing properties at valuation (Period end)]
NB. Cost is the net book value after any depreciation rather than just the cost of properties if
the intention is to use the word cost as it is used in the Global Accounts.
SPBM members: If you use different version of cost, you must indicate in the profile data for
your organisation whether properties are held at historic cost, deemed cost or valuation.
The regulator recognises that there is a wide variety of different gearing measures in use
across the sector; different organisations will use different metrics to reflect the nature of
their business and their existing loan covenants.
In order to reflect the growing number of providers who operate through the capital markets
in which to access funding, these metric measures gearing on a net debt basis.
This will provide a more meaningful measure of the financial position of the significant
minority of providers who have recently raised funding from the capital markets and
therefore hold a significant amount of cash, in preparation for a range of investment
programmes. The regulator recognises that registered providers can be restricted by
lenders’ covenants and therefore may not have the ability in which to increase the loan
portfolio despite showing a relatively average gearing result.
Clarification of the accounting terms used in this and other definitions provided by the
Regulator for Social Housing may be found here: Accounting direction 2015.
Sector Scorecard Scotland Analysis Report 2019
42
Definitions – Outcomes Delivered
STA 001 GN/OP – Customer satisfaction GN & OP
Percentage of respondents very or fairly satisfied that their landlord’s services overall. In line
with STAR guidance. This includes General Needs and sheltered housing
RSH 304 – Reinvestment %*
This metric looks at the investment in properties (existing stock as well as New Supply) as a
percentage of the value of total properties held.14
Reinvestment % = [A ÷ B] x 100
A = [Properties Acquired (total housing properties)
+ Development of new properties (total housing properties)
+ Works to Existing (total housing properties)
+ Capitalised Interest (total housing properties)
+ Schemes completed (total housing properties)]
B = [Tangible fixed assets: Housing properties at cost (Period end) / Tangible fixed assets:
Housing properties at valuation (Period end)]
NB. Cost is the net book value after any depreciation rather than just the cost of properties if
the intention is to use the word cost as it is used in the Global Accounts.
SPBM members: if you use different version of cost, you must indicate in the profile data for
your organisation whether properties are held at historic cost, deemed cost or valuation.
Source: Statutory financial statements (Cash flow statement). Clarification of the accounting
terms used in this and other definitions provided by the Regulator for Social Housing may be
found here: Accounting direction 2015.
SS 303 – Investment in communities
NB: definition has been updated for 2018
This measure should quantify your expenditure on activities that go beyond being a landlord
or housing developer. Community investment includes community and neighbourhood
activities (e.g. employment skills training, money advice, community groups etc.) and shows
that you are making a positive contribution to the communities where you own and manage
stock. It is likely that all social landlords will have expenditure on this item.
Note: There may be inconsistency in how community investment is accounted for and
accounts alone could underestimate the overall community impact that housing
associations have. Please ensure you include all expenditure on items outlined above.
Definitions – Effective Asset Management
RSH 401 – Return on capital employed (ROCE) *
14 This metric is not based on cashflow data given the limitations on data collected as part of the FVA regulatory
return
Sector Scorecard Scotland Analysis Report 2019
43
This metric compares the operating surplus to total assets less current liabilities and is a
common measure in the commercial sector to assess the efficient investment of capital
resources.
ROCE = (A ÷ B) x 100
A = Return [Operating surplus / (deficit) (overall) including gain / (loss) on disposal of fixed
assets (housing properties) + Share of operating surplus/(deficit) in joint ventures or
associates]
B = Capital employed [Total fixed assets + Total current assets- Current liabilities]
NB. Gain / (loss) on disposal of fixed assets (housing properties) is not usually included in
operating surplus. Similarly, results of JVs are not usually included in either turnover or
operating surplus. However, these results are included in this measure as they can be
considered to form part of the return on the capital investment in either fixed assets or joint
ventures.
Source = statutory financial statements or FVA. Clarification of the accounting terms used in
this and other definitions provided by the Regulator for Social Housing may be found here:
Accounting direction 2015.
SS 402 – Occupancy
Managed General Needs properties:
Occupied units ÷ (Occupied units + Vacant units available for letting + Vacant units
unavailable for letting) x 100
This percentage should be the inverse of your vacant properties available and unavailable to
let measure.
"Units in the following states would be considered to be available for letting:
• First let and ready for immediate occupation;
• Re-let and ready for immediate occupation;
• To be let or re-let after minor repairs or normal maintenance and redecoration work
between lets;
• The previous tenant is no longer being charged rent and no works are required before a
new tenant can move in;
• Handed over from a contractor, development section or maintenance section on
completion of works, for new letting or re-letting, and is in a satisfactory condition for
letting."
"Units would not be considered available for letting:
• Awaiting improvement, conversion, repair or other works;
• Awaiting sale;
• Unauthorised occupation;
• Waiting to be demolished.
Sector Scorecard Scotland Analysis Report 2019
44
Additionally, a unit can only be considered as being available for letting if it can be freely let
by the provider."
Source: Definition of available and unavailable for letting are aligned with the Statistical Data
Return (SDR), however unit numbers may differ from the SDR if a provider has units outside of
England.
SS 403 – Ratio of responsive repairs to planned maintenance
Routine maintenance ÷ (Planned maintenance + Major repairs expenditure + Capitalised
major repairs and re-improvements expenditure)
Source = statutory financial statements or FVA.
Definitions – Operating Efficiencies
RSH 501 – Headline social housing cost per unit *
The unit cost metric assesses the headline social housing cost per unit as defined by the
regulator. The cost measures set out in the metric are unchanged from the metric used in
the regulator’s 2016 publication Delivering better value for money. However, the
denominator has been changed from units managed to units owned and/or managed.
Headline social housing cost per unit = Social housing costs ÷ Social housing units
Social housing costs = [Management costs
+ Service charge costs
+ Routine maintenance costs
+ Planned maintenance costs
+ Major repairs expenditure
+ Capitalised major repairs expenditure for period
+ Lease costs
+ Other (social housing letting) costs
+ Development services15
+ Community / neighbourhood services
+ Other social housing activities: Other (operating expenditure)
+ Other social housing activities: charges for support services
(operating expenditure)]
NB. Use actual expenditure rather than £000s in this and all related cost per unit measures.
Divided by
Social housing units = Total social housing units owned and/or managed at period end16
(Social rent general needs housing (excluding Affordable Rent), Affordable Rent general
needs housing, social rent supported housing and sheltered housing (excluding Affordable
Rent), Affordable Rent supported housing and sheltered housing, Low Cost Home
Ownership, care homes, other social housing units)
NB. Leasehold units which for example include Right to Buy and fully stair-cased shared
ownership units where the provider retains the freehold are excluded from this definition and
all related cost per unit measures.
15 Accounting Direction 2015 requires material items of social housing activity to be separately identified.
https://www.gov.uk/government/uploads/system/uploads/attachment_data/file/465837/Accounting_direction_2
015_full.pdf . 16 Leasehold units which for example include Right to Buy and fully stair-cased shared ownership units where the
provider retains the freehold are excluded from this definition
Sector Scorecard Scotland Analysis Report 2019
45
Source = statutory financial statements or FVA. Clarification of the accounting terms used in
this and other definitions provided by the Regulator for Social Housing may be found here:
Accounting direction 2015.
SS 502 – Management cost per unit
This unit cost metric assesses the MANAGEMENT cost per unit as defined by the regulator in
the Accounting direction for providers of social housing 2015. The denominator is the units
owned and/or managed.
This measure may be used by the RSH in its analysis of providers costs.
Management cost per unit = A ÷ B
A = Management costs
B = Social housing units
“Management costs” = total expenditure on Management relating to Social Housing Lettings,
as per the financial accounts
“Social housing units” = Total social housing units owned and/or managed at period end17
(Social rent general needs housing (excluding Affordable Rent), Affordable Rent general
needs housing, social rent supported housing and sheltered housing (excluding Affordable
Rent), Affordable Rent supported housing and sheltered housing, Low Cost Home
Ownership, care homes, other social housing units)
Source = statutory financial statements or FVA. Clarification of the accounting terms used in
this and other definitions provided by the Regulator for Social Housing may be found here:
Accounting direction 2015.
SS 503 – Maintenance cost per unit
This unit cost metric assesses the routine and planned maintenance cost per unit as defined
by the regulator in the Accounting direction for providers of social housing 2015. The
denominator is the units owned and/or managed.
This measure may be used by the RSH in its analysis of providers costs.
Maintenance cost per unit = A ÷ B
A = Routine maintenance + Planned Maintenance
B = Social housing units
“Maintenance costs” = total expenditure on Routine maintenance and Planned Maintenance
costs relating to Social Housing activities, as per the financial accounts
“Social housing units” = Total social housing units owned and/or managed at period end18
(Social rent general needs housing (excluding Affordable Rent), Affordable Rent general
needs housing, social rent supported housing and sheltered housing (excluding Affordable
Rent), Affordable Rent supported housing and sheltered housing, Low Cost Home
Ownership, care homes, other social housing units)
Source = statutory financial statements or FVA. Clarification of the accounting terms used in
this and other definitions provided by the Regulator for Social Housing may be found here:
Accounting direction 2015.
17 Leasehold units which for example include Right to Buy and fully stair-cased shared ownership units where the
provider retains the freehold are excluded from this definition 18 As above
Sector Scorecard Scotland Analysis Report 2019
46
SS 504 – Major Repairs cost per unit
This unit cost metric assesses the major repairs cost per unit as defined by the regulator in
the Accounting direction for providers of social housing 2015. The denominator is the units
owned and/or managed.
This measure may be used by the RSH in its analysis of providers costs.
Major repairs cost per unit = A ÷ B
A = Major Repairs + Capitalised major repairs expenditure for period
B = Social housing units
“Major repairs costs” = total expenditure on Major repairs (including capitalised) relating to
Social Housing activities, as per the financial accounts
“Social housing units” = Total social housing units owned and/or managed at period end19
(Social rent general needs housing (excluding Affordable Rent), Affordable Rent general
needs housing, social rent supported housing and sheltered housing (excluding Affordable
Rent), Affordable Rent supported housing and sheltered housing, Low Cost Home
Ownership, care homes, other social housing units)
Source = statutory financial statements or FVA. Clarification of the accounting terms used in
this and other definitions provided by the Regulator for Social Housing may be found here:
Accounting direction 2015.
SS 505 – Service charge cost per unit
This unit cost metric assesses the SERVICE CHARGE cost per unit as defined by the
regulator in the Accounting direction for providers of social housing 2015. The denominator
is the units owned and/or managed.
This measure may be used by the RSH in its analysis of providers costs.
Service charge cost per unit = A ÷ B
A = Service charge costs
B = Social housing units
“Service charge costs” = total expenditure on Service charge costs relating to Social
Housing activities, as per the financial accounts
“Social housing units” = Total social housing units owned and/or managed at period end20
(Social rent general needs housing (excluding Affordable Rent), Affordable Rent general
needs housing, social rent supported housing and sheltered housing (excluding Affordable
Rent), Affordable Rent supported housing and sheltered housing, Low Cost Home
Ownership, care homes, other social housing units)
Source = statutory financial statements or FVA. Clarification of the accounting terms used in
this and other definitions provided by the Regulator for Social Housing may be found here:
Accounting direction 2015.
19 As above 20 As above
Sector Scorecard Scotland Analysis Report 2019
47
SS 506 – Other social housing costs per unit
This unit cost metric assesses OTHER SOCIAL HOUSING costs per unit as defined by the
regulator in the Accounting direction for providers of social housing 2015. The denominator
is the units owned and/or managed.
This measure may be used by the RSH in its analysis of providers costs.
Other social housing costs per unit = A ÷ B
A = Other (social housing letting) costs + Development services + Community /
neighbourhood services+ Other social housing activities: Other (operating expenditure) +
Other social housing activities: charges for support services (operating expenditure) + Lease
costs
B = Social housing units
“Other (social housing letting) costs” = total expenditure on Other costs relating to Social
Housing activities, as per the financial accounts
“Social housing units” = Total social housing units owned and/or managed at period end21
(Social rent general needs housing (excluding Affordable Rent), Affordable Rent general
needs housing, social rent supported housing and sheltered housing (excluding Affordable
Rent), Affordable Rent supported housing and sheltered housing, Low Cost Home
Ownership, care homes, other social housing units)
Source = statutory financial statements or FVA. Clarification of the accounting terms used in
this and other definitions provided by the Regulator for Social Housing may be found here:
Accounting direction 2015.
GNPI 28 – Rent collected as % of rent due (GN)
For managed General Needs properties only:
Rent collected ÷ (Rent and service charge due for the period - Rent loss due to empty
properties) x 100
Rent and service charge due for the period = Gross rent and service charge due on the
relevant units (gross annual rent roll), including void properties and excluding arrears brought
forward.
Rent collected = Actual rent and service charge income received in the period from current
or former tenants (including HB payments), with no adjustments made for late HB payments,
pre-payments or post-payments.
Items collected by the landlord as an agent such as water rates, those not directly part of the
rent such as court costs and repairs recharges, and recovery of overpaid housing benefit
through the rent collection system should be excluded.
It is acceptable to report this figure a few days after the end of the reporting period to
coincide with the end of the rental period. However, no adjustments should be made to this
figure for payments received after the end of the rental period.
Rent loss due to empty properties = Rent and service charges that could not be collected
during the period due to empty dwellings. The dwelling may have been vacant for any reason
and includes dwellings that are unavailable to let. Dwellings that are unavailable to let and
21 As above
Sector Scorecard Scotland Analysis Report 2019
48
excluded from the annual rent roll (policy voids), the rent and service charges should be
zeroed out. For example, properties awaiting demolition.
CPP 04 – Overhead costs as a percentage of turnover
This measure is aligned with the HouseMark/Acuity measure. For SPBM members we would
expect a figure of between 10% and 20%.
Overheads ÷ Adjusted turnover x 100
Overheads
Overheads are broadly categorised into Finance, IT, Premises and Central (corporate costs,
HR, staff benefits, governance etc).
The numerator must include:
• Total cost of all staff directly engaged in overhead (back-office) functions,
including their national insurance, pensions and on-costs.
• All non-pay costs relating to overheads
Exclude costs relating to direct activities (repairs, maintenance, housing management,
supported housing, development, estate services, leasehold, shared ownership, other social
housing, costs eligible for service charges, property insurance, community investment, costs
relating to property sales or non-social activities).
Overheads should only include staff costs (including travel and subsistence) for staff where
time is not spent on any of the above direct activities.
Calculation for adjusted turnover
Adjusted Turnover = (Statement of comprehensive income Turnover + DLO internal turnover
– Statement of comprehensive income Cost of sales)
DLO internal turnover: Whether or not you have an in-house maintenance DLO could
significantly affect this indicator; there will be associated overheads but no corresponding
turnover. An adjustment is therefore made for the notional turnover generated by this
business, being the schedule of rates or equivalent value of the repairs carried out for your
own organisation. As a rough check, we would expect the internal turnover to be in the region
of 150- 200% of the corresponding staff costs of the internal workforce. This adjustment
should only be made if the DLO is part of the entity being benchmarked.
Examples of overheads and direct costs
Overheads employees include:
• Chief executive and PA
• Corporate services directors and PA
• Office managers
• Corporate support officers
• Front-of-house receptionists
• IT staff
• Finance staff (including rent and service charge accountants)
• Insurance officers
• HR and payroll processing staff
• Performance management and business improvement staff
Sector Scorecard Scotland Analysis Report 2019
49
• PR and marketing staff (including any graphic designers)
• Company secretary and other corporate governance staff
Note it would exclude:
• All staff engaged in housing management as detailed under ‘direct cost per
property of housing management’
• All staff engaged in management or delivery of responsive repairs and void works
as detailed under ‘direct cost per property of responsive repairs and void works’.
• All staff engaged in management or delivery of major works and cyclical
maintenance programmes as detailed under ‘direct cost per property of major
works and cyclical maintenance’.
• All estate services ‘contractor-side‘staff, such as caretakers, concierges,
groundsmen, cleaners etc.
• All care and support staff
• All staff carrying out ‘wider-role’ functions, such as community investment,
financial inclusion, regeneration etc.
Overhead non-pay costs include:
• Office rent and/or depreciation
• Other office premises costs (utilities, cleaning, maintenance, furniture, fixtures and
fittings)
• Office supplies (such as stationery, printing, postage, refreshments, books and
periodicals)
• Finance costs (including audits fees and payroll processing)
• General business insurance liability premiums (but exclude property insurance
premiums which go to ‘other’)
• IT costs (including hardware and software purchase and depreciation, and
telephone costs)
• HR costs
• Recruitment
• Staff training costs
• Corporate board and governance costs (including payments to board members,
committee costs and training costs)
• PR and marketing costs (including graphic design and website)
• Corporate membership and subscription fees
• Tenant survey costs
• Consultancy fees relating to central corporate management (but stock condition
survey costs are included in major works and cyclical maintenance).
Note it would exclude:
• All housing management costs as detailed under ‘direct cost per property of housing
management’
• All responsive repairs and void works costs as detailed under ‘direct cost per
property of responsive repairs and void works’
• All cost relating to major works and cyclical maintenance programmes as detailed
under ‘direct cost per property of major works and cyclical maintenance’
• Estate services (contractor side) costs
• Costs relating to care and support

Sector Scorecard Scotland Analysis Report 2019
50
• Other costs eligible for service charge
• All costs relating to ‘wider role’ type activities (such as area regeneration, financial
inclusion, employment and training)
• Reconciling items such as:
o One off redundancy costs
o One-off pension deficit funding
o Loan fees and financing arrangements
o Charges for bad debts
o Charitable donations
o Depreciation of housing stock
o Impairment
o Cost of sales
o And any other costs that are not part of your ongoing operating expenses.
Sector Scorecard Scotland Analysis Report 2019
51
Appendix 2: Calculations used in this report
Aggregation
The figures in this report are based on aggregated data from individual landlords. Sector
Scorecard participants’ underlying data is available in an accompanying schedule.
Correlation
Correlation is a technique for investigating the relationship between two variables. We have
used Pearson's correlation coefficient to measure the strength of the association between
the two variables.
Pearson's method rates correlation on a scale ranging from -1 to +1, where +1 and -1 are
perfect linear correlations, which show up as 45° diagonal lines on a scatter plot. If the value
is 0, then there is no apparent linear relationship between the two variables, this appears as a
horizontal line on a scatter plot. The closer the correlation coefficient gets to +1 or -1, the
stronger the correlation; the closer it gets to 0, the weaker it is.
We have interpreted the strength of the coefficient scores in the following way:
• 0.50 to 1 Strong
• 0.30 to 0.49 Moderate
• 0.10 to 0.29 Weak
• 0 to 0.09 No correlation
Note: the scale is the same for negative scores.
It may help to interpret the figure as percentages, so 0.33 = 33%, where 100% is the
maximum.
Percentages and percentage points
This report uses percentages (%) to indicate proportional increases and percentage points
to describe the change in percentage figures between years.
When we compare two figures, we can describe the difference between them by either
calculating the actual change in units or by the proportional change expressed as a
percentage. For example, if headline social housing costs had increased from £3,500 to
£3,600 this would equate to a £100 actual increase or a 2.9% proportional increase.
If reinvestment had increased from 2.9% to 3.3% the actual change between the two figures
would be 0.4 percentage points. If we were to describe the change as a 0.4% increase this
would be incorrect. Expressing the change as a percentage indicates that this is a
proportional change however the actual proportion change between the two figures is 6.9%.
Quartiles and medians
Medians and quartiles are used throughout the report to indicate how your organisation
compares to the other participants. With the data points arranged in numerical order, the
median is the middle value and the quartiles divide the dataset into four equal parts.
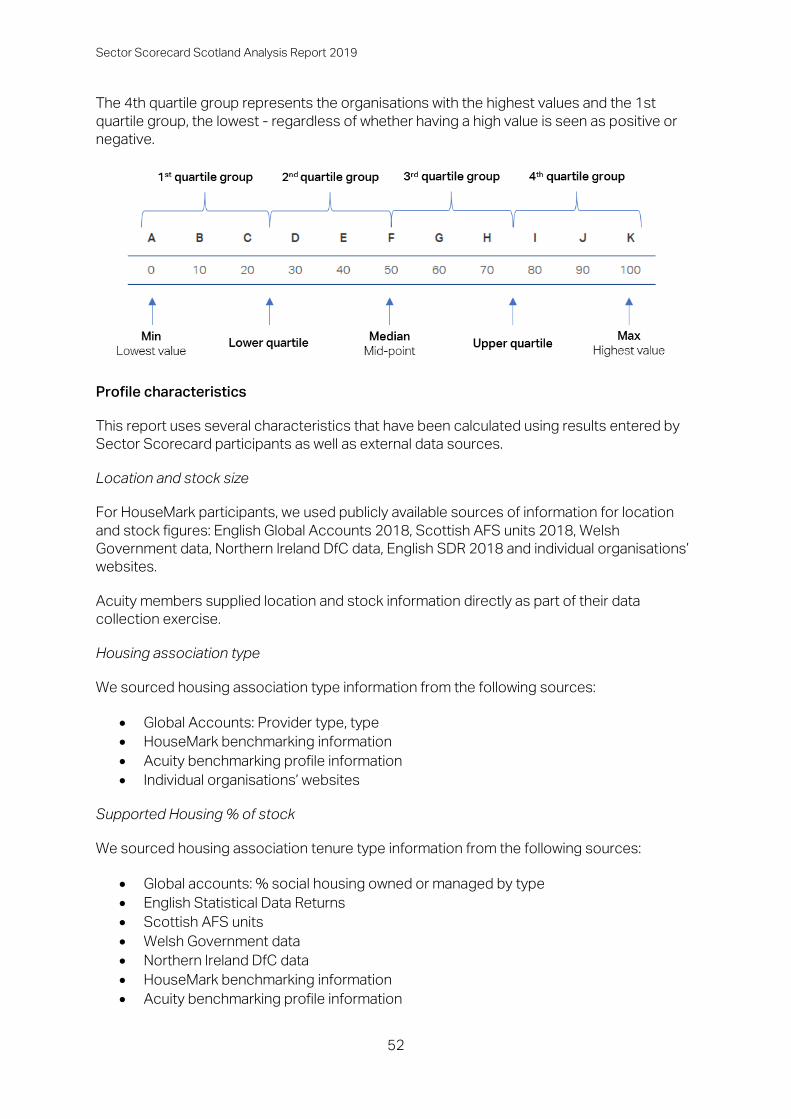
Sector Scorecard Scotland Analysis Report 2019
52
The 4th quartile group represents the organisations with the highest values and the 1st
quartile group, the lowest - regardless of whether having a high value is seen as positive or
negative.
Profile characteristics
This report uses several characteristics that have been calculated using results entered by
Sector Scorecard participants as well as external data sources.
Location and stock size
For HouseMark participants, we used publicly available sources of information for location
and stock figures: English Global Accounts 2018, Scottish AFS units 2018, Welsh
Government data, Northern Ireland DfC data, English SDR 2018 and individual organisations’
websites.
Acuity members supplied location and stock information directly as part of their data
collection exercise.
Housing association type
We sourced housing association type information from the following sources:
• Global Accounts: Provider type, type
• HouseMark benchmarking information
• Acuity benchmarking profile information
• Individual organisations’ websites
Supported Housing % of stock
We sourced housing association tenure type information from the following sources:
• Global accounts: % social housing owned or managed by type
• English Statistical Data Returns
• Scottish AFS units
• Welsh Government data
• Northern Ireland DfC data
• HouseMark benchmarking information
• Acuity benchmarking profile information
Sector Scorecard Scotland Analysis Report 2019
53
Comparative groups
As well as banding organisations by stock size, this report also bands together participants
by the figure they entered for three measures: development programme size, gearing and
operating margin.
For each of these measures we split the group into three ‘terciles’ using the 33rd and 66th
percentiles. This means that organisations’ results in the highest third could be described as
having a large development programme in relation to stock, high gearing and high operating
margin. Those in the middle third were described as medium and those in the lowest third
were described as having a comparatively small (development programme) or low gearing /
operating margin.
We applied a similar method to organisations’ supported housing and sheltered housing
stock. Using the Supported Housing as a percentage of stock, we calculated the top 10%
(decile). These organisations were described as having a comparatively large proportion of
supported housing stock. Organisations that recorded a figure above zero were recorded as
having ‘some’ supported housing stock.
Balanced panel
To compare the movement of quartile points over time, we have used a dataset of
organisations that submitted data for the measure in 2017 and 2018, so the comparison of
quartile points over time is based on a consistent cohort of organisations. This is referred to
in the report as a balanced panel.
The balanced panel is based on the name of the organisation matching in 2018 and 2019. It
excludes organisations that have merged and/or changed name between the years. The
balanced panel will include organisations whose business has changed between years but
retained the same name.
To maintain a reasonable dataset size, the balanced panel is different for each measure. No
direct comparisons are made between measures over time.


