DOES DRINKING IMPAIR COLLEGE PERFORMANCE? EVIDENCE FROM AREGRESSION DISCONTINUITY APPROACH
Scott E. CarrellMark HoekstraJames E. West
Working Paper 16330http://www.nber.org/papers/w16330
NATIONAL BUREAU OF ECONOMIC RESEARCH1050 Massachusetts Avenue
Cambridge, MA 02138September 2010
We would like to thank Doug Miller and Hillary Hoynes for helpful comments and suggestions. Anyerrors are our own. The views expressed in this paper reflect those of the authors and do not necessarilyreflect the official policy or position of the U.S. Air Force, Department of Defense, the U.S. Government,or the National Bureau of Economic Research.
NBER working papers are circulated for discussion and comment purposes. They have not been peer-reviewed or been subject to the review by the NBER Board of Directors that accompanies officialNBER publications.
Does Drinking Impair College Performance? Evidence from a Regression Discontinuity ApproachScott E. Carrell, Mark Hoekstra, and James E. WestNBER Working Paper No. 16330September 2010JEL No. I18,I21
ABSTRACT
This paper examines the effect of alcohol consumption on student achievement. To do so, we exploitthe discontinuity in drinking at age 21 at a college in which the minimum legal drinking age is strictlyenforced. We find that drinking causes significant reductions in academic performance, particularlyfor the highest-performing students. This suggests that the negative consequences of alcohol consumptionextend beyond the narrow segment of the population at risk of more severe, low-frequency, outcomes.
Scott E. CarrellDepartment of EconomicsUniversity of California, DavisOne Shields AvenueDavis, CA 95616and [email protected]
Mark HoekstraDepartment of EconomicsUniversity of Pittsburgh4714 W. W. Posvar HallPittsburgh, PA, [email protected]
James E. WestDepartment of Economics and GeosciencesU.S. Air Force Acdemy2354 Fairchild Dr. #6K100USAF Academy, CO [email protected]
1
Economists and other social science researchers have devoted significant effort toward
understanding the effects of alcohol consumption. However, nearly all of this research has
focused on low-frequency outcomes such as mortality and teen pregnancy (Carpenter and
Dobkin, 2009; Dee, 1999; Dee 2001; Fertig and Watson, 2009; Saffer, 1997). In contrast, little is
known about the effect of drinking on the majority of users. In addition, identifying the causal
effect of alcohol consumption is difficult since individuals likely select into drinking based on
unobserved characteristics that affect outcomes. Moreover, efforts to exploit state-level variation
such as alcohol taxes or adoption of minimum legal drinking age laws have also been
problematic. That is, there are concerns that the timing of the drinking age laws may be
endogenous (Miron and Tetelbaum, 2007), while efforts to exploit tax differences across states
have been limited by the relative weakness of taxes as an instrument (e.g., Chaloupka and
Wechsler, 1996) and the corresponding imprecision of labor market outcome estimates (Dave
and Kaestner, 2002).
In this paper, we examine the impact of drinking on academic performance in college.
In doing so, this study contributes to the existing literature and the corresponding policy debate
in several ways. First, examining the impact of drinking in a college context allows for us to
gauge the impact of drinking on a wide range of students, rather than focusing on low frequency
outcomes that affect relatively few individuals. In addition, understanding the impact of
drinking during college is itself particularly important for public policy, since college is a critical
time in the human capital formation process that can significantly impact future labor market
outcomes. Indeed, concern regarding the harmful effects of drinking in college is reflected by
the Amethyst Initiative, in which 135 university presidents and chancellors argue that current
policy has resulted in “binge-drinking” and thus ought to be reexamined.
2
Another distinct advantage of our approach is that by studying the impact of drinking in a
college environment in which underage drinking is strictly prohibited, we can distinguish the
effect of drinking from confounding factors. To do so, we utilize a regression discontinuity
design in comparing the grades of students who turned 21 just before final exams to those who
turned 21 just afterward.1 Under the plausible identifying assumption that other determinants of
performance are smooth through age 21, any discontinuous changes in performance are properly
interpreted as the causal impact of drinking on performance.
We use administrative data on 3,884 students at the United States Air Force Academy
(USAFA) between 2000 and 2006. This educational setting offers two distinct advantages for
our analysis. First, in contrast to many college campuses, the explicit ban on underage drinking
at the USAFA is strictly enforced; violations can lead to expulsion.2 As a result, in an
anonymous survey of underage students in our sample, only 37 to 39 percent of students reported
drinking any alcohol since arriving at the academy.3 By comparison, the National Institute on
Alcohol Abuse and Alcoholism (NIAAA) reports that 83% of college students nationwide drink,
and that 41% of college students reported consuming five or more drinks on a single occasion
within the past two weeks (NIAAA, 2010).4 The second advantage of using USAFA data is a
consistent measurement of academic achievement. Students at USAFA are required to take a
core set of approximately 30 courses in mathematics, basic sciences, social sciences, humanities,
and engineering. For these core courses, students have no discretion in choosing their
1 This research design is similar to that used by Carpenter and Dobkin (2009) to estimate the effect of drinking on mortality. 2 Per the AFCWMAN36-3501, Section 1.6.1, two incidents of underage drinking result in the expulsion of the student. Additionally, some single incidents such as driving under the influence (DUI) result in expulsion. 3 This includes drinking over the summer and winter breaks, when students are at home and away from the watchful eyes of their superiors. 4 Additionally, in a self-reported sample of 10,424 college freshmen across 14 schools taken in the fall semester of 2003, roughly 55% reported drinking alcohol during a two week time period. Among those who drank, there were on average 4.35 (sd = 2.99) drinking occasions for male students and 3.35 (sd=2.32) drinking occasions for female students within that two-week period (White, Kraus, and Swartzwelder, 2006).
3
professors. Furthermore, exams are standardized across different sections of the same course.
These attributes lessen the scope for professor subjectivity and student selection into courses that
might correlate with date of birth.
Results from our analysis indicate that alcohol consumption significantly reduces
academic performance by nearly one tenth of a standard deviation, or approximately as much as
being assigned a professor whose quality is one standard deviation below average (Carrell &
West, 2010). Strikingly, the negative effects are largest for the highest-performing students at
the academy. This suggests that the negative consequences of alcohol consumption are not
limited to a small fraction of users or even to those who might naturally struggle with academics.
1. Identification Strategy
In order to estimate the causal impact of drinking on student performance, we apply a
regression discontinuity design5 to exploit the sudden increase in drinking that occurs at age 21.
This approach is similar to that used to examine the impact of Head Start (Ludwig and Miller,
2007) and, more recently, the effect of alcohol consumption on mortality (Carpenter and Dobkin,
2009). The identifying assumption of the design is that while other determinants of performance
such as motivation or maturity vary smoothly over age 21, access to and consumption of alcohol
varies discontinuously at that point. This smoothness assumption appears to be particularly
reasonable when treatment depends on age because in contrast to other outcomes such as test
scores, there is little scope for individuals to change their 21st birthday by a few days or weeks.
Moreover, current evidence indicates that there is a discontinuous increase in alcohol
consumption at age 21; Carpenter and Dobkin (2009) report a 21 percent increase in recent
drinking days at age 21. Similarly, although we cannot directly test how much more students in 5 Imbens and Lemieux (2008) offer a thorough description of regression discontinuity design.
4
our data drink once they turn 21 than those just about to turn 21, we can report that there is
significant variation on the extensive margin: In a 2004 USAFA survey of students, nearly 90
percent of students 21 years or older reported drinking in the previous year. In contrast, only 37
to 39 percent of students under the age of 21 report having at least one drink since coming to the
academy, some of which presumably occurred off-campus during summer or winter breaks.
To formally test for discontinuities in academic performance at age 21, we estimate the
following equation:
CourseScoreic = β0 + β1Age21i + β2 f(Age)i + εic
where CourseScoreic is the final score earned in course c by student i, Age21 is an indicator
variable equal to one if the student is at least 21 years old at the time of the exam, and f(Age) is a
flexible polynomial of one’s age at the time of the exam which we allow to take different forms
on either side of the cutoff. Under the identifying assumption that other determinants of
achievement are continuous at the age 21 cutoff, β1 will be an unbiased estimate of the effect of
the increase in drinking at age 21 on academic performance. Standard errors are clustered at the
birthday level (month/day/year), which accounts for the fact that students are observed with
scores in multiple courses.
In addition to the equation above, we also estimate specifications in which we
additionally control for course by section fixed effects, graduating class by semester by year at
USAFA fixed effects, birth year fixed effects, SAT verbal, SAT math, academic composite,
leadership composite, fitness score, and indicator variables for Black, Hispanic, Asian, recruited
athlete, and preparatory school attendance. These additional controls account for any course,
teacher, classroom, or cohort-level common shocks to student performance.
5
While the primary advantage of applying a regression discontinuity design to USAFA
data is that it allows us to estimate cleanly the impact of drinking on performance, the tradeoff is
that the resulting estimates may under- or over-state the impact of drinking that other contexts.
For example, our estimates will reflect the effect of the type of drinking that occurs on and soon
after one’s 21st birthday, which may be closer to binge drinking than other types of drinking.6 To
the extent that individuals may moderate drinking over time, our estimates may overstate the
long-term effects of drinking. On the other hand, while our outcome of interest is course
performance, the regression discontinuity estimates are primarily driven by changes to the final
exam score. Given that final exams count for as little as 35% of the overall course score, our
estimates may underestimate the effect of this type of drinking by as much as a factor of three.
Similarly, our regression discontinuity estimates capture the effect of drinking for a relatively
short period of time prior to final exams, which means that drinking could not have affected
cognitive learning throughout the semester. Allowing for longer-term access to alcohol may well
lead to larger negative effects. In addition, since there is limited scope for drinking to have
affected classroom learning throughout the semester, our view is that the estimates here are best
interpreted as the effect of drinking on performance, rather than the effect of drinking on
learning.
2. Data
Our data include student-level observations for each course taken during the 2000-01
through the 2005-06 academic years. From this sample, we exclude physical education courses
and observations on freshmen students and students who had attended military preparatory
6 We note, however, that Carpenter and Dobkin (2009) report a sustained increase in drinking at age 21 rather than a temporary spike.
6
school.7 In addition, we exclude observations in which the final exam was taken more than 270
days before or after one’s 21st birthday. This leaves a sample of 58,032 observations on 3,884
students. Each observation measures the final score achieved by each student in each course.
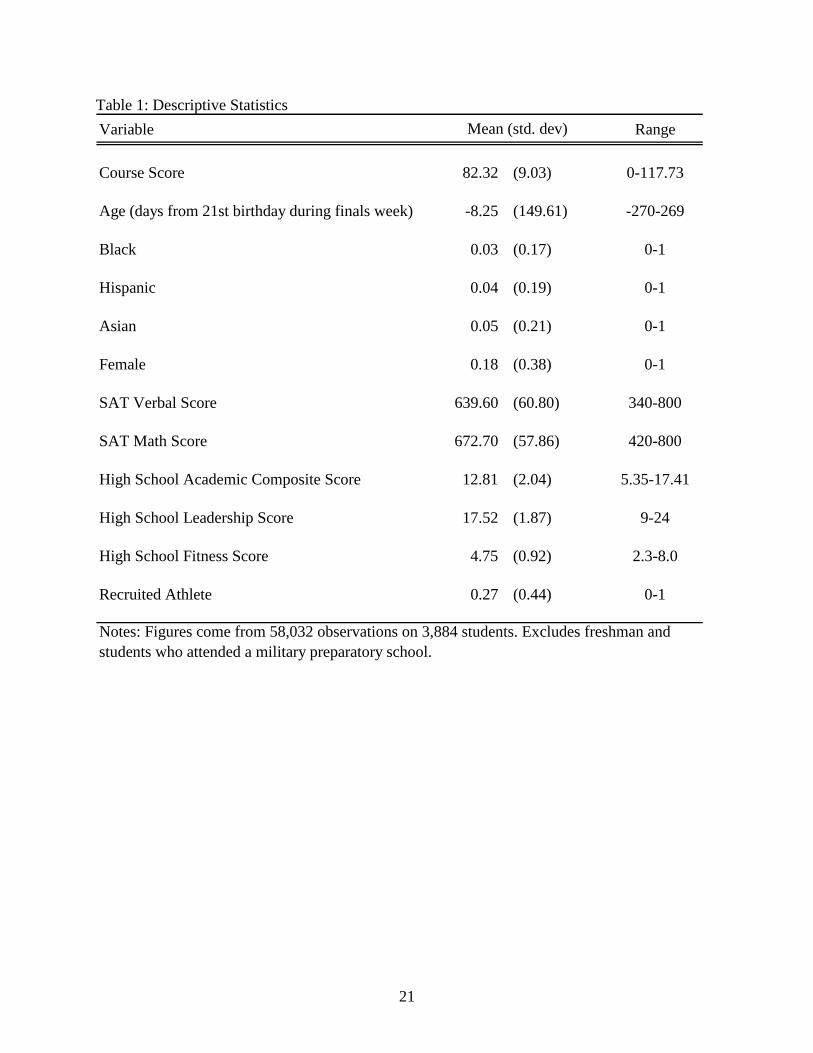
Summary statistics from our data are shown in Table 1. The average score achieved in
academic courses was 82 percent, which corresponds to a mean grade point average of 2.9.8
The average combined SAT score of students in our sample is approximately 1,300, which is
similar to other undergraduate institutions such as UCLA, University of Michigan, University of
Virginia, and UNC-Chapel Hill. Eighteen percent of the sample is female, 3 percent is Black, 4
percent is Hispanic, and 5 percent is Asian. Thus, the student body at USAFA is somewhat more
White and male and less Black than four-year public universities nationwide.9
Students at the academy are also more likely to come from families in which their parents
live with each other (84.1 percent versus 66.1 percent), and are more likely to have attended a
religious service in the last year (90.2 percent versus 78.1 percent). Finally, and perhaps most
importantly for this study, students at the USAFA report that they spent less time partying during
their last year in high school than did students in general: 33.8 percent of students at the academy
reported they spent no time partying (versus 25.3 percent for all public university students),
while 15 percent reported spending at least 6 hours a week partying (versus 23.3 percent).
7 We exclude freshmen because only a small fraction of students turn 21 during their freshman year and freshman at USAFA are prohibited from drinking alcohol, regardless of age. In addition, students who attended military preparatory school can be considerably older than average college student and are the less representative of college-students more generally. We note, however that our results are not sensitive to the exclusion of these students, as shown in columns 3 and 4 of Table 6. 8 These statistics represent the academic achievement of students in our sample within 180 days of their 21st birthday. 9 According to The Freshman Survey, administered to entering freshmen nationwide by the UCLA Cooperative Institutional Research Program (CIRP), 74.5 percent of students attending all public four-year colleges are White, 13.7 percent are Black, and 3.8 percent are Asian.
7
3. Results
3.1 The Discontinuity in Drinking at Age 21
Although we cannot match student-level data on drinking to our sample, there is evidence
of a large increase in drinking at age 21 at the USAFA. In the anonymous USAFA Climate
Survey, relatively few students under the age of 21 report having a drink since coming to
USAFA (2003: 39 percent, 2004: 38 percent, 2005: 37 percent) while in 2004, approximately
90 percent of students 21 years or older reported having a drink in the previous year. Moreover,
this difference likely understates the true increase in drinking at age 21 at the USAFA for several
reasons. First, these figures only represent the increase in drinking on the extensive margin.
Indeed, while we do not have data on the frequency or intensity of drinking at the academy,
Carpenter and Dobkin (2009) report a 21 percent increase in the proportion of days drinking at
age 21. In addition, it is likely that the majority of the underage drinking that does occur by
students at the USAFA is done while off-campus during holiday breaks, when students are no
longer under the watchful eye of their superiors. Finally, once students at the USAFA turn 21
years of age, social drinking is quite accessible because a campus bar is located adjacent to the
student dormitories.10 Thus, the evidence suggests that there is a significant increase in drinking
at age 21 at the USAFA.
3.2 Tests of the Validity of the RD Design
The primary threat to identification in a RD design comes from the possibility of
nonrandom sorting of students to either side of the cutoff. While the scope for such sorting
seems limited, if not impossible, given both the inflexibility of age and the timing of the final
10 Hap's Place Lounge is located in the campus student union, called Arnold Hall, adjacent to the student dormitories. Students at the USAFA are required to reside in the dormitories. A student-made video of Hap's Place can be found at: http://www.youtube.com/watch?v=LHWNN9-c0ho.
8
exam schedule at the USAFA, we can nonetheless test the identifying assumption that other
determinants of achievement are smooth through the age 21 threshold.
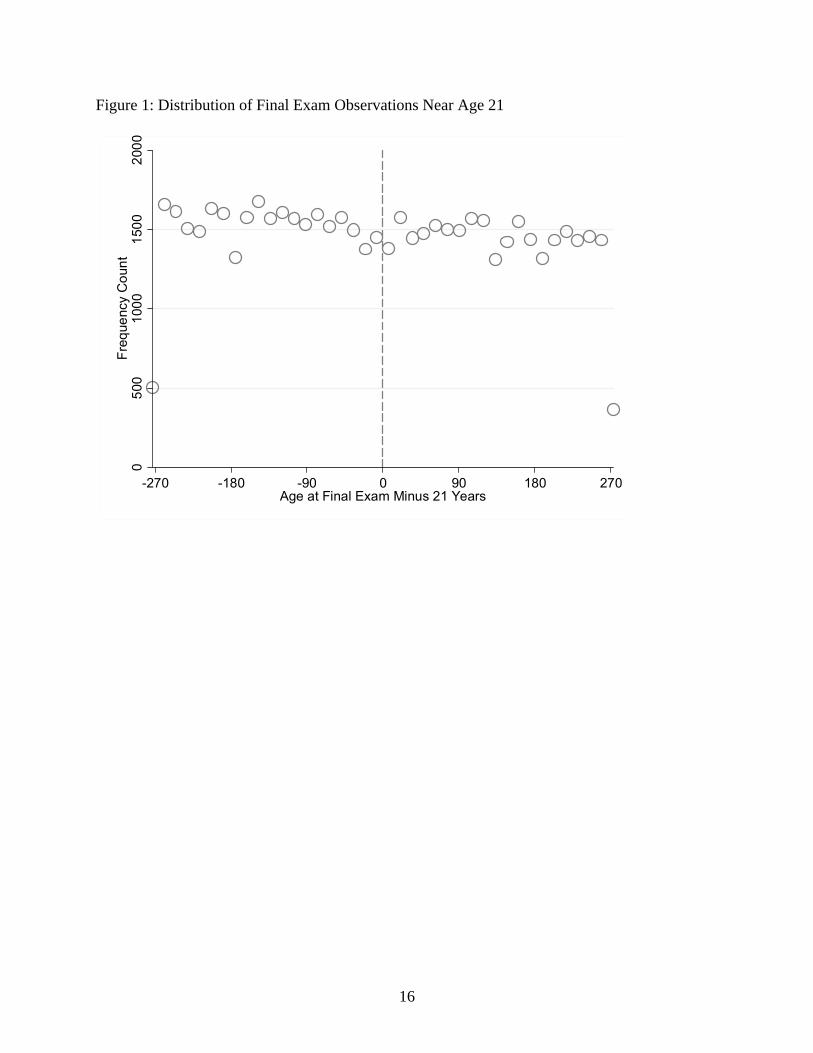
We first examine whether there is evidence of sorting graphically. Figure 1 shows the
distribution of observations around the age 21 cutoff, which shows the density is smooth across
the minimum drinking age cutoff. Graphically there is little evidence of nonrandom sorting near
age 21.11
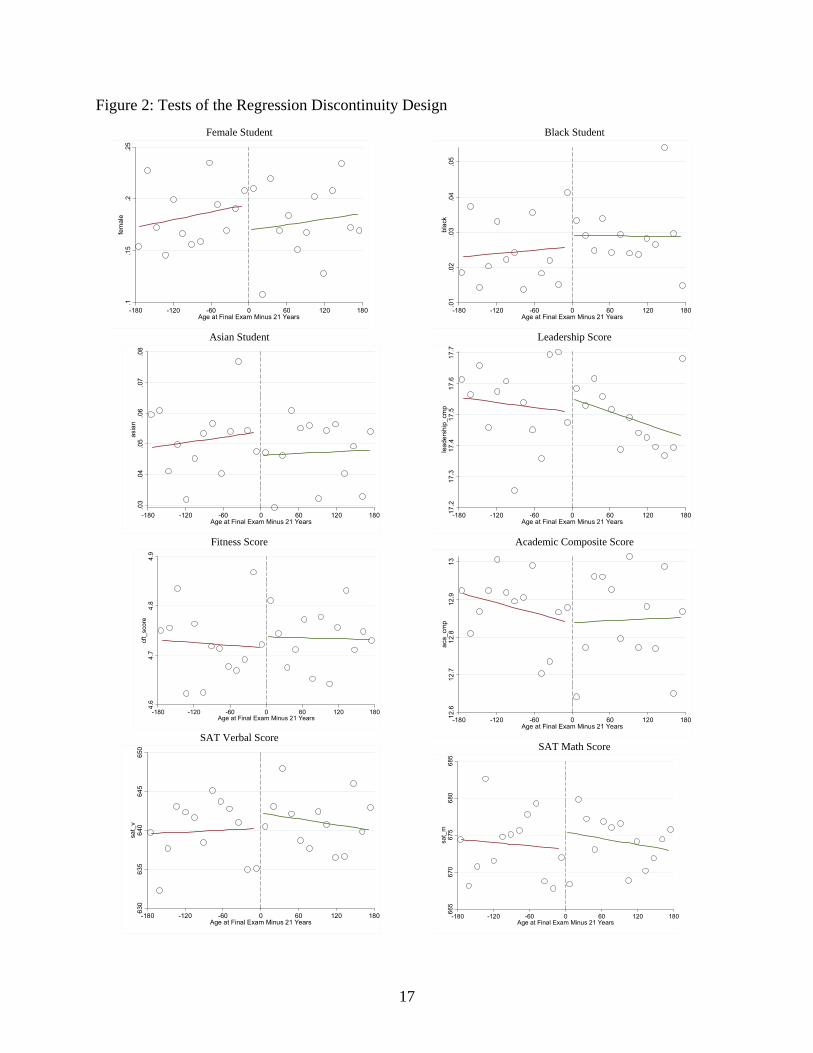
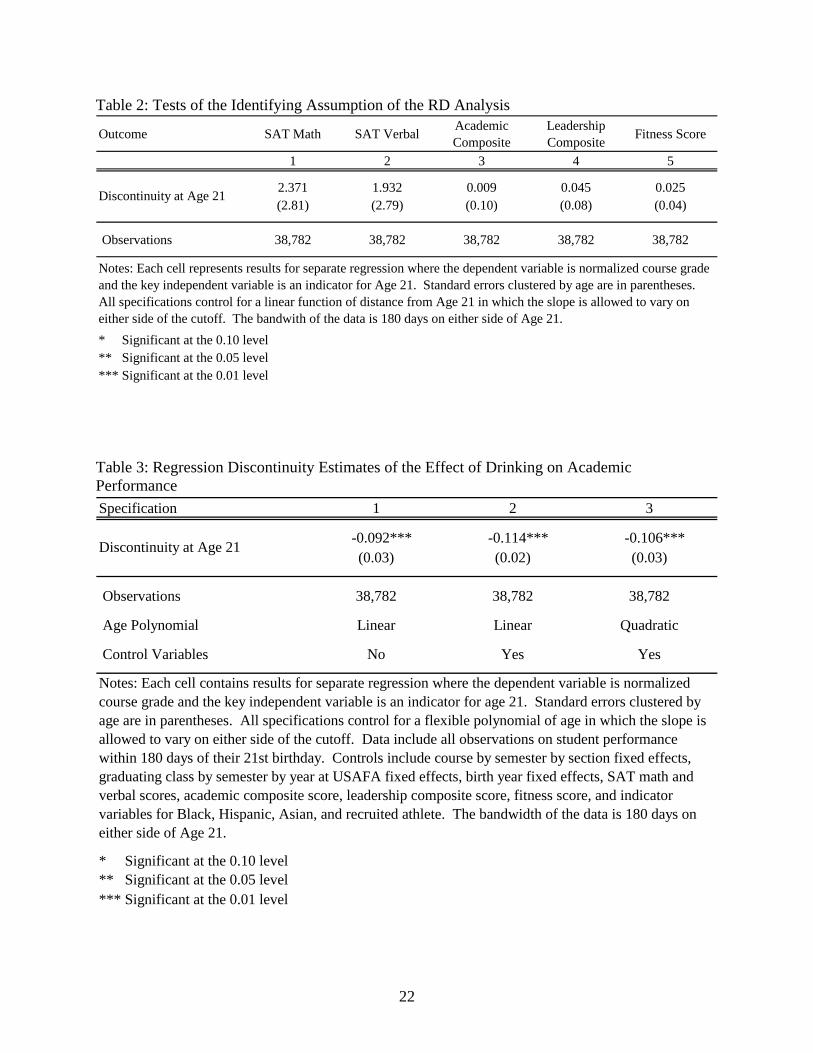
In addition, we also test whether a variety of predetermined characteristics vary smoothly
across the age 21 cutoff, including math and verbal SAT scores, academic composite scores,
leadership composite scores, and fitness scores. Results are shown in Figure 2, in which the
open circles represent local averages and the line is the predicted score. Corresponding
regression discontinuity estimates are shown in Table 2. Both the visual evidence and regression
estimates reveal no evidence of discontinuities in predetermined characteristics at age 21.
Collectively, these results are supportive of the identifying assumption that while drinking is
discontinuous at age 21, other determinants of performance are continuous.
3.3 The Effect of Drinking on Academic Performance
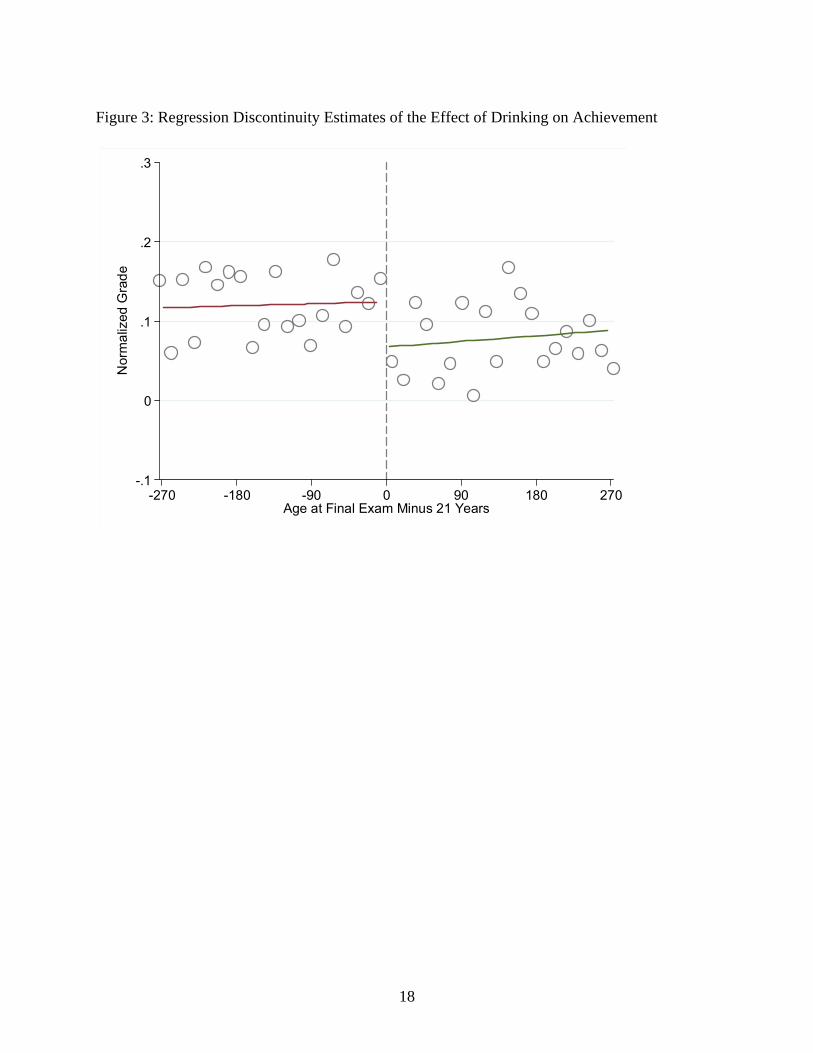
Figure 3 provides a graphical representation of the effect of drinking on academic
performance.12 The results indicate that students who turn 21 just prior to taking final exams
score approximately one-tenth of a standard deviation lower than students who turn 21 just after
finals. This drop in performance is both statistically and economically significant; it is roughly
11 To further test this result, we performed chi-squared goodness of fit tests by semester. For the first ten semesters of data, we fail to reject the null hypothesis of uniformity at a 5% level. In the final three semesters of data, the frequency of birthdates is skewed due to the absence of data from the rising class. The main results of our paper are robust to the exclusion of these final three semesters of data. 12 Scores are not centered at zero because scores were normalized for the full sample, though as described earlier we exclude students who had attended military preparatory school prior to enrolling at the academy. Those students perform worse academically, on average, than other students.
9
the same effect as having a professor whose quality is one standard deviation below the mean
(Carrell and West, 2010).
Corresponding regression discontinuity estimates are shown in Table 3, which includes
observations on all courses in which the final exam was taken within 180 days of the student’s
21st birthday. Columns 1 and 2 show the estimates from specifications without and with
controls, respectively, while Column 3 shows the estimate when allowing for quadratic functions
of age on either side of the age 21 cutoff. All three specifications show that drinking causes a
statistically significant reduction in performance on the order of approximately one-tenth of a
standard deviation.
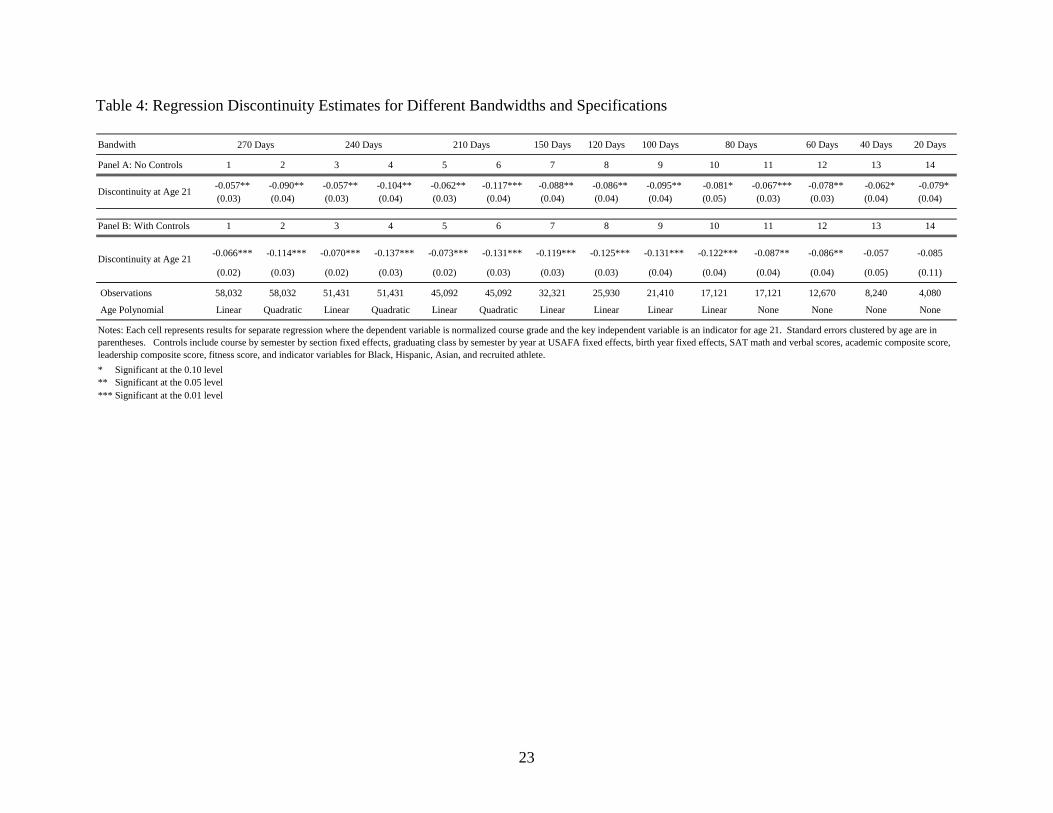
To test the robustness of these results, we estimated specifications using different
bandwidths, different polynomials of age, and with and without individual controls. Results are
shown in Table 4, where Panel A shows results from specifications without controls and Panel B
shows results with controls. Columns 1 through 6 shows results for bandwidths of 9, 8, and 7
months, where odd-numbered columns include a linear polynomial of age and even-numbered
columns include a quadratic. Columns 7 through 10 control for linear functions of age for
bandwidths of 150, 120, 100, and 80 days. Columns 11 through 14 show results for bandwidths
of 80, 60, 40, and 20 days. In those specifications no controls for age are included, under the
assumption that among those sufficiently close to their 21st birthday, whether one can drink is
essentially random. Consistent with the visual evidence in Figure 1 as well as the results of
Table 2, estimates indicate that drinking causes a statistically significant performance drop of
0.06 to 0.10 standard deviations in the course.
An important question is whether our estimates represent temporary or permanent
reductions in performance due to the increase in drinking that occurs after turning 21. While
10
Figure 3 appears to show a lasting impact of age 21-induced drinking, we note that definitively
estimating the permanent effect of drinking is difficult for two reasons. First, it requires us to
estimate how well students would have performed months after turning 21 had they not been
able to drink. This is considerably more tenuous than making an assumption regarding
performance immediately after turning 21, which is required for the regression discontinuity
analysis. The second reason relates to the fact that we do not directly observe alcohol
consumption in the months after turning 21. Thus, even if we were to observe a rebound in
performance in the months after turning 21, it would be difficult to know whether it is due to a
reduction in drinking intensity or due to students' ability to adjust to a lifestyle of drinking.
However, with those caveats in mind, we can test whether the performance drop we
observe at age 21 is temporary. To do so, we estimate average academic performance 0 to 2
months, 2 to 4 months, 4 to 6 months and 6 to 8 months after turning 21 relative to performance
in the 2 months prior to turning 21.13 Consistent with Figure 3, the results suggest a performance
drop that persists through at least 8 months.14 While we cannot be certain whether the
persistence we observe is due to continued alcohol consumption, “senioritis”, or some other
effect, we do find a similar lasting reduction in performance when we limit the sample to only
students who turn 21 during their junior year.
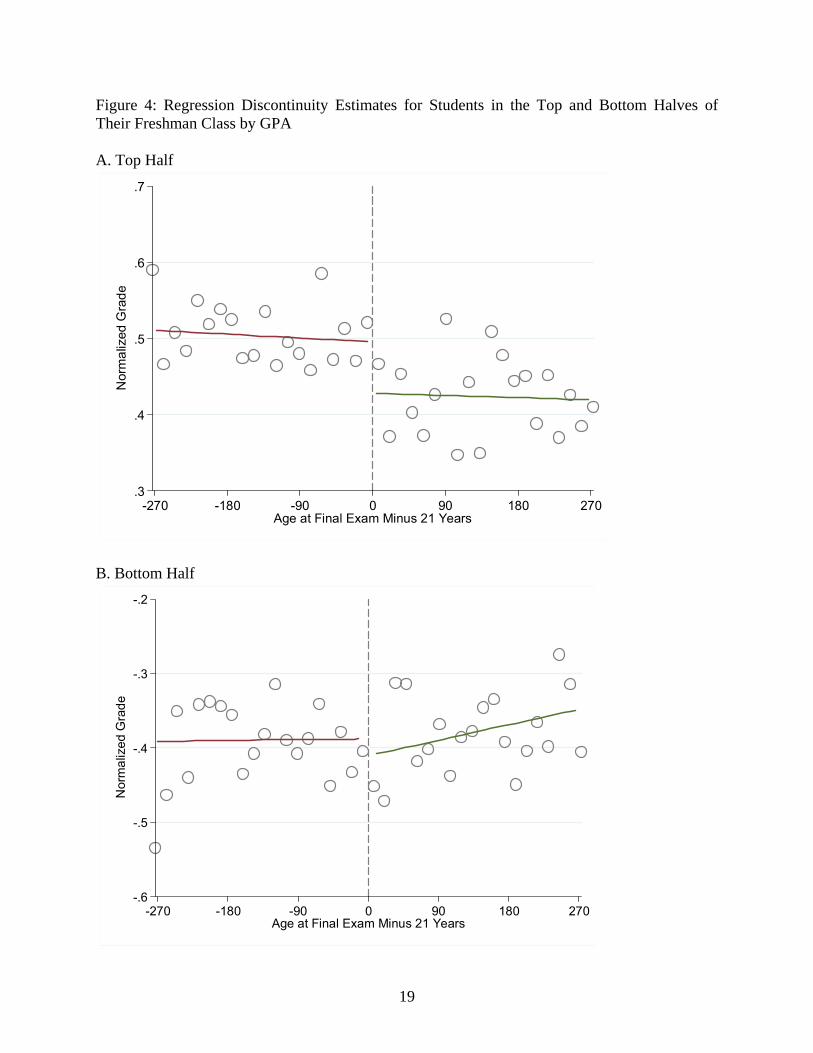
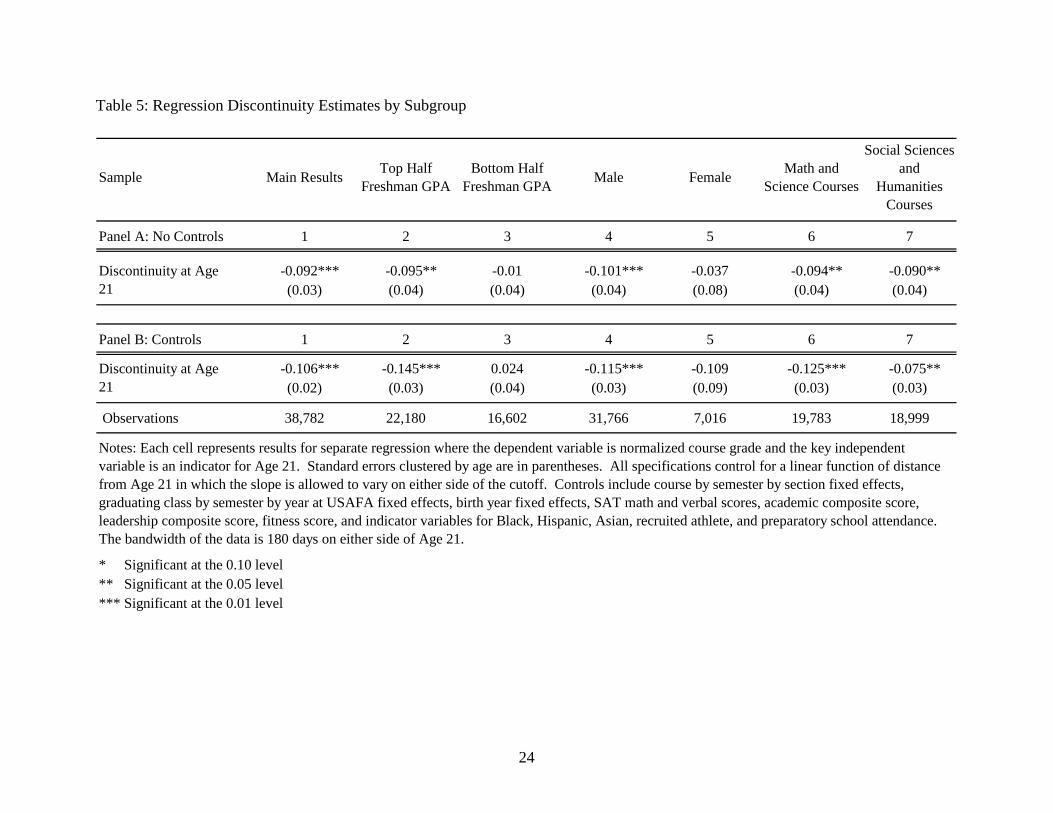
Next, we examine which students are most affected by drinking. Table 5 shows results
when we split the sample into two groups by cumulative GPA at the end of the freshman year.
Strikingly, we find that the largest negative effects of drinking are for the students who were in
the top half of their class by GPA at the end of their freshman year. Point estimates in Column 2
13 Thus, the model implicitly assumes that in the absence of age 21-induced drinking, performance would have remained at levels observed in the two months prior to turning 21. This appears to be a conservative assumption, since performance appears to be increasing, if anything, prior to turning 21. 14 Estimates are -0.101, -0.097, -0.050, and -0.113 after 0 to 2, 2 to 4, 4 to 6, and 6 to 8 months, respectively. All estimates except for that between 4 and 6 months are statistically significant at the 1% level.
11
indicate that these students experience a drop in course performance of 0.10 to 0.15 standard
deviations, or more than the effect of being assigned a professor whose quality was one standard
deviation below average. This result is shown graphically in Figure 4, which shows the
discontinuous drop in performance for students whose freshmen GPAs placed them in the top
half of their class. In contrast, we find little effect for students in the bottom half of their class.
Columns 4 and 5 of Table 5 show results for men and women, respectively. Estimates
are negative for both groups, though the estimates for women are imprecisely estimated due to
the limited number of women at the academy. Finally, Columns 5 and 6 show estimates
separately for math and science courses versus social sciences and humanities. Results indicate
that student performance drops similarly in both types of courses.
In summary, our results yield two notable findings. We find that there is a large and
statistically significant discontinuous drop in college performance at age 21 that is robust across
various bandwidths and functional forms. The drop in performance from the increase in drinking
in the weeks prior to final exams is economically significant, as it is approximately the same as
the effect of being assigned to a professor whose quality is one standard deviation below the
mean in quality for the entire semester. We also find that the largest negative effects of drinking
are on the high-ability students.
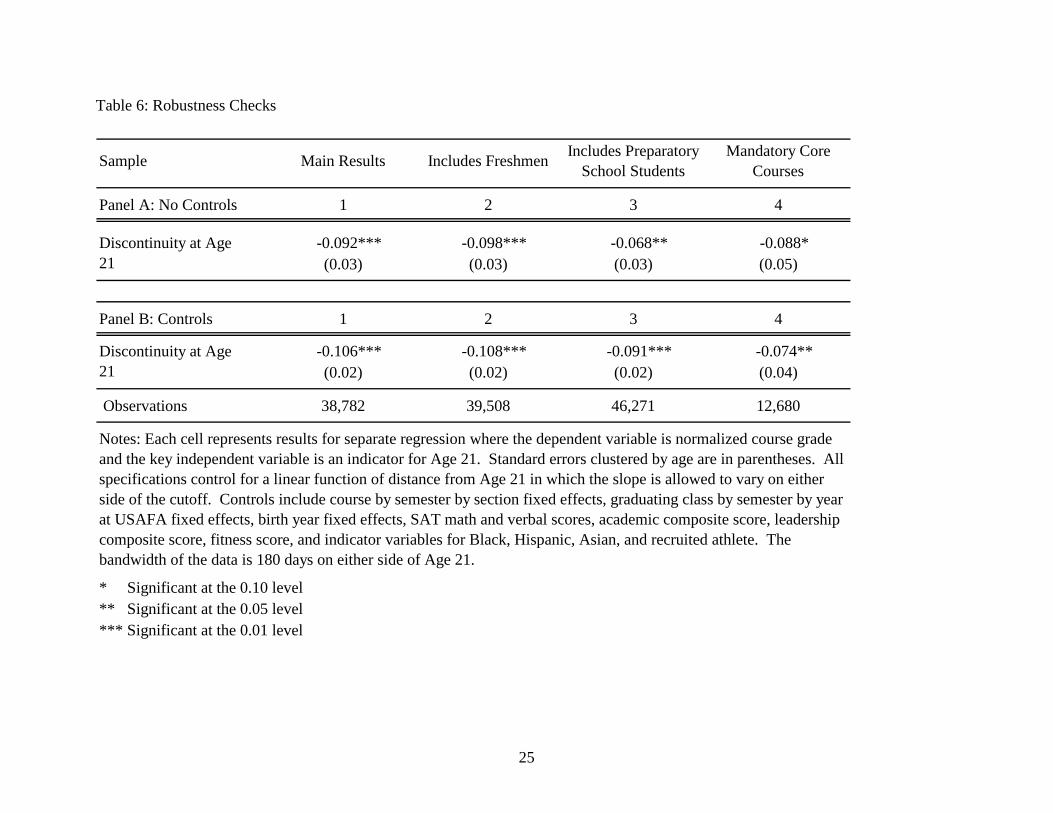
3.4 Robustness Tests
To test the robustness of our findings, in Table 6, Column 2, we show that our results are
virtually unchanged when including freshman students. In Column 3, we show similar results
when we include students who attended military preparatory schools prior to entering the
USAFA. As a third robustness check, in Column 4 we restrict our observations to the required
core courses taken by all students at the USAFA. These courses have the advantage of common
12
examinations for all students taking the course in a given semester and eliminate any possible
concerns of self-selection of courses during the semester in which a student turns 21 years of
age. Again, our results remain virtually unchanged compared to our main specification.
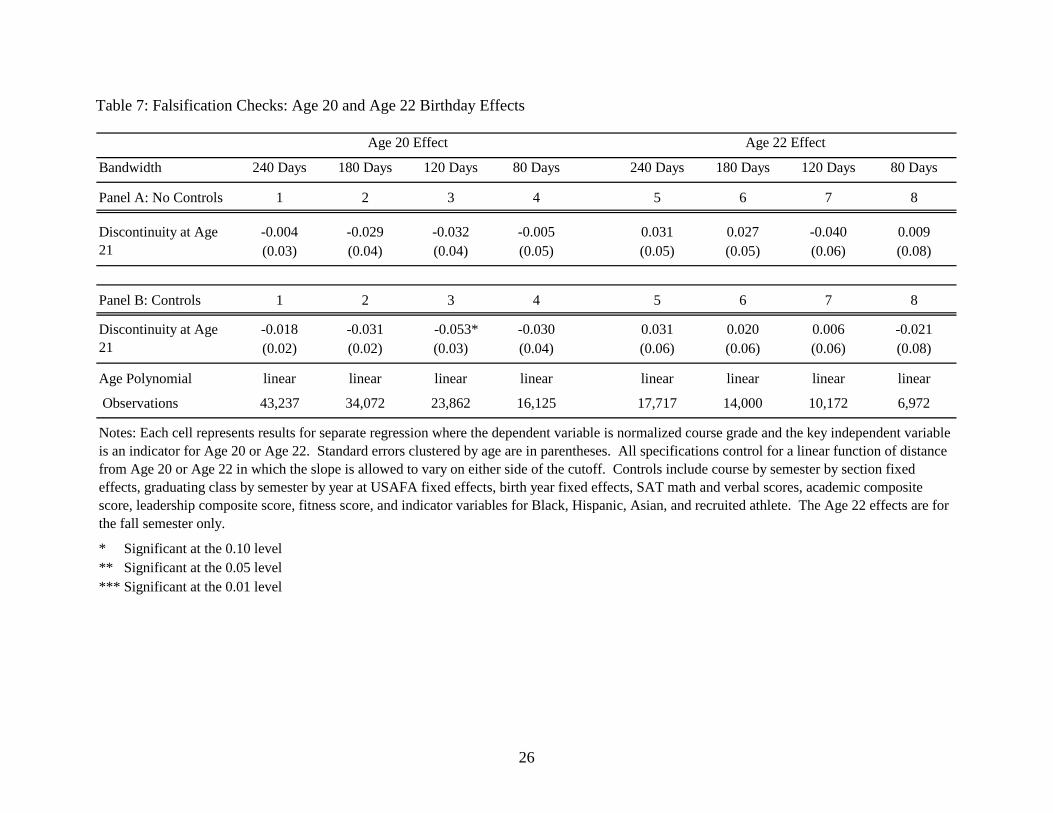
3.5 Birthday Effects
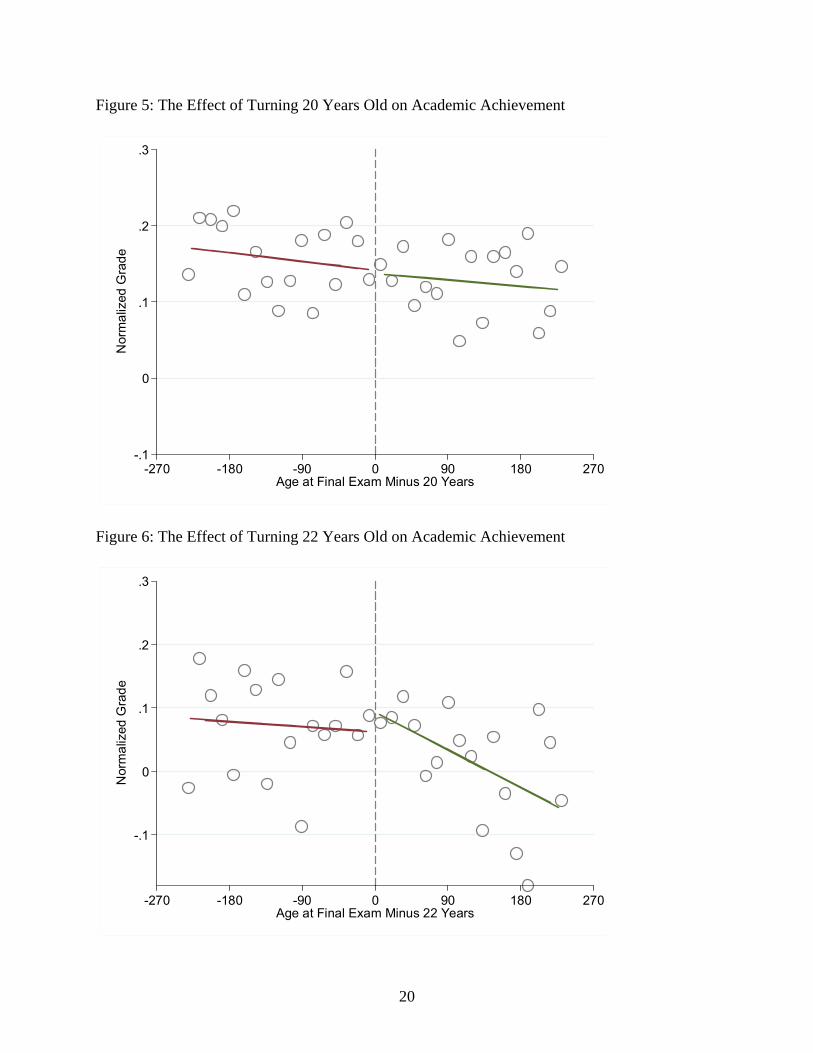
An alternative interpretation of the performance decline at age 21 is that it represents the
effect of birthdays generally, rather than the effect of drinking. To test this hypothesis, we
perform a similar regression discontinuity analysis for students turning 20. If the performance
declines estimated earlier were the result of a birthday effect rather than the increase in drinking
at age 21, we would expect to observe a similar decline at age 20. Results are shown in Figure 5,
with corresponding regression discontinuity estimates presented in the first 4 columns of Table 7.
The results indicate relatively small declines in performance, and only one of eight estimates is
statistically significant at the 10 percent level. More importantly, the underlying data shown in
Figure 5 do not appear indicative of a drop in performance at age 20.
We also test whether performance declines discontinuously at age 22. In contrast to age
20, it is possible that drinking increases discontinuously at age 22. However, we would expect
any such increase to be considerably smaller than the increase at age 21. Results are shown in
Figure 6, with corresponding regression discontinuity estimates presented in columns 5 through
8 of Table 7. In order to ensure comparability of the sample to the left and right of the age
cutoff, we restrict the sample to grades received in the fall semester.15 As with age 20, there is
little compelling graphical or statistical evidence of a meaningful drop in performance; none of
the 8 estimates is statistically significant at the 10 percent level.
15 That is, since a significant proportion of students do not turn 22 until after final exams in the spring of their senior year, we would never observe these students on the right-hand side of the age 22 cutoff in the spring semester.
13
4. Conclusion
While there has been a considerable amount of research on the consequences of alcohol
consumption, existing studies have faced one of two significant limitations. First, attempts to
exploit state-level laws have resulted in questions regarding both the relevance and the validity
of the instruments. Second, the majority of the existing research has focused on low frequency
outcomes such as fatalities and out-of-wedlock childbearing, so it is unclear whether drinking
has consequences on a broader set of individuals.
This study addresses the consequences of drinking on academic performance in college,
which allows us to examine a high frequency individual-level outcome. To overcome the
identification problem caused by selection into drinking, we exploit the discontinuity in drinking
that occurs at age 21 at a unique educational institution in which the minimum legal drinking age
is strictly enforced. Results show that drinking prior to and during final exam week causes a
statistically and economically meaningful reduction in academic performance. The performance
drop is of approximately the same magnitude as being assigned to a professor whose quality is
one standard deviation below average.
Moreover, we find that these effects are largely driven by the highest-performing
students. This suggests that the negative consequences of drinking are not limited to the narrow
segment of the population at risk of more severe, low-frequency outcomes.
14
References Amethyst Initiative, www.amethystinitiative.org, accessed February 23, 2010 Carrell, Scott E. and James E. West. 2010. “Does Professor Quality Matter? Evidence from Random Assignment of Students to Professors.” Journal of Political Economy, 118:3 409- 432. Carpenter, Christopher, and Carlos Dobkin. 2009. “The Effect of Alcohol Consumption on Mortality: Regression Discontinuity Evidence from the Minimum Drinking Age.” American Economic Journal: Applied Economics, 1:1 164-182. Chaloupka, Frank J., and Henry Wechsler. 1996. “Binge Drinking in College: The Impact of Price, Availability, and Alcohol Control Policies.” Contemporary Economic Policy, 14: 112-124. Cooperative Institutional Research Program. 2007. “The Freshman Survey”, Higher Education Research Institute at the University of California – Los Angeles. Dave, Dhaval, and Robert Kaestner. 2002. “Alcohol Taxes and Labor Market Outcomes.” Journal of Health Economics, 21: 357-371. Dee, Thomas S. 1999. “State Alcohol Policies, Teen Drinking, and Traffic Fatalities.” Journal of Public Economics, 72: 289-315. Dee, Thomas S. 2001. “The Effects of Minimum Legal Drinking Ages on Teen Childbearing.” Journal of Human Resources, 36 (4): 823-838. DeSimone, Jeff, and Amy Wolaver. 2005. “Drinking and Academic Performance in High School.” NBER Working Paper 11035. Fertig, Angela R. and Tara Watson. 2009. “Minimum Drinking Age Laws and Infant Health Outcomes.” Journal of Health Economics, 28: 737-747. Imbens, Guido W. and Thomas Lemieux. 2008. “Regression Discontinuity Designs: A Guide to Practice.” Journal of Econometrics, 142 (2): 615-635. Ludwig, Jens, and Doug Miller. 2007. “Does Head Start Improve Children’s Outcomes? Evidence from a Regression Discontinuity Design.” Quarterly Journal of Economics, 122 (1): 159-208. Miron, Jeffrey A. and Elina Tetelbaum. 2007. “Does the Minimum Legal Drinking Age Save Lives?”, Economic Inquiry, 47(2): 317-336. National Institute on Alcohol Abuse and Alcoholism, 2010. “Research Findings on College Drinking and the Minimum Legal Drinking Age”,
15
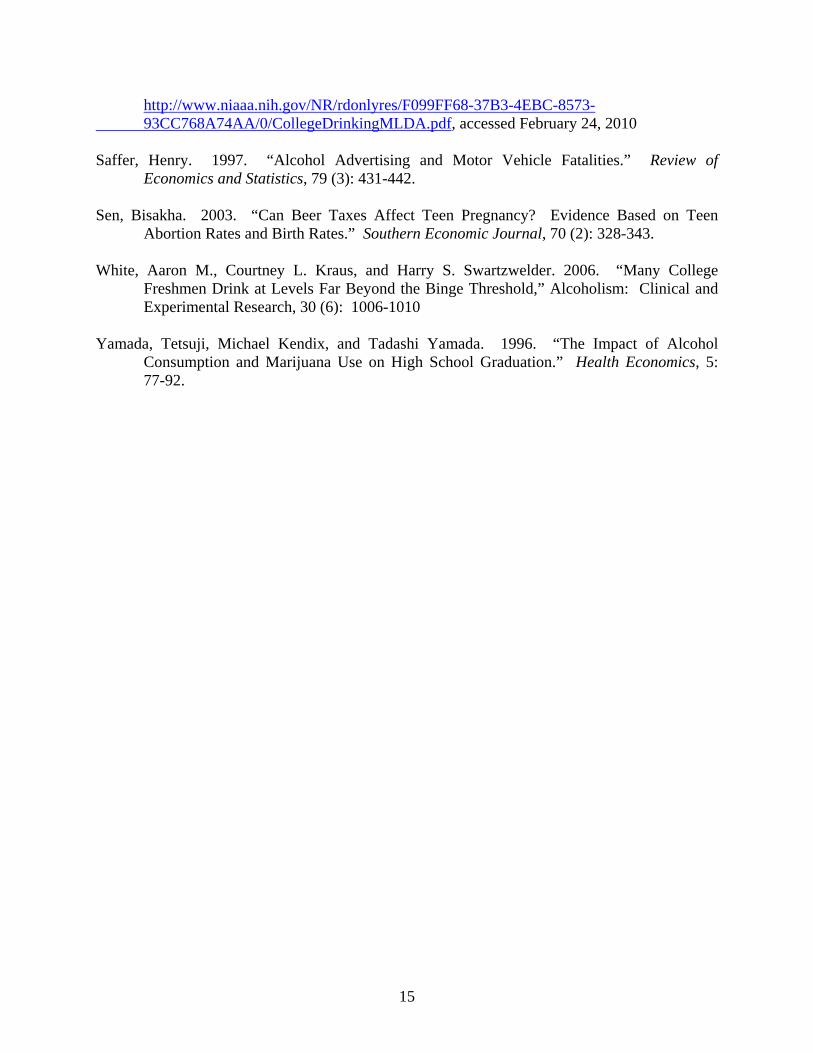
http://www.niaaa.nih.gov/NR/rdonlyres/F099FF68-37B3-4EBC-8573- 93CC768A74AA/0/CollegeDrinkingMLDA.pdf, accessed February 24, 2010 Saffer, Henry. 1997. “Alcohol Advertising and Motor Vehicle Fatalities.” Review of Economics and Statistics, 79 (3): 431-442. Sen, Bisakha. 2003. “Can Beer Taxes Affect Teen Pregnancy? Evidence Based on Teen Abortion Rates and Birth Rates.” Southern Economic Journal, 70 (2): 328-343. White, Aaron M., Courtney L. Kraus, and Harry S. Swartzwelder. 2006. “Many College
Freshmen Drink at Levels Far Beyond the Binge Threshold,” Alcoholism: Clinical and Experimental Research, 30 (6): 1006-1010
Yamada, Tetsuji, Michael Kendix, and Tadashi Yamada. 1996. “The Impact of Alcohol Consumption and Marijuana Use on High School Graduation.” Health Economics, 5: 77-92.
16
Figure 1: Distribution of Final Exam Observations Near Age 21
050
010
0015
0020
00Fr
eque
ncy
Cou
nt
-270 -180 -90 0 90 180 270Age at Final Exam Minus 21 Years
17
Figure 2: Tests of the Regression Discontinuity Design
Female Student .1
.15
.2.2
5fe
mal
e
-180 -120 -60 0 60 120 180Age at Final Exam Minus 21 Years
Asian Student
.03
.04
.05
.06
.07
.08
asia
n
-180 -120 -60 0 60 120 180Age at Final Exam Minus 21 Years
Fitness Score
4.6
4.7
4.8
4.9
cft_
scor
e
-180 -120 -60 0 60 120 180Age at Final Exam Minus 21 Years
SAT Verbal Score
630
635
640
645
650
sat_
v
-180 -120 -60 0 60 120 180Age at Final Exam Minus 21 Years
Black Student
.01
.02
.03
.04
.05
blac
k
-180 -120 -60 0 60 120 180Age at Final Exam Minus 21 Years
Leadership Score
17.2
17.3
17.4
17.5
17.6
17.7
lead
ersh
ip_c
mp
-180 -120 -60 0 60 120 180Age at Final Exam Minus 21 Years
Academic Composite Score
12.6
12.7
12.8
12.9
13ac
a_cm
p
-180 -120 -60 0 60 120 180Age at Final Exam Minus 21 Years
SAT Math Score
665
670
675
680
685
sat_
m
-180 -120 -60 0 60 120 180Age at Final Exam Minus 21 Years
18
Figure 3: Regression Discontinuity Estimates of the Effect of Drinking on Achievement
-.1
0
.1
.2
.3
Nor
mal
ized
Gra
de
-270 -180 -90 0 90 180 270Age at Final Exam Minus 21 Years
19
Figure 4: Regression Discontinuity Estimates for Students in the Top and Bottom Halves of Their Freshman Class by GPA A. Top Half
.3
.4
.5
.6
.7
Nor
mal
ized
Gra
de
-270 -180 -90 0 90 180 270Age at Final Exam Minus 21 Years
B. Bottom Half
-.2
-.3
-.4
-.5
-.6
Nor
mal
ized
Gra
de
-270 -180 -90 0 90 180 270Age at Final Exam Minus 21 Years
20
Figure 5: The Effect of Turning 20 Years Old on Academic Achievement
-.1
0
.1
.2
.3
Nor
mal
ized
Gra
de
-270 -180 -90 0 90 180 270Age at Final Exam Minus 20 Years
Figure 6: The Effect of Turning 22 Years Old on Academic Achievement
-.1
0
.1
.2
.3
Nor
mal
ized
Gra
de
-270 -180 -90 0 90 180 270Age at Final Exam Minus 22 Years
21
Table 1: Descriptive Statistics Variable Range
Course Score 82.32 (9.03) 0-117.73
Age (days from 21st birthday during finals week) -8.25 (149.61) -270-269
Black 0.03 (0.17) 0-1
Hispanic 0.04 (0.19) 0-1
Asian 0.05 (0.21) 0-1
Female 0.18 (0.38) 0-1
SAT Verbal Score 639.60 (60.80) 340-800
SAT Math Score 672.70 (57.86) 420-800
High School Academic Composite Score 12.81 (2.04) 5.35-17.41
High School Leadership Score 17.52 (1.87) 9-24
High School Fitness Score 4.75 (0.92) 2.3-8.0
Recruited Athlete 0.27 (0.44) 0-1
Mean (std. dev)
Notes: Figures come from 58,032 observations on 3,884 students. Excludes freshman and students who attended a military preparatory school.
22
Table 2: Tests of the Identifying Assumption of the RD Analysis
* Significant at the 0.10 level** Significant at the 0.05 level*** Significant at the 0.01 level
Discontinuity at Age 21
Notes: Each cell represents results for separate regression where the dependent variable is normalized course grade and the key independent variable is an indicator for Age 21. Standard errors clustered by age are in parentheses. All specifications control for a linear function of distance from Age 21 in which the slope is allowed to vary on either side of the cutoff. The bandwith of the data is 180 days on either side of Age 21.
Table 3: Regression Discontinuity Estimates of the Effect of Drinking on Academic Performance Specification 1 2 3
-0.092*** -0.114*** -0.106***(0.03) (0.02) (0.03)
Observations 38,782 38,782 38,782
Age Polynomial Linear Linear Quadratic
Control Variables No Yes Yes
* Significant at the 0.10 level
*** Significant at the 0.01 level
Discontinuity at Age 21
** Significant at the 0.05 level
Notes: Each cell contains results for separate regression where the dependent variable is normalized course grade and the key independent variable is an indicator for age 21. Standard errors clustered by age are in parentheses. All specifications control for a flexible polynomial of age in which the slope is allowed to vary on either side of the cutoff. Data include all observations on student performance within 180 days of their 21st birthday. Controls include course by semester by section fixed effects, graduating class by semester by year at USAFA fixed effects, birth year fixed effects, SAT math and verbal scores, academic composite score, leadership composite score, fitness score, and indicator variables for Black, Hispanic, Asian, and recruited athlete. The bandwidth of the data is 180 days on either side of Age 21.
23
Table 4: Regression Discontinuity Estimates for Different Bandwidths and Specifications
Bandwith 150 Days 120 Days 100 Days 60 Days 40 Days 20 Days
Age Polynomial Linear Quadratic Linear Quadratic Linear Quadratic Linear Linear Linear Linear None None None None
* Significant at the 0.10 level** Significant at the 0.05 level*** Significant at the 0.01 level
80 Days
Discontinuity at Age 21
210 Days
Notes: Each cell represents results for separate regression where the dependent variable is normalized course grade and the key independent variable is an indicator for age 21. Standard errors clustered by age are in parentheses. Controls include course by semester by section fixed effects, graduating class by semester by year at USAFA fixed effects, birth year fixed effects, SAT math and verbal scores, academic composite score, leadership composite score, fitness score, and indicator variables for Black, Hispanic, Asian, and recruited athlete.
Discontinuity at Age 21
270 Days 240 Days
24
Table 5: Regression Discontinuity Estimates by Subgroup
* Significant at the 0.10 level** Significant at the 0.05 level*** Significant at the 0.01 level
Discontinuity at Age 21
Discontinuity at Age 21
Notes: Each cell represents results for separate regression where the dependent variable is normalized course grade and the key independent variable is an indicator for Age 21. Standard errors clustered by age are in parentheses. All specifications control for a linear function of distance from Age 21 in which the slope is allowed to vary on either side of the cutoff. Controls include course by semester by section fixed effects, graduating class by semester by year at USAFA fixed effects, birth year fixed effects, SAT math and verbal scores, academic composite score, leadership composite score, fitness score, and indicator variables for Black, Hispanic, Asian, recruited athlete, and preparatory school attendance. The bandwidth of the data is 180 days on either side of Age 21.
25
Table 6: Robustness Checks
Sample Main Results Includes Freshmen Includes Preparatory School Students
* Significant at the 0.10 level** Significant at the 0.05 level*** Significant at the 0.01 level
Discontinuity at Age 21
Discontinuity at Age 21
Notes: Each cell represents results for separate regression where the dependent variable is normalized course grade and the key independent variable is an indicator for Age 21. Standard errors clustered by age are in parentheses. All specifications control for a linear function of distance from Age 21 in which the slope is allowed to vary on either side of the cutoff. Controls include course by semester by section fixed effects, graduating class by semester by year at USAFA fixed effects, birth year fixed effects, SAT math and verbal scores, academic composite score, leadership composite score, fitness score, and indicator variables for Black, Hispanic, Asian, and recruited athlete. The bandwidth of the data is 180 days on either side of Age 21.
26
Table 7: Falsification Checks: Age 20 and Age 22 Birthday Effects
Bandwidth 240 Days 180 Days 120 Days 80 Days 240 Days 180 Days 120 Days 80 Days
* Significant at the 0.10 level** Significant at the 0.05 level*** Significant at the 0.01 level
Age 22 Effect
Notes: Each cell represents results for separate regression where the dependent variable is normalized course grade and the key independent variable is an indicator for Age 20 or Age 22. Standard errors clustered by age are in parentheses. All specifications control for a linear function of distance from Age 20 or Age 22 in which the slope is allowed to vary on either side of the cutoff. Controls include course by semester by section fixed effects, graduating class by semester by year at USAFA fixed effects, birth year fixed effects, SAT math and verbal scores, academic composite score, leadership composite score, fitness score, and indicator variables for Black, Hispanic, Asian, and recruited athlete. The Age 22 effects are for the fall semester only.


![Hoekstra Delft 24Oct2011[1]](https://static.documents.pub/doc/80x56/577d23641a28ab4e1e99ab8c/hoekstra-delft-24oct20111.jpg)


