Page 1
Scott Kelley
Dr. Michael Kuby
Arizona State University
NSF Grant 1025313: Spatial Refueling Patterns of Drivers of Alternative-Fuel and Conventional Vehicles
ESRI Southwest User Group Annual Conference
November 16, 2011 Mesa, Arizona
Page 2
Energy Geography and Spatial Modeling/GIS
Our Energy Future?
New Infrastructure
Early Patterns?
Source: Energy Information Administration
Page 3
Previous Work: ◦ Sperling & Kitamura (1986 & 1987)
◦ Diesel vs. Gasoline
Range Anxiety ◦ Gasoline: Higher Energy Density, Greater Range
Honda Civic GX Source: Honda
Page 4
What are the refueling patterns of CNG drivers in Southern California?
◦ How do they compare to gasoline drivers?
◦ How can this help inform future alternative fuel infrastructure decision-making?
Page 5
Survey Data
Collection
Fleet vs. Consumer
Find companion
station
Source: City of Burbank, CA
Page 6
Network Analyst
Street Data Source: ◦ TeleAtlas data with ArcGIS 10
◦ Digitized and connected interstates
Goals: ◦ Shortest Path vs. Refueling Path
Primary Cost: Travel Time
Secondary Cost: Distance
◦ Closest Facility Analysis for CNG
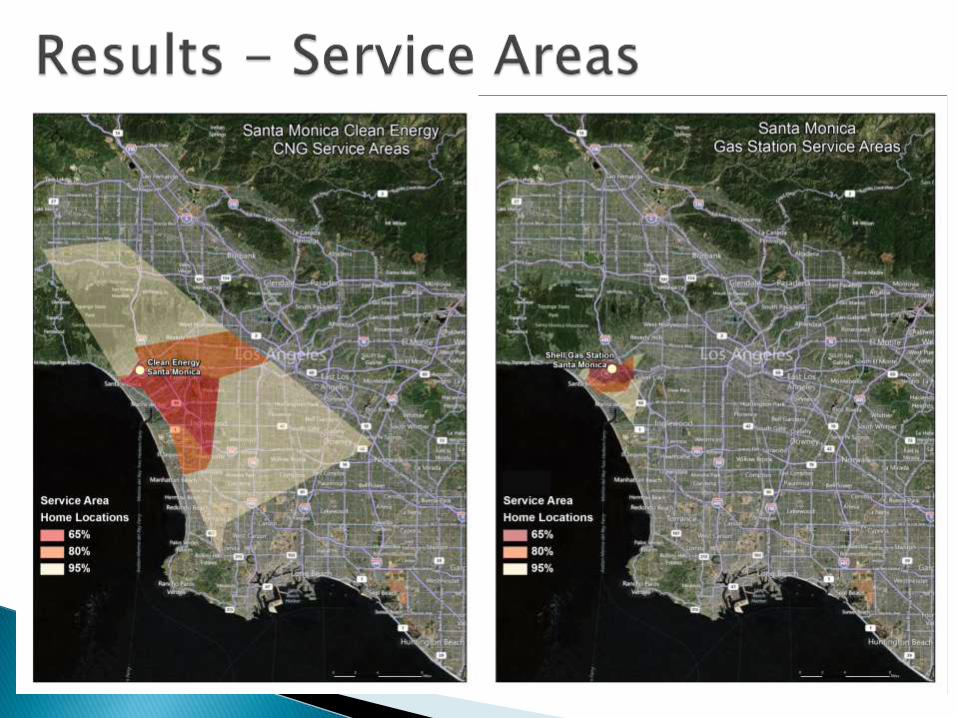
◦ Service Areas
◦ Home locations important!
Page 7
Build & calibrate
Digitize
Calculate
Automate
Export for Analysis ◦ Shortest Path
◦ Station Path
Page 8
Review routes
QA/QC
Export to gdb
Page 9
Immediate Route and Full Route ◦ Kitamura & Sperling used immediate
◦ Kept separate
Page 10
Actual Trip Length, in Miles Time Deviation, in Minutes (%)
Mean Median Mean Median
Santa Monica
Gasoline 9.9 5.4 1.56 (12.2%) 1.35 (6.8%)
CNG 17.8 10.3 8.20 (101.2%) 6.39 (32.1%)
Anaheim
Gasoline 11.4 10.4 2.58 (13.4%) 1.43 (5.3%)
CNG 18.8 16.4 8.45 (23.7%) 5.39 (14.9%)
Burbank
Gasoline 54.0 12.3 2.76 (15.9%) 2.00 (6.53%)
CNG 44.1 21.0 8.02 (28.9%) 5.55 (21.4%)
* Single-purpose refueling trips (same origin and destination) removed
Page 11
Burbank CNG Station - Consumer Stops Matrix (Origin - Destination)
DESTINATION
Home Work Social/Dining Shopping School Other TOTAL PERCENT
Home 0 6 3 3 2 2 16 30.19%
Work 19 1 1 1 0 0 22 41.51%
ORIGIN Social/Dining 6 0 0 0 0 0 6 11.32%
Shopping 2 0 1 0 0 0 3 5.66%
School 4 0 0 0 0 1 5 9.43%
Other 1 0 0 0 0 0 1 1.89%
TOTAL 32 7 5 4 2 3 53 PERCENT 60.38% 13.21% 9.43% 7.55% 3.77% 5.66%
Burbank GAS Station - Consumer Stops Matrix (Origin - Destination)
DESTINATION
Home Work Social/Dining Shopping School Other TOTAL PERCENT
Home 0 5 11 1 0 0 17 32.08%
Work 15 1 3 2 0 0 21 39.62%
ORIGIN Social/Dining 5 1 0 0 0 0 6 11.32%
Shopping 3 0 0 0 0 0 3 5.66%
School 6 0 0 0 0 0 6 11.32%
Other 0 0 0 0 0 0 0 0.00%
TOTAL 29 7 14 3 0 0 53
PERCENT 54.72% 13.21% 26.42% 5.66% 0.00% 0.00%
Page 14
Closest Facility Analysis ◦ Data Source: NREL station data/Clean Car Maps
Page 15
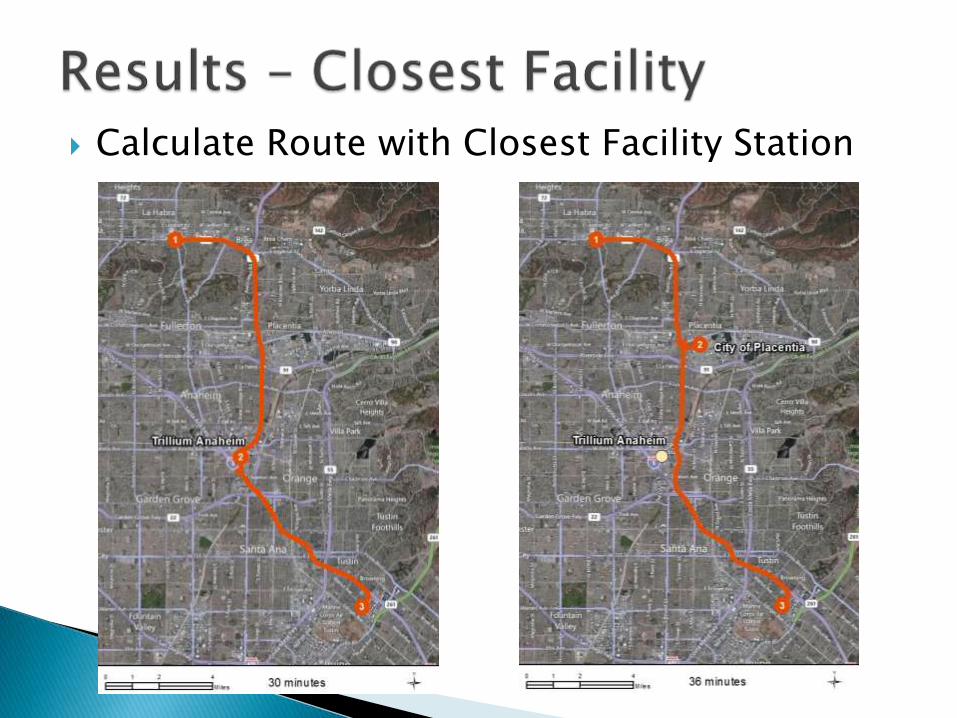
Calculate Route with Closest Facility Station
Page 16
Closest Facility - % using closest to home
◦ Anaheim – 0%
◦ Santa Monica – 46.67%
◦ Burbank - 28%
Page 18
Perceptions?
Traffic Patterns?
Cited:
“Convenient
Location”
Page 19
Beyond GIS
◦ Statistical Analysis
Comparing populations of Gasoline/CNG
Near-home refueling for CNG or on-route?
Flow Recapturing Location Model (FRLM) - Kuby
◦ Patterns
Differences in geography?
Demographic differences?
Page 20
Survey Drivers and Analyze Refueling Patterns
RQ: How do EV drivers use the new Phoenix infrastructure, and how can these results assist other cities in building their own networks?
Source: Blink Network
Page 21
Ecotality/DOE network ◦ Residential
◦ Public
A different approach ◦ Level 1,2 chargers
◦ DC Fast-chargers
Stationary vs. quick-stop
Page 22
Thanks to: ◦ PI: Dr. Michael Kuby
◦ School of Geographical Sciences and Urban Planning, Arizona State University
Joe Schoenemann, ASU - Digitizing
Patrick Zweifel, Jeff Martinez, ASU – Survey Collection
Mike McLean, ASU-ISSR
Clean Energy and gas station owners