60
SCOTTISH MUSLIMS IN NUMBERS Understanding Scotland’s Muslim population through the 2011 Census

SCOTTISH
MUSLIMSIN NUMBERSUnderstanding Scotland’s Muslim population through the 2011 Census
SCOTTISH MUSLIMS IN NUMBERS2
By Dr. Khadijah Elshayyal
© The Alwaleed Centre for the Study of Islam in the Contemporary World, University of Edinburgh, 16 George Square, Edinburgh EH8 9LD.
With special thanks to:Alistair Hunter and Tom Lea, The Alwaleed Centre, The Muslim Council of Scotland (MCS), Stuart Macdonald and Laine Ruus, the Edinburgh Data Library, and staff at the National Records Scotland (NRS).
Art Director:Salman Farsi
Graphic Design:Sadek Ahmed
Scottish Muslims in NumbersUnderstanding Scotland’s Muslim population through the 2011 Census
www.alwaleed.ed.ac.uk
@alwaleed_centre
/alwaleededinburgh
An online version of this report is available at:www.alwaleed.ed.ac.uk/scottishmuslims

SCOTTISH MUSLIMS IN NUMBERS3

SCOTTISH MUSLIMS IN NUMBERS4
CO
NTE
NTS 1 INTRODUCTION 06
2 EXECUTIVE SUMMARY 08
3 DEMOGRAPHIC DETAIL 14 3.1 Population and Place Of Birth 143.2 Ethnic Diversity 153.3 Geographical Distribution 163.4 Age Profile 183.5 Parliamentary Constituency Population 20 (Westminster and Scottish)
5 INEQUALITIES 36 5.1 Deprivation 365.2 Housing Tenure 385.3 Health and Disability 39
6 LABOUR MARKET ISSUES 43 6.1 Economic Activity/Inactivity 436.2 Types of Economic Activity 446.3 Education and Qualifications 456.4 Focus on Women 506.5 Socio-economic Classification 52
4 ISSUES RELATING TO CIVIC LIFE 244.1 National Identity 244.2 English Language Skills 254.3 Household Type 264.4 Focus on Youth 304.5 Prison and Other Institutionalised Populations 34
7 CONCLUSIONS 54
8 REFERENCES 56

SCOTTISH MUSLIMS IN NUMBERS5
List of Tables & FiguresTables
Table 1: Religion in the 2011 Census
Table 2: Scottish Muslims as a proportion of British Muslims
Table 3: Country of Birth of Muslim Population
Table 4: Ethnicity of Muslim Population
Table 5: Muslim Proportions of Ethnic Groups
Table 6: Muslim Population by Region
Table 7: Muslim Population Change in cities with
Largest Muslim Population
Table 8: Change in Muslim Population Age Profile 2001-2011
Table 9: Muslims in 55-74 year old age band
Table 10: UK Constituencies with over 1% Muslim population
Table 11: Scottish Constituencies with over 1% Muslim population
Table 12: Muslim population in all Scottish Council Areas
Table 13: Muslims and National Identity
Tables 14 & 15: Muslims and English Language Skills
Table 16: English Language Skills by Religion and Sex
Tables 17 & 18: Muslims and Household Composition (HRPs)
Table 19: Muslims (individuals) and Household Composition
Table 20: Age Profile of Muslim Population
Table 21: Muslims in 0-4 and 5-9 year old Age Bands
Table 22: Young Muslim Population in Glasgow, Dundee and East Renfrewshire, wards with >5% Muslim population
Table 23: Muslims and Communal Establishments
Table 24: Prison Population by Religion
Table 25: Prison Population by Ethnicity
Table 26: Muslims and Deprivation by Local Authority
Table 27: Muslims and Housing Tenure
Table 28: Ethnicity and Housing Tenure
Table 29: Muslims and Ill Health
Table 30: Health in the over 65 Population by Sex
Table 31: Muslims and Disability
Table 32: Disability in the over 60 Population by Sex
Table 33: Council areas with large Muslim Populations
and over 65s with Disabilities
Table 34: Muslims and Economic Activity
Table 35: Types of Full Time Employment
Table 36: Muslims and Highest Level of Qualification
Table 37: Muslim Students by Age and Sex
Table 38: Council Areas with Highest Muslim Student Populations
Table 39: Student population by ethnicity and sex
Table 40: Women Looking After Home and Family
Table 41: Economically Active Women, aged 16 and over
Table 42: Economic inactivity among Muslim men and women, aged 16 and over
Table 43: Muslims and National Statistics Socio-Economic Classification (NS-SeC)
Table 44: Local Council Areas with the largest numbers of Muslim ‘high’ and ‘low’ achievers
Figures
Figures 1: Population Pyramids for Muslim Population and Overall Population
Figure 2: Proportion of each ethnic group living in the most deprived 10 per cent data zones/LSOA,Scotland/England
Figure 3: Muslims and highest level of educational qualification - 2001
Figure 4: Muslims and highest level of educational qualification - 2011

1. Introduction
Scotland has been home to established Muslim communities since the early 20th Century. Although records of Muslim presence in Scotland date back as early as 1504,1 the first substantial Muslim communities
were formed of settlers who arrived from South Asia (Pakistan and India) in the aftermath of the Second World War. As with post-war immigration to other parts of Britain and Europe, these settlers were concentrated around urban areas, in particular the cities of Glasgow, Edinburgh and Dundee. But in contrast to many of the South Asians who arrived in the northern towns of England from the villages and towns of rural Mirpur, these Scottish immigrants tended to hail from comparatively more affluent Pakistani cities such as Lahore.2
To date, we have no authoritative compilation of statistical data pertaining to Scotland’s Muslims, nor has there been developed any substantial statistically informed demographic picture of Scotland’s Muslim population. In part, this has been due to the unavailability of such data until relatively recently. The UK national census first introduced a question on religion only in 2001, thus providing us with the first accurate population figure for Muslims (and indeed, other minority religions) in British history. Another reason has been a lack of interest, both by Muslim organisations and individuals, as well as among
scholars of British Islam. With the overwhelming majority of British Muslims residing in England (95.5%), studies of ‘Muslims in Britain’ have very often been essentially studies of Muslims in England. And while, as this report shows, Scottish Muslims do have much in common with Muslims in other nations of the UK, there are other areas where distinct differences emerge from the data, highlighting what are interesting particularities about the Scottish Muslim experience.
Photo credit: Ian Rutherford/The Scotsman.

SCOTTISH MUSLIMS IN NUMBERS7
The political developments of recent years make it all the more important for us to develop a deeper understanding of Scotland’s Muslim population and their communities. The governance of Scotland is becoming increasingly devolved. The Scotland Act 2016, introduced in the wake of the post-independence referendum Smith Commission, extended and awarded significant powers to Holyrood. The recent result of the EU referendum has raised the prospect of a second independence referendum for Scotland, or at the very least, even further devolution, as real possibilities. In this context, the importance of understanding Scotland’s Muslim populations, their demographic as well as health, education, and socio-economic features cannot be understated to those who will be developing policies for the nation. As Scotland’s sense of itself continues to develop in this new and evolving political context, its appreciation of its minority populations is vital to its evolving self-understanding. While at 1.45% Muslims constitute only a small minority of Scotland’s population, they remain the largest religious minority, larger than all other religious minorities combined. Furthermore, as the Christian population of Scotland continues to decline, and the population of those with ‘no religion’ continues to rise,3 Muslims and those of minority faiths occupy an increasingly integral place in 21st Century Scotland.
This report uses the most recent national census data (2011) to develop a statistical overview of the Muslim population of Scotland. It seeks to fulfil two aims: 1) to provide the first comprehensive profile of Scotland’s Muslim population using the most recent census data; and 2), to highlight some of the features that are distinctive to Scotland’s Muslim population, and offer some analysis, context and deeper understanding of the issues. For both of these aims, this report can be used in conjunction with the recently published
‘British Muslims in Numbers’ (2015) by Sundas Ali. However, there are important differences between the two reports, both in terms of the way in which data has been collected, owing to different census forms used in Scotland, compared with England and Wales, but also differences in the geography levels used, and other aspects of report presentation. Nonetheless, I have tried to present this report such that it can be used as coherently as possible alongside its predecessor, but also as a standalone document. A specific feature of this report relates to the much smaller population in Scotland as a whole, but also specifically of Muslims in Scotland. This has caused limitations in some areas where population numbers in multivariate categories were so small as to become restricted by the National Records of Scotland (NRS), in the interest of safeguarding and confidentiality. Figures have been approximated for some of these categories by using microdata samples provided by the NRS but sometimes this also has not been possible.
Finally, a note about census data. Censuses are an invaluable tool for providing ‘snapshot’ pictures, and for helping us to understand patterns of change over time. Unlike polling data or data from other surveys relying on sample populations, national census data accounts for every individual – and as such commands a high level of statistical confidence. However, although the figures in this report provide us with the most up to date, comprehensive picture of Scottish Muslims, the data is already five years old and so will not reflect changes and developments that have taken place since 2011 – for instance the recent and continuing arrival of Syrian refugees.
Picture above: MSPs Humza Yousaf and Angela Constance take part in swearing in ceremony at the Scottish Parliament, May 2016. In acknowledgment of his Scottish and Pakistani heritage, Yousaf took his oath in English and Urdu. Jeff J Mitchell/Getty Images
1 Bashir Maan, Muslims in Scotland (Argyll, Edinburgh: 2014), p.13.2 Stefano Bonino, Muslims in Scotland: the making of community in a post-9/11 world (Edinburgh University Press, Edinburgh: forthcoming, 2017).3 The Christian population went down from 65.1% in 2001 to 52.8% in 2011, and the ‘no religion’ population went up from 27.5% in 2001, to 36.7% in 2011. See Census 2001 NRS Table KS07 and Census 2011 NRS Table KS209SCb.

SCOTTISH MUSLIMS IN NUMBERS8
2. Executive SummaryDemographic Detail:
Population and Place of Birth:
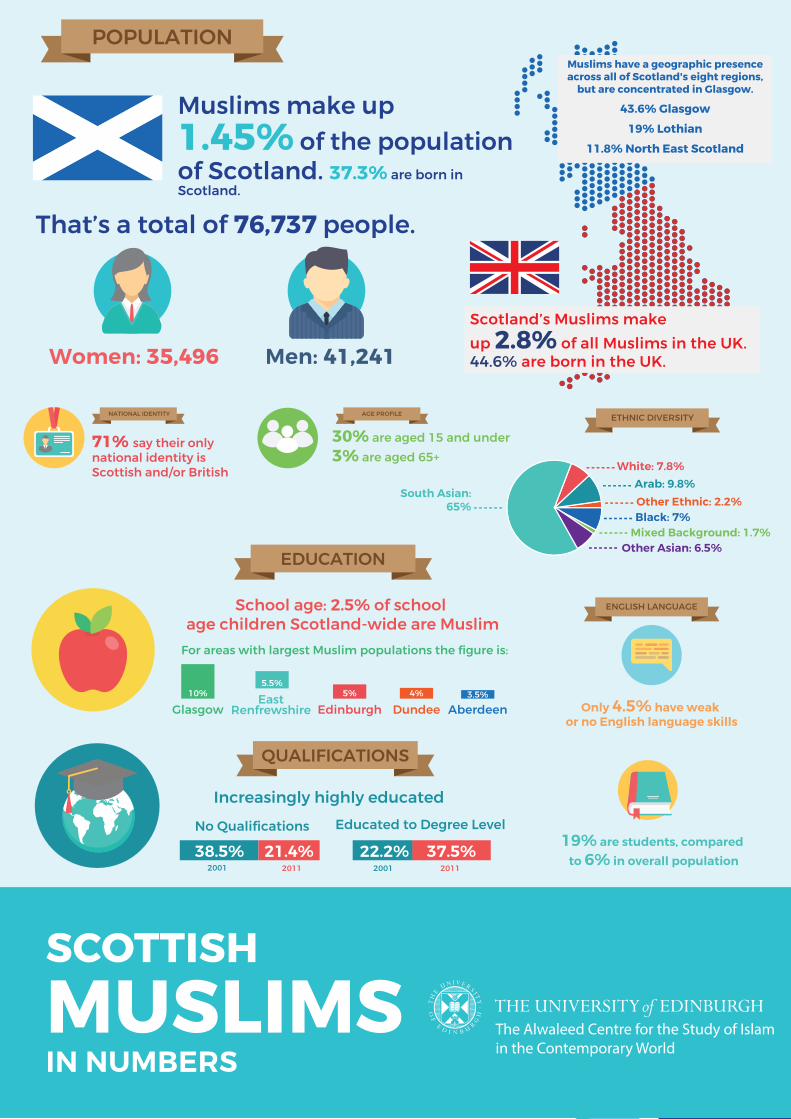
• Muslims constitute 1.45% of the population in Scotland – there are 76,737 Muslims, 41,241 of them men, and 35,496 women. Scotland’s Muslims make up 2.8% of all Muslims in the UK.
• The Muslim population of Scotland is larger than the total population of all the other non-Christian faith groups in Scotland.
• 44.6% of the Muslim population is UK born, and 37.3% are born in Scotland.
Observations:
• The Muslim population increased by over 34,000 between the 2001 and 2011 Censuses, and Muslims remain the largest minority faith population in Scotland – larger than all the other minority faiths combined.
• Nonetheless, the Muslim population is very small in proportion to the overall population. Muslims are about 1 in 70 of the Scottish population. For comparison, Muslims are just under 1 in 20 of the population of the UK as a whole.
• Scotland has a growing Muslim population which has a young age profile, and increasingly UK/Scotland-born. Though currently a youthful population, the proportion falling into the 65+ age band is gradually on the rise.
Ethnic Diversity:
• Muslims in Scotland are an ethnically diverse population. Although a majority of Muslims are South Asian (65%), 9.8% or 1 in 10 are Arab, and 7.8% (1 in 12) are White, while 7% are Black.
• Over one third of the Black and Ethnic Minority (BME) population in Scotland is Muslim.
Observations:
• Ethnic diversity among Scottish Muslims reflects a wide range of worldwide connections that provide opportunities for mutually enriching cultural and economic ties and relationships.
• One third of the BME population in Scotland are Muslim, and 92% of Muslims in Scotland are BME – experiences of race, cultural, religious and gendered prejudice and discrimination are often intersectional and efforts to address them by
policy makers and civil society groups will be most effective when taking this into account.
• In addition to involving women and young people, Scottish Muslim institutions should remain alert to the importance of reflecting the ethnic diversity of their communities in decision-making and executive roles.
Geographical Distribution:
• 75% of Muslims live in the three Scottish parliamentary regions of Glasgow (43.6%), Lothian (19%) and North East Scotland (11.8%), mainly concentrated in the cities of Glasgow, Edinburgh, Dundee and Aberdeen.
• While there are Muslims in all of Scotland’s council areas, and in general, the population is sparsely distributed. The city council with the highest concentration of Muslims is Glasgow (5%), and within Glasgow, Dundee and East Renfrewshire, some wards have significant concentrations of Muslim population. Pollokshields and Southside Central (both in Glasgow) are the wards with the highest concentration of Muslim residents – 27.8% and 15.7% respectively.
Observations:
• The widespread and relatively sparse distribution of the Muslim population across Scotland contradicts popular notions of clustering and self-segregation.
• There are only 13 electoral wards with a Muslim population of 5% or more – even the areas where the Muslim population is most concentrated such as Pollokshields ward (27.8%), do not come close to comparing with some of the urban areas in Blackburn, Bradford and Birmingham, where the Muslim population in some wards is over 70%.
Age Profile:
• 30% of the Muslim population was aged 15 or under in 2011, compared to 17% of the total population. For the 65+ age band, the figure for Muslims is 3.3%, compared with 17% for the population as a whole.
• It is estimated that in 2021 there will be 5,076 Muslims aged between 65-85, an estimated 6.6% of the overall population in that age band.
Observations:
• The youthful demographic profile of the Muslim population is distinct from the older profile of the overall Scottish population.

SCOTTISH MUSLIMS IN NUMBERS9
• The growing proportion of Muslims in the elderly age bands requires relevant care providers to address cultural and religious needs for this group as appropriate.
• In implementing provisions for grave re-use in the recently introduced Burial and Cremation Act (Scotland), Burial Authorities should be obliged to consult with religious communities in situations where religious sections of cemeteries are affected.
Parliamentary Constituency Population:
• Muslim populations are not significant enough in any of Scotland’s Westminster or Holyrood constituencies to be the sole decisive force in the fortunes of an electoral candidate. The Scottish parliamentary constituency with the highest Muslim population is Glasgow Southside, where 18.9% of the population is Muslim. Glasgow Central is the UK parliamentary constituency with the highest Muslim population, at 12.9%.
Observation:
• Although there are many examples of significant political engagement from Scotland’s Muslim communities, there remains a low voter registration and turnout rate. Much more can be done to generate awareness among Muslims of the importance of participating in the electoral system.
Issues Relating to Civic Life:
National Identity:
• 71% of Muslims in Scotland consider their only national identity to be Scottish or British (or any combination of UK identities).
Observations:
• Muslims have a strong sense of belonging to Scotland in particular and the UK more generally.
• Wider research raises questions around ways in which Scots who are not Muslims imagine their Scottishness, and the extent to which this includes or excludes Muslims and ethnic minorities. It has also pointed to notable real and perceived barriers to integration – one of which being divergent understandings of what it means to integrate. This highlights the importance of cross-community and cross-cultural conversations and initiatives around what is a challenging and often contentious topic.
English Language Skills:
• Only 4.5% of Muslims in Scotland have weak or no English language skills.
Observation:
• Only a small proportion of the Muslim population struggles with English, and the patterns for this are not dissimilar to those among the populations of other religious minorities for whom a significant number are immigrants.
Household Type:
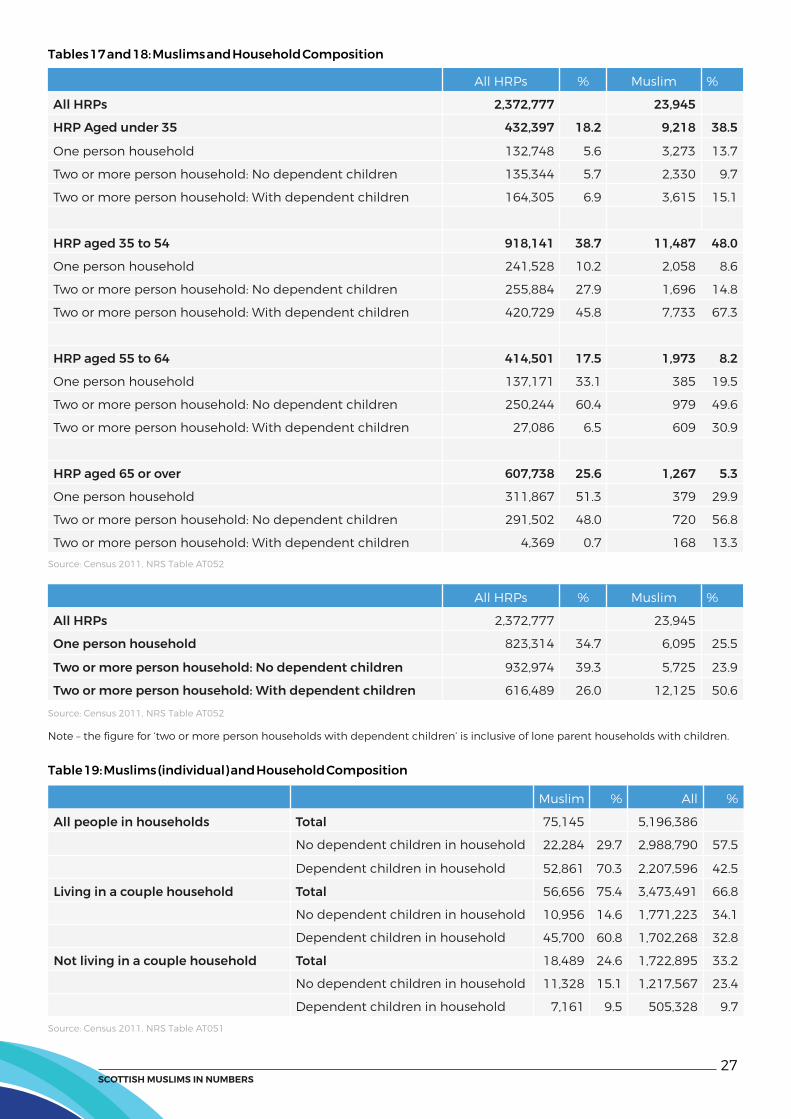
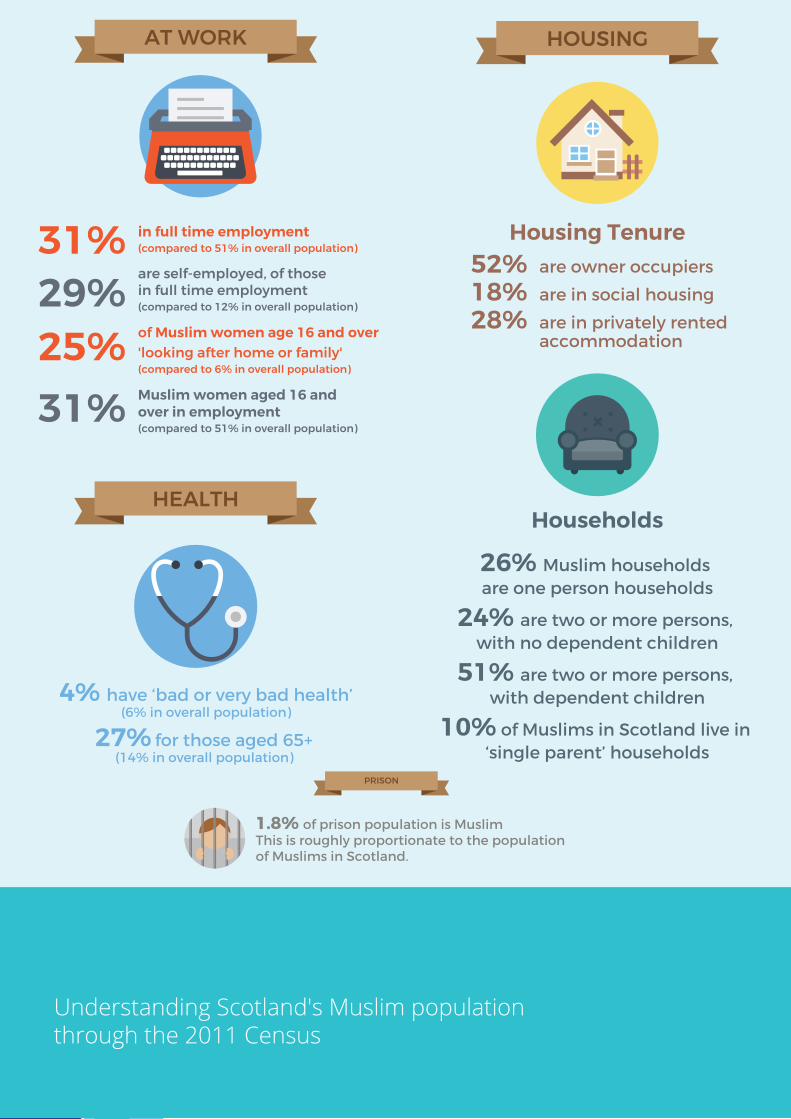
• Two figures are particularly reflective of the younger age profile of the Muslim population: the first is that 12,125, or 50.6% of Muslim households are composed of a couple with dependent children, almost double the figure (26%) for the overall population. The second, that 39% or 2 in 5 Muslim households have a household reference person (formerly ‘head of household’) under the age of 35. This is in comparison to a figure of 18% for the population as a whole.
• 10% of Muslim household reference persons report that they are single, with dependent children.
Observation:
• The high number of Muslim households with dependent children will have interests in specific policy areas such as the development of facilities for children and young people, as well as family support networks and initiatives. The latter may be especially useful for single parent households.
Focus on Youth:
• 2.4% of school-aged children (5-14 year olds) are Muslim. In some Glasgow and Dundee wards where Muslim populations are more concentrated the figure is much higher. For instance in Pollokshields, 48% of all school-age children are Muslim.
• By 2021, it is projected that the number of Muslim teenagers aged 15-19 in Scotland will be around 7,250, or 9.4% of the overall population for that age band.
Observations:
• Schools and other services for children and families need to be aware of these demographic patterns in developing their diversity, equality and inclusion policies.
• Key ways in which the Scottish Government’s commitments to diversity and equality can be demonstrated include supporting the teaching of Urdu in schools in areas of Glasgow and Dundee, and actively supporting the development of broader religious literacy in schools, to help prepare children for life in Scotland as part of an increasingly diverse, globalised and interconnected world.
SCOTTISH MUSLIMS IN NUMBERS10
• Concerns around racism and Islamophobia in the education sector and the workplace should be taken seriously and commitments made towards better public education, and policy development around these areas.
Prison Population:
• 1.8% of the prison population in Scotland is Muslim. This is broadly in proportion to the 1.45% of Scottish population which is Muslim, and in significant contrast to the very large figure of 13% for Muslim prisoners in England and Wales.
Observation:
• Discussions around the high Muslim prison population in England and Wales should take care to point out that Scotland is an exception to this. Scottish prison and rehabilitation institutions should nonetheless take care to be sensitive to cultural and religious needs of Muslim and other minority populations.
Inequalities:
Deprivation:
• Due to the relatively sparse distribution of Muslims in Scotland within their cities of settlement, it is difficult to assess whether there is any pattern between Scottish Index of Multiple Deprivation (SIMD) scores, and Muslim residents. This may be an area of potential future research at data zone level.
• Previous research has found that BME populations are more likely to live in more deprived areas of Scotland, and this is most notable with the ‘African’ category.
• Notably, although Pakistanis and Bangladeshis are still over-represented in more deprived areas of Scotland, they are less likely to be living in such areas in Scotland than they are in England.
Observations:
• Solid evidence suggests that BME Scots continue to be more likely to reside in more deprived areas, despite data suggesting that Pakistanis and Bangladeshis are less likely to be living in deprivation in Scotland than they are in England.
• There is scope for more research into SIMD scores in smaller geographies where there are more concentrated Muslim populations in Scotland.
Housing Tenure:
• More than half of Muslim households are owner occupied and 18% are classed as social housing.
• 1 in 4 Muslim households are privately rented. This figure is especially high among Arab households, where 46.5% of homes are privately rented. This may be related to the high student numbers among the Arab population.
Observations:
• The availability of affordable rental properties will be a matter of significant concern for many Muslims who are privately renting, but particularly so for Arabs, where over 45% fall into this category. Local authorities seeking to designate ‘rent pressure zones’ under the SPRT from 2017 onwards should bear this in mind.
• Presently, there is no shari’a compliant home purchase product being offered under the Scottish Help to Buy affordable homes scheme. This represents an opportunity for potential lenders to offer a product that may be of significant interest to Muslims.
Health and Disability:
• The proportion of Muslims self-declaring as having ‘bad or very bad health’ is 4% - similar to the figure for the overall population of Scotland, which is 5.6%.
• For the 65 and over age band, 33% of Muslim women are in ‘bad or very bad health’, as compared with only 14% for the overall population.
• 39% of Muslim women aged 60 and over self-declare a disability that ‘limits their day-to-day activities a lot’, compared with the smaller figure for 25% for the overall population.
Observations:
• These patterns mirror similar findings in England and Wales.
• Although UK-level research suggests that Muslims and those from South Asian backgrounds experience disadvantage in accessing mental and physical health services.
• There is potential to develop appropriate initiatives to combat the impacts of loneliness on elderly Pakistani and Bangladeshi women, as a means of tackling one of the causes of ill-health in this demographic.
• Charities and civil society groups have run successful health education, awareness and accessibility campaigns on a number of issues – these can be emulated and expanded where appropriate.

SCOTTISH MUSLIMS IN NUMBERS11
Labour Market Issues:
Economic Activity/Inactivity:
• Almost 1 in 3 (31%) of the Muslim population is ‘economically active’ full-time – whether as an employee, or self-employed. For the population as a whole, the figure is 51%. It is notable that both of these percentages are higher than the corresponding figures for England and Wales which are 19.8% for Muslims and 34.9% for the overall population.
• Among those who are employed full-time, the figures for Muslims who are self-employed is notably high, at 29% compared with 12.3% for the overall population. This is most pronounced for Muslim men in full-time employment, more than 1 in 3 of whom are self-employed. For the general population, the corresponding figure is 15.7%.
Observations:
• The lower proportion of ‘economically active’ Muslims is offset by the higher proportion of Muslims who are students. While unemployment is clearly an issue among Muslims, at 2.4% higher than the national percentage, it represents a smaller discrepancy than exists in England and Wales (3.2%).
• The proportion of the ‘economically active’ Muslim population who are self-employed is significantly high: almost a third of ‘economically active’ Muslim males. This pattern suggests an ethic for entrepreneurship and economic independence, as well as demonstrating the significant economic contribution that Muslim businesspeople make to Scotland at both local and national levels. It could also be a symptom of labour market discrimination that may have been faced by Muslims, leading them to resort to self-employment.
Education and Qualifications:
• Between 2001 to 2011, the proportion of Muslims with no qualifications decreased at a faster pace than it did for the overall population of Scotland – falling from 38.5% to 21.4%
• The percentage of Muslims holding ‘Level 4 and above’ (degree level) qualifications has also markedly increased during the same period, from 22.2% to 37.5%.
• Thus, in 2011, the proportion of highly educated (Level 4 and above) Muslims in Scotland exceeds the figure for the population as a whole: 37.5% compared with 27.1%.
• There are 11,054 Muslim students aged 18 and over – approximately 1 in 7 of the total Muslim population of Scotland, and 21.3% of the population of Muslims
aged 18 and over. 62% of these are based in either Glasgow or Edinburgh – where Muslim students account for 8.2% and 4.5% (respectively) of the total student population.
• There is a significant variation in the proportion
of students within predominantly Muslim ethnic groups. 39% of Arabs aged 18 and over are students, compared with 19.3% for Bangladeshis and 14.4% for Pakistanis.
Observations:
• Muslims in Scotland are fast becoming a highly educated population – currently exceeding the total population figure for ‘degree level and above’ education by 10 percentage points.
• With 1 in 7 Scottish Muslims being students, there is a great deal of potential in seeking to harness the time and skills that they have to offer, for charitable and community-based volunteering, for example.
Employment Patterns:
Focus on Women:
• 25% of Muslim women aged 16 and over are ‘looking after home or family’, compared with 5.6% for the total population – this figure accounts for 2 in 5 Muslim women who are ‘economically inactive’.
• Muslim women are less likely to be working full-time (15.6%) than Hindu or Sikh women (33.8% and 26.1% respectively). This is likely offset by the high proportion of Muslim women looking after home or family. A notable proportion of Muslim women work part-time (15.1%), and while unemployment is slightly higher for Muslim women than for women in the general population (at 5.3% compared with 3.1%), it is similar to the corresponding levels for Hindu and Sikh women, which are 6.1% and 7.5% respectively.
Observations:
• There are many factors that explain the lower figures for ‘economic activity’ among Muslim women, not least the younger age profile of the Muslim population and the higher number of dependent children in Muslim households.
• Other important factors relate to employment barriers – whether linked to discrimination or to a lack of more flexible, non-traditional channels of employment that could aid mothers in entering or re-joining the workforce.

SCOTTISH MUSLIMS IN NUMBERS12
Socio-economic Classification:
• The socio-economic picture for Muslims is diverse and varied. Significantly, 12.4% of Muslims are classified as ‘small employers and own account workers’, supporting findings in previous sections.
• While the proportion of Muslims in ‘higher’ level occupations is close to figures for the total population, a much higher proportion of Muslims have never worked.
Observations:
• Comparisons with the Muslim population in England and Wales suggest that Muslims in Scotland are somewhat socio-economically better off.
• Viewed together with other findings in this report, the socio-economic profile of Muslims in Scotland suggests an aspirational population with a keen capacity for social mobility.
'Salaam', a mural mixing Islamic patterns with Celtic designs by artist Mohammed Ali, at Edinburgh's Annandale Street Mosque.
Children at the Michelin Junior Bike Ride in Dundee, 2012.
Procurator Fiscal at work in Livingston’s Sheriff Court.A Taste of Scottish Islam event at the City of Edinburgh Methodist Church.
‘Salaam’ mural by artist Mohammed Ali.

Glasgow Central Mosque

SCOTTISH MUSLIMS IN NUMBERS14
3.1 Population and place of birth
The 2011 Census shows that Muslims make up 1.45% of the population of Scotland. There are 2,706,066 Muslims in England and Wales, and 3,832 in Northern Ireland. The Muslim population in Scotland has increased from 42,557 in 2001 to 76,737 in 2011, representing an 80% increase over 10 years. As is the case in England and Wales, the Muslim population of Scotland is larger than the total population of other non-Christian faith groups. While Scotland remains a majority Christian country, it is only just – but this is more due to the large number of those who consider themselves to have no religion, rather than to the population sizes of other religions. The figure for this category is over 10 percentage points greater than the corresponding figure for England and Wales – over 1 in 3 people in Scotland ‘have no religion’, compared to 1 in 4 in England and Wales. Indeed, those describing themselves as having no religion outnumber the largest Christian denomination (Church of Scotland). This category, combined with the minority faiths and those who did not state their religion comes to a total of 46%.
The overwhelming majority of UK Muslims reside in England (95.5%). Scottish Muslims make up only a small proportion of the UK Muslim population, at 2.8% of the total.
44.6% of the Scottish Muslim population is UK-born (37.3% in Scotland). As for those born outside of the UK, the greatest proportion by far was born in Asia, followed in close succession by Africa and then the Middle East.
3. Demographic Detail
Religion Total Population %
Church of Scotland 1,717,871 32.44
Roman Catholic 841,053 15.88
Other Christian (including Christian related)
291,275 5.50
Muslim 76,737 1.45
Hindu 16,327 0.31
Buddhist 12,795 0.24
Sikh 9,055 0.17
Jewish 5,887 0.11
Any other religion 15,248 0.29
No religion 1,941,116 36.66
Religion not stated 368,039 6.95
All 5,295,403 100.00
All Muslims % Muslims % of Muslim Total
England 53,012,456 2,660,116 5.0 95.5
Wales 3,063,456 45,950 1.5 1.6
Scotland 5,295,403 76,737 1.5 2.8
N. Ireland 1,810,863 3,832 0.2 0.1
UK 63,182,178 2,786,898 4.4 100
Country of Birth Muslims Muslim Population Change % of overall population increase
2001 % 2011 % 2001-2011
Scotland 17,015 39.98 28,649 37.33 11,634 34
Rest of UK 4,163 9.78 5,613 7.31 1,450 4.24
Rest of Europe 1,284 3.02 3,220 4.20 1,936 5.66
Africa 2,590 6.09 7,392 9.63 4,802 14.05
Middle East 3,108 7.30 6.600 8.60 3,492 10.22
Asia 14,159 33.27 25,039 32.63 10,880 31.83
Rest of World 238 0.56 224 0.29 -9 -0.03
Total 42,557 100.00 76,737 100.00 34,185
Source: Census 2011, NRS Table KS209SCb
Source: Census 2011, Office for National Statistics Table KS209EW, NRS Table KS209Cb and Northern Ireland Statistics and Research Agency (NISRA) Table QS218NI
Source: Census 2001 NRS Table CT 0151a and Census 2011 NRS Table CT 0122c
Table 1: Religion in the 2011 Census
Table 3: Country of Birth of Muslim Population
Table 2: Scottish Muslims as a proportion of British Muslims

SCOTTISH MUSLIMS IN NUMBERS15
3.2 Ethnic Diversity
Scottish Muslims are an ethnically diverse population – and increasingly so. While a majority of Scottish Muslims are of South Asian ethnic heritage (65%), this proportion is decreasing over time and the figure for Muslims in other ethnic categories, notably, the ‘Black total’, and specifically the ‘African’ categories, is rising. It is not possible to track changes in population for some ethnic categories, such as ‘White: Polish’, and ‘Arab’ as these were only introduced in the 2011 Census, and as such, we do not have figures for 2001. Muslims make up just under 40% of the Scottish Asian population, 15% of the ‘Black’ category and over 80% of the Arab population. The total Black and Minority Ethnic (BME) population of Scotland is estimated to number around 211,000. With 70,754 Muslims falling into these ethnic categories, Muslims make up 33.5% of the BME population – just over 1 in 3. Additionally, approximately 92% of Scottish Muslims are classified as BME.
MuslimsMuslim Population
Change
Proportion of overall %
change
2001 % 2011 % 2001-2011
% change
White Total 3,401 8.0 5,983 7.80 2,582 75.92 4.15
White: Scottish 1,151 2.70 2,501 3.26 1,350 117.29 2.17
White: Other British 353 0.83 694 0.90 341 96.60 0.55
White: Irish 35 0.08 61 0.08 26 74.29 0.04
White: Gypsy/Traveller - - 25 0.03 - - -
White: Polish - - 130 0.17 - - -
Other White 1,862 4.38 2,572 3.35 710 38.13 1.14
Any Mixed Background 1,367 3.21 1,342 1.75 -25 -1.83 -0.04
Asian Total 33,626 79.01 54,870 71.50 21,244 63.18 34.17
Indian 892 2.10 1,954 2.55 1,062 119.06 1.71
Pakistani 28,353 66.62 44,858 58.46 16,505 58.21 26.55
Bangladeshi 1,669 3.92 3,053 3.98 1,384 82.92 2.23
Other South Asian 2,674 6.28 4,664 6.08 1,990 74.42 3.20
Chinese 38 0.09 341 0.44 303 797.37 0.49
Black Total 1,059 2.49 5,380 7.01 4,321 408.03 6.95
Caribbean 15 0.04 31 0.04 16 106.67 0.03
African 946 2.22 5,051 6.58 4,105 433.93 6.60
Black Scottish or Other Black 98 0.23 298 0.39 200 204.08 0.32
Other Ethnic Group Total 3,104 7.29 9,162 11.94 6,058 195.17 9.74
Arab - - 7,505 9.78 - - -
Any other ethnic group - - 1,657 2.16 - - -
All people 42,557 76,737 62,172 100.00
Source: Census 2001, NRS Table CT 0151b and Census 2011, NRS Table DC2201SC
Table 4: Ethnicity of Muslim Population
SCOTTISH MUSLIMS IN NUMBERS16
Ethnic Group All MuslimsMuslims as % of all
population in ethnic
category
Muslims as % of
overall Muslim
population
White 5,084,407 5,983 0.1 7.8
Mixed/multiple ethnic group 19,815 1,342 6.8 1.8
Asian/Asian Scottish/Asian British 140,678 54,870 39.0 71.5
Black/African/Caribbean/Black Scottish/British
36,178 5,380 14.9 7.0
Arab 9,366 7,505 80.1 9.8
Any other ethnic group 4,959 1,657 33.4 2.2
All 5,295,403 76,737 1.5 100.0
Scottish Parliamentary Region All people MuslimMuslims as % of all
population
Muslims as % of
overall Muslim
population
Glasgow 669,157 33,144 5 43.6
Lothian 729,918 14,753 2 19.0
North East Scotland 753,768 9,273 1.2 11.8
West Scotland 706,719 6,204 0.9 8.3
Central Scotland 658,769 5,951 0.9 7.8
Mid Scotland and Fife 653,539 4,244 0.6 5.1
South Scotland 678,356 1,991 0.3 2.7
Highlands and Islands 445,177 1,177 0.3 1.7
5,295,403 76,737 100
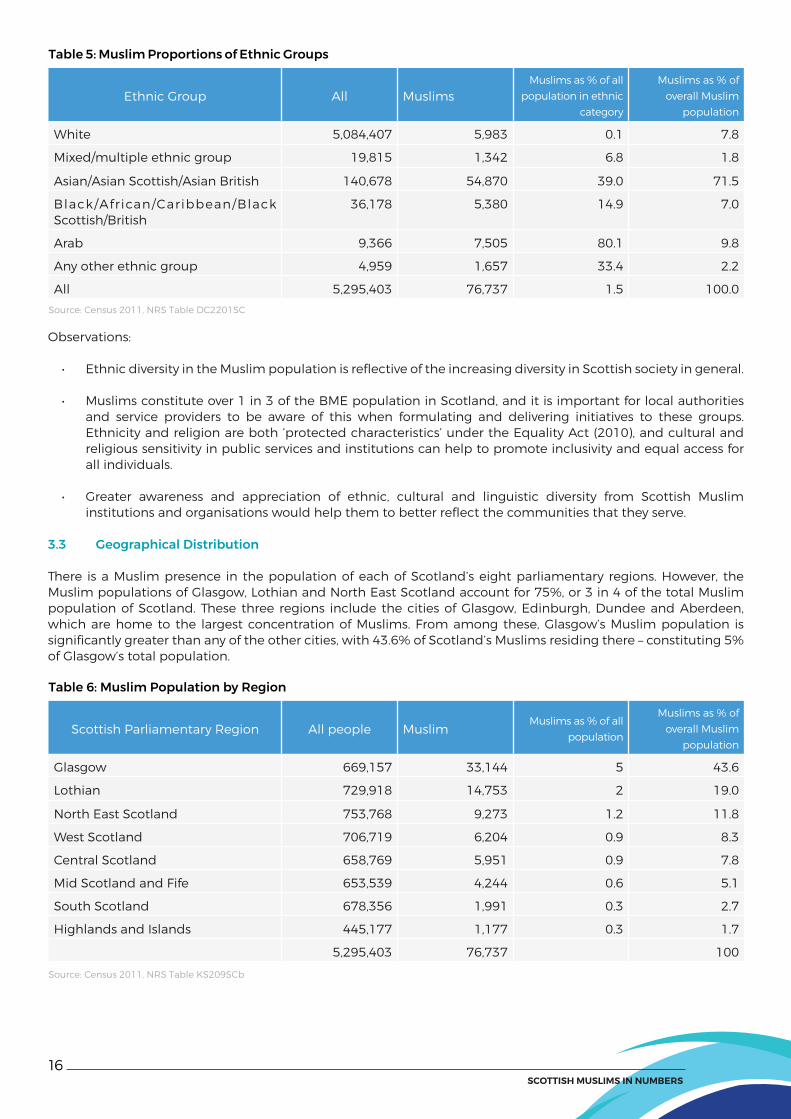
Table 5: Muslim Proportions of Ethnic Groups
Table 6: Muslim Population by Region
Source: Census 2011, NRS Table DC2201SC
Source: Census 2011, NRS Table KS209SCb
Observations:
• Ethnic diversity in the Muslim population is reflective of the increasing diversity in Scottish society in general.
• Muslims constitute over 1 in 3 of the BME population in Scotland, and it is important for local authorities and service providers to be aware of this when formulating and delivering initiatives to these groups. Ethnicity and religion are both ‘protected characteristics’ under the Equality Act (2010), and cultural and religious sensitivity in public services and institutions can help to promote inclusivity and equal access for all individuals.
• Greater awareness and appreciation of ethnic, cultural and linguistic diversity from Scottish Muslim institutions and organisations would help them to better reflect the communities that they serve.
3.3 Geographical Distribution
There is a Muslim presence in the population of each of Scotland’s eight parliamentary regions. However, the Muslim populations of Glasgow, Lothian and North East Scotland account for 75%, or 3 in 4 of the total Muslim population of Scotland. These three regions include the cities of Glasgow, Edinburgh, Dundee and Aberdeen, which are home to the largest concentration of Muslims. From among these, Glasgow’s Muslim population is significantly greater than any of the other cities, with 43.6% of Scotland’s Muslims residing there – constituting 5% of Glasgow’s total population.

SCOTTISH MUSLIMS IN NUMBERS17
4 Author interview with Sumon Hoque, Aberdeen Muslim Association, 21st April 2016.
City All PeopleOverall
Population Change
MuslimsMuslim Population
Change
2001 2011 2001-2011
% 2001 % of all population
2011 % of all population
2001-2011
%
Aberdeen 212,125 222,793 10,668 5.0 1,753 0.8 4,293 1.9 2,540 144.9
Dundee 145,663 147,268 1,605 1.1 2,879 2.0 3,875 2.6 996 34.6
EastRenfrewshire
89,311 90,574 1,263 1.4 1,918 2.1 3,002 3.3 1,084 56.5
Edinburgh 448,624 476,626 28,002 6.2 6,759 1.5 12,434 2.6 5,675 84.0
Glasgow 577,869 593,245 15,376 2.7 17,792 3.1 32,117 5.4 14,325 80.5
Table 7: Muslim Population Change in Cities with Largest Muslim Population
Source: Census 2001, NRS Table KS07 and Census 2011, NRS Table KS209Ca
There are 13 electoral wards with a Muslim population of 5% or more. 11 of these wards are in Glasgow or East Renfrewshire, and the remaining two are in the city of Dundee. The wards with the highest percentage of Muslim residents are Pollokshields (27.8%) and Southside Central (15.7%). While these figures do suggest that there are a handful of areas where the Muslim population is quite concentrated, they also question the popularised notion that British Muslims are self-segregating, by showing that there is a Muslim presence even in the most remote of Scottish regions. Moreover, even the areas with the most concentrated Muslim populations do not come close to comparing to some of the wards in the North of England, that have seen moments of racial tension in the past, such as those during the summers of 1995 and 2001.
In terms of population change, we see that there has been a steady growth of the Muslim populations in all the main cities. The two main reasons for this are natural increase (as figure 1 shows the Muslim population of Scotland has a high birth rate), and immigration. The Muslim population increase for Edinburgh and Glasgow mirrors the overall Muslim population increase for Scotland. In Dundee and East Renfrewshire, the Muslim population is steadily increasing, with the lower rate of increase perhaps explained by the lower number of immigrant families settling in these areas as compared to the two larger cities. The high figure for Aberdeen’s Muslim population increase (144.9%) is reflective of the transient nature of the population in that city. Conversations with officials at the Aberdeen Muslim Association (AMA) reveal that mosque attendance and participation in community initiatives during this period indicated an influx of new Muslim residents in the city.4 However, many of these proved to be temporary residents who were employed short-term in Aberdeen’s oil industry, or pursuing education or training in the city for a fixed period of time. The expectation is that by the 2021 Census, especially in light of the recent North Sea oil crisis and its impact on local jobs, Aberdeen’s Muslim population will have shown a decline from the figure for 2011.

SCOTTISH MUSLIMS IN NUMBERS18
3.4 Age Profile
Figure 1: Population Pyramids for Muslim Population and Overall Population
Overall Population
Muslim PopulationMale
Male Female
Female
Although, as we have just seen, the Muslim population of Scotland is a youthful one, a comparison between the data for 2001 and 2011 reveals that, on the whole it appears to be very gradually getting older. The proportion of the Muslim population in the 0-4 age bracket increased only very marginally from 10.3% to 10.8%, suggesting a relatively stable birth rate. The most significant increase in terms of absolute numbers and share of the total Muslim population is in the 25-64 age bracket. There is also a notable increase of Muslims aged 65+ (a percentage change of +110.2%), this age band now accounts for 3.3% of the total Muslim population (up from 2.8% in 2001). Meanwhile, the younger age bands of 5-14/15 year olds, and 15/16-24 year olds experienced a decrease in their percentage share of the total Muslim population of Scotland (from 21% to 17.2%, and from 18.2% to 16.9%, respectively).5
5 The 2001 Census categorised age groups as 5-15 and 16-24, whereas the 2011 Census used the categories 5-14 and 15-24. The comparison I make between the two sets of results is therefore not precise, and only made in order to illustrate general patterns in population change over time.

SCOTTISH MUSLIMS IN NUMBERS19
Muslims Muslim Population Change
Age group 2001 % Age group 2011 % Age group 2001-2011 change %
0 to 4 4,389 10.3 0 to 4 8,283 10.8 0 to 4 3,894 88.7
5 to 15 8,930 21.0 5 to 14 13,191 17.2 5 to 14/15 4,261 47.7
16 to 24 7,733 18.2 15 to 24 13,003 16.9 15/16 to 24 5,270 68.1
25 to 64 20,303 47.7 25 to 64 39,733 51.8 25 to 64 19,430 95.7
65 + 1,202 2.8 65 + 2,527 3.3 65 + 1,325 110.2
Total 42,557 Total 76,737 Total 34,180
Table 8: Change in Muslim Population Age Profile 2001-2011
Source: Census 2001, NRS Table T26 Census 2011, NRS Table CT0041a
6 Shelina Janmohamed, Generation M: Young Muslims Changing the World (London: IB Tauris, 2016).7 Alistair Hunter, ‘Grave Concerns about Reuse’, (16th September 2016), Burying our Differences: negotiating faith and space in contexts of death and diversity, The University of Edinburgh: http://www.bod-project.llc.ed.ac.uk/2016/09/16/grave-concerns-about-reuse/ (accessed on 4th October 2016).
Age Group Muslims Muslims as % of overall population
55 to 59 2,130 2.8
60 to 64 1,229 1.6
65 to 69 831 1.1
70 to 74 886 1.2
Total 5,076 6.6
Table 9: Muslims in 55 to 74 year Old Age Band, 2011
Observations: • The younger age profile of the Muslim population carries increasing cultural and economic significance,
a feature that resonates beyond Scotland, across the UK and internationally. Muslim millennials, dubbed 'Generation M', have been found to enjoy a growing amount of commercial and cultural influence, not least for their role in the growth of the 'Muslim pound'.6
• The gradual growth of the older age-band within the Muslim population should alert us to the need to develop culturally sensitive elderly care services.
• Facilities and provisions for burial are another area of inevitably increasing importance for the Muslim population, in view of the notable growth of the 65+ age band. A recent overhaul of Scotland’s archaic burial laws which for the first time allows the re-use of graves, was preceded by a public consultation which made specific assurances that religious communities would be consulted, and given the right to object, in cases where it is proposed to reuse graves in cemeteries or sections of cemeteries used by them. As others have noted, such specific assurances seem to have been dropped by the final text of the Burial and Cremation Act (Scotland).7 It is hoped that they will be included as requirements in the forthcoming guidance to be issued to local Burial Authorities, as grave re-use is widely considered by Muslims (as with many Jews) to be forbidden.
Taking a closer look at the older age categories, we can see that by the 2021 census, there will be approximately 5,000 Muslims in the 65-84 age band. This estimate is based on a simple extrapolation of the 55-74 year old population, and does not take into account mortality or emigration.

SCOTTISH MUSLIMS IN NUMBERS20
3.5 Parliamentary constituency population
None of the Westminster parliamentary constituencies in Scotland have a Muslim population that can be considered to be significant enough to decide an election result on its own. Table 10 shows that Glasgow Central and Glasgow South have the highest Muslim populations, at 12.9% and 7.3% respectively. They are both areas where Muslim communities have been actively courted by politicians during election campaigns. The Scottish parliamentary constituency with by far the largest Muslim population is Glasgow Southside, where Nicola Sturgeon is the sitting MSP, with almost 20% of its population identifying as Muslim. The proportion of Muslims in this constituency is almost three times as much as the proportion of Muslims in Glasgow Kelvin, the next constituency in Table 11.
Muslims in Scotland have a long tradition of political activism and engagement, both through standing for elected office, and participating in political parties and civil society campaigns. However, according to analysis conducted by the Electoral Commission, voter registration among Muslims in Scotland is lower than it is for the populations of any other religion.8 There is scope for Muslim civil society groups to campaign more strongly in favour of voter registration. A social media initiative by the Amina Muslim Women’s Resource Centre, encouraging Muslim women to vote during the 2015 General Election and the EU referendum earlier this year can be highlighted as an example of good practice in this regard.9
For many Scottish Muslims the Labour Party was historically considered to be the ‘political home’. However, in the wake of 9/11 and in particular after the start of the Iraq War in 2003, the SNP, with its anti-war and consciously inclusive rhetoric calling for ‘civic nationalism’, became an increasingly attractive option for many Pakistani Muslims.10
Observations:
• The lower voter registration figure among Scottish Muslims is a feature that is shared with the Muslim population in England and Wales. It is also a notable feature among BME communities in general.
• Public awareness campaigns on the importance of voter registration, perhaps by the Electoral Commission in cooperation with grassroots community bodies might go some way to encouraging a higher voter registration and turnout rate among Muslims and other minority populations.
UK Parliamentary Constituency 2005
All people MuslimMuslims as % of all
population
Glasgow Central 91,257 11,773 12.9
Glasgow South 87,852 6,424 7.3
Glasgow North 71,636 3,423 4.8
Glasgow South West 83,979 3,913 4.7
Glasgow North East 85,854 2,960 3.4
East Renfrewshire 90,574 3,002 3.3
Edinburgh East 95,314 3,081 3.2
Glasgow North West 85,882 2,688 3.1
Edinburgh South West 99,236 2,819 2.8
Dundee West 89,226 2,522 2.8
Edinburgh South 86,184 2,391 2.8
Edinburgh North and Leith 106,183 2,654 2.5
Aberdeen North 99,654 2,305 2.3
Aberdeen South 93,197 1,616 1.7
Dundee East 88,016 1,510 1.7
Edinburgh West 89,709 1,489 1.7
Glasgow East 87,402 974 1.1
Table 10: UK constituencies with over 1% Muslim population
Source: Census 2011, NRS Table KS209SCb

SCOTTISH MUSLIMS IN NUMBERS21
8 The Electoral Commission, ‘Electoral registration in 2011’ (Electoral Commission, Office for National Statistics and National Records of Scotland, July 2014). According to this analysis, Christians in Scotland are most likely (90.1%) to be on the electoral register, and Muslims are the least likely (74.5%).9 More information on this initiative can be viewed on the Amina MWRC Facebook page: www.facebook.com/amina.mwrc.1 (accessed on 30th August 2016).10Asifa Hussain and William Miller, Multicultural Nationalism: Islamophobia, Anglophobia and Devolution (Oxford: OUP, 2006).
Scottish Parliamentary Constituency 2011 All people Muslim Muslims as % of all population
Glasgow Southside 66,005 12,456 18.9
Glasgow Kelvin 79,334 4,673 5.9
Glasgow Cathcart 74,883 3,881 5.2
Glasgow Pollok 78,356 3,493 4.5
Glasgow Maryhill and Springburn 74,753 2,927 3.9
Edinburgh Eastern 79,883 2,798 3.5
Glasgow Anniesland 74,628 2,347 3.1
Aberdeen Central 83,557 2,508 3.0
Edinburgh Northern and Leith 86,344 2,433 2.8
Dundee City West 75,267 1,990 2.6
Dundee City East 72,001 1,885 2.6
Edinburgh Southern 77,561 2,018 2.6
Edinburgh Pentlands 73,177 1,889 2.6
Edinburgh Central 83,867 2,038 2.4
Edinburgh Western 75,794 1,258 1.7
Glasgow Provan 72,896 1,177 1.6
Glasgow Shettleston 72,390 1,163 1.6
Aberdeen Donside 78,497 1,002 1.3
Aberdeen South and North Kincardine 74,663 822 1.1
Table 11: Scottish Constituencies with over 1% Muslim population
Source: Census 2011, NRS Table KS209SCb

SCOTTISH MUSLIMS IN NUMBERS22
Scottish Council Area 2011 All people Muslim Muslims as % of all population
Glasgow City 593,245 32,117 5.4
East Renfrewshire 90,574 3,002 3.3
Edinburgh, City of 476,626 12,434 2.6
Dundee City 147,268 3,875 2.6
Aberdeen City 222,793 4,293 1.9
North Lanarkshire 337,727 3,315 1.0
West Lothian 175,118 1,746 1.0
East Dunbartonshire 105,026 1,044 1.0
Falkirk 155,990 1,415 0.9
South Lanarkshire 313,830 2,514 0.8
Renfrewshire 174,908 1,313 0.8
Fife 365,198 2,591 0.7
Stirling 90,247 578 0.6
Midlothian 83,187 508 0.6
Clackmannanshire 51,442 334 0.6
Perth & Kinross 146,652 741 0.5
East Lothian 99,717 508 0.5
West Dunbartonshire 90,720 344 0.4
Shetland Islands 23,167 96 0.4
Aberdeenshire 252,973 691 0.3
Highland 232,132 691 0.3
Dumfries & Galloway 151,324 406 0.3
Angus 115,978 395 0.3
East Ayrshire 122,767 374 0.3
Moray 93,295 236 0.3
Scottish Borders 113,870 256 0.2
South Ayrshire 112,799 246 0.2
North Ayrshire 138,146 210 0.2
Inverclyde 81,485 197 0.2
Argyll & Bute 88,166 186 0.2
Eilean Siar 27,684 61 0.2
Orkney Islands 21,349 20 0.1
Table 12: Muslim population in all Scottish Council Areas
Source: Census 2011, NRS Table KS209SCb

SCOTTISH MUSLIMS IN NUMBERS23
SCOTTISH MUSLIMS IN NUMBERS24
4. Issues relating to Civic Life
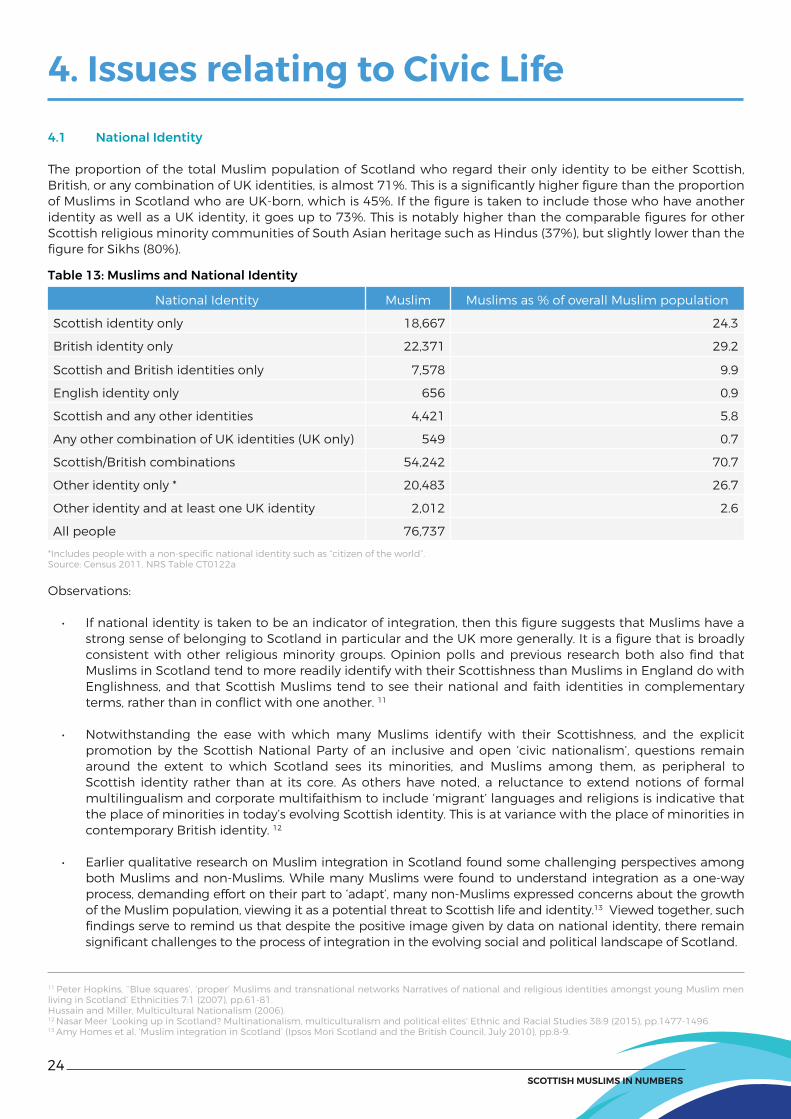
4.1 National Identity
The proportion of the total Muslim population of Scotland who regard their only identity to be either Scottish, British, or any combination of UK identities, is almost 71%. This is a significantly higher figure than the proportion of Muslims in Scotland who are UK-born, which is 45%. If the figure is taken to include those who have another identity as well as a UK identity, it goes up to 73%. This is notably higher than the comparable figures for other Scottish religious minority communities of South Asian heritage such as Hindus (37%), but slightly lower than the figure for Sikhs (80%).
Observations:
• If national identity is taken to be an indicator of integration, then this figure suggests that Muslims have a strong sense of belonging to Scotland in particular and the UK more generally. It is a figure that is broadly consistent with other religious minority groups. Opinion polls and previous research both also find that Muslims in Scotland tend to more readily identify with their Scottishness than Muslims in England do with Englishness, and that Scottish Muslims tend to see their national and faith identities in complementary terms, rather than in conflict with one another. 11
• Notwithstanding the ease with which many Muslims identify with their Scottishness, and the explicit promotion by the Scottish National Party of an inclusive and open ‘civic nationalism’, questions remain around the extent to which Scotland sees its minorities, and Muslims among them, as peripheral to Scottish identity rather than at its core. As others have noted, a reluctance to extend notions of formal multilingualism and corporate multifaithism to include ‘migrant’ languages and religions is indicative that the place of minorities in today’s evolving Scottish identity. This is at variance with the place of minorities in contemporary British identity. 12
• Earlier qualitative research on Muslim integration in Scotland found some challenging perspectives among both Muslims and non-Muslims. While many Muslims were found to understand integration as a one-way process, demanding effort on their part to ‘adapt’, many non-Muslims expressed concerns about the growth of the Muslim population, viewing it as a potential threat to Scottish life and identity.13 Viewed together, such findings serve to remind us that despite the positive image given by data on national identity, there remain significant challenges to the process of integration in the evolving social and political landscape of Scotland.
National Identity Muslim Muslims as % of overall Muslim population
Scottish identity only 18,667 24.3
British identity only 22,371 29.2
Scottish and British identities only 7,578 9.9
English identity only 656 0.9
Scottish and any other identities 4,421 5.8
Any other combination of UK identities (UK only) 549 0.7
Scottish/British combinations 54,242 70.7
Other identity only * 20,483 26.7
Other identity and at least one UK identity 2,012 2.6
All people 76,737
Table 13: Muslims and National Identity
*Includes people with a non-specific national identity such as “citizen of the world”.Source: Census 2011, NRS Table CT0122a
11 Peter Hopkins, ‘‘Blue squares’, ‘proper’ Muslims and transnational networks Narratives of national and religious identities amongst young Muslim men living in Scotland’ Ethnicities 7:1 (2007), pp.61-81.Hussain and Miller, Multicultural Nationalism (2006).12 Nasar Meer ‘Looking up in Scotland? Multinationalism, multiculturalism and political elites’ Ethnic and Racial Studies 38:9 (2015), pp.1477-1496.13 Amy Homes et al, ‘Muslim integration in Scotland’ (Ipsos Mori Scotland and the British Council, July 2010), pp.8-9.

SCOTTISH MUSLIMS IN NUMBERS25
All people
aged 3 and over
Understands spoken
English only
Speaks, reads and
writes English
Speaks but
does not read or write
English
Speaks and reads but does not write English
Reads but does not speak or write English
Other combination
of skills in English
No skills in English
Muslim 71,715 1,209 62,032 4,924 1,581 117 523 1,329
% 1.7 86.5 6.9 2.2 0.2 0.7 1.9
All people aged 3 and over Muslim %
Top three categories of English skills 68,537 95.6
Bottom three categories of English skills 1,849 2.6
No skills in English 1,329 1.9
All people aged 3 and over 71,715 100.0
Tables 14 and 15: Muslims and English Language Skills
Source: Census 2011, NRS Table AT058
Source: Census 2011, NRS Table AT058
4.2 English Language Skills
The subject of English language proficiency is one which has received a great deal of recent attention, largely because of comments made by the former Prime Minister, David Cameron in January 2016. His claim that up to 22% of Muslim women in England struggled with speaking English was disputed strongly, not least by the Muslim Council of Britain, who’s ‘British Muslims in Numbers’ report estimated that this figure was closer to 6%.14 In Scotland, the census focused on ‘English language skills’, rather than proficiency, and as such, the categories in this section differ slightly from those used in the corresponding section on proficiency in the England and Wales census. The following three tables show the data on English language skills for Muslims in various formats.
Tables 14 and 15 below suggest that the figure for Scottish Muslims who have no English skills, or have difficulty with English, is 4.5%. Table 16 gives us an overview of English language skills among the population of minority religions for whom a significant proportion will be first generation immigrants. This is useful as it shows that for Buddhists, Hindus, Muslims and Sikhs, figures for women in the top categories of English skills lag behind those for men by a few percentage points, across the board. For the population as a whole – there is no significant discrepancy between the figures for men and women.
14 The large discrepancy between these two figures is due to the fact that they were measuring different variables. The MCB estimate was extrapolated from the figures for those in the population aged 3 and over, who had been born in Pakistan or Bangladesh. This was because the figures for English language proficiency for Muslims (or indeed for Muslim women) had not, at the time of the report’s publication, yet been made available. Notwithstanding this, as Nafeez M Ahmed points out, questions can also be raised about the government’s estimate, which relied on a base population of Muslim women aged 17 and over. If the 16 and under age band was excluded as irrelevant (assumed to be in education rather than in or seeking employment), then why was the 65+ age band retained? See N M Ahmed, ‘David Cameron’s illiterate proposal to counter-radicalisation by targeting Muslim women’ (18th January 2016) available at: https://medium.com/insurge-intelligence/david-cameron-s-illiterate-proposal-to-counter-radicalisation-by-targeting-muslim-women-f6069bfee942#.xxsxte2lw (accessed 17th August 2016). In short, both figures have their flaws, and a comparison between the two is not useful.

SCOTTISH MUSLIMS IN NUMBERS26
English Language SkillsTotal
PopulationReligion
All % Buddhist % Hindu % Muslim % Sikh %
Speaks, reads and writes English
4,799,106 93.8 11,283 89.6 14,704 94.6 62,032 86.5 7,564 87.7
Male 2,317,843 93.6 5,364 90.4 8,809 95.6 34,359 88.8 4,114 90.2
Female 2,481,263 94.0 5,919 88.9 5,895 93.1 27,673 83.8 3,450 84.8
Speaks but does not read or write English
154,559 3.0 548 4.4 463 3.0 4,924 6.9 531 6.2
Male 79,942 3.2 212 3.6 226 2.5 2,318 6.0 215 4.7
Female 74,617 2.8 336 5.2 237 3.7 2,606 7.9 316 7.8
Other combination of skills in English
155,943 3.1 467 3.7 294 1.9
3,430 4.8
389
4.5
Male 75,518 3.1 236 4.0 150 1.6 1,604 4.2 196 4.3
Female 80,425 3.1 231 3.5 144 2.3 1,826 5.5 193 4.7
No skills in English 8,615 0.2 295 2.3 87 0.6 1,329 1.9 145 1.7
Male 3,908 0.2 123 2.2 29 0.3 409 1.1 35 0.8
Female 4,707 0.2 172 2.6 58 0.9 920 2.8 110 2.7
All people aged 3 and over: total 5,118,223 12,593 15,548 71,715 8,629
Male 2,477,211 5,935 9,214 38,690 4,560
Female 2,641,012 6,658 6,334 33,025 4,069
Source: Census 2011, NRS Table CT0152d
Table 16: English Language Skills by Religion by Sex
Observations:
• There is a small but significant percentage of the Scottish Muslim population for whom English language skills are weak or absent. However this is a pattern that is also found among other religious minority groups, for whom a large number of the population are first generation immigrants. It is more attributable to this factor, rather than to a propensity towards self-segregation, as has been suggested by some politicians and commentators. 15
• It is encouraging that the Scottish Government’s recent ‘refresh’ of its English for Speakers of Other Languages (ESOL) strategy maintains that English language courses will usually be free for learners, and that where they are charged for, funding or financial help will usually be available for those who require it. Furthermore, it is also positive to see that English as an Additional Language (EAL) provision in schools will be increased. 16
4.3 Household Type
The NRS provides figures for household type using the Household Reference Person (HRP) variable, rather than by household – therefore any comparisons with the data for England and Wales that is used in Sundas Ali’s ‘British Muslims in Numbers’ (2015), which is based on the ‘household’ variable, will not be exact. However we see similar patterns to those in England and Wales reflecting a younger age profile, and younger families. So the percentage of Muslim HRPs under the age of 35 is almost double the percentage for the total population. This trend reverses for HRPs between 55 and 64 years of age, and for HRPs over the age of 65, the figure is 25.6% for the total population, almost five times the 5.3% for Muslims.
We also see that over half of Muslim households in Scotland are composed of two or more people, with dependent children – double the corresponding percentage for the total population. Single person households account for a quarter of those households with a Muslim HRP, as compared with 35% for the total population.
15 David Barrett ‘British Muslims are becoming a ‘nation within a nation’, Trevor Philips warns’ The Telegraph 11th April 2016.David Cameron ‘We won’t let women be second-class citizens’ The Times 18th January 2016.16 Education Scotland, ‘Welcoming our Learners: Scotland’s ESOL strategy 2015-2020’ (Scottish Government, 2015).Scottish Government, ‘New Scots: Integrating Refugees in Scotland’s Communities’ (Scottish Government, 2013).
SCOTTISH MUSLIMS IN NUMBERS27
Tables 17 and 18: Muslims and Household Composition
Table 19: Muslims (individual) and Household Composition
Source: Census 2011, NRS Table AT052
Source: Census 2011, NRS Table AT052
Source: Census 2011, NRS Table AT051
Note – the figure for ‘two or more person households with dependent children’ is inclusive of lone parent households with children.
All HRPs % Muslim %
All HRPs 2,372,777 23,945
HRP Aged under 35 432,397 18.2 9,218 38.5
One person household 132,748 5.6 3,273 13.7
Two or more person household: No dependent children 135,344 5.7 2,330 9.7
Two or more person household: With dependent children 164,305 6.9 3,615 15.1
HRP aged 35 to 54 918,141 38.7 11,487 48.0
One person household 241,528 10.2 2,058 8.6
Two or more person household: No dependent children 255,884 27.9 1,696 14.8
Two or more person household: With dependent children 420,729 45.8 7,733 67.3
HRP aged 55 to 64 414,501 17.5 1,973 8.2
One person household 137,171 33.1 385 19.5
Two or more person household: No dependent children 250,244 60.4 979 49.6
Two or more person household: With dependent children 27,086 6.5 609 30.9
HRP aged 65 or over 607,738 25.6 1,267 5.3
One person household 311,867 51.3 379 29.9
Two or more person household: No dependent children 291,502 48.0 720 56.8
Two or more person household: With dependent children 4,369 0.7 168 13.3
All HRPs % Muslim %
All HRPs 2,372,777 23,945
One person household 823,314 34.7 6,095 25.5
Two or more person household: No dependent children 932,974 39.3 5,725 23.9
Two or more person household: With dependent children 616,489 26.0 12,125 50.6
Muslim % All %
All people in households Total 75,145 5,196,386
No dependent children in household 22,284 29.7 2,988,790 57.5
Dependent children in household 52,861 70.3 2,207,596 42.5
Living in a couple household Total 56,656 75.4 3,473,491 66.8
No dependent children in household 10,956 14.6 1,771,223 34.1
Dependent children in household 45,700 60.8 1,702,268 32.8
Not living in a couple household Total 18,489 24.6 1,722,895 33.2
No dependent children in household 11,328 15.1 1,217,567 23.4
Dependent children in household 7,161 9.5 505,328 9.7
SCOTTISH MUSLIMS IN NUMBERS28
SCOTTISH
MUSLIMSIN NUMBERS
Understanding Scotland's Muslim population through the 2011 Census
Muslims make up 1.45% of the population of Scotland. 37.3% are born inScotland.
That’s a total of 76,737 people.
Women: 35,496 Men: 41,241
POPULATION
EDUCATION
QUALIFICATIONS
AT WORK HOUSING
HEALTH
School age: 2.5% of school age children Scotland-wide are Muslim
Increasingly highly educated
71% say their only national identity is Scottish and/or British
30% are aged 15 and under
3% are aged 65+
NATIONAL IDENTITY AGE PROFILE
South Asian: 65%
Arab: 9.8%
Other Ethnic: 2.2% Black: 7%
Mixed Background: 1.7%
White: 7.8%
ETHNIC DIVERSITY
ENGLISH LANGUAGE
PRISON
in full time employment (compared to 51% in overall population)
are self-employed, of those in full time employment (compared to 12% in overall population)
of Muslim women age 16 and over 'looking after home or family'(compared to 6% in overall population)
Muslim women aged 16 and over in employment (compared to 51% in overall population)
4% have ‘bad or very bad health’(6% in overall population)
27% for those aged 65+ (14% in overall population)
19% are students, compared
to 6% in overall population
52% are owner occupiers
18% are in social housing
28% are in privately rented accommodation
1.8% of prison population is MuslimThis is roughly proportionate to the population of Muslims in Scotland.
Only 4.5% have weak or no English language skills
Housing Tenure
Households
26% Muslim households are one person households
24% are two or more persons, with no dependent children
51% are two or more persons, with dependent children
10% of Muslims in Scotland live in ‘single parent’ households
Other Asian: 6.5%
Scotland’s Muslims make
up 2.8% of all Muslims in the UK. 44.6% are born in the UK.
Muslims have a geographic presence across all of Scotland's eight regions,
but are concentrated in Glasgow.
43.6% Glasgow
19% Lothian
11.8% North East Scotland
Glasgow10%
Edinburgh5%
Dundee4%
Aberdeen3.5%East
Renfrewshire
5.5%
For areas with largest Muslim populations the figure is:
No Qualifications
38.5% 21.4%2001 2011
Educated to Degree Level
22.2% 37.5%2001 2011
31%29%25%31%
SCOTTISH MUSLIMS IN NUMBERS29
SCOTTISH
MUSLIMSIN NUMBERS
Understanding Scotland's Muslim population through the 2011 Census
Muslims make up 1.45% of the population of Scotland. 37.3% are born inScotland.
That’s a total of 76,737 people.
Women: 35,496 Men: 41,241
POPULATION
EDUCATION
QUALIFICATIONS
AT WORK HOUSING
HEALTH
School age: 2.5% of school age children Scotland-wide are Muslim
Increasingly highly educated
71% say their only national identity is Scottish and/or British
30% are aged 15 and under
3% are aged 65+
NATIONAL IDENTITY AGE PROFILE
South Asian: 65%
Arab: 9.8%
Other Ethnic: 2.2% Black: 7%
Mixed Background: 1.7%
White: 7.8%
ETHNIC DIVERSITY
ENGLISH LANGUAGE
PRISON
in full time employment (compared to 51% in overall population)
are self-employed, of those in full time employment (compared to 12% in overall population)
of Muslim women age 16 and over 'looking after home or family'(compared to 6% in overall population)
Muslim women aged 16 and over in employment (compared to 51% in overall population)
4% have ‘bad or very bad health’(6% in overall population)
27% for those aged 65+ (14% in overall population)
19% are students, compared
to 6% in overall population
52% are owner occupiers
18% are in social housing
28% are in privately rented accommodation
1.8% of prison population is MuslimThis is roughly proportionate to the population of Muslims in Scotland.
Only 4.5% have weak or no English language skills
Housing Tenure
Households
26% Muslim households are one person households
24% are two or more persons, with no dependent children
51% are two or more persons, with dependent children
10% of Muslims in Scotland live in ‘single parent’ households
Other Asian: 6.5%
Scotland’s Muslims make
up 2.8% of all Muslims in the UK. 44.6% are born in the UK.
Muslims have a geographic presence across all of Scotland's eight regions,
but are concentrated in Glasgow.
43.6% Glasgow
19% Lothian
11.8% North East Scotland
Glasgow10%
Edinburgh5%
Dundee4%
Aberdeen3.5%East
Renfrewshire
5.5%
For areas with largest Muslim populations the figure is:
No Qualifications
38.5% 21.4%2001 2011
Educated to Degree Level
22.2% 37.5%2001 2011
31%29%25%31%

SCOTTISH MUSLIMS IN NUMBERS30
There are over 12,000 Muslim households with dependent children, making up over 50% of the total Scottish Muslim households. The corresponding figure for the overall population is 26%. The younger age profile within the Muslim population is particularly pronounced when we observe that 39% of Muslim households have a household reference person (HRP) under the age of 35, as compared with the corresponding figure of 18% for the total Scottish population. At the other end of the age spectrum, only 5% of Muslim HRPs are over the age of 65, whereas the figure for the total population is 26%.
Well over two thirds of Muslim households include dependent children, compared with 43% for the total population. For both population groups, the majority of these households with dependent children are ‘couple households’ – 77% for the overall population and 87% for the Muslim population.
Observations:
• The high proportion of Muslim households with young children can be linked to the large proportion of women ‘looking after home and family’. For these households, areas of specific policy interest include government support for affordable and quality childcare, in addition to facilities and opportunities for young people. Assisting families with children can go hand in hand with initiatives providing support and options for women to offer their skills to society through employment, training or volunteering. These could be areas of potential fruitful partnership between local councils and civil society organisations and networks.
• The figure for single parent households with dependent children stands at close to 10% for Muslim HRPs, a significant but similar figure to the total population (unlike in England and Wales, where it is higher for Muslims). More needs to be understood about the causes for this figure, and appropriate support offered by mosques, imams and other bodies.
4.4 Focus on Youth
While Muslims form 1.45% of the total Scottish population, the proportion of school-age children (aged 5-14) who are Muslim is notably higher, at 2.4%. The number of Muslim teenagers in 2021 (those currently in the 5-9 age band) is projected to be 9.4% of the overall Muslim population. For some areas of Glasgow and Dundee, wards with the most concentrated Muslim populations (constituting over 5% of the total), the percentage of Muslims among children of school age is very high. For instance, in the Pollokshields ward, where Muslims make up 28% of the overall population, the proportion of 5-15 year olds who are Muslim is 48%.
Table 20: Age Profile of Muslim Population
Table 21: Muslims in 0 to 4 and 5 to 9 year Old Age Bands, 2011
Age group All MuslimsMuslims as % of all population in
age groupMuslims as % of overall Muslim
population
0 to 4 292,821 8,283 2.8% 10.8
5 to 14 561,232 13,191 2.4% 17.2
15 to 24 694,766 13,003 1.9% 16.9
25 to 64 2,856,250 39,733 1.4% 51.8
65 + 890,334 2,527 0.3% 3.3
Total 5,295,403 76,737 1.4% 100
Age All people MuslimMuslims as % of overall Muslim
Population
Total 5,295,403 76,737
0 to 4 292,821 8,283 10.8
5 to 9 269,617 7,249 9.4
Source: Census 2011, NRS Table CT0041a
Source: Census 2011, NRS Table CT0041a

SCOTTISH MUSLIMS IN NUMBERS31
Table 22: Young Muslim Population in Glasgow, Dundee and East Renfrewshire, wards with >5% Muslim population
All Ages Age 0-4 Age 5-15
Electoral Ward % Muslims All Muslims % Muslims All Muslims % Muslims
Pollokshields 27.8 1,459 662 45.4 2,539 1,208 47.6
Southside Central 15.7 1,777 559 31.5 2,925 914 31.2
Newlands/Auldburn 8.9 1,343 215 16 2,723 422 15.5
Hillhead 8 963 188 19.5 1,552 388 25.0
Springburn 7.6 1,628 223 13.7 2,728 370 13.6
Govan 7.1 1,520 220 14.5 2,721 363 13.3
Greater Pollock 6.7 2,178 250 11.5 4,755 501 10.5
Giffnock and Thornliebank 6.5 712 53 7.4 1,848 191 10.3
Anderston/City 6.2 787 184 23.4 989 226 22.9
Maryfield 5.5 674 97 14.4 1,224 121 9.9
Langside 5.3 1,141 126 11 1,767 236 13.4
Neilston, Uplawmoor and Newton Mearns North
5.3 1,109 85 7.7 2,824 251 8.9
West End 5 676 97 14.3 1,292 147 11.4
Source: Census 2011, NRS Table DC2017SC

SCOTTISH MUSLIMS IN NUMBERS32
Observations:
• The high proportion of Muslims in the younger age brackets in particular wards has implications on a number of areas, and it is important for Scotland’s public services and institutions to seek to be more accessible, inclusive and reflective of young Scottish Muslims, in amongst the nation’s other minorities. There are many ways in which ‘aspirational pluralism’17 can be effected thorough policy: considering that Urdu is the 4th most widely spoken language in the home (see Census 2011 NRS Table AT002), the Scottish Government’s 1+2 language learning initiative for schools should include Urdu more explicitly – especially, but not exclusively – in areas with high concentrations of Pakistani populations such as Glasgow and Dundee. Additionally, support should be given to those schools and families where pupils wish to take a certificate in Urdu. The Scottish Government already aspires to offer ‘the opportunity to reflect on the development of Scotland as a diverse, complex, multicultural and multilingual nation’, adding that ‘We, as a nation, should celebrate this diversity and the diverse languages in our midst.’18
• At the moment, there is no state-funded Muslim school in Scotland, although there is a strong tradition of state funding for Roman Catholic schools, as well as three state-funded Episcopalian schools and one state-funded Jewish school. The evidence in this report suggests that, in view of the significant proportion of Muslims among school-aged children in some wards within Glasgow and Dundee, there is an opportunity for the Scottish Government to demonstrate its commitment to parity by taking steps towards funding a Muslim school.19 While there may be opposition from some quarters to the potential expansion of the faith school sector, in the context of real anxieties around sectarianism for example,20 such a step would signal a solid intention to deliver equity in parental choice. If such a school were open to children from all backgrounds, it would serve as an acknowledgment of Scotland’s multi-faith and multicultural landscape, and could represent an opportunity for successful community engagement with the education system, as well as for inter-faith integration, interaction and learning.
• Research among young people in Scotland has shown how they experience racism and Islamophobia in different ways, and that this also varies according to context, place and a range of triggers.21 Importantly, primary and lower secondary schools have been found to be places where racist comments occurred, and though confident in their own resilience, some young people also expressed a ‘perception that institutional racism penetrated a range of organisations’.22 Public education initiatives can help to promote improved religious literacy and understanding, which in turn, would address problems stemming from homogenisation and misrecognition.23 Greater openness from public institutions towards positively fostering a multi-faith and multi-ethnic national identity, and making tangible impacts in this direction24 can also go some way towards allaying these concerns and cultivating a greater sense of belonging for young people.
• Young Muslims will be progressing into the workforce, where many continue to face double penalties (ethnic and religious). For many, particularly women , there is often a triple penalty, relating to sex discrimination.25
Effectively addressing barriers and inequalities will be vital in areas such as tackling discrimination in the education sector and workplace, widening access to employment opportunities, and, particularly for women, facilitating support to work including, but not limited to, appropriate and flexible childcare. Local and national government agencies would benefit from working with community-based initiatives to further understand these issues and deliver solutions.
17 Meer ‘Looking up in Scotland?’ (2015).18 Scottish Government Languages Working Group, ‘Language Learning in Scotland: a 1+2 Approach’ (Scottish Government, 2012).19 Former First Minister, Alex Salmond, expressed his support in 2008 for a Muslim state school, subject to approval of an application to Glasgow City Council.20 Meer ‘Looking up in Scotland?’ (2015)21 Peter Hopkins et al, ‘Faith, Ethnicity, Place: Young people’s everyday geopolitics in Scotland’ (AHRC, 2015), pp.32-41.22 Ibid, p.3523Ibid. pp.38-48.24 Carol Young, ‘Race Equality in Scotland’s public sector: five missing links?’ in Nasar Meer (ed.) Scotland and Race Equality: directions in policy and identity (Runnymede Trust, 2016), pp.19-22.25 House of Commons Women and Equalities Committee (HCWEC), ‘Employment Opportunities for Muslims in the UK’ (House of Commons, August 2016). Specifically on Scottish ethnic minorities’ experiences and perceptions of discrimination, see Nasar Meer, ‘Self-Reported Discrimination in Scotland’ in Meer (ed.) Scotland and Race Equality (2016), pp.11-15.

SCOTTISH MUSLIMS IN NUMBERS33

SCOTTISH MUSLIMS IN NUMBERS34
It has not been possible to obtain figures for the Muslim prison population by ethnic group due to the NRS judging this information to be potentially disclosive of personal information – it is therefore very difficult to obtain an accurate impression of the ethnic make-up of the Muslim population in Scottish prisons.
The Muslim population in Scotland’s prisons is roughly proportionate to the percentage of Muslims in the overall population. This is in significant contrast to the figures for England and Wales, where the Muslim prison population is disproportionately large, at approximately 13%. This can perhaps be explained to some extent by some of the other features of Scotland’s Muslim population that are discussed in this report – an increasingly highly educated population, high student numbers, lower unemployment figures than those for England and Wales, and a more independent employment profile.
4.5 Prison and other institutionalised populations:
Table 23: Muslims and Communal Establishments
All % of total population Muslim % of Muslim population
All people in communal establishments 99,017 1.9 1,592 2.1
Medical and care establishments 42,079 0.8 81 0.1
Educational establishments 37,670 0.7 1,269 1.7
Defence establishments 2,613 0.0 6 0.0
Prison service establishments 5,908 0.1 109 0.1
Hotels and holiday accommodation 6,144 0.1 52 0.1
Other establishments* 4,603 0.1 75 0.1*Includes people enumerated as sleeping rough on census night (a total of 98 in Scotland).Source: Census 2011, NRS Table AT060
Table 24: Prison Population by Religion
ReligionPrison service
establishments populationReligion Population as %
of all Prison Population% of religion population in
prison
Church of Scotland 1,393 23.6 0.08
Roman Catholic 1,327 22.5 0.16
Other Christian 177 3.0 0.06
Buddhist 33 0.6 0.26
Hindu 7 0.1 0.04
Jewish 9 0.2 0.15
Muslim 109 1.8 0.14
Sikh 5 0.1 0.06
Other religion 33 0.6 0.22
No religion 2,358 39.9 0.12
Religion not stated 457 7.7 0.12
All 5,908 0.11
Source: Census 2011, NRS Table AT60

SCOTTISH MUSLIMS IN NUMBERS35
Table 25: Prison Population by Ethnicity
Ethnic Categories All Prisoners %
White 5,694 96.4
Mixed or multiple ethnic groups 11 0.2
Asian, Asian Scottish or Asian British
126 2.1
African 28 0.5
Caribbean or Black 36 0.6
Other ethnic groups 13 0.2
All 5,908 100.0
Source: Census 2011, NRS Table DC4211SCca
Observations:
• While the high Muslim prison population in England and Wales is a source of concern, it is important to highlight that this issue does not extend into Scotland.
• Nonetheless, Scotland’s prisons and other communal institutions should remain attuned to the specific cultural and religious needs and sensitivities of Muslims and other minorities from among their populations.

SCOTTISH MUSLIMS IN NUMBERS36
5. Inequalities
5.1 Deprivation
The Scottish Index of Multiple Deprivations (SIMD) is a widely used measure of deprivation across seven domains: income, employment, health, education, skills and training, housing, geographic access and crime. SIMD scores are calculated at data zone level, the smallest area-level statistical unit in Scotland, each datazone containing a population of between 500 to 1,000 household residents. Although data zones nest into local authority areas, the SIMD scores for individual data zones cannot be aggregated and then averaged out for a larger area. As such, the table below shows the local authorities containing the highest national shares of the most deprived areas, according to the SIMD. It is difficult to draw solid conclusions in relation to Muslim populations and deprivation from this, as the Muslim populations in the vast majority of Scottish local authorities are so sparsely distributed.
But this may be worth further research in much smaller geographical areas such as data zones, within Glasgow at the least. There has been some research into poverty and ethnicity in Scotland,26 and this has found there to be people from a range of different minority ethnic groups in Scotland living disproportionately in the most deprived circumstances. The pattern was found to be most pronounced with the ‘African’ category, where over one third of this category were found to be living in a ‘deprived area’. As Section 3.2 of this report has illustrated, 92% of Scotland’s Muslims are of BME heritage, so it is reasonable to assume that many of them will also be living in deprived circumstances. However, if we look more closely at the Pakistani category (on the basis of 65% of Muslims being of South Asian heritage), we see that although there is some disproportionality in terms of this ethnicity living in more deprived areas, they score below the national average in terms of living in the 15% most deprived areas. 27
Table 26: Muslims and Deprivation by Local Authority
Council Area
Percentage of data zones
among 5% most deprived
in Scotland
Percentage of data zones
among 15% most deprived
in Scotland
National share of most
deprived areas (within 15%
most deprived)
National share of most
deprived areas (within 15%
most deprived)
% population who are Muslim
Glasgow City 21.3 41.6 45.5 29.6 5.4
North Lanarkshire 5.5 23.9 7.1 10.2 1
Fife - 12.8 - 5.9 0.7
Dundee City 10.6 30.7 5.8 5.6 2.6
Edinburgh City 3.5 9.8 5.8 5.5 2.6
South Lanarkshire 2.8 13.3 3.4 5.4 0.8
Renfrewshire 6.5 22.4 4.3 4.9 0.8
North Ayrshire 6.7 25.7 3.7 4.7 0.2
Inverclyde 12.7 40 4.3 4.5 0.2
East Ayrshire 7.8 20.8 3.7 3.3 0.3
West Dunbartonshire 10.2 26.3 3.7 3.2 0.4
Source: Local Authority Summaries, SIMD 2012, http://www.gov.scot/Topics/Statistics/SIMD/Publications/LASummariesSIMD12 and Census 2011 (accessed on 14th August 2016), and NRS Table KS209SCb
Moreover, analysis comparing Scotland with England and Wales using data from the NRS and the Office for National Statistics (ONS) shows that there is a marked difference (over 20%) between figures for Pakistanis and Bangladeshis living in the most deprived areas, suggesting that Pakistanis and Bangladeshis in Scotland are ‘better off’ than those in England. Notably, however, the gap between the two figures for Arabs in Scotland and Arabs in England is much smaller (where 5% more live in deprived areas), and for the African category, they are 5% more likely to live in deprived areas in Scotland than in England.
26 Danny Boyle, ‘A view from the ground’ in Meer (ed.) Scotland and Race Equality (2016), pp.23-27. 27 National Records of Scotland, Equality Results from the 2011 Census Release 2, 21st March 2014. Available at: http://www.gov.scot/Publications/2014/03/7340/17 (accessed on 29th August 2016).
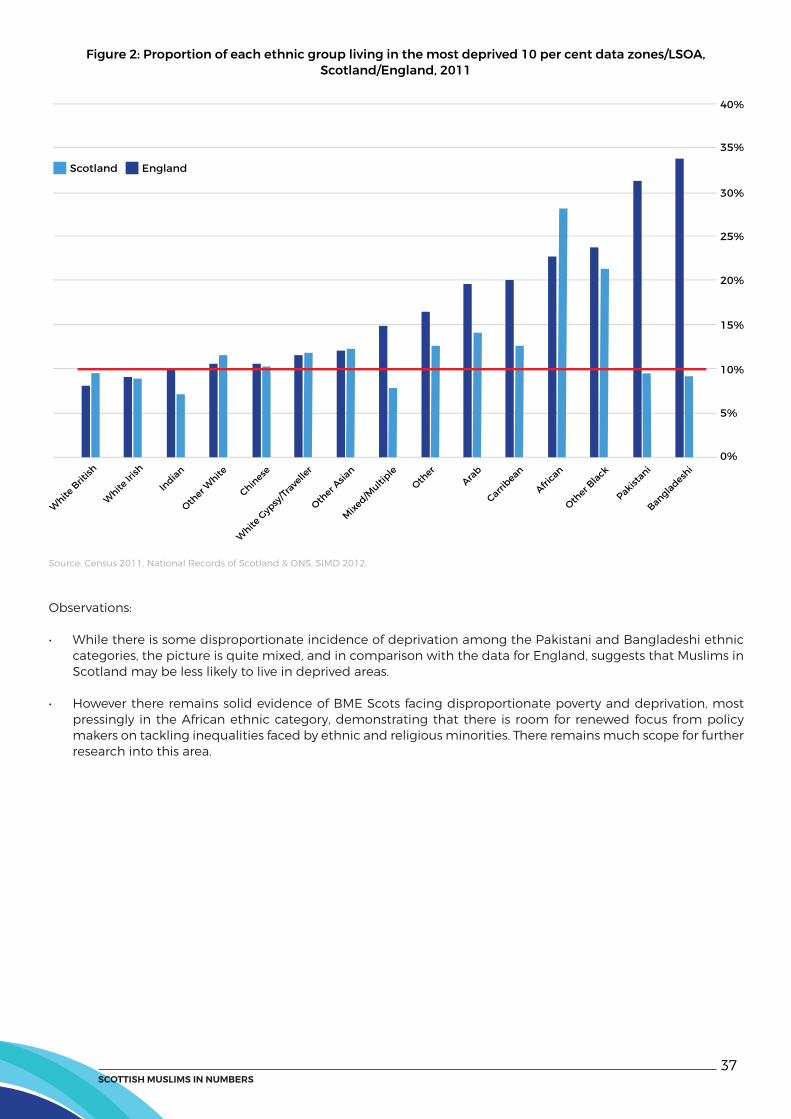
SCOTTISH MUSLIMS IN NUMBERS37
Source: Census 2011, National Records of Scotland & ONS, SIMD 2012.
Figure 2: Proportion of each ethnic group living in the most deprived 10 per cent data zones/LSOA,Scotland/England, 2011
Observations:
• While there is some disproportionate incidence of deprivation among the Pakistani and Bangladeshi ethnic categories, the picture is quite mixed, and in comparison with the data for England, suggests that Muslims in Scotland may be less likely to live in deprived areas.
• However there remains solid evidence of BME Scots facing disproportionate poverty and deprivation, most pressingly in the African ethnic category, demonstrating that there is room for renewed focus from policy makers on tackling inequalities faced by ethnic and religious minorities. There remains much scope for further research into this area.

SCOTTISH MUSLIMS IN NUMBERS38
5.2 Housing Tenure
A detailed breakdown of census responses to the question on housing tenure has not been made available by NRS, so for this section, I have generated tables using their safeguarded microdata sample, which comprises a 5% sample of anonymised individual 2011 census records. 28
The figure for those owning their homes outright is just over half the corresponding proportion for the total population – reflective of populations that have only arrived and settled in recent decades. Combined figures for social rental among Muslims are only slightly below those for the general population (18.2% compared with 20%), but private rental figures are significantly higher – over double those for the general population. More than 1 in 4 household spaces in the Muslim population is privately rented.
If we look at housing tenure among ethnic groups that are predominantly or significantly Muslim in population, we see that the proportion of home ownership (with a mortgage) among the Pakistani and Bangladeshi ethnic groups is higher than the overall population, but that for the Arab ethnic group, the figure is much lower, at 20%. This may reflect the relatively more recent or transient nature of settlement of Arab immigrants to Scotland, but also the much higher number of students from among them (see Section 6/Table 39). By the same token, private renting among the Arab group is roughly double the figure for Bangladeshis and Pakistanis (46.5% compared with 28.1% and 27%), and four times as high as the figure for the overall population (46.5% compared with 12.6%).
28 Microdata are small samples of data for whole households and individuals, which include some associated census characteristics but no information that could identify a household or individual. Further information on the microdata that I have used here is available from National Records of Scotland at: http://www.scotlandscensus.gov.uk/microdata (accessed on 24th August 2016).
Table 27: Muslims and Housing Tenure
Tenure of Household Total Muslim
Household spaces with no usual residents
2.1 1.8
Owned outright 23.7 12.5
Owned with a mortgage or shared ownership
40.7 39.3
Social rented: Rented from council (local authority)
11.4 4.4
Social rented: Other social rented 9.6 13.8
Private rented: Private landlord or letting agency
10.4 24.7
Private rented: Other Private Rented or Living Rent Free
2.2 3.4
Total 100 100
N= 267,071 3,780
NRS (2015). 2011 Census Microdata Individual Safeguarded Sample (Regional): Scotland. [data collection]. UK Data Service. SN: 7834

SCOTTISH MUSLIMS IN NUMBERS39
Table 28: Ethnicity and Housing Tenure
Tenure of HouseholdAll Ethnic
Groups
Asian, Asian Scottish/British:
Pakistani, Pakistani Scottish
Asian, Asian Scottish/British:
Bangladeshi, Bangladeshi
Scottish
Other ethnic
groups: Arab, Arab
Scottish/British
Household spaces with no usual residents 2.1 0.7 2 4.2
Owned outright 23.7 17.1 7.5 8.2
Owned with a mortgage or shared ownership
40.7 48.6 46.2 20
Social rented: Rented from council (local authority)
11.4 3.2 11.6 7.8
Social rented: Other social rented 9.6 8.7 8 13.2
Private rented: Private landlord or letting agency
10.4 18.3 22.1 41.4
Private rented: Other Private Rented or Living Rent Free
2.2 3.4 2.5 5.2
Total 100 100 100 100
N= 267,071 2,444 199 425
NRS (2015). 2011 Census Microdata Individual Safeguarded Sample (Regional): Scotland. [data collection]. UK Data Service. SN: 7834
Observations:
• For the significant proportion of Scotland’s Muslim population who are privately renting their homes, the new Scottish Private Residential Tenancy (SPRT), to be introduced in 2017, will be of particular interest, especially provisions for more flexible tenancy periods and regulations on rent rises. Local authorities with large proportions of residents privately renting should consider this if/when they seek to apply to designate areas as ‘rent pressure zones’.
• For those seeking to purchase their first homes, the ease of availability of affordable housing will be a priority. Currently there are no lenders offering shari’a compliant mortgages under the Scottish Government’s Help to Buy affordable homes scheme, so this is identified as an area for future policy development.
5.3 Health and Disability
The percentage of Muslims self-declaring as having ‘bad or very bad health’ is very close to the figure for the overall population (4% and 5.6%). There is a higher proportion of Muslims classifying themselves as having ‘very good or good health’ (87% compared to 82.2%), perhaps due to the younger (and therefore, generally healthier) age profile of the Muslim population. However, in view of the more youthful Muslim population, the difference between these two figures is not as large as one might expect. A focus on ill health among the older population might explain this. 1 in 3 Muslim women aged 65 and over consider themselves to be in bad or very bad health – much higher than the figure for women in the overall population, which measured at just under 1 in 7. Conversely, whereas over half of women in the 65 and over age band consider themselves to be in very good or good health, the corresponding figure for Muslim women is less than a quarter.
Table 29: Muslims and Ill Health
Health Categories All % Muslim %
Very Good or Good Health
4,353,481 82.2 66,923 87
Fair Health 644,881 12.2 6,707 9
Bad or Very Bad Health
297,041 5.6 3,107 4
All 5,295,403 100.0 76,737 100
Source: Census 2011, NRS Table AT062

SCOTTISH MUSLIMS IN NUMBERS40
Table 30: Health in the over 65 Population by Sex
Health categories
All Muslims
Male > 65
% Female > 65 % Male > 65 % Female > 65 %
Very Good or Good Health
213,980 55.8 269,943 53.3 667 47.1 258 23.2
Fair Health 117,782 30.7 166,672 32.9 513 36.2 485 43.7
Bad or Very Bad Health
51,977 13.5 69,980 13.8 308 21.7 367 33.1
All (age 65+) 383,739 506,595 1,417 1,110
Source: Census 2011, NRS Table CT0152e
Focusing on disability, the proportion of Muslims who consider themselves to have a disability which limits their day-to-day activities, whether ‘a little’ or ‘a lot’, is slightly lower than the percentage figure for the overall population. Again this can be attributed to the younger age profile of the Scottish Muslim population. However, if we hone in on the figures for the over 60 age band, we can see that actually a greater proportion of Muslim men and women self-declare a disability, as compared with the figure for the overall population. In particular, the figure for Muslim women self-declaring a disability is 14% higher than the corresponding figure for women in the overall population.
Table 31: Muslims and Disability
Disability categories All % Muslims %
Day-to-day activities not limited
4,255,032 80.4 67,609 88.1
Day-to-day Activities limited a little
534,508 10.1 5,065 6.6
Day-to-day activities limited a lot
505,863 9.6 4,063 5.3
All 5,295,403 100 76,737 100
Source: Census 2011, NRS Table AT061
Table 32: Disability in the Over 60 Population by Sex
Disability categories
All Muslims
Male aged 60+
% Female aged 60+
% Male aged 60+
% Female aged 60+
%
Day-to-day activities not
limited
302,440 55.1 344,615 51 976 47.9 561 32.7
Day-to-day Activities limited a
little
121,013 22.1 160,986 24 494 24.2 491 28.6
Day-to-day activities limited a
lot
125,011 22.8 172,791 25 569 27.9 665 38.7
All 548,464 678,392 2,039 1,717
Source: Census 2011, NRS Table AT061

SCOTTISH MUSLIMS IN NUMBERS41
29 Sara Kidd and Lynn Jamieson, ‘Experiences of Muslims Living in Scotland’ (Scottish Government Social Research, 2011), pp.37-40.30 Raj Bhopal, ‘The quest for culturally sensitive health-care systems in Scotland: insights for a multi-ethnic Europe’ Journal of Public Health 34:1 (2012), pp.5-11.31 Christina R Victor, Vanessa Burholt and Wendy Martin ‘Loneliness and Ethnic Minority Elders in Great Britain: An Exploratory Study’ in Journal of Cross-Cultural Gerontology 27:1 (2012), pp.65-78.32 See for example Steven Swinford, ‘Britain should learn from Asian and African immigrants about caring for elderly, says minister’ The Telegraph 21st April 2014.33 ‘Managing Diabetes during Ramadan’, Diabetes UK: https://www.diabetes.org.uk/ramadan (accessed on 24th August 2016).34 ‘Scottish government funds Kidney Research UK project’, Kidney Research UK: http://www.kidneyresearchuk.org/news/scottish-government-funds-kidney-research-uk-project 29th January 2014 (accessed on 24th August 2016).35 ‘Give Blood’, Scottish Ahlulbayt Society: http://scottishahlulbaytsociety.org/give-blood/ (accessed on 24th August 2016).
◊ Diabetes UK runs a campaign during Ramadan to equip Muslims who are diabetic with relevant information, highlight any risks and also circulate guidance from imams on questions around fasting while diabetic.33
◊ A recent Kidney Research UK campaign to encourage organ donation from among South Asians in the west of Scotland. This campaign cites research indicating that ‘Kidney failure affects the Asian community up to five times as much as the Caucasian community’ and that ‘The need for organ transplants in South Asian communities is more than three times higher than that of other communities, due to illnesses such as diabetes, kidney disease and heart disease being more prevalent’.34
◊ The Scottish Ahlulbayt Society’s drive, in partnership with the Scottish National Blood Transfusion Service (SNBTS), NHS National Services Scotland, and the Imam Hussain Blood Donation Campaign Scotland to encourage regular blood donation among Muslims. This has proved successful in better connecting Muslim communities with the NHS, potentially helping to tackle barriers to accessibility of health services.35
Observations:
• These patterns mirror similar findings among the Muslim population of England and Wales.
• More research is needed to understand the underlying causes of these figures, and why health inequalities are especially pronounced among older Muslim women. Factors for this may include language or cultural barriers, access issues to services or carers, or public health education.
• Previous research has suggested that Muslims and those from South Asian backgrounds experience disadvantage and discrimination in accessing mental and physical health services, and services for those with disabilities.29
• In contrast with this, Scotland’s Ethnicity and Health (‘Fair for All’) policy (introduced in 2002) has been pioneering in setting standards for a culturally sensitive healthcare system that seeks to minimise inequities faced by minorities and disadvantaged groups in accessing healthcare services.30 The Scottish Government should give full support to the continued development and implementation of these policies and local health boards should prioritise ethnicity and health policy in their service delivery.
• Previous research into loneliness among ethnic minority elders in the UK has found that reported rates of loneliness are particularly high for a number of ethnic groups in the 65+ age band, among them Pakistanis and Bangladeshis. A range of causal factors have been identified, including dislocation to social and cultural networks as a result of migration.31 This brings into question the validity of popular assumptions that Asian and African communities generally retain a sense of obligation to look after their elderly population in the home,32 and underlines the importance of developing culturally sensitive and appropriate elderly care for this demographic as it continues to grow in the coming years.
• Mosques as well as Muslim and BME civil society organisations have important roles to play in promoting healthier lifestyles, and working with relevant agencies to facilitate cultural sensitivity and improved access to health and disability services.
• Some examples of good practice in Scotland that can be emulated in the area of public health awareness and education include:

SCOTTISH MUSLIMS IN NUMBERS42
Table 33: Council areas with large Muslim populations and over 65s with disabilities
Council AreaTotal
Muslims aged 65+
Muslims 65+ with disability
limiting day-to-day
activity
% Council Areaall people aged 65+
all people 65+ with disability
limiting day-to-day
activity
%
Glasgow City
1,028 712 69.3
Glasgow City 82,165 52,723 64.2
Edinburgh, City of
355 228 64.2 Edinburgh, City of
68,487 34,133
49.8
Dundee City 116 68 58.6
Dundee City 24,597 11,093 45.1
East Renfrewshire
177 110 62.2 East Renfrewshire
16,280 7,580 46.6
Aberdeen City 45 21 46.7
Aberdeen City 32,031 16,376 51.1
Source: Census 2011, NRS Table CT0152a

SCOTTISH MUSLIMS IN NUMBERS43
6. Labour Market Issues6.1 Economic Activity/Inactivity
Almost one third (31%) of the Scottish Muslim population is economically active on a full time basis, whether self-employed, or as an employee. For the general population, the corresponding figure is 51%, or just over half. This low employment figure is inevitably related to the very high proportion of students among Scottish Muslims – a proportion three times as high as the proportion of students among the general population (18.5% compared with 6.2%). The unemployment rate among Muslims is higher than that of the general population (8.7% compared with 6.3%) but by a smaller margin than the corresponding figures for England and Wales.
Table 34: Muslims and Economic Activity
All people % Muslims%
Economically active:
Employee: Part-time*
604,252 17.3 8,406 16.3
Employee: Full-time* 1,569,289 45.0 11,377 22.0
Self-employed: Part-time*
72,823 2.1 1,579 3.1
Self-Employed: Full-time*
208,854 6.0 4,424 8.6
Unemployed* 220,723 6.3 4,474 8.7
Economically inactive:
Retired 186,841 5.4 684 1.3
Student 217,491 6.2 9,544 18.5
Looking after home or family
140,034 4.0 6,509 12.6
Long Term sick or disabled
196,727 5.6 1,882 3.6
Other 71,704 2.1 2,787 5.4
All people aged 16 to 64
3,488,738 51,666
*Including full-time studentsSource: Census 2011, NRS Table CT0094b

SCOTTISH MUSLIMS IN NUMBERS44
Table 35: Types of Full Time Employment
All
Total Employee % Self-employed
with employees
% Self-employed
no employees
%
Male 1,119,942 944,521 84.3 55,955 5 119,466 10.7
Female 680,282 633,037 93.1 16,169 2.4 31,076 4.6
1,800,224 1,577,558 72,124 150,542
Muslims
Total Employee % Self-employed
with employees
% Self-employed
no employees
%
Male 11,682 7,811 66.9 2,039 17.5 1,832 15.7
Female 3,816 3,196 83.8 321 8.4 299 7.8
15,498 11,007 2,360 2,131
Source: Census 2011, NRS Table AT150
6.2 Types of Economic Activity
Looking more closely at those who are in full-time employment, a breakdown of the nature of their employment shows that a significant proportion from within the Muslim population are self-employed, whether working on their own, or also employing others. While 1 in 8 (12.3%) of the total population working full-time is classed as ‘self-employed’, the corresponding proportion for Muslims in Scotland is more than double, at more than 2 in 7 or 29%. If we hone in further to look at males in full-time employment, the difference is even more pronounced, with over 1 in 3 Muslim men being self-employed (33.2%), compared with 15.7% for males in the overall population.
Observations:
• The higher proportion of people who are self-employed among Muslims suggests a capacity for entrepreneurship and independence. On the other hand, it may also be an indicator of barriers faced by Muslims in the job market, that have encouraged many to resort to self-employment. Further research on this is needed.
• This observation, together with unemployment rates that are fairly in proportion to the rate among the overall population undermines right-wing populist suggestions that ‘immigrant’ communities are more likely to be reliant on the state. Further, many small businesses will be responsible for creating jobs and thus supporting the economy.
• The tendency towards self-reliance, along with high student figures are indicative of an aspirational population that is seeking upward social mobility.

SCOTTISH MUSLIMS IN NUMBERS45
6.3 Education and Qualifications
Between 2001 and 2011, the percentage of Muslims with no qualifications has decreased at a faster pace than the corresponding percentage for the overall population – a fall of 17 percentage points compared with a fall of 10 percentage points. At the other end of the scale, the proportion of Muslims with a Level 4 qualification also increased at a higher rate than the corresponding figure for the overall population – an increase of 15 percentage points, compared with an increase of 8 percentage points for the general population. As of 2011, almost 2 in 5 Scottish Muslims between the ages of 16 to 74 are educated at Level 4 (i.e. degree level and above). For the overall Scottish population the figure is just over 1 in 4.
Table 36: Muslims and Highest Level of Qualification
2001 2011
Level of Qualification All people
aged 16 to 74
% Muslims aged 16
to 74
% All people
aged 16 to 74
% Muslims aged 16 to 74
%
No qualifications* 1,239,947 33.2 11,170 38.5 907,845 22.9 11,432 21.4
Level 1 921,074 24.7 5,136 17.7 965,789 24.3 10,650 20.0
Level 2 584,060 15.7 4,025 13.9 608,216 15.3 5,783 10.8
Level 3 259,389 7.0 2,208 7.6 412,278 10.4 5,512 10.3
Level 4 726,609 19.5 6,440 22.2 1,076,402 27.1 20,006 37.5
Total 3,731,079 28,979 3,970,530 53,383
*For 2001, this category includes ‘qualifications outwith these groups’.
Source: Census 2001, NRS Table T25 and Census 2011, NRS Table CT0094aNB: The ‘highest level of qualification’ variable was classified by the NRS as follows:
Level 1: O Grade, Standard Grade, Access 3 Cluster, Intermediate 1 or 2, GCSE, CSE, Senior Certificate or equivalent; GSVQ Foundation or Intermediate, SVQ level 1 or 2, SCOTVEC Module, City and Guilds Craft or equivalent; Other school qualifications not already mentioned (including foreign qualifications).
Level 2: SCE Higher Grade, Higher, Advanced Higher, CSYS, A Level, AS Level, Advanced Senior Certificate or equivalent; GSVQ Advanced, SVQ level 3, ONC, OND, SCOTVEC National Diploma, City and Guilds Advanced Craft or equivalent.
Level 3: HNC, HND, SVQ level 4 or equivalent; Other post-school but pre-Higher Education qualifications not already mentioned (including foreign qualifications).
Level 4 and above: Degree, Postgraduate qualifications, Masters, PhD, SVQ level 5 or equivalent; Professional qualifications (for example, teaching, nursing, accountancy); Other Higher Education qualifications not already mentioned (including foreign qualifications).

SCOTTISH MUSLIMS IN NUMBERS46
Figure 4: Muslims and highest level of educational qualification - 2011
Figure 3: Muslims and highest level of educational qualification - 2001

SCOTTISH MUSLIMS IN NUMBERS47
There are 11,054 Muslim students in Scotland, with approximately 60% being male and 40% female. This is similar to the pattern in England and Wales, where 57% of Muslim students are male and 43% female. It is difficult to tell if this is also the case within local council areas in Scotland as this data is not available on a local level.
Table 37: Muslim Students by Age and Sex
Age band Sex Number of students % of Muslim student pop
18 to 24Males 3,332 30.1%
Females 2,622 23.7%
25 to 34Males 2,246 20.3%
Females 1,257 11.4%
35 to 49Males 887 8.0%
Females 565 5.1%
50 and overMales 76 0.7%
Females 69 0.6%
11,054
Source: Census 2011, NRS Table AT107

SCOTTISH MUSLIMS IN NUMBERS48

SCOTTISH MUSLIMS IN NUMBERS49
Table 38: Council Areas with Highest Muslim Student Populations
Total Muslim % Muslim
Glasgow City 53,603 4,398 8.2
Edinburgh, City of 49,935 2,269 4.5
Aberdeen City 22,706 873 3.8
Dundee City 16,107 869 5.4
Fife 16,983 296 1.7
East Renfrewshire 3,920 265 6.8
North Lanarkshire 10,628 230 2.2
South Lanarkshire 9,696 193 2
Stirling 6,987 180 2.6
Renfrewshire 7,281 162 2.2
Perth & Kinross 3,548 141 4
Falkirk 3,852 120 3.1
West Lothian 4,467 95 2.1
East Dunbartonshire 4,339 84 1.9
Aberdeenshire 5,596 44 0.8
East Lothian 3,120 42 1.4
Scottish Borders 2,456 39 1.6
Midlothian 2,057 34 1.7
West Dunbartonshire 3,033 29 1
Angus 3,151 24 0.8
Highland 3,739 22 0.6
East Ayrshire 3,740 20 0.5
South Ayrshire 3,370 20 0.6
Clackmannanshire 1,321 19 1.4
Dumfries & Galloway 2,593 19 0.7
Moray 1,775 14 0.8
Inverclyde 3,199 13 0.4
North Ayrshire 4,389 10 0.2
Argyll & Bute 1,564 9 0.6
Shetland Islands 287 5 1.7
Eilean Siar 479 1 0.2
Orkney Islands 257 0 0
Total 260,178 10,539 4.1
Source: Census 2011, NRS Table CT0152c
Table 38 shows that 4,398 (or 42%) of all Muslim students are based in Glasgow, with another 2,269 (or 20%) in Edinburgh – making these two cities home for the majority of Muslim students in Scotland. The proportion of all students in Glasgow and Edinburgh who are Muslims is 8.2% and 4.5% respectively. For Scotland as a whole, 4% of all students are Muslims, representing a significantly higher proportion than the figure of Muslims in the general population, and more than the combined total of students belonging to religions other than Christianity.
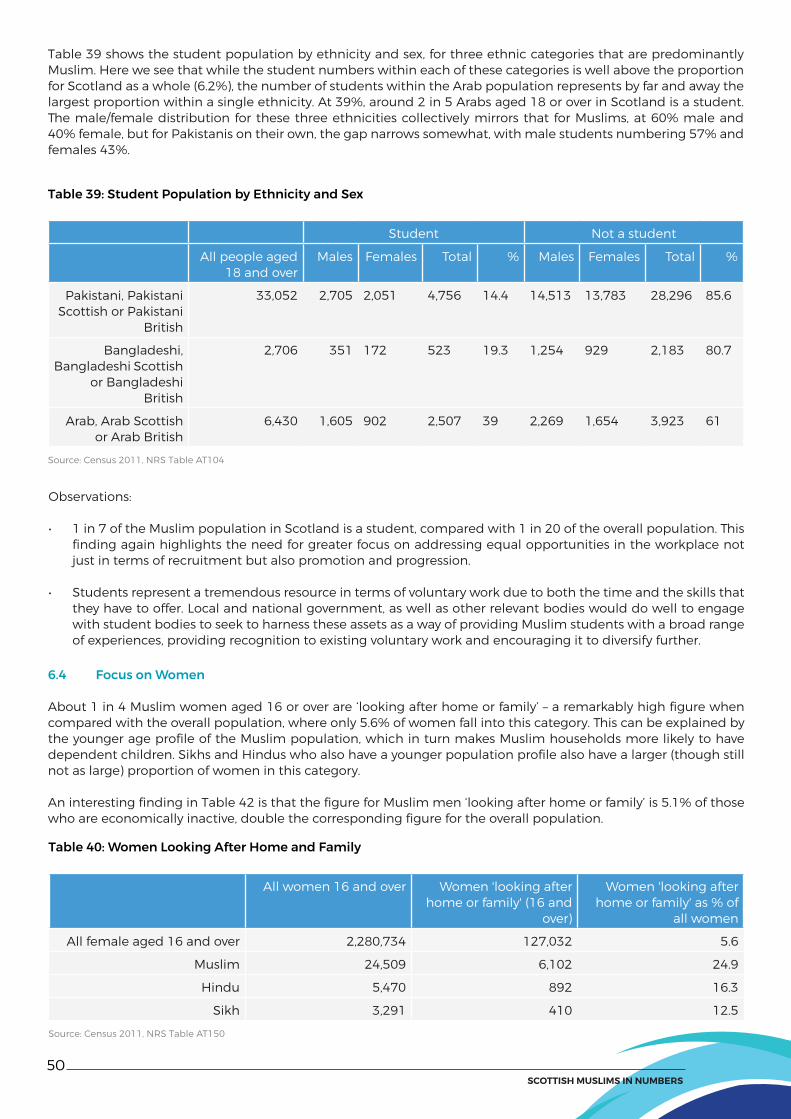
SCOTTISH MUSLIMS IN NUMBERS50
Table 39 shows the student population by ethnicity and sex, for three ethnic categories that are predominantly Muslim. Here we see that while the student numbers within each of these categories is well above the proportion for Scotland as a whole (6.2%), the number of students within the Arab population represents by far and away the largest proportion within a single ethnicity. At 39%, around 2 in 5 Arabs aged 18 or over in Scotland is a student. The male/female distribution for these three ethnicities collectively mirrors that for Muslims, at 60% male and 40% female, but for Pakistanis on their own, the gap narrows somewhat, with male students numbering 57% and females 43%.
Table 39: Student Population by Ethnicity and Sex
Student Not a student
All people aged 18 and over
Males Females Total % Males Females Total %
Pakistani, Pakistani Scottish or Pakistani
British
33,052 2,705 2,051 4,756 14.4 14,513 13,783 28,296 85.6
Bangladeshi, Bangladeshi Scottish
or Bangladeshi British
2,706 351 172 523 19.3 1,254 929 2,183 80.7
Arab, Arab Scottish or Arab British
6,430 1,605 902 2,507 39 2,269 1,654 3,923 61
Source: Census 2011, NRS Table AT104
Observations:
• 1 in 7 of the Muslim population in Scotland is a student, compared with 1 in 20 of the overall population. This finding again highlights the need for greater focus on addressing equal opportunities in the workplace not just in terms of recruitment but also promotion and progression.
• Students represent a tremendous resource in terms of voluntary work due to both the time and the skills that they have to offer. Local and national government, as well as other relevant bodies would do well to engage with student bodies to seek to harness these assets as a way of providing Muslim students with a broad range of experiences, providing recognition to existing voluntary work and encouraging it to diversify further.
6.4 Focus on Women
About 1 in 4 Muslim women aged 16 or over are ‘looking after home or family’ – a remarkably high figure when compared with the overall population, where only 5.6% of women fall into this category. This can be explained by the younger age profile of the Muslim population, which in turn makes Muslim households more likely to have dependent children. Sikhs and Hindus who also have a younger population profile also have a larger (though still not as large) proportion of women in this category.
An interesting finding in Table 42 is that the figure for Muslim men ‘looking after home or family’ is 5.1% of those who are economically inactive, double the corresponding figure for the overall population.
Table 40: Women Looking After Home and Family
All women 16 and over Women 'looking after home or family' (16 and
over)
Women 'looking after home or family' as % of
all women
All female aged 16 and over 2,280,734 127,032 5.6
Muslim 24,509 6,102 24.9
Hindu 5,470 892 16.3
Sikh 3,291 410 12.5
Source: Census 2011, NRS Table AT150

SCOTTISH MUSLIMS IN NUMBERS51
Table 41: Economically Active Women
Total Working full time
% Working part-time
% Full-time
student
% Unemployed % Total % economically
active
All 2,280,734 680,282 29.8 477,251 20.9 8,463 0.4 71,300 3.1 54.5
Muslim 24,509 3,816 15.6 3,710 15.1 1,322 5.4 1,295 5.3 41.4
Hindu 5,470 1,847 33.8 777 14.2 351 6.4 331 6.1 64.5
Sikh 3,291 860 26.1 782 23.8 178 5.4 247 7.5 63.8
Source: Census 2011, NRS Table AT150
Table 42: Economic inactivity among Muslim men and women, aged 16 and over
Economically inactive men Economically inactive women
All men % Muslim men
% All women
% Muslim women
%
Total 661,718 9,225 Total 967,218 14,366
Retired 107,724 16.3 5,412 58.7 Retired 111,491 11.5 4,158 28.9
Student 393,960 59.5 1,276 13.8 Student 581,161 60.1 1,268 8.8
Looking after Home or family
15,650 2.4 467 5.1 Looking after home or family
127,032 13.1 6,102 42.5
Long-term sick or disabled
105,764 16 918 10 Long-term sick or disabled
104,171 10.8 1,071 7.5
Other 38,620 5.8 1,152 12.5 Other 43,363 4.5 1,767 12.3
Source: Census 2011, NRS Table AT150
Observations:
• The higher proportion of Muslim women aged 16 and over who are economically inactive reflects a complex and multifaceted picture. Contributing factors include the younger age profile of the Muslim population, and the associated greater proportion of households with dependent children. This in turn affects employment possibilities, which are themselves affected by barriers (real and perceived) related to ethnicity, gender and religion. It must also be highlighted that the census questionnaire did not take into account any voluntary social and community service which many people (among them Muslim women) may be engaged in but will not be visible in any of the categories above.
• The recently published report on ‘Employment Opportunities for Muslims’ by the House of Commons Select Committee on Women and Equalities found that Muslim women were the most disadvantaged group in today’s society when it came to employment opportunities.36
• Given the higher incidence of family and home commitments among Muslim women, a clear area of focus for policy makers is how to creatively better facilitate non-traditional and more flexible forms of employment in order to allow more Muslim women to join the workforce.
36 HCWEC, ‘Employment Opportunities for Muslims in the UK’ (2016).

SCOTTISH MUSLIMS IN NUMBERS52
6.5 Socio-Economic classification
Table 43 shows that there is diversity among the Muslim population of Scotland in terms of socio-economic classification. Some figures can be explained by features that have been highlighted elsewhere in this report. For example, the two largest categories – full time students (23.5%), and ‘never worked’ (15.9%), can both be linked to the younger age profile of the Muslim population, the higher numbers of students, as well as the larger proportion of families with young dependent children, and women ‘looking after the home and family’. The figures for those in ‘higher’ occupation categories are comparable with those for the population as a whole – with the lower percentage for Muslims being attributable to a dip in the proportion of ‘large employers and higher managerial/administrative occupations’. This small gap could partly be due to a higher proportion of Muslims focusing on small businesses, as demonstrated by the figure for ‘small employers and own account workers’, which is 12.4% for Muslims, compared with 7.4% for the total population. It could also be partly due to obstacles faced by Muslims and ethnic minorities in accessing promotions and higher-level occupations, as has been demonstrated by studies in this area.37 Perhaps this point is made even clearer by the figures in the lower managerial, administrative and professional category, where there is a gap of almost 8 percentage points between the proportion of all people and the proportion of Muslims in this category. However, the overall socio-economic picture for Muslims in Scotland, based on this census data, seems to be more positive than in England and Wales, as is suggested by the smaller proportion of the Muslim population in intermediate, lower supervisory roles and routine roles than in the total population.
Table 43: Muslims and National Statistics Socio-Economic Classification (NS-SeC)
All people aged 16 to 74
% Muslim Population aged 16 to 74
%
1. Higher Managerial, Administrative and Professional Occupations
456,392 11.5 4,566 8.6
1.1 Large employers and higher managerial and administrative occupations
177,560 4.5 688 1.3
1.2 Higher professional occupations
278,832 7 3,878 7.3
2. Lower managerial, administrative and professional occupations
690,381 17.4 4,904 9.2
3. Intermediate occupations 513,038 12.9 3,554 6.7
4. Small employers and own account workers
294,610 7.4 6,597 12.4
5. Lower supervisory and technical occupations
326,930 8.2 2,900 5.4
6. Semi-routine occupations 616,404 15.5 6,157 11.5
7. Routine occupations 514,036 13 2,612 4.9
8. Never worked 124,530 3.1 8,492 15.9
9. Long-term unemployed 74,100 1.9 1,073 2
10. Full-time students 360,109 9.1 12,528 23.5
Source: Census 2011, NRS Table AT153
37 HCWEC, ‘Employment Opportunities for Muslims in the UK’ (2016).

SCOTTISH MUSLIMS IN NUMBERS53
Table 44 illustrates how, in terms of raw figures, there are clearly many more ‘low achievers’ among Scotland’s Muslims than ‘high achievers’. Together with the figures in Table 43, this shows that whereas for the overall population, the proportion of ‘low achievers’ (5%) is less than half the proportion of ‘high achievers’ (11.5%), for Muslims, the pattern is reversed, with the proportion of ‘low achievers’ (17.9%) constituting more than double the percentage of Muslims who are ‘high achievers’ (8.6%).
Table 44: Local Council Areas with the Largest Numbers of Muslim ‘High’ and ‘Low’ Achievers
Local Council Areas ‘High Achievers’* Local Council Areas ‘Low Achievers’**
Glasgow 1,208 Glasgow 5,204
Edinburgh 657 Rest of Scotland 1,988
Rest of Scotland 168 Edinburgh 1,358
Aberdeen 45 Dundee 363
East Renfrewshire 30 East Renfrewshire 327
Dundee 28 Aberdeen 325
* ‘high achievers’: those in higher managerial, administrative and professional occupations.** ‘low achievers’: those who have never worked or are long-term unemployed.Source: Census 2011, NRS Tables CT0152b and CT0152f
Observations:
• NS-Sec data for Muslims in Scotland gives a mixed picture. However, in keeping with many other findings in this report, it supports the view that Scotland’s Muslim population is socio-economically somewhat better off than Muslims in England and Wales. For instance, while over a fifth of Muslims aged 16-74 in England and Wales have never worked, for Scotland, the figure is 15.9%. However, this is still significantly higher than the corresponding percentage for the overall Scottish population (3.1%).
• Similarly, while a greater proportion of Muslims in Scotland than in England and Wales are classified in the higher professional categories, they still lag behind the overall Scottish population in this regard. Significantly, more than double the amount of Scottish Muslims are unemployed or have never worked than those in higher professional categories – a reverse pattern is visible in the overall Scottish population.
• When viewed together with other findings in this report, this data suggests that while there is aptitude for better education, and entrepreneurship, real or perceived ethnic, religious and/or gender barriers could play a role in limiting social mobility. However, a tendency towards self-employment and small business initiatives could also be an offsetting factor (albeit insufficient on its own) to explain the lower numbers of Muslims in the higher professional categories. This represents an important area of potential further research.

SCOTTISH MUSLIMS IN NUMBERS54
7. Conclusions
This report has sought to provide a comprehensive picture of the Muslim population of Scotland based on data from the most recent census, and also to identify distinctive patterns by making comparisons with data from the 2001 census, and with census data for England and Wales.
Scotland’s Muslim population is a small but growing one, with a young age profile. There are Muslims living in all parts of Scotland, although with a concentration in the areas in and around Glasgow, Edinburgh, Dundee and Aberdeen. Almost half are UK-born, and Muslims in Scotland are ethnically diverse, accounting for one third of the nation’s BME population. Muslims are civically engaged, with a strong sense of national identity, and a particular sense of pride in their Scottishness, although there is clearly some work to do in translating everyday civic and political engagement into active participation in the electoral system.
Much of the data indicates a highly aspirational Scottish Muslim population with an eye on social mobility and a tendency towards financial independence and self-sufficiency. Muslims in Scotland are increasingly highly educated, with well over a third achieving ‘degree level or above’ education. Just under a third of Muslims who work full-time are self-employed, with many owning small businesses. Muslim young people – both school-age and students – represent a tremendous resource in terms of their capacity to contribute positively to the nation, and this can be facilitated by greater cultural understanding and recognition in educational and other public spaces, as well as cross-community and government-community partnerships on matters of mutual interest.
The majority of Muslim households are owner occupied or privately rented, with a smaller proportion renting from the social housing sector as compared with the figures for Scotland as a whole. In terms of composition, a majority of households consist of couples with dependent children although there remains a significant proportion of lone parent homes with children, comparable with the population as a whole.
In the area of health, figures for the Muslim population are similar to the wider population, with the exception of the older age bands where there is a clear decline in self-reported health. Sustained policy support is needed at both national and local levels for cultural sensitivity and inclusivity in Scotland’s health services. This will help to eliminate any real or perceived
discrimination barriers that might be faced by Muslims and people from South Asian backgrounds.
Though initial analysis using (with caution) ethnicity as a proxy for religion suggests that Muslims are still more likely to live in areas of deprivation, comparisons with similar data in England and Wales suggest that Muslims in Scotland are better off in ‘deprivation terms’. Similarly, while the socio-economic picture is mixed, it is overall a more positive one than is painted by the data for Muslims in England and Wales. This supports the general image of an aspirational, yet broadly upwardly mobile population.
Areas for future research include investigating the causes of poor health among the elderly Muslim population, particularly elderly women. Additionally, research into levels of deprivation in neighbourhoods with the most concentrated Muslim populations in Glasgow and Dundee will help to deepen our understanding of the extent to which Muslims may reside in deprived areas.
Overall, this report’s findings highlight important features of a dynamic and still developing Scottish Muslim population. On balance, the data tells us a more positive story than has been told in England and Wales, and this should be acknowledged as encouraging. But it also highlights some crucial and difficult questions. What are the limits of Scotland’s ‘civic nationalism’ and what are the implications of this for the ongoing process of integration? How can we best harness the assets that Scotland’s increasingly highly educated young Muslim population has to offer? Why, does voter registration among Muslims remain low, despite the long tradition of political engagement? Why does discrimination, real and perceived, persist, and how can it best be tackled? How can we better understand patterns of minority populations living in deprivation, and address? These are all questions that present both challenges and opportunities to local and national government as well as to Muslim community organisations and leadership, and it is hoped that this report will prove a useful starting point for future work in all these areas.

SCOTTISH MUSLIMS IN NUMBERS55
SCOTTISH MUSLIMS IN NUMBERS56
8. ReferencesAhmed, Nafeez. ‘David Cameron’s illiterate proposal to counter-radicalisation by targeting Muslim women’ (18th January 2016) available at: https://medium.com/insurge-intelligence/david-cameron-s-illiterate-proposal-to-counter-radicalisation-by-targeting-muslim-women-f6069bfee942#.xxsxte2lw (accessed 17th August 2016).
Ali, Sundas. ‘British Muslims in Numbers: a demographic, health and socio-economic profile based on the 2011 Census’ (Muslim Council of Britain, 2015)
Barrett, David. ‘British Muslims are becoming a ‘nation within a nation’, Trevor Philips warns’ The Telegraph 11th April 2016.
Bhopal, Raj. ‘The quest for culturally sensitive health-care systems in Scotland: insights for a multi-ethnic Europe’ Journal of Public Health 34:1 (2012), pp.5-11.
Bonino, Stefano. Muslims in Scotland: the making of community in a post 9/11 world (Edinburgh University Press: forthcoming, 2017)
Boyle, Danny. ‘A View from the Ground’ in Meer, N (ed.) Scotland and Race Equality: directions in policy and identity (Runnymede Trust, 2016).
Cameron, David ‘We won’t let women become second-class citizens’ The Times 18th January 2016.
Education Scotland. ‘Welcoming our Learners: Scotland’s ESOL strategy 2015-2020’ (Education Scotland, Scottish Government, 2015).
Electoral Commission, Office for National Statistics and National Records of Scotland. Electoral Registration in 2011 (July 2014).
Homes, Amy et al, ‘Muslim integration in Scotland’ (Ipsos Mori Scotland and the British Council, July 2010).
Hopkins, Peter et al. Faith, Ethnicity, Place: young people’s everyday geopolitics in Scotland (AHRC, 2015).
Hopkins, Peter. ‘‘Blue squares’, ‘proper’ Muslims and transnational networks Narratives of national and religious identities amongst young Muslim men living in Scotland’ Ethnicities 7:1 (2007), pp. 61-81.
House of Commons Women and Equalities Committee. ‘Employment Opportunities for Muslims in the UK’ (House of Commons, August 2016).
Hunter, Alistair. ‘Grave Concerns about Reuse’, (16th September 2016), Burying our Differences: negotiating faith and space in contexts of death and diversity, The University of Edinburgh: http://www.bod-project.llc.ed.ac.uk/2016/09/16/grave-concerns-about-reuse/ (accessed on 4th October 2016).
Hussain, Asifa and William Miller. Multicultural Nationalism: Islamophobia, Anglophobia and Devolution (Oxford: OUP, 2006).
Kidd, Sara and Lynn Jamieson. ‘Experiences of Muslims Living in Scotland’ (Scottish Government Social Research, 2011).
Maan, Bashir. Muslims in Scotland (Argyll, Edinburgh: 2014).
Meer, Nasar. ‘Self-Reported Discrimination in Scotland’ in Meer, N (ed.) Scotland and Race Equality: directions in policy and identity (Runnymede Trust, 2016).
_____‘Looking up in Scotland? Multinationalism, multiculturalism and political elites’ Ethnic and Racial Studies 38:9 (2015), pp. 1477-1496.
National Records of Scotland, Equality Results from the 2011 Census Release 2, 21st March 2014 (http://www.gov. scot/Publications/2014/03/7340/17

SCOTTISH MUSLIMS IN NUMBERS57
Data Sources:National Records Scotland: www.scotlandscensus.org.ukScottish Index of Multiple Deprivations (SIMD) 2012: http://www.gov.scot/Topics/Statistics/SIMD/ Office for National Statistics (ONS): www.ons.gov.ukNorthern Ireland Statistics and Research Agency (NISRA): www.nisra.gov.uk
Websites: Amina Muslim Women’s Resource Centre Facebook page: https://www.facebook.com/amina.mwrc.1/‘Managing Diabetes during Ramadan’, Diabetes UK: http://www.diabetes.org.uk/ramadan‘Scottish Government funds Kidney Research UK project’, Kidney Research UK: http://www.kidneyresearchuk.org/news/scottish-government-funds-kidney-research-uk-project‘Give Blood’, Scottish Ahlulbayt Society: http://scottish ahlulbaytsociety.org/give-blood
Photographs: p.6 & 55: Prominent Scottish Muslims showcase Islamic Tartan.p.31: School pupils at Al Qalam Academy, Glasgow.p.42 & 47: Shops at Nicolson Square, Edinburghp.45: Islamic Student Society event, University of Edinburgh.p.48: Students in discussion at a meeting of the University of Edinburgh Islamic Society.p.59: Muslim students in prayer, Edinburgh
Photo Credits:Andrew Denholm/The Herald.Aurangzeb Haneef.Hamza Anwar/Alwaleed Centre.Ian Rutherford/The Scotsman.Jeff J Mitchell/Getty Images.Mohammad Hussain/Alwaleed Centre.RJ Ramsay Photography.Umera Rashid/Alwaleed Centre.
Infographic:Designed with graphics from Flaticon.
Scottish Government Languages Working Group. ‘Language learning in Scotland: a 1+2 Approach’ (Scottish Government, 2012).Scottish Government. ‘New Scots: Integrating Refugees in Scotland’s Communities’ (Scottish Government, 2013).
Swinford, Steven. ‘Britain should learn from Asian and African immigrants about caring for elderly, says minister’ The Telegraph 21st April 2014.
Victor, Christina R., Vanessa Burholt and Wendy Martin. ‘Loneliness and Ethnic Minority Elders in Great Britain: An Exploratory Study’ in Journal of Cross-Cultural Gerontology 27:1 (2012), pp.65-78.
Young, Carol. ‘Race Equality in Scotland’s Public Sector’ in Meer, N (ed.) Scotland and Race Equality: directions in policy and identity (Runnymede Trust, 2016).

SCOTTISH MUSLIMS IN NUMBERS58
Notes


SCOTTISH
MUSLIMSIN NUMBERSUnderstanding Scotland’s Muslim population through the 2011 Census


