• This report summarises the weather and the condition in the coastal, offshore and oceanic
waters around Scotland for the years 2004 and 2005. It describes the measurements made
during these two years and compares them with average conditions observed over the last
three decades or more.
• The weather in Scotland during 2004 and 2005 was warmer than average. Rainfall at Stornoway
in the northwest of Scotland remained higher than normal in all but one of the months during
2004 and 2005.
• In almost all areas temperatures in 2004 and 2005 were warmer than normal, although
temperatures have generally decreased slightly since record highs that were observed during
2003.
• Monthly sea surface temperature data showed that in coastal sites, the spring or early
summer in both 2004 and 2005 were close to or below normal, but temperatures rose later
in the summer and remained above normal during the winter months. Overall the average
temperatures for the 2004 and 2005 were higher than normal.
• Both temperature and salinity at offshore and oceanic sites were above normal during 2004
and 2005, following a trend that has been observed over the last 30 years.
• Winter temperature at fishing grounds in the North Sea showed a continuation of the general
warming trend seen in coastal waters. It is difficult to determine a clear trend in the southern
north sea due to the high variability, but salinities in the northern North Sea followed the
trend towards high values seen elsewhere in the North Atlantic
• In the surface waters around Scotland the linear trend in temperature since 1970 is between
0.2 and 0.6°C per decade. This trend is similar to that observed over the whole of the northern
hemisphere since 1979 (0.234°C per decade). These changes are caused by a combination
of natural variability and Global Climate Change.
4
This report presents a summary of the conditions in the seas around Scotland using both data collected by Fisheries
Research Services (FRS) and data sources from other organisations within Scotland and further afield. The underlying
theme of this report is climate change and therefore the focus of the report is physical measurements made in the
atmosphere and the seas around Scotland.
The first section of this report examines changes that have been observed in the weather at selected stations
around Scotland. As the weather has an influence on ocean conditions this helps put the variability observed in
the marine environment into context. The report then continues to describe data collected in the coastal, offshore
and oceanic regions around Scotland, identifying any interesting patterns observed during 2004 and 2005 and
describing longer term changes where data are available.
It important to put the Scottish measurements into a global context. Over the last decade the atmosphere and
the surface layers of the seas and oceans around Scotland have been warming at a rate greater than observed
at any time in the last 100 years. It is clear that this warming is linked to the general warming trend in global
temperatures. Global climate change is almost certainly being driven by rising concentration of greenhouse gases
into the atmosphere caused by human activities such as burning of fossil fuels and deforestation. In this report
we explain changes that have been observed over the whole of the North Atlantic and how this fits in with the
patterns that we are seeing in Scotland.
Although some of the timeseries presented in this report are relatively short, comparing them to longer timeseries
allows us to put the observations into the context of longer term change. And examining many single datasets
together helps to develop an understanding of the wider regional patterns of change. So, by bringing together
observations from a number of different sources, we can get a clearer picture of what changes are happening in
the Scottish marine environment.
Whatever the underlying causes of the climate variability, changes in the physical marine environment affect the
marine ecosystem and have an impact on the health and diversity of the marine ecosystem and its productivity. For
example, changes in climate can effect the distribution and abundance of plankton, which then affect distribution
and abundance of fish stocks. As the marine ecosystem is complex, these changes are not always easy to understand.
FRS are committed to monitoring the impacts of climate variability on the seas around Scotland and have an active
programme of research that aims at developing a better understanding of the impacts of past and potential future
change on the marine ecosystem.
AcknowledgementsThis report has been prepared by collating data and editing text from a wide range of sources from within FRS and
beyond. FRS would like to thank all of the volunteers who participate in the long-term monitoring programme as
well as the staff, both scientific and technical, from the many organisations who have submitted their data sets
for inclusion into this report. A list of those who have provided data can be found in Appendix A.
Introduction
5
What is Normal?When trying to understand changes in climate, we tend to be mainly interested in long term trends, ie
those changes that occur over periods of five years or longer. When examining data for such trends it is
standard practice to remove both seasonal variability and the long term average values. The data are then
described as anomalies and they show us the difference between the observed value and the ‘normal’
or average values. In truth, the climate is always changing to some extent so there is no real definition
of ‘normal’. However to help us compare different datasets we have chosen a period, which is then used
to define ‘normal’ conditions. For most of the datasets in this report, the normal period is calculated as
the average of measurements made between between 1971 and 2000. In many of the figures shown
in this report data are plotted as anomalies, for example temperature data from coastal temperature
timeseries in Figure 7. Before 2000 the period 1961-1990 was used as a baseline and some datasets
(such as the mainland coastal weather stations) continue to use this period.
Sometimes it is difficult to compare data from different regions, as these have different patterns of
naturally variability. For example, in a region such as the southern North Sea, where salinity values
can vary between <30 to 35, a value of 1 or 2 above normal is not significant. But in a region where the
variability in salinity is low, this could well be significant. In these cases, anomalies are then normalised
with respect to the standard deviation. The normalised anomalies are then expressed in units of standard
deviation, in which case; a value of three means three standard deviations above normal. In this report,
normalised anomalies are mostly used when comparing datasets over wide areas, such as the North
Sea (Figure 16) and the North Atlantic (Figure 22)
6
Section 1: Weather During 2004 and 2005
Changes in the atmosphere, or the ‘weather’ can affect conditions in the sea in many
ways. Sunshine warms the sea surface, winds cool the surface of the sea and stir the
surface waters up by creating waves and drive currents around our coasts. Rainfall
affects the saltiness of the sea by adding fresh water directly to the surface and through
freshwater runoff from land and rivers.
It is important to consider what the weather was like in 2004 and 2005 in order to set
the years into context before we look at the changes that occurred in the seas around
Scotland in those years.
Here we present a summary of the weather experienced during 2004 and 2005 at
a selection of five maritime locations around Scotland. The first four locations have
been chosen to represent the southwest, northwest, northeast and southeast coasts
of Scotland (Figure 1). The locations are Bishopton in the Clyde (1), Stornoway in the
Hebrides (2), Dyce near Aberdeen (3) and Leuchars near St Andrews (4).
Mainland Coastal StationsAt each coastal site, the ‘normal’ or average conditions at each site have been found
for the period 1961 to 1990 (See - What is Normal?). Figures 2 and 3 show the monthly
average of the daily maximum and minimum air temperature, the total monthly
sunshine hours and total monthly rainfall for each of the coastal sites during the two
year period compared to normal.
2004Maximum and Minimum air temperatures were again above normal for most of the
year at all four coastal sites during 2004. The warmest conditions were observed on
the south east coast of Scotland at Leuchars, with maximum temperatures during April
and May reaching 12.7°C and 15.7°C, just over 2°C warmer than normal. The coolest
months were in July and October 2004, when maximum and minimum temperatures
remained close to normal or slightly below normal.
September and February were the sunniest months during 2004, particularly on the
East Coast, with 106 hours of sunshine during September 2004 at Dyce. Rainfall during
2004 was very variable at all sites throughout the year with alternating wetter and drier
months on both the east and west coast.
2005Rainfall in Stornoway was higher than normal throughout the whole of the year,
continuing a trend that has seen higher than normal rainfall almost continuously for
at least the last 10 years. April was a particularly wet month, with west coast stations
recording monthly rainfall totals of 117mm and 114mm at Bishopton and Stornoway
respectively. These extremes were not seen in the rainfall on the east coast.
Despite temperatures being generally above normal throughout the year, sunshine
hours were more variable and often below normal, particularly at Stornoway. In July
2005 as in 2004, sunshine hours at both of the west coast sites were below normal,
repeating a pattern seen at these sites since 2001.
Figure 1. Location of five representative weather stations around the Scottish coast; Abbotsinch
in the Clyde (1), Stornoway in the Hebrides (2), Dyce near Aberdeen (3), Leuchars near St Andrews (4) and Lerwick, Shetland Isles (5).
5
3
4
2
1
7
Figure 2 Monthly average air temperature (maximum and minimum), total sunshine (hours) and total rainfall (mm) at coastal sites on the West coast Scotland (Bishopton and Stornoway). (See Figure 1). The blue line ( ) shows monthly average values
recorded during 2004 and the red line ( ) shows monthly average values recorded during 2005. The red shaded bars indicate the ‘normal’ conditions calculated using 1961-1990 averages. Prior to 2000, data from southwest coast of Scotland
was reported from Abbotsinch rather than Bishopton.
J F M A M J J A S O N D
Month
Total Monthly Rainfall
J F M A M J J A S O N D
Total Monthly Sunshine
J F M A M J J A S O N D
Maximum Daily Air Temperature
Maximum Daily Air TemperatureMaximum Daily Air Temperature
J F M A M J J A S O N D
Stornoway (N West Coast)
J F M A M J J A S O N D
Month
Total Monthly Rainfall
J F M A M J J A S O N D
Total Monthly Sunshine
J F M A M J J A S O N D
J F M A M J J A S O N D
Maximum Daily Air Temperature
Bishopton (S West Coast)
0
50
100
150
200
250
0
50
100
150
200
250
-2
0
2
4
6
8
10
12
14
02
4
6
8
1012
14
16
18
20
Hou
rs°C
°Cm
m
8
Figure 3. Monthly average air temperature (maximum and minimum), total sunshine (hours) and total rainfall (mm) at coastal sites on the East coast Scotland (Dyce and Leuchars). (See Figure 1).The blue line ( ) shows monthly average
values recorded during 2004 and the red line ( ) shows monthly average values recorded during 2005. The red shaded bars indicate the ‘normal’ conditions calculated using 1961-1990 averages.
Dyce ( N East Coast) Leuchars (S East Coast)
Maximum Daily Air Temperature Maximum Daily Air Temperature
J F M A M J J A S O N D
Month
Total Monthly Rainfall
J F M A M J J A S O N D
Total Monthly Sunshine
J F M A M J J A S O N D
Maximum Daily Air Temperature
J F M A M J J A S O N D
J F M A M J J A S O N D
Month
Total Monthly Rainfall
0
50
100
150
200
250
0
50
100
150
200
250
J F M A M J J A S O N D
Total Monthly Sunshine
-2
0
2
4
6
8
10
12
14
J F M A M J J A S O N D
02
4
6
8
1012
14
16
18
20
J F M A M J J A S O N D
Maximum Daily Air TemperatureH
ours
°C°C
mm
9
Figure 4.The North Atlantic Oscillation, Hurrell Winter Index. Thick black line is the data smoothed with a two year running mean. Periods of positive NAO are highlighted in red with negative periods shown in blue.
The North Atlantic Oscillation
The North Atlantic Oscillation (NAO) is the most common pattern of variability in the atmospheric pressure
across the North Atlantic Ocean. The NAO is related to the strength and direction of westerly winds across
the North Atlantic. Changes in the strength and position of these westerly winds have a significant impact
on conditions in the weather and the seas around Scotland. The North Atlantic Oscillation (NAO) Index is
a parameter that has been devised to tell us the state of the NAO.
When the NAO Index is high, the weather conditions in Scotland tend to become warmer and wetter.
Conversely when the NAO Index is low, the weather becomes colder and drier. These changes are also
reflected by differing conditions in the seas and oceans.
The NAO Index was low for a period during the 1960’s and early 1970’s and since then has been mainly high.
However, there have been a few short periods when the NAO has switched to negative values. After a period
of high NAO index values between 1985 and 1995 the NAO index underwent a large and rapid decrease
during the winter preceding 1996 (Figure 4). The index was positive again during 1997-2000 until a further
reversal occurred over the winter preceding 2001. Since 2001 the index has been weak and variable.
The NAO index only describes the strength of the most common pattern in atmospheric pressure in the
North Atlantic (a north-south variation in sea level pressure anomaly). Although this has been the dominant
pattern for much of the last 30 years, it is not always the case. Since 2002 the pattern of pressure in the
North Atlantic has not been a typical NAO pattern and therefore there has not been such a clear relationship
between the NAO index and the conditions in the atmosphere and seas around Scotland.
Figure 5 Location of coastal temperature measurements that extend back more than 20 years .
Red - Millport. Green - Fair Isle. Blue - Peterhead.
Staff at the FRS Marine Laboratory maintain a network of
coastal monitoring stations around the Scottish coast.
Although there are many coastal meteorological stations
across Scotland recording conditions in the atmosphere,
there are only a few locations where conditions in the sea
have been recorded. There are only three sites in Scotland
(Fair Isle, Millport and Peterhead), where we have been
able to obtain records of coastal sea surface temperature
that extend back more than 20 years (Figure 5).
Until 2003, measurements of sea surface temperature
at Fair Isle and Millport were made by hand using a
simple insulated bucket thermometer. The Sources and
Links page at the end of this report provide links to the
organisations that have help to collect data at these
sites. Without their commitment we would have very little
information about long-term changes in the temperature of
Scottish coastal waters. Since 2003, FRS have automated
the measurements at these sites by deploying small
instruments that automatically record sea temperatures.
This will help to ensure that the data from these valuable
timeseries continues to be collected well into the future.
Section 2: Scottish Coastal Waters
Figure 6 and Table 1 show the monthly average sea surface temperature at Fair Isle, Millport and Peterhead
for the years 2004 and 2005 compared to normal conditions. The normal values can be used to see that
there are differences in the seasonal pattern of sea surface temperature between the east and west coasts
of Scotland. On average, the minimum winter temperatures on the west coast of Scotland and at Fair Isle
are higher than those on the east coast. In the summer time, the waters of the shallower North Sea warm
up more quickly and so in summer temperatures at Peterhead are higher than those at Fair Isle, although
still lower than those on the west coast.
Figure 6 Average monthly sea temperatures at three coastal temperature sites in Scotland (positions marked in Fig. 5). The blue line (●) shows monthly average values recorded during 2004 and the red line (●) shows monthly average
values recorded during 2005. The thick grey line indicates the normal conditions calculated from averages of available data up to 2000. Error bars show one standard deviation from these average values. The grey dotted lines indicate the
maximum and minimum values observed through the length of the timeseries.
Peterhead
J F M A M J J A S O N D
Fair Isle
J F M A M J J A S O N D
Millport (Clyde)
4
6
8
10
12
14
16
°C
J F M A M J J A S O N D
11
TABLE 1. Monthly average sea-surface temperature from coastal monitoring sites around Scotland for 2004 and 2005. Long-term average values for each month have been calculated and adjusted using the average trend to be
comparable to those calculated at Millport. The confidence that can be placed on these average values increases as the length of the timeseries increases. Those shown in green are the longest and therefore the most reliable.
Care should be taken when using averages calculated from the shorter datasets.
Average Jan Feb Mar Apr May Jun Jul Aug Sep Oct Nov Dec
*Errors have been identified in data from St Andrews during 2004.
12
2004At Millport, on the west coast of Scotland, temperatures during 2004 were generally warmer than normal,
a pattern reflected in almost all of the coastal monitoring stations. The beginning and end of the year
were very warm, with temperatures in February and December being 1.1°C and 1.2°C warmer than normal
respectively. The summer was also warm, with average August temperatures reaching 15°C, which is 1.3°C
warmer than normal. The warm August followed a cooler period in July when temperatures returned to
slightly below normal levels.
At the coastal monitoring site in Fair Isle, the first and latter parts of the year were warmer than normal.
The month showing the greatest deviation from normal was January, with average temperatures of 8.3°C,
being 1.2°C warmer than normal. Whilst June and July remained close to normal, temperatures rose again
in August and remained more than 0.7°C warmer than normal for the rest of the year.
At Peterhead, on the east coast of Scotland, the temperatures throughout the year were also mostly warmer
than normal, particularly during January and February. In contrast to other stations, August temperatures
were close to normal, but the average temperature in September reached 0.8°C above normal conditions
and warmer than normal temperatures then continued through from September to December.
2005Warm temperatures observed in the latter part of the year in 2004, continued into the early part if 2005.
At Millport, temperatures in January, February and March were all more than 0.9°C above normal. Average
February temperatures of 8.1°C were 1.3°C above normal.
At Fair Isle, problems with the monitoring meant that data from some months of 2005 were missing.
However, it is clear from the data that during the summer months a much cooler period occurred, leading
to temperatures of between 0.3°C and 0.8°C lower than normal. The cooler period was observed at almost
all of the coastal monitoring sites, and was particularly strong at those sites on the north and east coasts
of Scotland (Table 1)
At Peterhead, a similar pattern was observed, with temperatures at the start and end of the year being
warmer than normal, whilst temperatures in the middle of the year were closer to normal or even sometimes
slightly below normal (Apr, May). July was the warmest month, with average temperatures of 13.3°C being
1°C warmer than normal.
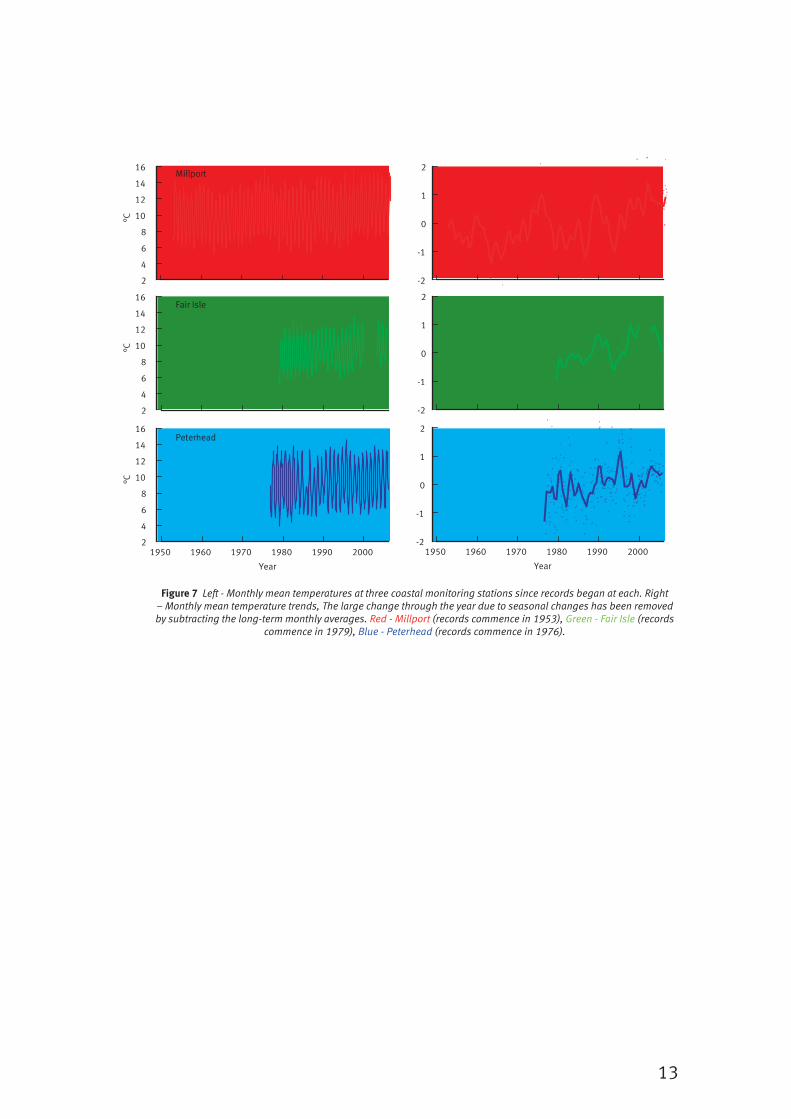
Long-Term TrendsChanges that occur from year to year can also be compared to long-term trends by looking at all the
measurements made over the years. Figure 7 shows the monthly average sea-surface temperature anomalies
at all three stations for as long as data have been collected at each site. At all of the coastal stations the
general trend since 1980 has been one of warming at a rate of between 0.2 and 0.6°C per decade. From
these data, the warming trend appears to be strongest on the west coast of Scotland.
13
Figure 7 Left - Monthly mean temperatures at three coastal monitoring stations since records began at each. Right – Monthly mean temperature trends, The large change through the year due to seasonal changes has been removed by subtracting the long-term monthly averages. Red - Millport (records commence in 1953), Green - Fair Isle (records
commence in 1979), Blue - Peterhead (records commence in 1976).
Peterhead
1950 1960 1970 1980 1990 2000
Year
-2
-1
0
1
2
1950 1960 1970 1980 1990 2000
Year
2
4
6
8
10
12
14
16
°C
Fair Isle
-2
-1
0
1
2
2
4
6
8
10
12
14
16
°C
Millport
-2
-1
0
1
2
2
4
6
8
10
12
14
16
°C
14
Climate Variability and Climate Change
The conditions in the seas and oceans around Scotland vary in similar ways to those in the atmosphere,
with daily, monthly and seasonal patterns as well as longer term change. Sometimes the terminology used
to describe change in weather and climate can be misunderstood or confused. Some common terms and
sources variability are described below:
Weather: Weather is used to describe changes that occur over a short period of time. In this report we most
commonly use the term weather to describe the short term changes that occur in the atmosphere (such as
in Section 1) but the term could also be correctly used to describe short term changes that are observed
in the seas and oceans.
Climate: The climate of a region is described by the average weather. The climate is often calculated as the
average weather over a long period of time. In this report the climate of a region is calculated over a long
period of time (usually 30 year period 1971-2000) and is referred to as ‘normal’ or ‘average’ conditions.
Elsewhere these average conditions may be referred to as the ‘climatological mean’ or just the ‘climate’.
Climate Variability: In this report we describe the changes that are observed in conditions in the seas and
oceans from month to month and from year to year. These changes are driven in part by natural variability
and in part by global climate change.
Climate Change: We know that the average global climate is changing over a long period, caused by human
activities, sometimes termed as human-induced or anthropogenic climate change. In this report we use
the term Global Climate Change to distinguish between this and other natural changes or variability in
climate.
Daily Cycle: The daily cycle of light and dark influences the marine ecosystem, and some plankton migrate
in the water column in response to changes in light. As the sea heats up and cools down much more slowly
than the atmosphere, daily changes in temperature are only observed in very shallow coastal areas. The
semi-diurnal (twice daily) changes in the tide also have a strong influence on the marine ecosystem.
Seasonal Cycle: In Scotland we have four distinct seasons, spring, summer, autumn and winter. This
seasonal pattern of variability can also observed in the marine environment. As the sea heats up and
cools down more slowly than the atmosphere we see a lag in the seasonal temperature cycle. Seas are at
their warmest during August and September and at their coolest in February and March. It is sometimes
useful to calculate an average seasonal cycle, and then compare monthly data to the average. This can tell
us if a particular month was above or below normal. Changes on a month to month basis cannot really be
described as climate change or be attributed directly to global climate change but can nevertheless have
a significant impact on the marine ecosystem at that time.
Longer Term Variability: We know that conditions in the seas around Scotland vary from year to year and
decade to decade, and that these changes can be linked to changes in patterns of atmospheric pressure
in the North Atlantic. This variability can be explained to some extent by the NAO Index (see Section 1). If
we look at average temperatures in the North Atlantic we can also see a pattern of variability of between
20-40 years which is described as the Atlantic Multidecadal Oscillation (See AMO Section) and is thought
to be a natural pattern. We also know that the longer term changes that we see are in part driven by Global
Climate Change.
15
Section 3: Coastal Monitoring Sites
The FRS Coastal Long-Term Monitoring programme was set up in 1999 to monitor water quality parameters
at a selection of sampling sites in Scottish coastal waters. Since 1999, the number of sites has been
expanded, through additional monitoring and by collating data from other sources.
We collect data on sea-surface temperature at all sites and in addition we collect salinity, nutrients (e.g. as
phosphate, silicate, nitrate and ammonia) and phytoplankton at selected full monitoring sites. The nutrient
measurements along with the phytoplankton samples are being used to support research into primary
production and harmful algal blooms.
Figure 8. Location of the long-term coastal monitoring sites around Scotland. Full sample sites where measurements are taken for temperature, salinity and nutrients are at Loch Maddy1, Loch Ewe2, Orkney3 and Shetland4 ( ). Nutrient
and salinity sampling were also initiated at Fair Isle during 2003. Secondary sampling sites where measurements are made for temperature only are at Mallaig on the West Coast and Findon on the East coast ( ). Data are also collected from other sources at Ardtoe, St Andrews and Longannet ( ). New temperature monitoring sites were established in the Cromarty Firth during 2003 and at North Berwick in 2006 ( ). The map also shows the long-term coastal temperature sampling stations at Peterhead ( ), Fair Isle( ) and
Millport( ).
Figure 8 shows the location of each of the four full sampling sites around Scotland. In addition, there are
a number of further sites where just temperature data are recorded. Two of these sites, in the Cromarty
Firth and at North Berwick, have only just been established and therefore the data are not included in this
report. FRS has also obtained data from a number of independent sampling stations at Ardtoe, St Andrews
and Longannet. Data from these stations are presented in this report. Volunteer teams from variety of
institutes, service the coastal monitoring sites around Scotland and the work would not be possible without
their help.
Temperature data from the coastal monitoring sites are presented in Table 1 and Figure 9 to show what
conditions were like at each site during 2004 and 2005. These timeseries are short and their mean values
have been adjusted using the estimated decadal trend in sea surface temperature, to match the equivalent
Fair Isle
Peterhead
Millport
12
3
4
Findon
St Andrews
Longannet
MallaigArdtoe
North Berwick
Cromarty Firth
16
Mallaig (West Coast)
1 2 3 4 5 6 7 8 9 10 11 12Month
1 2 3 4 5 6 7 8 9 10 11 12Month
Loch Maddy (Outer Isles)
Ardtoe (West Coast)
6
8
10
12
14
16
°C
6
8
10
12
14
16
°C
Loch Ewe (West Coast )
long term mean at Millport. This allows the sites from shorter datasets to be compared to longer ones.
Care should be taken, however, when using the mean values from shorter timeseries as we have much
less confidence than the mean values from the longer datasets. Although the timeseries at the coastal
monitoring sites are not long enough to accurately establish normal conditions, we can see that at all
sites, the adjusted anomalies compare well. The overall pattern is also coherent with that of the long term
temperature timeseries.
During 2004, the start of the year (Jan, Feb) was warmer generally than normal. Temperatures were close
or even slightly below normal during spring and early summer. At most sites, August was very warm, this
is particularly apparent at Longannet in the Firth of Forth. The average August temperature of 17.9°C was
the warmest value in the 10 year record. The warm autumn of 2004 led to winter temperatures that were
warmer than normal, and this carried on into the start if 2005. However, by April 2005, temperatures at
many of the sites had reduced to normal or below normal. This cooler period lasted through until July when
temperatures rose again. Temperatures in December 2005 were again higher than normal, particularly on
the west coast of Scotland.
The following text provides a brief description of each coastal temperature monitoring site. This includes any
problems that have been observed with the data and any notes relating to data quality. As these sites are
coastal in location, they can be strongly affected by local freshwater outflows and as such do not necessarily
represent conditions that would be observed further offshore in deeper waters.
Figure 9. West Coast (9a), North Coast (9b) and East Coast (9c). Sea-surface temperature data from long-term monitoring sites around Scotland. The blue lines ( ) show monthly average values recorded during 2004 and the
red lines ( ) show monthly average values recorded during 2005. The black dots show all data from previous years. Average monthly values are show as a green line. The thickness of the line indicates the length of the timeseries and
therefore the confidence we have that the mean is a representative value. <5years ( ) 5 year mean ( ) or 10 year mean ( ).
a)
17
1 2 3 4 5 6 7 8 9 10 11 12Month
1 2 3 4 5 6 7 8 9 10 11 12Month
6
8
10
12
14
°C
Scalloway (Shetland)Scapa Pier (Orkney)
1 2 3 4 5 6 7 8 9 10 11 12Month
1 2 3 4 5 6 7 8 9 10 11 12Month
°C
°C
°C
2
4
6
8
10
12
14
16
18Longannet (Firth of Forth)
2
4
6
8
10
12
14
16
18St Andrews
4
6
8
10
12
14
Findon (East Coast)
MallaigTemperature measurements have been made at Mallaig since 1999. However, there have been problems
with the temperature recorder at this site and some data are missing. In 2003 a new more secure site was
established close to the fishery pier. Data are collected in situ and are checked and calibrated by FRS.
Loch MaddyLoch Maddy was established as a coastal monitoring site in 2002. This is one of the shortest timeseries
presented in this report and as such the long term mean should just be used as a guide. The temperature
recorder is fixed at a depth of around 5 metres underneath Loch Maddy Pier. Data are collected in situ
b)
c)
18
and are checked and calibrated by FRS. As this site is inside the loch, the data show some influence of
freshwater input.
Loch EweTemperature measurements have been taken in Loch Ewe since 1999. The temperature recorder is deployed
from a buoy at a depth of 5m below sea surface, in a sheltered location at a fish farm in Loch Ewe. Data are
collected in situ and are checked and calibrated by FRS. At this site there is a lot of influence from fresh
water flowing into the loch. During the winter this water is colder than the surrounding loch water and during
the summer this water is warmer than the surrounding loch water.
Ardtoe (not an FRS Long Term Monitoring Site)Temperature measurements have been made at the Ardtoe Marine Farming Unit that until recently was run
by the Seafish Industry Authority (SFIA) but is now an independent company. The data are measured in the
sea water intake to the tanks used for fish farming research. The data are uncalibrated.
Scapa PierTemperature measurements have been made at Scapa Pier in Orkney since 1999. This is a fairly sheltered
location within Scapa Flow. The temperature recorder is suspended from the pier at a depth of 1m below
the level of the lowest tide. Data are collected in situ and are checked and calibrated by FRS.
ScallowayTemperature measurements have been made at Scalloway since 1999. This is a moderately exposed site
in a natural harbour on the southwest coast of Shetland. The temperature recorder is suspended at 2m
below the sea surface under a floating pontoon at Scalloway boat club. Data are collected in situ and are
checked and calibrated by FRS.
FindonTemperature measurements have been made at a coastal site at Findon since 1996. The site is an exposed
location in a small inlet on the east coast of Scotland. The temperature recorder is fixed inside a pipe that
affords it some shelter from storms and is deployed at a depth of 1m below the level of the lowest tide. The
data are sometimes affected by spiking caused by air trapped in the inlet pipe. These data are removed by
applying a median filter before calculating daily and monthly averages.
St Andrews (not an FRS Long Term Monitoring Site)Temperature measurements have been made at the low water mark in St Andrews bay, twice per week
since 1999. These data are collected by staff at St Andrews University for the purpose of monitoring sea
water intake to the aquaria. The quality of the data are thought to be reasonable but will be affected by
the estuarine outflow and are liable to be strongly affected by localised cooling and heating of the water
on the shallow foreshore. As such, temperatures during winter may be lower and temperatures during the
summer may higher than those expected from a measurement site in deeper water.
Longannet (not an FRS Long Term Monitoring Site)Temperature measurements have been taken at the sea water intake pipe at the power station in Longannet
since 1997. The site is within the Firth of Forth and will be strongly affected by freshwater flow through the
estuary. The data are uncalibrated.
19
Section 4: Ecosystem Monitoring at Stonehaven
FRS Marine Laboratory has established a coastal ecosystem monitoring site on the east coast of Scotland.
The site is 5km offshore from the town of Stonehaven, in a water depth of approximately 50m. Since 1997
weekly measurements of seawater temperature and salinity have been taken as well as water samples for
the analysis of nutrients and plankton. A second ecosystem monitoring site was established on the west
coast of Scotland, at Loch Ewe, in 2002 to monitor the same parameters.
As Stonehaven is a relatively shallow station, depth averaged values of temperature, salinity and nutrients
have been presented. The weekly measurements at Stonehaven allow us to identify seasonal patterns in
the data and see how these vary from year to year. Temperatures are usually highest around September and
lowest during April (Figure 12). Salinity also has a similar seasonal cycle, lowest values occurring during
April and the highest values around October.
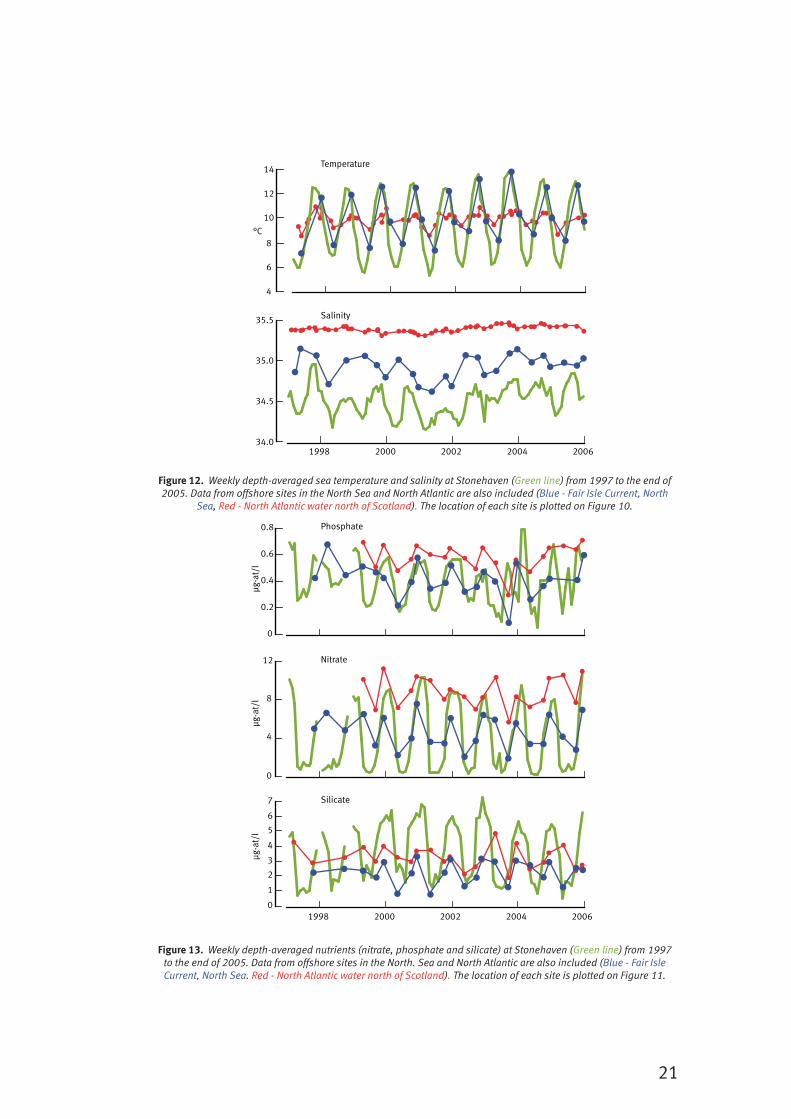
Although the measurements at Stonehaven are only available from 1997, the changes in temperature and
salinity can be put into context with the longer term changes seen in other monitoring data, such as the
data collected further offshore in the Fair Isle current and the Atlantic water north of Scotland. Figure 12
shows temperature and salinity data at Stonehaven in comparison with data from other offshore sites.
During the period 1997 to 2005, the sea surface temperatures at Stonehaven showed the warming trend
that has been observed at all sites in the North Sea, with peak temperatures observed during 2003 and
slightly lower temperatures in 2004 and 2005. The salinity decreased to a minimum in 2002 and started
to rise again. From the monthly data (Figure 10) we can see that the salinities during the summer months
of 2005 were the highest recorded in the 10 year dataset.
34.2
34.4
34.6
34.8
35.0
Stonehaven Salinity
6
8
10
12
14
°C
1 2 3 4 5 6 7 8 9 10 11 12Month
1 2 3 4 5 6 7 8 9 10 11 12Month
Stonehaven Temperature
Figure 10. Monthly mean depth-averaged temperature and salinity at the Stonehaven monitoring site. The blue line ( ) shows monthly average values recorded during 2004 and the red line ( ) shows monthly
average values recorded during 2005. The thick grey line indicates the normal conditions calculated from 10-year period 1997-2006. Error bars show one standard deviation from these average values. The grey dotted lines indicate
the maximum and minimum values observed through the length of the timeseries.
Figure 11 shows the location of the Stonehaven sampling site in relation to the circulation of surface waters
around the north and east coasts of Scotland. At Stonehaven, collecting data on a weekly basis allows us
data to monitor changes that occur from season to season. However, as it is more difficult and costly to take
samples offshore using a larger research vessel, the data from the offshore locations are only collected three
times per year. This does not mean that the offshore data are any less valuable. As we describe in Section
6, the offshore data are essential to help us to understand the trends observed in the coastal waters in the
context of changes happening over the whole North Atlantic region.
20
The seasonal cycle for nutrients is a little different to that of temperature and salinity (Figure 13). Nutrient
levels are at their highest during the winter. During the summer time nutrient levels become very low as
the nutrients are used up by phytoplankton growing during the spring and summer. During the period
of measurement at Stonehaven (1997-2005) the level of nutrients in winter, particularly phosphate and
silicate, increased and then decreased again.
All the data collected at Stonehaven, including phytoplankton and zooplankton data, are published on the
FRS website: www.frs-scotland.gov.uk/stonehaven
0° 30°W
50°N
60°N
Figure 11. Location of offshore and oceanic sampling sites (squares) around Scotland where the Marine Laboratory and others (see text) make routine oceanographic measurements 2-3 times each year. Green - Stonehaven Weekly
Ecosystem Monitoring, Blue – The Fair Isle Current, North Sea, Red - Atlantic water north of Scotland. Orange - Atlantic water west of Scotland, Purple - the oceanic site in the Atlantic water near Faroe. Brown - Tiree Passage Mooring. The
map also shows the circulation of surface waters around the coast of Scotland. The red arrow is the flow of warm, salty Atlantic water along the shelf edge (the Shelf Edge Current). The blue and green and yellow arrows show the flow of
coastal waters. The yellow arrow shows the path of the the Scottish Coastal Current The blue arrow shows the inflow of mixed coastal / oceanic water past Fair Isle (the Fair Isle Current). The orange arrow shows the flow of water from the
middle of the Atlantic around the Faroe Islands. The thin broken line marks the edge of the continental shelf.
21
Figure 12. Weekly depth-averaged sea temperature and salinity at Stonehaven (Green line) from 1997 to the end of 2005. Data from offshore sites in the North Sea and North Atlantic are also included (Blue - Fair Isle Current, North
Sea, Red - North Atlantic water north of Scotland). The location of each site is plotted on Figure 10.
4
6
8
10
12
14
°C
1998 2000 2002 2004 200634.0
34.5
35.0
35.5
Temperature
Salinity
Figure 13. Weekly depth-averaged nutrients (nitrate, phosphate and silicate) at Stonehaven (Green line) from 1997 to the end of 2005. Data from offshore sites in the North. Sea and North Atlantic are also included (Blue - Fair Isle Current, North Sea. Red - North Atlantic water north of Scotland). The location of each site is plotted on Figure 11.
0
1
2
3
4
5
6
7
-
0
4
8
12
µg-a
t/l
µg-a
t/l
µg-a
t/l
0
0.2
0.4
0.6
0.8
Silicate
Nitrate
Phosphate
1998 2000 2002 2004 2006
22
The Tiree Passage Mooring
The Scottish Association of Marine Science (SAMS), Dunstaffnage Marine Laboratory has maintained an
oceanographic mooring in the Tiree Passage since 1981. The mooring sits between the Isle of Mull and
the Isles of Coll and Tiree in around 50m water depth on the west coast of Scotland. The mooring holds
instruments that measure the speed and direction of currents through the Tiree passage as well as the sea
water temperature and salinity.
Conditions of the west coast of Scotland are influenced by waters flowing in the Scottish Coastal Current as
well as water from the North Atlantic which flows along the continental shelf and under certain conditions
intrudes into shallower waters around the coast. The data from the Tiree mooring are being used to help
understand how and when water from the North Atlantic move into the Scottish Coastal Current.
Figure 14 shows temperature data from the Tiree mooring at a depth of 45 metres. The data, presented
as anomalies (see What is Normal?), are compared with data from Atlantic water to the west of Scotland
measured in the Rockall Section.
The trends in the two timeseries compare reasonably well, demonstrating the links between conditions
in the coastal waters with those further offshore. Analysis of the temperature from the Tiree dataset has
shown that a small proportion (17%) of the variability at this site can be accounted for by changes in the
North Atlantic, with a larger proportion (50%) being attributed to changes in the Scottish Coastal Current
(Inall, et al 2006).
In common with the other temperature datasets, the overall trend of the Tiree temperature data is one of
warming at a rate of around 0.6 per decade.
Figure 14 . A comparison between the changes of temperature at around 50m in the Tiree passage ( ) and in Atlantic water lying west of Scotland ( ) The data are shown as anomalies as the average values and the seasonal
cycle has been removed. The location of the measurement sites are shown in Figure 11
Further information:
Inall, M., Gillibrand P., Griffiths, C., MacDougal N., Blackwell K. (2006). Temperature, Salinity and Flow
Variability on the North-West European Shelf. submitted to Journal of Marine Systems, 2007.
Temperature
1980 1985 1990 1995 2000 2005-1.0
-0.8
-0.6
-0.4
-0.2
0
0.2
0.4
0.6
0.8
1.0
°C
Tiree passage
Atlantic water
23
Section 5: North Sea Fishing Grounds
Each year fisheries scientists from a number of different countries with an interest in the North Sea collaborate in
the International Bottom Trawl Survey (IBTS). The first-quarter survey is usually carried out in February and scientists
count the number of young fish in a grid of boxes in the North Sea. In each box, measurements of temperature
and salinity are also recorded to provide information about the conditions in which these young fish are living.
This information can also tell us how the winter bottom temperature and salinity of the North Sea have changed
over the last 30 years.
The general circulation of the North Sea is shown in Figure 11. As the North Sea is relatively shallow, conditions in
the North Sea are strongly influenced by those in the atmosphere, and so the sea conditions often reflect the local
weather conditions and have in the past shown a strong relationship with the NAO Index. However there are a few
other factors that have a marked effect on conditions. The first is input of freshwater running off land and through
rivers around the North Sea. This leads to the lowered salinity values in coastal areas, particularly in the south-
east near to the large rivers such as the Rhine and the Elbe. During the winter months the water flowing into the
North Sea from rivers is also colder than the seawater. The largest source of freshwater is the surface outflow from
the Baltic but this is not felt at the seabed level. The second major influence on conditions in the North Sea is the
inflow of warmer and saltier water from the North Atlantic. This occurs mainly in the northern North Sea, although
the influence of the Atlantic can also be observed in waters flowing through the English Channel.
As a result, conditions at the seabed in the northern North Sea are normally warmer and saltier than those in the
southern North Sea and they also show less variability from year to year. The average temperature and salinity
observed during the Quarter 1 surveys during the period 1971-2000 are shown in Figure 15, the influence of the
North Atlantic (warmer and saltier) and coastal freshwater input (colder and fresher) can be seen clearly.
Figures 16 and 17 show the difference in the winter bottom temperatures and salinity of the North Sea during the
IBTS survey of 2004 and 2005, compared to the normal conditions. To take into account the variability at each site,
the normalised anomalies are presented (see What is Normal? pp xx).
During both the 2004 and 2005 surveys, winter bottom temperatures were mostly higher than normal over most
of the North Sea. The winter of 2004 was warmer than that of 2005. In the southern North Sea during 2005, some
of the areas were very close to normal conditions (some even slightly below).
During the 2004 and 2005 surveys, winter bottom salinities were higher than normal in almost all areas. The
exceptions were some isolated coastal areas that had lower than normal salinities probably associated with strong
freshwater runoff events. During 2004, the strongest salinity anomalies were off the Scottish coast in the north-
western parts of the North Sea, where salinities reached 3.3 standard deviations above normal. During 2005 high
salinities were more widespread with areas around the Dogger Bank having salinities that reached 3.6 standard
deviations above normal. Very low salinities were observed around the Baltic Outflow and German Bight.
The changes in winter bottom temperature and salinity at selected fishing grounds since 1970 are shown in Figure
18. They are the Viking Bank, the Fladen Ground, the Dogger Bank and the German Bight. Figure 19 shows the area
used to select data for each of the four fishing grounds. There has been a change to the method used to calculate
these timeseries and as such the data are slightly different to that published in earlier Climate Status Reports.
24
4
5
6
7
8
60°N
50°N
60°N
50°N
10°E0°
10°E0°
35.0
34.9
34.8
34.7
34.6
<34.5
35.1
35.2
35.3
Average Winter Bottom Temperature 1971-2000
Average Winter Bottom Salinity 1971-2000
Figure 15. Average Winter Bottom temperature and salinity calculated from the ICES International Bottom Trawl Survey Quarter 1 data for the period 1971-2000. Average values have been calculated for data in each ICES statistical rectangle where there are more than 25 years of data. Note the salinity colour scale has a cutoff of 34.5, the average
salinity in the coastal regions can be as low as 30.2.
25
60°N
50°N
60°N
50°N
10°E0°
10°E0°
North Sea Winter Bottom Temperature Anomalies in Year 2004
North Sea Winter Bottom Salinity Anomalies in Year 2004
-1
-2
-3
0
1
2
3
-1
-2
-3
0
1
2
3
Figure 16. Winter Bottom temperature and salinity anomalies for 2004 from the ICES International Bottom Trawl Survey. Anomalies are normalized and expressed as standard deviations from the mean.
26
60°N
50°N
60°N
50°N
10°E0°
10°E0°
North Sea Winter Bottom Temperature Anomalies in Year 2005
North Sea Winter Bottom Salinity Anomalies in Year 2005
-1
-2
-3
0
1
2
3
-1
-2
-3
0
1
2
3
Figure 17. Winter Bottom temperature and salinity anomalies for 2005 from the ICES International Bottom Trawl Survey. Anomalies are normalized and expressed as standard deviations from the mean.
27
The timeseries (Figure 18) show clearly how the waters of the northern North Sea are much warmer than
those in the south. The observed winter temperatures in the northern grounds of the Viking Bank have never
fallen below 5°C (1970), while winter temperatures in the more southerly Dogger Bank have been as low
as 3°C (1979). In the German Bight area, extremely low temperatures (less than 0°C) were also recorded
in 1979. The large change in salinity from year to year in the southern coastal locations is demonstrated by
the timeseries of data from the German Bight which varies between 34.35 in 1970 and 31.50 in 1995.
These data also show how, since around 1995, the correlation between conditions in the North Sea and
the NAO Index has become less clear.
In all of the North Sea fishing grounds, the long-term trend in winter bottom temperatures is one of warming
as temperature have been generally rising after a cool period in the late-1970s. Winter temperatures at
the northern sites such as the Viking Bank and Fladen Ground have been warming at around 0.4-0.5°C per
decade. In the southern North Sea, at Dogger Bank and German Bight, the warming has been at a slower
Figure 18. Winter bottom temperature and salinity recorded during the International Bottom Trawl Survey at selected North Sea fishing grounds. The thin black line shows the changes in the North Atlantic Oscillation (NAO) Winter Index
during this period. The linear trend since 1970 is also shown (black line).
28
rate of around 0.2-0.3°C per decade. Overall, using this IBTS Quarter 1 dataset, a warming trend is observed
in all regions of the North Sea with average values of around 0.4°C per decade. (Figure 20).
Winter bottom salinities show more variability than temperatures, particularly in coastal regions. In the
northern North Sea, winter bottom salinities have also been increasing since 1970 and this reflects the trend
towards higher salinities across the whole North Atlantic. Further south, it is more difficult to determine
a clear trend. In the German Bight which is strongly influenced by freshwater runoff, there appears to be
a strong decreasing trend in salinity (Figure 18). However, the interannual variability in freshwater runoff
means that it is difficult to have confidence in trends calculated in the shallow coastal areas. Overall in the
southern North Sea, there is no clear trend in the salinity data (Figure 20).
Figure 19. The location of selected fishing grounds, the data are shown in Figure 20, where bottom winter temperature and salinity have been measured since 1970 as part of the ICES IBTS survey. They are; VB - the Viking Bank
(60°N, 2°E); FG - the Fladden Ground (58.5°N, 1°W); DG - the Dogger Bank (54.5°N, 3°E); GB - the German Bight (54.5°N, 8°E).
V B
F G
G BD B
29
Figure 20. Linear trend in Winter Bottom temperature and salinity calculated from the ICES International Bottom Trawl Survey Quarter 1 data for the period 1971-2005. Units are per decade. Values calculated from linear fit to data in
ICES rectangles with more than 30 years of data. Note that the high interannual variability in the coastal regions make a salinity trend difficult to determine with confidence, data have been rejected when root mean squared error was
greater than 0.25.
60°N
50°N
60°N
50°N
10°E0°
10°E0°
Linear Trend Winter Bottom Temperature 1971-2005
Linear Trend Winter Bottom Salinity 1971-2005
0.00
0.06
0.04
0.02
-0.02
-0.04
-0.06
0.00
0.06
0.04
0.02
-0.02
-0.04
-0.06
30
The Atlantic Multidecadal Oscillation
We can put changes observed in the seas around Scotland into a wider global context by considering the average changes that have occurred across the whole of the North Atlantic. By adding together all of the data collected in the North Atlantic (between the latitudes of 0-70°N), a timeseries of average North Atlantic surface temperature has been prepared by National Oceanographic Administration Association (NOAA) in the USA. This timeseries extends back to the start of the century and it shows what the long term pattern of variability in sea surface temperatures has been (Figure 21).
Since the records began in the late 1880’s it appears that as well as having a long term warming trend, the surface temperature of the North Atlantic has alternately switched between warmer and cooler phases that last around 20-40 years. This oscillation has been called the Atlantic Multidecadal Oscillation (AMO). The data show that the Atlantic was in a warm phase during the late 1950’s and early 1960’s and a cooler phase in the mid 1970’s. It is thought that these changes are natural, driven by changes in the circulation of the North Atlantic Ocean although at the moment the processes are not well understood. This long term pattern of variability makes it quite difficult to separate changes caused Global Climate Change and changes caused by natural variability, particularly in cases where observations only extend back 30 years.
Figure 21. Timeseries of average sea surface temperature in the North Atlantic (0-70°N). Data are calculated by NOAA from the HADISST2 dataset in the North Atlantic. The dark blue line shows annual average anomalies relative to the
1971-2000 mean value. The pale blue line is a 10 year running mean. Source Data: http://www.cdc.noaa.gov/Pressure/Timeseries/AMO/
We know that global average surface temperatures have increased over the last century by about 0.74°C (0.074°C per decade). But over the last 30 years the observed changes have been much more rapid. In the Northern Hemisphere, the temperature trend calculated for the period 1979-2005 was around 0.2°C per decade. In the seas around Scotland we have observed changes in sea surface temperature of between 0.2°C and 0.6°C per decade.
This is partly to be expected as regional changes are likely to be more extreme than the smoothed trend we see in the global average. For ocean temperatures, it is also partly because we are calculating trends since around 1970 when both the AMO and the NAO were at their lowest. Because of this, over the last 30 years we could say we have observed a period of enhanced climate change. It is important to bear in mind the long-term pattern of variability when trying to interpret trends derived from shorter datasets. Although the trends calculated from data since 1970 are real estimates of the change observed during that period, they are not necessarily indicative of the underlying long term trend.
Although the AMO is thought to be a natural process, it is not yet clear whether the patterns of high and low we have seen in the past will be continued in the future. Some scientists believe that the AMO might start to decrease and this decrease will be large enough to temporarily reduce the observed warming trend. More research is needed to help us understand the internal processes in the ocean that are the cause of the AMO.
Further information:
Enfield, D.B., A.M. Mestas-Nunez, and P.J. Trimble, (2001): The Atlantic Multidecadal Oscillation and its relationship to rainfall and river
flows in the continental U.S., Geophys. Res. Lett., 28: 2077-2080.
Kerr, R. A., (2005) Atlantic climate pacemaker for millennia past, decades hence? Science, 309, 43-44.
The coastal temperature time series give us a good indication of changes that are occurring in the Scottish
coastal environment. In order to put these changes in a broader context we can compare the coastal data
to those collected further offshore in the seas surrounding Scotland and in the wider North Atlantic.
Firstly we can consider the average changes that have occurred across the whole of the North Atlantic. The
NOAA timeseries of average North Atlantic surface temperatures extends back to the start of the century and
gives us a good idea of the long term pattern of variability (Figure 21). It shows that in the North Atlantic
there have been alternating periods of warming and cooling and also that the temperatures observed in
the last decade have been the warmest in more than 100 years.
Each year the International Council for the Exploration of the Sea (ICES) publishes a report that summarises
conditions in the North Atlantic, prepared by researchers who compare their own findings from each region.
The ICES Report on Ocean Climate (known previously as the ICES Ocean Climate Status Summary) provides
a comprehensive overview of conditions in the North Atlantic (Figure 22).
For 2005 the report stated: ‘The upper layers of the North Atlantic and Nordic Seas were warmer and more
saline than the long-term average. The trend in the last decade (1995–2005) has been of warming and
increasing salinity in the upper ocean.’
Figure 22. Temperature in the upper layers of the North Atlantic in 2005 compared to the long term mean value (1971-2000). Anomalies are normalised with respect to the standard deviation. Figure of 2 means the data was
2 standard deviations above the mean. Reds are positive/warm and blues are negative/cool). Figure extracted from Figure 1 of the IROC 2005, number within circles relate station numbers as referenced in that
report.
60°E
30°E
0°30°W60°W
90°W
120°W
1
2
3
4
5
6 7
8
9 10
11
12
13
141516
17 18
19
20
21
2223
24
25
2627
28
-1 -2 -30123
32
Researchers at FRS monitor conditions at key points in the offshore and oceanic waters around Scotland,
three times each year. These measurements, some of which have been made for the last 100 years, provide
us with invaluable information about changes in the marine environment around Scotland.
Figure 11 shows the location of key sites where the FRS staff and researchers from other organisations
make their measurements. The monitoring sites are plotted on a map which also shows a simplified path
of the main ocean currents flowing around Scotland.
Using datasets which are collected at a number of different stations and at various depths, the data are
analysed to determine the properties of water that travels from the North Atlantic to these monitoring points.
We can determine the properties of Atlantic Water at the following four key sites: West of Scotland, Around
Faroe, North of Scotland and the Inflow to the North Sea. A brief description for each of these datasets can
be found below. These datasets are also included in the IROC report and the temperature data from 2005
are plotted along with those from other datasets in Figure 22.
Atlantic Water North of ScotlandResearchers from FRS and Faroese Fisheries Laboratory (FFL) monitor a set of stations across the Faroe
Shetland Channel. Data from the Shetland side of the channel (red square in Figure 11) are used to represent
conditions in the warm Atlantic water that flows along the continental shelf to the north of Scotland.
Atlantic Water around FaroeData from the Faroese side of the Faroe Shetland channel (orange square in Figure 11) are used to represent
conditions in Atlantic waters flowing around Faroe.
Atlantic Water, West of ScotlandResearchers from the Scottish Association for Marine Science (SAMS) in Oban, the National Centre for
Oceanography, Southampton (NOC) and FRS monitor a set of stations across the Rockall Trough to the west
of Scotland. Data from this site (purple square in Figure 11) are used to represent conditions in Atlantic
waters flowing northwards along the continental shelf edge and around Scotland.
Fair Isle Current, Atlantic Water inflow to the North Sea Researchers from FRS monitor a set of stations to the east of the Orkney Islands (blue square in Figure
11). Data from this site, within the Fair Isle Current that flows into the North Sea, have been chosen as an
indicator of the exchange of water between the North Atlantic and the North Sea.
In the Faroe Shetland Channel, the data collected by FRS and FL form one of the longest timeseries of
regular measurements in the global ocean. The changes in temperature we see at this point follow a similar
pattern to those in the wider North Atlantic, which is to be expected because Atlantic Water passes through
the Faroe Shetland channel on its way into the Nordic Seas. Since reaching a minimum value in the mid
to late 1980s, the overall trend in the data at both sites in the Faroe Shetland Channel has been one of
increasing temperature.
In the North Atlantic waters to the north of Scotland the temperatures during 2003 were the highest observed
at any time in the last 100 years (Figure 23). Since then temperatures have decreased slightly, but in the
Atlantic waters around Faroe temperatures remained between 0.5°C and 0.6°C warmer than normal whilst
on the other side of the channel (north of Scotland) the surface waters were between 0.4°C and 0.5°C
warmer than normal in 2004 and 2005 respectively.
33
Figure 23. Changes in temperature and salinity within the two flows of Atlantic water lying to the north of Scotland. The red line indicates changes in the Atlantic water at the Scottish shelf edge. The orange line indicates changes in the
flow around the Faroe Islands. The location of each measurement site is shown in Figure 11. Changes in the average North Atlantic surface temperatures are also shown for comparison (grey line).
Salinity
Year
-0.05
-0.10
-0.05
0
0.05
0.10
0.15
Temperature
1900 1920 1940 1960 1980 2000
-1.0
-0.5
0
0.5
1.0
°C
Figure 24. A comparison between the changes of temperature and salinity in the Atlantic water north of Scotland (red line) and in Atlantic water lying west of Scotland (purple line). The location of each measurement site is shown in
Figure 11. Note that the values are all relative to zero, as the seasonal cycle has been removed. The data has also been smoothed.
Salinity
1970 1975 1980 1985 1990 1995 2000 2005Year
-0.10
-0.05
0
0.05
0.10
Temperature
-0.10
-0.05
0
0.05
0.10
34
Figure 25. A comparison between the changes of temperature and salinity in the Fair Isle inflow to the North Sea (blue line) and in the Atlantic water north of Scotland (red line). The location of each measurement site is shown in
Figure 11. Note that the values are all relative to zero, as the seasonal cycle has been removed. The data has also been smoothed.
The salinity of the surface layers in the North Atlantic follows a similar pattern of variability to the temperature
(Figure 23). In the North Atlantic waters to the north of Scotland and around Faroe, higher than normal
salinities have been observed in the past around the 1950’s to 1960’s and then declined to a minimum
value by the end of the 1970’s. Since then, as for temperature, the trend has been towards an increase in
salinity. This is also seen in observation made in the wider North Atlantic.
Atlantic waters to the north and west of Scotland show the same general pattern of change over the last 25
years. Temperature in the Atlantic waters west of Scotland were above normal in 2004 and 2005.
The highest values of the 20 year long record were observed in 2005, with temperatures of 0.6°C warmer
than normal. Salinity has also been increasing since 1975. The highest salinity values were observed during
2003 and have reduced slightly since then (Figure 24).
The temperature of the water in the Fair Isle Current was lower in 2004 and 2005 than it had been in 2003
but was still between 0.5°C and 0.6°C warmer than normal. The salinity in the Fair Isle Current appears to
vary with a cycle that has a period of around 7 years (Figure 25). This is closely linked to changes in the
weather patterns over the North Sea and can be explained to some extent by the NAO Index.
-1.2
-0.8
-0.4
0
0.4
0.8
1.2
-0.25
-0.20
-0.15
-0.10
-0.05
0
0.05
0.10
0.15
0.20
0.25Salinity
1970 1975 1980 1985 1990 1995 2000 2005Year
Temperature
°C
35
The Sir Alister Hardy Foundation for Ocean Science (SAHFOS) has been sampling plankton in the seas around
Scotland since the late 1940’s using an instrument known as the Continuous Plankton Recorder (CPR) which
is designed to be towed from merchant ships. As these ships, usually cargo vessels, travel on their regular
routes through the North Sea and North Atlantic they also collect regular near-surface plankton data.
The CPR works by filtering plankton from the water over long distances (up to 500 nautical miles) on a
moving band of silk which acts as a filter. The filter silk band is wound through the CPR on rollers turned
by gears, which are powered by an impeller. On return to the SAHFOS laboratory, the silk is removed from
the mechanism and divided into samples (known as blocks) nominally representing 10 nautical miles of
towing. The plankton in these samples are then analysed according to standard procedures.
Before cutting, the colour of the silk is compared to a colour chart and given a ‘greenness’ value of 0
(no greenness), 1 (very pale green), 2 (pale green) or 6.5 (green). Other colours are not recorded. This
index, known as the Phytoplankton Colour Index gives a an approximate indication of the phytoplankton
concentration.
After cutting into blocks, microscopic analysis of the plankton is undertaken. After analysis, the counts are
checked and added to the CPR database, which contains details of the plankton found on over 170,000
samples taken since 1946 in the North Sea and North Atlantic Ocean.
Figure 26. Trends in surface Phytoplankton Colour Index and Calanus Finmarchicus abundance for four areas around Scotland. Areas are shown in Figure 26. The data are yearly mean normalised anomalies. The seasonal cycle calculated for the period 1971-2000 has been removed. Annual and seasonal averages were calculated taking into
account the number of samples that each sample was based upon. Anomalies have been normalised using the standard deviation.
36
Figure 27 Standard Areas for Continuous Plankton Recorder Data around Scotland.
Figure 26 shows the trends in phytoplankton colour index since 1945 and the abundance of the omnivorous
copepod Calanus finmarchicus since 1950 in four standard areas around Scotland (Figure 27). As we are
interested in long-term trends, we show the data not as the values actually measured but as ‘anomalies’.
The phytoplankton colour index has been increasing in all areas over the last 60 years and this trend
continued in 2004 and 2005. Analysis of the phytoplankton colour index has also shown that the seasonal
pattern has changed from one where there is an identifiable spring and autumn bloom to one where there
is a single bloom throughout the summer (data not shown).
The time series of Calanus finmarchicus in the North Sea also show that there has been a marked decline in
abundance, particularly in the North Sea areas of C2 and B2 (Figure 27). During the 1960’s the biomass of
Calanus finmarchicus constituted up to 70% of all the zooplankton in the North Sea, but by the late 1990s
the abundance had declined to only around 35%.
It is known that whilst Calanus finmarchicus has declined the abundance of a different species, Calanus
helgolandicus, has increased. These changes in abundance are thought to be related to long-term changes
in climate, as Calanus finmarchicus is a species associated with colder waters and Calanus helgolandicus
is a species associated with warmer waters.
Further Information:
Edwards, M., Johns, D.G., Licandro, P., John, A.W.G. & Stevens, D. P. 2006. Ecological Status Report: results
from the CPR survey 2004/2005. SAHFOS Technical Report, 3: 1-8. ISSN 1744-0750
0° 30°W
50°N
60°N
B2
C2C4
37
Sampling from Merchant Vessels
The use of merchant ships to make scientific measurements is quite widespread in marine science. The
ships are referred to as ‘vessels of opportunity’ or voluntary observing ships (VOS) and they play a vital
role in helping us to understand the climate of the oceans. One example is the use of merchant ships to
collect important meteorological information.
Merchant vessels have also been used to collect large amounts of data about the temperature of the
oceans, using a small probe known as an expendable bathythermograph (XBT). Since around 1970, these
instruments have been dropped from vessels at regular intervals along the vessels track and measure the
temperature of the ocean as they fall to the seabed, sending this data back to the vessel through a fine
copper wire. More recently some vessels have been fitted with instruments that measure ocean currents
and these measurements provide extremely valuable information about changes in the flow of ocean waters
from region to region.
In more recent years scientists have also begun to use cargo and passenger ferries to collect continuous
information about the surface waters. In 2007, FRS started to collect data from the MV Hascosay, a NorthLink
Ferry that travels a regular route between Aberdeen and Lerwick. This vessel, which is already used to collect
plankton data as part of the CPR programme, will now measure the sea surface temperature, salinity and
fluorescence as it travels twice per week along the route. The data will provide FRS with additional useful
Offshore DataOceanographic data at Rockall, west of Scotland are collected by the following organisations:
SAMS, Dunstaffnage Marine Laboratory, UK.
http://www.sams.ac.uk/dml/
National Oceanography Centre, Southampton, UK.
http://www.noc.soton.ac.uk
SAMS also provided the temperature timeseries from Tiree.
39
The International Council for the Exploration of the Sea (ICES)ICES publish the Report on Ocean Climate each year. The report can be downloaded from the website at:
http://www.ices.dk/marineworld/oceanclimate.asp
ICES also maintain a huge database of oceanographic data that covers the whole of the ICES region of the North
Atlantic.
http://www.ices.dk/ocean
North Atlantic Oscillation (NAO)The NAO Winter Index is prepared by Dr James Hurrell, Climate Analysis Section, Climate and Global Dynamics
Division, the US National Center for Atmospheric Research.
http://www.cgd.ucar.edu/cas/jhurrell/indices.html
North Atlantic DatasetsThe timeseries of North Atlantic surface temperatures are calculated from a gridded sea surface temperature dataset
know as the HADISST1 dataset. The data are provided by the NOAA in the USA.
http://www.cdc.noaa.gov/Pressure/Timeseries/AMO/
Climate Change LinksPrevious Scottish Ocean Climate Status Reports http://www.frs-scotland.gov.uk/Ocean_Climate
North Sea Temperature MapsWeekly maps of sea surface temperature in the North Sea