J. ISSAAS Vol. 22, No. 1: 30-41 (2016) 30 SCREENING METHOD FOR IRON TOLERANT RICE SUITED FOR TIDAL SWAMP AREA Iskandar Lubis 1) , Aidi Noor 2 , Munif Ghulamahdi 3 , Muhammad Ahmad Chozin 3 , Khairil Anwar 4 and Desta Wirnas 5 1 Laboratory of Crop Production, Bogor Agricultural University, Jalan Meranti 1, Kampus IPB Dramaga, Bogor 16680, Indonesia 2 Agricultural Technology Research Agency, Jl. Panglima Batur Barat No. 4, Banjarbaru, Kalimantan Selatan 70711, Indonesia 3 Crop Ecophysiology Laboratory, Bogor Agricultural University, Jalan Meranti 1, Kampus IPB Dramaga, Bogor 16680, Indonesia 4 Swamp Land Agricultural Research Agency, South Kalimantan, Indonesia, Jl. Kebun Karet, Lok Tabat, Banjarbaru 70712, Kalimantan Selatan, Indonesia 5 Plant Breeding Laboratory, Bogor Agricultural University, Jalan Meranti 1, Kampus IPB Dramaga, Bogor 16680, Indonesia Corresponding author: [email protected](Received: January 20, 2015; Accepted: May 10, 2016) ABSTRACT Previous research conducted in the greenhouse at the Cikabayan University Farm, Bogor Agricultural University, Indonesia from July to September 2010, using cultivar IR 64 and Margasari found that Fe concentration in solution that causing low Fe toxicity symptoms was 52 ppm Fe, moderate toxicity was 143 ppm Fe, and severe toxicity 325 ppm Fe. This research aims at: 1) To observe the effects of two levels of Fe concentrations on growth of rice; 2) to find out rice genotypes that tolerant or semi tolerant to iron toxicity; 3) to verify toxicity levels in the green house and in the field. The green house experiment was conducted at the Cikabayan University Farm, Bogor Agricultural University from July to September 2010 using Yoshida’s nutrient solution with Fe added according to the treatment levels. This research used factorial design with two factors, which are: Fe concentrations (143 and 325 ppm Fe) and 20 paddy genotypes. The field experiment was done in two tidal swamp areas, in Belandean and Danda Jaya, Barito Kuala District, South Kalimantan Province, Indonesia, consisting of four genotypes chosen in the green house experiment and IR64 as a control. Results showed that increasing in Fe concentration from 143 to 325 ppm and period of Fe stress increase Fe toxic symptoms in rice. Four paddy genotypes that had been selected in the green house (Inpara-1, Inpara-2, Inpara-4, dan TOX4136 line) showed lower Fe toxic symptom after planted in the tidal swamp area. Inpara-1 and Inpara-4 genotypes indicated as tolerant genotypes to iron toxicity and perform higher yield than the other genotypes in both of field experimental locations in the tidal swamp area. Fe concentration at 325 ppm in Yoshida’s solution can be used for screening of rice tolerant genotypes to iron toxicity. Key words: iron toxicity, rice geonotypes, green house, field INTRODUCTION Iron toxicity is one limiting factor of rice production in the paddy field; it reportedly occurs in Asian countries such as China, India, Indonesia, Thailand, Malaysia, and Philipines (Asch et al. 2005). Specific visual symptoms related to iron toxicity, are primarily associated with accumulation of oxidation products of polyphenols which is called bronzing or yellowing in rice (Yamauchi and
Transcript
J. ISSAAS Vol. 22, No. 1: 30-41 (2016)
30
SCREENING METHOD FOR IRON TOLERANT RICE SUITED FOR
TIDAL SWAMP AREA
Iskandar Lubis1), Aidi Noor2, Munif Ghulamahdi3, Muhammad Ahmad Chozin3,
Khairil Anwar4 and Desta Wirnas5
1 Laboratory of Crop Production, Bogor Agricultural University, Jalan Meranti 1,
Kampus IPB Dramaga, Bogor 16680, Indonesia 2 Agricultural Technology Research Agency, Jl. Panglima Batur Barat No. 4, Banjarbaru,
Kalimantan Selatan 70711, Indonesia 3 Crop Ecophysiology Laboratory, Bogor Agricultural University, Jalan Meranti 1,
Kampus IPB Dramaga, Bogor 16680, Indonesia 4 Swamp Land Agricultural Research Agency, South Kalimantan, Indonesia, Jl. Kebun Karet,
Lok Tabat, Banjarbaru 70712, Kalimantan Selatan, Indonesia 5 Plant Breeding Laboratory, Bogor Agricultural University, Jalan Meranti 1,
(Received: January 20, 2015; Accepted: May 10, 2016)
ABSTRACT
Previous research conducted in the greenhouse at the Cikabayan University Farm, Bogor Agricultural University, Indonesia from July to September 2010, using cultivar IR 64 and Margasari
found that Fe concentration in solution that causing low Fe toxicity symptoms was 52 ppm Fe,
moderate toxicity was 143 ppm Fe, and severe toxicity 325 ppm Fe. This research aims at: 1) To observe the effects of two levels of Fe concentrations on growth of rice; 2) to find out rice genotypes
that tolerant or semi tolerant to iron toxicity; 3) to verify toxicity levels in the green house and in the
field. The green house experiment was conducted at the Cikabayan University Farm, Bogor
Agricultural University from July to September 2010 using Yoshida’s nutrient solution with Fe added
according to the treatment levels. This research used factorial design with two factors, which are: Fe
concentrations (143 and 325 ppm Fe) and 20 paddy genotypes. The field experiment was done in two
tidal swamp areas, in Belandean and Danda Jaya, Barito Kuala District, South Kalimantan Province,
Indonesia, consisting of four genotypes chosen in the green house experiment and IR64 as a control.
Results showed that increasing in Fe concentration from 143 to 325 ppm and period of Fe stress
increase Fe toxic symptoms in rice. Four paddy genotypes that had been selected in the green house
(Inpara-1, Inpara-2, Inpara-4, dan TOX4136 line) showed lower Fe toxic symptom after planted in the
tidal swamp area. Inpara-1 and Inpara-4 genotypes indicated as tolerant genotypes to iron toxicity and perform higher yield than the other genotypes in both of field experimental locations in the tidal
swamp area. Fe concentration at 325 ppm in Yoshida’s solution can be used for screening of rice
tolerant genotypes to iron toxicity.
Key words: iron toxicity, rice geonotypes, green house, field
INTRODUCTION
Iron toxicity is one limiting factor of rice production in the paddy field; it reportedly occurs
in Asian countries such as China, India, Indonesia, Thailand, Malaysia, and Philipines (Asch et al. 2005). Specific visual symptoms related to iron toxicity, are primarily associated with accumulation
of oxidation products of polyphenols which is called bronzing or yellowing in rice (Yamauchi and
Screening method for iron tolerant rice…..
31
Yoshida, 1981). Iron toxicity in paddy results in poor growth, limited tillering and as a consequence,
low yield or a failed harvest (Audebert and Sahrawat, 2000). Many researches show iron toxicity
could decrease yield by around 12-100% (Sahrawat , 2004; Sahrawat, 2010).
Iron toxicity causes physiological stress in rice, and it is common in ultisol, oxisol, and sulfic
acid tidal swamp land with high iron concentration (Sahrawat 2004). Tidal swamp area in Indonesia is 20.1 million ha, and about 6.7 million ha is sulfic acid soils (Alihamsyah, 2004), with high pyrites
and soluble Fe content that potentially cause iron toxicity in paddy. Iron toxicity is not only caused
by higher absorption of Fe+2 in paddy tissues, which is enhanced by Fe concentration in the soil, but
also relates with other factors such as nutrient imbalance and reductive environment condition with
poor drainage (Sahrawat , 2004). Iron toxicity also relates with sensitive rice cultivar such as IR64
that causes low productivity (Suhartini, 2004; Suhartini and Makarim, 2009). A sensitive cultivar
(IR64) performed lower yield (58%) compared to a tolerant cultivar (Margasari) in tidal swamp land
in South Kalimantan, in which soil Fe concentration was 719 ppm and pH 3.84(Noor et al. 2005).
Using tolerant genotype against iron toxicity is the cheaper and easier way for farmers to solve iron
toxicity problems. In order to get higher productivity, it is necessary to perform early selection for
paddy genotypes that can tolerate high iron levels with potentially higher yield.
One of the problems in the evaluation for rice genotypes that tolerant to iron toxicity is if the
number of genotypes to be evaluated is large, and the other problem is variation in Fe concentrations
in the soils. As a consequence, results of selection for tolerant genotypes may not be consistent
(Audebert and Sahrawat, 2000). In order to eliminate environmental variation in the field, selection
for tolerant genotypes can be done under the controlled environment in the green house, using nutrient
solution culture or hydroponics (Asch et al. 2005). An appropriate selection method with a short
process period in the green house is important in order to get tolerant rice genotype for production in
the field. A screening method in the green house having a high correlation with performance and
productivity in the field is necessary in order to identify tolerant rice genotype in a fast, cheap and
precise way. Previous researches showed that there are differences in rice selection methods using
nutrient solution in the green house, primarily Fe concentrations in nutrient solution, solution pH, seedling age and period of Fe stress (Asch et al. 2005; Dorlodot et al. 2005; Aung, 2006; Kpongor,
2003). This research therefore sought to observe the effects of two levels of Fe concentrations on the
growth of rice; to select rice genotypes that are tolerant or semi tolerant to iron toxicity and to verify
the iron toxicity levels in the green house and in the field in order to develop a better method for
screening.
MATERIALS AND METHODS
Experiments were done in a green house at the Cikabayan University Farm, Bogor
Agricultural University from July to September 2010, and in two locations in a tidal swamp area in
Barito Kuala, South Kalimantan from Fabruary to July 2011.
Soil analysis
Soil analysis was done in the Swamp Land Agricultural Research Agency in Banjarbaru,
South Kalimantan. Soil pH was measured in a 1:1.5 (w/v) water solution using a pH meter. Clay
minerals were identified by X-ray diffraction analysis (Rigaku RAD-2RS Diffractometer). The
content of organic carbon (C) in soil was measured with a NC analyzer (Sumigraph NC analyzer NC-
800-13 N, Sumika Chem. Anal. Service). Available P content was obtained by the Bray 1 method
(Bray and Kurtz 1945), while the absorbance at 693 nm was determined using a UV-VIS
spectrophotometer (UV-1200, Shimadzu Corporation, Japan). Cation exchange capacity (CEC) was
obtained by extraction with 1 mol L-1 NH4OAc pH 7.0 and the contents of exchangeable bases
(calcium and magnesium) were determined by atomic absorption spectrophotometry (AA-640-12,
J. ISSAAS Vol. 22, No. 1: 30-41 (2016)
32
Shimadzu Corporation, Japan) while those of exchangeable potassium and sodium were determined
by flame emission spectrophotometry (AA-640-12, Shimadzu Corporation, Japan). Base saturation
was defined as the ratio of total exchangeable bases to CEC, expressed as a percentage. Exchangeable
Al was extracted with 1 mol L-1 KCl. Exchangeable Al was extracted with 1 mol L-1 KCl and
measured with acid-base titration. Iron (Fe) was exracted with 1 mol L-1 NH4 OAc (ammonium
acetate) and then Fe in solution was determined by atomic absorption spectrophotometry. Pyrite was determined by oxidizing pyrite with hydrogen peroxide and soluble sulphate, which was equivalent
with pyrite, was measured by turbidimetry.
Green house experiments
Rice genotypes tolerant to iron toxicitywere evaluated under two environmental stress
conditions which caused moderate and severe iron toxicity symptoms. Previous research
demonstrated that 52 ppm Fe concentration in solution caused low Fe toxicity symptoms with a
score of 3 in IR64. Moderate toxicity with score = 5 was observed in 143 ppm Fe, and severe
toxicity with score 9 was observed in 325 ppm Fe (Noor et al. 2012). In the experiment, a factorial in randomized block design was used with two factors, namely (1) Fe concentrations: 143
ppm, moderate Fe toxicity symptom and 325 ppm, severe Fe toxicity symptom) and (2) Genotypes:
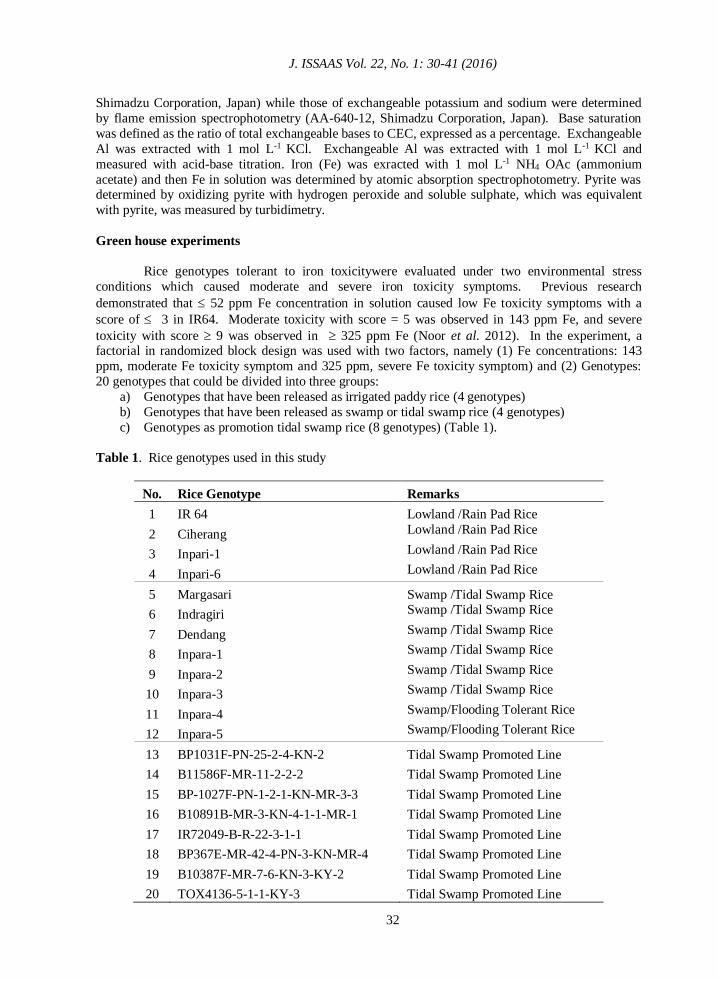
20 genotypes that could be divided into three groups:
a) Genotypes that have been released as irrigated paddy rice (4 genotypes)
b) Genotypes that have been released as swamp or tidal swamp rice (4 genotypes)
c) Genotypes as promotion tidal swamp rice (8 genotypes) (Table 1).
Table 1. Rice genotypes used in this study
No. Rice Genotype Remarks
1 IR 64 Lowland /Rain Pad Rice
2 Ciherang Lowland /Rain Pad Rice
3 Inpari-1 Lowland /Rain Pad Rice
4 Inpari-6 Lowland /Rain Pad Rice
5 Margasari Swamp /Tidal Swamp Rice
6 Indragiri Swamp /Tidal Swamp Rice
7 Dendang Swamp /Tidal Swamp Rice
8 Inpara-1 Swamp /Tidal Swamp Rice
9 Inpara-2 Swamp /Tidal Swamp Rice
10 Inpara-3 Swamp /Tidal Swamp Rice
11 Inpara-4 Swamp/Flooding Tolerant Rice
12 Inpara-5 Swamp/Flooding Tolerant Rice
13 BP1031F-PN-25-2-4-KN-2 Tidal Swamp Promoted Line
14 B11586F-MR-11-2-2-2 Tidal Swamp Promoted Line
15 BP-1027F-PN-1-2-1-KN-MR-3-3 Tidal Swamp Promoted Line
16 B10891B-MR-3-KN-4-1-1-MR-1 Tidal Swamp Promoted Line
17 IR72049-B-R-22-3-1-1 Tidal Swamp Promoted Line
18 BP367E-MR-42-4-PN-3-KN-MR-4 Tidal Swamp Promoted Line
19 B10387F-MR-7-6-KN-3-KY-2 Tidal Swamp Promoted Line
20 TOX4136-5-1-1-KY-3 Tidal Swamp Promoted Line
Screening method for iron tolerant rice…..
33
Every experimental unit was replicated three times. Rice was transplanted into a plastic box
with sand as a medium, where half concentration of Yoshida’s nutrient solution at pH 5.0 was added.
After 14 days, single seedlings were transferred into a PVC plastic pot (1200 ml capacity; 7.5 cm x 23
cm, diam. x length) with half concentration of Yoshida’s nutrient solution (1000 ml) (Yoshida et al.
1976) at pH 4.5, and acclimated for 7 days. After acclimatisation, it was treated using FeSO4 for two
levels of Fe concentrations at pH 4.0 (Fig. 1). The top of the plastic pot was covered with a plastic liner to minimize oxygen loss and solution media evaporation. The solution with Fe was added
everyday to replace the solution that was lost by absorption and evapotranspiration and nutrient
culture was replaced once a week.
(a) (b) (c)
Fig. 1. Research activities in the green house: (a) Rice seedling in sand box, (b) Rice seedling at
14 days age transferred to a plastic pot (PVC) and acclimated for 7 days. (c) Rice that had
been treated with Fe and grown for 4 weeks.
Observations conducted consisted of Fe toxicity levels on rice for a period of 1 to 4 weeks after transplanting, tiller numbers, root length, shoot weight and root weigt at 4 weeks after
transplanting. The toxicity levels were indicated by leaf damage starting from the tip leaf that became
brown and then black, and the scoring of iron toxicity symptoms referred to IRRI-INGER (1996),
modification by Asch et al. (2005) and Aung (2006) (Table 2). Four genotypes were chosen for the
field trial according to its tolerance to Fe toxicity (scoring) and plant growth.
Table 2. Fe toxicity symptom scores in rice
Fe Score Fe Toxicity in Leaf (%) Tolerancy Levels
1 0 Highly tolerant
2 1-9 Tolerant
3 10-29 Tolerant
5 30-49 Moderately tolerant
7 50-69 Sensitive
9 70-89 Very sensitive
10 90-100 Very sensitive
Sources : IRRI-INGER (1996), modification by Asch et al. (2005) and Aung (2006)
Verification of Iron Toxicity Symptoms in the Field
Verification of tolerant rice genotypes in the green house was done in field at two locations
that potentially have different levels of iron toxicity stress. The field experiment was done in a B
J. ISSAAS Vol. 22, No. 1: 30-41 (2016)
34
type of tidal swamp area in Belandean and Danda Jaya, Barito Kuala District, South Kalimantan
Province. The B type of tidal swamp is characterized by temporary flooding by a big tide (sea or
river) which occurs periodically. Rice genotypes used for the experiment were four genotypes chosen
from the green house experiment. IR 64 was used as a sensitive control. Four genotypes TOX4136,
Inpara-1, Inpara-2, and Inpara-4 which have been selected based on the concentration of 325 ppm Fe
at 4 week stress with Fe toxicity symptom score 5.0 (moderate) and one sensitive variety IR 64 (score Fe 7.7) based on the results of the previous experiment (Noor et al., 2012). The treatments were
replicated three times and the 21 day olds seedlings were transplanted into (4 x 5) m2 of plot at 20 x
20 cm2 spacing with two seedlings per hole. Half of nitrogen and all of P and K fertilizer were applied
at 7 days after transplanting, and the other half of N was given four weeks after first application.
Observations on iron toxicity symptom were done at 4 and 8 weeks after transplanting.
Statistical analysis
Data analysis was done using analysis of variance, and the Least Significant Difference at
95% confidence level used for advance analysis.
RESULTS AND DISCUSSION
Green House Experiments
Iron toxicity symptom on rice in green house
Generally, iron toxicity symptoms in irrigated paddy (4 genotypes), swamp rice (8
genotypes), and promoted lines (8 genotypes) increased with increasing in iron toxicity, and period of
observation and iron concentration in nutrient solution (Fig. 2).
In 143 ppm Fe condition, iron toxicity symptoms in the three genotype groups were almost
similar, except in the week 4th iron toxicity symptom scores in paddy rice were higher than the other groups. Under 325 ppm Fe condition, paddy rice showed toxicity symptom scores higher than the
other groups for all of observation periods. Average different iron toxicity symptom scores between
143 ppm Fe and 325 ppm Fe conditions at 1, 2, 3, and 4 weeks observation were 0.20, 1.88, 2.20 and
3.00 (Fig. 2).
Fig. 2. Change of Fe toxicity average score of irrigated, swamp and promoted line rices in two
In the second week of observation, iron toxicity symptom scores significantly different
among treatments, especially for 325 ppm Fe (2.3 – 6.3), Iron toxicity symptom in the second week
at 143 and 325 ppm Fe treatments were different only for genotypes such as IR64 Ciherang, Inpari-
1, Inpari-6, Indragiri, Dendang, and Inpara-1 (Table 3).
Table 3. Interaction between genotype and Fe concentrations for Fe toxicity symptoms at 2 and 4 weeks after treatment.
No. Rice genotype
2 Weeks 4 Weeks
143
ppm Fe
325
ppm Fe
143
ppm Fe
325
ppm Fe
1 IR 64 2.7
B
a 6.3
A
a 5.0
B
a 7.7
A
ab
2 Ciherang 3.0
B
a 5.7
A
ab 4.3
B
ab 6.3
A
bcd
3 Inpari-1 2.7
B
a 5.0
A
abc 3.7
B
ab 7.0
A
abc
4 Inpari-6 3.0
B
a 5.7
A
ab 3.7
B
ab 8.3
A
a
5 Margasari 3.0
B
a 5.0
A
abc 3.0
B
b 5.7
A
cde
6 Indragiri 2.7 A
a 4.3 A
bcd 3.0 B
b 6.3 A
bcd
7 Dendang 2.7
A
a 4.3
A
bcd 3.0
B
b 6.3
A
bcd
8 Inpara-1 2.7
A
a 4.3
A
bcd 3.0
B
b 5.0
A
def
9 Inpara-2 3.0
A
a 3.7
A
cde 3.0
B
b 5.0
A
def
10 Inpara-3 2.7
B
a 5.0
A
abc 3.7
B
ab 6.3
A
bcd
11 Inpara-4 2.0
A
a 3.0
A
de 3.0
B
b 5.0
A
def
12 Inpara-5 2.0
B
a 5.0
A
abc 4.3
B
ab 7.0
A
abc
13 BP1031F-PN-25-2-4-KN-2 2.3
A
a 3.7
A
cde 3.0
B
b 5.0
A
def
14 B11586F-MR-11-2-2-2 2.0
B
a 5.0
A
abc 3.7
B
ab 7.0
A
abc
15 BP-1027F-PN-1-2-1-KN-MR-3-3 2.0
A
a 3.0
A
de 3.0
B
b 7.0
A
abc
16 B10891B-MR-3-KN-4-1-1-MR-1 2.0
B
a 4.3
A
bcd 3.7
B
ab 7.0
A
abc
17 IR72049-B-R-22-3-1-1 3.0
B
a 4.3
A
bcd 3.0
B
b 5.7
A
cde
18 BP367E-MR-42-4-PN-3-KN-MR-4 2.7
A
a 4.3
A
bcd 3.7
B
ab 7.0
A
abc
19 B10387F-MR-7-6-KN-3-KY-2 2.0
A
a 2.7
A
de 3.0
B
b 5.7
A
cde
20 TOX4136-5-1-1-KY-3 2.0
A
a 2.3
A
e 3.0
B
b 5.0
A
def
Values within columns having the same lowercase letters are not significantly different (P<0.05) using LSD test. (critical value of t test for 2 weeks = 1.9 and 4 weeks = 2.0)
J. ISSAAS Vol. 22, No. 1: 30-41 (2016)
36
Based on iron toxicity score observation at 4 weeks in the 325 ppm treatment, paddy field
genotypes (IR64, Ciherang, Inpari-1, Inpari-6) showed high toxicity symptomp scores that were 6.3-
8.3 (average 7.33). Iron toxicity symptom score in swamp paddy genotypes were between 5.0-7.0
(average 5.83) whereas iron toxicity in tidal paddy genotypes were between 5.0-7.0 (average 6.18) .
Iron toxicity scores at 4 weeks for all paddy genotypes at 325 ppm treatment were higher than those
of 143 ppm treatment (Table 3). Based on the score of iron toxicity symptoms at 4 weeks at 143 ppm treatment, 17 genotypes were classified as tolerant ( 3.0-3.7). There were 11 genotypes had the lowest
score (3.0) from the 17 tolerant genotypes. Many selected genotypes were classified as tolerant, based
on iron toxicity score at 143 ppm treatment, making it less effective as a basis for selection.
Based on the scores of iron toxicity symptoms at 4 weeks at 325 ppm Fe stress treatment, 11
genotypes performed moderately tolerant (score 5.0-5.7), with five genotypes with the lowest score
(score of 5.0). Five genotypes considered to be moderately tolerant to iron toxicity were Inpara-1,
Inpara-4, TOX4136-5-1-1-KY-3 line, Inpara-2, and BP1031F-PN-25-2-4 -KN-2 liner. The research
results showed that Fe concentrations that causes Fe toxication in plants is very diverse. The Fe levels
in solution which causes toxicity vary widely ranged between 10-500 ppm Fe (Bode et al., 1995;
Asch et al., 2005; Fageria and Rabelo, 1987). The concentrations of Fe nutrient in solution of 250-
500 ppm with pH 4.5-6.0 significantly boosted the levels of Fe in plant tissue and showed symptoms of Fe toxicity on sensitive plants (Majerus et al. 2007; Mehraban et al. 2008).
Verification of iron toxicity symptoms in the field
To verify the tolerance of varieties tested under greenhouse conditions, five varieties were
tested in a field trial in the tidal swamp in Belandean and Danda Jaya, South Kalimantan Province.
Soil characteristics
Soil analysis showed that the soil was very acidic, with a pH of 3.8 and 4.1 in Belandean and
Danda Jaya, respectively. Levels of toxic elements, such as exchangeable-Al (9.70 me/100g) and Fe concentration (631 ppm), in Belandean were higher than in Danda Jaya which had exchangeable-Al at
6.37 me/100 g and 425 ppm Fe. The depth of the layer of pyrites (FeS2 2%) in Belandean was
more shallow ( 40 cm) than in Danda Jaya ( 54 cm), while pyrite content in Belandean was also higher (4.37%) than in Danda Jaya (2.48%).(Table 4). Belandean possesses higher level of stress than
the Danda Jaya location based on the depth of the more superficial layers of pyrites and pyrites
content, exchangeable-Al, higher Fe and the lower soil pH, higher soil Fe content and lower pH.
Levels of pyrites was high and pyrites layer depth was more shallow at Belandean, and as a
consequences, iron toxicity stress were more severe than in Danda Jaya (Table 4). The shallow
pyrites layer in the soil has greater potential to cause iron toxicity in rice, because shallow layer is
easy to be affected by oxidation. When the pyrite layer is oxydized, it would decrease soil pH,
increase Al and Fe toxicity and lower nutrient content. Under reductive environment, excessive iron
in the form of ferrous ions (Fe2+) will appear in acid sulfate soils and may become toxic for rice (Dent,
1986).
The oxydation of pyrates produce ferric ions (Fe+3) and H+ that cause soil to become very
acidic, based on the chemical reaction below (Dent, 1986) :
FeS2 + 15/4 O2 + 7/2 H2O Fe(OH)3 + 2 SO42- + 4 H+
Under flooded reductive conditions, ferric ions (Fe+3) will reduce to ferrous ions (Fe+2) which
can be absorbed in larger amounts resulting in phytotoxicity. The reduction of ferricc to ferrous ions
is commonly associated with iron reduction bacteria, and the reaction is as follows (Dent, 1986) :
Fe(OH)3 + 3H+ + e− Fe2+ + 3H2O
Screening method for iron tolerant rice…..
37
Table 4. Soil characteristics of the field in tidal swamp area, KP. Blandean and Danda Jaya, Barito
Kuala District, South Kalimantan
Soil Characteristic KP. Blandean Danda Jaya
Value Criteria* Value Criteria*
pH (H2O) 3.80 Very Acid 4.10 Very Acid
C. Organic (%) 5.01 High 4.16 High
N total (%) 0,25 Medium 0.27 Medium
P Bray I (ppm P2O5) 12.80 Medium 15.20 Medium
P total (mg/100g P2O5) 84.00 High 112 High
K total (mg/100 g K2O) 8.00 Low 8.00 Low
Excngeable Base (me/100g) :
Ca 1.50 Low 1.10 Low
Mg 1.37 Low 1.30 Low
K 0.09 Very low 0.09 Very Low
Na 0.62 Medium 0.62 Medium
KTK (me/100 g) 15.75 Medium 12.65 Medium
Al-dd (me/100 g) 9.70 High 6.37 High
Fe (ppm) 631 - 425 -
Texture (%):
Clay 69 Silty Clay 63 Silty Clay
Silt 31 36
Sand 0 1 *Soepraptohardjo (1983)
Iron toxicity symptoms and rice yield
The level of iron toxicity symptoms in the field showed that more stress was found in
Belandean than in Danda Jaya location, either in the 4th or 8th week of observation, especially for
sensitive varieties such as IR 64. Higher toxicity in Belandean resulted in lower yield compared to
that in Danda Jaya. Iron toxicity symptom scores of Inpara-1 and Inpara-4 varieties were lower and
these varieties produced higher yield than the others in both locations. For both locations, IR 64 as a
sensitive control variety showed higher iron toxicity symptom score and produced lower yield than
the others (Table 5). Observations were done in the 4th or 8th week after transplanting because these refered to the results in the greenhouse experiments. Iron toxicity symptom scores at 8 weeks showed
that green house tolerant varieties had lower level of symptom scores (3.0 – 4.3) than the control
variety IR 64 (7.0) in Belandean and in Danda Jaya locations. Tolerant varieties also had lower level
of symptom scores (2.0 – 3.7) than sensitive control variety IR 64 (5.7). Yield of Inpara-1, Inpara-2
and Inpara-4 performed were 3.85, 3.32 and 4.01 ton ha-1, respectively in Belandean which were
higher than that of IR 64 (2.1 ton ha-1). In Danda Jaya location, Inpara-1, Inpara-2 and Inpara-4
performed yield of 4.51, 4.12 and 5.46 ton ha-1 respectively which were higher than yield of IR 64 as
a sensitive control variety (2.33 ton ha-1). The yield of TOX4136 line had no significant difference
with the yield of IR 64 in both locations. The facts above showed that the results in the green house
were confirmed by the results in the field.
Concentrations of Fe in the soil at 300-400 ppm cause iron toxicity in rice plant (Breemen
and Moormann 1978). The critical border of Fe concentration (extraction by 1N NH4OAC, pH 4.8) in
the soil of tidal swamp land that can cause iron toxicity is 260 ppm Fe (Sulaiman et al. 1997). Initial
soil analysis in the two locations were 425 ppm Fe with pH 4.1 (Danda Jaya) and 631 ppm with pH
3.8 (Belandean) were higher than the concentration that stated by Breemen and Moormann (1978) and
J. ISSAAS Vol. 22, No. 1: 30-41 (2016)
38
Sulaiman et al. (1997). Those conditions potentially cause toxicity for sensitive variety such as IR 64.
Belandean, with lower pH and higher soil Fe concentration, has the potential to cause more severe
iron toxicityon rice than Danda Jaya location.
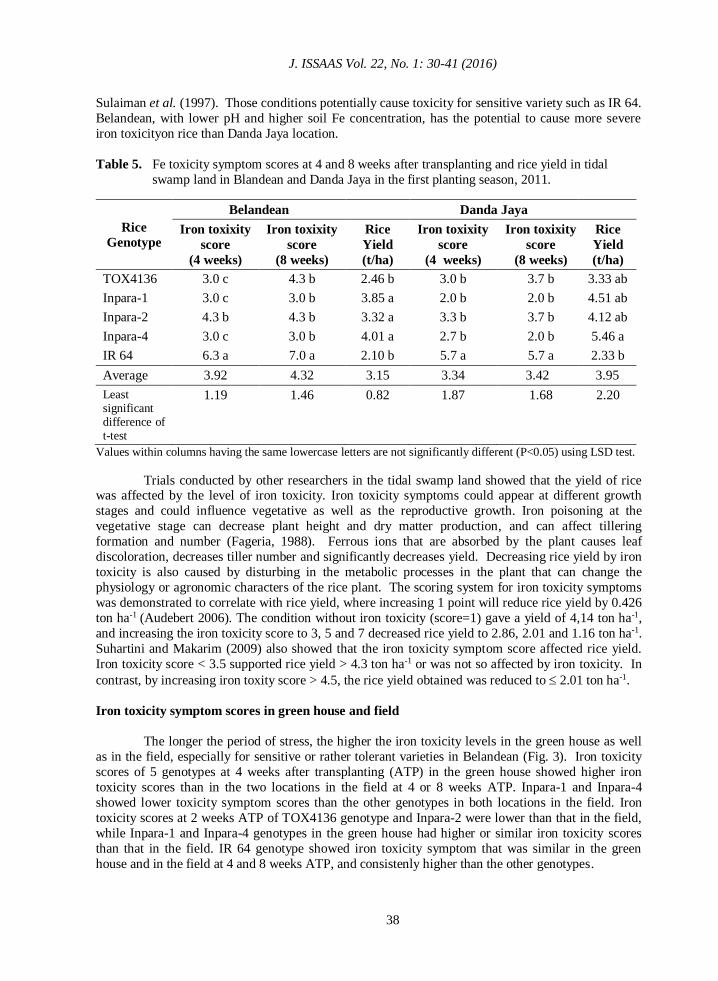
Table 5. Fe toxicity symptom scores at 4 and 8 weeks after transplanting and rice yield in tidal
swamp land in Blandean and Danda Jaya in the first planting season, 2011.
Rice
Genotype
Belandean Danda Jaya
Iron toxixity
score
(4 weeks)
Iron toxixity
score
(8 weeks)
Rice
Yield
(t/ha)
Iron toxixity
score
(4 weeks)
Iron toxixity
score
(8 weeks)
Rice
Yield
(t/ha)
TOX4136 3.0 c 4.3 b 2.46 b 3.0 b 3.7 b 3.33 ab
Inpara-1 3.0 c 3.0 b 3.85 a 2.0 b 2.0 b 4.51 ab
Inpara-2 4.3 b 4.3 b 3.32 a 3.3 b 3.7 b 4.12 ab
Inpara-4 3.0 c 3.0 b 4.01 a 2.7 b 2.0 b 5.46 a
IR 64 6.3 a 7.0 a 2.10 b 5.7 a 5.7 a 2.33 b
Average 3.92 4.32 3.15 3.34 3.42 3.95
Least significant difference of t-test
1.19 1.46 0.82 1.87 1.68 2.20
Values within columns having the same lowercase letters are not significantly different (P<0.05) using LSD test.
Trials conducted by other researchers in the tidal swamp land showed that the yield of rice was affected by the level of iron toxicity. Iron toxicity symptoms could appear at different growth
stages and could influence vegetative as well as the reproductive growth. Iron poisoning at the
vegetative stage can decrease plant height and dry matter production, and can affect tillering
formation and number (Fageria, 1988). Ferrous ions that are absorbed by the plant causes leaf
discoloration, decreases tiller number and significantly decreases yield. Decreasing rice yield by iron
toxicity is also caused by disturbing in the metabolic processes in the plant that can change the
physiology or agronomic characters of the rice plant. The scoring system for iron toxicity symptoms
was demonstrated to correlate with rice yield, where increasing 1 point will reduce rice yield by 0.426
ton ha-1 (Audebert 2006). The condition without iron toxicity (score=1) gave a yield of 4,14 ton ha-1,
and increasing the iron toxicity score to 3, 5 and 7 decreased rice yield to 2.86, 2.01 and 1.16 ton ha-1.
Suhartini and Makarim (2009) also showed that the iron toxicity symptom score affected rice yield.
Iron toxicity score < 3.5 supported rice yield > 4.3 ton ha-1 or was not so affected by iron toxicity. In
contrast, by increasing iron toxity score > 4.5, the rice yield obtained was reduced to 2.01 ton ha-1.
Iron toxicity symptom scores in green house and field
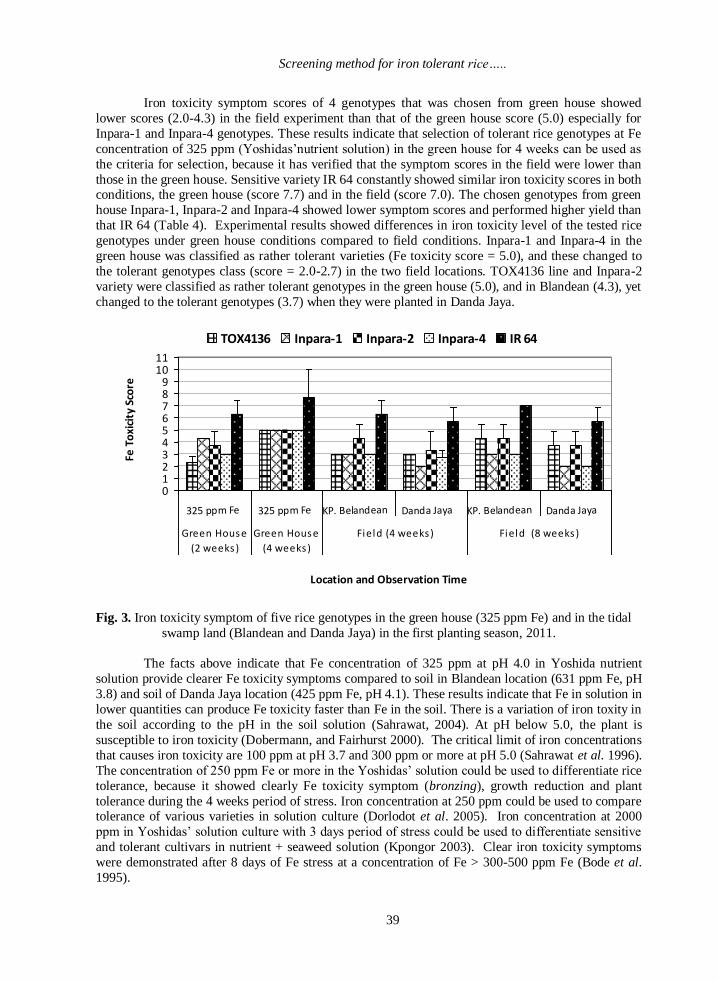
The longer the period of stress, the higher the iron toxicity levels in the green house as well
as in the field, especially for sensitive or rather tolerant varieties in Belandean (Fig. 3). Iron toxicity
scores of 5 genotypes at 4 weeks after transplanting (ATP) in the green house showed higher iron
toxicity scores than in the two locations in the field at 4 or 8 weeks ATP. Inpara-1 and Inpara-4
showed lower toxicity symptom scores than the other genotypes in both locations in the field. Iron
toxicity scores at 2 weeks ATP of TOX4136 genotype and Inpara-2 were lower than that in the field,
while Inpara-1 and Inpara-4 genotypes in the green house had higher or similar iron toxicity scores
than that in the field. IR 64 genotype showed iron toxicity symptom that was similar in the green
house and in the field at 4 and 8 weeks ATP, and consistenly higher than the other genotypes.
Screening method for iron tolerant rice…..
39
Iron toxicity symptom scores of 4 genotypes that was chosen from green house showed
lower scores (2.0-4.3) in the field experiment than that of the green house score (5.0) especially for
Inpara-1 and Inpara-4 genotypes. These results indicate that selection of tolerant rice genotypes at Fe
concentration of 325 ppm (Yoshidas’nutrient solution) in the green house for 4 weeks can be used as
the criteria for selection, because it has verified that the symptom scores in the field were lower than
those in the green house. Sensitive variety IR 64 constantly showed similar iron toxicity scores in both conditions, the green house (score 7.7) and in the field (score 7.0). The chosen genotypes from green
house Inpara-1, Inpara-2 and Inpara-4 showed lower symptom scores and performed higher yield than
that IR 64 (Table 4). Experimental results showed differences in iron toxicity level of the tested rice
genotypes under green house conditions compared to field conditions. Inpara-1 and Inpara-4 in the
green house was classified as rather tolerant varieties (Fe toxicity score = 5.0), and these changed to
the tolerant genotypes class (score = 2.0-2.7) in the two field locations. TOX4136 line and Inpara-2
variety were classified as rather tolerant genotypes in the green house (5.0), and in Blandean (4.3), yet
changed to the tolerant genotypes (3.7) when they were planted in Danda Jaya.
Fig. 3. Iron toxicity symptom of five rice genotypes in the green house (325 ppm Fe) and in the tidal
swamp land (Blandean and Danda Jaya) in the first planting season, 2011.
The facts above indicate that Fe concentration of 325 ppm at pH 4.0 in Yoshida nutrient
solution provide clearer Fe toxicity symptoms compared to soil in Blandean location (631 ppm Fe, pH
3.8) and soil of Danda Jaya location (425 ppm Fe, pH 4.1). These results indicate that Fe in solution in
lower quantities can produce Fe toxicity faster than Fe in the soil. There is a variation of iron toxity in
the soil according to the pH in the soil solution (Sahrawat, 2004). At pH below 5.0, the plant is
susceptible to iron toxicity (Dobermann, and Fairhurst 2000). The critical limit of iron concentrations
that causes iron toxicity are 100 ppm at pH 3.7 and 300 ppm or more at pH 5.0 (Sahrawat et al. 1996).
The concentration of 250 ppm Fe or more in the Yoshidas’ solution could be used to differentiate rice
tolerance, because it showed clearly Fe toxicity symptom (bronzing), growth reduction and plant
tolerance during the 4 weeks period of stress. Iron concentration at 250 ppm could be used to compare tolerance of various varieties in solution culture (Dorlodot et al. 2005). Iron concentration at 2000
ppm in Yoshidas’ solution culture with 3 days period of stress could be used to differentiate sensitive
and tolerant cultivars in nutrient + seaweed solution (Kpongor 2003). Clear iron toxicity symptoms
were demonstrated after 8 days of Fe stress at a concentration of Fe > 300-500 ppm Fe (Bode et al.
1995).
0123456789
1011
325 ppm Fe 325 ppm Fe KP. Belandean Danda Jaya KP. Belandean Danda Jaya
Green House
(2 weeks)
Green House
(4 weeks)
Field (4 weeks) Field (8 weeks)
Location and Observation Time
Fe T
oxi
city
Sco
re
TOX4136 Inpara-1 Inpara-2 Inpara-4 IR 64
J. ISSAAS Vol. 22, No. 1: 30-41 (2016)
40
CONCLUSIONS
A screening method in the green house for rice tolerant genotype that related with the level
of Fe toxicity symptom and rice productivity in the field is needed in order to select tolerant
genotypes in shorter time, cheaper cost, and better accuracy than a direct selection in the field. Based
on the score of iron toxicity symptoms at 4 weeks after treatment, 17 genotypes were classified as
tolerant using 143 ppm Fe, and 11 genotypes performed moderately tolerant using 325 ppm Fe.
Inpara-1 and Inpara-4 indicated as the tolerant genotypes to Fe toxicity, and performed higher yields
in the two field research locations. Rice genotypes that were selected in the green house showed
lower Fe toxicity symptoms in the tidal land than those in the green house. Fe concentarion at 325
ppm under Yoshida’ nutrient solution at pH 4.0 in the four weeks period of stress can be used for screening of rice tolerant genotypes to Fe toxicity.
AKNOWLEDGEMENT
We thank the Research Collaborattion Programme among Indonesian Agriculture Research
agency and Indonesian Universities (KKP3T) for funding this research.
REFERENCES
Alihamsyah, T. 2004. Potensi dan Pendayagunaan Lahan Rawa untuk Peningkatan produksi Padi
dan Beras Indonesia. In. F. Kasrino, E. Pasandaran, dan A.M. Pagi (Eds). Indonesian Research Agency. p.141-151.
Asch, F., M. Becker and D.S. Kpongor. 2005. A quick and efficient screen for tolerance to iron
toxicity in lowland rice. J. Plant Nutr. Soil Sci. 168:764–773.
Audebert, A. 2006. Iron partitioning as a mechanism for iron toxicity tolerance in lowland rice. In :
Audebert A, Narteh LT, Millar D and Beks B (Eds). Iron Toxicity in Rice-Based System in
West Africa. Africa Rice Center (WARDA). p. 34-46
Audebert, A. and K.L. Sahrawat. 2000. Mechanisms for iron toxicity tolerance in lowland rice. J.
Plant Nutr. 23:1877-1885.
Aung, T. 2006. Physiological mechanisms of iron toxicity tolerance in lowland rice. Master of
Science. Thesis. Institute of Crop Science and Resource Conservation (INRES). Department
of Plant Nutrition. University of Bonn, Germany. 76 p.
Bode, K, O. Döring, S. Lüthje, H.U. Neue and M. Böttger. 1995. The role of active oxygen in iron
tolerance of rice (Oryza sativa). Protoplasma. 184:249–255.
Breemen, N.V. and F.R. Moormann. 1978. Iron toxic soils, Pp. 781-800. In Soils and Rice.
International Rice Research Institute. Los Banos, Philippines: IRRI.
Dent, D. 1986. Acid Sulphate Soils: A baseline for research and development. International Land Reclamation Institutes Publ. 39. Wageningen, The Netherlands. 198 p.
Dobermann, A. and T. Fairhurst. 2000. Iron toxicity, pp. 121-125. In. Rice: Nutrient Disorders and
Nutrient Management. A. Dobermann and T. Fairhurst (Eds). International Rice Research
Institute, Manila.
Dorlodot, S., S. Lutts and P. Bertin. 2005. Effect of ferrous iron toxicity on the growth and mineral
competition of and interspecific rice. J. Plant Nutr. 28 (1):1-20.
Screening method for iron tolerant rice…..
41
Fageria, N.K. and N.A. Rabelo. 1987. Tolerance of rice cultivars to iron toxicity. J. Plant Nutr. 10:
653–661.
Fageria, N.K. 1988. Influence of iron on nutrient uptake by rice. Int. Rice Res. Newsl. 13(1): 20-21.
IRRI-INGER. 1996. Standard Evaluation System for Rice. 4th Edition International Rice Research
Institute-International Network Genetic Evaluation Research. Manila, Phillippines. 52 p.
Kpongor, D.S. 2003. Developing a standardized procedure to screen lowland rice (Oryza sativa)
seedling for tolerance to iron toxicity. Master of Science. Thesis. Faculty of Agriculture.
University of Bonn. 46 p.
Majerus, V., P. Bertin and S. Lutts. 2007. Effects of iron toxicity on osmotic potential, osmolytes
and polyamines concentrations in the African rice (Oryza glaberrima Steud.). Plant Sci. 173:
96–105.
Mehraban, P., A.A. Zadeh and H.R. Sadeghipour. 2008. Iron toxicity in rice (Oryza sativa L.) under different potassium nutritiom. Asian J. Plant Sci. 1-9.
Noor, A., I. Khairullah, R.D. Ningsih and Sumanto. 2005. Evaluasi toleransi galur-galur padi terhadap
keracunan besi di lahan sulfat masam. Agric. J. Satyawacana Agric. Univ. 18 (1) :71-84.
Noor, A., I. Lubis, M. Ghulamahdi, M.A. Chozin, K. Anwar and D. dan Wirnas. 2012. Pengaruh
konsentrasi besi dalam larutan hara terhadap gejala keracunan besi dan pertumbuhan
tanaman padi. Indonesia Agron. J. 40(2):91-98
Sahrawat, K.L., C.K. Mulbah, S. Diatta, R.D. DeLaune, W.H. Patrick, B.N. Singh and M.P. Jones.
1996. The role of tolerant genotypes and plant nutrients in the management of iron toxicity in lowland rice. J. Agric. Sci. 126:143–149.
Sahrawat, K.L. 2004. Iron toxicity in wetland rice and the role of other nutrients. J. Plant Nutr. 27
(8):1471–1504.
Sahrawat, K.L. 2010. Reducing iron toxicity in lowland rice with tolerant genotipes and plant
nutrition. Plant Stress. 4:70-75.
Suhartini, T. 2004. Perbaikan varietas padi untuk lahan keracunan Fe. 2004. Germplasm Bul. 10
(1):1-11.
Suhartini. T. and A.K. Makarim. 2009. Teknik seleksi genotipe padi toleran keracunan besi. Agric. Food Crop Res. J. 28:125-130.
Sulaiman, A., Arifin and G. Nohoi. 1997. Studi korelasi pertumbuhan tanaman padi dengan besi
tanah. Kalimantan Agrikultura J. 2 (4):1-14.
Yamauchi, M. and S. Yoshida. 1981. Physiological mechanisms of rice’s tolerance for iron toxicity.
Paper presented at the IRRI Saturday Seminar, June 6, 1981. Manila, Philippines:
International Rice Research Institute.
Yoshida,S., D.A. Forno, J.H. Cock, and K.A. Gomez. 1976. Laboratory manual for physiological
studies of rice, 3rd Edition., Manila, Philippines: Int. Rice Res. Inst. pp. 61–64.