Screening methods for salinity tolerance: a case study with tetraploidwheat
Rana Munns1 & Richard A. JamesCSIRO Plant Industry, GPO Box 1600, Canberra ACT 2601, Australia. 1Corresponding author∗
Received 20 June 2002; accepted 13 February 2003
Key words: durum wheat, salinity, Triticum turgidum
Abstract
Fast and effective glasshouse screening techniques that could identify genetic variation in salinity tolerance weretested. The objective was to produce screening techniques for selecting salt-tolerant progeny in breeding programsin which genes for salinity tolerance have been introduced by either conventional breeding or genetic engineering.A set of previously unexplored tetraploid wheat genotypes, from five subspecies of Triticum turgidum, were used ina case study for developing and validating glasshouse screening techniques for selecting for physiologically basedtraits that confer salinity tolerance. Salinity tolerance was defined as genotypic differences in biomass productionin saline versus non-saline conditions over prolonged periods, of 3–4 weeks. Short-term experiments (1 week)measuring either biomass or leaf elongation rates revealed large decreases in growth rate due to the osmotic effectof the salt, but little genotypic differences, although there were genotypic differences in long-term experiments.Specific traits were assessed. Na+ exclusion correlated well with salinity tolerance in the durum subspecies, andK+/Na+ discrimination correlated to a lesser degree. Both traits were environmentally robust, being independent ofroot temperature and factors that might influence transpiration rates such as light level. In the other four T. turgidumsubspecies there was no correlation between salinity tolerance and Na+ accumulation or K+/Na+ discrimination,so other traits were examined. The trait of tolerance of high internal Na+ was assessed indirectly, by measuringchlorophyll retention. Five landraces were selected as maintaining green healthy leaves despite high levels of Na+accumulation. Factors affecting field performance of genotypes selected by trait-based techniques are discussed.
Introduction
New sources of salinity tolerance are needed for cropsgrown on salt-affected land. This would be particularlyeffective in areas with subsoil salinity, which is ex-tensive in many landscapes dominated by sodic soils.‘Transient salinity’, i.e., natural salinity not associatedwith groundwater or with rising saline water tables,can occur under sodic topsoils (Rengasamy, 2002).In Australia, two-thirds of the agricultural area hasa potential for transient salinity. ‘Dryland salinity’,i.e., land affected by clearing and resultant rising wa-ter tables, is difficult to reclaim and make productive,but rising water tables can be controlled by planting
deep-rooted perennial species. Trials in Australia haveshown that lucerne (Medicago alfalfa) can lower awater table sufficiently to allow subsequent cropping(Ridley et al., 2001). Salinity tolerance is required,not only for the ‘de-watering’ species, but also for theannual crops to follow, as salt will be left in the soilwhen the water table is lowered. Increasing the salt tol-erance of crops will also allow the more effective useof poor quality irrigation water. Ability to grow high-return crops such as durum wheat on salt-affected landwill boost farm incomes and support changed farmmanagement practices to address salinisation.
Improving the salt tolerance of crop and pas-ture species requires access to new genetic diversity(either natural or transgenic), and efficient techniquesfor identifying salt-tolerance. There is probably a
202
wide range of genetic diversity in salinity tolerancein international collections that is undiscovered orunderutilised.
Screening methods based on growth or yield
Screening large numbers of genotypes for salinitytolerance in the field is difficult, due to spatial het-erogeneity of soil chemical and physical properties,and to seasonal fluctations in rainfall. A field studyin Syria using ICARDA’s advanced durum breedinglines indicated that significant genetic variation for salttolerance might exist, but the confounding presenceof drought stress made it difficult to identify geno-types with salt tolerance (Srivastava and Jana, 1984).They conclude that ‘the lack of reliable large-scalefield screening techniques still seems to be the biggestproblem in genetic improvement of salt and droughttolerance of crop plants’. Screening techniques thatcan be carried out under controlled environments havetherefore often been used (Table 1).
Large numbers of bread and durum wheat geno-types have been screened for salt tolerance in glass-houses, the criteria being biomass production at highsalinity (up to 250 mM NaCl) relative to biomass innon-saline conditions (e.g., Kingsbury and Epstein,1984; Martin et al., 1994). A screen by Sayed (1985)of 5000 wheat lines, based on survival of high sa-linity, showed considerable genetic diversity amongsthexaploid and tetraploid lines. However, little hascome from such work, presumably due to a lack ofcorrelation between glasshouse selection (survival ofhigh salinity) and performance in the field.
Possibly, application of the glasshouse basedscreening methods would be greater if genetic differ-ences at moderate salinity (50–100 mM NaCl) couldbe found. However, this has proved difficult to do.Table 1 lists techniques that have been used to screenlarge numbers of genotypes for salinity tolerance.Many studies have used measurements of leaf or rootelongation rate to identify genetic differences in re-sponse to moderate salinity, but the results so far havenot been usilised in the field. Frequently, short-termgrowth experiments have revealed little differencebetween genotypes that differ in long-term biomassproduction or yield. For example, in a comparisonbetween 20 cultivars of wheat, barley and triticalethere were no significant differences between the leafelongation rate in the first 10 days of salinisation ofany cultivar (Munns et al., 1995), including that aof durum wheat that proved to be the most sensitive
and a barley that proved the most tolerant (Rawson etal., 1988). Many short-term growth experiments meas-uring whole shoot biomass revealed little differencebetween wheat genotypes in their response to salin-ity, even between those known to differ in long-termbiomass production or yield (Nicolas et al., 1993; Riv-elli et al., 2002; Shah et al., 1987; Weimberg, 1987).Longer-term experiments have been necessary to de-tect genotypic differences in the effects of salinity ongrowth: it has been necessary to expose plants to sa-linity for at least two weeks, and sometimes severalmonths (Fortmeier and Schubert, 1995; Francois etal., 1986; Kingsbury and Epstein, 1984; Munns et al.,1995). Even with rice, a fast growing and salt sensitivespecies, it has been necessary to grow plants for sev-eral weeks to be confident of obtaining reproducibledifferences in salinity tolerance between genotypes(Aslam et al., 1993; Zhu et al., 2001).
However, long-term experiments are demanding oflabour and resources, even when limited to a relativelyfew number of genotypes, so other techniques havebeen utilised.
Screening methods based on damage, or tolerance tovery high salinity levels
Techniques that can handle large numbers of geno-types include germination or plant survival in highsalinity, leaf injury as measured by membrane damage(leakage of ions from leaf discs), premature loss ofchlorophyll (using a hand-held meter), or damage tothe photosynthetic apparatus (using chlorophyll fluor-escence). These are listed in Table 1, and are discussedin some detail at the end of this article. These methodscan identify genotypes able to germinate in, or survive,very high salinities (over 200 mM NaCl), but do notdiscriminate between genotypes in ability to toleratethe low or moderate salinities typical of many salinefields (50–100 mM NaCl). This could be why geno-typic variation in germination or survival has rarelybeen replicated in the field or in long-term growthexperiments.
A major limitation to the use of injury or survivalto identify salt-tolerant germplasm arises when thecause of injury is not known. The injury could be dueto water stress, the Na+ or Cl− accumulating withinthe leaf, or to K+ or Ca2+ deficiency (Greenway andMunns, 1980). Alternatively, leaf death could be dueto accelerated senescence due to osmotic effect of thesalt. This becomes particularly relevant when consid-ering the reproducibility of the responses in the field.
203
Table 1. Techniques used to screen large numbers of genotypes for salinity tolerance in glasshouses or controlled environments. Com-ments indicate whether a control (non-saline) treatment is necessary, particular advantages of the technique that relate to its experimentalfeasibility, whether the responses measured are due to the osmotic or the salt-specific effect of the salinity treatment, and how long thetreatment needs to be imposed. Avoiding the need to grow controls plants is a major advantage.
TechniqueA Controls Advantages Osmotic or Length of
needed salt-specific treatment
effect (weeks)
Screening techniques for tolerance to moderate salinity (50–150 mM NaCl)
Measurements of growth:
Root elongation Yes Can be used with very young seedlings Osmotic 1
Leaf elongation Yes Not destructive Osmotic 2
Biomass Yes More likely to relate to field Both 4
Yield Yes Most likely to relate to field Both 16
Measurements of injury:
Leakage from leaf discs No∗ Not destructive Either or both 3–4
Chlorophyll content No∗ Not destructive and quick (using hand-held meter) Either or both 3–4
Chlorophyll fluorescence No∗ Not destructive Either or both 3–4
Specific traits:
Na+ exclusion No Not descrutive, and a single easy analysis Salt-specific 1–2
K+/Na+ discrimination No Not destructive Salt-specific 1–2
Cl− exclusion No Not destructive Salt-specific 1–2
Screening techniques for tolerance to high salinity (200–300 mM NaCl)
Germination Yes Very large numbers easily handled Osmotic 1
Survival No∗ Limited experimental period, if high salinity Either or both 2–8, depending on
used. Highly tolerant genotypes stand out. salinity
∗Assumes all genotypes under control conditions have no leakage, the same leaf longevity, fluorescence parameters typical of healthyplants, and 100% survival.ANot listed are photosynthesis, osmotic adjustment, enzyme activity, gene expression, compatible solutes, ABA or ethylene, as these arenot feasible screening techniques. These measurements can be made on only small numbers of genotypes at the one time. Not listed,also, are stomatal conductance and transpiration efficiency. These are feasible screening techniques, and can be used for large numbers ofgenotypes, but are specific traits for drought tolerance.
The effect of the field, when salinity might be increas-ing at the same time the soil water content falls, meansadditional factors come in such as increased osmoticstress, and the inability of roots to access nitrogen andother nutrients. For instance, N deficiency will causeaccelerated leaf senescence due to demand for N to beremobilised from old leaves.
Screening methods based on physiologicalmechanisms
Because of the complex nature of salinity tolerance,as well as the difficulties in maintaining long-termgrowth experiments, trait-based selection criteria arerecommended for screening techniques (Noble andRogers, 1992; Yeo and Flowers, 1986; Yeo et al.,1990). Traits used for screening germplasm for salin-
ity tolerance have included Na+ exclusion (Garcia etal., 1995), K+/Na+ discrimination (Asch et al., 2000)and Cl− exclusion (Rogers and Noble, 1992).
We have focussed on improving the salinity tol-erance of durum (tetraploid) wheat. Current durumwheat cultivars are more sensitive to soil salinity thanbread wheat (hexaploid) cultivars (Francois et al.,1986; Maas and Grieve, 1990; Shah et al., 1987;Rawson et al., 1988). The first mechanism that weused as a basis for a screening technique was Na+exclusion, as genetic differences in Na+ exclusion arehighly correlated with differences in salinity tolerancebetween tetraploid and hexaploid wheat (Francois etal., 1986; Gorham et al., 1987). We looked for geneticdiversity in the trait of Na+ exclusion from leaves ina set of tetraploid relatives of durum wheat grown at
204
150 mM NaCl (Munns et al., 2000). Three landraceswith the trait of Na+ exclusion were identified, buttheir salinity tolerance was not verified (Munns et al.,2000). The first set of experiments described hereassessed the relationship between the trait of Na+ ex-clusion and salinity tolerance. Anticipating we wouldbe backcrossing the trait from the landrace into durumcultivars, we examined environmental variables thatmight influence the uptake of Na+ and so interferewith assessing the trait in glasshouse or field. Thetwo variables we considered most important were roottemperature and light. The relationship between sa-linity tolerance and K+/Na+ discrimination was alsoconsidered, because K+/Na+ rather than Na+ alonehas been used as an index of salinity tolerance forcultivar comparisons in wheat (Chhipa and Lal, 1995;Dvorák et al., 1994) and rice (Asch et al., 2000; Zhuet al., 2001).
The second mechanism of salinity tolerance weconsidered was tissue tolerance of high internal Na+concentrations. Tissue tolerance cannot be measureddirectly, and is difficult to quantify. Yet it is clearlyimportant; overexpression of the vacuolar Na+/H+antiporter that sequesters Na+ in vacuoles (NHX1)improved the salinity tolerance of Arabidopsis, tomatoand brassica (Aharon et al., 2003). Variation in salin-ity tolerance not associated with Na+ exclusion wasobserved for a small number of accessions of the dip-loid wheat ancestor Triticum tauschii (syn. Aegilopssquarrosa) accessions (Schachtman and Munns, 1992;Schachtman et al., 1991), so it is likely that variationexists within the tetraploid wheat ancestors. To assessgenetic variation in the tetraploid lines, we looked forleaf longevity, lack of necrosis, and prolonged growthdespite very high accumulation of Na+.
Materials and methods
Germplasm
A collection of 54 Triticum turgidum selections com-prising the sub-species durum, turgidum, polonicum,turanicum, and carthlicum were provided by Dr RayHare (NSW Agriculture, Tamworth) as representinga wide range in genetic diversity (Table 2). This setof genotypes had previously been screened for rates ofNa+ uptake and K+/Na+ discrimination (Munns et al.,2000).
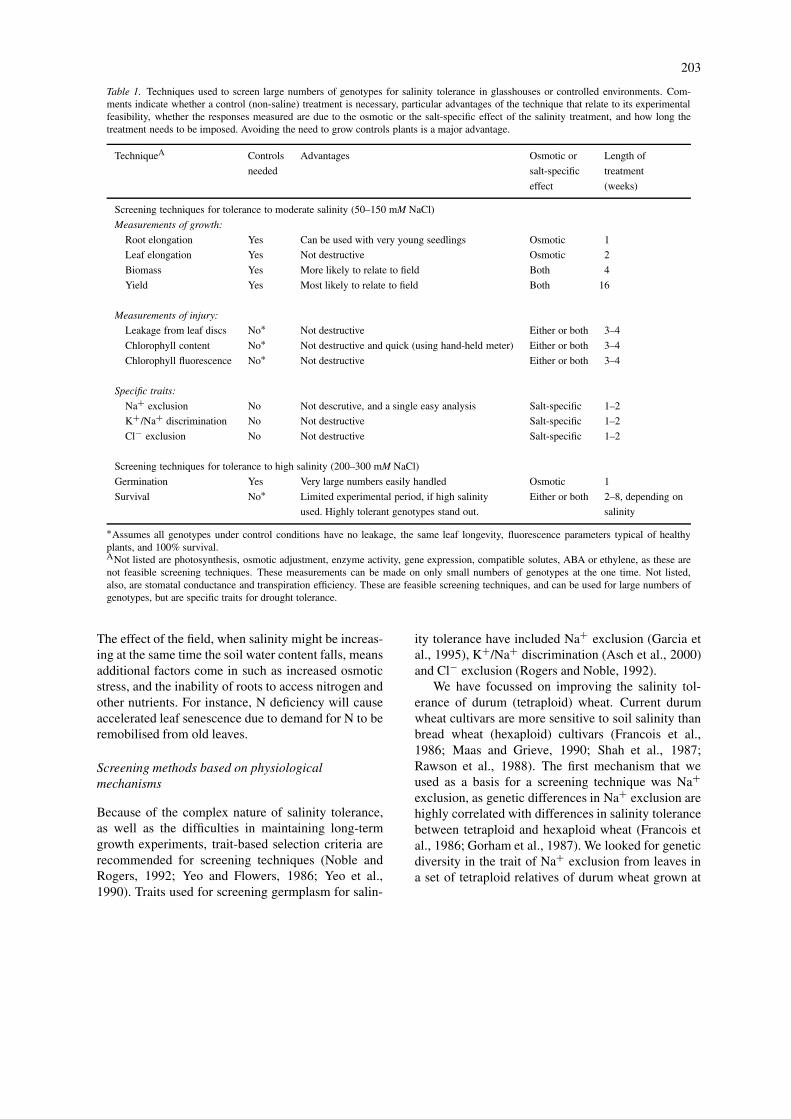
Figure 1. Supported hydroponic method for screening plants forsalinity tolerance. Pots are filled with quartz gravel, 144 pots pertank, and the tanks are subirrigated every 30 min with nutrient orsaline solution from a 44 gallon drum, by a pump activated by atimer. Solution drains back into the drum when the pump turns off.A cooling coil is inserted into the drum to maintain the nutrientsolution close to 20 ◦C.
Growth conditions and the gravel-based hydroponicmethod
Seeds were selected by weight, surface sterilised with1% hypochlorite for 15 min, and germinated in Petriedishes for 3 days. Germinated seeds were planted into6.5 × 15.8-cm pots containing quartz gravel, one plantper alternate pot, in 90-L plastic moulded trays con-taining 144 pots. Trays were subirrigated with eithersaline or non-saline nutrient solution, as described inMunns et al. (1995), and illustrated in Figure 1. Thisgravel culture was preferred to other forms of hy-droponic culture, as roots are supported, each plantis a separate replicate, the frequent subirrigation anddrainage avoids hypoxia, and there is no breakageof lateral roots as occurs in unsupported hydroponicswhen the solution is changed (Miller, 1987). The nutri-ent solution at full strength was Hoagland and Arnonsolution No 2, containing 4 mM Ca2+ and 1 mM P.
Seedlings were watered initially with tap water,then half strength nutrient solution was introduced 2days after emergence (DAE), and increased to fullstrength at 3 DAE. Commencing at 4–10 DAE, 25 mMNaCl was added to the irrigation solution twice dailyover 3 days to a final concentration of 150 mM. Sup-plemental Ca2+ was added (as CaCl2) to bring thetotal concentration of Ca2+ to 10 mM, and the molarratio of Na+:Ca2+ to 15:1. Control treatments al-
205
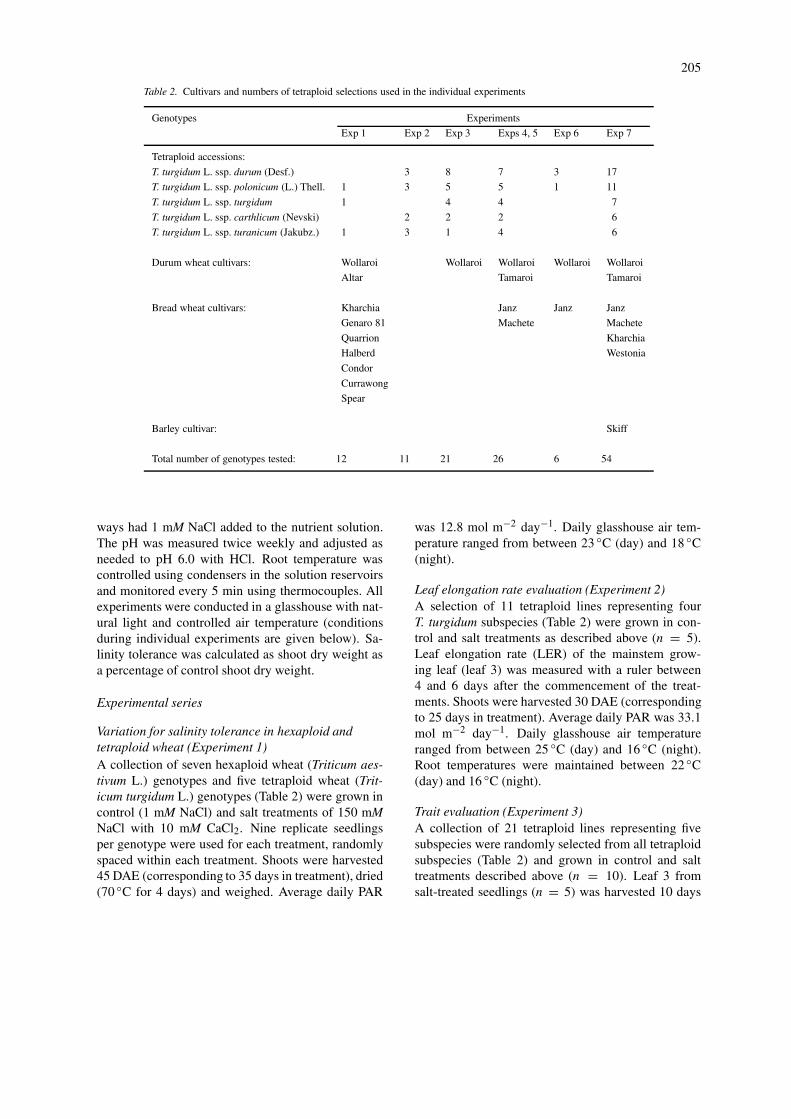
Table 2. Cultivars and numbers of tetraploid selections used in the individual experiments
Genotypes Experiments
Exp 1 Exp 2 Exp 3 Exps 4, 5 Exp 6 Exp 7
Tetraploid accessions:
T. turgidum L. ssp. durum (Desf.) 3 8 7 3 17
T. turgidum L. ssp. polonicum (L.) Thell. 1 3 5 5 1 11
T. turgidum L. ssp. turgidum 1 4 4 7
T. turgidum L. ssp. carthlicum (Nevski) 2 2 2 6
T. turgidum L. ssp. turanicum (Jakubz.) 1 3 1 4 6
Durum wheat cultivars: Wollaroi Wollaroi Wollaroi Wollaroi Wollaroi
Altar Tamaroi Tamaroi
Bread wheat cultivars: Kharchia Janz Janz Janz
Genaro 81 Machete Machete
Quarrion Kharchia
Halberd Westonia
Condor
Currawong
Spear
Barley cultivar: Skiff
Total number of genotypes tested: 12 11 21 26 6 54
ways had 1 mM NaCl added to the nutrient solution.The pH was measured twice weekly and adjusted asneeded to pH 6.0 with HCl. Root temperature wascontrolled using condensers in the solution reservoirsand monitored every 5 min using thermocouples. Allexperiments were conducted in a glasshouse with nat-ural light and controlled air temperature (conditionsduring individual experiments are given below). Sa-linity tolerance was calculated as shoot dry weight asa percentage of control shoot dry weight.
Experimental series
Variation for salinity tolerance in hexaploid andtetraploid wheat (Experiment 1)A collection of seven hexaploid wheat (Triticum aes-tivum L.) genotypes and five tetraploid wheat (Trit-icum turgidum L.) genotypes (Table 2) were grown incontrol (1 mM NaCl) and salt treatments of 150 mMNaCl with 10 mM CaCl2. Nine replicate seedlingsper genotype were used for each treatment, randomlyspaced within each treatment. Shoots were harvested45 DAE (corresponding to 35 days in treatment), dried(70 ◦C for 4 days) and weighed. Average daily PAR
was 12.8 mol m−2 day−1. Daily glasshouse air tem-perature ranged from between 23 ◦C (day) and 18 ◦C(night).
Leaf elongation rate evaluation (Experiment 2)A selection of 11 tetraploid lines representing fourT. turgidum subspecies (Table 2) were grown in con-trol and salt treatments as described above (n = 5).Leaf elongation rate (LER) of the mainstem grow-ing leaf (leaf 3) was measured with a ruler between4 and 6 days after the commencement of the treat-ments. Shoots were harvested 30 DAE (correspondingto 25 days in treatment). Average daily PAR was 33.1mol m−2 day−1. Daily glasshouse air temperatureranged from between 25 ◦C (day) and 16 ◦C (night).Root temperatures were maintained between 22 ◦C(day) and 16 ◦C (night).
Trait evaluation (Experiment 3)A collection of 21 tetraploid lines representing fivesubspecies were randomly selected from all tetraploidsubspecies (Table 2) and grown in control and salttreatments described above (n = 10). Leaf 3 fromsalt-treated seedlings (n = 5) was harvested 10 days
206
after its appearance (coinciding with approximately 10days after the salt treatment started for all genotypes).Remaining shoots (n = 10) were harvested at 28DAE (24 days in treatments). Average daily PAR was43.6 mol m−2 day−1. Daily glasshouse air temperatureranged from between 32 ◦C (day) and 20 ◦C (night).
Effect of root temperature and light on Na+ and K+accumulation and K+/Na+ (Experiments 4 and 5)A collection of 22 tetraploid lines with two durum andtwo bread wheat cultivars (Table 2) were grown inthe salt treatment described above in two experimentsthat differed in light and root temperature (n = 4).In the first experiment, average daily PAR was 13.5mol m−2 day−1, whereas average daily PAR in thesecond experiment was about double at 29.9 mol m−2
day−1. Average daily root temperature treatmentswere 15.4 ◦C, 19.6 ◦C and 24.3 ◦C, respectively, in thefirst experiment and 15.6 ◦C, 20.0 ◦C and 24.0 ◦C re-spectively in the second experiment. Average daily airtemperature was 20.3 ◦C in both experiments. Seed-lings were randomly spaced in four replicate blocks ineach root temperature treatment. Leaf 3 was harvestedat 10 days after appearance (and also 10 days afterthe final salt concentration was reached). Remainingshoots were harvested 24 DAE (18 days in salt), anddried and weighed.
Effect of salinity-induced phosphorus accumulationon leaf injury (Experiment 6)A selection of four tetraploid lines, with a bread wheatand durum cultivar (Table 2), were grown in con-trol and salt treatments as described above, whichcontained 1 mM P. Ten replicate seedlings per linewere used for each treatment and replicates were ran-domly spaced within each treatment. Seedlings wereharvested 22–24 DAE (corresponding to 15–17 daysin treatment) and visually assessed for leaf injury.Blades of leaf 1, 2 and 3 (most recently fully expan-ded leaf) were ground. Average daily PAR was 8.0mol m−2 day−1. Average daily glasshouse air temper-ature was 20.2 ◦C, and average daily root temperaturewas 20.9 ◦C.
Screen for tissue tolerance to Na+ in a collection oftetraploid landraces (Experiment 7)A selection of 47 tetraploid lines, two durum cul-tivars, four bread wheat cultivars and a barley cultivarwere screened for symptoms of salinity-induced leafinjury in salt treatment as described above except thatP was reduced to 50 µM. Lines were randomly double
spaced within a block design (n = 4). Entire shootswere harvested at 28 DAE, which corresponded to 3weeks in 150 mM NaCl. Leaf blades were separatedinto green and dead leaf portions. The percentage deadleaf was calculated as the weight of dead leaf as apercentage of total leaf weight. Immediately prior toharvest, chlorophyll content was estimated using a leafchlorophyll meter (SPAD-502 meter, Minolta, Osaka,Japan). Mean leaf chlorophyll content for each geno-type was derived from three readings taken at the base,middle and tip of leaf 1, 2 and 3. Average daily PARwas 15.6 mol m−2 day−1. Average daily glasshouseair temperature was 19.1 ◦C, and average daily roottemperature was 19.9 ◦C.
Chemical analyses
Harvested leaf blades were rinsed with deionised wa-ter, dried at 70 ◦C for 3 days, weighed and extracted in500 mM HCl at 80 ◦C for 1 h and analysed for Na+and K+ by an atomic absorption spectrophotometer(Varian Spectra AA-300, Melbourne Australia). Phos-phorus was analysed on dried (70 ◦C for 3 days), finelyground and pelleted leaf material using an X-ray fluor-escence spectrometer (Phillips PW 1404, Eindhoven,The Netherlands) according to the method describedby Norrish and Hutton (1977).
Data analysis
Data were analysed by analysis of variance, and LSD(P = 0.05) was used to compare genotype means.Data from Experiments 4 and 5 were analysed usingan analysis of variance–split plot design, where lightwas assigned as whole plots, root temperature as sub-plots and replicates as blocks. LSD (P = 0.05) wasused to compare treatment means.
Results
Growth experiments: how to measure salinitytolerance
Biomass (Experiment 1)The first step in this study was to see if there wassignificant genetic variation in salinity tolerance intetraploid wheat genotypes, and to compare the toler-ance with durum cultivars and bread wheat cultivars.Salinity tolerance was expressed as the percent bio-mass in saline versus control treatments. A level of
207
150 mM NaCl was chosen as a preliminary experi-ment at 100 mM NaCl failed to produce statisticallysignificant differences between any genotypes over aperiod of 6 weeks, including those that were expectedto differ in salt tolerance (data not shown).
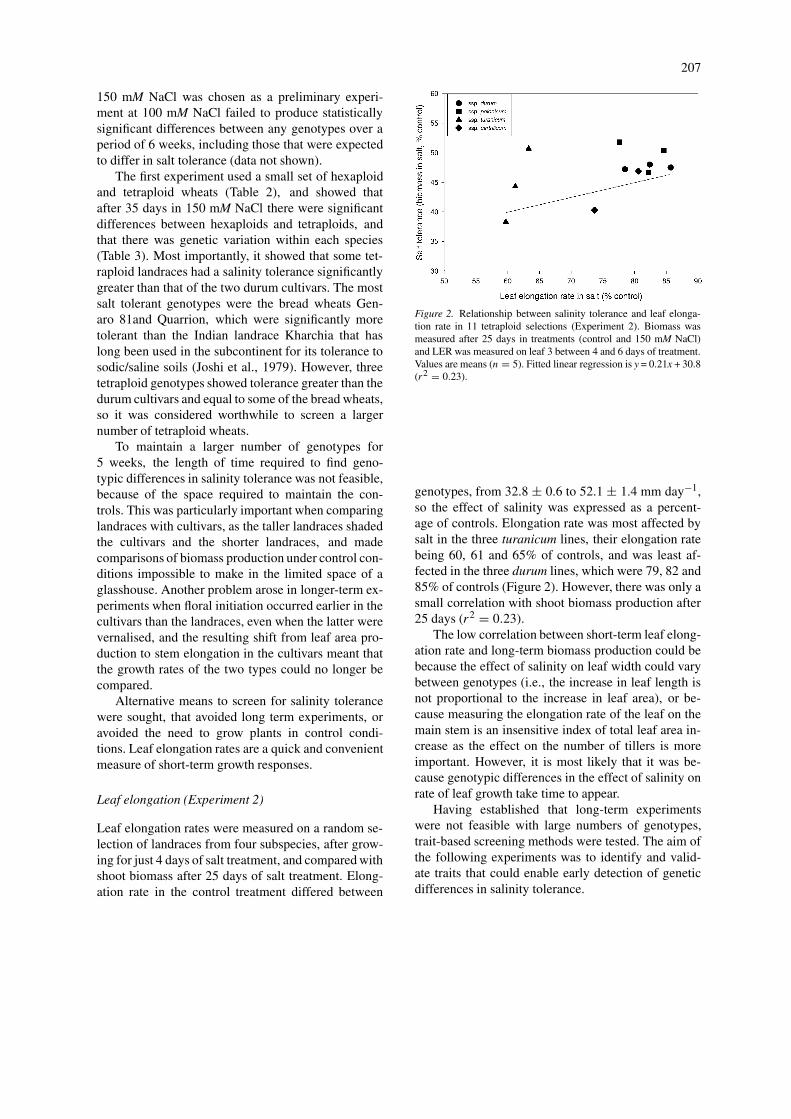
The first experiment used a small set of hexaploidand tetraploid wheats (Table 2), and showed thatafter 35 days in 150 mM NaCl there were significantdifferences between hexaploids and tetraploids, andthat there was genetic variation within each species(Table 3). Most importantly, it showed that some tet-raploid landraces had a salinity tolerance significantlygreater than that of the two durum cultivars. The mostsalt tolerant genotypes were the bread wheats Gen-aro 81and Quarrion, which were significantly moretolerant than the Indian landrace Kharchia that haslong been used in the subcontinent for its tolerance tosodic/saline soils (Joshi et al., 1979). However, threetetraploid genotypes showed tolerance greater than thedurum cultivars and equal to some of the bread wheats,so it was considered worthwhile to screen a largernumber of tetraploid wheats.
To maintain a larger number of genotypes for5 weeks, the length of time required to find geno-typic differences in salinity tolerance was not feasible,because of the space required to maintain the con-trols. This was particularly important when comparinglandraces with cultivars, as the taller landraces shadedthe cultivars and the shorter landraces, and madecomparisons of biomass production under control con-ditions impossible to make in the limited space of aglasshouse. Another problem arose in longer-term ex-periments when floral initiation occurred earlier in thecultivars than the landraces, even when the latter werevernalised, and the resulting shift from leaf area pro-duction to stem elongation in the cultivars meant thatthe growth rates of the two types could no longer becompared.
Alternative means to screen for salinity tolerancewere sought, that avoided long term experiments, oravoided the need to grow plants in control condi-tions. Leaf elongation rates are a quick and convenientmeasure of short-term growth responses.
Leaf elongation (Experiment 2)
Leaf elongation rates were measured on a random se-lection of landraces from four subspecies, after grow-ing for just 4 days of salt treatment, and compared withshoot biomass after 25 days of salt treatment. Elong-ation rate in the control treatment differed between
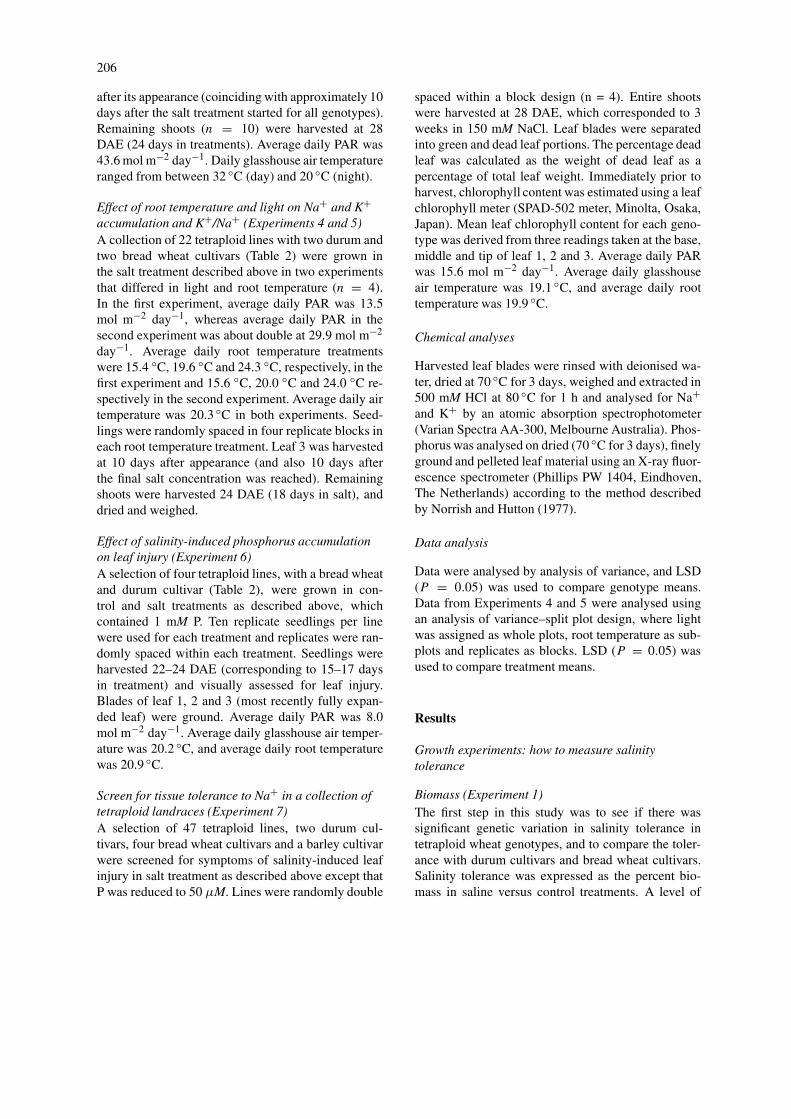
Figure 2. Relationship between salinity tolerance and leaf elonga-tion rate in 11 tetraploid selections (Experiment 2). Biomass wasmeasured after 25 days in treatments (control and 150 mM NaCl)and LER was measured on leaf 3 between 4 and 6 days of treatment.Values are means (n = 5). Fitted linear regression is y = 0.21x + 30.8(r2 = 0.23).
genotypes, from 32.8 ± 0.6 to 52.1 ± 1.4 mm day−1,so the effect of salinity was expressed as a percent-age of controls. Elongation rate was most affected bysalt in the three turanicum lines, their elongation ratebeing 60, 61 and 65% of controls, and was least af-fected in the three durum lines, which were 79, 82 and85% of controls (Figure 2). However, there was only asmall correlation with shoot biomass production after25 days (r2 = 0.23).
The low correlation between short-term leaf elong-ation rate and long-term biomass production could bebecause the effect of salinity on leaf width could varybetween genotypes (i.e., the increase in leaf length isnot proportional to the increase in leaf area), or be-cause measuring the elongation rate of the leaf on themain stem is an insensitive index of total leaf area in-crease as the effect on the number of tillers is moreimportant. However, it is most likely that it was be-cause genotypic differences in the effect of salinity onrate of leaf growth take time to appear.
Having established that long-term experimentswere not feasible with large numbers of genotypes,trait-based screening methods were tested. The aim ofthe following experiments was to identify and valid-ate traits that could enable early detection of geneticdifferences in salinity tolerance.
208
Table 3. Salinity tolerance of hexaploid and tetraploid cultivars and selectionsgrown in control or salt treatment (150 mM NaCl) after 35 d (Experiment 1).Values are means (n = 9)
Category Genotype Shoot dry weight (g) Salt tolerance
name Control Salt treatment (%) control
or line
number
Hexaploids:
Cultivars Genaro 81 2.06 1.38 67
Quarrion 2.53 1.32 52
Halberd 2.80 1.33 48
Condor 2.56 0.99 39
Currawong 3.76 1.42 38
Spear 2.98 0.92 31
Kharchia 3.76 1.36 36
Tetraploids:
Cultivars Wollaroi 2.50 0.63 25
Altar 1.95 0.69 35
Selections Line 543 2.29 0.99 43
Line 248 2.87 1.21 42
Line 354 2.49 1.06 43
LSD(0.05) 0.36 0.14 6
The trait of sodium exclusion – rates of ionaccumulation in leaves
Trait evaluation (Experiment 3)
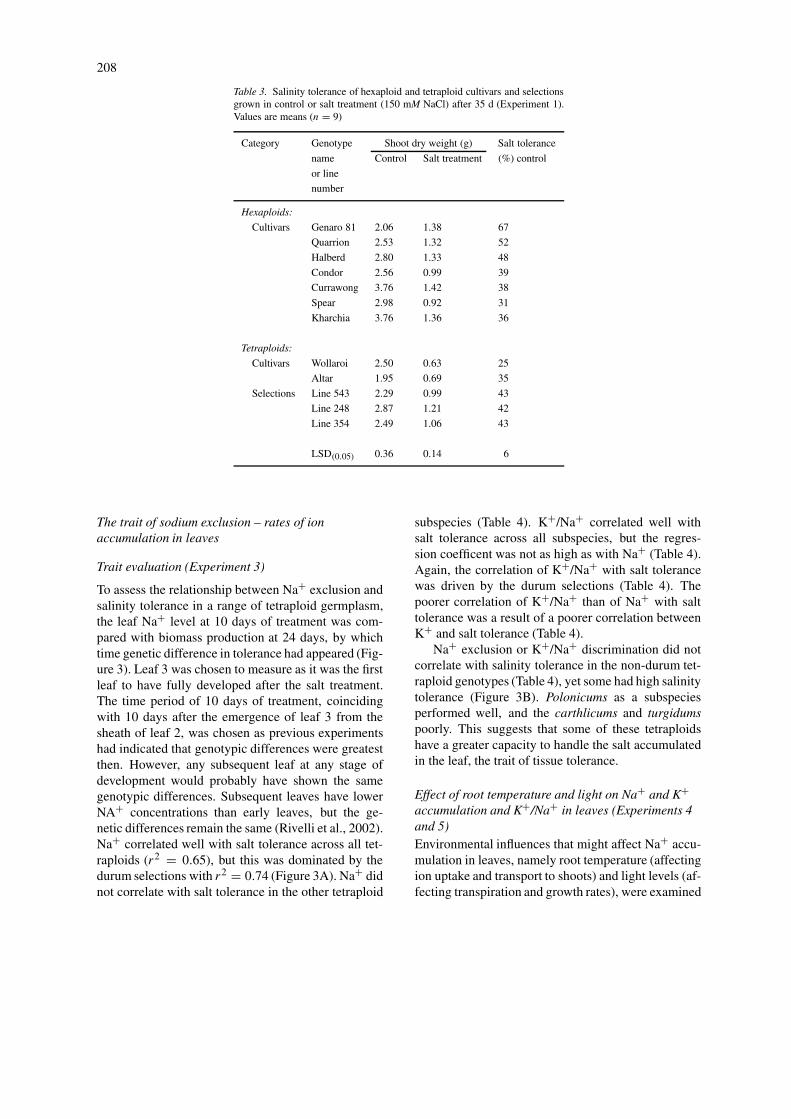
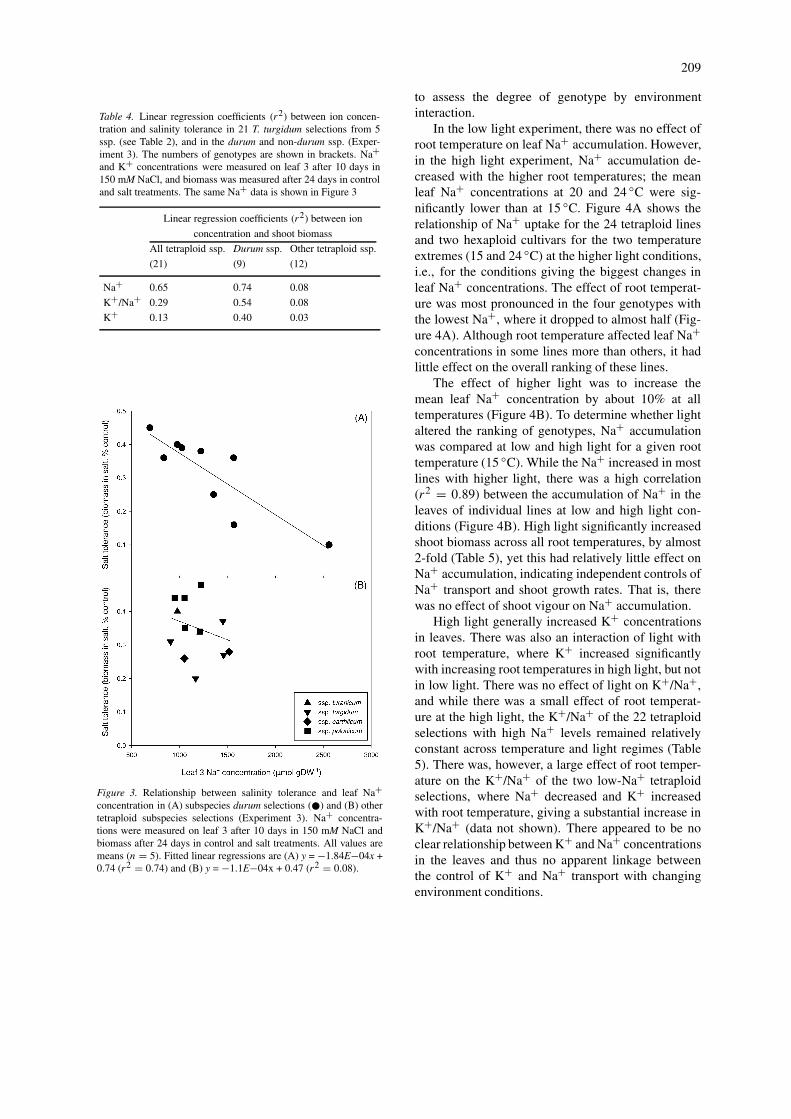
To assess the relationship between Na+ exclusion andsalinity tolerance in a range of tetraploid germplasm,the leaf Na+ level at 10 days of treatment was com-pared with biomass production at 24 days, by whichtime genetic difference in tolerance had appeared (Fig-ure 3). Leaf 3 was chosen to measure as it was the firstleaf to have fully developed after the salt treatment.The time period of 10 days of treatment, coincidingwith 10 days after the emergence of leaf 3 from thesheath of leaf 2, was chosen as previous experimentshad indicated that genotypic differences were greatestthen. However, any subsequent leaf at any stage ofdevelopment would probably have shown the samegenotypic differences. Subsequent leaves have lowerNA+ concentrations than early leaves, but the ge-netic differences remain the same (Rivelli et al., 2002).Na+ correlated well with salt tolerance across all tet-raploids (r2 = 0.65), but this was dominated by thedurum selections with r2 = 0.74 (Figure 3A). Na+ didnot correlate with salt tolerance in the other tetraploid
subspecies (Table 4). K+/Na+ correlated well withsalt tolerance across all subspecies, but the regres-sion coefficent was not as high as with Na+ (Table 4).Again, the correlation of K+/Na+ with salt tolerancewas driven by the durum selections (Table 4). Thepoorer correlation of K+/Na+ than of Na+ with salttolerance was a result of a poorer correlation betweenK+ and salt tolerance (Table 4).
Na+ exclusion or K+/Na+ discrimination did notcorrelate with salinity tolerance in the non-durum tet-raploid genotypes (Table 4), yet some had high salinitytolerance (Figure 3B). Polonicums as a subspeciesperformed well, and the carthlicums and turgidumspoorly. This suggests that some of these tetraploidshave a greater capacity to handle the salt accumulatedin the leaf, the trait of tissue tolerance.
Effect of root temperature and light on Na+ and K+accumulation and K+/Na+ in leaves (Experiments 4and 5)Environmental influences that might affect Na+ accu-mulation in leaves, namely root temperature (affectingion uptake and transport to shoots) and light levels (af-fecting transpiration and growth rates), were examined
209
Table 4. Linear regression coefficients (r2) between ion concen-tration and salinity tolerance in 21 T. turgidum selections from 5ssp. (see Table 2), and in the durum and non-durum ssp. (Exper-iment 3). The numbers of genotypes are shown in brackets. Na+and K+ concentrations were measured on leaf 3 after 10 days in150 mM NaCl, and biomass was measured after 24 days in controland salt treatments. The same Na+ data is shown in Figure 3
Linear regression coefficients (r2) between ion
concentration and shoot biomass
All tetraploid ssp. Durum ssp. Other tetraploid ssp.
(21) (9) (12)
Na+ 0.65 0.74 0.08
K+/Na+ 0.29 0.54 0.08
K+ 0.13 0.40 0.03
Figure 3. Relationship between salinity tolerance and leaf Na+concentration in (A) subspecies durum selections (�) and (B) othertetraploid subspecies selections (Experiment 3). Na+ concentra-tions were measured on leaf 3 after 10 days in 150 mM NaCl andbiomass after 24 days in control and salt treatments. All values aremeans (n = 5). Fitted linear regressions are (A) y = −1.84E−04x +0.74 (r2 = 0.74) and (B) y = −1.1E−04x + 0.47 (r2 = 0.08).
to assess the degree of genotype by environmentinteraction.
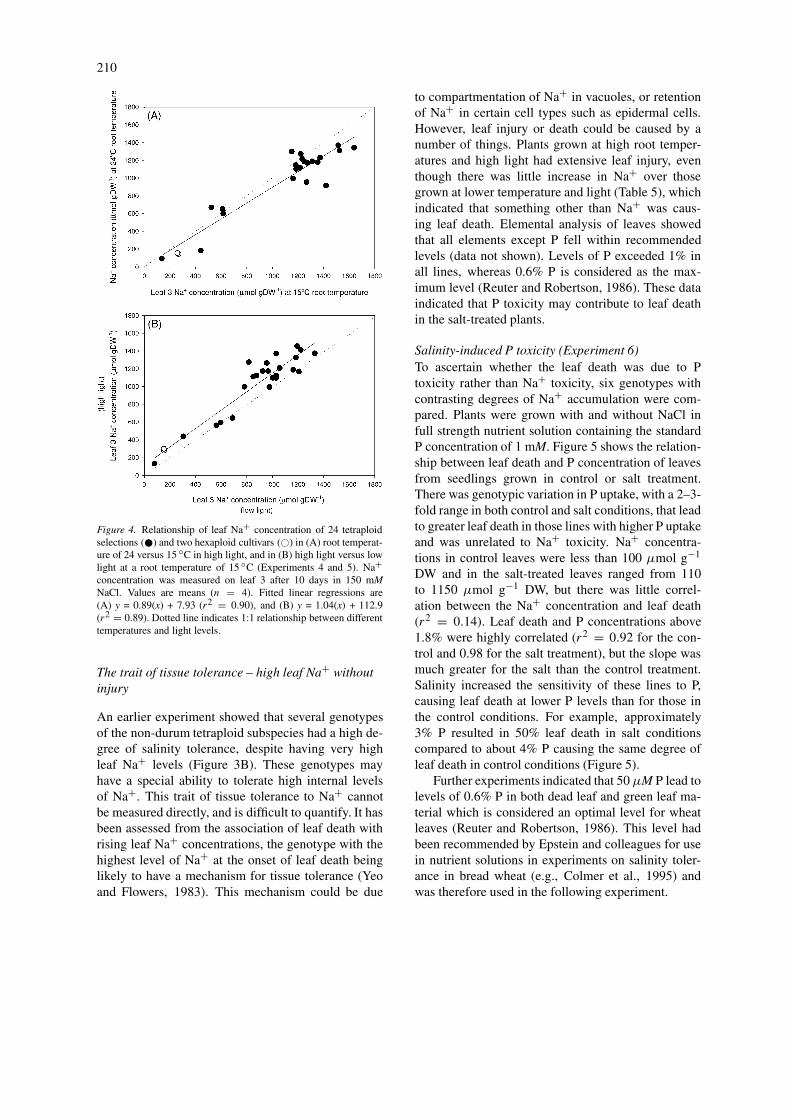
In the low light experiment, there was no effect ofroot temperature on leaf Na+ accumulation. However,in the high light experiment, Na+ accumulation de-creased with the higher root temperatures; the meanleaf Na+ concentrations at 20 and 24 ◦C were sig-nificantly lower than at 15 ◦C. Figure 4A shows therelationship of Na+ uptake for the 24 tetraploid linesand two hexaploid cultivars for the two temperatureextremes (15 and 24 ◦C) at the higher light conditions,i.e., for the conditions giving the biggest changes inleaf Na+ concentrations. The effect of root temperat-ure was most pronounced in the four genotypes withthe lowest Na+, where it dropped to almost half (Fig-ure 4A). Although root temperature affected leaf Na+concentrations in some lines more than others, it hadlittle effect on the overall ranking of these lines.
The effect of higher light was to increase themean leaf Na+ concentration by about 10% at alltemperatures (Figure 4B). To determine whether lightaltered the ranking of genotypes, Na+ accumulationwas compared at low and high light for a given roottemperature (15 ◦C). While the Na+ increased in mostlines with higher light, there was a high correlation(r2 = 0.89) between the accumulation of Na+ in theleaves of individual lines at low and high light con-ditions (Figure 4B). High light significantly increasedshoot biomass across all root temperatures, by almost2-fold (Table 5), yet this had relatively little effect onNa+ accumulation, indicating independent controls ofNa+ transport and shoot growth rates. That is, therewas no effect of shoot vigour on Na+ accumulation.
High light generally increased K+ concentrationsin leaves. There was also an interaction of light withroot temperature, where K+ increased significantlywith increasing root temperatures in high light, but notin low light. There was no effect of light on K+/Na+,and while there was a small effect of root temperat-ure at the high light, the K+/Na+ of the 22 tetraploidselections with high Na+ levels remained relativelyconstant across temperature and light regimes (Table5). There was, however, a large effect of root temper-ature on the K+/Na+ of the two low-Na+ tetraploidselections, where Na+ decreased and K+ increasedwith root temperature, giving a substantial increase inK+/Na+ (data not shown). There appeared to be noclear relationship between K+ and Na+ concentrationsin the leaves and thus no apparent linkage betweenthe control of K+ and Na+ transport with changingenvironment conditions.
210
Figure 4. Relationship of leaf Na+ concentration of 24 tetraploidselections (�) and two hexaploid cultivars (�) in (A) root temperat-ure of 24 versus 15 ◦C in high light, and in (B) high light versus lowlight at a root temperature of 15 ◦C (Experiments 4 and 5). Na+concentration was measured on leaf 3 after 10 days in 150 mMNaCl. Values are means (n = 4). Fitted linear regressions are(A) y = 0.89(x) + 7.93 (r2 = 0.90), and (B) y = 1.04(x) + 112.9(r2 = 0.89). Dotted line indicates 1:1 relationship between differenttemperatures and light levels.
The trait of tissue tolerance – high leaf Na+ withoutinjury
An earlier experiment showed that several genotypesof the non-durum tetraploid subspecies had a high de-gree of salinity tolerance, despite having very highleaf Na+ levels (Figure 3B). These genotypes mayhave a special ability to tolerate high internal levelsof Na+. This trait of tissue tolerance to Na+ cannotbe measured directly, and is difficult to quantify. It hasbeen assessed from the association of leaf death withrising leaf Na+ concentrations, the genotype with thehighest level of Na+ at the onset of leaf death beinglikely to have a mechanism for tissue tolerance (Yeoand Flowers, 1983). This mechanism could be due
to compartmentation of Na+ in vacuoles, or retentionof Na+ in certain cell types such as epidermal cells.However, leaf injury or death could be caused by anumber of things. Plants grown at high root temper-atures and high light had extensive leaf injury, eventhough there was little increase in Na+ over thosegrown at lower temperature and light (Table 5), whichindicated that something other than Na+ was caus-ing leaf death. Elemental analysis of leaves showedthat all elements except P fell within recommendedlevels (data not shown). Levels of P exceeded 1% inall lines, whereas 0.6% P is considered as the max-imum level (Reuter and Robertson, 1986). These dataindicated that P toxicity may contribute to leaf deathin the salt-treated plants.
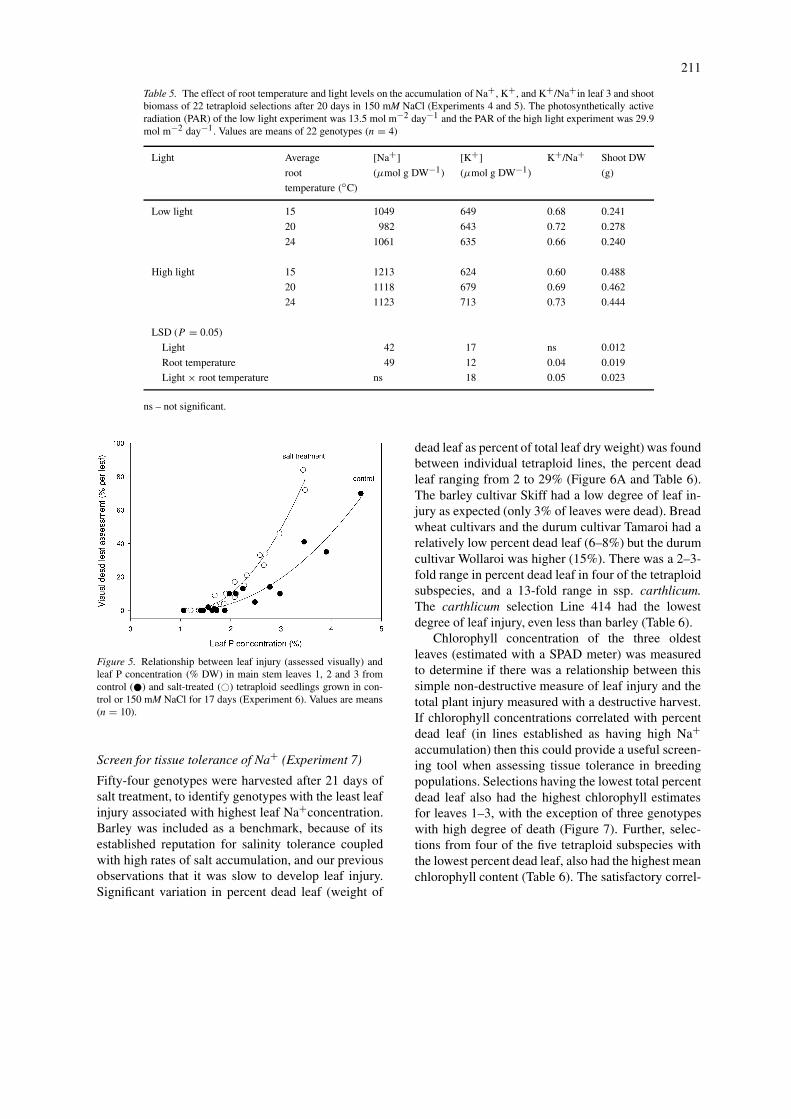
Salinity-induced P toxicity (Experiment 6)To ascertain whether the leaf death was due to Ptoxicity rather than Na+ toxicity, six genotypes withcontrasting degrees of Na+ accumulation were com-pared. Plants were grown with and without NaCl infull strength nutrient solution containing the standardP concentration of 1 mM. Figure 5 shows the relation-ship between leaf death and P concentration of leavesfrom seedlings grown in control or salt treatment.There was genotypic variation in P uptake, with a 2–3-fold range in both control and salt conditions, that leadto greater leaf death in those lines with higher P uptakeand was unrelated to Na+ toxicity. Na+ concentra-tions in control leaves were less than 100 µmol g−1
DW and in the salt-treated leaves ranged from 110to 1150 µmol g−1 DW, but there was little correl-ation between the Na+ concentration and leaf death(r2 = 0.14). Leaf death and P concentrations above1.8% were highly correlated (r2 = 0.92 for the con-trol and 0.98 for the salt treatment), but the slope wasmuch greater for the salt than the control treatment.Salinity increased the sensitivity of these lines to P,causing leaf death at lower P levels than for those inthe control conditions. For example, approximately3% P resulted in 50% leaf death in salt conditionscompared to about 4% P causing the same degree ofleaf death in control conditions (Figure 5).
Further experiments indicated that 50 µM P lead tolevels of 0.6% P in both dead leaf and green leaf ma-terial which is considered an optimal level for wheatleaves (Reuter and Robertson, 1986). This level hadbeen recommended by Epstein and colleagues for usein nutrient solutions in experiments on salinity toler-ance in bread wheat (e.g., Colmer et al., 1995) andwas therefore used in the following experiment.
211
Table 5. The effect of root temperature and light levels on the accumulation of Na+, K+, and K+/Na+in leaf 3 and shootbiomass of 22 tetraploid selections after 20 days in 150 mM NaCl (Experiments 4 and 5). The photosynthetically activeradiation (PAR) of the low light experiment was 13.5 mol m−2 day−1 and the PAR of the high light experiment was 29.9mol m−2 day−1. Values are means of 22 genotypes (n = 4)
Light Average [Na+] [K+] K+/Na+ Shoot DW
root (µmol g DW−1) (µmol g DW−1) (g)
temperature (◦C)
Low light 15 1049 649 0.68 0.241
20 982 643 0.72 0.278
24 1061 635 0.66 0.240
High light 15 1213 624 0.60 0.488
20 1118 679 0.69 0.462
24 1123 713 0.73 0.444
LSD (P = 0.05)
Light 42 17 ns 0.012
Root temperature 49 12 0.04 0.019
Light × root temperature ns 18 0.05 0.023
ns – not significant.
Figure 5. Relationship between leaf injury (assessed visually) andleaf P concentration (% DW) in main stem leaves 1, 2 and 3 fromcontrol (�) and salt-treated (�) tetraploid seedlings grown in con-trol or 150 mM NaCl for 17 days (Experiment 6). Values are means(n = 10).
Screen for tissue tolerance of Na+ (Experiment 7)
Fifty-four genotypes were harvested after 21 days ofsalt treatment, to identify genotypes with the least leafinjury associated with highest leaf Na+concentration.Barley was included as a benchmark, because of itsestablished reputation for salinity tolerance coupledwith high rates of salt accumulation, and our previousobservations that it was slow to develop leaf injury.Significant variation in percent dead leaf (weight of
dead leaf as percent of total leaf dry weight) was foundbetween individual tetraploid lines, the percent deadleaf ranging from 2 to 29% (Figure 6A and Table 6).The barley cultivar Skiff had a low degree of leaf in-jury as expected (only 3% of leaves were dead). Breadwheat cultivars and the durum cultivar Tamaroi had arelatively low percent dead leaf (6–8%) but the durumcultivar Wollaroi was higher (15%). There was a 2–3-fold range in percent dead leaf in four of the tetraploidsubspecies, and a 13-fold range in ssp. carthlicum.The carthlicum selection Line 414 had the lowestdegree of leaf injury, even less than barley (Table 6).
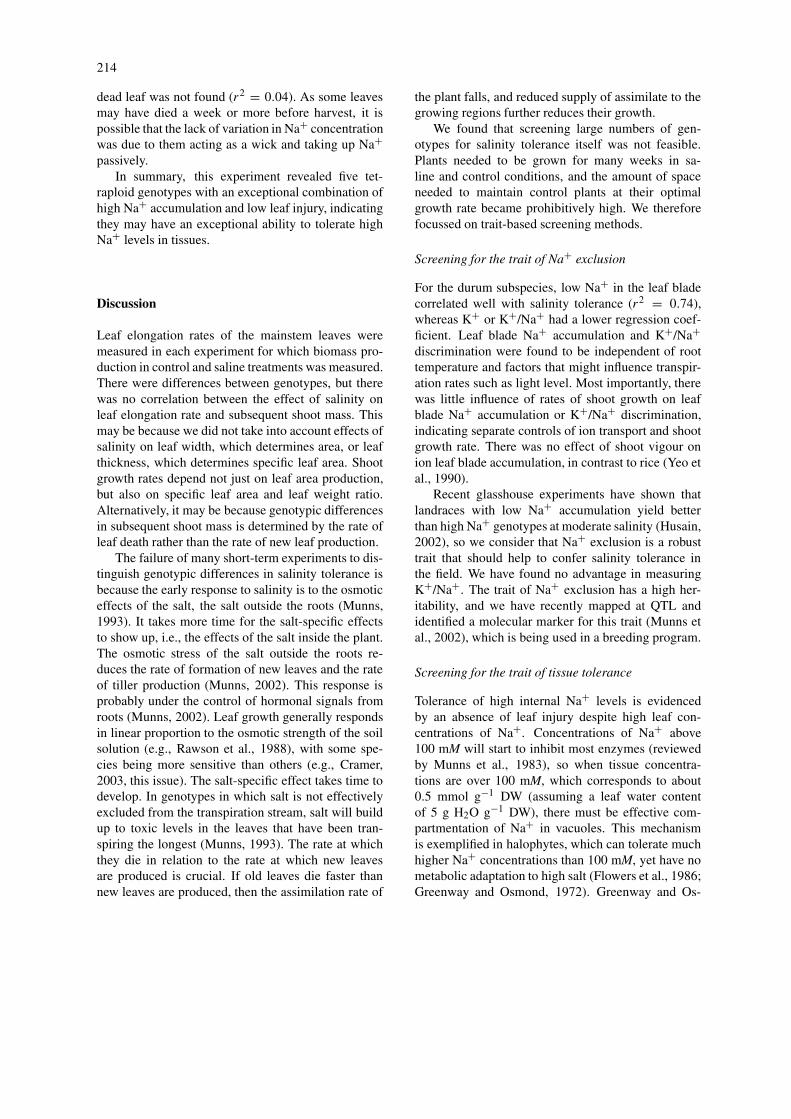
Chlorophyll concentration of the three oldestleaves (estimated with a SPAD meter) was measuredto determine if there was a relationship between thissimple non-destructive measure of leaf injury and thetotal plant injury measured with a destructive harvest.If chlorophyll concentrations correlated with percentdead leaf (in lines established as having high Na+accumulation) then this could provide a useful screen-ing tool when assessing tissue tolerance in breedingpopulations. Selections having the lowest total percentdead leaf also had the highest chlorophyll estimatesfor leaves 1–3, with the exception of three genotypeswith high degree of death (Figure 7). Further, selec-tions from four of the five tetraploid subspecies withthe lowest percent dead leaf, also had the highest meanchlorophyll content (Table 6). The satisfactory correl-
212
Table 6. Mean (n=4) and range of percent dead leaf (%DL), mean chlorophyll estimate (leaves 1, 2 and3 on main stem), total leaf Na+ content per percentage dead leaf , and Na+ concentration in dead leaf,in a number of genotypes from different subspecies of T. turgidum (the number of genotypes shown inbrackets), and cultivars of durum wheat, bread wheat and barley. Plants were grown in 150 mM NaCl for 21days (Experiment 7)
Genotypes Assessment %DL Mean chlorophyll Total leaf Na+ Na+ concentration
estimate of leaves per %DL in dead leaf
1, 2 and 3
(%) (SPAD units) (µmol) (mmol g DW−1)
Ssp. durum Min 5.1 12.2 15 1.46
selections (17) Max 15.2 35.2 58 4.68
Mean 10.1 22.1 38 3.72
Line 139 5.1 30.8 42 3.94
Ssp. polonicum Min 4.2 17.3 47 3.81
selections (11) Max 10.3 31.5 93 5.11
Mean 7.8 20.9 62 4.29
Line 255 4.2 31.5 93 3.81
Ssp. turgidum Min 5.6 16.0 28 3.60
selections (7) Max 12.5 29.9 88 4.32
Mean 9.0 23.2 58 3.94
Line 362 5.6 29.9 88 3.69
Ssp. carthlicum Min 2.2 10.7 17 2.97
selections (6) Max 28.4 32.7 108 4.23
Mean 18.1 20.1 43 3.54
Line 414 2.2 32.7 108 3.87
Ssp. turanicum Min 6.0 19.7 27 2.52
selections (6) Max 13.2 36.6 66 3.69
Mean 10.1 24.5 38 3.31
Line 528 6.0 36.6 66 2.52
Durum wheat Wollaroi 14.5 13.9 14 2.86
cultivars Tamaroi 8.4 28.7 37 4.30
Bread wheat Janz 8.0 19.9 23 2.97
cultivars Machete 7.6 20.7 21 3.83
Westonia 6.6 23.6 22 3.90
Kharchia 5.8 23.6 32 3.57
Barley cultivar Skiff 3.0 31.2 107 4.08
LSD (0.05) 5.5 9.1 29 1.06
ation between mean chlorophyll content and percentdead leaf (r2 = 0.51) suggests that a simple non-destructive measure of chlorophyll content (measuredusing a SPAD meter) would be an adequate surrog-
ate for measuring extremes in percent dead leaf whenscreening breeding populations.
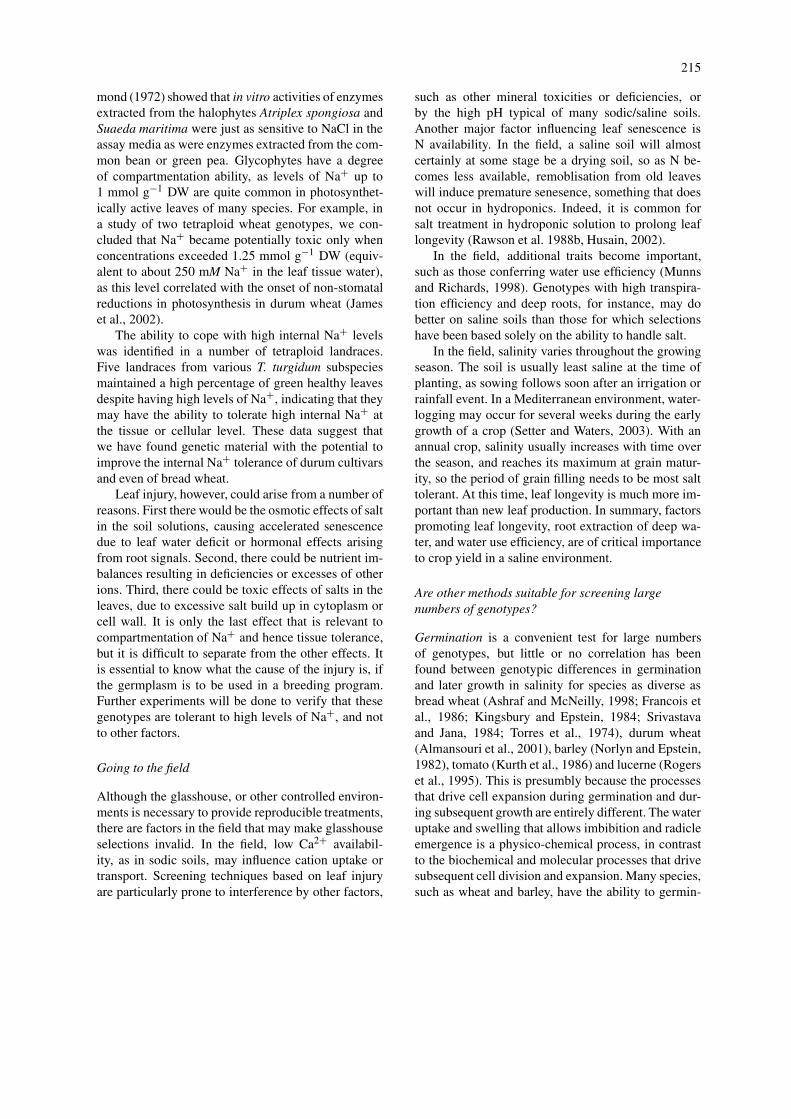
The total leaf Na+ content of individual genotypesdid not correlate with the percent dead leaf (Figure 8),
213
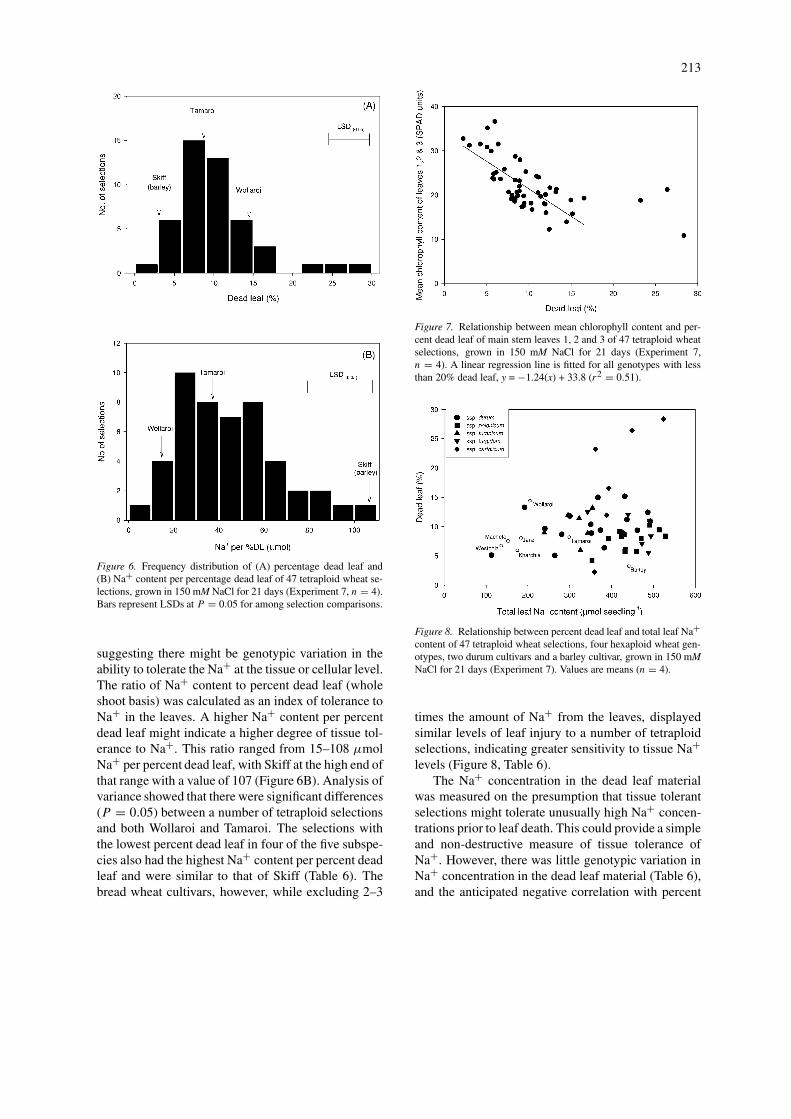
Figure 6. Frequency distribution of (A) percentage dead leaf and(B) Na+ content per percentage dead leaf of 47 tetraploid wheat se-lections, grown in 150 mM NaCl for 21 days (Experiment 7, n = 4).Bars represent LSDs at P = 0.05 for among selection comparisons.
suggesting there might be genotypic variation in theability to tolerate the Na+ at the tissue or cellular level.The ratio of Na+ content to percent dead leaf (wholeshoot basis) was calculated as an index of tolerance toNa+ in the leaves. A higher Na+ content per percentdead leaf might indicate a higher degree of tissue tol-erance to Na+. This ratio ranged from 15–108 µmolNa+ per percent dead leaf, with Skiff at the high end ofthat range with a value of 107 (Figure 6B). Analysis ofvariance showed that there were significant differences(P = 0.05) between a number of tetraploid selectionsand both Wollaroi and Tamaroi. The selections withthe lowest percent dead leaf in four of the five subspe-cies also had the highest Na+ content per percent deadleaf and were similar to that of Skiff (Table 6). Thebread wheat cultivars, however, while excluding 2–3
Figure 7. Relationship between mean chlorophyll content and per-cent dead leaf of main stem leaves 1, 2 and 3 of 47 tetraploid wheatselections, grown in 150 mM NaCl for 21 days (Experiment 7,n = 4). A linear regression line is fitted for all genotypes with lessthan 20% dead leaf, y = −1.24(x) + 33.8 (r2 = 0.51).
Figure 8. Relationship between percent dead leaf and total leaf Na+content of 47 tetraploid wheat selections, four hexaploid wheat gen-otypes, two durum cultivars and a barley cultivar, grown in 150 mMNaCl for 21 days (Experiment 7). Values are means (n = 4).
times the amount of Na+ from the leaves, displayedsimilar levels of leaf injury to a number of tetraploidselections, indicating greater sensitivity to tissue Na+levels (Figure 8, Table 6).
The Na+ concentration in the dead leaf materialwas measured on the presumption that tissue tolerantselections might tolerate unusually high Na+ concen-trations prior to leaf death. This could provide a simpleand non-destructive measure of tissue tolerance ofNa+. However, there was little genotypic variation inNa+ concentration in the dead leaf material (Table 6),and the anticipated negative correlation with percent
214
dead leaf was not found (r2 = 0.04). As some leavesmay have died a week or more before harvest, it ispossible that the lack of variation in Na+ concentrationwas due to them acting as a wick and taking up Na+passively.
In summary, this experiment revealed five tet-raploid genotypes with an exceptional combination ofhigh Na+ accumulation and low leaf injury, indicatingthey may have an exceptional ability to tolerate highNa+ levels in tissues.
Discussion
Leaf elongation rates of the mainstem leaves weremeasured in each experiment for which biomass pro-duction in control and saline treatments was measured.There were differences between genotypes, but therewas no correlation between the effect of salinity onleaf elongation rate and subsequent shoot mass. Thismay be because we did not take into account effects ofsalinity on leaf width, which determines area, or leafthickness, which determines specific leaf area. Shootgrowth rates depend not just on leaf area production,but also on specific leaf area and leaf weight ratio.Alternatively, it may be because genotypic differencesin subsequent shoot mass is determined by the rate ofleaf death rather than the rate of new leaf production.
The failure of many short-term experiments to dis-tinguish genotypic differences in salinity tolerance isbecause the early response to salinity is to the osmoticeffects of the salt, the salt outside the roots (Munns,1993). It takes more time for the salt-specific effectsto show up, i.e., the effects of the salt inside the plant.The osmotic stress of the salt outside the roots re-duces the rate of formation of new leaves and the rateof tiller production (Munns, 2002). This response isprobably under the control of hormonal signals fromroots (Munns, 2002). Leaf growth generally respondsin linear proportion to the osmotic strength of the soilsolution (e.g., Rawson et al., 1988), with some spe-cies being more sensitive than others (e.g., Cramer,2003, this issue). The salt-specific effect takes time todevelop. In genotypes in which salt is not effectivelyexcluded from the transpiration stream, salt will buildup to toxic levels in the leaves that have been tran-spiring the longest (Munns, 1993). The rate at whichthey die in relation to the rate at which new leavesare produced is crucial. If old leaves die faster thannew leaves are produced, then the assimilation rate of
the plant falls, and reduced supply of assimilate to thegrowing regions further reduces their growth.
We found that screening large numbers of gen-otypes for salinity tolerance itself was not feasible.Plants needed to be grown for many weeks in sa-line and control conditions, and the amount of spaceneeded to maintain control plants at their optimalgrowth rate became prohibitively high. We thereforefocussed on trait-based screening methods.
Screening for the trait of Na+ exclusion
For the durum subspecies, low Na+ in the leaf bladecorrelated well with salinity tolerance (r2 = 0.74),whereas K+ or K+/Na+ had a lower regression coef-ficient. Leaf blade Na+ accumulation and K+/Na+discrimination were found to be independent of roottemperature and factors that might influence transpir-ation rates such as light level. Most importantly, therewas little influence of rates of shoot growth on leafblade Na+ accumulation or K+/Na+ discrimination,indicating separate controls of ion transport and shootgrowth rate. There was no effect of shoot vigour onion leaf blade accumulation, in contrast to rice (Yeo etal., 1990).
Recent glasshouse experiments have shown thatlandraces with low Na+ accumulation yield betterthan high Na+ genotypes at moderate salinity (Husain,2002), so we consider that Na+ exclusion is a robusttrait that should help to confer salinity tolerance inthe field. We have found no advantage in measuringK+/Na+. The trait of Na+ exclusion has a high her-itability, and we have recently mapped at QTL andidentified a molecular marker for this trait (Munns etal., 2002), which is being used in a breeding program.
Screening for the trait of tissue tolerance
Tolerance of high internal Na+ levels is evidencedby an absence of leaf injury despite high leaf con-centrations of Na+. Concentrations of Na+ above100 mM will start to inhibit most enzymes (reviewedby Munns et al., 1983), so when tissue concentra-tions are over 100 mM, which corresponds to about0.5 mmol g−1 DW (assuming a leaf water contentof 5 g H2O g−1 DW), there must be effective com-partmentation of Na+ in vacuoles. This mechanismis exemplified in halophytes, which can tolerate muchhigher Na+ concentrations than 100 mM, yet have nometabolic adaptation to high salt (Flowers et al., 1986;Greenway and Osmond, 1972). Greenway and Os-
215
mond (1972) showed that in vitro activities of enzymesextracted from the halophytes Atriplex spongiosa andSuaeda maritima were just as sensitive to NaCl in theassay media as were enzymes extracted from the com-mon bean or green pea. Glycophytes have a degreeof compartmentation ability, as levels of Na+ up to1 mmol g−1 DW are quite common in photosynthet-ically active leaves of many species. For example, ina study of two tetraploid wheat genotypes, we con-cluded that Na+ became potentially toxic only whenconcentrations exceeded 1.25 mmol g−1 DW (equiv-alent to about 250 mM Na+ in the leaf tissue water),as this level correlated with the onset of non-stomatalreductions in photosynthesis in durum wheat (Jameset al., 2002).
The ability to cope with high internal Na+ levelswas identified in a number of tetraploid landraces.Five landraces from various T. turgidum subspeciesmaintained a high percentage of green healthy leavesdespite having high levels of Na+, indicating that theymay have the ability to tolerate high internal Na+ atthe tissue or cellular level. These data suggest thatwe have found genetic material with the potential toimprove the internal Na+ tolerance of durum cultivarsand even of bread wheat.
Leaf injury, however, could arise from a number ofreasons. First there would be the osmotic effects of saltin the soil solutions, causing accelerated senescencedue to leaf water deficit or hormonal effects arisingfrom root signals. Second, there could be nutrient im-balances resulting in deficiencies or excesses of otherions. Third, there could be toxic effects of salts in theleaves, due to excessive salt build up in cytoplasm orcell wall. It is only the last effect that is relevant tocompartmentation of Na+ and hence tissue tolerance,but it is difficult to separate from the other effects. Itis essential to know what the cause of the injury is, ifthe germplasm is to be used in a breeding program.Further experiments will be done to verify that thesegenotypes are tolerant to high levels of Na+, and notto other factors.
Going to the field
Although the glasshouse, or other controlled environ-ments is necessary to provide reproducible treatments,there are factors in the field that may make glasshouseselections invalid. In the field, low Ca2+ availabil-ity, as in sodic soils, may influence cation uptake ortransport. Screening techniques based on leaf injuryare particularly prone to interference by other factors,
such as other mineral toxicities or deficiencies, orby the high pH typical of many sodic/saline soils.Another major factor influencing leaf senescence isN availability. In the field, a saline soil will almostcertainly at some stage be a drying soil, so as N be-comes less available, remoblisation from old leaveswill induce premature senesence, something that doesnot occur in hydroponics. Indeed, it is common forsalt treatment in hydroponic solution to prolong leaflongevity (Rawson et al. 1988b, Husain, 2002).
In the field, additional traits become important,such as those conferring water use efficiency (Munnsand Richards, 1998). Genotypes with high transpira-tion efficiency and deep roots, for instance, may dobetter on saline soils than those for which selectionshave been based solely on the ability to handle salt.
In the field, salinity varies throughout the growingseason. The soil is usually least saline at the time ofplanting, as sowing follows soon after an irrigation orrainfall event. In a Mediterranean environment, water-logging may occur for several weeks during the earlygrowth of a crop (Setter and Waters, 2003). With anannual crop, salinity usually increases with time overthe season, and reaches its maximum at grain matur-ity, so the period of grain filling needs to be most salttolerant. At this time, leaf longevity is much more im-portant than new leaf production. In summary, factorspromoting leaf longevity, root extraction of deep wa-ter, and water use efficiency, are of critical importanceto crop yield in a saline environment.
Are other methods suitable for screening largenumbers of genotypes?
Germination is a convenient test for large numbersof genotypes, but little or no correlation has beenfound between genotypic differences in germinationand later growth in salinity for species as diverse asbread wheat (Ashraf and McNeilly, 1998; Francois etal., 1986; Kingsbury and Epstein, 1984; Srivastavaand Jana, 1984; Torres et al., 1974), durum wheat(Almansouri et al., 2001), barley (Norlyn and Epstein,1982), tomato (Kurth et al., 1986) and lucerne (Rogerset al., 1995). This is presumbly because the processesthat drive cell expansion during germination and dur-ing subsequent growth are entirely different. The wateruptake and swelling that allows imbibition and radicleemergence is a physico-chemical process, in contrastto the biochemical and molecular processes that drivesubsequent cell division and expansion. Many species,such as wheat and barley, have the ability to germin-
216
ate at very high salinity (over 300 mM NaCl), but theemerged radicle cannot grow further at this level ofsalinity. The physico-chemical nature of the swellingprocess during germination may explain why there isrelatively little difference between species in salt tol-erance to germination. For example, halophytes areno more salt tolerant than glycophytes at germination,although they quickly show their superior toleranceat the start of hypocotyl elongation (Malcolm et al.,2003).
There seems little value in screening for salinitytolerance of germination per se, at very high salinity,as it would be rare for a field to have a soil solution ofEC more than 20 dS m−1 (equivalent to 200 mM NaCl)at the time of planting. Fields are usually at their leastsaline at the time of planting. Seedling emergencefrom the soil is most likely to be more important thangermination, particularly if the soil surface is sodicand hard, when vigorous growth of the coleoptile androots is critical (Hollington, 1998).
Survival at high salinities is also a convenient test,and has been used in a number of studies (Kingsburyand Epstein, 1984; Sayad, 1985) but this is more relev-ant to perennials than annuals, because perennials mayhave an opportunity to recover from a period of highsalinity. Survival has been used successfully to selectfor the most tolerant genotypes within the perennialhalophyte, tall wheatgrass (Shannon, 1978). In anycase, screening species for survival of high salinity,rather than growth, carries the risk of selecting againstproductivity. As salinity is usually variable within afield, and most of the yield comes from the least sa-line areas, selecting for performance in a high-salinityenvironment alone may not be productive (Richards,1983).
Leaf injury can be measured by various methods,ranging from leaf disc leakage to chlorophyll fluor-escence. We found that the dark-adapted fluorescenceparameters Fv/Fm were no more sensitive an index ofsalt injury than chlorophyll content itself; both Fv/Fmand chlorophyll started to decrease at the same time(James et al., 2002). However, the light-adapted pho-tochemical quenching parameter NPQ was a moresensitive index of leaf injury; this started to increaseat the same time we observed non-stomatal effects onassimilation. This response coincided with a buildupof Na+ and Cl− above 250 mM, raising the possibiltyof a toxic ion effect on photosynthesis (James et al.,2002).
Tissue culture has been tried as method to gener-ate and select for genetic variation. However, plants
regenerated from selected cells or calluses have usu-ally shown no increase in tolerance over establishedcultivars (Dracup, 1993). This is probably becausesalt tolerance is not due to the action of a single cellalone, but depends on the structural and physiologicalintegrity of the whole plant.
Stomatal conductance could provide a positivescreen for salinity tolerance, and be better than a neg-ative screen such as leaf injury. In a study with twotetraploid genotypes, stomatal conductance was re-duced early in the life of the leaf, and was the initialcause of the reduced assimilation (James et al., 2002).It is likely that the reduced stomatal conductance wasdue to osmotic stress, generated via root signals, asit occurred before NaCl started to build up to highlevels in the leaf. Even so, if this is the major limitationto photosynthesis and growth, screening for stomatalconductance may be the most effective way of select-ing genotypes that will continue to grow fast in salinesoil. Screening for conductance could be done with aviscous flow porometer, which is much faster than adiffusion porometer (Rebetzke et al., 2000). Measur-ing gas exchange itself or even chlorophyll fluoresenceis not feasible as a screen, but can be valuable to in-vestigative a small number of germplasm selectionsthat have been obtained by quicker means.
Future need for screening methods
Rapid and specific screening methods will be neededfor screening large germplasm collections, for devel-oping molecular markers, for gene discovery, and forpyramiding traits or genes.
International collections undoubtedly hold manytreasures, including variation in salinity tolerance. Butto screen these is still a formidable task. Feasiblescreening methods should avoid the need to growplants under control conditions, and avoid pleiotropicor interactive effects of other variables such as geneticdifferences in growth rate, morphology or phenology.
Molecular markers can reduce the work involvedin phenotypic screens. Once a locus (QTL) or geneassociated with a specific trait is identified, a PCR-based molecular marker can be developed. Markerscan be tested on seeds or seedlings, and provide a cost-effective way of screening large numbers of individu-als in a segregating population. Molecular markersthen represent the ultimate in a selection technique –their use is non-destructive, and does not require con-trols or salt treatments. However, to identify a markerin the first place, a specific phenotype is needed, and
217
this is best developed from a physiologically basedselection technique.
For gene discovery using microarray approaches,specific screens will be more useful than just ‘salinitytolerance’, i.e., growth in saline versus control condi-tions. Specific screens will show whether the functionof the candidate gene is for osmotic or salt specificadaptation to salinity. Even in genetic engineering, aspecific phenotype will be useful to validate the func-tion of the transgene in different genetic backgrounds,and to allow pyramiding of different genes or traits.
Future breakthroughs in salinity tolerance willcome through an understanding of processes con-trolling the transport of Na+ and Cl− within the plant.These require specific cell types in specific locationswithin the plant catalysing transport in a coordinatedmanner. For example, genes controlling the efflux ofNa+ across the plasmamembrane may function use-fully only in epidermal cells of roots; efflux of Na+into the apoplast would be useless to cells in leavesat the end of the transpiration stream, and presum-ably also in the internal cells in roots while the plantwas transpiring. A deep understanding of whole planttolerance requires more knowledge of cell-specifictransport processes and the consequences of manipula-tion of transporters and signalling elements in specificcell types (Tester and Davenport, 2003). Understand-ing of the molecular genetics and physiology of thetraits conferring salinity tolerance will form the basisfor further improvements in the salinity tolerance ofagricultural species
Acknowledgements
We thank Dr Ray Hare for selecting and providingus with the tetraploid germplasm, Anna Rita Rivellifor valuable collaborative work at several key stagesof this study, Lorraine Mason for atomic absorptionspectroscopy, Dr Greg Rebetzke for advice on thestatistical analyses, and Drs Tim Colmer and JohnPassioura for critical advice on the manuscript.
References
Aharon G S, Apse M P, Duan S, Hua X, Zhang H-X, Blum-wald E 2003 Characterisation of a family of vacuolar Na+/H+antiporters in Arabidopsis thaliana. Plant Soil 253, 245–256.
Almansouri M, Kinet J-M and Lutts S 2001 Effect of salt and os-motic stresses on germination in durum wheat (Triticum durumDesf.). Plant Soil 231, 245–256.
Asch F, Dingkuhn M, Dörffling K and Miezan K 2000 Leaf K/Na ra-tio predicts salinity induced yield loss in irrigated rice. Euphytica113, 109–118.
Ashraf M and McNeilly T 1988 Variability in salt tolerance of ninespring wheat cultivars. J. Agron. Crop Sci. 160, 14–21.
Aslam M, Qureshi R H and Ahmed N 1993 A rapid screening tech-nique for salt tolerance in rice (Oryza sativa L.). Plant Soil 150,99–107.
Chhipa B R and Lal P 1995 Na/K ratios as the basis of salt tolerancein wheat. Aust. J. Agric. Res. 46, 533–539.
Cramer G R 2003 Differential effects of salinity on leaf elongationkinetics of three grass species. Plant Soil 253, 233–244.
Damania A B 1991 The use of genetic resouces in breeding durumwheat. Plant Breed. Abstr. 61, 873–881.
Dracup M 1993 Why does in vitro cell selection not improve thesalt tolerance of plants? In Genetic Aspects of Plant MineralNutrition. Eds. PJ Randall, E Delhaize, RA Richards and RMunns. pp. 137–142. Kluwer Academic Publishers, Dordrecht,The Netherlands.
Dvorák J, Noaman M M, Goyal S and Gorham J 1994 Enhancementof the salt tolerance of Triticum turgidum L. by the Kna1 locustransferred from the Triticum aestivum L. chromosome 4D byhomoeologous recombination. Theor. Appl. Gen. 87, 872–877.
Flowers T J and Yeo A R 1986 Ion relations of plants under droughtand salinity. Aust. J. Plant Physiol. 13, 75–91.
Flowers T J, Hajibagheri M A and Clipson N J W 1986 Halophytes.Q. Rev. Biol. 61, 313–337.
Fortmeier R and Schubert S 1995 Salt tolerance of maize (Zea maysL.): the role of sodium exclusion. Plant Cell Environ. 18, 1041–1047.
Francois L E, Maas E V, Donovan T J and Youngs V L 1986 Ef-fect of salinity on grain yield and quality, vegetative growth,and germination of semi-dwarf and durum wheat. Agron. J. 78,1053–1058.
Garcia A, Senadhira D, Flowers T J and Yeo A R 1995 The effectsof selection for sodium transport and of selection for agronomiccharacteristics upon salt resistance in rice (Oryza sativa L.).Theor. Appl. Gen. 90, 1106–1111.
Gorham J, Hardy C, Wyn Jones R G, Joppa L R and Law C N 1987Chromosomal location of a K/Na discrimination character in theD genome of wheat. Theor. Appl. Genet. 74, 584–588.
Greenway H and Munns R 1980 Mechanisms of salt tolerance innonhalophytes. Annu. Rev. Plant Physiol. 31, 149–190.
Greenway H and Osmond C B 1972 Salt responses of enzymes fromspecies differing in salt tolerance. Plant Physiol. 49, 256–259.
Hollington P A 1998 Technological breakthroughs in screen-ing/breeding wheat varieties for salt tolerance. National Con-ference on ‘Salinity management in agriculture’. CSSI Karnal,India, 2–5 December 1998.
Husain S 2002 Physiology and genetics of salt tolerance in durumwheat. A thesis submitted for the degree of Doctor of Philosophyof the Australian National University, Canberra, Australia.
James R A, Rivelli A R, Munns R and von Caemmerer S (2002)Factors affecting CO2 assimilation, leaf injury and growth insalt-stressed durum wheat. Funct. Plant Biol. 29, 1393–1403.
Joshi Y C, Qadar A and Rana R S 1979 Differential sodium andpotassium accumulation related to sodicity tolerance in wheat.Ind. J. Plant Physiol. 22, 226–230.
Kingsbury R W and Epstein E 1984 Selection for salt-resistantspring wheat. Crop Sci 24, 310–14.
Kurth E, Jensen A and Epstein E 1986 Resistance of fully imbibedtomato seeds to very high salinities. Plant Cell Environ. 9, 667–676.
218
Maas E V and Grieve C M 1990 Spike and leaf development insalt-stressed wheat. Crop Sci. 30, 1309–1313.
Malcolm C V, Lindley V A, O’Leary J W, Runciman H V andBarrett-Lennard E G 2003 Germination and establishment ofhalophyte shrubs in saline environments. Plant Soil 253, 171–185.
Martin P K, Ambrose M J and Koebner R M D 1994 A wheat ger-mplasm survey uncovers salt tolerance in genotypes not exposedto salt stress in the course of their selection. Aspects Appl. Biol.39, 215–222.
Miller D M 1987 Errors in the measurement of root pressure andexudation volume flow-rate caused by damage during the transferof unsupported roots between solutions. Plant Physiol. 85, 164–166.
Munns R 1993 Physiological processes limiting plant growth in sa-line soil: some dogmas and hypotheses. Plant Cell Environ. 16,15–24.
Munns R 2002 Comparative physiology of salt and water stress.Plant Cell Environ. 25, 239–250.
Munns R and Richards R A 1998 Improving crop productivity insaline soils. In Productivity and Sustainability: Shaping the Fu-ture. Proc. 2nd Int. Crop Science Congress. Eds. V L Chopra, RB Singh and A Varma. pp. 453–464. Oxford and IBH Publishing,New Delhi.
Munns R, Greenway H and Kirst G O 1983 Halotolerant eukaryotes.In Physiological Plant Ecology. III. Responses to the Chemicaland Biological Environment. Eds. OL Lange, PS Nobel, CB Os-mond and H Zeigler. pp. 59–135. Encycl. Plant Physiol., NewSeries, Vol. 12C. Springer, Berlin.
Munns R, Schachtman D P and Condon A G 1995 The significanceof a two-phase growth response to salinity in wheat and barley.Aust. J. Plant Physiol. 22, 561–569.
Munns R, Hare R A, James R A and Rebetzke G J 2000 Geneticvariation for improving the salt tolerance of durum wheat. Aust.J. Agric. Res. 51, 69–74.
Munns R, Husain S, Rivelli A R, James R A, Condon A G, LindsayM P, Lagudah E S, Schachtman D and Hare RA 2002 Avenues forincreasing salt tolerance of crops, and the role of physiologically-based selection traits. Plant Soil 247, 93–105.
Nicolas M E, Munns R, Samarakoon A B and Gifford R M 1993Elevated CO2 improves the growth of wheat under salinity. Aust.J. Plant Physiol. 20, 349–60.
Noble C L and Rogers M E 1992 Arguments for the use of physiolo-gical criteria for improving the salt tolerance in crops. Plant Soil146, 99–107.
Norlyn J D and Epstein E 1982 Barley production: irrigation withseawater on coastal soil. In Biosaline Research: A look to thefuture. Ed. A. San Pietro. pp. 525–529. Plenum, New York.
Norrish K and Hutton J T 1977 Plant analysis by X-ray spectro-metry 1. Low atomic number elements, sodium to calcium. X-raySpectrometry 6, 6–11.
Rawson H M, Richards R A and Munns R 1988 An examination ofselection criteria for salt-tolerance in wheat, barley and triticalegenotypes. Aust. J. Agric. Res. 39, 759–772.
Rengasamy P 2002 Transient salinity and subsoil constraints to dry-land farming in Australian sodic soils: an overview. Aust. J. Exp.Agric. 42, 351–361.
Rebetzke G J, Read J J, Barbour M M, Condon A G and RawsonH M 2000 A hand-held porometer for rapid assessment of leafconductance in wheat. Crop Sci. 40, 277–280.
Reuter D J and Robertson J B (Eds.) 1986 Plant Analysis – AnInterpretation Manual. Inkata Press, Melbourne.
Richards R A 1983 Should selection for yield in saline regions bemade on saline or non-saline soils? Euphytica 32, 431–438.
Ridley A M, Christy B, Dunin F X, Haines P J, Wilson K F andEllington A 2001 Lucerne in crop rotations on the Riverine Plains1: The soil water balance. Aust. J. Agric. Res. 52, 279–293.
Rivelli A R, James R A, Munns R and Condon A G 2002 Effect ofsalinity on water relations and growth of wheat genotypes withcontrasting sodium uptake. Funct. Plant Biol. 29, 1065–1074.
Rogers M E and Noble C L 1992 Variation in growth and ion accu-mulation between two selected populations of Trifolium repensL. differing in salt tolerance. Plant Soil 146, 131–136.
Rogers M E, Noble C L, Halloran G M and Nicolas M E 1995 Theeffect of NaCl on the germination and early seedling growth ofwhite clover (Trifolium repens L.) populations selected for highand low salinity tolerance. Seed Sci. Technol. 23, 277–287.
Sayed H I 1985 Diversity of salt tolerance in a germplasm collectionof wheat (Triticum spp.). Theor. Appl. Genet. 69, 651–657.
Schachtman D P, Munns R and Whitecross M I 1991 Variation ofsodium exclusion and salt tolerance in Triticum tauschii. CropSci. 31, 992–997.
Schachtman D P, Lagudah E S and Munns R 1992 The expression ofsalt tolerance from Triticum tauschii in hexaploid wheat. Theor.Appl. Genet. 84, 714–719.
Setter T M and Waters I 2003 Review of prospects for germplasmimprovement for waterlogging tolerance in wheat, barley andoats. Plant Soil 253, 1–33.
Shah S H, Gorham J, Forster B P and Wyn Jones R G 1987 Salttolerance in the Triticeae: the contribution of the D genome tocation selectivity in hexaploid wheat. J. Exp. Bot. 38, 254–69.
Shannon M C 1978 Testing salt tolerance variability among tallwheatgrass lines. Agron. J. 70, 719–722.
Srivastava J P and Jana S 1984 Screening wheat and barleygermplasm for salt tolerance. In Salinity Tolerance in Plants:Strategies for Crop Improvement. Ed. RC Staples and GHToenniessen. pp. 273–283. Wiley, New York, USA.
Tester M and Davenport R 2003 Na+ tolerance and Na+ transportin higher plants. Ann. Bot. 91, 503–527.
Torres B C, Bingham F T and Oertli J 1974 Salt tolerance of Mex-ican wheat: II Relation to variable sodium chloride and length ofgrowing season. Soil Sci. Amer. Proc. 38, 777–780.
Weimberg R 1987 Solute adjustment in leaves of two species ofwheat at two different stages of growth in response to salinity.Physiol Pant. 70, 381–388.
Yeo AR and Flowers TJ 1983 Varietal differences in the toxicity ofsodium ions in rice leaves. Physiol. Plant. 59, 189–195.
Yeo A R and Flowers T J 1986 Salinity resistance in rice (Oryzasativa L.) and a pyramiding approach to breeding varieties forsaline soils. Aust. J. Plant Physiol. 13, 161–73.
Yeo A R, Yeo M E, Flowers S A and Flowers T J 1990 Screeningof rice (Oryza sativa L.) genotypes for physiological charac-ters contributing to salinity resistance, and their relationship tooverall performance. Theor. Appl. Gen. 79, 377–384.
Zhu G Y, Kinet J-M, Lutts S 2001 Characterisation of rice (Oryzasativa L.) F3 populations selected for salt resistance. I. Physiolo-gical behaviour during vegetative growth. Euphytica 121, 25–263.