PRESENTATION TITLE ON ONE LINE AND ON TWO LINES First and last name Position, company Performance Study for JanusGraph Storage Backends, Scylla, Cassandra, and HBase Chin Huang, Software Engineer, IBM Ted Chang, Performance Engineer, IBM
Transcript
PRESENTATION TITLE ON ONE LINE AND ON TWO LINES
First and last namePosition, company
Performance Study for JanusGraph Storage Backends, Scylla, Cassandra, and HBase
Chin Huang, Software Engineer, IBM
Ted Chang, Performance Engineer, IBM
PRESENTATION TITLE ON ONE LINE AND ON TWO LINES
First and last namePosition, company
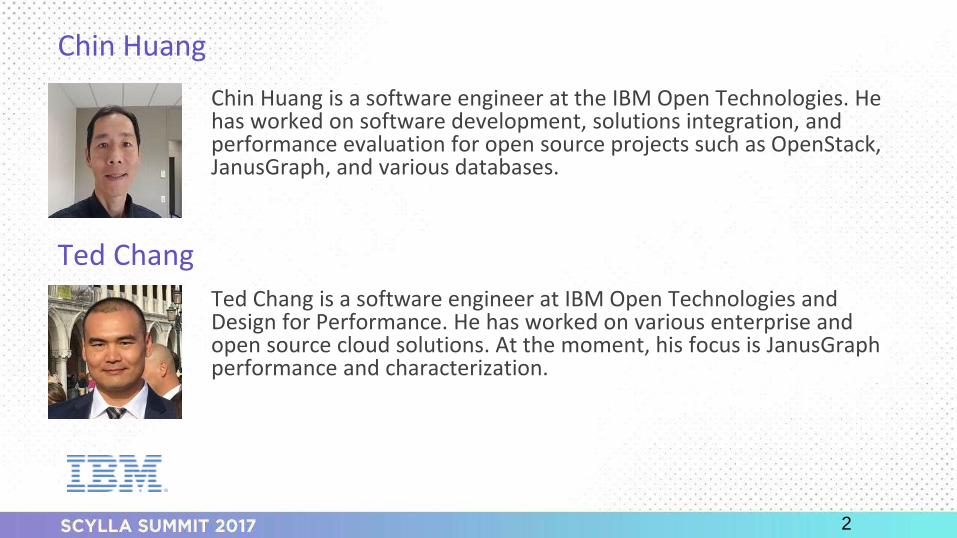
Chin Huang
Chin Huang is a software engineer at the IBM Open Technologies. He has worked on software development, solutions integration, and performance evaluation for open source projects such as OpenStack, JanusGraph, and various databases.
2
Ted Chang is a software engineer at IBM Open Technologies and Design for Performance. He has worked on various enterprise and open source cloud solutions. At the moment, his focus is JanusGraphperformance and characterization.
Ted Chang
PRESENTATION TITLE ON ONE LINE AND ON TWO LINES
First and last namePosition, company
Agenda
▪ Overview – Graph database storage backends
▪ Performance evaluation scenarios and results
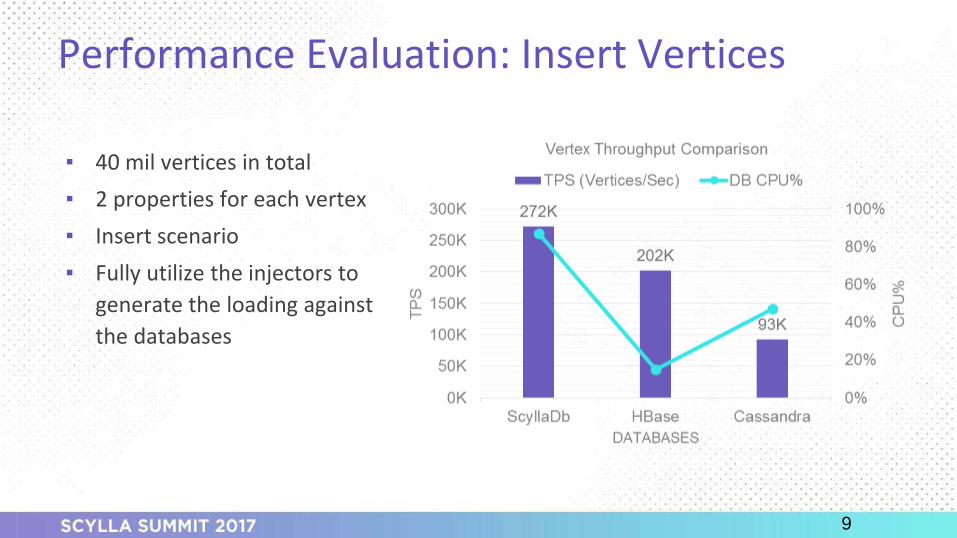
o Insert vertices (inserts)
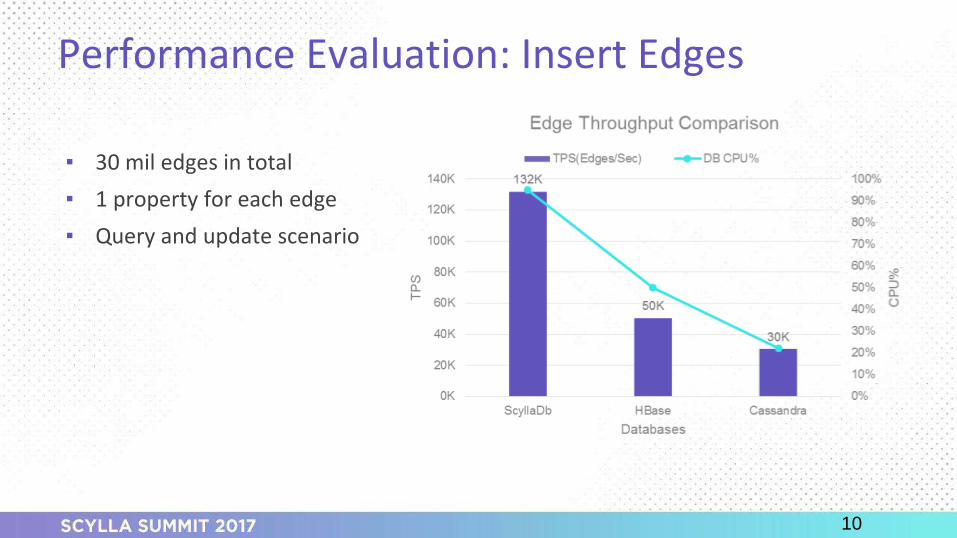
o Insert edges (= search + update)
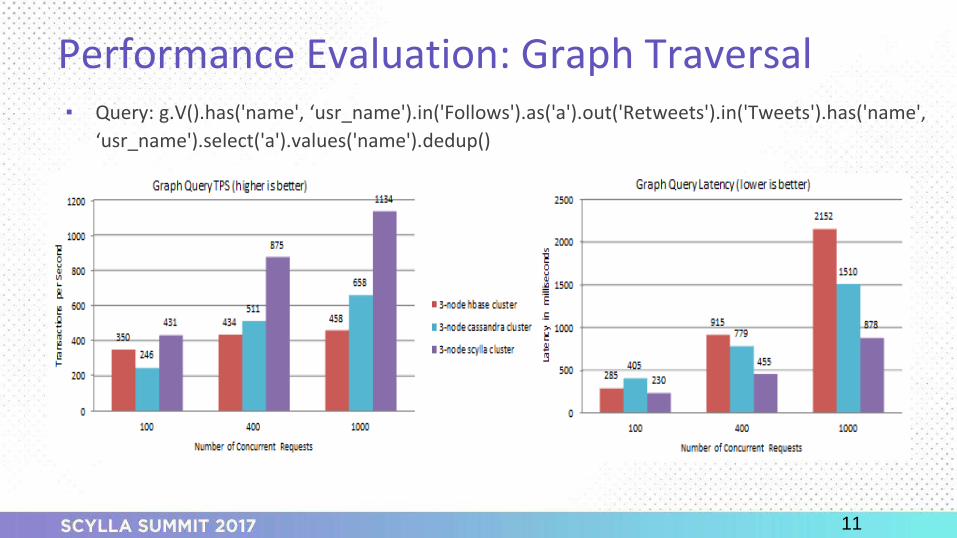
o Graph traversal (query)
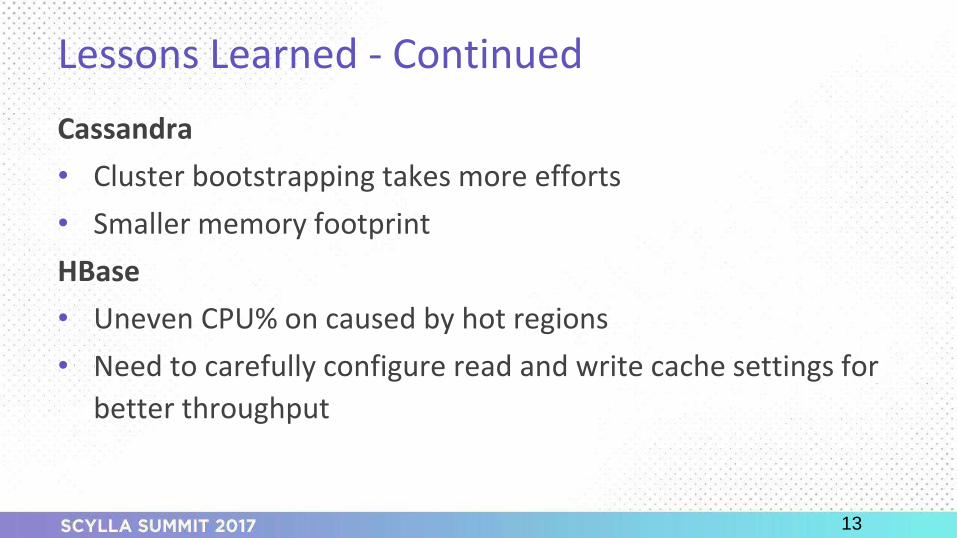
▪ Lessons learned
▪ Q&A
3
PRESENTATION TITLE ON ONE LINE AND ON TWO LINES
First and last namePosition, company
Overview – Graph database storage
backends
PRESENTATION TITLE ON ONE LINE AND ON TWO LINES
First and last namePosition, company
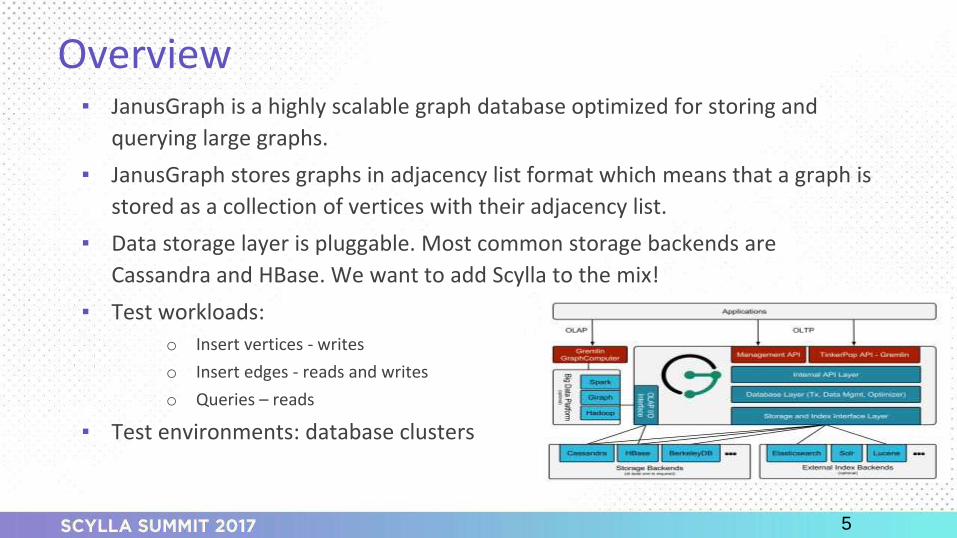
Overview▪ JanusGraph is a highly scalable graph database optimized for storing and
querying large graphs.
▪ JanusGraph stores graphs in adjacency list format which means that a graph is
stored as a collection of vertices with their adjacency list.
▪ Data storage layer is pluggable. Most common storage backends are
Cassandra and HBase. We want to add Scylla to the mix!
▪ Test workloads:
o Insert vertices - writes
o Insert edges - reads and writes
o Queries – reads
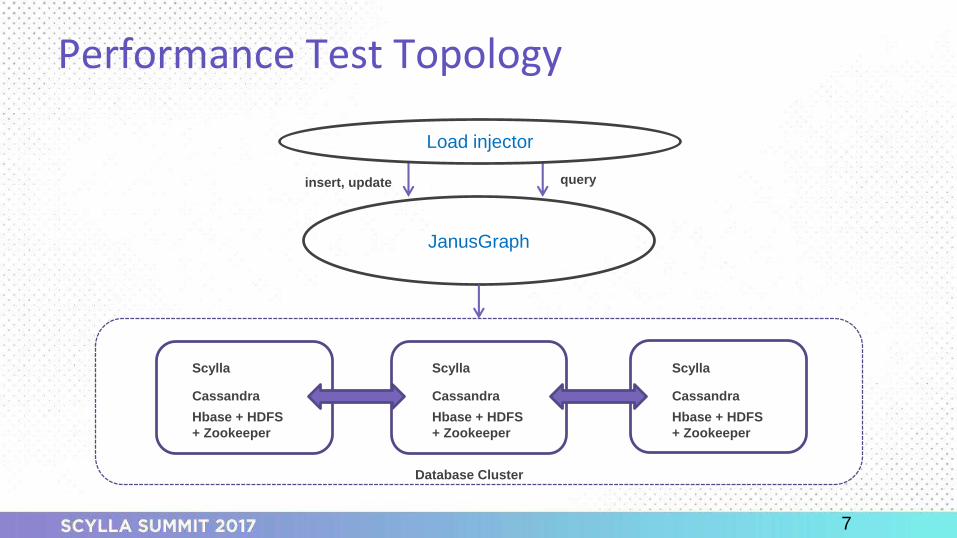
▪ Test environments: database clusters
5
PRESENTATION TITLE ON ONE LINE AND ON TWO LINES
First and last namePosition, company
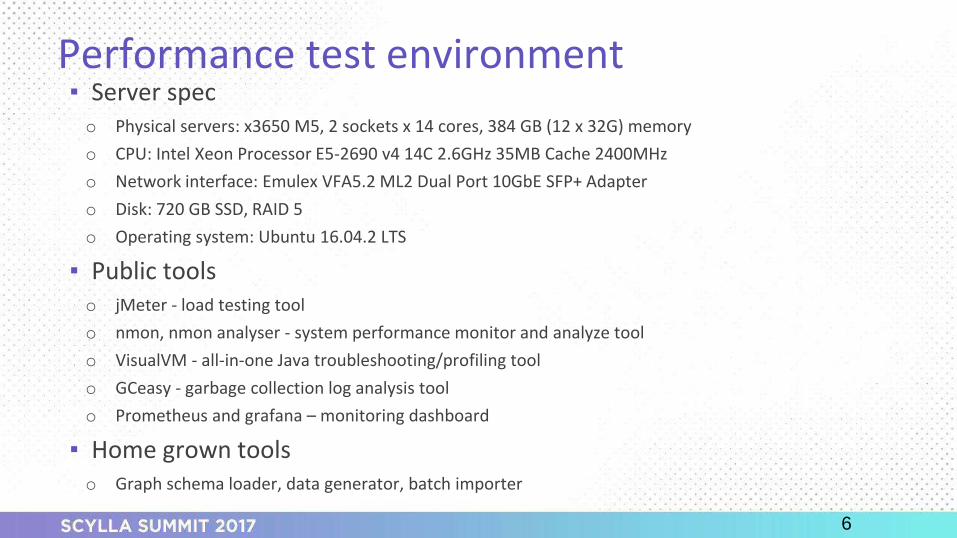
Performance test environment▪ Server speco Physical servers: x3650 M5, 2 sockets x 14 cores, 384 GB (12 x 32G) memory