+ All Categories
Home > Documents > sdarticle 7

sdarticle 7

Date post: 03-Apr-2018
Category:
Upload: praveenroyal
View: 220 times
Download: 0 times
Share this document with a friend
7
Journal of Chromatography A, 1135 (2006) 78–84 Use of inverse gas chromatography to account for the pervaporation perfor mance in monito ring the oxidat ion of primar y alcoho ls Sa ˆ ad Moulay , Hassiba Benguergoura, Ta¨ ıeb Aouak Facult´ e des Sciences de l’Ing´ enieur, D´ epartement de Chimie Industrielle, Universit´ e de Blida, Route de Soumˆ aa, B. P. 270, Blida 09000, Algeria Received 9 May 2006; received in revised form 29 July 2006; accepted 8 September 2006 Av ailable online 2 October 2006 Abstract The oxidation of n-propanol and n-butanol to their corresponding aldehydes was monitored by the pervaporation technique. Mass transfer phenomenon that occurs in the pervaporation process was conrmed by the results of invers e gas chromatography. Polydimethylsiloxane (PDMS), a hyd rophobic pol yme r wid ely emplo yed as a me mbr anein per vapor ati on tec hni que , wa s ev alu ate d as a sta tio nar y pha se in thi s stu dy . The re ten tion times of the dif fer ent mol ec ule s probes ( n-propanol, n-but anol, propionaldehyde, and butyr aldeh yde), mole cule s inv olve d as reac tants and produc ts in the oxidation reaction, gave an insight into the extent of the interactions between each of these molecules and the stationary phase. The innite dilution conditions allowed to measure the innite dilution activity coefcient, γ , and the specic retention volume, V 0 g , and to estimate the Flory-Huggins parameter interactions, χ 12 . The magnitudes of these parameters threw some light on the permselectivity of the membranes in the pervaporation operation. © 2006 Elsevier B.V. All rights reserved. Keywords: Interaction parameters; Inverse gas chromatograp hy; Oxidation reaction; PDMS membrane; Pervaporation 1. Intr oducti on Due to its energy-saving facet, pervaporation has become a vers atile techn ique to separ ate orga nic comp onents from orga nic mixtures [1,2]. Also, the recovery of organic compounds from wastew ater by means of the pervaporation technique has gained a special attention [3]. We used this technique to break down the microemulsion, a highly ordered system [4–6], monitor the oxidation of primary alcohols [7], and separate azeotropic mix- tures [8]. Its use to control some equilibrated organic reactions was reported [9]. In the pervaporation operation, as depicted in Fig. 1, the feed mixture is maintained in contact with the ups tre am side of a dense membrane and the per mea te (or the pervaporate) is continuously removed from the dowstream side of the membrane in vapor state by a vacuum pump. The use of a membrane would alter the vapor–liquid equilibrium (VLE). Of the aspects of the pervaporative membrane integrity, the che mic al nat ure in ter ms of org ani c fun cti ona l groups wit hin the Corresponding author. Tel.: +213 25 43 36 31; fax: +213 25 43 36 31.  E-mail address: [email protected] (S. Moulay). backbone or as pendent moieties, ensuring a varying polarity, determines its effectiveness in the pervaporation process. Sepa- rative membranes destined to the pervaporation are crosslinked polymeric mater ials in the follo wing forms: homop olyme rs, copol ymers , polymer blends, interp enetr ating networks, and best of all chemically modied (functionalized) polymers. The latter ones were conveniently made to enhance or reduce the polarity of the membrane with regard to the aim at applying the pervaporation. The existing or deliberately introduced func- tional groups within the membrane will selectively interact with the molecules to be separated. In the aim of provid ing a bet ter understan din g of the per va po- ration performance in the monitoring the oxidation of primary alcohols to their corresponding aldehydes, we thought of the approach of interaction parameters of Flory-Huggins, χ 12 . T o measure these interactions parameters, the inverse gas chro- matography (IGC) technique was employed because it is the reliable tool to quantify the extent of interactions between the probe and the stationary phase. According to the value of the interaction parameter, one can select among others the appro- priate membrane for a pervaporation work. Of the many uses of inv erse gas chromatogr aphy , its appli catio n in polymers- related phenomena has gained a paramount importance. In fact, 0021-9673/$ – see front matter © 2006 Elsevier B.V . All rights reserved. doi:10.1016/j.chroma.2006.09.046
Transcript

7/29/2019 sdarticle 7

http://slidepdf.com/reader/full/sdarticle-7 1/7

Journal of Chromatography A, 1135 (2006) 78–84

Use of inverse gas chromatography to account for the pervaporationperformance in monitoring the oxidation of primary alcohols

Saad Moulay ∗, Hassiba Benguergoura, Taıeb Aouak 

Facult´ e des Sciences de l’Ing´ enieur, D´ epartement de Chimie Industrielle, Universit´ e de Blida, Route de Soumˆ aa, B. P. 270, Blida 09000, Algeria

Received 9 May 2006; received in revised form 29 July 2006; accepted 8 September 2006

Available online 2 October 2006

Abstract

The oxidation of  n-propanol and n-butanol to their corresponding aldehydes was monitored by the pervaporation technique. Mass transferphenomenon that occurs in the pervaporation process was confirmed by the results of inverse gas chromatography. Polydimethylsiloxane (PDMS),

a hydrophobic polymer widely employed as a membranein pervaporation technique, was evaluated as a stationary phase in this study. The retention

times of the different molecules probes (n-propanol, n-butanol, propionaldehyde, and butyraldehyde), molecules involved as reactants and products

in the oxidation reaction, gave an insight into the extent of the interactions between each of these molecules and the stationary phase. The infinite

dilution conditions allowed to measure the infinite dilution activity coefficient, γ ∞, and the specific retention volume, V 0g , and to estimate the

Flory-Huggins parameter interactions, χ∞12. The magnitudes of these parameters threw some light on the permselectivity of the membranes in the

pervaporation operation.

© 2006 Elsevier B.V. All rights reserved.

Keywords: Interaction parameters; Inverse gas chromatography; Oxidation reaction; PDMS membrane; Pervaporation

1. Introduction

Due to its energy-saving facet, pervaporation has become a

versatile technique to separate organic components from organic

mixtures [1,2]. Also, the recovery of organic compounds from

wastewater by means of the pervaporation technique has gained

a special attention [3]. We used this technique to break down

the microemulsion, a highly ordered system [4–6], monitor the

oxidation of primary alcohols [7], and separate azeotropic mix-

tures [8]. Its use to control some equilibrated organic reactions

was reported [9]. In the pervaporation operation, as depicted

in Fig. 1, the feed mixture is maintained in contact with the

upstream side of a dense membrane and the permeate (or

the pervaporate) is continuously removed from the dowstream

side of the membrane in vapor state by a vacuum pump. The

use of a membrane would alter the vapor–liquid equilibrium

(VLE).

Of the aspects of the pervaporative membrane integrity, the

chemical nature in terms of organic functional groups within the

∗ Corresponding author. Tel.: +213 25 43 36 31; fax: +213 25 43 36 31.

 E-mail address: [email protected] (S. Moulay).

backbone or as pendent moieties, ensuring a varying polarity,determines its effectiveness in the pervaporation process. Sepa-

rative membranes destined to the pervaporation are crosslinked

polymeric materials in the following forms: homopolymers,

copolymers, polymer blends, interpenetrating networks, and

best of all chemically modified (functionalized) polymers. The

latter ones were conveniently made to enhance or reduce the

polarity of the membrane with regard to the aim at applying

the pervaporation. The existing or deliberately introduced func-

tional groups within the membrane will selectively interact with

the molecules to be separated.

In the aim of providing a better understanding of the pervapo-

ration performance in the monitoring the oxidation of primary

alcohols to their corresponding aldehydes, we thought of the

approach of interaction parameters of Flory-Huggins, χ12. To

measure these interactions parameters, the inverse gas chro-

matography (IGC) technique was employed because it is the

reliable tool to quantify the extent of interactions between the

probe and the stationary phase. According to the value of the

interaction parameter, one can select among others the appro-

priate membrane for a pervaporation work. Of the many uses

of inverse gas chromatography, its application in polymers-

related phenomena has gained a paramount importance. In fact,

0021-9673/$ – see front matter © 2006 Elsevier B.V. All rights reserved.

doi:10.1016/j.chroma.2006.09.046

7/29/2019 sdarticle 7

http://slidepdf.com/reader/full/sdarticle-7 2/7

S. Moulay et al. / J. Chromatogr. A 1135 (2006) 78–84 79

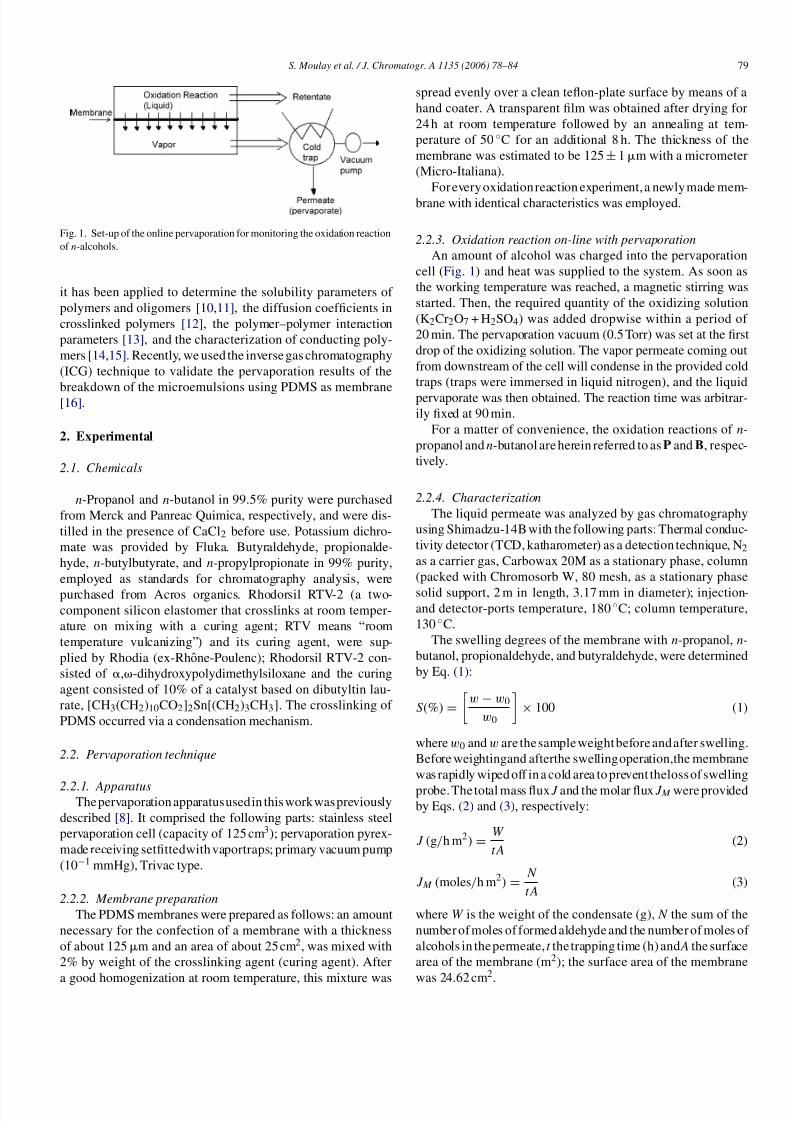
Fig. 1. Set-up of the online pervaporation for monitoring the oxidation reaction

of n-alcohols.

it has been applied to determine the solubility parameters of 

polymers and oligomers [10,11], the diffusion coefficients in

crosslinked polymers [12], the polymer–polymer interaction

parameters [13], and the characterization of conducting poly-

mers [14,15]. Recently, we used the inverse gas chromatography

(ICG) technique to validate the pervaporation results of the

breakdown of the microemulsions using PDMS as membrane[16].

2. Experimental

2.1. Chemicals

n-Propanol and n-butanol in 99.5% purity were purchased

from Merck and Panreac Quimica, respectively, and were dis-

tilled in the presence of CaCl2 before use. Potassium dichro-

mate was provided by Fluka. Butyraldehyde, propionalde-

hyde, n-butylbutyrate, and n-propylpropionate in 99% purity,

employed as standards for chromatography analysis, were

purchased from Acros organics. Rhodorsil RTV-2 (a two-component silicon elastomer that crosslinks at room temper-

ature on mixing with a curing agent; RTV means “room

temperature vulcanizing”) and its curing agent, were sup-

plied by Rhodia (ex-Rhone-Poulenc); Rhodorsil RTV-2 con-

sisted of  ,-dihydroxypolydimethylsiloxane and the curing

agent consisted of 10% of a catalyst based on dibutyltin lau-

rate, [CH3(CH2)10CO2]2Sn[(CH2)3CH3]. The crosslinking of 

PDMS occurred via a condensation mechanism.

2.2. Pervaporation technique

2.2.1. ApparatusThe pervaporation apparatus usedin this workwas previously

described [8]. It comprised the following parts: stainless steel

pervaporation cell (capacity of 125 cm3); pervaporation pyrex-

made receiving setfittedwith vaportraps; primary vacuum pump

(10−1 mmHg), Trivac type.

2.2.2. Membrane preparation

The PDMS membranes were prepared as follows: an amount

necessary for the confection of a membrane with a thickness

of about 125m and an area of about 25 cm2, was mixed with

2% by weight of the crosslinking agent (curing agent). After

a good homogenization at room temperature, this mixture was

spread evenly over a clean teflon-plate surface by means of a

hand coater. A transparent film was obtained after drying for

24 h at room temperature followed by an annealing at tem-

perature of 50 ◦C for an additional 8 h. The thickness of the

membrane was estimated to be 125±1m with a micrometer

(Micro-Italiana).

For every oxidation reaction experiment, a newly made mem-

brane with identical characteristics was employed.

2.2.3. Oxidation reaction on-line with pervaporation

An amount of alcohol was charged into the pervaporation

cell (Fig. 1) and heat was supplied to the system. As soon as

the working temperature was reached, a magnetic stirring was

started. Then, the required quantity of the oxidizing solution

(K2Cr2O7 + H2SO4) was added dropwise within a period of 

20 min. The pervaporation vacuum (0.5 Torr) was set at the first

drop of the oxidizing solution. The vapor permeate coming out

from downstream of the cell will condense in the provided cold

traps (traps were immersed in liquid nitrogen), and the liquid

pervaporate was then obtained. The reaction time was arbitrar-ily fixed at 90 min.

For a matter of convenience, the oxidation reactions of  n-

propanol and n-butanol are herein referred to as P and B, respec-

tively.

2.2.4. Characterization

The liquid permeate was analyzed by gas chromatography

using Shimadzu-14B with the following parts: Thermal conduc-

tivity detector (TCD, katharometer) as a detection technique, N2

as a carrier gas, Carbowax 20M as a stationary phase, column

(packed with Chromosorb W, 80 mesh, as a stationary phase

solid support, 2 m in length, 3.17 mm in diameter); injection-and detector-ports temperature, 180 ◦C; column temperature,

130 ◦C.

The swelling degrees of the membrane with n-propanol, n-

butanol, propionaldehyde, and butyraldehyde, were determined

by Eq. (1):

S (%) =

w−w0

w0

× 100 (1)

wherew0 andw are the sample weight before and after swelling.

Before weightingand afterthe swellingoperation,the membrane

was rapidly wiped off in a cold area to prevent theloss of swelling

probe. The total mass flux J and the molar flux J  M  were providedby Eqs. (2) and (3), respectively:

J (g/h m2) =W 

tA(2)

J M  (moles/h m2) =N 

tA(3)

where W  is the weight of the condensate (g), N  the sum of the

number of moles of formed aldehyde and the number of moles of 

alcohols in the permeate, t the trapping time (h) and A the surface

area of the membrane (m2); the surface area of the membrane

was 24.62 cm2

.

7/29/2019 sdarticle 7

http://slidepdf.com/reader/full/sdarticle-7 3/7

80 S. Moulay et al. / J. Chromatogr. A 1135 (2006) 78–84

2.3. Inverse gas chromatography technique

2.3.1. Equipment preparation

Gas chromatography used in this part of work was the

one cited above, Shimadzu-14B fitted with a TCD detector

(katharometer); N2 was as a carrier gas flowing at 5 mL/min

and a soap-film meter was employed to measure the gas flow

rates. For binary systems, the molecule probes were injected

individually with a 10L Hamilton syringe. Also, to assess

the effect of one component on the activity of the other, that

is the aldehyde in the presence of its corresponding alcohol, the

mixtures of two probes (propionaldehyde and n-propanol, and

butyraldehyde and n-butanol) were injected. These two mixtures

are herein designated M PP and M BB, respectively. The injection-

and detector-port temperatures were set at 160 ◦C. The column

was prepared as follows:

1. Chromosorb W was employed as a stationary phase solid

support (80 mesh, specific area of 1 m2 /g). Prior to use, it

was deactivatedwith an acidic washingfollowed by treatmentwith dimethyldichlorosilane (DMCS).

2. Impregnation of the solid support: Approximately 0.2 g of 

polymer (PDMS employed was thenon-crosslinked one) was

dissolved in 20 mL of ethyl acetate, and the solution was

placed into a 250 mL round-bottomed flask. After addition

of 2 g of the solid support, the slurry was well swirled before

evaporation of the solvent to dryness by means of a rota-

evaporator. Afterwards, the impregnated support was further

dried in vacuo in a drying-oven at a temperature of 40 ◦C for

48 h. The dried solid was then sieved before the following

step.

3. Column packing: A 1.50 m× 3.17 mm stainlesssteel columnwas thoroughly filled with the impregnated solid support.

To ensure a homogeneous packing, the filling operation was

secured with an electric vibrator.

4. Column conditioning: After the packing process, the column

was subjected to heat at a temperature of 200 ◦C for 48h

under a gas carrier flow rate of 3 mL/min.

2.3.2. Inverse gas chromatography parameters

The specific retention volume V 0g , the normalized volume of 

the carrier gas necessary to elute the molecule probe (solute) out

of the column, was calculated using Eqs. (4) and (5):

V 0g =jF (t R − t 0)

W s

273.15

T c(4)

j =3

2

(P in/P ou)2 − 1

(P in/P ou)3 − 1(5)

where t R is the measured retention time at maximum peak of 

the solute, t 0 the retention time of methane, j the James-Martin

pressure drop correction, F the saturated carrier gas flow rate, T cthe column temperature, W s the weight of the stationary phase,

Pin and Pou the pressures at the inlet and outlet, respectively. W swas taken 0.2 g, assuming that all the coated packing ends up in

the column.

Theinfinite dilution activity coefficient of the molecule probe

(γ ∞1 ), was estimated from the solute specific retention volume

using the following equation [17], Eq. (6):

ln(γ ∞1 ) = ln

273.15R

M 1P 01V 

0g

−P 01 (B11 − V 1)

RT (6)

where R is the universal gas constant, M 1 the molar mass of thesolute, P 01 the saturated pressure of solute at temperature T , V 1the molar volume of the solute, B11 the second virial coefficient

of the probe, its values at the different temperatures were taken

from [18].

The Flory Huggins interaction parameter χ∞12 is related to the

specific retention volume according to the following relation

[19], Eq. (7), where d 1 and d 2 are the densities of the solute and

the stationary phase, respectively, and V 2 is the molar volume of 

the stationary phase. By assuming ln d 1 / d 2 =0 and V 1 /V 2→0

[19], Eq. (7) can be simplified to Eq. (8).

χ∞12 = ln 273.15R

M 1P 01V 

0g

−P 0

1(B

11− V 

1)

RT − ln

d 1d 2−

1−V 

1V 2

(7)

χ∞12 = ln γ ∞1 − 1 (8)

3. Results and discussion

3.1. Sorption/pervaporation

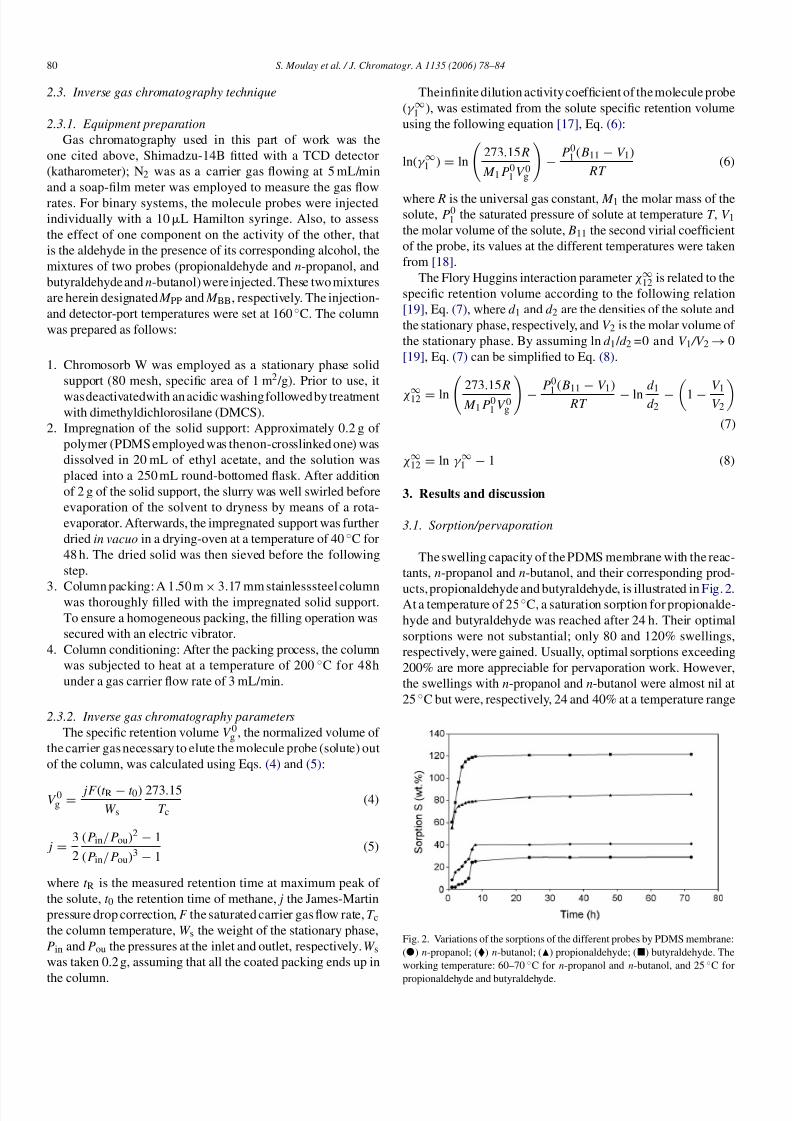
The swelling capacity of the PDMS membrane with the reac-

tants, n-propanol and n-butanol, and their corresponding prod-

ucts, propionaldehyde and butyraldehyde, is illustrated in Fig. 2.At a temperature of 25 ◦C, a saturation sorption for propionalde-

hyde and butyraldehyde was reached after 24 h. Their optimal

sorptions were not substantial; only 80 and 120% swellings,

respectively, were gained. Usually, optimal sorptions exceeding

200% are more appreciable for pervaporation work. However,

the swellings with n-propanol and n-butanol were almost nil at

25 ◦C but were, respectively, 24 and 40% at a temperature range

Fig. 2. Variations of the sorptions of the different probes by PDMS membrane:

() n-propanol; () n-butanol; () propionaldehyde; () butyraldehyde. The

working temperature: 60–70 ◦C for n-propanol and n-butanol, and 25 ◦C for

propionaldehyde and butyraldehyde.

7/29/2019 sdarticle 7

http://slidepdf.com/reader/full/sdarticle-7 4/7

S. Moulay et al. / J. Chromatogr. A 1135 (2006) 78–84 81

Fig. 3. Variations of the total mass flux J for systems P and B vs. temperature.

Reaction time, 90 min.

of 60–70 ◦C after 30 h. The course of the oxidation reaction

of  n-propanol and n-butanol to their aldehydes was monitored

by the on-line pervaporation to avoid the over-oxidation which

may afford carboxylic acids, hemiacetals, and the corresponding

esters. In fact, the analysis of the permeate by chromatographyrevealed the presence of aldehyde as the exclusive product and

the non-reacted alcohol under the actual oxidation reaction con-

ditions. The total mass and molar fluxes J and J  M  as a function

of temperature are shown in Figs. 3 and 4. It can be noticed that

the total fluxes were found to increase with the reaction tem-

perature and more significantly beyond a temperature of 70 ◦C.

Raising thetemperature of thefeed would speed up theoxidation

reaction leading to more substantial formation of the aldehyde

and, consequently, the flux rises. In the case of the system B,

the fluxes were higher than those for the system P which is in

a good agreement with the fact that to the better sorption cor-

responds the higher flux [20]. Fig. 5 shows the evolution of the

aldehyde concentration in the pervaporate as a function of thereaction temperature. In both cases, B and P, the aldehyde con-

tent increased at temperatures lower than 65 ◦C, but dropped

beyond the latter temperature. The ester started to form at tem-

peratures higher than 65 ◦C. Overall, the butyraldehyde fraction

was nearly always higher than that of the propionaldehyde.

Again, this can be explained by the difference in the sorption

capacities of these aldehydes by PDMS membrane.

Fig. 4. Variations of thetotalmolar flux J  M  for systems P and B vs. temperature.

Reaction time, 90 min.

Fig. 5. Variations of the concentration of aldehyde in the permeate (wt.%) vs.

temperature: () propionaldehyde; () butyraldehyde. Reaction time, 90 min.

3.2. IGC results

The inverse gas chromatography technique was used as analternative to validate our results in the oxidation reaction of pri-

mary alcohols to their corresponding aldehydes using the perva-

poration technique. Although the pervaporation and the inverse

gas chromatographytechniquesare quitedifferent in theirproper

functions, they share one feature which is the involvement of the

sorption-diffusion-desorption phenomenon. On the one hand,

the probe in IGC isin a gaseous state, but it isin a liquid phase in

pervaporation (in the feed). On the other hand, its concentration

in theformer techniqueis lowerthan that in thelatter one. Yet,the

performances of both techniques are linked to the interactions

between the probe and the polymeric material (as membrane in

pervaporation and as stationary phase in IGC). Thus, an IGCstudy would give a first insight into the magnitude of the inter-

action of the probe with membrane in pervaporation technique

and, consequently, into the permselectivity performance.

The methodology of this present study was first to assess

the interactions within a binary system consisting of a

solute (molecule probe) and the solvent (polymeric stationary

phase), and, second, to consider those within M PP /PDMS and

 M BB /PDMS systems. The working temperatures were between

40and100 ◦C. The differentresults aregatheredin Tables1and2

in which the results for only the lowest and highest temperatures

are given.

The profile of the plot ln V g = f (1/ T ) is claimed to bea straight

line with a positive slope for temperatures higher than the glasstransition temperature, T g, of the polymer used as a sorbent.

In our case, the working temperatures were higher than the T gof PDMS (−123 ◦C) and the results indicate that the expected

straight lines were indeed observed for all systems studied.

Figs. 6–9 illustrate the plots ln V g = f (1/ T ) for the different sor-

bates. With the exceptionof propionaldehyde,straight lineswere

found for all sorbates; the curves of propionaldehyde in the sys-

tems showed a deviation starting at 60 ◦C as can be seen in

Fig. 7. A general observation is that the retention volume of 

every sorbate remained unaffected by the presence of the other

one beyond temperatures higher than 80–90 ◦C; however, the

effect of the presence of other component gradually manifested

7/29/2019 sdarticle 7

http://slidepdf.com/reader/full/sdarticle-7 5/7

82 S. Moulay et al. / J. Chromatogr. A 1135 (2006) 78–84

Table 1

Thermodynamic and chromatographic results for the sorbates: n-propanol and propionaldehyde

Binary system M PP /PDMS system

Sorbate n-Propanol Propionaldehyde n-Propanol Propionaldehyde

T (◦C) 40 100 40 100 40 100 40 100

V g (mL/g) 118.91 73.96 70.60 64.00 108.65 69.71 67.62 62.92

ln γ ∞

3.97 1.57 2.05 0.40 3.99 1.58 2.04 0.40χ∞12 2.97 0.57 1.05 −0.60 2.99 0.58 1.04 −0.60

 H a (kJmol−1) −5.836 −5.836 −2.145 −2.145 −5.316 −5.316 −1.690 −1.690

Ga (kJmol−1) −12.74 −14.25 −11.38 −13.80 −12.50 −14.06 −11.27 −13.75

Table 2

Thermodynamic and chromatographic results for the sorbates: n-butanol and butyraldehyde

Binary system M BB /PDMS system

Sorbate n-Butanol Butyraldehyde n-Butanol Butyraldehyde

T (◦C) 40 100 40 100 40 100 40 100

V g (mL/g) 231.67 91.28 126.18 72.44 216.03 87.21 107.38 71.99

ln γ ∞

4.14 1.91 2.37 0.79 2.30 1.92 2.43 0.80χ∞12 3.14 0.91 1.37 −0.21 3.30 0.92 1.43 −0.20

 H a (kJmol−1) −13.088 −13.088 −6.010 −6.010 −10.340 −10.340 −5.190 −5.190

Ga (kJmol−1) −14.47 −14.90 −12.89 −14.18 −14.29 −14.762 −12.472 −14.167

Fig. 6. Variations of ln V 0g = f (1/T ): () n-propanol in a binary system; ()

n-propanol in M PP /PDMS system.

Fig.7. Variations of ln V 0g = f (1/T ): () propioanaldehydein a binary system;

() propionaldehyde in M PP /PDMS system.

Fig. 8. Variations of ln V 0g = f (1/T ): () n-butanol in a binary system; ()

n-butanol in M BB /PDMS system.

Fig. 9. Variations of ln V 0g = f (1/T ): () butyraldehyde in a binary system;

() butyraldehyde in M BB

 /PDMS system.

7/29/2019 sdarticle 7

http://slidepdf.com/reader/full/sdarticle-7 6/7

S. Moulay et al. / J. Chromatogr. A 1135 (2006) 78–84 83

Fig. 10. Plots of  γ ∞i = f (1/T ): B, C, D, and E, for n-butanol, n-propanol,

butyraldehyde, and propionaldehyde, respectively, in binary systems.

at lower temperatures. The retention volumes of the primary

alcohols, n-propanol and n-butanol, were greater than those of their corresponding aldehydes, and these results are in accor-

dance with the sorption differences discussed above.

The variations of the infinite dilution activity coefficients

γ ∞i of the solutes were found to decrease with temperature

(Figs. 10 and 12). It can be remarked that γ ∞i ’s (n-propanol,

n-butanol) are greater than γ ∞i ’s (propionaldehyde, butyralde-

hyde), suggesting an enhanced solvatation of the PDMS macro-

molecular chains, thus a better penetration of propionaldehyde

and butyraldehyde in the membrane. Those of butyraldehyde

were, in turn, lower than those of propionaldehyde, explaining

the higher flux and concentration of butyraldehyde (Figs. 3–5).

The binary interaction parameter of Flory-Huggins, χ∞

12

, varies

with temperature (Figs. 11 and 13) and was found to decrease

almost linearly by raising the temperature for all sorbates as the

theory predicts [21]. The smaller the χ∞12, the better the absorp-

tion of the probe by PDMS, indicating a greater compatibility of 

the probe with the polymer and, consequently, a better diffusion

into themembrane. Thus, thepermselectivity of themembraneis

more favorable for aldehydes than their corresponding alcohols.

At higher temperatures, i.e. 100 ◦C, the interaction parameters

Fig. 11. Plots of  χ∞12 = f (1/T ): B, C, D, and E, for n-butanol, n-propanol,

butyraldehyde, and propionaldehyde, respectively, in binary systems.

Fig. 12. Plots of  γ ∞i = f (1/T ): B, C, D, and E, for n-butanol, n-propanol,

butyraldehyde, and propionaldehyde, respectively, in M PP /PDMS and M BB / 

PDMS systems.

were found negative in the case of aldehydes, indicating a strong

interaction of these sorbates with PDMS membranes. Moreover,the χ∞12 values imply that the selectivity in the oxidation of  n-

butanol would be greater than that in the oxidation of n-propanol

Figs. 12 and 13.

Enthalpies of absorption,  H a, were calculated from the

slopes of the straight lines of the retention diagrams illustrated

in Figs. 6–9, and according to the following equation, Eq. (9):

H a = − R

∂ ln V 0g

∂(1/T )

(9)

The magnitudes of the enthalpies of absorption given in

Tables 1 and 2 also provide an insight into the behavior of 

the membrane towards the components involved in the oxi-dation reactions in study. The | H a| values suggest that the

enthalpies of absorption are due more likely to the Van der

Waalsdipole–dipole interactions (2.1–8.4 kJ mol−1)andslightly

to hydrogen bonding (10–40kJ mol−1) between the sorbate and

the sorbent, and not to the heats of condensation as the  H vvalues of the sorbates in study exceed 20 kJ mol−1.

Fig. 13. Plots of  χ∞12 = f (1/T ): B, C, D, and E, for n-butanol, n-propanol,

butyraldehyde, and propionaldehyde, respectively, in M PP /PDMS and M BB / 

PDMS systems.

7/29/2019 sdarticle 7

http://slidepdf.com/reader/full/sdarticle-7 7/7

84 S. Moulay et al. / J. Chromatogr. A 1135 (2006) 78–84

The free enthapies of absorption, Ga, were determined

using the following equation [22], Eq. (10) where T c is the col-

umn temperature and ρ is the density of the stationary phase

(ρPDMS = 0.98).

Ga = −RT  lnV 0g T c ρ

273 (10)

The Ga values at temperatures of 40 and 100 ◦C for the differ-

ent sorbates in the binary, M PP /PDMS and M BB /PDMS systems

are given in Tables 1 and 2. They fluctuated between −11 and

−15kJmol−1 for all the probes and decreased, but not sub-

stantially, upon increasing temperature by 60 ◦C. From these

values, it seems that the absorption spontaneity of the sorbates

in the PDMS membrane is not entirely due to their hydrogen

bonding capacity, and this confirms the above-discussion on the

enthalpies of absorption.

4. Conclusion

The inverse gas chromatography study corroborated to a cer-

tain extent the results of the monitoring the oxidation of primary

alcohols, n-propanol and n-butanol by pervaporation technique.

The retention volumes, the infinite dilution activity coefficients,

the Flory Huggins interaction parameters, and the enthalpies

of absorption for n-butanol, n-propanol, propionaldehyde, and

butyraldehyde varied in accord with their sorption by the PDMS

membrane used as a solvent in IGC study, and with the varia-

tions of the pervaporative factors, the total flux and the aldehyde

enrichment parameter.

References

[1] B. Smitha, D. Suhanya, S. Sridhar, M. Ramakrishma, J. Membr. Sci. 24

(2004) 1.

[2] S.M. Zhang, E. Drioli, Sep. Sci. Technol. 30 (1995) 1.

[3] F. Lipnizki, R.W. Field, Sep. Purif. Technol. 22–23 (2001) 347.

[4] T. Aouak, S. Moulay, A. Hadj-Ziane, J. Membr. Sci. 173 (2001) 149.

[5] Z.A. Hadj-Ziane, S. Moulay, Desalination 170 (2004) 91.

[6] S. Moulay, A. Hadj-Ziane, N. Bensacia,Sep. Purif. Technol. 44 (2005) 181.

[7] H. Benguergoura, T. Aouak, S. Moulay, J. Membr. Sci. 229 (2004) 107.

[8] S. Moulay, T. Aouak, A. Hadj-Ziane, F. Rouabah, M. El Mahdi, J. Soc.

Alg. Chim. 10 (2000) 89.

[9] N. Wynn, Chem. Eng. Prog. 97 (2001) 66.

[10] E. Morales, J.L. Acosta, Polym. J. 28 (1996) 127.

[11] P. Choi, T. Kavassalis, A. Rudhin, J. Coll. Interf. Sci. 180 (1996) 1.

[12] P.L. Jackson, M.B. Huglin, Eur. Polym. J. 31 (1995) 63.

[13] A. Etxeberria, C. Uriate, M.J. Fernandezberridi, J.J. Uruin, Macro-

molecules 27 (1994) 1245.

[14] M.M. Chehimi, M.L. Abel, B. Saoudi, M. Delamar, N. Jammul, J.F. Watts,

Polimery 41 (1996) 75.

[15] M.M. Chehimi, M.L. Abel, E. Pigoislandureau, M. Delamar, Synth. Met.

60 (1993) 183.

[16] A. Hadj-Ziane, S. Moulay, J.P. Canselier, J. Chromatogr. A 1091 (2005)

145.

[17] D.D. Deshpande, D. Patterson, H.P. Schreiber, C.S. Su, Macromolecules 7

(1974) 530.

[18] R.H. Perry, D. Green, Perry’s Chemical Engineer’s Handbook, Interna-

tional Student Edition, McGraw-Hill, New York, 1999.

[19] V. Voelkel, J. Fall, Chromatographia 44 (1997) 197.

[20] P. Aptel, J. Cunny, J. Jozefonvicz, G. Morel, J. Neel, J. Appl. Polym. Sci.

18 (1974) 351.

[21] T.K. Kwei, Macromolecules in solution, in: F.A. Bovey, F.H. Winslow

(Eds.), Macromolecules, An Introduction to Polymer Science, Academic

Press, New York, 1979, p. 273 (Chapter 4).

[22] A. Boutboul, F. Lenfant, P. Giampaoli, A. Feigenbaum, V. Ducruet, J. Chro-

matogr. A 969 (2002) 9.


Recommended