Sea Level and Its Rising Warren Wiscombe, NASA Goddard with assistance from Benjamin Chao, NASA Goddard and Bruce Douglas, International Hurricane Center & Florida International University, Miami
Transcript
Sea Level and Its Rising
Warren Wiscombe, NASA Goddard
with assistance fromBenjamin Chao, NASA Goddard
and Bruce Douglas, International Hurricane
Center &Florida International University, Miami
Apr 2005 Meto 401 2
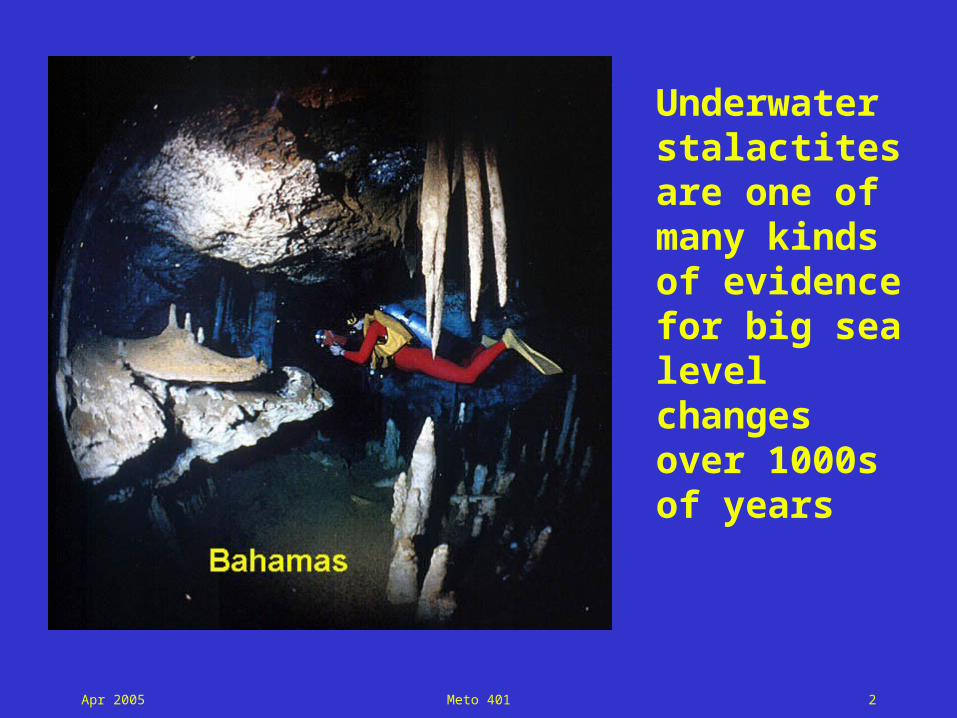
Underwater stalactites are one of many kinds of evidence for big sea level changes over 1000s of years
Apr 2005 Meto 401 3
What has happened since end of last ice age?
Since 20K yr ago, sea level has risen over 120 m!
Apr 2005 Meto 401 4
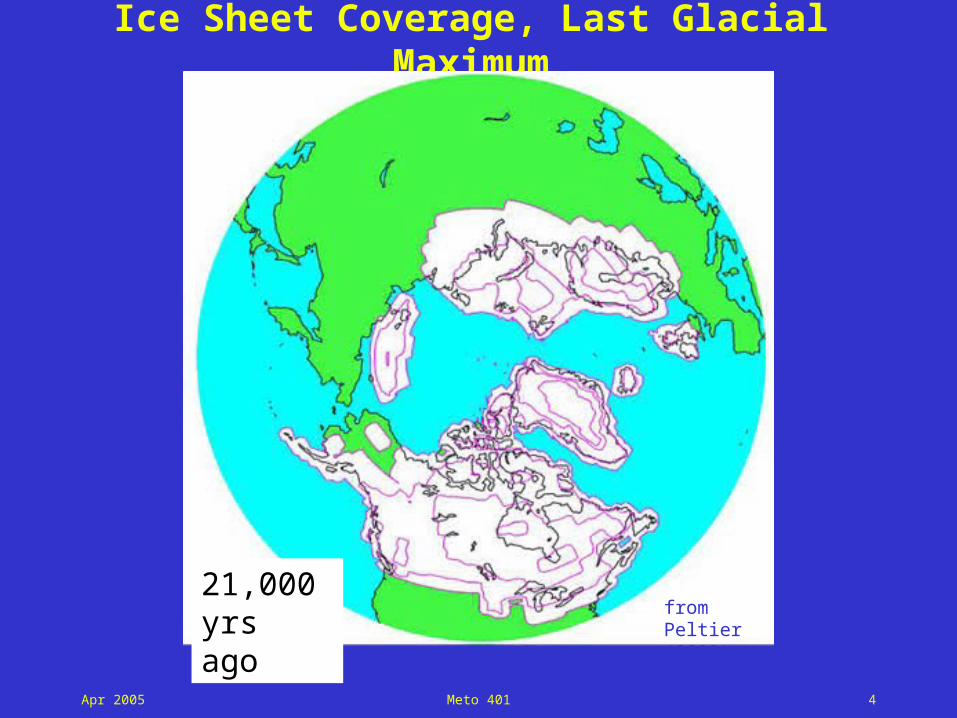
Ice Sheet Coverage, Last Glacial Maximum
from Peltier (2000)
21,000 yrs ago
Apr 2005 Meto 401 5
Ice Sheet Coverage Today
Apr 2005 Meto 401 6
Estimates of global sea level change (m) over past 140,000 years show N. America is
biggest player
Apr 2005 Meto 401 7
interactive QT/VR movie
Apr 2005 Meto 401 8
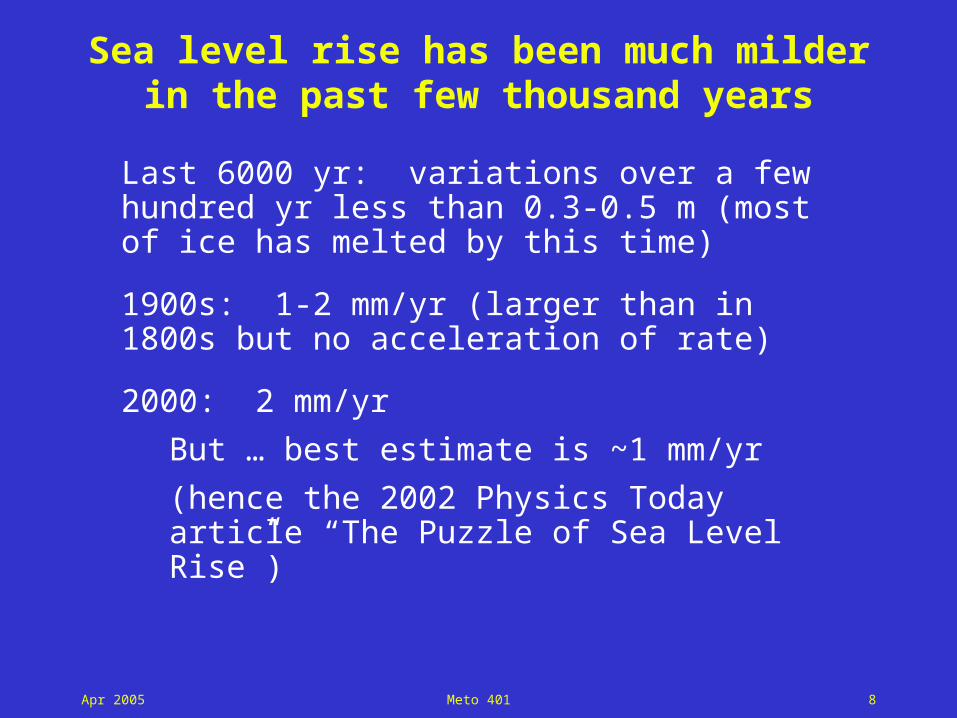
Sea level rise has been much milder in the past few thousand years
Last 6000 yr: variations over a few hundred yr less than 0.3-0.5 m (most of ice has melted by this time)
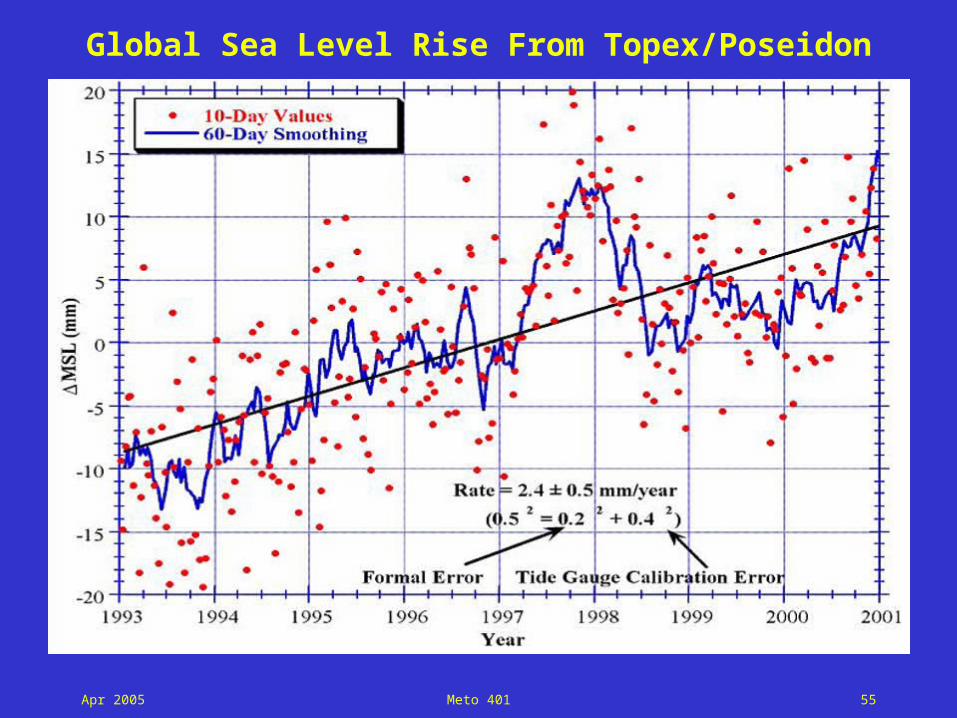
1900s: 1-2 mm/yr (larger than in 1800s but no acceleration of rate)
2000: 2 mm/yr
But … best estimate is ~1 mm/yr
(hence the 2002 Physics Today article “The Puzzle of Sea Level Rise”)
Apr 2005 Meto 401 9
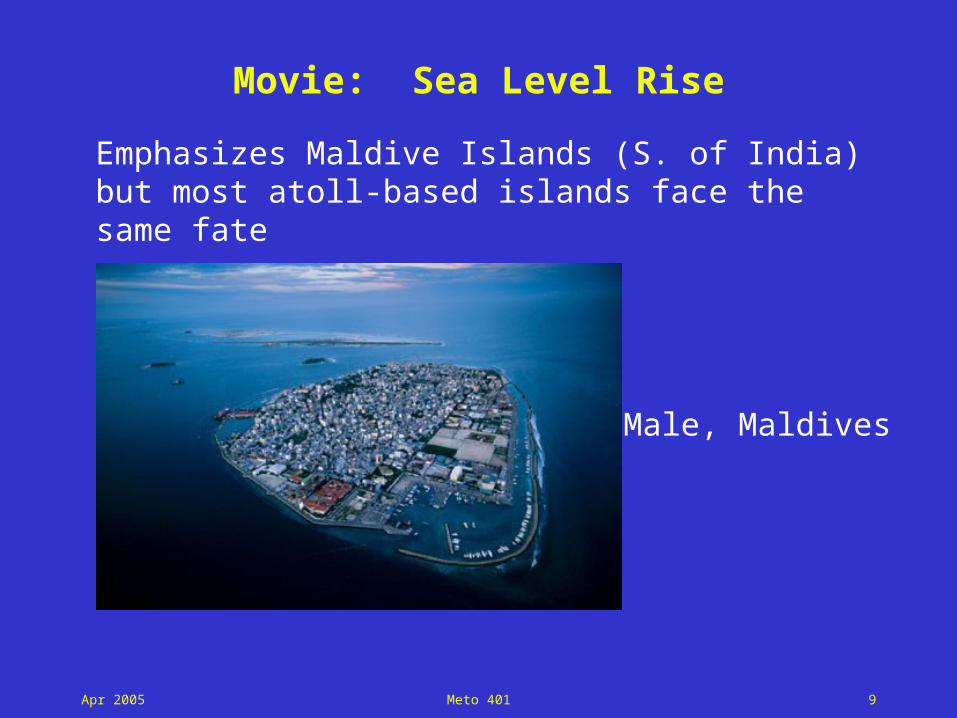
Movie: Sea Level Rise
Emphasizes Maldive Islands (S. of India) but most atoll-based islands face the same fate
Male, Maldives
Apr 2005 Meto 401 10
Tuvalu is also sinking
Apr 2005 Meto 401 11
Primary Impacts Of Sea Level Rise
• Increased flooding and storm damage
• Inundation of low-lying areas
• Higher water tables
• Salt intrusion into aquifers and surface waters
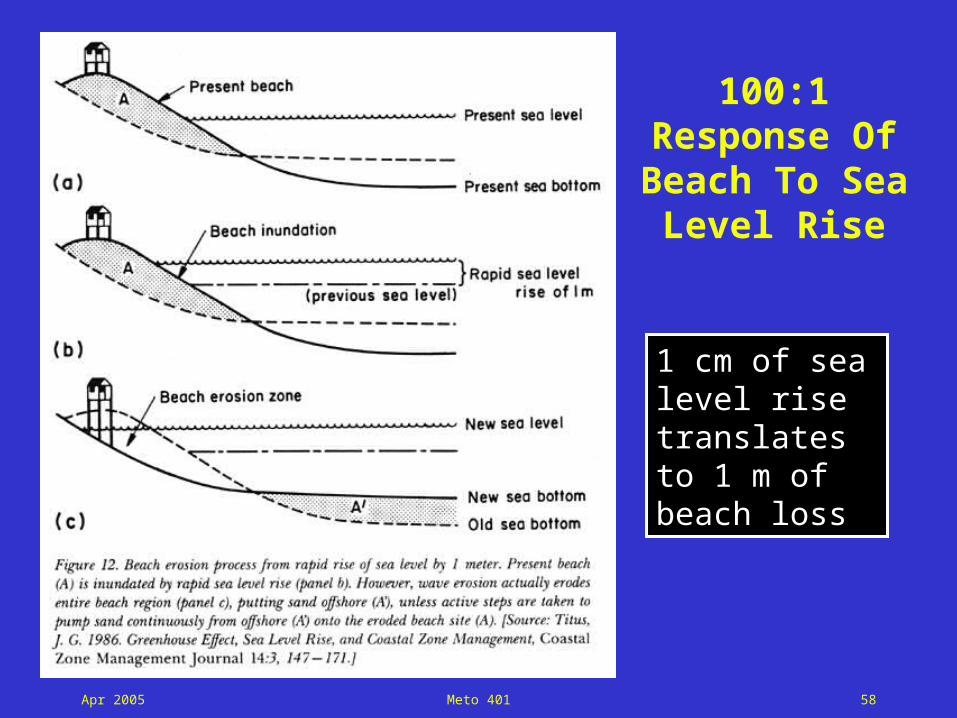
• Erosion of beaches and coastlines
Apr 2005 Meto 401 12
People huddle near the water...
• Two-thirds of the world's population lives within 500 km of a coastline.
• 80% of the world's population lives below 500 m elevation.
• This places an overwhelming majority of people at risk when sea levels rise.
Apr 2005 Meto 401 13
Last 300 yr (IPCC examples)
Apr 2005 Meto 401 14
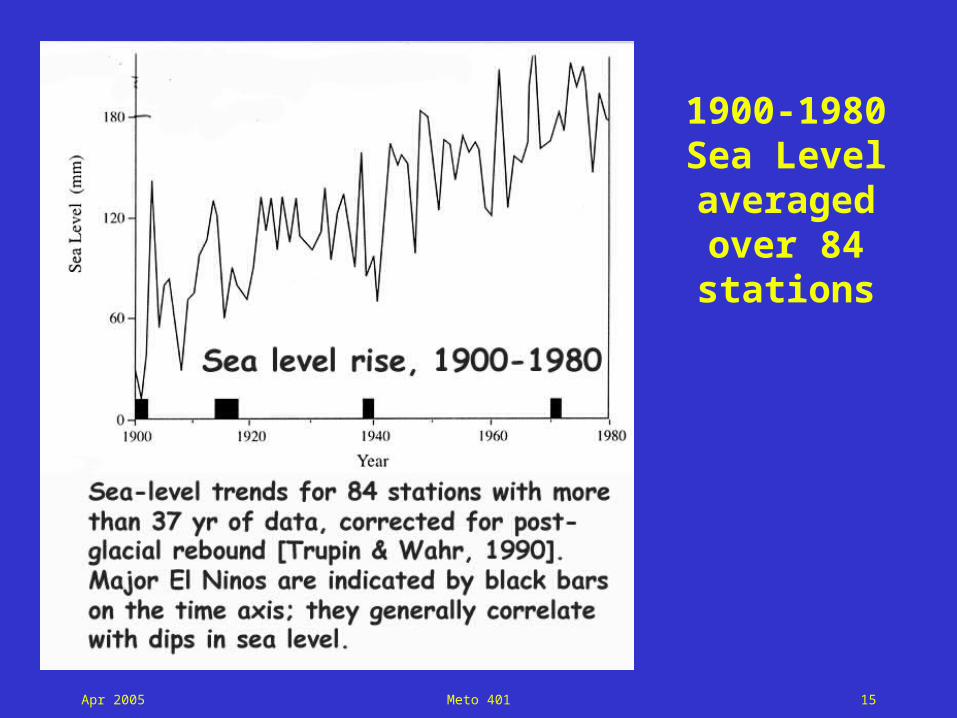
Sea level is rising most
places, but not everywhere
Apr 2005 Meto 401 15
1900-1980 Sea Level averaged over 84 stations
Apr 2005 Meto 401 16
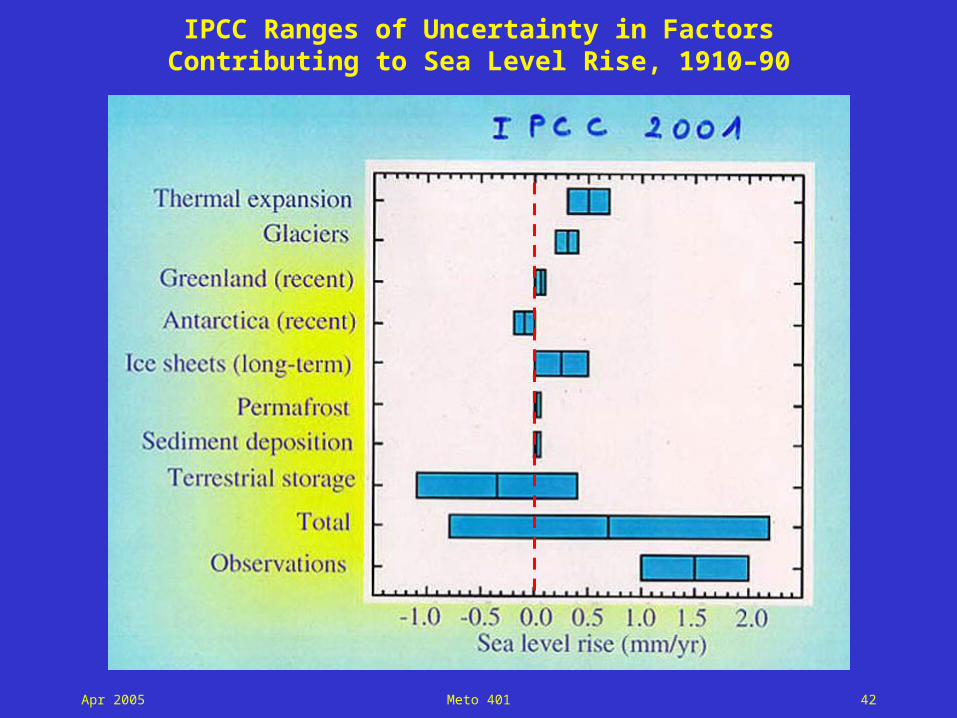
How does the IPCC* parse out the 2 mm/yr rise of the 1900s?
~1 mm/yr from ocean thermal expansion
0.2-0.4 mm/yr from melting ice– -0.2 to 0 from Antarctica (increasing precip)– 0 to 0.1 from Greenland (melting beats precip)– 0 to 0.5 from Antarc/Grnld due to past climate
changes
-1.2 to +0.4 mm/yr due to terrestrial water storage
“Unfortunately sufficient measurements exist to determine the mass balance for only a few hundred of the world’s 160,000 glaciers.”
*Intergovernmental Panel on Climate Change
Apr 2005 Meto 401 17
What does the IPCC project for the future?
Warming of ocean will continue even if greenhouse gases are stabilized; after 500 yr, this “steric” sea level rise still only half its ultimate value
Projections:1990-2100: 0.1 to 0.8 m risenext 500-1000 yr: 1-4 m rise for 4xCO2
W. Antarctic ice sheet in no immediate danger but if temperature rises enough to uncork its outflow glaciers, collapse could be more rapid
E. Antarctic ice sheet never melts in any scenario
Greenland or Antarctic melting would take milennia!
Apr 2005 Meto 401 18
Examples of sea level rises of 15 & 25 feet
Apr 2005 Meto 401 19
Climate modeling results from NCAR predict “committed sea level rise”
• Even if no more greenhouse gases were added to the atmosphere, globally averaged surface air temperatures would rise about 0.5C and global sea levels would rise another 11 cm from thermal expansion alone by 2100.
• “… we are committed to a significant amount of global warming and sea level rise because of the greenhouse gases we have already put into the atmosphere…”
• The projected sea level rise is twice the 5-cm rise that occurred during the latter half of the 20th century.
• These numbers do not take into account fresh water from melting ice sheets and glaciers, which could at least double the sea level rise caused by thermal expansion alone.
Note progressive drowning & loss of coastal marshes due to a higher than normal rate of sea level rise.
Apr 2005 Meto 401 21
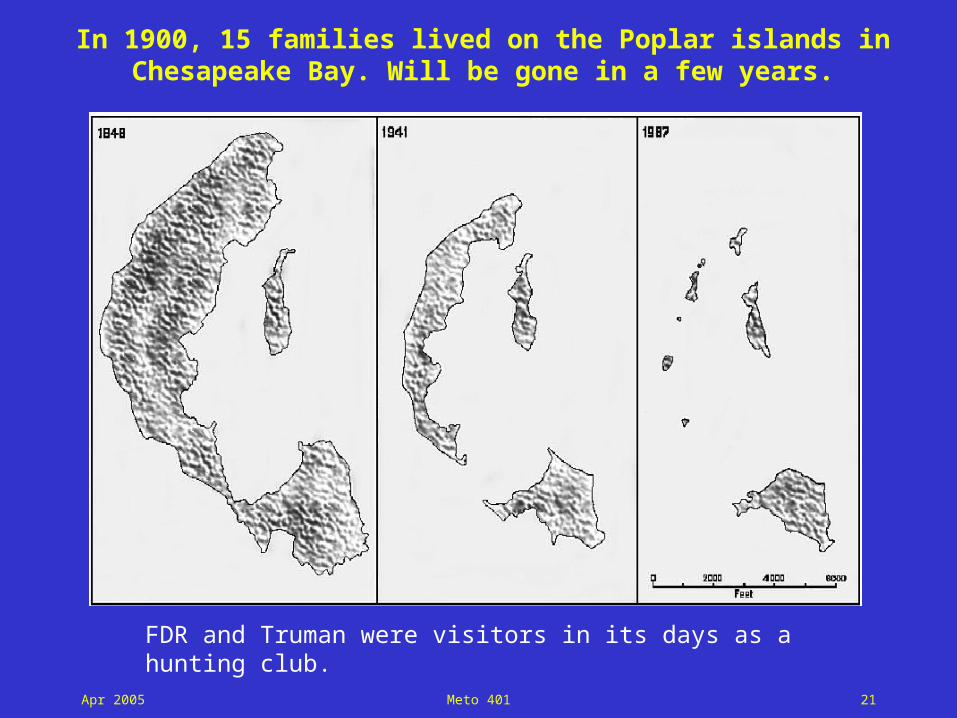
In 1900, 15 families lived on the Poplar islands in Chesapeake Bay. Will be gone in a few years.
FDR and Truman were visitors in its days as a hunting club.
Apr 2005 Meto 401 22
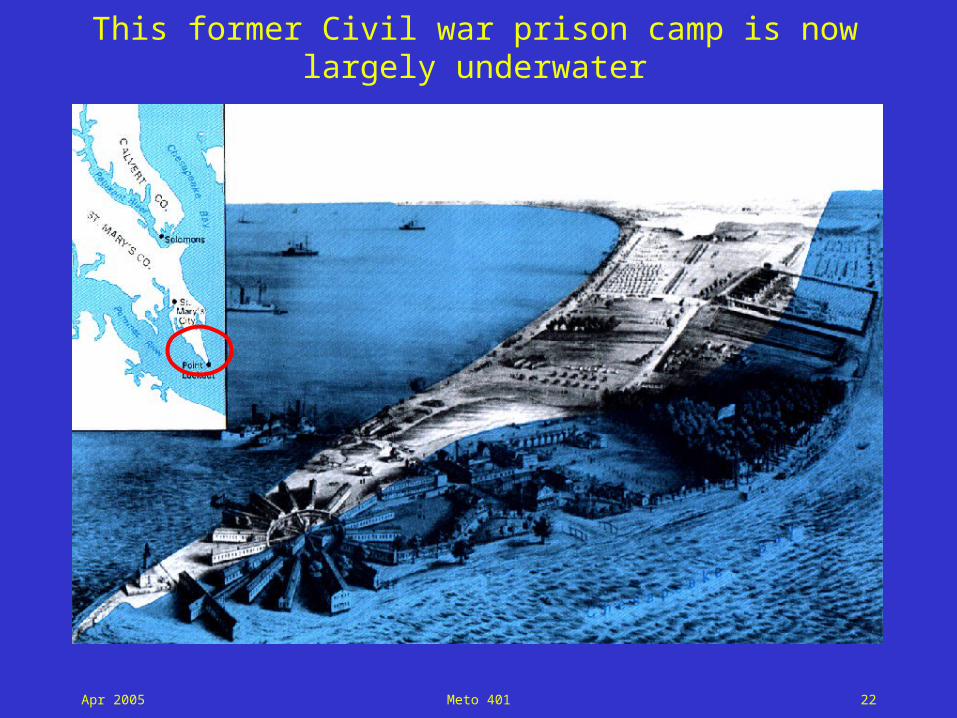
This former Civil war prison camp is now largely underwater
Apr 2005 Meto 401 23
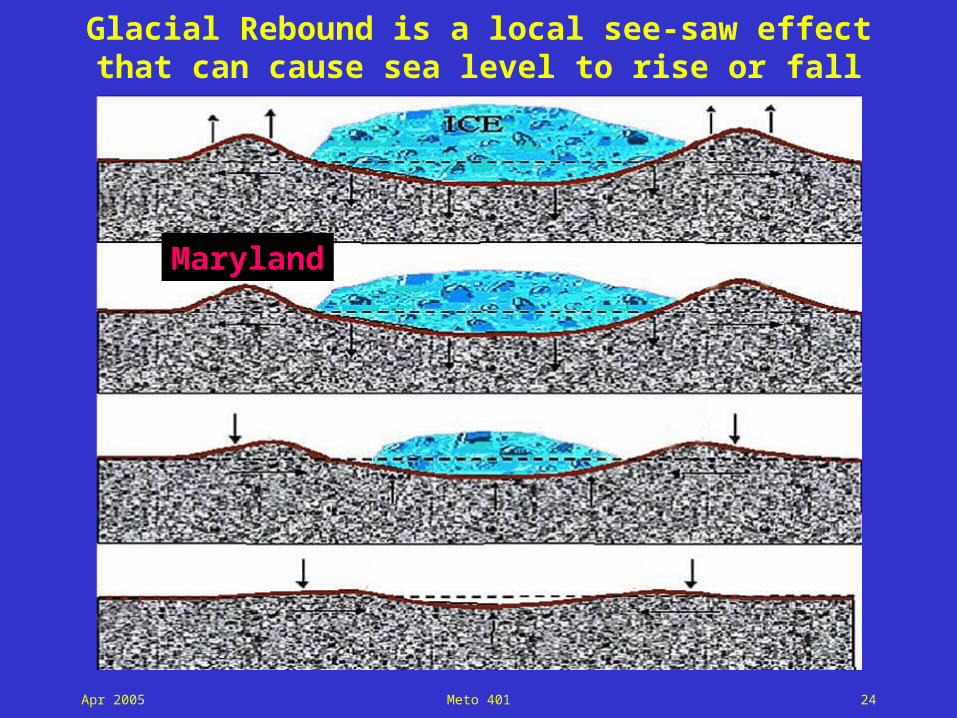
Bruce Douglas, sea level expert
“The rate of sea level rise in the mid-Atlantic states is 3.5–4 mm/yr (about 2x the global average) because of post glacial rebound.
So if we want to see what a doubled rate of sea level rise would do to beaches and wetlands elsewhere..., we have only to look at the mid-Atlantic.
Louisiana is seeing rates of relative sea level rise as high as 10 mm/yr, and loses wetlands and beach at the rate of tens of acres/day.”
Apr 2005 Meto 401 24
Glacial Rebound is a local see-saw effect that can cause sea level to rise or fall
Maryland
Apr 2005 Meto 401 25
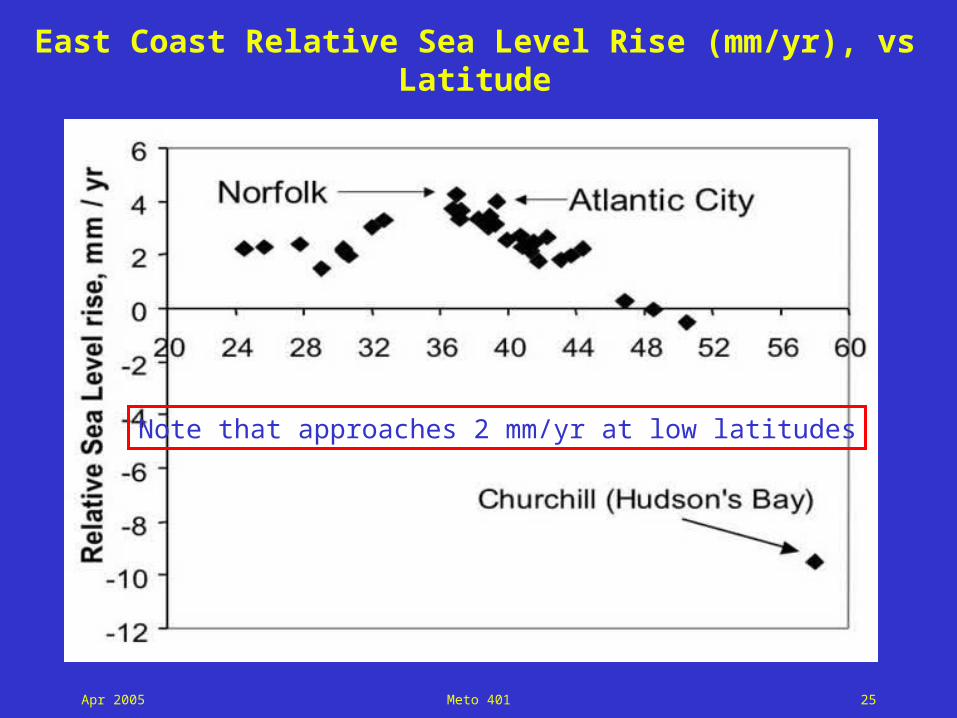
East Coast Relative Sea Level Rise (mm/yr), vs Latitude
Note that approaches 2 mm/yr at low latitudes
Apr 2005 Meto 401 26
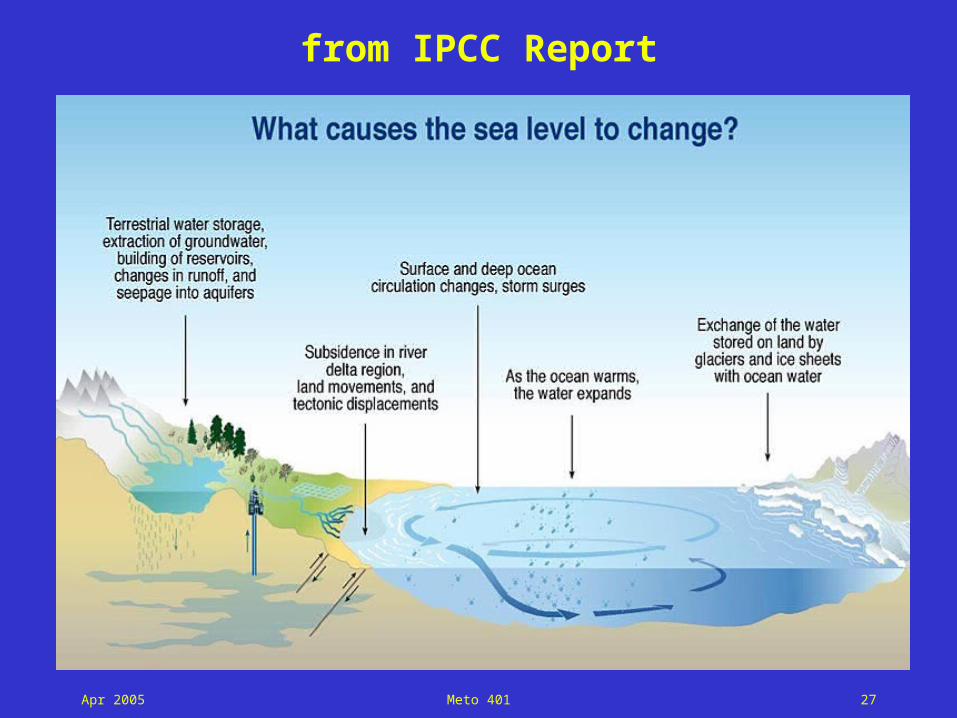
Causes of sea level change?
Apr 2005 Meto 401 27
from IPCC Report
Apr 2005 Meto 401 28
Cause 1: Volume Change at Constant Mass
• “steric” (thermal + salinity)
• Local atmosphere-ocean thermal interactions make maps non-uniform
– El Nino, North Atlantic Oscillation, & other vacillations alter the pattern greatly
• Deep currents and thermohaline (vertical pump) circulations move heat around in 3D
Apr 2005 Meto 401 29
Summary: IPCC “Indicators of Warming”
Apr 2005 Meto 401 30
Temperature Change, last 1000 yr(the Mann “Hockey Stick” curve)
Apr 2005 Meto 401 31
The Surface Warming Evidence – IPCC
In some places there is a cooling! Why might this be?
Apr 2005 Meto 401 32
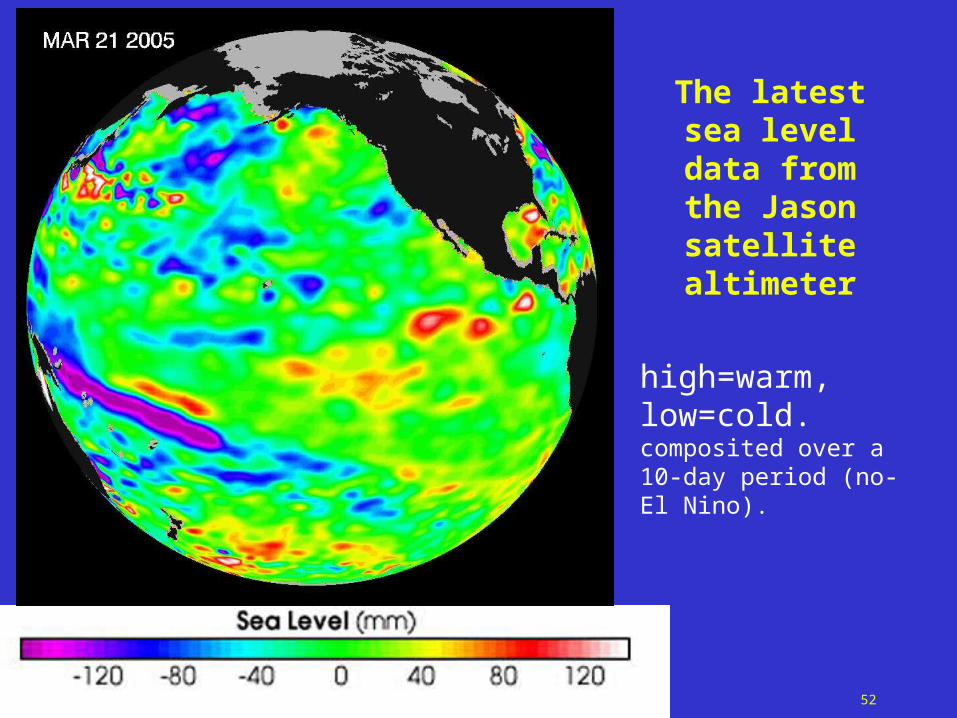
Show movie SST2001
SST (Sea Surface Temperature) varies a lot! Helps make sea level vary a lot from place to place, and makes regional predictions of sea level change difficult.
Apr 2005 Meto 401 33
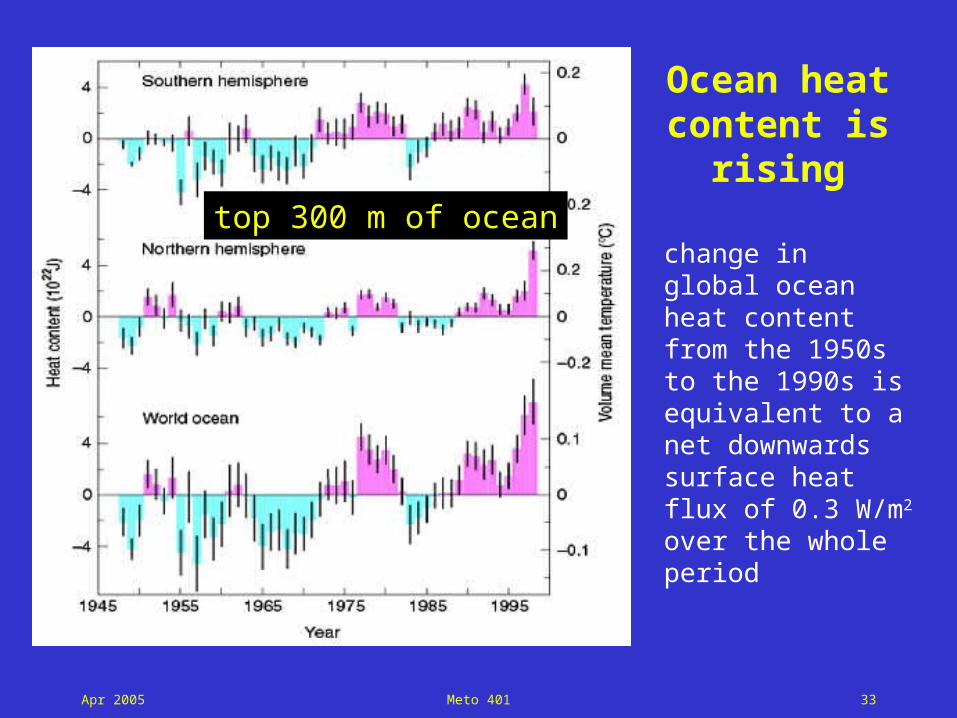
Ocean heat
content is rising
change in global ocean heat content from the 1950s to the 1990s is equivalent to a net downwards surface heat flux of 0.3 W/m2 over the whole period
top 300 m of ocean
Apr 2005 Meto 401 34
Thermal-Expansion Sea Level Trends, 1955-96
From Cabanes, et al., 2001
upper 3000 m
Apr 2005 Meto 401 35
Cause 2: Mass Change
• Imbalance of precip (P) and evaporation (E) over ocean (P–E not zero)
Greenland is thinning near the coast, thickening on the ice sheet
more or less what models would predict.
Apr 2005 Meto 401 37
More information on Greenland from NASA Wallops observational program
Greenland’s ice sheet is rapidly thinning near the coasts (Krabill, Science, July 2004) — in some places, at a rate of more than 1 m per year. (NASA Wallops data)
“A conservative estimate indicates a net loss of approximately 51 km3/yr of ice from the entire ice sheet, sufficient to raise global sea level by 0.005 inches per year, approximately 7% of the observed rise.”
“The thinning cannot be accounted for by increased melting alone. It appears that ice must be flowing more quickly into the sea through glaciers.”
Apr 2005 Meto 401 38
East Coast Inundation if Greenland Melts
Red: land submergence for an estimated 5-m sea-level rise (equivalent to melting all Greenland ice).
It would take 1000 yr for Greenland to melt in place! Fast outflow glaciers could speed the process.
Apr 2005 Meto 401 39
Cause 3: Ocean Basin Shape Change due to Solid Earth deformations