j ourna l homepage: www.e lsev ie r .com/ locate /pa laeo
Sea-level changes across the Paleocene–Eocene interval in the SpanishPyrenees, and their possible relationship with North Atlantic magmatism
Victoriano Pujalte a,⁎, Birger Schmitz b, Juan Ignacio Baceta a
a Department of Stratigraphy and Palaeontology, Faculty of Science and Technology, University of the Basque Country UPV/EHU, Ap. 644, 48080 Bilbao, Spainb Division of Nuclear Physics, Department of Physics, University of Lund, P.O. Box 118, SE-221 00 Lund, Sweden
The issue ofwhethermajor and rapid global sea-level changes existed on a preglacial Earth can be resolved by thedetailed study of the Paleocene–Eocene (P–E) interval, where a large and rapid carbon isotope excursion linkedto an important global warming event, the Paleocene Eocene Thermal Maximum, allows for high-resolution cor-relation between terrestrial, coastal and marine settings. Based primarily on outcrop and borehole informationfrom the Tremp-Graus Basin in the southern Spanish Pyrenees, it is shown that a sea-level fall of at least 20 moccurred less than 75 kyr prior to the PETM. This forced a seaward displacement of the shoreline of ca. 20 km,a widespread incision of valleys in the alluvial plains and the subaerial exposure and excavation of the adjacentmarine carbonate platform. The subsequent sea-level rise caused the infilling of the incised valleys, a processcompleted before the onset of the PETM, and continued rising during and after the event, leading to the aggrada-tion of the alluvial plain and eventually to the transgression of the whole Tremp-Graus Basin. However, the sealevel did not regain its pre-fall position until near the end of the PETM. Therefore, although rising, the sea levelwas comparatively low in the southern Pyrenean area during most of the PETM. The pre-PETM sea-level fallhas been reported in other basins of the southern Pyrenees, in the North Sea area, the Austrian Alps and inEgypt, and the subsequent sea-level rise has been documented in widely separated sites around the Earth, anevidence of their global (eustatic) scope. The causal mechanism(s) of the pre-PETM sea-level fall is (are)unresolved, although glacioeustasymay have played a role. The subsequent sea-level rise wasmost likely causedby tectonomagmatic activity in the North Atlantic.
The Paleocene Eocene Thermal Maximum (PETM) was the mostprominent of several geologically brief episodes (b 200 kyr) ofextremely high temperatureswhich interspersed thewarm early Paleo-gene greenhouse climate. It is well documented that during the PETM,which occurred ca. 56 Ma ago, global temperatures rose by about5–9 °C, causing a significant biotic impact (e.g., Thomas, 1998; Crouchet al., 2001; Gingerich, 2003). The fingerprint of the PETM is a 2–6‰negative carbon isotopic excursion (CIE), identified in many oceansediment cores and land-based sections (e.g., Zachos et al., 2003;Aubry et al., 2007). The CIE developed in less than 20 kyr (McInerneyand Wing, 2011) requiring the rapid addition of massive quantities ofisotopically light carbon to the atmosphere-ocean reservoir.
Yet, the trigger of the PETM remains controversial. Alternativehypotheses include, among others, destabilisation of oceanic methanehydrates (Dickens et al., 1995), thermogenic CO2 and CH4 productionin the North Atlantic (Svensen et al., 2004), orbitally triggered carbon
4 6013500..
ghts reserved.
release from the thawing of circum-Arctic and Antarctic terrestrial per-mafrost (DeConto et al., 2012) and the oxidation of organic matter afterthe desiccation of a large epicontinental seaway (Higgins and Schrag,2006). The latter hypothesis required a “relative sea-level fall prior tothe onset of the CIE”, a possibility that Higgins and Schrag (2006, p.531) supported with literature data, including a study by Schmitzet al. (2001). Indeed, Schmitz et al. (2001), and later Schmitz andPujalte (2003) inferred from their studies in the Pyrenees that thePETM might have occurred during an interval of low sea level. Someauthors, however, have challenged a pre-PETM sea-level drop(e.g., Sluijs et al., 2008).
The purpose of this paper is to reassess sea-level changes across thePaleocene–Eocene (P–E) interval based primarily on evidence from theSouth Pyrenean Tremp-Graus Basin, but also with data from a selectionof other basins. It is shown that in the Tremp-Graus Basin: 1) there isclear proof that a sea-level fall occurred shortly before the onset of thePETM; 2) the subsequent sea-level rise was initiated before the onsetof the PETM and continued during and after the event; and 3) althoughrising, the sea level stayed relatively low during most of the PETM. Thepublished results fromother basins in the Pyrenees and elsewhere seemto confirm that the range of the reported sea-level changes was at least
46 V. Pujalte et al. / Palaeogeography, Palaeoclimatology, Palaeoecology 393 (2014) 45–60
supra-regional if not global. Finally, a possible link between NorthAtlantic tectonomagmatic activity in the North Atlantic and the sea-level rise across the P–E interval is discussed.
2. Geological setting
The Pyrenean orogen resulted from the Late Cretaceous to EarlyMiocene collision between the Iberian and European plates (Roest andSrivastava, 1991). Its axial zone, formedmostly of Palaeozoic basement,is flanked to the north and south by thrust sheets ofMesozoic and Ceno-zoic sedimentary rocks with low-angle basal detachments (Muñoz,1992). Three of these sheets are recognised in or near the study area,emplaced during the Santonian–late Maastrichtian, the Ypresian, andthe Lutetian–early Miocene (Fig. 1; Fernández et al., 2012).
Tectonic quiescence prevailed during the latest Maastrichtian–earliest Ypresian, as demonstrated by slow and near homogeneous sub-sidence and the absence of angular unconformities or growth structureswithin the coeval succession. The studied succession was accumulatedtowards the end of this interval (Fig. 1), during which the mainallocyclic controls of the sedimentation were climate and eustasy-dominated sea-level changes. The Ypresian Stage is, however, verylong (8.2 Ma), and the local Ilerdian Stage is used here to allow forgreater stratigraphic precision and because this stage name is used in
Fig. 1. Simplified geological map of the southern Pyrenees showing the position of theTremp-Graus and Ainsa basins, and chronostratigraphic chart with indication of thrusting(i.e., tectonically active) and quiescent intervals (modified from Fernández et al., 2012).
most of the literature on Pyrenean stratigraphy. It should be notedthat the bases of the Ilerdian and Ypresian Stages are coeval (Pujalteet al., 2009a; Vandenberghe et al., 2012).
Throughout the P–E interval the Pyreneandomainwas a deep-waterembayment, opened westwards into the Bay of Biscay and flanked byshallow marine carbonate shelves. The shelves were surrounded bycoastal alluvial plains that were particularly well-developed in theTremp-Graus Basin due to an abundant clastic input fromnearbymoun-tains created during the Santonian–late Maastrichtian thrusting phase(Figs. 1, 2A).
3. Data set and methods
This paper partly draws on information from earlier studies, butmainly on new field and laboratory data. Earlier information includesseveral δ13C isotope profiles across the P–E interval from soil carbonatenodules, which for the first time allowed the delineation of the PETM incontinental sections of Spain (Schmitz and Pujalte, 2003, 2007; Supple-mentary Fig. 1). Isotope profiles based on dispersed organic matter(δ13CTOC) of Domingo et al. (2009) have also been taken into account,as well as palaeontological information from marine Thanetian andIlerdian deposits of Robador et al. (1990), Scheibner et al. (2007),Robador (2008) and Baceta et al. (2011).
Key new data include high-resolution maps across the P–E intervalof three sectors of the Tremp-Graus Basin (Fig. 2B). The Esplugafredasector is situated in the northern margin of the basin and was the lastto be reached by the Ilerdian Sea. The Claret sector corresponds to thebasin axis, the part of the basin showing the highest subsidence rate.The Esplugafreda and Claret sectors were situated in a coastal alluvialplain during Paleocene times, and were flooded by the sea after thePETM. In contrast, the Campo sector was in a marine setting duringmost of the Thanetian and Ilerdian times. The map of the Esplugafredasector was included in a field guide of restricted circulation (Fig. 3.2 inBaceta et al., 2006). The maps of the other two sectors are publishedin this paper for the first time. New interpretations of borehole dataacross the P–E interval are also provided.
Also new are: 1) Field and δ13CTOC isotope data from a new section,the Ferrera ridge (longitude: 0° 19′ 59″ latitude 42° 25′28″); 2) thin-section and polished-slab data from the Ferrera and Campo sections;and 3) micropalaeontological data from non-marine deposits acrossthe P–E interval. Carbon isotopic analyses were performed with anIsoprime mass spectrometer with a dual inlet system, following stan-dard procedures, at the Department of Geography and Geology at theUniversity of Copenhagen. The results are listed in Table 1.
The micropalaeontological data were obtained by examining undera binocular microscope wet sieving residues of mudstone samples ofseveral sections. In about half of the samples a scant assemblage(10–20 specimens) was found. Specimens with abraded and reddenedtests, obviously resedimented, were ignored, but those with better-preserved tests and of colours similar to their host rocks were consid-ered autochthonous or para-autochthonous. They are listed in Table 2,their environmental significance being discussed in the appropriatesections below.
4. Stratigraphy
Danian–lower Ilerdian successions of the Tremp-Graus Basincomprise two major facies, shallow marine and continental, whichinterfinger laterally and alternate vertically (Figs. 2B, C, 3). Shallowmarine deposits mainly consist of carbonates that are rich in largerforaminifera (nummulitids, alveolinids and soritids), calcareous algae,molluscs and corals. Continental deposits, traditionally referred to ingeological literature as “Garumnian” or “Garumnian facies”, are nowincluded in the formally defined Tremp Group (Cuevas, 1992; Pujalteand Schmitz, 2005). This Group comprises several formations, ofwhich only the upper two are relevant to this study (Fig. 2C). The
A
B
C
Fig. 2. (A) Location and early Paleogene palaeogeography of the Pyrenean area (B) Danian–Lower Ilerdian outcrops and facies of the Tremp-Graus Basin, with indication of themain studysectors (Esplugafreda, Claret and Campo), reference sections and boreholes. Palaeocurrents obtainedmainly from imbricated clasts of conglomerate. (C) SimplifiedDanian–Lower Ilerdianstratigraphy of the Tremp-Graus Basin (after Cuevas, 1992, and Pujalte and Schmitz, 2005).
Esplugafreda Formation (Thanetian, 165–350 m thick) is mostly madeup of overbank red silty mudstones with intercalated channelisedcalcarenites and calcareous conglomerates. In the Esplugafreda sectorthe red mudstones include numerous calcic soil horizons (K horizonsof Gile et al., 1965) typified by abundant calcareous nodules 2–5 cm indiameter, and occasional horizons with gypsum veins and crystals. Inthe Claret sector, K horizons are somewhat less prominent but gypsum
is widespread, at some levels occurring as laterally persistent packagesseveral metres thick. Both this gypsum and the ubiquitous K horizonsprovide evidence of an arid to semiarid climate.
The interfingering between the continental Esplugafreda Formationand the coeval marine carbonates is best observed in the Serraduy sec-tion (Fig. 2B, C). At Serraduy, theDanian is represented by a conspicuous3.5 m thick unit of palustrine limestones overlain by a widespread soil
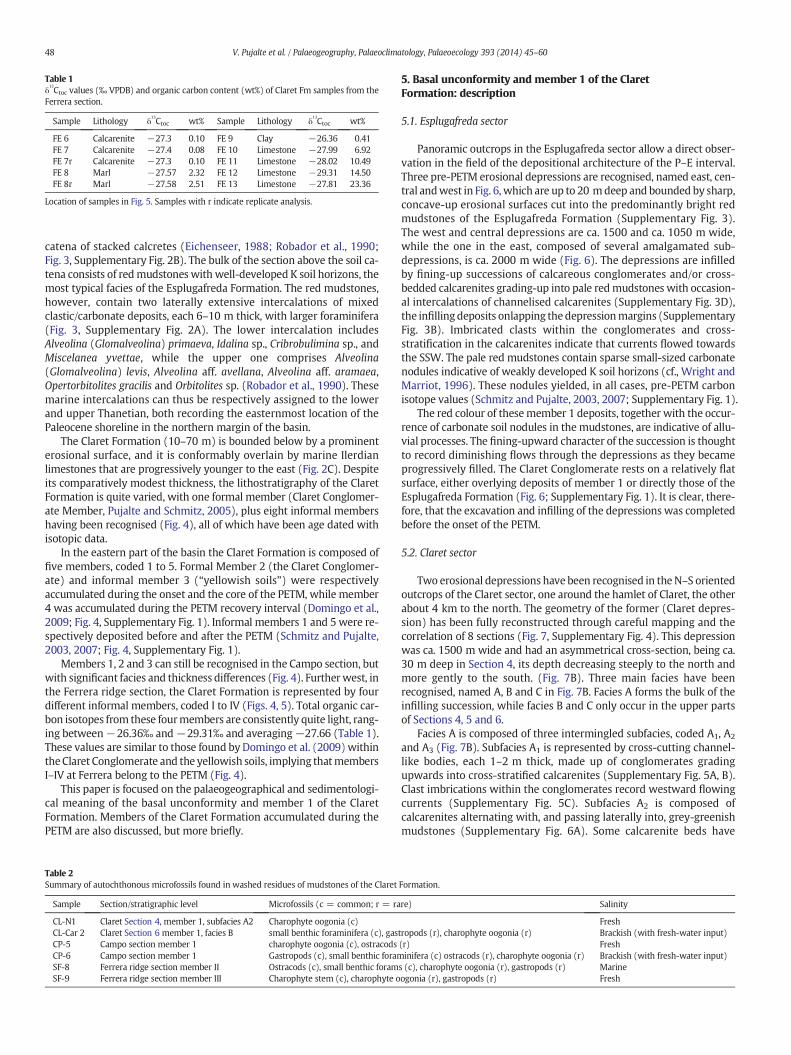
Table 1δ13Ctoc values (‰ VPDB) and organic carbon content (wt%) of Claret Fm samples from the
Ferrera section.
Sample Lithology δ13Ctoc wt% Sample Lithology δ
13Ctoc wt%
FE 6 Calcarenite −27.3 0.10 FE 9 Clay −26.36 0.41FE 7 Calcarenite −27.4 0.08 FE 10 Limestone −27.99 6.92FE 7r Calcarenite −27.3 0.10 FE 11 Limestone −28.02 10.49FE 8 Marl −27.57 2.32 FE 12 Limestone −29.31 14.50FE 8r Marl −27.58 2.51 FE 13 Limestone −27.81 23.36
Location of samples in Fig. 5. Samples with r indicate replicate analysis.
48 V. Pujalte et al. / Palaeogeography, Palaeoclimatology, Palaeoecology 393 (2014) 45–60
catena of stacked calcretes (Eichenseer, 1988; Robador et al., 1990;Fig. 3, Supplementary Fig. 2B). The bulk of the section above the soil ca-tena consists of redmudstones with well-developed K soil horizons, themost typical facies of the Esplugafreda Formation. The red mudstones,however, contain two laterally extensive intercalations of mixedclastic/carbonate deposits, each 6–10 m thick, with larger foraminifera(Fig. 3, Supplementary Fig. 2A). The lower intercalation includesAlveolina (Glomalveolina) primaeva, Idalina sp., Cribrobulimina sp., andMiscelanea yvettae, while the upper one comprises Alveolina(Glomalveolina) levis, Alveolina aff. avellana, Alveolina aff. aramaea,Opertorbitolites gracilis and Orbitolites sp. (Robador et al., 1990). Thesemarine intercalations can thus be respectively assigned to the lowerand upper Thanetian, both recording the easternmost location of thePaleocene shoreline in the northern margin of the basin.
The Claret Formation (10–70 m) is bounded below by a prominenterosional surface, and it is conformably overlain by marine Ilerdianlimestones that are progressively younger to the east (Fig. 2C). Despiteits comparatively modest thickness, the lithostratigraphy of the ClaretFormation is quite varied, with one formal member (Claret Conglomer-ate Member, Pujalte and Schmitz, 2005), plus eight informal membershaving been recognised (Fig. 4), all of which have been age dated withisotopic data.
In the eastern part of the basin the Claret Formation is composed offive members, coded 1 to 5. Formal Member 2 (the Claret Conglomer-ate) and informal member 3 (“yellowish soils”) were respectivelyaccumulated during the onset and the core of the PETM, while member4 was accumulated during the PETM recovery interval (Domingo et al.,2009; Fig. 4, Supplementary Fig. 1). Informal members 1 and 5 were re-spectively deposited before and after the PETM (Schmitz and Pujalte,2003, 2007; Fig. 4, Supplementary Fig. 1).
Members 1, 2 and 3 can still be recognised in the Campo section, butwith significant facies and thickness differences (Fig. 4). Furtherwest, inthe Ferrera ridge section, the Claret Formation is represented by fourdifferent informal members, coded I to IV (Figs. 4, 5). Total organic car-bon isotopes from these fourmembers are consistently quite light, rang-ing between−26.36‰ and−29.31‰ and averaging−27.66 (Table 1).These values are similar to those found by Domingo et al. (2009)withintheClaret Conglomerate and the yellowish soils, implying thatmembersI–IV at Ferrera belong to the PETM (Fig. 4).
This paper is focused on the palaeogeographical and sedimentologi-cal meaning of the basal unconformity and member 1 of the ClaretFormation. Members of the Claret Formation accumulated during thePETM are also discussed, but more briefly.
Table 2Summary of autochthonous microfossils found in washed residues of mudstones of the Claret
Sample Section/stratigraphic level Microfossils (c = common; r = ra
CL-N1 Claret Section 4, member 1, subfacies A2 Charophyte oogonia (c)CL-Car 2 Claret Section 6 member 1, facies B small benthic foraminifera (c), gasCP-5 Campo section member 1 charophyte oogonia (c), ostracodsCP-6 Campo section member 1 Gastropods (c), small benthic foramSF-8 Ferrera ridge section member II Ostracods (c), small benthic foramSF-9 Ferrera ridge section member III Charophyte stem (c), charophyte o
5. Basal unconformity and member 1 of the ClaretFormation: description
5.1. Esplugafreda sector
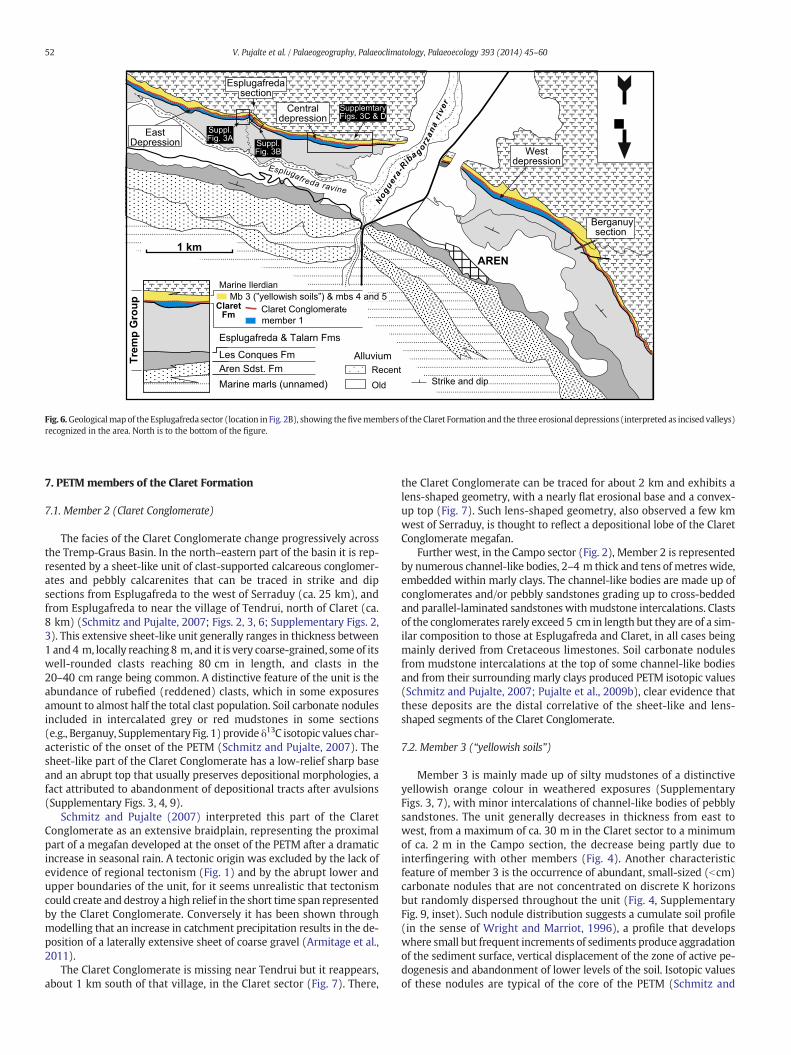
Panoramic outcrops in the Esplugafreda sector allow a direct obser-vation in the field of the depositional architecture of the P–E interval.Three pre-PETM erosional depressions are recognised, named east, cen-tral andwest in Fig. 6, which are up to 20 mdeep and bounded by sharp,concave-up erosional surfaces cut into the predominantly bright redmudstones of the Esplugafreda Formation (Supplementary Fig. 3).The west and central depressions are ca. 1500 and ca. 1050 m wide,while the one in the east, composed of several amalgamated sub-depressions, is ca. 2000 m wide (Fig. 6). The depressions are infilledby fining-up successions of calcareous conglomerates and/or cross-bedded calcarenites grading-up into pale redmudstones with occasion-al intercalations of channelised calcarenites (Supplementary Fig. 3D),the infilling deposits onlapping thedepressionmargins (SupplementaryFig. 3B). Imbricated clasts within the conglomerates and cross-stratification in the calcarenites indicate that currents flowed towardsthe SSW. The pale red mudstones contain sparse small-sized carbonatenodules indicative of weakly developed K soil horizons (cf., Wright andMarriot, 1996). These nodules yielded, in all cases, pre-PETM carbonisotope values (Schmitz and Pujalte, 2003, 2007; Supplementary Fig. 1).
The red colour of thesemember 1 deposits, together with the occur-rence of carbonate soil nodules in the mudstones, are indicative of allu-vial processes. The fining-upward character of the succession is thoughtto record diminishing flows through the depressions as they becameprogressively filled. The Claret Conglomerate rests on a relatively flatsurface, either overlying deposits of member 1 or directly those of theEsplugafreda Formation (Fig. 6; Supplementary Fig. 1). It is clear, there-fore, that the excavation and infilling of the depressions was completedbefore the onset of the PETM.
5.2. Claret sector
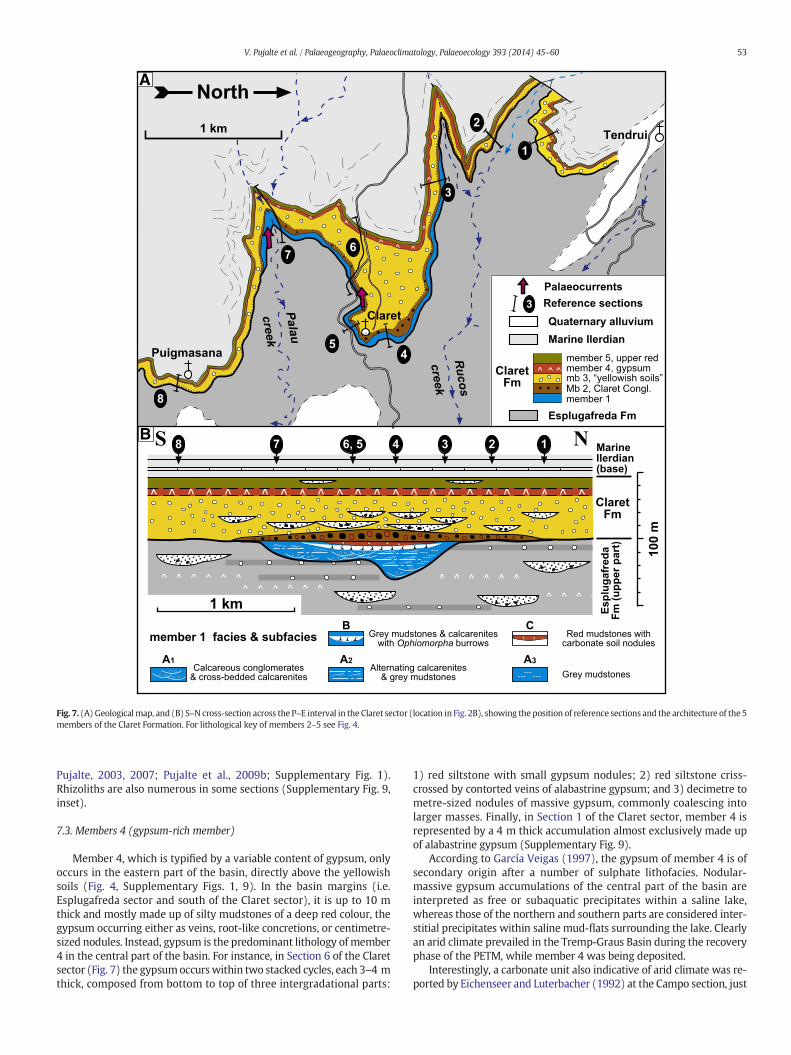
Two erosional depressions have been recognised in theN–S orientedoutcrops of the Claret sector, one around the hamlet of Claret, the otherabout 4 km to the north. The geometry of the former (Claret depres-sion) has been fully reconstructed through careful mapping and thecorrelation of 8 sections (Fig. 7, Supplementary Fig. 4). This depressionwas ca. 1500 m wide and had an asymmetrical cross-section, being ca.30 m deep in Section 4, its depth decreasing steeply to the north andmore gently to the south. (Fig. 7B). Three main facies have beenrecognised, named A, B and C in Fig. 7B. Facies A forms the bulk of theinfilling succession, while facies B and C only occur in the upper partsof Sections 4, 5 and 6.
Facies A is composed of three intermingled subfacies, coded A1, A2
and A3 (Fig. 7B). Subfacies A1 is represented by cross-cutting channel-like bodies, each 1–2 m thick, made up of conglomerates gradingupwards into cross-stratified calcarenites (Supplementary Fig. 5A, B).Clast imbrications within the conglomerates record westward flowingcurrents (Supplementary Fig. 5C). Subfacies A2 is composed ofcalcarenites alternating with, and passing laterally into, grey-greenishmudstones (Supplementary Fig. 6A). Some calcarenite beds have
Fig. 3. Field sketch of the Serraduy section in the right (west) bank of the Isábena River, looking south (location in Fig. 2B). Thickness of the shown succession is ca. 150 m. Modified fromRobador et al. (1990).
sharp erosive bases with flute and tool marks, parallel lamination intheir lower parts and current-ripple lamination in their upper parts(Supplementary Fig. 6B, C). Others are entirely formed by unidirectionalclimbing ripples indicative of rapid sedimentation rates (Supplementa-ry Fig. 6D). Palaeocurrents from these calcarenites usually diverge atnearly 90° from those of subfacies A1. The mudstones clearly representa low-energy setting, the intercalated calcarenites recording episodicinfluxes of sediment-laden flows. Subfacies A3, which only occurs nextto the northernmargin of the erosional depression (Fig. 7B), consists al-most exclusively of grey-greenish mudstones, with just occasional andthin intercalations of calcarenite beds. No evidence of soil development,such as carbonate nodules or rhizoliths, was observed in facies A. Smallcoal fragments were found within one bed of subfacies A1, and coalifiedplant remains are common within the calcarenite beds of subfacies A2.Washed residues from themudstones of subfacies A2 andA3were eitherbarren or provided a few, poorly-preserved charophyte oogonia, indic-ative of fresh-water conditions (Table 2, sample CL-N1). Consequentlyfacies A is collectively interpreted as fluviatile, with subfacies A1
representing channel-axis accumulations, subfacies A2 levee/crevassesplay deposits resulting from discrete flood events, and subfacies A3
floodplain deposits, their modest areal development being attributableto the confinement imposed by the depression margins. The predomi-nance of grey colours in facies A, and the preservation of coalifiedremains, is indicative of poorly-oxygenated conditions.
Facies B is lithologically similar to subfacies A2, being also composedof an alternation of grey-greenish mudstones and calcarenites. Howev-er, a number of calcarenite beds from facies B are bioturbated byOphiomorpha (Supplementary Fig. 6E), an ichnogenus indicative of ma-rine influence. A few specimensof small calcareous benthic foraminiferafound in the washed residue of sample CL-Car 2 (Table 2) are furtherproof of such influence, although the occurrence of charophyte oogoniain the same sample suggests occasional fresh-water inputs. Facies C isalmost exclusively composed of red mudstones with scattered soilcarbonate nodules (Supplementary Fig. 6F), features indicative of awell-oxygenated alluvial flood plain, its location attesting to the finalinfilling of the Claret erosional depression (Fig. 7B). The carbonate
nodules yielded pre-PETM isotopic values, a proof that such infillingwas also completed before the onset of the event (Schmitz andPujalte, 2007; Supplementary Fig. 1).
The erosional depression to the north of Claret is only partly exposedin an isolated outcrop (Supplementary Fig. 4D), and its dimensionscould not be established. Its occurrence, however, demonstrates thatmore than one depression was excavated in the Claret sector. Thedepression fill is formed by a fining-up succession similar to those inthe Esplugafreda sector.
5.3. Campo sector
The Campo section, the most representative of the Campo sector,provides many clues about the timing and magnitude of sea-levelchanges across the P–E interval, their appreciation requiring a briefdescription of the upper Thanetian succession. This succession is com-prised of threemappable lithological units, coded L (lower),M (middle)andU (upper) in Fig. 8. These units are differentiated from each other bya contrasting lithology and in colour air photographs by a distinct shade,units L and U having a light brownish hue, the intervening unit M beinglight grey.
Unit L (14.5 m) rests abruptly on lower Thanetian dolomitic marlsand limestones and it is composed of current-laminated quartz-richpackstones and grainstones with fragments of echinoderms, corallinealgae and shallow benthic forams. Unit M (24 m) mostly consists ofthickly-bedded bioclastic sandy packstones and grainstones rich in coral-line algal fragments and/or shallow benthic foraminifera. The facies andfossils of both units, and the occurrence of a 7 m thick cross-stratifiedpackage within unit M (Fig. 8A), are indicative of a shallow marinehigh-energy environment. Units L and M are separated from each otherby a ca. 6 m thick interval of marls and marly limestones, usuallycovered by vegetation (Fig. 8A), which contains an open marine fossilassemblage of ostracods and autochthonous calcareous nannofossils, in-cluding abundant specimens ofDiscoaster multiradiatus. This nannofossilallows assigning to geomagnetic chronC25n a short intervalwith normalpolarities found within unit L (Pujalte et al., 2003; Fig. 8A).
Fig. 4. Representative sections across the P–E interval in the Tremp-Graus Basin (location in Fig. 2B), with reliable and tentative correlations of the ninemembers of the Claret Formationbased on δ
13C isotopic data from soil carbonate nodules and from organic carbon.
50 V. Pujalte et al. / Palaeogeography, Palaeoclimatology, Palaeoecology 393 (2014) 45–60
Unit U (15 m) is more relevant for this study and it is thereforedescribed more extensively. It has long been known that this unitis capped by a sharp irregular surface rich in Microcodium remains(e.g., Eichenseer and Luterbacher, 1992), a proof of subaerial exposure.Indeed, Microcodium is customarily interpreted as the product of thecalcification of roots of terrestrial plants on carbonate-rich substrates(Klappa, 1978; Kosir, 2004; but see also Kabanov et al., 2008). Howeverno detailed analysis of this surface has previously been attempted.
The observations presented here were facilitated by two circum-stances, the enlargement of the road, which created a fresh cut in unitU, and a landslide triggered byheavy rains in thewinter of 2010providinga wide plain-view exposure of its capping surface (SupplementaryFig. 7A). Three successive intervals could thus be recognised in the upper-most metres of unit U, labelled X, Y and Z in Fig. 9 and in SupplementaryFig. 7A.
Intervals X and Y, despite different grey colouring, are both repre-sented by massive coralgal bindstones. In this study occasionalMicrocodium rossetes were observed in thin sections from the upperpart of interval Y (Fig. 9).
Interval Z (1–1.5 m thick), which Scheibner et al. (2007) described asa mixture of coralgal bound-rudstone and macroid boundstonemicrofacies types, has a brecciated appearance, being formed by dark-
grey irregular zones surrounded by a light-grey or brownishpseudomatrix (Fig. 9B, D, E). Polished slabs and thin sections revealthat the pseudomatrix is mostly composed of Microcodium remains,mainly disaggregated prisms with occasional rosettes, while the dark-grey zones, which range in size from 1 cm to a few dm, are irregularly-shaped pieces of host-rock similar in composition to those of intervalsX and Y. The thin-sections further prove that the irregular shapes ofthe host rock pieces are due to corrosion byMicrocodium. Yet no individ-ual rhizoliths (in the sense of Klappa, 1980) have been recognised, a factattributed to extensive reworking by the roots of colonising plants. Thetop surface of interval Z has an undulating morphology with a relief ofca. 50 cm, probably resulting from karstic dissolution during subaerialexposure (Fig. 9A), and it has a centimetric micro-relief due to differen-tial erosion of themore resistant host rock remains and the less resistantMicrocodium-rich pseudomatrix (Fig. 9C). The features of interval Z, andof its capping surface, are thus clearly attributable to a long-lastingperiod of subaerial exposure.
A cross-section constructed after the careful mapping of the Camposector demonstrates that the exposure surface described above issituated in the shoulder of an erosional depression excavated into theuppermost Thanetian carbonates, which is ca. 5 km wide and about15 m deep in its central part, where unit U was entirely eliminated
Fig. 5. Columnar section across the P–E interval at the Ferrera ridge (location in Fig. 2B),with indication of members I–IV and situation of the samples used for organic carbon iso-tope analysis (results in Table 1).
(Fig. 8B, C).Member 1 deposits infilling this erosional depression,whichrange in thickness from ca. 7 m at the Campo section to ca. 23 m at thedeepest part of the depression (Fig. 8C), are mostly composed of green-ish, weakly calcareous mudstones with a few intercalated calcarenites.Except for occasional innermoulds of gastropods themudstones are de-void of macrofossils, (Pujalte et al., 2009b). However, charophyteoogonia were found in sample CP-5 and ostracods and small benthicforaminifera in sample CP-6 (Table 2). Themudstones are thus attribut-able to a low-energy brackish-water setting with fresh-water input.
5.4. Ferrera ridge section
The Danian–Ilerdian succession at the Ferrera section is almostwholly made up of shallow marine carbonates, the exception being aca. 10 m thick mixed clastic-carbonate unit sandwiched betweenupper Thanetian and lower Ilerdian carbonates. This unit clearly
represents the Claret Formation distal part, as demonstrated by itsstratigraphic position and by carbon isotopic data (Table 1, Fig. 4).
The ca. 90 m thick upper Thanetian marine succession at Ferrera ismostly made up of sandy calcarenites rich in nummulitids and, as inCampo, is capped by a sharp surface withMicrocodium remains. Howev-er, the Ferrera surface differs from the one at Campo in several significantfeatures.
First,Microcodium is much less abundant at Ferrera and it is mainlyconcentrated in the uppermost 30 cm of the Thanetian carbonatesuccession, although minor amounts of it have been observed in sam-ples from 1 m below the capping surface (Fig. 5, SupplementaryFig. 8A). Second, instead of forming a widespread pseudomatrix,Microcodium remains at Ferrera tend to be clustered around irregular,sub-vertical cylindrical tubules, which are abundant and up to 1 cmwide in the uppermost 30 cm of the succession but sporadic and just1–2 mm wide at depth. Due to that clustering most tubules appearsurrounded by haloes of a somewhat dark shade, best seen in polishedslabs from the uppermost 30 cm (Fig. 5, Supplementary Fig. 8B, C2).The haloes are therefore interpreted as pedodiagenetic accumulationsaround roots, and the tubules as rhizocretions (in the sense of Klappa,1980). The rhizocretions underwent little deformation during burialcompaction and may be partly or totally infilled with calcarenites withoyster fragments and small benthic foraminifera of overlying memberI of the Claret Formation (Supplementary Fig. 8C). These featuresdemonstrate that the topmost part of the Thanetian carbonates wassubaerially exposed, colonised by plants and probably indurated. Thecolonising plants died and decayed when the area was reflooded by ashallow sea, and some rhizocretions became open voids that wereinfilled with marine sediments. Clearly, at Ferrera the extent of plantcolonisation was less extensive, and the interval of subaerial exposureshorter, than at Campo. This suggests that the pre-PETM lowstandshoreline was placed a short distance to the west of the Ferrera ridgesection.
The calcarenites overlying the subaerial exposure surface at Ferrerawere deposited during the PETM according to the isotope data(Table 1), coeval deposits to member 1 being therefore absent. Suchabsence implies either that no erosional depression was excavated inthis distal zone or that the Ferrera site was located at the shoulder ofan erosional depression.
6. Basal unconformity and member 1 of the ClaretFormation: interpretation
The erosional depressions delineated by the lower boundary of theClaret Formation in the Esplugafreda, Claret and Campo sectors arehere interpreted as incised valleys using some of the criteria of Boydet al. (2006); Table 3. It is widely acknowledged that the excavation ofincised valleys in the margins of marine basins is mostly triggered bya relative sea-level fall (e.g., Strong and Paola, 2008), the surfaces ofsubaerial exposure capping marine deposits at the Campo and Ferrerasections providing evidence that this was the case in the Tremp-GrausBasin.
The excavation of an incised valley continues until the sea reaches itslowest level, the valley being filled with sediments during the subse-quent sea-level rise. In this process the seaward part of the incisedvalley may be transformed into an estuary, but fluvial conditions maycontinue in its landward part (Boyd et al., 2006). This model may ex-plain the lithological differences in member 1 of the Claret Formation,the brackish-water deposits found in the Campo sector being attribut-able to an estuarine setting, the red clastic deposits of the Esplugafredasector to a fluvial setting, those of the Claret sector showing mixedinfluences.
Field data demonstrate that the cutting and filling of the Tremp-Graus incised valleys occurred during a single cycle of sea-level changeprior to the deposition of the Claret Conglomerate (Figs. 6–8), andhencebefore the onset of the PETM.
Fig. 6.Geologicalmapof the Esplugafreda sector (location in Fig. 2B), showing thefivemembers of the Claret Formation and the three erosional depressions (interpreted as incised valleys)recognized in the area. North is to the bottom of the figure.
52 V. Pujalte et al. / Palaeogeography, Palaeoclimatology, Palaeoecology 393 (2014) 45–60
7. PETM members of the Claret Formation
7.1. Member 2 (Claret Conglomerate)
The facies of the Claret Conglomerate change progressively acrossthe Tremp-Graus Basin. In the north–eastern part of the basin it is rep-resented by a sheet-like unit of clast-supported calcareous conglomer-ates and pebbly calcarenites that can be traced in strike and dipsections from Esplugafreda to the west of Serraduy (ca. 25 km), andfrom Esplugafreda to near the village of Tendrui, north of Claret (ca.8 km) (Schmitz and Pujalte, 2007; Figs. 2, 3, 6; Supplementary Figs. 2,3). This extensive sheet-like unit generally ranges in thickness between1 and4 m, locally reaching8 m, and it is very coarse-grained, some of itswell-rounded clasts reaching 80 cm in length, and clasts in the20–40 cm range being common. A distinctive feature of the unit is theabundance of rubefied (reddened) clasts, which in some exposuresamount to almost half the total clast population. Soil carbonate nodulesincluded in intercalated grey or red mudstones in some sections(e.g., Berganuy, Supplementary Fig. 1) provide δ13C isotopic values char-acteristic of the onset of the PETM (Schmitz and Pujalte, 2007). Thesheet-like part of the Claret Conglomerate has a low-relief sharp baseand an abrupt top that usually preserves depositional morphologies, afact attributed to abandonment of depositional tracts after avulsions(Supplementary Figs. 3, 4, 9).
Schmitz and Pujalte (2007) interpreted this part of the ClaretConglomerate as an extensive braidplain, representing the proximalpart of a megafan developed at the onset of the PETM after a dramaticincrease in seasonal rain. A tectonic origin was excluded by the lack ofevidence of regional tectonism (Fig. 1) and by the abrupt lower andupper boundaries of the unit, for it seems unrealistic that tectonismcould create and destroy a high relief in the short time span representedby the Claret Conglomerate. Conversely it has been shown throughmodelling that an increase in catchment precipitation results in the de-position of a laterally extensive sheet of coarse gravel (Armitage et al.,2011).
The Claret Conglomerate is missing near Tendrui but it reappears,about 1 km south of that village, in the Claret sector (Fig. 7). There,
the Claret Conglomerate can be traced for about 2 km and exhibits alens-shaped geometry, with a nearly flat erosional base and a convex-up top (Fig. 7). Such lens-shaped geometry, also observed a few kmwest of Serraduy, is thought to reflect a depositional lobe of the ClaretConglomerate megafan.
Further west, in the Campo sector (Fig. 2), Member 2 is representedby numerous channel-like bodies, 2–4 m thick and tens of metres wide,embedded within marly clays. The channel-like bodies are made up ofconglomerates and/or pebbly sandstones grading up to cross-beddedand parallel-laminated sandstones withmudstone intercalations. Clastsof the conglomerates rarely exceed 5 cm in length but they are of a sim-ilar composition to those at Esplugafreda and Claret, in all cases beingmainly derived from Cretaceous limestones. Soil carbonate nodulesfrom mudstone intercalations at the top of some channel-like bodiesand from their surrounding marly clays produced PETM isotopic values(Schmitz and Pujalte, 2007; Pujalte et al., 2009b), clear evidence thatthese deposits are the distal correlative of the sheet-like and lens-shaped segments of the Claret Conglomerate.
7.2. Member 3 (“yellowish soils”)
Member 3 is mainly made up of silty mudstones of a distinctiveyellowish orange colour in weathered exposures (SupplementaryFigs. 3, 7), with minor intercalations of channel-like bodies of pebblysandstones. The unit generally decreases in thickness from east towest, from a maximum of ca. 30 m in the Claret sector to a minimumof ca. 2 m in the Campo section, the decrease being partly due tointerfingering with other members (Fig. 4). Another characteristicfeature of member 3 is the occurrence of abundant, small-sized (bcm)carbonate nodules that are not concentrated on discrete K horizonsbut randomly dispersed throughout the unit (Fig. 4, SupplementaryFig. 9, inset). Such nodule distribution suggests a cumulate soil profile(in the sense of Wright and Marriot, 1996), a profile that developswhere small but frequent increments of sediments produce aggradationof the sediment surface, vertical displacement of the zone of active pe-dogenesis and abandonment of lower levels of the soil. Isotopic valuesof these nodules are typical of the core of the PETM (Schmitz and
A
B
Fig. 7. (A) Geologicalmap, and (B) S–N cross-section across the P–E interval in the Claret sector (location in Fig. 2B), showing the position of reference sections and the architecture of the 5members of the Claret Formation. For lithological key of members 2–5 see Fig. 4.
Pujalte, 2003, 2007; Pujalte et al., 2009b; Supplementary Fig. 1).Rhizoliths are also numerous in some sections (Supplementary Fig. 9,inset).
7.3. Members 4 (gypsum-rich member)
Member 4, which is typified by a variable content of gypsum, onlyoccurs in the eastern part of the basin, directly above the yellowishsoils (Fig. 4, Supplementary Figs. 1, 9). In the basin margins (i.e.Esplugafreda sector and south of the Claret sector), it is up to 10 mthick and mostly made up of silty mudstones of a deep red colour, thegypsum occurring either as veins, root-like concretions, or centimetre-sized nodules. Instead, gypsum is the predominant lithology of member4 in the central part of the basin. For instance, in Section 6 of the Claretsector (Fig. 7) the gypsumoccurswithin two stacked cycles, each 3–4 mthick, composed from bottom to top of three intergradational parts:
1) red siltstone with small gypsum nodules; 2) red siltstone criss-crossed by contorted veins of alabastrine gypsum; and 3) decimetre tometre-sized nodules of massive gypsum, commonly coalescing intolarger masses. Finally, in Section 1 of the Claret sector, member 4 isrepresented by a 4 m thick accumulation almost exclusively made upof alabastrine gypsum (Supplementary Fig. 9).
According to García Veigas (1997), the gypsum of member 4 is ofsecondary origin after a number of sulphate lithofacies. Nodular-massive gypsum accumulations of the central part of the basin areinterpreted as free or subaquatic precipitates within a saline lake,whereas those of the northern and southern parts are considered inter-stitial precipitates within saline mud-flats surrounding the lake. Clearlyan arid climate prevailed in the Tremp-Graus Basin during the recoveryphase of the PETM, while member 4 was being deposited.
Interestingly, a carbonate unit also indicative of arid climate was re-ported by Eichenseer and Luterbacher (1992) at the Campo section, just
A
B
C
Fig. 8. (A) Columnar section andfield photo of the Thanetian–lower Ilerdian interval of the Campo section in the right (west) bank of the Esera river. L,M andU = lower,middle andupperunits of the Upper Thanetian marine succession; position of geomagnetic chron 25 N, and a micrograph of Discoaster multiradiatus is also shown. (B, C) Geological map and cross-sectionof Thanetian–lower Ilerdian strata in the Campo sector (location in Fig. 2B), highlighting themembers of the Claret Formation (CC = Claret Conglomerate distal facies). Reference Sections:1, Campo; 2, La Cinglera; 3, San Martín; 4, Castellar; 5, Unnamed.
54 V. Pujalte et al. / Palaeogeography, Palaeoclimatology, Palaeoecology 393 (2014) 45–60
above two prominent limestone beds with alveolinids that pinch outinto the yellowish soils about 3 km to the east of Campo (Pujalte et al.,2009b; Fig. 4, Supplementary Fig. 7B). That carbonate unit is ca. 5 mthick and consists of a few stacked shallowing-up cycles composed,from base to top, of lagoonal miliolid packstones, inter- to supratidallimestones with charophytes and supratidal dolomites with algal lami-nations disrupted by nodules of gypsum and celestine (SupplementaryFig. 8C). Eichenseer and Luterbacher (1992) interpreted these cycles asarid to semi-arid tidal flat parasequences, and pointed out that similaraccumulations are absent in the remainder of the marine Ilerdian suc-cession of the Tremp-Graus Basin. The uniqueness of these arid tidalflat deposits, and their stratigraphic location just above deposits coevalwith the yellowish soils, strongly suggest that they are correlative withmember 4 of the Claret Formation (Fig. 4).
7.4. Claret Formation members at the Ferrera ridge section
Member I (2.5 m thick) is represented by cross- and parallel-laminated calcarenites that decrease up section in bed thickness from30 cm to 10 cm, and in mean grain-size from medium to very-finegrades (Fig. 5; Supplementary Fig. 8). The calcarenites are well sortedand contain ca. 15% of quartz grains. Abraded oyster remains occur inthe lower half of the member, and small benthic foraminifers andcalcareous algae in the upper half. Member I is thus attributable to ahigh-energy nearshore marine environment.
Member II (ca. 2 m thick), which is partly covered by scree and veg-etation (Fig. 5; Supplementary Fig. 8), is made up of brownish sandymarlstones grading up into marls. A sample from its lower part (SF-8in Table 2) contains ostracods and small benthic foraminifera, with
A C
B D
E
Fig. 9. (A) Simplified columnar section of a part of the Campo section in the left (east) bank of the Esera River (location in Fig. 8B). (B) Field view of intervals Y and Z, illustrating theirdifferent aspect; note the undulating morphology of the subaerial exposure surface capping Z. (C) Close-up of the rugged surface of subaerial exposure capping interval Z; (D and E)close-up and polished slab of interval Z, showing irregular pieces of host rock (dark grey zones) surrounded byMicrocodium-rich zones (light-grey zones). Rule in D is 20 cm, diameterof coin in E is 2 cm. Brownish colours in figures B, C and D is due to superficial coating.
lesser amounts of charophyte oogonia and inner moulds of tiny gastro-pods. The ostracod assemblage is dominated by Neocyprideis, a genusreported from Cenozoic shallow marine environments (e.g., Siddiqui,2000). The benthic foraminifera assemblage is mainly composed of hy-aline forms of the order Rotaliida, suborder Rotaliina, a group of forami-nifera usually found in shallow marine mixed muddy-sandy floors. Theassemblage includes a few quinqueloculiniforms miliolids and rareagglutinated foraminifera, which support the above interpretation.The rare oogonia in sample SF-8 are rather abraded and were probablyresedimented.
Member III (ca. 3 m thick; Fig. 5), also poorly exposed (Fig. 5), isexclusively composed of greenish silty clays that only contain a sparsemicrofossil assemblage of charophytes, mostly stem remains and rareoogonia (sample SF-9 in Table 2). Charophyte stems, unlike oogonia,are too fragile to survive long-distance transport, and are therefore con-sidered to be autochthonous or para-autochthonous. Their occurrence,
Table 3Comparing some of the criteria for Incised valley systems of Boyd et al. (2006) and observed fe
Criteria of Boyd et al. (2006) O
1 (p. 192)— The valley is a negative (i.e., erosional) palaeotopographic feature, the base ofwhich truncates underlying strata. The valley should be larger than a single channel andcommonly has an erosional relief of 10 m ormore. Most valleys range inwidth between1–10 km.
TbT
2 (pp. 192 and 193) — The (erosional) base and walls of the valley… correlates to anerosional (or hiatal) surface outside the valley…that may be characterized by awell-developed soil or rooted horizon.
Ts
4 (p. 194) — Where the area lies close to the shoreline coastal regression accompaniesincision (and) the base of the incised-valley fill exhibit a juxtaposition ofmore proximal(landward) facies over more distal (seaward) deposits across a regional unconformity.
Tfc
5 (pp. 193 and194) — Deposits of the incised-valley fill onlap the valley base and walls. Oa
7 (p. 194) Channels contained within the valley should be substantially smaller than thevalley itself.
Cr
coupled with the fine-grained nature of the deposits, point to a fresh-water low-energy aquatic environment.
Member IV (3.15 m thick; Fig. 5) is composed of fine-grained lime-stones, dark-grey in fresh cut, which contain charophyte remains andthin-shelled non-ornamented ostracods, both indicative of a low-energy lacustrine setting. Member IV is also represented in the Camposection by a 1.3 m thick bed of grey micritic limestone (Fig. 4, Supple-mentary Fig. 7B). Occasional fragments of charophyte stems wereobserved in thin sections, but also poorly developed circumgranularcracks, mottling and etched quart grains, features indicative ofpalustrine conditions (e.g., Alonso-Zarza, 2003) that suggest that mem-ber IV at Campowas deposited in a zonewith an oscillatingwater-tableor seasonally inundated, probably the margin of a fresh water pond orlake. This interpretation is supported by the fact that the limestonebed pinches out within the continental yellowish soils just a fewhundred metres to the east of Campo (Pujalte et al., 2009b).
atures of the basal erosional boundary and member 1 of the Claret Formation.
bserved features
he depressions in the Esplugafreda, Claret and Campo section are bounded belowy erosional surfaces that truncate underlying strata.hey range between 15–30 m in erosional relief and between 1.05–5 km in width.
he surfaces of subaerial exposure with Microcodium in the Campo and Ferreraections clearly correlate with the erosional bases of the paleovalleys.
he subaerial exposure surfaces withMicrocodium separates Thanetian marine carbonatesrom non-marine deposits of member 1 at the Campo section, and Thanetian openmarinearbonates from littoral-marine deposits of member I at the Ferrera section.nlap onto the valleywall can be observed in some outcrops (e.g., Supplementary Fig. 3B)nd it is inferred for several others (e.g. Fig. 7).hannels contained within the Esplugafreda and Claret depressions meet thatequirement (e.g., Supplementary Fig. 3D).
56 V. Pujalte et al. / Palaeogeography, Palaeoclimatology, Palaeoecology 393 (2014) 45–60
Isotope data (Table 1) demonstrate that the four members of theClaret Formation at Ferrera belong to the PETM. Member I, because ofits coarse-grained nature, is tentatively correlated with the Claret Con-glomerate, while overlyingmembers II, III and IV are considered correl-ative of the yellowish soils, an inference supported by their fieldrelationships (Fig. 4).
8. Borehole data
A better delineation of the palaeogeographical evolution of theTremp-Graus Basin across the P–E interval can be attained with infor-mation from four oil exploration wells (location in Fig. 2). In short, thesuccession of the Cajigar borehole is similar to that of the Serraduysection, those of the Centenera-2 and Monesma wells are comparableto that of the Campo section, and the P–E interval of the Graus-1
Fig. 10. Cross-sections depicting successive positions of the sea level across
borehole is similar to that of the Ferrera ridge section (SupplementaryFig. 10).
9. Sea-level changes in the Tremp-Graus Basin across theP–E interval
9.1. Reconstruction
A reconstruction of relative sea-level changes in the Tremp-GrausBasin during the P–E interval is graphically illustrated in Fig. 10. Clearly,a transgression took place during late Thanetian times, at the peak ofwhich the sea reached the Serraduy section (1 in Fig. 10). A period ofsea-level lowering ensued, during which the former marine carbonateplatform became subaerially exposed, first at Campo and then at theFerrera ridge (2 and 3 in Fig. 10). Concurrently, incised valleyswere pro-gressively excavated in the coastal alluvial plain and in the adjacent
the P–E interval in the Tremp-Graus Basin. Explanation within the text.
carbonate platform until the sea level reached its lowest point (3 inFig. 10). The valleys are drawnwithout deposits for simplicity, althoughin all probability they contained a fraction of them.
A long period of sea-level rise was then initiated, the infilling of theincised valleys being its first consequence (4 in Fig. 10). This inference ispartly based on the fact that most incised valleys are infilled duringrelative sea-level rises (e.g., Boyd et al., 2006; Strong and Paola, 2008),but it is also supported by the estuarine deposits of member 1 in theCampo sector and the occurrence of Ophiomorpha burrows at Claret,both facts indicative of marine influence.
The sea level continued rising during the PETM interval, as demon-strated by the re-flooding of the Ferrera section recorded by member I(5 in Fig. 10). There is ample evidence in the Pyrenean basins that con-tinental clastic influx to the sea was greatly intensified during the PETMinterval (e.g., Schmitz et al., 2001; Schmitz and Pujalte, 2003). Based onthat, the vertical passage of member I to themuddy shallowmarine de-posits ofmember II and then to the fresh-water clayey deposits ofmem-ber III at the Ferrera section is attributed to a climatically-forceddepositional regression (6 in Fig. 10). To the east of Ferrera the sea-level rise caused fluvial aggradation in the coastal plain, recorded bythe bulk of the yellowish soils. The lacustrine/palustrine limestones ofmember IV further reveal that the eastward advance of the Ilerdiansea was heralded by the development of coastal freshwater ponds,probably favoured by a rising water table linked to the sea-level rise(6 and 7 in Fig. 10).
The encroachment of arid tidal flat conditions over marine depositsat Campo suggests a brief pause or slowing down of the sea-level riseduring the recovery phase of the PETM (Fig. 10; SupplementaryFig. 7). After this pause the transgression resumed, the Ilerdian seaeventually flooding the entire Tremp-Graus Basin (7 in Fig. 10). It isimportant to emphasise, however, that the Ilerdian Sea did not reachthe Serraduy section, where the late Thanetian highstand shorelinewas situated, until the end of the PETM (Fig. 10; SupplementaryFig. 2). This fact entails that the bulk of the PETM took placewith a risingbut relatively low sea level.
9.2. Age models
While it is clear that the sea-level fall and rise causing the excavationand infilling of the Tremp-Graus palaeovalleys pre-date the PETM, thelow chronostratigraphic resolution of fossils from the P–E interval pre-clude their precise timing. Consequently, tentative age models basedon two different lines of reasoning are discussed below.
The firstmodel is based on sedimentation rates during Claret Forma-tion times. Estimated time spans for the onset plus the core of the PETMrange from 125 to 135 kyr (Giusberti et al., 2007; Röhl et al., 2007;McInerney and Wing, 2011), a mean duration of 130 kyr being there-fore used for the model. These 130 kyr are represented in the Tremp-Graus Basin by the Claret Conglomerate plus the yellowish soils, where-as the time interval from the peak lowstand to the onset of the PETM isrecorded by member 1 of the Claret Formation (Figs. 4, 10). Two facts,however, must be taken into account before the estimate is attempted.One, member 1 deposits only occur within the incised valleys, whilethose of the PETM are expansive over the whole eastern area of thebasin (Figs. 4, 10). Two, sedimentation rates increased in the Tremp-Graus Basin during the PETM (Schmitz and Pujalte, 2003). To overcomethe first issue, the outcrop areas of members 1–3, rather than their localthicknesses, have been taken as a proxy of sedimentation rates. For thesecond, estimates are made for scenarios involving double, triple andquadruple increases. Larger increases are considered unlikely since, asexplained above, sedimentary features of member 1 also indicate com-paratively high sedimentation rates.
The outcropping area of Members 2 and 3 in the Esplugafreda andClaret sectors have been calculated to be between 6 and 8 times largerthan those ofmember 1 (7 times on average). If no increase in sedimen-tation rate during the PETM is taken into account, the time span of
member 1 would be ca. 18.6 kyr (i.e. 130 kyr/7). This figure wouldsuccessively augment to 37.1, to 55.7 and to 74.3 kyr in the two-fold,three-fold and four-fold increase scenarios. It is reasonable to concludethat the peak lowstand occurred 75 kyr, or less, prior to the PETM.
The second line of approach, based on the deep-water Zumaia sec-tion (location in Fig. 2A), provides a similar estimate. At Zumaia thebulk of the upper Thanetian is formed by stacked marl/marly limestonecouplets 40–50 cm thick, with intercalated thin-bedded (0.5–3.5 cm)turbidites. This succession, however, is capped by three limestonebeds separated by thin marly intercalations, each bed being ca. 20 cmthick, the lower one including a turbidite 8 cm thick (SupplementaryFig. 11). These limestones have a distinctive greenish colouringresulting from a high content in glauconite, and are known to be wide-spread in the Basque Basin (Baceta et al., 2000; Schmitz et al., 2001). Theonset of the PETM occurs immediately above the uppermost limestonebed (Schmitz et al., 1997; Storme et al., 2012).
Dinarès-Turell et al. (2002) convincingly showed that the upperThanetian marl/marly limestone couplets at Zumaia are the expressionof orbital precession cycles, with a mean duration of ca. 19–23 kyr, andit is reasonable to assume that the thin marl/green limestone coupletsalso record precession cycles. Insoluble residues in the former (mostlyclays and silt-sized quartz grains) range between 80 and 45%, abruptlydiminishing to 25–20% in the green limestone couplets (Schmitz et al.,1997; Storme et al., 2012). However, the reason for such a sudden andsignificant reduction in clastic input has not been discussed so far. It ishere suggested that it is linked to the initial phase of the pre-PETMsea-level rise and transgression in the Tremp-Graus Basin (from 3 to 4in Fig. 10), during which a sizable percentage of the clastic supply wasbeing trapped in the incised valleys. This scenario would satisfactorilyexplain both the reduction in clastic input and the abundance of glauco-nite in the green limestone, an indication of condensation. If correct, thiswould imply that the peak lowstand (i.e. just before the deposition ofthe three green limestone couplets) occurred about 57–69 kyr prior tothe onset of the PETM.
9.3. The pre-PETM sea-level fall: magnitude and palaeogeographic effects
An attempt to quantify themagnitude of the pre-PETM sea-level fall,based on data from the Campo section and sector, is graphicallydepicted in Fig. 11A. The coralgal limestones in the uppermostThanetian unit U prove that, just prior to the peak lowstand, Campowas located in the photic zone of a shallow sea. Estimations of the depo-sitional depth of these limestones are however somewhat vague. For in-stance, Scheibner et al. (2007) concluded that they were depositedbelow the wave base, while Baceta et al. (2011) pointed out that theirfossil assemblage resembles turbid-water corals living in shallowsheltered positions of sub-littoral areas. Therefore it is conservativelyassumed here that the corals grew at 3–5 m water depth, their subse-quent subaerial exposure implying a 3–5 m sea-level fall. The excava-tion of the erosional valley to the east of Campo requires 15 additionalmetres of sea-level fall (Fig. 8A). Accordingly, the magnitude the pre-PETM sea-level fall in the Tremp-Graus Basin was, at least, 18–20 m. Itshould be noted that this estimate applies to the last phase of the fall,as the sea-level lowering from the peak highstand to the peak lowstand(from 1 to 3 in Fig. 10) may have been greater.
Although the magnitude of the sea-level fall remains somewhatimprecise, the palaeogeographic changes it brought about can be accu-rately reconstructed. The highstand and peak lowstand shorelines canbe traced extrapolating the data from, respectively, the Serraduy sectionand the Cajigar borehole, and the Ferrera ridge section and the Graus-1borehole (Fig. 11B, C). Clearly, the sea-level fall forced a seaward retreatof the shoreline of ca. 20 km. Also, it triggered the excavation of incisedvalleys, which decreased inwidth upstream from ca. 5 km in the Camposector to around 1 km in the central depression of the Esplugafredasector (Fig. 11C). The E–W Claret erosional depression, in the axialpart of the basin, is tentatively considered a trunk incised valley,
A
B
C
Fig. 11. (A) Simplified sketch used to estimate the magnitude of the pre-PETM sea-levelfall, based on observations in the Campo section and sector (location in Figs. 2B and 8B).(B and C) Reconstructed palaeogeographies of the Tremp-Graus Basin for the peaktransgression and peak regression intervals of the late Thanetian sea (1 and 3 in Fig. 11).
58 V. Pujalte et al. / Palaeogeography, Palaeoclimatology, Palaeoecology 393 (2014) 45–60
whereas the NNE–SSE trending valleys of the Esplugafreda sector areinterpreted as tributaries. The areal distribution of the valleys, coupledwith palaeocurrent directions, demonstrate that several incised valleysystems must have existed, from which it is concluded that the sea-level fall prompted the excavation of a whole suite of them (Fig. 11C).
10. Sea-level changes across the P–E interval in other basins
Sea-level changes similar to those recognized in the Tremp-GrausBasin across the P–E interval have been described elsewhere in the Pyr-enees, in the North Sea area, in the Austrian Alps (northern margin ofthe Tethys), and in the Nile Valley (southern margin of the Tethys).
In the Ordesa and Monte Perdido National Park (north of the AinsaBasin, south-central Pyrenees; Fig. 1), Robador et al. (2009) andPujalte et al. (2011) reported that continental pebbly quartz sandstonesabruptly overlie an irregular erosional surface carved into upperThanetian marine carbonates, a facies shift indicative of a sea-level fall.The continental quartz sandstones evolve gradually seaward tonummulite-bearing sandy marls attributable to the PETM, and areoverlain by lower Ilerdian marine limestones recording a subsequentsea-level rise and transgression.
South of Bilbao, in the western Pyrenees (Fig. 2A), incised valleysinfilled with continental quartz sands were described by Floquet(1992) and by Baceta et al. (1994). No isotopic analyses were carriedout in these studies, but the incised valley deposits are sandwichedbetween upper Thanetian and lower Ilerdian marine carbonates, astratigraphic position identical to those in the Tremp-Graus Basin. Itis reasonable to assume, therefore, that their respective ages aresimilar.
The occurrence of incised valleys in the North Sea just below the P–Einterval area has long been known (e.g., Vandenberghe et al., 1998). Inthe Cap d'Ailly area (Normandy, France) the P–E interval begins, accord-ing to Dupuis (2000), with a unit of fluviatile sands and sandstones thatinfills an irregular topography excavated into Upper Cretaceous chalks.These sands are overlain by lacustrine–palustrine limestones and marlswith pedogenic features in turn capped by a 1 m thick bed of lignite inwhich the CIE associated with the PETM was recorded. The successioncontinueswith alternating clays, silts and sandswith abundant lagoonalfauna. Dupuis (2000) attributed the incised topography into the chalk toa period of low sea-level, followed by a sea-level rise that successivelycaused the infilling of the channel-like depressions, aggradation of thecoastline and deposition of the lagoonal succession. The occurrence ofthe CIE in the 1 m thick lignite proves that both the lowstand and theonset of the sea-level rise predate the PETM. Dupuis et al. (2011) subse-quently proved that the same situation can be observed in outcropsacross the eastern English Channel, northwestern France and southernBelgium.
Sea-level changes in the Austrian Alps were investigated Egger et al.(2009) and Egger (2011) in two sections, Frauengrube and Anthering.The former is a shallow-water succession in which the PETM intervalis missing, the latter a deep-water turbidite-bearing succession with acontinuous record across the P–E interval. The thickest turbidites atAnthering, some of them up to 5 m thick, occur in the 20 m thickinterval situated just below the onset of the PETM. This fact was takenas evidence of a sea-level fall occurring shortly before the PETM,which would also explain the missing interval at Frauengrube. Duringthe PETM interval itself, sedimentation at Anthering was mainly of afine-grained nature, with a large increase in hemipelagic contribution,features considered indicative of a coeval sea-level rise.
In the Nile Valley, the P–E interval is represented by an outer shelfsuccession that contains an expanded record of the PETM, the base ofwhich marks the Global Boundary Standard Stratotype Section andPoint (GSSP) for the Eocene Series (Aubry et al., 2007). This GSSP wasplaced at the base of the so-called Dababiya quarry beds, a unit restingon a gently, concave-up erosional surface of regional extent excavatedin the uppermost Paleocene succession, the origin of which has beenlinked to a pre-PETM sea-level fall (Speijer, 2006; Aubry et al., 2009).Based on a quantitative analysis of ostracod associations Speijer andMorsi (2002) concluded that the magnitude of the fall was ca. 15 m, ittook place during the 60 kyr prior to the PETM and it was followed bya sea-level rise of ca. 20 m during the PETM, leading to the depositionof the Dababiya Quarry Beds. Thus, although based on an entirely
different data set, the Egyptian record seems to closelymatch the timingand magnitude of the sea-level changes described in the Tremp-GrausBasin.
11. Discussion
Several authors have suggested that sea-level changes across theP–E interval in the North Sea area were tectonically induced. Dupuiset al. (2011), for instance, concluded that the incision of the pre-PETMfluvial network was a result of a broad uplift caused by magmaticactivity in the North Atlantic Igneous Province, while the subsequenttransgression was caused by thermal subsidence of the margins afterthe cooling of the intrusion. Tectonomagmatic driven uplift and subsi-dence might also be invoked to explain the sea-level changes in theAustrian Alps, where the effect of North Atlantic volcanism is well doc-umented (Egger and Brückl, 2006). However, those in the Pyreneeswould be difficult to explain by thismechanism for at least two reasons:one, tectonics were subdued in the Pyrenees during the Danian–earlyIlerdian interval (Fig. 1); two, dissimilar effects would be expected indifferent tectonic units and, instead, essentially the same results werefound in the Tremp-Graus Basin, in the northern Ainsa Basin and inthe southern Basque Cantabrian area (Figs. 1, 2). The similar timingand magnitude of sea-level changes in the Pyrenean basins and in theNile Valley would be even harder to explain. The bulk of the evidencetherefore suggests that the sea-level changes around the P–E in theTremp-Graus Basin were either eustatic or at least eustatically-dominated.
The origin of the late Thanetian sea-level lowering is somewhatenigmatic. Glacioeustasy is one possibility, as some recent studies indi-cate that ephemeral small ice sheets could grow in Antarctica even dur-ing greenhouse climates (e.g., Miller et al., 2005a), and in fact Speijer(2006) suggested this mechanism to explain the pre-PETM sea-levelfall in Egypt. However, a 20 m lowering of global sea level throughglacioeustacy alone would require a major cooling and a rapid build-up of ice, of which published oxygen isotopic records show no evidence.Thus, although glacioeustacy might have played a role, this fact arguesstrongly against it being the sole driving mechanism of the sea-levelfall. Clearly more data will be necessary to resolve the issue.
The eustatic nature of the sea-level rise during the PETM is moreconclusive since, in addition than in the basins here reported, the risehas been documented in such widely separated sites as the New JerseyShelf, Arctic Spitsbergen or New Zealand. In these three sites the risehad been attributed to thermal expansion of seawater due to oceanwarming during the PETM (Sluijs et al., 2008; Handley et al., 2011;Harding et al., 2011). However, the data from the Tremp-Basin demon-strate that the sea-level rise started before the PETMand continued dur-ing and after it, causing the widespread Ilerdian trangression in thewhole Pyrenean Gulf (Fig. 10). Clearly other mechanisms, in additionto thermal expansion, must have forced such a significant and long last-ing eustatic sea-level rise. The close temporal coincidence between therise and tectono-magmatic activity in the North Atlantic strongly sug-gest a causal relationship, but perhaps not in the way advocated byDupuis et al. (2011). Alternatively, Miller et al. (2005b) indicate thatthe opening of the Norwegian–Greenland Sea during the late Paleoceneto early Eocene interval was coeval with the largest change in ridgelength of the past 100 Myr, and they suggest that this reorganisationcaused a sea-level rise and increased CO2 outgassing which contributedto global warming.
12. Conclusions
The data provided in this paper demonstrate that the PETM waspreceded in the Tremp-Graus Basin by a sea-level fall of ca. 20 m,which forced a seaward displacement of the shoreline of ca. 20 kmand the excavation of a whole suite of incised valleys in the adjacent al-luvial plain. The subsequent sea-level rise started between 75 and
57 kyr before the P–E boundary, bringing about the infilling of the in-cised valleys. Despite a depositional regression at the onset of thePETM, caused by increased clastic supply, the sea level continued torise during and after the thermal event, causing the aggradation of thealluvial plain and the so-called Ilerdian transgression. Literature data in-dicate that the sea-level lowering preceding the PETM can be recognisedin other basins of the Pyrenees, throughout the whole North Sea area,the Austrian Alps and in Egypt, and that the subsequent sea-level riseis globally widespread, strong evidence of an eustatic origin. The precisemechanism(s) causing the pre-PETM sea-level lowering still need to bedetermined, although a glacioeustatic component cannot be excluded.The subsequent global sea-level rise was most probably connected to alarge change in ridge length in the Norwegian-Greenland Sea.
Supplementary data to this article can be found online at http://dx.doi.org/10.1016/j.palaeo.2013.10.016.
Acknowledgements
Field and laboratory studies of VP and JIB were funded by theResearch Project CLG2011-23770 (Ministerio de Economía yCompetitividad, Spanish Government) and IT-631-13 (ResearchGroupsof the Basque University System, Basque Government); those of BS bythe Swedish Research Council. We are indebted to A. Pérez-García(Repsol Exploración SA) for the borehole information, to F. Caballero(University of the Basque Country) for assistance in thefield and samplepreparation, and to J. Rodriguez-Lázaro and B. Martínez García (Univer-sity of the Basque Country) for their advice about the Claret Formationostracods and small benthic forams. Last, but not least, we thank threeanonymous reviewers and Finn Surlyk (Journal Editor), for numerouscomments that greatly improved an early version of this manuscript.
References
Alonso-Zarza, A.M., 2003. Palaeoenvironmental significance of palustrine carbonates andcalcretes in the geological record. Earth Sci. Rev. 60, 261–298.
Armitage, J.J., Duller, R.A., Whittaker, A.C., Allen, P.A., 2011. Transformation of tectonic andclimatic signals from source to sedimentary archive. Nat. Geosci. 4, 231–235.
Aubry, M.P., Ouda, K., Dupuis, C., Berggren, W.A., Van Couvering, J.A., Members of theWorking Group on the Paleocene/Eocene boundary, 2007. The Global StandardStratotype-section and Point (GSSP) for the base of the Eocene Series in the Dababiyasection (Egypt). Episodes 30, 271–286.
Aubry, M.P., Dupuis, C., Berggren, W.A., Ouda, K., Knox, K., Sabour, A.A., 2009. Sea-levelchanges bracket the PETM. In: Strong, P., Crouch, E., Hollis, C. (Eds.), and Biotic Eventsof the Paleogene, CBEP 2009, Wellington, New Zealand, Conference program andAbstracts, p. 144.
Baceta, J.I., Pujalte, V., Payros, 1994. Rellenos de valles encajados en el Maastrichtiense su-perior y Paleógeno inferior de Alava (Plataforma Noribérica, Cuenca Vasca).Geogaceta 16, 86–89.
Baceta, J.I., Pujalte, V., Dinarès-Turell, J., Payros, A., Orue-Etxebarria, X., Bernaola, G., 2000.The Paleocene–Eocene boundary interval in the Zumaia section (Guipúzcoa, BasqueBasin): magnetoestratigraphy and high-resolution lithostratigraphy. Rev. Soc. Geol.Esp. 13, 375–391.
Baceta, J.I., Pujalte, V., Caballero, F. (Eds.), 2006. Paleocene and Early Eocene facies andevents: a basin–platform–coastal plain transect (South-Central and WesternPyrenees). Post Conference Field Trip Guidebook of the Climate and Biota of theEarly Paleogene International Meeting 2006, Bilbao, Spain (94 pp.).
Baceta, J.I., Pujalte, V., Wright, V.P., Schmitz, B., 2011. Carbonate platform models, sea-level changes and extreme climatic events during the Paleocene–early Eocene green-house interval: a basin–platform–coastal plain transect across the southern Pyreneanbasin. In: Arenas, C., Pomar, L., Colombo, F. (Eds.), Pre-Meeting Field-trips Guidebook,28th IAS Meeting, Zaragoza. Sociedad Geológica de España, Geo-Guías, 7,pp. 101–150.
Boyd, R., Dalrymple, R.W., Zaitlin, B.A., 2006. Estuarine and incised-valley facies models.In: Posamentier, H.W., Walker, R.G. (Eds.), Facies Models Revisited: SEPM (Societyfor Sedimentary Geology) Special Publication, 84, pp. 171–235.
Crouch, E.M., Heilmann-Clausen, C., Brinkhuis, H., Morgans, H.E.G., Rogers, K.M., Egger, H.,Schmitz, B., 2001. Global dinoflagellate event associated with the late Paleocenethermal maximum. Geology 29, 315–318.
Cuevas, J.L., 1992. Estratigrafía del Garumniense de la Conca de Tremp. Prepirineo deLérida. Acta Geol. Hisp. 27, 95–108.
DeConto, R.M., Galeotti, S., Pagani, M., Tracy, D., Schaefer, K., Zhang, T., Pollard, D.,Beerling, D.J., 2012. Past extreme warming events linked to massive carbon releasefrom thawing permafrost. Nature 484, 87–92.
Dickens, G.R., O'Neil, J.R., Rea, D.K., Owen, R.M., 1995. Dissociation of oceanic methane hy-drate as a cause of the carbon isotope excursion at the end of the Paleocene.Paleoceanography 10, 965–971.
60 V. Pujalte et al. / Palaeogeography, Palaeoclimatology, Palaeoecology 393 (2014) 45–60
Dinarès-Turell, J., Baceta, J.I., Pujalte, V., Orue-Etxebarria, X., Bernaola, G., 2002.Magnetostratigraphic and cyclostratigraphic calibration of a prospective Palaeocene ⁄Eocene stratotype at Zumaia (Basque Basin, northern Spain). Terra Nova 14, 371–378.
Domingo, L., López-Martínez, N., Leng,M.J., Grimes, S.T., 2009. The Paleocene–Eocene Ther-mal Maximum record in the organic matter of the Claret and Tendruy continental sec-tions (South-central Pyrenees, Lleida, Spain). Earth Planet. Sci. Lett. 281, 226–237.
Dupuis, C., 2000. L'intervalle Paléocène–Eocène au Cap d'Ailly (Haute Normandie) et lespaléoaltérations à la base des faciès Sparnaciens. Bull. Inf. Géol. Bassin Paris 37,10–14.
Dupuis, C., Quesnel, F., Iakovleva, A., Storme, J.-Y., Yans, J., Magioncalda, R., 2011. Sea levelchanges in the Paleocene–Eocene interval in NW France: evidence of two majordrops encompassing the PETM. In: Egger, H. (Ed.), Climate and Biota of the EarlyPaleogene, Conference Program and Abstracts, Salzburg, Austria. Berichte derGeologischen Bundesanstalt, 85, p. 113.
Egger, H., 2011. The early Paleogene history of the Eastern Alps. In: Egger, H. (Ed.), Cli-mate and Biota of the Early Paleogene, Field-Trip Guidebook, Salzburg, Austria.Berichte der Geologischen Bundesanstalt, 86, pp. 9–16.
Egger, H., Brückl, E., 2006. Gigantic volcanic eruptions and climatic change in the earlyEocene. Int. J. Earth Sci. 95, 1065–1070.
Egger, H., Heilmann-Clausen, C., Schmitz, B., 2009. From shelf to abyss: record of thePaleocene/Eocene boundary in the Eastern Alps (Austria). Geol. Acta 7, 215–227.
Eichenseer, H., 1988. Facies geology of late Maestrichtian to early Eocene coastal andshallow marine sediments, Tremp-Graus Basin, northeastern Spain. Arbeiten ausdem Institut und Museum für Geologie und Paläontologie der Universität Tübingen,n.1. (273 pp.). (Ph.D. Thesis).
Eichenseer, H., Luterbacher, H., 1992. The marine Paleogene of the Tremp region (north-east Spain): depositional sequences, facies history, biostratigraphy and controllingfactors. Facies 27, 119–152.
Fernández, O., Muñoz, J.A., Arbués, P., Falivene, O., 2012. 3D structure and evolution of anoblique system of relaying folds: the Ainsa basin (Spanish Pyrenees). J. Geol. Soc. 169,545–559.
Floquet, M., 1992. Outcrop sequence stratigraphy in a ramp setting: the Late Cretaceous–Early Paleogene deposits of the Castilian Ramp (Spain). In: CNRS/IFP (Ed.), Field tripguide book International Symposium on Sequence Stratigaphy of Mesozoic–CenozoicEuropean Basins: Université de Bourgogne, Dijon (130 pp.).
García Veigas, J., 1997. First Continental Evaporitic Phase in the South Pyrenean CentralArea: Tremp Gypsum (Garumn Facies, Upper Paleocene; Allochtonous Zone). In:Busson, G., Schreiber, B.Ch. (Eds.), Sedimentary Deposition in Rift and Foreland Basinsin France and Spain (Paleogene and Lower Neogene). Columbia University Press,pp. 335–342.
Gile, L.H., Peterson, F.F., Grossman, R.B., 1965. The K horizon — a master soil horizon ofcarbonate accumulation. Soil Sci. 99, 74–82.
Gingerich, P.D., 2003. Mammalian responses to climate change at the Paleocene–Eocene boundary: Polecat Bench record in the northern Bighorn Basin, Wyo-ming. In: Wing, S.L., Gingerich, P.D., Schmitz, B., Thomas, E. (Eds.), Causes andConsequences of Globally Warm Climates in the Early Paleogene. GSA SpecialPaper, 369, pp. 463–478.
Giusberti, L., Rio, D., Agnini, C., Backman, J., Fornaciari, E., Tateo, F., Oddone, M., 2007.Mode and tempo of the Paleocene–Eocene Thermal Maximum in an expanded sec-tion from the Venetian pre-Alps. Geol. Soc. Am. Bull. 119, 391–412.
Handley, L., Crouch, E.M., Pancost, R.D., 2011. A New Zealand record of sea level rise andenvironmental change during the Paleocene–Eocene Thermal Maximum.Palaeogeogr. Palaeoclimatol. Palaeoecol. 305, 185–200.
Harding, I.C., Charles, A.J., Marshall, J.E.A., Pälike, H., Roberts, A.P., Wilson, P.A., Jarvis, E.,Thorne, E., Morris, E., Moremon, R., Pearce, R.B., Akbari, S., 2011. Sea-level and salinityfluctuations during the Paleocene–Eocene thermal maximum in Arctic Spitsbergen.Earth Planet. Sci. Lett. 303, 97–107.
Higgins, J.A., Schrag, D.P., 2006. Beyond methane: towards a theory for the Paleocene–Eocene Thermal Maximum. Earth Planet. Sci. Lett. 245, 523–537.
Kabanov, P., Anadón, P., Krumbein, W.E., 2008. Microcodium: an extensive review and aproposed non-rhizogenic biologically induced origin for its formation. Sediment.Geol. 205, 79–99.
Klappa, C.F., 1978. Biolithogenesis of Microcodium: elucidation. Sedimentology 25,489–522.
Kosir, A., 2004. Microcodium revisited: root calcification products of terrestrial plants oncarbonate-rich substrates. J. Sediment. Res. 74, 845–857.
McInerney, F.A., Wing, S.L., 2011. The Paleocene–Eocene Thermal Maximum: a perturba-tion of carbon cycle, climate, and biosphere with implications for the future. Annu.Rev. Earth Planet. Sci. 39, 489–516.
Miller, K.G., Kominz, M.A., Browning, J.V., Wright, J.D., Mountain, G.S., Katz, M.E.,Sugarman, P.J., Cramer, B.S., Christie-Blick, N., Pekar, S.F., 2005a. The phanerozoic re-cord of global sea-level change. Science 310, 1293–1298.
Miller, K.G., Wright, J.D., Browning, J.V., 2005b. Visions of ice sheets in a greenhouseworld. In: Paytan, A., De La Rocha, C. (Eds.), Ocean Chemistry Throughout the Phan-erozoic. Marine Geology Special Issue, 217, pp. 215–231.
Muñoz, J.A., 1992. Evolution of a continental collision belt: ECORS-Pyrenees crustalbalanced cross-section. In: McClay, K.R., Buchanan, P.G. (Eds.), Thrust tectonics.Chapman & Hall, London, pp. 235–246.
Pujalte, V., Schmitz, B., 2005. Revisión de la estratigrafía del Grupo Tremp(“Garumniense”, Cuenca de Tremp-Graus, Pirineos meridionales). Geogaceta 38,79–82.
Pujalte, V., Dinarès-Turell, J., Bernaola, G., Baceta, J.I., Payros, A., 2003. A reappraisal ofthe position of Chron C25n in the Campo section (Huesca province, south–centralPyrenees). Geogaceta 34, 155–158.
Pujalte, V., Baceta, J.I., Schmitz, B., Orue-Etxebarria, X., Payros, A., Bernaola, G., Apellaniz,E., Caballero, F., Serra-Kiel, J., Tosquella, J., 2009a. Redefinition of the Ilerdian Stage(early Eocene). Geol. Acta 7, 177–194.
Pujalte, V., Schmitz, B., Baceta, J.I., Orue-Etxebarria, X., Bernaola, G., Dinarès-Turell, J.,Payros, A., Apellaniz, E., Caballero, F., 2009b. Correlation of the Thanetian–Ilerdianturnover of larger foraminifera and the Paleocene–Eocene Thermal Maximum:confirming evidence from the Campo area (Pyrenees, Spain). Geol. Acta 7, 161–175.
Pujalte, V., Robador, A., Payros, A., Samsó, J.M., 2011. Sea level changes across the PETM inthe Pyrenees, part 2: evidence from a platform interior setting. In: Egger, H. (Ed.), Cli-mate and Biota of the Early Paleogene, Conference Program and Abstracts, Salzburg,Austria. Berichte der Geologischen Bundesanstalt, 85, p. 132.
Robador, A., 2008. El Paleoceno e Ilerdiense inferior del Pirineo occidental: Estratigrafía ySedimentología. (Ph.D. Thesis) University of the Basque Country, Spain. Publicacionesdel Instituto Geológico y Minero de España, Serie Tesis Doctorales 12 (312 pp.).
Robador, A., Samsó, J.M., Serra-Kiel, J., Tosquella, J., 1990. Field guide. In: Barnolas, A.,Robador, A., Serra-Kiel, J., Caus, E. (Eds.), Introduction to the Early Paleogene of theSouth Pyrenean Basin. Field-Trip Guidebook 1st Meeting IGCP Project 286. InstitutoTecnológico Geominero de España, Madrid, pp. 131–159.
Robador, A., Pujalte, V., Samsó, J.M., Payros, A., 2009. Registro geológico del máximotérmico del Paleoceno Eoceno en el Parque Nacional de Ordesa y Monte Perdido(Pirineo Central). Geogaceta 46, 111–114.
Roest, W.R., Srivastava, S.P., 1991. Kinematics of the plate boundaries between Eurasia,Iberia, and Africa in the North Atlantic from the Late Cretaceous to the present.Geology 19, 613–616.
Röhl, U., Westerhold, T., Bralower, T.J., Zachos, J.C., 2007. On the duration of thePaleocene–Eocene thermal maximum (PETM). Geochem. Geophys. Geosyst. 8, 1–13.
Scheibner, C., Rasser, M.W., Mutti, M., 2007. The Campo section (Pyrenees, Spain)revisited: implications for changing benthic carbonate assemblages across thePaleocene–Eocene boundary. Palaeogeogr. Palaeoclimatol. Palaeoecol. 248, 145–168.
Schmitz, B., Pujalte, V., 2003. Sea-level, humidity, and land-erosion records across the ini-tial Eocene Thermal Maximum from a continental-marine transect in northern Spain.Geology 31, 689–692.
Schmitz, B., Pujalte, V., 2007. Abrupt increase in seasonal extreme precipitation at thePaleocene–Eocene boundary. Geology 35, 215–218.
Schmitz, B., Asaro, F., Molina, E., Monechi, S., von Salis, K., Speijer, R.P., 1997. High-resolution iridium, δ13C, δ180, foraminifera and nannofossil profiles across the latestPaleocene benthic extinction event at Zumaya, Spain. Palaeogeogr. Palaeoclimatol.Palaeoecol. 133, 49–68.
Schmitz, B., Pujalte, V., Núnez-Betelu, K., 2001. Climate and sea-level perturbations duringthe Initial Eocene Thermal Maximum: evidence from siliciclastic units in the BasqueBasin (Ermua, Zumaia and Trabakua Pass), northern Spain. Palaeogeogr.Palaeoclimatol. Palaeoecol. 165, 299–320.
Siddiqui, Q.A., 2000. Some species of the genus Neocyprideis in the early Tertiary ofPakistan. J. Micropalaeontol. 19, 1–7.
Speijer, R.P., 2006. Eustasy in the hothouse of the PETM. In: Caballero, F., Apellaniz, E.,Baceta, J.I., Bernaola, G., Orue-Etxebarria, X., Payros, A., Pujalte, V. (Eds.), Climate andBiota of the Early Paleogene, CBEP 2006, Bilbao, Spain. Volume of Abstracts, p. 168.
Speijer, R.P., Morsi, A.M.M., 2002. Ostracode turnover and sea-level changes associatedwith the Paleocene–Eocene Thermal Maximum. Geology 30, 23–26.
Storme, J.-Y., Devleeschouwer, X., Schnyder, J., Cambier, G., Baceta, J.I., Pujalte, V., DiMatteo, A., Iacumin, P., Yans, J., 2012. The Palaeocene⁄Eocene boundary section atZumaia (Basque–Cantabric Basin) revisited: new insights from high-resolution mag-netic susceptibility and carbon isotope chemostratigraphy on organic matter(δ13Corg). Terra Nova 24, 310–317.
Strong, N., Paola, C., 2008. Valleys that never were: time surfaces versus stratigraphicsurfaces. J. Sediment. Res. 78, 579–593.
Svensen, H., Planke, S., Malthe-Sørenssen, A., Jamtveit, B., Myklebust, R., Eidem, T.R., Rey,S.S., 2004. Release ofmethane from a volcanic basin as amechanism for initial Eoceneglobal warming. Nature 429, 542–545.
Thomas, E., 1998. 1998. Biogeography of the late Paleocene benthic foraminiferal extinc-tion. In: Aubry, M.-P., Lucas, S., Berggren, W.A. (Eds.), Late Paleocene–Early EoceneClimatic and Biotic Events in theMarine and Terrestrial Records. Columbia UniversityPress, New York, pp. 214–235.
Vandenberghe, N., Laga, P., Steurbaut, E., Hardenbol, J., Vail, P.R., 1998. Tertiary SequenceStratigraphy at the southern border of the North Sea Basin in Belgium. In: deGraciansky, P.C., Hardenbol, J., Jacquin, T., Vail, P.R. (Eds.), Mesozoic and Cenozoic Se-quence Stratigraphy of European basins, 60. SEPM Special Publication, pp. 119–154.
Vandenberghe, N., Hilgen, F.J., Speijer, R.P., 2012. The Paleogene Period. In: Gradstein,F.M., Ogg, J.G., Schmitz, M., Ogg, G. (Eds.), The Geological Time Scale 2012. Elsevier,pp. 855–921.
Wright, V.P., Marriott, S.B., 1996. A quantitative approach to soil occurrence in alluvial de-posits and its application to the Old Red Sandstone of Britain. J. Geol. Soc. Lond. 153,907–913.
Zachos, J.C., Wara, M.W., Bohaty, S., Delaney, M.L., Petrizzo, M.R., Brill, A., Bralower, T.J.,Premoli-Silva, I., 2003. A transient rise in tropical sea surface temperature duringthe Paleocene–Eocene Thermal Maximum. Science 302, 1551–1554.