29
SVEUČILIŠTE U SPLITU POMORSKI FAKULTET U SPLITU ILGIN OZGUL SEA LEVEL VARIATIONS AND THEIR INTERACTIONS BETWEEN THE BLACK SEA AND THE AEGEAN SEA SEMINAR WORK SPLIT, December 2020.

SVEUČILIŠTE U SPLITU
POMORSKI FAKULTET U SPLITU
ILGIN OZGUL
SEA LEVEL VARIATIONS AND THEIR
INTERACTIONS BETWEEN THE BLACK
SEA AND THE AEGEAN SEA
SEMINAR WORK
SPLIT, December 2020.
SVEUČILIŠTE U SPLITU
POMORSKI FAKULTET U SPLITU
STUDIJ: MARITIME METEOROLOGY AND OCEANOLOGY
SEA LEVEL VARIATIONS AND THEIR
INTERACTIONS BETWEEN THE BLACK
SEA AND THE AEGEAN SEA
SEMINAR WORK
MENTOR: STUDENT:
Assist. Prof. Nenad Leder, PhD Ilgin Ozgul
(MB:017----)
SPLIT, December 2020.

ABSTRACT
In this study, tide gauge measurements and tide gauges around the Black Sea and the Aegean Sea
were investigated and compared with satellite altimeter data. Six original pieces of research
investigated amplitudes of oscillations in the Black Sea and the Aegean Sea. According to
investigated researches, the primary source of water level changes in the Black Sea and the
Aegean Sea has been observed as seasonal. The seasonal water change in the Southwestern Black
Sea was measured as an average of 19 cm. Tidal characteristic in the South of the Black Sea was
determined as semi-diurnal. Tide amplitudes for the Northern Black Sea were measured as 1.3-
3.0 cm and the main tide pattern was observed as semi-diurnal. The seasonal water change in the
Northeast Aegean Sea was measured as 12 cm. The tidal pattern of the North Mediterranean Sea
and South Aegean Sea was determined as mixed, mostly diurnal. The tidal amplitude of the
Aegean Sea was observed to be higher than the Black Sea. The reason for this difference may be
that the Aegean Sea is the continuation of the Mediterranean and the water bodies it relates to are
larger.
Keywords: sea level, Black Sea, Aegean Sea, Turkish straits

CONTENT
1. INTRODUCTION ................................................................................................................. 1
2. TIDE GAUGE MEASUREMENTS ...................................................................................... 4
3. SEA LEVEL CHANGE MAIN CAUSES ............................................................................. 7
4. AMPLITUDES OF SEA LEVEL OSCILLATIONS IN THE BLACK SEA AND THE
AEGEAN SEA ......................................................................................................................... 11
5. CONCLUSIONS .................................................................................................................. 20
LITERATURE ........................................................................................................................ 22
LIST OF FIGURES ................................................................................................................. 24
LIST OF TABLES ................................................................................................................... 24
[1]
1. INTRODUCTION
The Black Sea is a body of water located
between the Eastern end of Europe and the
Western end of Asia. The Black Sea, the
world's largest inland sea with 547,000 m3 of
water after the Caspian Sea, is fed by 17
rivers and more streams, including the
Danube River from Central Europe, the
Dnieper River from Eastern Europe, and the
Don River (Wikipedia, 2020) Bulgaria,
Romania, Russia, Turkey, and Ukraine
located on borders with the Black Sea, an
average of 300,000 m3 of water annually is
discharged to the Aegean Sea over Bosporus
and Dardanelles. A geographical map of the
Black Sea and nearby cities are given in
Figure 1. Bosporus is the natural way that
connects the Sea of Marmara and the Black
Sea. The Aegean Sea forms the northern tip
of the Mediterranean Sea, located between
the Balkan peninsula and the Anatolian
peninsula, with a sea area of 214,000 m2
(Wikipedia, 2020). The Marmara Sea and
the Aegean Sea are connected by the
Dardanelles natural waterway. Bosporus
forms the Turkish Straits System with
Dardanelles and Sea of Marmara. The water
exchange between the Black Sea and the
Aegean Sea takes place in a versatile way
through these two natural waterways. The
Bosporus, which has a length of 29.9 km,
constitutes the most complex structure of the
Turkish Straits System. Because of the
terrestrial structure, which expands from
place to place (3.6 km maximum width) and
shrinks (698 m minimum width), its depth
(120 m maximum) although it is 60 m on
average, different current characteristics are
encountered. Since the Black Sea is 40 cm
higher than Marmara, there is a surface
current varying in intensity from the Black
Sea to the Marmara at 3-7 knots (Wikipedia,
2020). A geographical map of the Aegean
Sea Region is given in Figure 2. However,
the salinity rate of the Sea of Marmara -
although it varies- is about 2 times the Black
Sea. (Average salinity of the Black Sea is
1.8%; average salinity of the Marmara is
2.95%) The specific gravity formed because
the difference in salinity is higher in the Sea
of Marmara. From the Marmara Sea, which
is heavier in terms of specific gravity, to the
Black Sea; there is a deep current of the
Bosporus that progresses from a depth of 15-
45 m from the surface. Orkoz currents
unique to the Bosporus are formed by the
effect of projecting terrestrial structure in the
Bosporus and strong Southern winds such as
southwestern winds (Alpar & Yüce, 1998).
Orkoz can reach speeds of 6-7 knots from
time to time. A geographical map of the Sea
of Marmara, Bosporus Strait, and
Dardanelles Strait is given in Figure 3.
Studies above sea level have a very rich
story. Even prehistoric societies tried to
associate regular changes in sea level with
the movements of the Moon and the Sun.
There are more than 37 distinct factors
affecting tides today (Trujillo & Thurman,
2015). However, it is known that the Sun
and the Moon, two of them, are the primary
factors in tidal forces. Today, sea level
research is vital for fishing technologies,
ponding, navigation safety, and the
construction of coastal structures. Sea level
measurements have been carried out by
mareograph (or known as tide gauge,
marigraph, sea-level recorder, limnimeter)
stations that have been established on
seacoasts and islands for a hundred years.
The first mareograph systems comprised
scaled pieces of rock or wall.

[2]
Figure 1. Geographical map of the Black Sea and nearby cities (Britannica, 2021).
In many European ports, low and high-water
levels were collected in this way. The first
quantitative observation of ocean tides was
started by Laplace in 1775 and continued by
Kelvin in 1868. The first mechanical
mareograph systems that detect high-
frequency variations in still water with float
mechanism and clock graphing recorder
emerged in the 1830s. In the last century,
with the advancement of technology,
acoustic, pressurized, and RADAR-type tide
gauges were established. These gauges were
generally created by revising old stations.
Local sea research in Turkey was realized
with the float mareograph systems until
1998. In the past 22 years, these systems
were
replaced by pressure, acoustic, and RADAR
systems (Turkey General Directorate of
Mapping, 2020). Usually, mareograph
stations use multiple gauges to minimize the
margin of error associated with the gauge. In
the last 50 years, height differences can be
determined by measuring from space with
satellite-assisted methods. To increase
accuracy in research; The measurements
obtained from GPS satellites that measure
the movement of observation satellites, tide
gauges, and tide gauges relative to the earth
are evaluated. The goal of this seminar work
is to examine the sea-level changes in the
Black Sea and the Aegean Sea by explaining
the reasons for sea-level change and the
measurement of sea-level change and to
reveal the amplitudes of these changes.
[3]
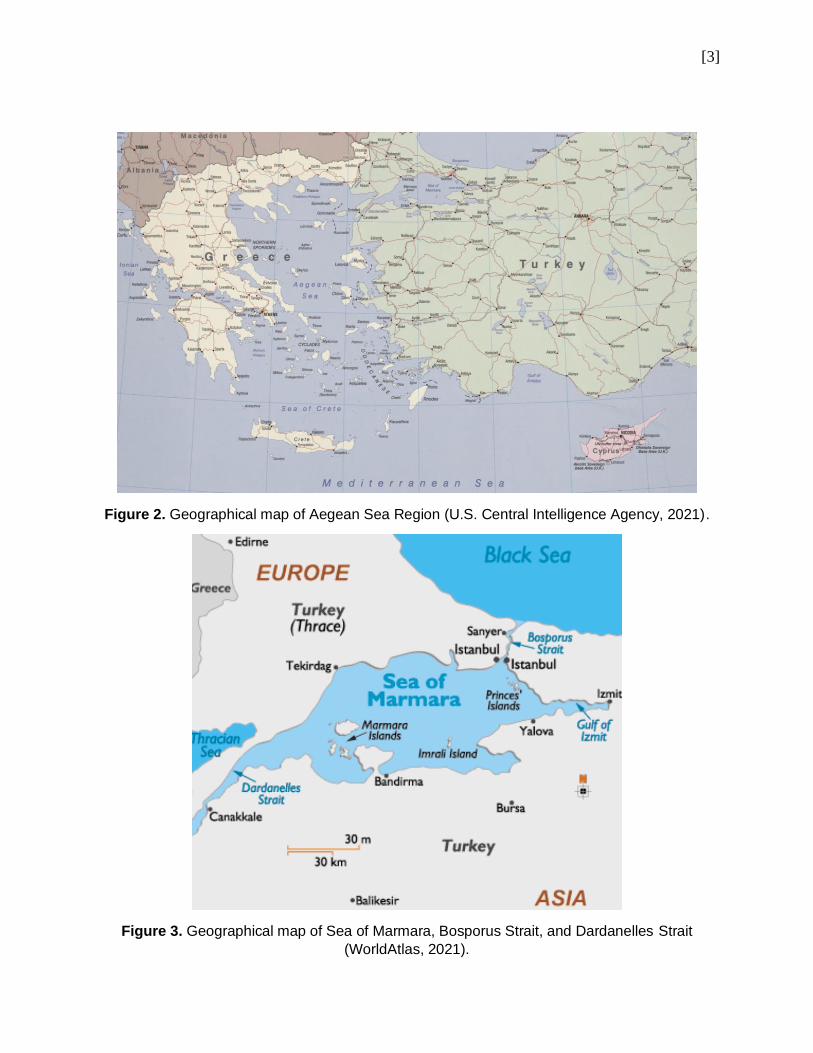
Figure 2. Geographical map of Aegean Sea Region (U.S. Central Intelligence Agency, 2021).
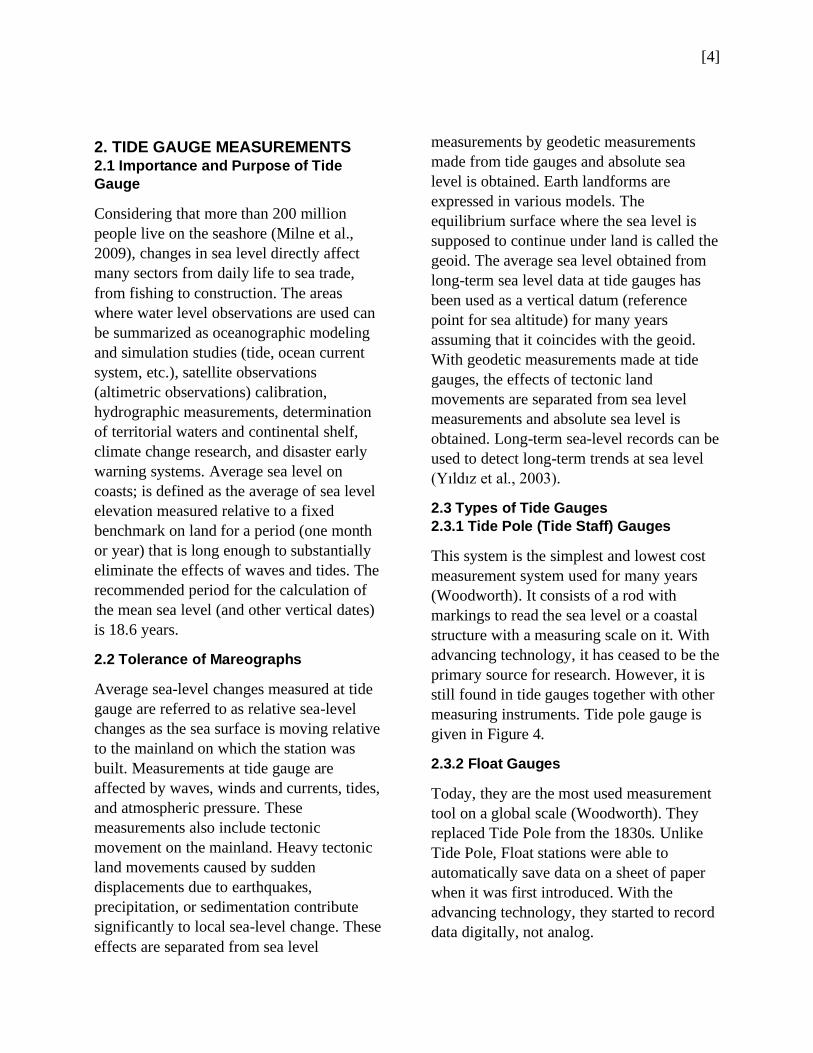
Figure 3. Geographical map of Sea of Marmara, Bosporus Strait, and Dardanelles Strait
(WorldAtlas, 2021).
[4]
2. TIDE GAUGE MEASUREMENTS 2.1 Importance and Purpose of Tide
Gauge
Considering that more than 200 million
people live on the seashore (Milne et al.,
2009), changes in sea level directly affect
many sectors from daily life to sea trade,
from fishing to construction. The areas
where water level observations are used can
be summarized as oceanographic modeling
and simulation studies (tide, ocean current
system, etc.), satellite observations
(altimetric observations) calibration,
hydrographic measurements, determination
of territorial waters and continental shelf,
climate change research, and disaster early
warning systems. Average sea level on
coasts; is defined as the average of sea level
elevation measured relative to a fixed
benchmark on land for a period (one month
or year) that is long enough to substantially
eliminate the effects of waves and tides. The
recommended period for the calculation of
the mean sea level (and other vertical dates)
is 18.6 years.
2.2 Tolerance of Mareographs
Average sea-level changes measured at tide
gauge are referred to as relative sea-level
changes as the sea surface is moving relative
to the mainland on which the station was
built. Measurements at tide gauge are
affected by waves, winds and currents, tides,
and atmospheric pressure. These
measurements also include tectonic
movement on the mainland. Heavy tectonic
land movements caused by sudden
displacements due to earthquakes,
precipitation, or sedimentation contribute
significantly to local sea-level change. These
effects are separated from sea level
measurements by geodetic measurements
made from tide gauges and absolute sea
level is obtained. Earth landforms are
expressed in various models. The
equilibrium surface where the sea level is
supposed to continue under land is called the
geoid. The average sea level obtained from
long-term sea level data at tide gauges has
been used as a vertical datum (reference
point for sea altitude) for many years
assuming that it coincides with the geoid.
With geodetic measurements made at tide
gauges, the effects of tectonic land
movements are separated from sea level
measurements and absolute sea level is
obtained. Long-term sea-level records can be
used to detect long-term trends at sea level
(Yıldız et al., 2003).
2.3 Types of Tide Gauges
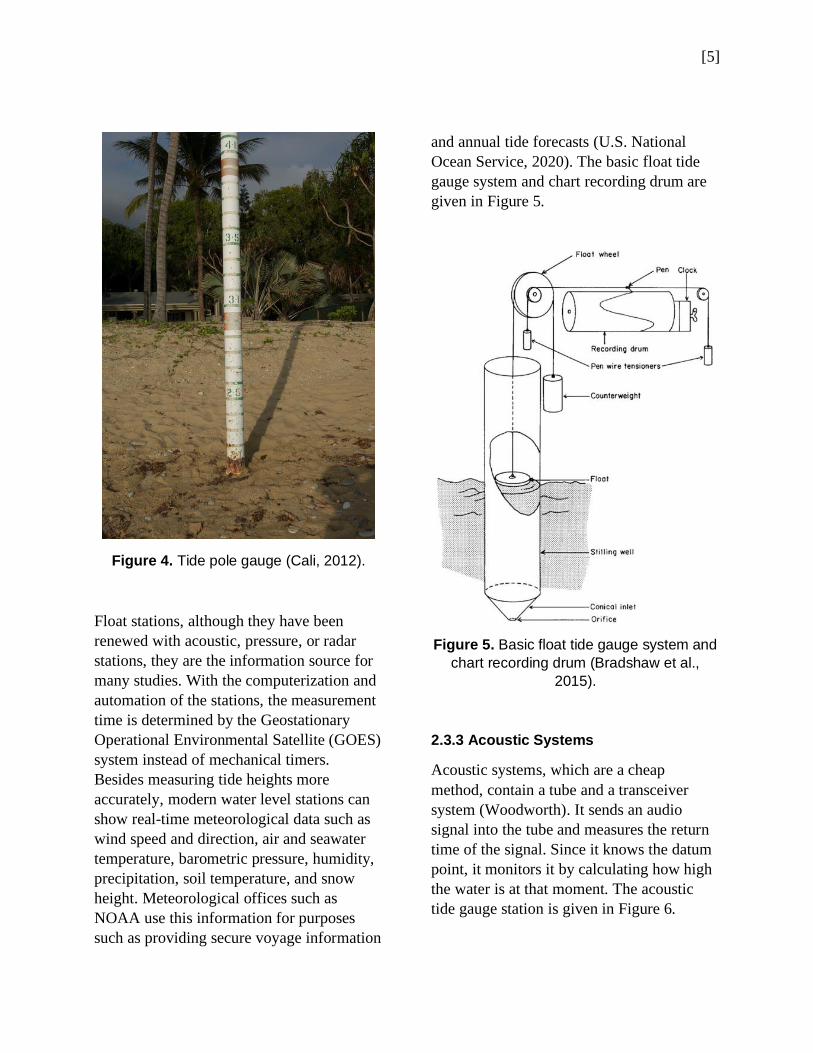
2.3.1 Tide Pole (Tide Staff) Gauges
This system is the simplest and lowest cost
measurement system used for many years
(Woodworth). It consists of a rod with
markings to read the sea level or a coastal
structure with a measuring scale on it. With
advancing technology, it has ceased to be the
primary source for research. However, it is
still found in tide gauges together with other
measuring instruments. Tide pole gauge is
given in Figure 4.
2.3.2 Float Gauges
Today, they are the most used measurement
tool on a global scale (Woodworth). They
replaced Tide Pole from the 1830s. Unlike
Tide Pole, Float stations were able to
automatically save data on a sheet of paper
when it was first introduced. With the
advancing technology, they started to record
data digitally, not analog.
[5]
Figure 4. Tide pole gauge (Cali, 2012).
Float stations, although they have been
renewed with acoustic, pressure, or radar
stations, they are the information source for
many studies. With the computerization and
automation of the stations, the measurement
time is determined by the Geostationary
Operational Environmental Satellite (GOES)
system instead of mechanical timers.
Besides measuring tide heights more
accurately, modern water level stations can
show real-time meteorological data such as
wind speed and direction, air and seawater
temperature, barometric pressure, humidity,
precipitation, soil temperature, and snow
height. Meteorological offices such as
NOAA use this information for purposes
such as providing secure voyage information
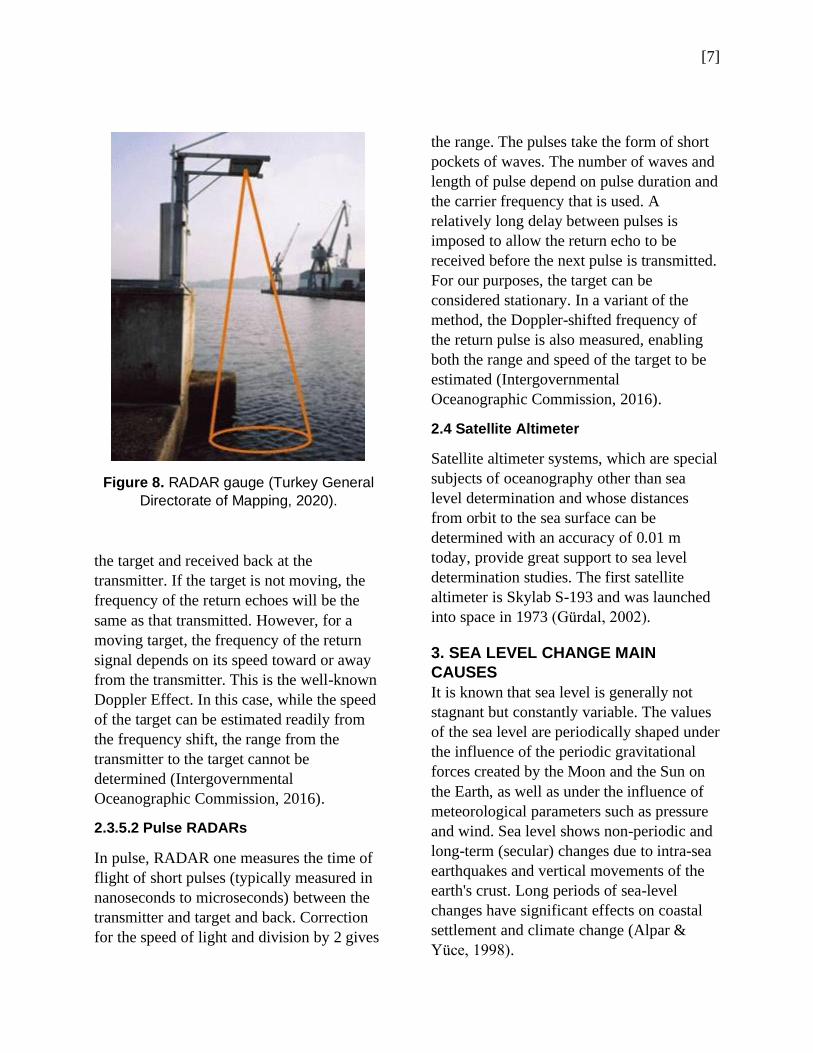
and annual tide forecasts (U.S. National
Ocean Service, 2020). The basic float tide
gauge system and chart recording drum are
given in Figure 5.
Figure 5. Basic float tide gauge system and
chart recording drum (Bradshaw et al.,
2015).
2.3.3 Acoustic Systems
Acoustic systems, which are a cheap
method, contain a tube and a transceiver
system (Woodworth). It sends an audio
signal into the tube and measures the return
time of the signal. Since it knows the datum
point, it monitors it by calculating how high
the water is at that moment. The acoustic
tide gauge station is given in Figure 6.

[6]
Figure 6. Acoustic tide gauge station
(Zacharia et al., 2017).
2.3.4 Pressure Gauges
Pressure measurement stations are usually
measured with a sensitive pressure gauge
placed on the seabed. As the seawater mass
on the sensor increases, it automatically
calculates how many centimeters the water
level rises, based on the density information
of the water and the instantaneous
atmospheric pressure. It must be positioned
so that it does not remain above the water
surface even during low tide (REFMAR,
2012). The pressure tide gauge is given in
Figure 7.
Figure 7. A pressure tide gauge (REFMAR,
2012).
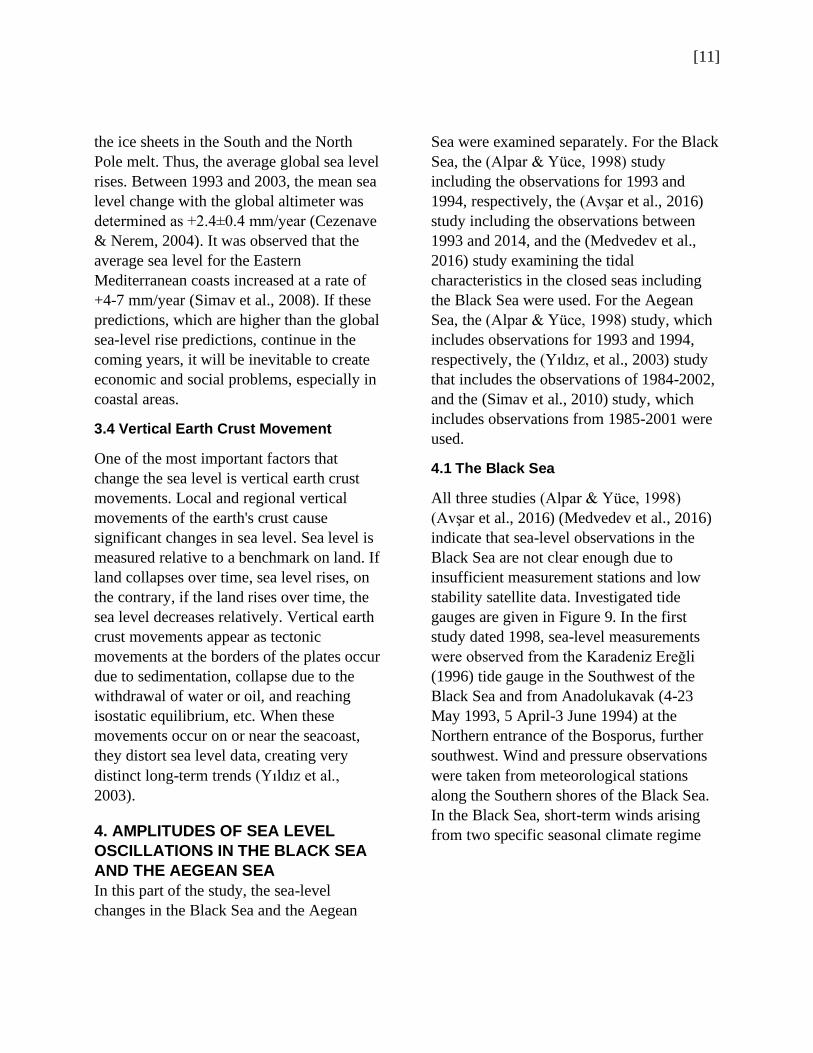
2.3.5 RADAR Gauges
RADAR (Radio Detection and Ranging)
systems are preferred because of speed
setup, instant data monitoring, and the
prevalence of RADAR technology in many
industries. These expensive but easily
procured, fast, and reliable measurement
systems have been installed on the Black Sea
and Mediterranean coasts in recent years
(Turkey General Directorate of Mapping,
2020). There are two types of RADARs:
Frequency Modulated - Continuous Wave
(FACT) RADARs and pulse RADARs
(Intergovernmental Oceanographic
Commission, 2016). The RADAR tide gauge
is given in Figure 8.
2.3.5.1 FMCW RADARs
In continuous wave (CW) RADAR, an
electromagnetic beam with a continuous
unmodulated frequency is transmitted
towards a target, with echoes reflected by
[7]
Figure 8. RADAR gauge (Turkey General
Directorate of Mapping, 2020).
the target and received back at the
transmitter. If the target is not moving, the
frequency of the return echoes will be the
same as that transmitted. However, for a
moving target, the frequency of the return
signal depends on its speed toward or away
from the transmitter. This is the well-known
Doppler Effect. In this case, while the speed
of the target can be estimated readily from
the frequency shift, the range from the
transmitter to the target cannot be
determined (Intergovernmental
Oceanographic Commission, 2016).
2.3.5.2 Pulse RADARs
In pulse, RADAR one measures the time of
flight of short pulses (typically measured in
nanoseconds to microseconds) between the
transmitter and target and back. Correction
for the speed of light and division by 2 gives
the range. The pulses take the form of short
pockets of waves. The number of waves and
length of pulse depend on pulse duration and
the carrier frequency that is used. A
relatively long delay between pulses is
imposed to allow the return echo to be
received before the next pulse is transmitted.
For our purposes, the target can be
considered stationary. In a variant of the
method, the Doppler-shifted frequency of
the return pulse is also measured, enabling
both the range and speed of the target to be
estimated (Intergovernmental
Oceanographic Commission, 2016).
2.4 Satellite Altimeter
Satellite altimeter systems, which are special
subjects of oceanography other than sea
level determination and whose distances
from orbit to the sea surface can be
determined with an accuracy of 0.01 m
today, provide great support to sea level
determination studies. The first satellite
altimeter is Skylab S-193 and was launched
into space in 1973 (Gürdal, 2002).
3. SEA LEVEL CHANGE MAIN
CAUSES
It is known that sea level is generally not
stagnant but constantly variable. The values
of the sea level are periodically shaped under
the influence of the periodic gravitational
forces created by the Moon and the Sun on
the Earth, as well as under the influence of
meteorological parameters such as pressure
and wind. Sea level shows non-periodic and
long-term (secular) changes due to intra-sea
earthquakes and vertical movements of the
earth's crust. Long periods of sea-level
changes have significant effects on coastal
settlement and climate change (Alpar &
Yüce, 1998).

[8]
3.1 Tidal Effects
The tides are one of the main causes of the
periodic change in sea level. As the sea level
rises or falls, the sea horizon slowly retracts
towards the sea or rises towards the land.
The tides are essentially very long and
regular shallow-water waves. Due to the
tide, the most variation normally occurs near
the equator and at large ones up to 0.5
meters. However, 2 m in oceans;
Occasionally, sea-level changes of around
10 m can occur on the oceanic coasts. For
example, sea level variation was observed as
12.9 m along the Atlantic Ocean coast of
Canada and up to 15 m in the Bay of Fundy.
There are more than 37 independent factors
in creating tidal patterns, but the Moon and
Sun effects are the most important.
However, there are also affects such as
terrestrial effects and orbital effects (Trujillo
& Thurman, 2015)
3.2 Tide-Generation Force of The Moon
Every atom in the universe exerts a force of
attraction against each other. This is called
Newton's Universal Law of Gravity.
According to gravity, the force of attraction
between two substances is directly
proportional to the mass of the substances in
question and inversely proportional to the
square of their distance. However, it is
known that the tide-generation force is
inversely proportional to the cube of the
distance. Every point on Earth is gravity by
the Moon. As the Moon rotates over the
Earth, the waters in the oceans follow it. Due
to this gravitational effect, a tidal bulge is
formed on the face of the Earth that sees the
Moon. At the same time, there is a
centripetal force created by the rotation of
the Earth around its axis. Oceans in the part
of the Earth that does not see the Moon are
directed towards the opposite direction of
the Moon with the effect of this centripetal
force. To be more specific, the tides are the
two forces acting on the oceans; It arises
from the inequality between centripetal force
and gravitational force. On the face of the
Earth-facing the Moon, the gravitational
force of the Moon overcomes the centripetal
force, creating a tidal bulge. On the face of
the Earth that does not see the Moon, the
centripetal force overcomes the gravitational
force applied by the Moon, creating another
tidal bulge. The elevations created by the
moon are also known as lunar bulges. The
monthly tidal cycle is 29.5 days as the Moon
completes a full orbit around the Earth in
29.5 days. In this cycle, when the Moon is
aligned between the Sun and the Earth, the
lunar bulges and the solar bulges align, and
the wave amplitudes converge. In this case,
high tides appear higher and are called
Spring Tides. When the moon is in the
position of the first quarter or the last
quarter, lower high tides appear and are
called the neap tide. Springtide is strong as
solar bulges and lunar bulges are a sum, but
the neap tide is weak. At the time of spring
tide, the tidal range (distance between high
and low tides) is large because there is
constructive interference between lunar
bulges and solar bulges during this time.
Neap tide instant tidal range is small because
there is destructive interference between
lunar bulges and solar bulges. The time
between consecutive spring tides (full moon
and new moon) or consecutive neap tides
(first quarter and fourth quarter) corresponds
to a "half" lunar calendar. The time between
spring tide and neap tide corresponds to a
"quarter" lunar calendar, which is about 1

[9]
week. In addition to the monthly calendar,
The Moon completes one complete
revolution in 24 hours and 50 minutes,
which means: It takes 24 hours and 50
minutes for any point on Earth to align with
the same point on the Moon. This is called
lunar day. Therefore, the Moon rises 50
minutes late every day and sets 50 minutes
late. In many parts of the world, high tides
occur every 12 hours and 25 minutes. This is
called the tidal period. If you stand in the
Equator, you will experience high tides
twice a day. The time between high tides is
called the tidal period. If you move from the
equator towards North or South latitudes you
will experience the same period, but the
higher tides will be lower because you are
on the lower part of the bulges (Trujillo &
Thurman, 2015).
3.1.2 Tide-Generation Force of The Sun
The Sun also creates two tidal elevations just
like the Moon on Earth. These elevations are
also called solar bulges. The Sun's mass is
27 times greater than the Moon's mass, but
its tide-generation force is not as great as the
Moon. Because the Sun is 390 times farther
from the Earth than the Moon. The Sun's
tidal-forming force on Earth is 46% of that
of the Moon. As a result, solar bulges are
46% smaller than lunar bulges. Even though
its size is much smaller than the Sun, the
reason the Moon has a more gravitational
effect is that the Moon is about 400 times
closer to the Earth than the Sun (Trujillo &
Thurman, 2015).
3.1.3 Rotation Effect of The Earth
The tides appear to move in the water
towards the land (flood tide) and towards the
sea (ebb tide). Variable high and low tides
are caused by the rotation of the Earth
around its axis in the body of water drawn
by the Sun and Moon. The rise of waters on
the face of the Earth that does not see the
Moon is due to the centripetal force (Trujillo
& Thurman, 2015).
3.1.4 Effects of Continents
Tidal waves that want to travel across the
ocean are blocked by the shores. At this
point, the most important factors that
determine what pattern a tide will follow
along the shore are the coastal structure and
the ocean depth off the shore. When the tides
enter shallow water, they undergo physical
changes such as slowing down or rising.
These changes tend to increase the tidal
range on the shore compared to oceans
where the maximum tidal change is 45 cm.
Theoretically, the Earth should experience 4
different tides a day, 2 high and 2 low. In
practice the situation is different. Different
tidal patterns are observed due to varying
depths and dimensions, especially the effect
of land. These can be diurnal, semi-diurnal,
or mixed patterns (Trujillo & Thurman,
2015).
3.1.4.1 Diurnal Pattern
In the diurnal tide pattern, one high tide and
one low tide occur per lunar day. These tides
are common in shallow inland waters (such
as the Gulf of Mexico and Southeast Asia).
Their periods are 24 hours and 50 minutes
(Trujillo & Thurman).
3.1.4.2 Semi-Diurnal Pattern
In the semi-diurnal tide pattern, two high
and two low tides occur per lunar day. The
height of successive low and high tides is on
average the same. Half-day tides are

[10]
common along the Atlantic coast of the
USA. The period is 12 hours and 25 minutes
(Trujillo & Thurman, 2015).
3.1.4.3 Mixed Pattern
The mixed pattern features both diurnal and
semi-diurnal tide patterns. There is a
considerable height difference between
successive high and/or low tides. Their
periods are usually 12 hours and 25 minutes,
but they can also have a daily period. Mixed
tides are the most common tides in the
world. Occurs in Pacific coasts and North
America (Trujillo & Thurman, 2015).
3.2 Effects of Meteorological Elements
The sea-level change caused by
meteorological effects is not regular but
occurs because of changes in air pressure
and changes in wind direction and strength.
Due to meteorological effects, variations up
to 0.03-0.25 m are observed between the
measured sea-level values and the predicted
sea-level values (Gürdal, 2002).
3.2.1 Effects of Atmospheric Pressure
and Temperature
Increasing atmospheric pressure causes a
decrease in sea level; a decrease causes an
increase in sea level. Theoretically, a change
of 1 mbar in atmospheric pressure causes a
change of about 1 cm in sea level. Changes
in air temperature depend on latitude and
often cause sea surfaces to tilt from the poles
to the equator. As the temperature increases,
the density of the sea decreases and the sea
level rises. When the temperature drops, the
density of the sea increases, and the sea level
decreases. According to tide gauge stations
located on Turkey's the Mediterranean and
the Aegean Sea coasts (Antalya, Bodrum,
Menteş, Erdek), sea level rises by an average
1 cm per 0.679 degrees Celsius (Yıldız, et.
al., 2003).
3.2.2 Wind Direction and Intensity
The drift effect of the wind on the sea
surface is an effect that the atmosphere
exerts on the sea surface, and this force
increases in direct proportion to the square
of the wind speed. With a wind-drift effect,
the seawater starts to move. The amount of
water entrained by the wind; drifts in the
direction of the wind blowing in shallow sea
waters, to the right in the Northern
Hemisphere in deep waters, and to the left in
the Southern Hemisphere (Coriolis effect).
Seawater carried by the wind rises suddenly
when it reaches land and can cause changes
in meter dimensions in extreme conditions.
3.3 Climate Change
Climate change is related to the continuation
of the amount of carbon dioxide in the
atmosphere with the carbon dioxide gas that
is ejected due to industrialization. The earth
absorbs some of the short-wave radiation
emitted by the Sun and re-emits some of the
energy it receives as long-wave radiation
back into the atmosphere. Carbon dioxide
with water vapor in the atmosphere; absorbs
some of these radiations from the earth and
emits some of them back to the earth, this is
called the "greenhouse effect". During the
circulation of energy between the
atmosphere and the earth, the atmosphere
and the earth get warmer. The continuous
increase in the amount of carbon dioxide in
the atmosphere causes an increase in the
annual average temperature in the
atmosphere and therefore climate change. As
the annual average temperature increases,
[11]
the ice sheets in the South and the North
Pole melt. Thus, the average global sea level
rises. Between 1993 and 2003, the mean sea
level change with the global altimeter was
determined as +2.4±0.4 mm/year (Cezenave
& Nerem, 2004). It was observed that the
average sea level for the Eastern
Mediterranean coasts increased at a rate of
+4-7 mm/year (Simav et al., 2008). If these
predictions, which are higher than the global
sea-level rise predictions, continue in the
coming years, it will be inevitable to create
economic and social problems, especially in
coastal areas.
3.4 Vertical Earth Crust Movement
One of the most important factors that
change the sea level is vertical earth crust
movements. Local and regional vertical
movements of the earth's crust cause
significant changes in sea level. Sea level is
measured relative to a benchmark on land. If
land collapses over time, sea level rises, on
the contrary, if the land rises over time, the
sea level decreases relatively. Vertical earth
crust movements appear as tectonic
movements at the borders of the plates occur
due to sedimentation, collapse due to the
withdrawal of water or oil, and reaching
isostatic equilibrium, etc. When these
movements occur on or near the seacoast,
they distort sea level data, creating very
distinct long-term trends (Yıldız et al.,
2003).
4. AMPLITUDES OF SEA LEVEL
OSCILLATIONS IN THE BLACK SEA
AND THE AEGEAN SEA
In this part of the study, the sea-level
changes in the Black Sea and the Aegean
Sea were examined separately. For the Black
Sea, the (Alpar & Yüce, 1998) study
including the observations for 1993 and
1994, respectively, the (Avşar et al., 2016)
study including the observations between
1993 and 2014, and the (Medvedev et al.,
2016) study examining the tidal
characteristics in the closed seas including
the Black Sea were used. For the Aegean
Sea, the (Alpar & Yüce, 1998) study, which
includes observations for 1993 and 1994,
respectively, the (Yıldız, et al., 2003) study
that includes the observations of 1984-2002,
and the (Simav et al., 2010) study, which
includes observations from 1985-2001 were
used.
4.1 The Black Sea
All three studies (Alpar & Yüce, 1998)
(Avşar et al., 2016) (Medvedev et al., 2016)
indicate that sea-level observations in the
Black Sea are not clear enough due to
insufficient measurement stations and low
stability satellite data. Investigated tide
gauges are given in Figure 9. In the first
study dated 1998, sea-level measurements
were observed from the Karadeniz Ereğli
(1996) tide gauge in the Southwest of the
Black Sea and from Anadolukavak (4-23
May 1993, 5 April-3 June 1994) at the
Northern entrance of the Bosporus, further
southwest. Wind and pressure observations
were taken from meteorological stations
along the Southern shores of the Black Sea.
In the Black Sea, short-term winds arising
from two specific seasonal climate regime

[12]
Figure 9. Investigated tide gauges in the Black Sea.
are effective. During the winter, the weather
is almost completely dominated by cyclonic
systems. During the summer, the Southwest
Black Sea is dominated by the Northeastern
winds. While there is no Northeastern wind,
there are usually the Southwestern winds.
The winds towards the land generally
increase the sea level. Therefore, Northeast
winds are expected to increase the water
level on the Southern coasts of the Black
Sea. Wind-induced water level changes can
be observed as 10-20 cm in places. Sea level
changes up to 20 cm have been observed at
the northern entrance of the Bosporus with
the strong northern winds. However, besides
the prevailing winds, the local weather
conditions where the measurement station is
located have an undeniable contribution to
the water level. Tidal effects are minor along
the Marmara and Aegean Sea, including the
Southern coasts of the Black Sea. The tides
in this area are hidden by wind, sea breeze,
and strong current from the Black Sea to the
Aegean Sea. A semi-diurnal tidal pattern
originating from the Black Sea was observed
at the northern entrance of the Bosporus.
Semi-diurnal tides of the Black Sea lose
their effect along the Bosporus and are
observed at the southern end of the Bosporus
with a tidal range (amplitude) of 2.5 cm.
Seasonal changes are of great importance
along the Southern shores of the Black Sea.
At Anadolukavak station, a maximum
change of 34 cm was detected in the
measurements made over a 2-year period.
Seasonal high water at the Northern entrance
of the Bosporus is experienced in May-June,
seasonal low water is experienced in
October-November. The difference between
the two seasons in terms of mean sea level
was observed to be 19 cm. Southwest Black
Sea is under the influence of low tide
amplitude. When the percent energy
distribution is analyzed according to
different frequency bands obtained from
Karadeniz Ereğli and Anadolukavak
stations, the biggest share of the distribution
points to the low frequency [Table 1].
Detailed tide data measured from Karadeniz
Ereğli and Anadolukavak stations are given
in Table 2. In the South of the Black Sea,
there are regular sea-level changes caused by
meteorological effects throughout the year.
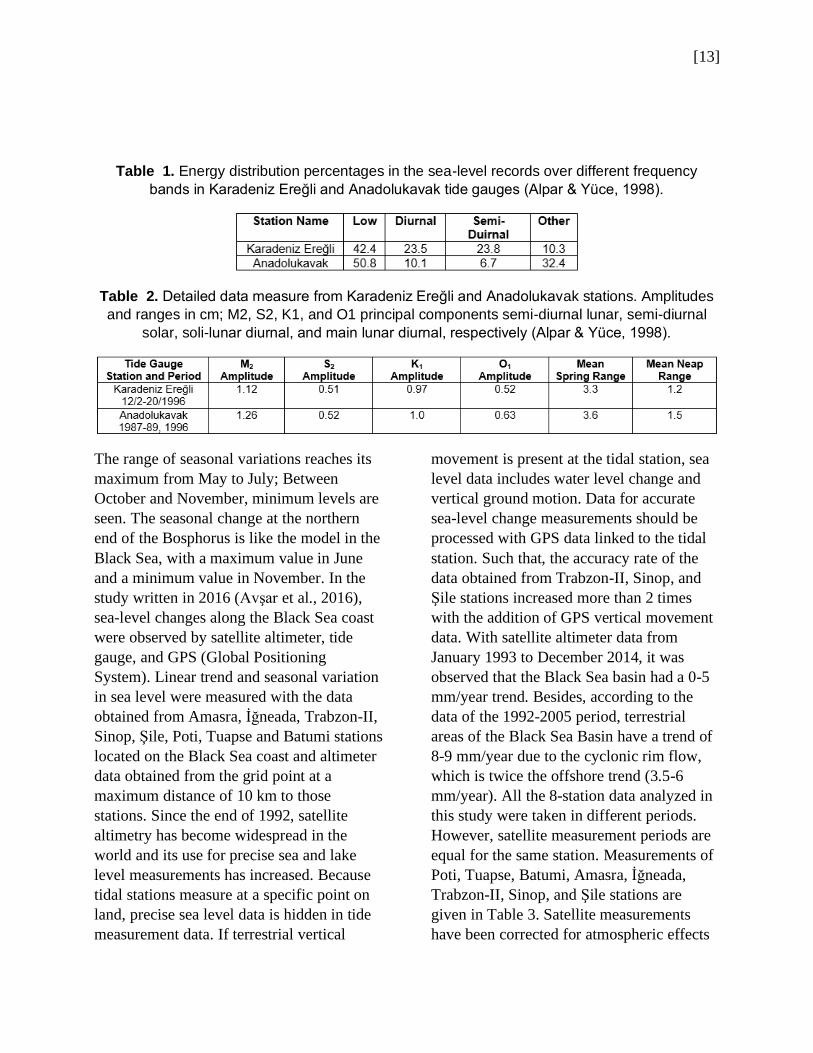
[13]
Table 1. Energy distribution percentages in the sea-level records over different frequency
bands in Karadeniz Ereğli and Anadolukavak tide gauges (Alpar & Yüce, 1998).
Table 2. Detailed data measure from Karadeniz Ereğli and Anadolukavak stations. Amplitudes
and ranges in cm; M2, S2, K1, and O1 principal components semi-diurnal lunar, semi-diurnal
solar, soli-lunar diurnal, and main lunar diurnal, respectively (Alpar & Yüce, 1998).
The range of seasonal variations reaches its
maximum from May to July; Between
October and November, minimum levels are
seen. The seasonal change at the northern
end of the Bosphorus is like the model in the
Black Sea, with a maximum value in June
and a minimum value in November. In the
study written in 2016 (Avşar et al., 2016),
sea-level changes along the Black Sea coast
were observed by satellite altimeter, tide
gauge, and GPS (Global Positioning
System). Linear trend and seasonal variation
in sea level were measured with the data
obtained from Amasra, İğneada, Trabzon-II,
Sinop, Şile, Poti, Tuapse and Batumi stations
located on the Black Sea coast and altimeter
data obtained from the grid point at a
maximum distance of 10 km to those
stations. Since the end of 1992, satellite
altimetry has become widespread in the
world and its use for precise sea and lake
level measurements has increased. Because
tidal stations measure at a specific point on
land, precise sea level data is hidden in tide
measurement data. If terrestrial vertical
movement is present at the tidal station, sea
level data includes water level change and
vertical ground motion. Data for accurate
sea-level change measurements should be
processed with GPS data linked to the tidal
station. Such that, the accuracy rate of the
data obtained from Trabzon-II, Sinop, and
Şile stations increased more than 2 times
with the addition of GPS vertical movement
data. With satellite altimeter data from
January 1993 to December 2014, it was
observed that the Black Sea basin had a 0-5
mm/year trend. Besides, according to the
data of the 1992-2005 period, terrestrial
areas of the Black Sea Basin have a trend of
8-9 mm/year due to the cyclonic rim flow,
which is twice the offshore trend (3.5-6
mm/year). All the 8-station data analyzed in
this study were taken in different periods.
However, satellite measurement periods are
equal for the same station. Measurements of
Poti, Tuapse, Batumi, Amasra, İğneada,
Trabzon-II, Sinop, and Şile stations are
given in Table 3. Satellite measurements
have been corrected for atmospheric effects

[14]
(ionospheric delay and dry/wet tropospheric
effects) and geophysical effects (solid ocean,
and pole tides, loading effect of the ocean
tides, sea state bias, and the inverted
barometer response of the ocean). Moreover,
3 of the tide gauge stations (Trabzon-II,
Sinop, and Şile) have been corrected by GPS
data. These GPS stations are used from
January 1st, 2010 to December 31st of 2014
(TRBN, SINP, and SLEE). This study does
not include measurements of the North of
the Black Sea. Since the Glacial Isostatic
Adjustment (GIA) effect is minimal in the
Black Sea region, it is negligible in this
study. Long-term observation results such as
Poti and Tuapse in Table 3 are in line with
the general results. However, there is
inconsistency with altimeter data at some
stations such as Amasra. The reason for this
may be the short period or data loss. It has
also been stated that changing sea levels in
periods of less than 50-60 years may lead to
uncertainties. However, short-term coastal
sea-level changes differ much more than
global sea-level changes. Moreover,
seasonal variation also affects sea level
variation. Seasonal components of the sea-
level change along the Black Sea coast are
given in Table 4. It is known that the
satellite altimeter can lose its accuracy as it
approaches land. Furthermore, although the
GIA vertical displacement along the Black
Sea coast is minimal, the uncertainty of the
GIA model is still an error source of the
trend estimations from the GPS and tide
gauges. Tides are the main cause of sea-level
changes in the world's oceans, according to
(Medvedev et al., 2016) study that examined
tides in closed seas, including the Black Sea.
However, oceanic tides show little or no
penetration in closed basins such as the
Baltic Sea, Black Sea, Caspian Sea. Semi-
diurnal tides in harmony with the local
resonance were observed in the northwest of
the Black Sea. In 100 years of observations,
the maximum tide height in the Black Sea
has been recorded as 18 cm. The Black Sea
has a limited water exchange through the
Mediterranean and Turkish Straits. Tidal
amplitudes in the Black Sea have been
investigated for 100 years, but there is still
no clear data. Tidal observations in the
Black Sea are generally less than 1 year. It is
based on short series and has limited
accuracy because the tidal signal coincides
with the background noise. In this study,
data from 23 stations located in the borders
of Russia, Ukraine, and Georgia were used.
Semi-diurnal tides prevail in the main part of
the Black Sea. In the northwest, semi-diurnal
tide amplitudes are 2.8-3 cm, and diurnal
tidal amplitudes are 1.3-1.7 cm. Diurnal
tides up to 4 cm have been observed from
time to time. The 18 cm maximum tide was
also observed in the Northwest. The
radiational tides associated with solar
radiational forcing on the sea surface were
found to play an important role in the
general tidal regime in this sea. Maximum
tidal heights and the energy factor in the
Black sea are shown in Figure 10.

[15]
Table 3. Long-term observation results of the sea-level change along the Black Sea coast
(Avşar et al., 2016).
Table 4. Seasonal components of the sea-level change along the Black Sea coast (Avşar et al.,
2016).

[16]
Figure 10. Maximum tidal heights and the energy factor in the Black Sea. Blue colors indicate
diurnal; red colors indicate a semi-diurnal tidal pattern. The biggest circle represents 20 cm of
tidal height, the smallest circle represents 5 cm of tidal high. It is proportional (Medvedev et al.,
2016).
4.2 The Aegean Sea
In the first study dated 1998 (Alpar & Yüce,
1998), Gökçeada and Nara stations for the
Aegean Sea were observed between 4-23
May 1993 and 5 April-3 July 1994. Also,
historical information about Gelibolu (1966-
71) and Bozcaada (1988-92) stations was
used. For pressure corrections, data collected
between April 5th and July 3rd from
Göztepe station. Investigated tide gauges are
given in Figure 11 and Figure 12. According
to the results of this study, similar to the
Black Sea, the eastern shores of the Aegean
Sea and the southern entrance to the
Dardanelles are under the influence of low
amplitude tidal waves. The observed
characteristic is mostly diurnal, but the
minor, semi-diurnal character is also
observed. Long-period observations are
dominated by barometric pressure. Higher
half-diurnal tidal amplitudes were observed
at Nara and Gökçeada stations compared to
Bozcaada and Gelibolu stations. Energy
distribution percentages observed from four
stations are given in Table 5. In the
Dardanelles and the Northeast Aegean Sea,
the tides are semi-diurnal. Amplitude data
obtained from Gelibolu, Nara, Gökçeada,
and Bozcaada stations are given in Table 6.
Therefore, along the Strait of Canakkale
towards the Aegean Sea, the mean ranges at
spring tide increase rapidly. The seasonal
sea-level patterns for the North-Eastern
Aegean have maxima in late summer-early
spring and minima in winter. These seasonal
changes are significant throughout the
Aegean Sea. For the Northeast Aegean,
seasonal high water was observed in October
and seasonal low water was observed in
January.

[17]
Figure 11. Investigated tide gauges in the Aegean Sea, Mediterranean Sea, and the Sea of
Marmara.
Figure 12. Investigated tide gauges near Dardanelles and in the Sea of Marmara.

[18]
The difference between the two seasons is
12 cm. The changes are important
throughout the Aegean Sea. The tidal
stations and their periods used in the second
study dated 2003 (Yıldız et al., 2003), are as
follows: Antalya-II, Bodrum-II, and Menteş,
1985-2002; Erdek, 1984-2002. Periods of
selected tidal components are more than 1
month and less than 18 years. As a result of
the analyzes, the average sea level variation
was determined to be 8.7±0.8 mm/year in
Antalya-II, 3.3±1.1 mm/year in Bodrum-II,
6.8±0.9 mm/year in Menteş, and 9.6±0.9
mm/year in Erdek. The mentioned analysis
results are shown in Table 7. Average sea-
level changes calculated at tide gauges are
higher than global sea-level changes of 1-2
mm/year. This situation reveals that the
average sea level at the tide gauges increased
significantly compared to the land where the
stations are located. Tidal amplitudes and
tidal types of each station were calculated
with the same measurement data. Tidal
amplitudes are given in Table 8. The tide
patterns of Antalya-II, Bodrum-II, Menteş
stations are mixed, mostly semi-diurnal. The
tidal type of Erdek station is mixed, mostly
diurnal. In the repeated GPS measurements
carried out in 2002, it was determined that
Antalya and Erdek mareograph benchmarks
collapsed at -5.3±1.8 mm/year and -8.4±3.0
mm/year, respectively. It is considered that
the relative sea-level changes at Antalya-II
and Erdek stations are caused by the local or
regional collapse of the land where the tide
gauges are located. The relative change of
mean sea level (3.3±1.1 mm/year) at
Bodrum-II station is very close to global sea-
level rise estimates. It is consistent with the
absence of significant vertical movement in
repeated GPS measurements. It was
determined that the mean sea level of the
Menteş tide gauges rose at a speed of
6.9±0.9 mm/year, but no significant vertical
movement could be determined with
repeated GPS measurements.
Table 5. Energy distribution percentages in the sea-level records over different frequency
bands in Gelibolu, Nara, Gökçeada, and Bozcaada tide gauges (Alpar & Yüce, 1998).

[19]
Table 6. Amplitudes and ranges in cm; M2, S2, K1 and O1 principal components semi-diurnal
lunar, semi-diurnal solar, soli-lunar diurnal, and main lunar diurnal, respectively (Alpar & Yüce,
1998).
Table 7. Monthly and annual average sea level change trends of four tide gauges (Yıldız et al.,
2003).
Table 8. The tidal amplitudes of the four geography stations over the respective periods. K1,
solar diurnal; O1, lunar diurnal; M2, lunar semi-diurnal, S2, solar semi-diurnal (Yıldız et al.,
2003).
[20]
In this study, meteorological and
oceanographic parameters are not included
in the analysis model, and if these
parameters have a long-term trend, they will
affect the accuracy and magnitude of the
change in mean sea level. Although it is
caused by local or regional vertical crustal
movements at Antalya-II and Erdek
geography stations at all four geography
stations, a local (relative) 3-10 mm/year sea
level rise trend was found. In another study
conducted in the Aegean Sea in 2010, trends
and interannual variability based on 1985-
2001 sea level measurements at two tide
gauge stations on the Aegean and Eastern
Mediterranean coasts of Turkey have been
analyzed to determine the possible forcing
mechanisms: in particular, the levels of
contributions by atmospheric, steric and land
motion. During the period 1985-2001 the sea
level trends in Antalya and Menteş are found
to be 7.9±0.8 mm/year and 5.5±1.0
mm/year, respectively. The atmospheric
contribution only accounts for 0.6-0.9
mm/year of a trend, while the steric
contribution is greater, accounting for
2.5±0.4 mm/year and 6.4±0.7 mm/year
respectively in Antalya and Menteş. Almost
half of the interannual sea level variance is
due to the combined atmospheric and steric
effects. Significant local land subsidence is
detected in Antalya with a rate of -3.2±0.5
mm/year based on EGPS data, and a trend of
smaller magnitude -1.3±0.5 mm/year is
recorded in Menteş. After removing the GPS
estimated VLM rates, and the steric and
atmospheric sea-level trends, there remain
unexplained trends of 1.3 mm/year and -4.5
mm/year respectively in Antalya and
Menteş. Two distinct periods, 1985-1993
and 1993-2001, apparent in the sea level
time series of both tide gauges are studied to
better understand the largely different
residual trends at these two stations. In the
1985-1993 period, the observed sea level in
Menteş decreases at a rate of -14 mm/year,
about 3.5 times faster than Antalya. The
same downward trend is also found at the
Khios tide gauge located 50 km away from
Menteş. On the other hand, positive sea level
trends up to 12 mm/year are found in both
tide gauges for the 1993-2001 period mainly
attributed to steric effect accounting for 80%
of the sea-level trends. The results indicate
that the primary source of the discrepancy
between the residual sea level trends of
Antalya and Menteş over the 1985-2001
period is the highly negative trend observed
at Menteş during the 1985-1993 period, the
source of which could not be resolved with
the available data sets.
5. CONCLUSIONS
The primary source of sea-level changes in
the Black Sea and the Aegean Sea has been
observed as seasonal (annual and semi-
annual) changes. According to the (Alpar &
Yüce, 1998) study examined for the Black
Sea, the seasonal (semi-annual) water
change in the Southwestern Black Sea was
measured as an average of 19 cm, this value
was measured at the stations on the shores of
the South Black Sea, mainly Şile
(22.84±12.66) and İğneada (22.54±10.88)
(except Trabzon-II station). Again, in the
(Alpar & Yüce, 1998) study, the tidal
characteristic in the South of the Black Sea
was determined as semi-diurnal and the tidal
range originating from the Black Sea in the
Bosporus was measured as 2.5 cm. In the
study of closed seas tides (Medmedev et al.,
2016), tide amplitudes for the Northern
Black Sea were measured as 1.3-3.0 cm and
[21]
the main semi-diurnal tide pattern was
observed. It has been noticed that the tidal
pattern changes diurnally as one moves
towards the Eastern Black Sea. However, the
common point emphasized by all 3 studies
examined is that the tidal effect in the Black
Sea is small. According to the study dated
2016 (Medvedev et al., 2016), a tidal effect
of a maximum of 18 cm has been observed
in the Black Sea in the last 100 years. It has
been stated that the Black Sea has an
average sea level trend of 8-9 mm/year on
the land and 3.5-6 mm/year in the open, and
it has been realized that this is not valid for
all stations and coasts. Thus, the annual
trend for the Trabzon-II station was given as
1.21±1.76, but for the Sinop station, this
value was recorded as 6.63±2.88. Both
measurements are corrected for vertical
ground motion and are compatible with
satellite altimeter data. In the 1998 study
(Alpar & Yüce, 1998) for the Northeast
Aegean Sea, it was stated that the seasonal
difference was 12 cm, and the low water
time was January, and the high-water time
was October. In the 2003 study (Yıldız et al.,
2003), the annual trend of Antalya-II station
(1985-2002) was 8.7±0.8 and the annual
trend of Menteş station (1985-2002) was
6.8±0.9. In the 2010 study (Simav et al.,
2010), Antalya station (1985-2001) was
measured as 7.9 ± 0.8 mm/year, and Menteş
station (1985-2001) was measured as having
a trend of 5. ±1.0 mm/year. The fact that
both stations yield 1 mm different results in
similar observation periods may be due to
the analysis method and other factors (wind,
pressure, ground motion) included in the
data. In the (Yıldız et al., 2003) study, the
tidal type of the Antalya-II, Bodrum-II and
Menteş stations was mixed, mostly semi-
diurnal; The tide pattern of Erdek station
was found to be mixed, mostly diurnal. The
largest tidal components of these stations are
6.97 cm, 3.96 cm, 5.77 cm, and 1.21 cm,
respectively. According to these results, the
tidal amplitudes in the Aegean Sea are
greater than those in the Black Sea. The
reason for this difference may be that the
Aegean Sea is the continuation of the
Mediterranean and the water bodies it relates
to are larger. On the other hand, the Black
Sea has connections to other seas only
through two narrow waterways, the
Bosporus, and the Dardanelles. The Black
Sea and Aegean tides lose their influence
after passing through these bottlenecks and,
according to some studies, they are not
affected by each other. However, in the
(Alpar & Yüce, 1998) study, very low-
frequency interactions were reported.

[22]
LITERATURE
Alpar, B., & Yüce, H. (1998). Sea-level Variations and their Interactions Between the Black Sea
and the Aegean Sea. Estuarine, Coastal and Shelf Science, 609–619.
Ankara Üniversitesi . (n.d.). Retrieved from
https://acikders.ankara.edu.tr/pluginfile.php/160748/mod_resource/content/0/7.pdf
Avşar, N., Jin, S., Kütoğlu, H., & Gürbüz, G. (2016). Sea level change along the Black Sea coast
from satellite altimetry, tide gauge and GPS observations. Geodesy and Geodynami , 50-
55.
Boğaziçi Üniversitesi KRDAE Jeodezi Anabilim Dalı . (2020, 12 7). Retrieved from
https://jeodezi.boun.edu.tr/sites/jeodezi.boun.edu.tr/files/dosyalar/files/JEODEZI_BUKR
DAE_GED.pdf
Bradshaw, E., Rickards, L., & Aarup, T. (2015). Sea level data archaeology and the Global Sea
Level Observing System(GLOSS). GeoResJ.
Britannica. (2021, 1 8). Black Sea . Retrieved from Encyclopedia Britannica:
https://www.britannica.com/place/Black-Sea
Cali, J. (2012). Observing the eclipse from the beach. Retrieved 1 8, 2021, from Oz Eclipse Solar
and Lunar Eclipse Observing: https://joe-
cali.com/eclipses/PLANNING/TSE2012p/Tides_eclipse_from_the_beach.html
Cezenave, A., & Nerem, R. (2004). Present Day Sea Level Change: Observations and Causes .
Reviews of Geophysics.
Gürdal, M. A. (2002). Deniz Seviyesi Değişimlerine Neden Olan Etkiler. Harita Dergisi .
Intergovernmental Oceanographic Commission. (2016). Radar Gauges. In Manual on Sea Level,
Measurement and Interpretation, Radar Gauges Volume V (pp. 12-14). France.
Medvedev, I., Rabinovich, A., & Kulikov, E. (2016). Tides in Three Enclosed Basins: The Baltic,
Black, and Caspian Sea . Frontiers inMarineScience.
Milne, G., Gehrels, R., Hugses, C., & Tamisiea, M. (2009). Identifying the causes of sea-level
change . Nature Geoscience .
NOAA. (2021, 1 8). What is a tide gauge? Retrieved from National Oceanic and Atmospheric
Administration U.S. Department of Commerce : https://oceanservice.noaa.gov/facts/tide-
gauge.html

[23]
REFMAR. (2012, 12 12). How pressure tide gauges work? Retrieved 1 8, 2021, from SHOM
REFMAR: http://refmar.shom.fr/en/documentation/instrumentation/les-maregraphes-a-
capteur-de-pression;jsessionid=9FB05E5C81EAD59988E0BA2A7B1A9F9A
Simav, M., Yıldız, H., & Arslan, E. (2008). Doğu Akdeniz'de Uydu Altimetre Verileri ile Deniz
Seviyesi Değişimlerinin Araştırılması. Harita Dergisi .
Simav, M., Yıldız, H., Türkezer, A., Lenk, O., & Özsoy, E. (2010). Sea Level Variability at
Antalya and Menteş Tide Gauges in Turkey: Atmospheric, Steric and Land Motion
Contributions .
Trujillo, A. P., & Thurman, H. V. (2015). Tides. In Essentials of Oceanography 11th Edition (pp.
295-311). Pearson.
Turkey General Directorate of Mapping. (2020, 12 5). Turkish National Sea Level Monitoring
System. Retrieved from
https://tudes.harita.gov.tr/Portal/Index/3?lang=us/Sea%20%E2%80%8B%E2%80%8BLe
vel%20Observations
U.S. Central Intelligence Agency. (2021, 1 8). Maps: Library of Congress. Retrieved from
Library of Congress: https://www.loc.gov/item/2006625576/
U.S. National Ocean Service. (2020, 12 5). What is a tide gauge? Retrieved from National Ocean
Service: https://oceanservice.noaa.gov/facts/tide-gauge.html
Wikipedia . (2020, 12 14). Retrieved from Aegean Sea :
https://en.wikipedia.org/wiki/Aegean_Sea
Wikipedia. (2020, 12 14). Retrieved from Black Sea: https://en.wikipedia.org/wiki/Black_Sea
Wikipedia. (2020, 12 14). Retrieved from Bosporus: https://en.wikipedia.org/wiki/Bosporus
Woodworth, P. L. (n.d.). Tide Gauges. Proudman Oceanographic Labratory.
WorldAtlas. (2021, 1 8). Sea of Marmara. Retrieved from WorldAtlas:
https://www.worldatlas.com/aatlas/infopage/seaofmarmara.htm
Yıldız, H., Demir, C., Gürdal, M. A., Akabalı, A., Demirkol, Ö., Ayhan, M., & Türkoğlu, Y.
(2003). ANALYSIS OF SEA LEVEL AND GEODETIC MEASUREMENTS OF
ANTALYA-II, BODRUM II, ERDEK AND MENTEŞ TIDE GAUGES IN THE
PERIOD OF 1984-2002. Harita Dergisi.
Zacharia, S., R.Srinivasan, T.Thamarai, G.A.Ramadass, & M.A.Atmanand. (2017). Design of an
Advanced Acoustic Tide Gauge for Tsunami Monitoring.

[24]
LIST OF FIGURES
Figure 1. Geographical map of the Black Sea and nearby cities (Britannica, 2021). ..................... 2
Figure 2. Geographical map of Aegean Sea Region (U.S. Central Intelligence Agency, 2021). .... 3
Figure 3. Geographical map of Sea of Marmara, Bosporus Strait, and Dardanelles Strait
(WorldAtlas, 2021). ..................................................................................................................... 3
Figure 4. Tide pole gauge (Cali, 2012). ........................................................................................ 5
Figure 5. Basic float tide gauge system and chart recording drum (Bradshaw et al., 2015). .......... 5
Figure 6. Acoustic tide gauge station (Zacharia et al., 2017). ....................................................... 6
Figure 7. A pressure tide gauge (REFMAR, 2012). ...................................................................... 6
Figure 8. RADAR gauge (Turkey General Directorate of Mapping, 2020). .................................. 7
Figure 9. Investigated tide gauges in the Black Sea. ................................................................... 12
Figure 10. Maximum tidal heights and the energy factor in the Black Sea. Blue colors indicate
diurnal; red colors indicate a semi-diurnal tidal pattern. The biggest circle represents 20 cm of
tidal height, the smallest circle represents 5 cm of tidal high. It is proportional (Medvedev et al.,
2016). ........................................................................................................................................ 16
Figure 11. Investigated tide gauges in the Aegean Sea, Mediterranean Sea, and the Sea of
Marmara. ................................................................................................................................... 17
Figure 12. Investigated tide gauges near Dardanelles and in the Sea of Marmara. ...................... 17
LIST OF TABLES
Table 1. Energy distribution percentages in the sea-level records over different frequency bands
in Karadeniz Ereğli and Anadolukavak tide gauges (Alpar & Yüce, 1998). ................................ 13
Table 2. Detailed data measure from Karadeniz Ereğli and Anadolukavak stations. Amplitudes
and ranges in cm; M2, S2, K1, and O1 principal components semi-diurnal lunar, semi-diurnal
solar, soli-lunar diurnal, and main lunar diurnal, respectively (Alpar & Yüce, 1998). ................. 13
Table 3. Long-term observation results of the sea-level change along the Black Sea coast (Avşar
et al., 2016)................................................................................................................................ 15
Table 4. Seasonal components of the sea-level change along the Black Sea coast (Avşar et al.,
2016). ........................................................................................................................................ 15
Table 5. Energy distribution percentages in the sea-level records over different frequency bands
in Gelibolu, Nara, Gökçeada, and Bozcaada tide gauges (Alpar & Yüce, 1998). ........................ 18
Table 6. Amplitudes and ranges in cm; M2, S2, K1 and O1 principal components semi-diurnal
lunar, semi-diurnal solar, soli-lunar diurnal, and main lunar diurnal, respectively (Alpar & Yüce,
1998). ........................................................................................................................................ 19
Table 7. Monthly and annual average sea level change trends of four tide gauges (Yıldız et al.,
2003). ........................................................................................................................................ 19

[25]
Table 8. The tidal amplitudes of the four geography stations over the respective periods. K1,
solar diurnal; O1, lunar diurnal; M2, lunar semi-diurnal, S2, solar semi-diurnal (Yıldız et al.,
2003). ........................................................................................................................................ 19


