SEA WAVES AND LONG PERIOD SEA WAVES AND LONG PERIOD VERTICAL SEISMOMETERS VERTICAL SEISMOMETERS Lorenzo Papa Lorenzo Papa Marina Pizzo Marina Pizzo Istituto Idrografico della Marina Istituto Idrografico della Marina University of Genoa, Dept. of Physics, University of Genoa, Dept. of Physics, Italy Italy Genoa Genoa 14 14 th th –18 –18 th th November November 2006 2006
Transcript
SEA WAVES AND LONG PERIOD SEA WAVES AND LONG PERIOD VERTICAL SEISMOMETERSVERTICAL SEISMOMETERS
Lorenzo PapaLorenzo Papa
Marina PizzoMarina Pizzo
Istituto Idrografico della MarinaIstituto Idrografico della Marina
University of Genoa, Dept. of Physics, University of Genoa, Dept. of Physics, Italy Italy
GenoaGenoa1414thth –18 –18thth November November 2006 2006
ECO-IMAGINE Conference, 14th - 18th November 2006, Genoa, Italy
The measurement of sea waves is of great interest in many environmental projects as:• the design of coastal structures • the harbour planning• the shoreline protection• predicting coastal vulnerability and map riskSurf wave coast effects and deep water standing oscillations produce, according to the Longuet- Higgins’ theory (1950), primary microseism waves with the same dominant period as sea surface waves and secondary microseisms which have half this period
ECO-IMAGINE Conference, 14th - 18th November 2006, Genoa, Italy
Longuet-Higgins’ theory The stationary wave profile at the depth h, in Lamb’s
notation, is given by:
For stationary waves (without compressibility) we have
a dynamic pressure p:
where: a is the wave amplitude is the angular frequency k is the wave number is the water density
= a cos(kx) cos(t) +
O(a3)
p(t) = - 0.5 a 2 cos
2(2t)
ECO-IMAGINE Conference, 14th - 18th November 2006, Genoa, Italy
The Physics Department of the University of Genoa uses
a long-period vertical seismometer (Teledyne Geotech, model SL210)
and a prototype of variable capacitance
accelerometer to compute in real time the sea wave spectrum in the Gulf of Genoa
ECO-IMAGINE Conference, 14th - 18th November 2006, Genoa, Italy
This seismometer has been installed in 1989This seismometer has been installed in 1989
The sampling time is 0.5 secondsThe sampling time is 0.5 seconds
The power spectrum is computed serially on The power spectrum is computed serially on a buffer a buffer of of 600 data 600 data (sampling window) (sampling window) by by the the FFT algorithmFFT algorithm
The SL-210 instrument The SL-210 instrument operates on the moving-coil operates on the moving-coil principle and has a natural principle and has a natural period that can be adjusted period that can be adjusted from 10 to 30 seconds. from 10 to 30 seconds. IIt employs a sensitive t employs a sensitive electromechanical transducer electromechanical transducer that converts long-period that converts long-period vertical motion into electrical vertical motion into electrical outputoutput
ECO-IMAGINE Conference, 14th - 18th November 2006, Genoa, Italy
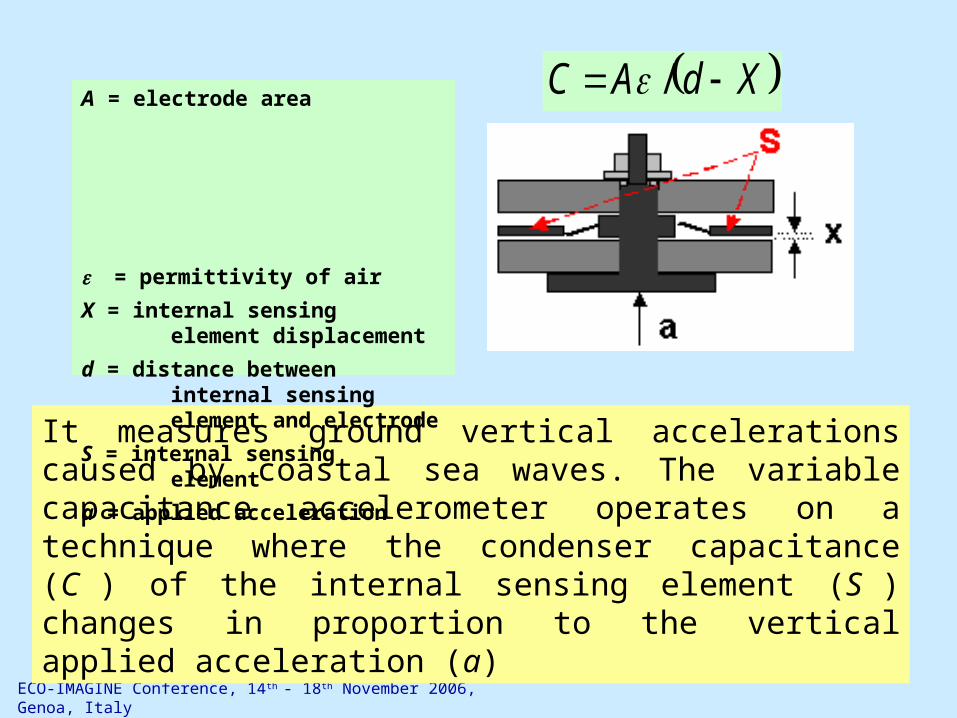
It measures ground vertical accelerations caused by coastal sea waves. The variable capacitance accelerometer operates on a technique where the condenser capacitance (C ) of the internal sensing element (S ) changes in proportion to the vertical applied acceleration (a)
XdAC /A = electrode area = permittivity of air
X = internal sensing element displacement
d = distance between internal sensing element and electrode
S = internal sensing element
a = applied acceleration
ECO-IMAGINE Conference, 14th - 18th November 2006, Genoa, Italy
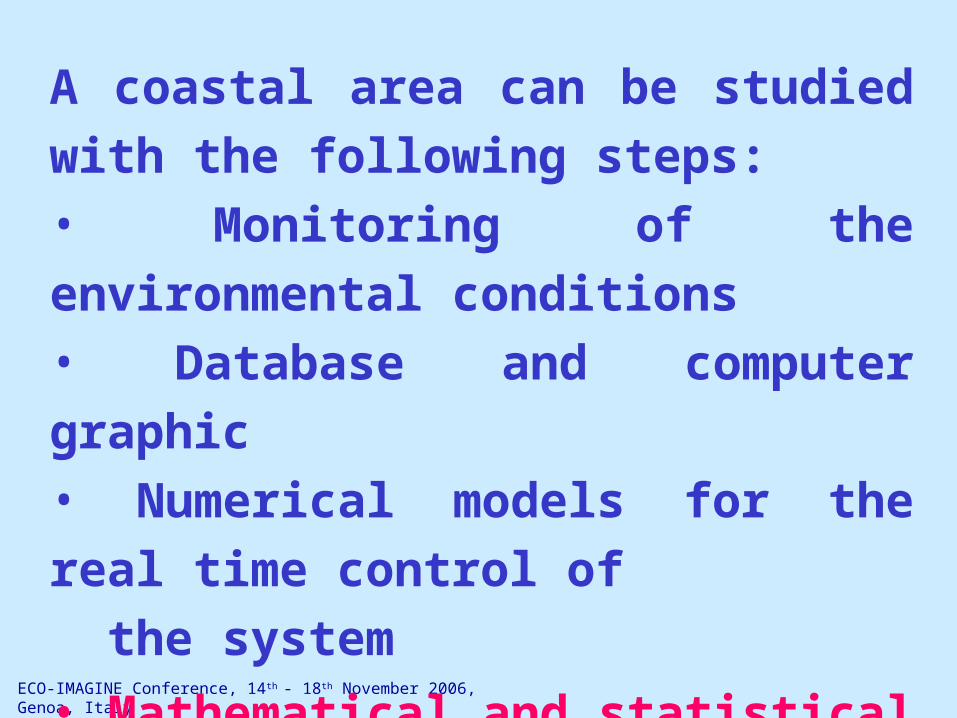
A coastal area can be studied with the
following steps: • Monitoring of the environmental conditions• Database and computer graphic• Numerical models for the real time control of
the system
• Mathematical and statistical algorithms for
forecasting of meteo-marine parameters
ECO-IMAGINE Conference, 14th - 18th November 2006, Genoa, Italy
Gulf of Genoa – database
3806 mean daily values of significant wave height (HS)
ECO-IMAGINE Conference, 14th - 18th November 2006, Genoa, Italy
Example of a storm
44 mean daily values of significant wave height (HS)
ECO-IMAGINE Conference, 14th - 18th November 2006, Genoa, Italy
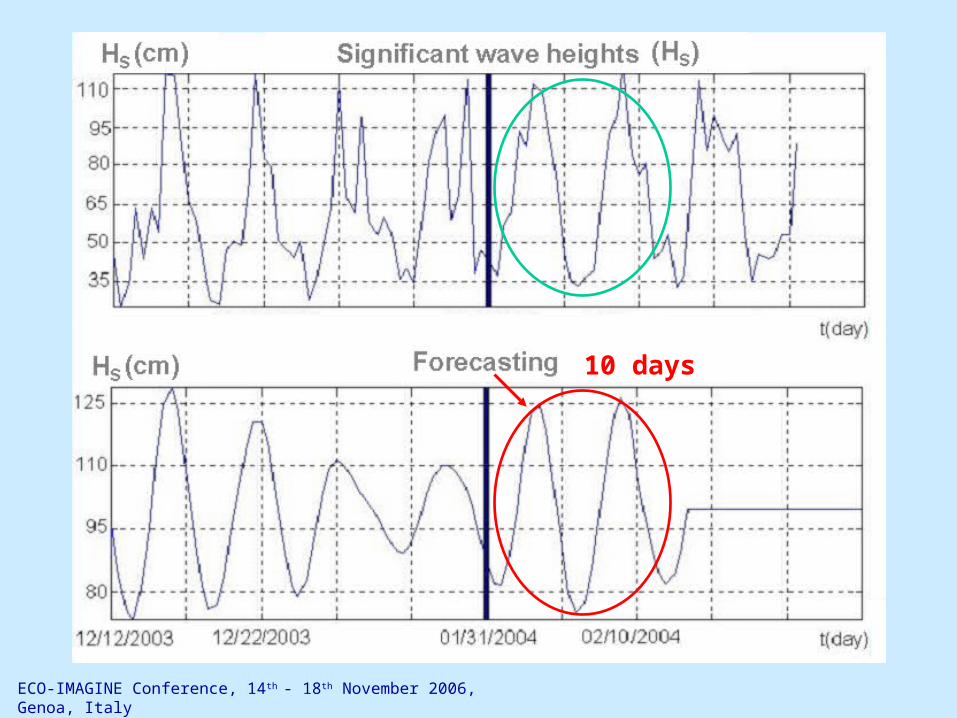
Pattern matching for sea wave forecast Pattern matching is a statistical technique (model free) used to check if a sample pattern finds relevant similarities in the whole historical database.
The comparison of the “sample pattern” with the “historical ones” is carried out by means of an algorithm that minimizes the standard deviation. When the historic pattern that matches the sample data has been selected, the time values of the following window are identified with the required forecast.
ECO-IMAGINE Conference, 14th - 18th November 2006, Genoa, Italy